4.1. Force Analysis of Particles
In order to study the movement process of contaminated particles, force analysis of the contaminated particles has been discussed first. The movement process of the charged contaminated particles is mainly determined through gravity (
Fg), fluid drag force (
Fd), electrical force (
Fe), and polarization force (
Fp) [
21].
Fp,
Fe (determined by the electrical field),
Fd, and
Fg can be expressed through Equations (1)–(4):
where
dp is the particle diameter(m);
E is the electrical field (V/m);
is the vacuum permittivity (8.85 × 10
−12 F/m); and
is particles relative dielectric constant.
Qp is the charge of the contaminated particles (C), which can be written as Equation (5).
where
vp is the contaminated particles speed and
μ is air dynamic viscosity.
where
g is the gravitational acceleration (9.8 m/s
2) and
ρp is the density of particles (kg/m
3).
where
e is the elementary charge quantity (1.6022 × 10
−19 C). Then, the dynamic equation of particles can be achieved as follows:
where
mp is the particles quality (kg) and
t is the time of movement (s).
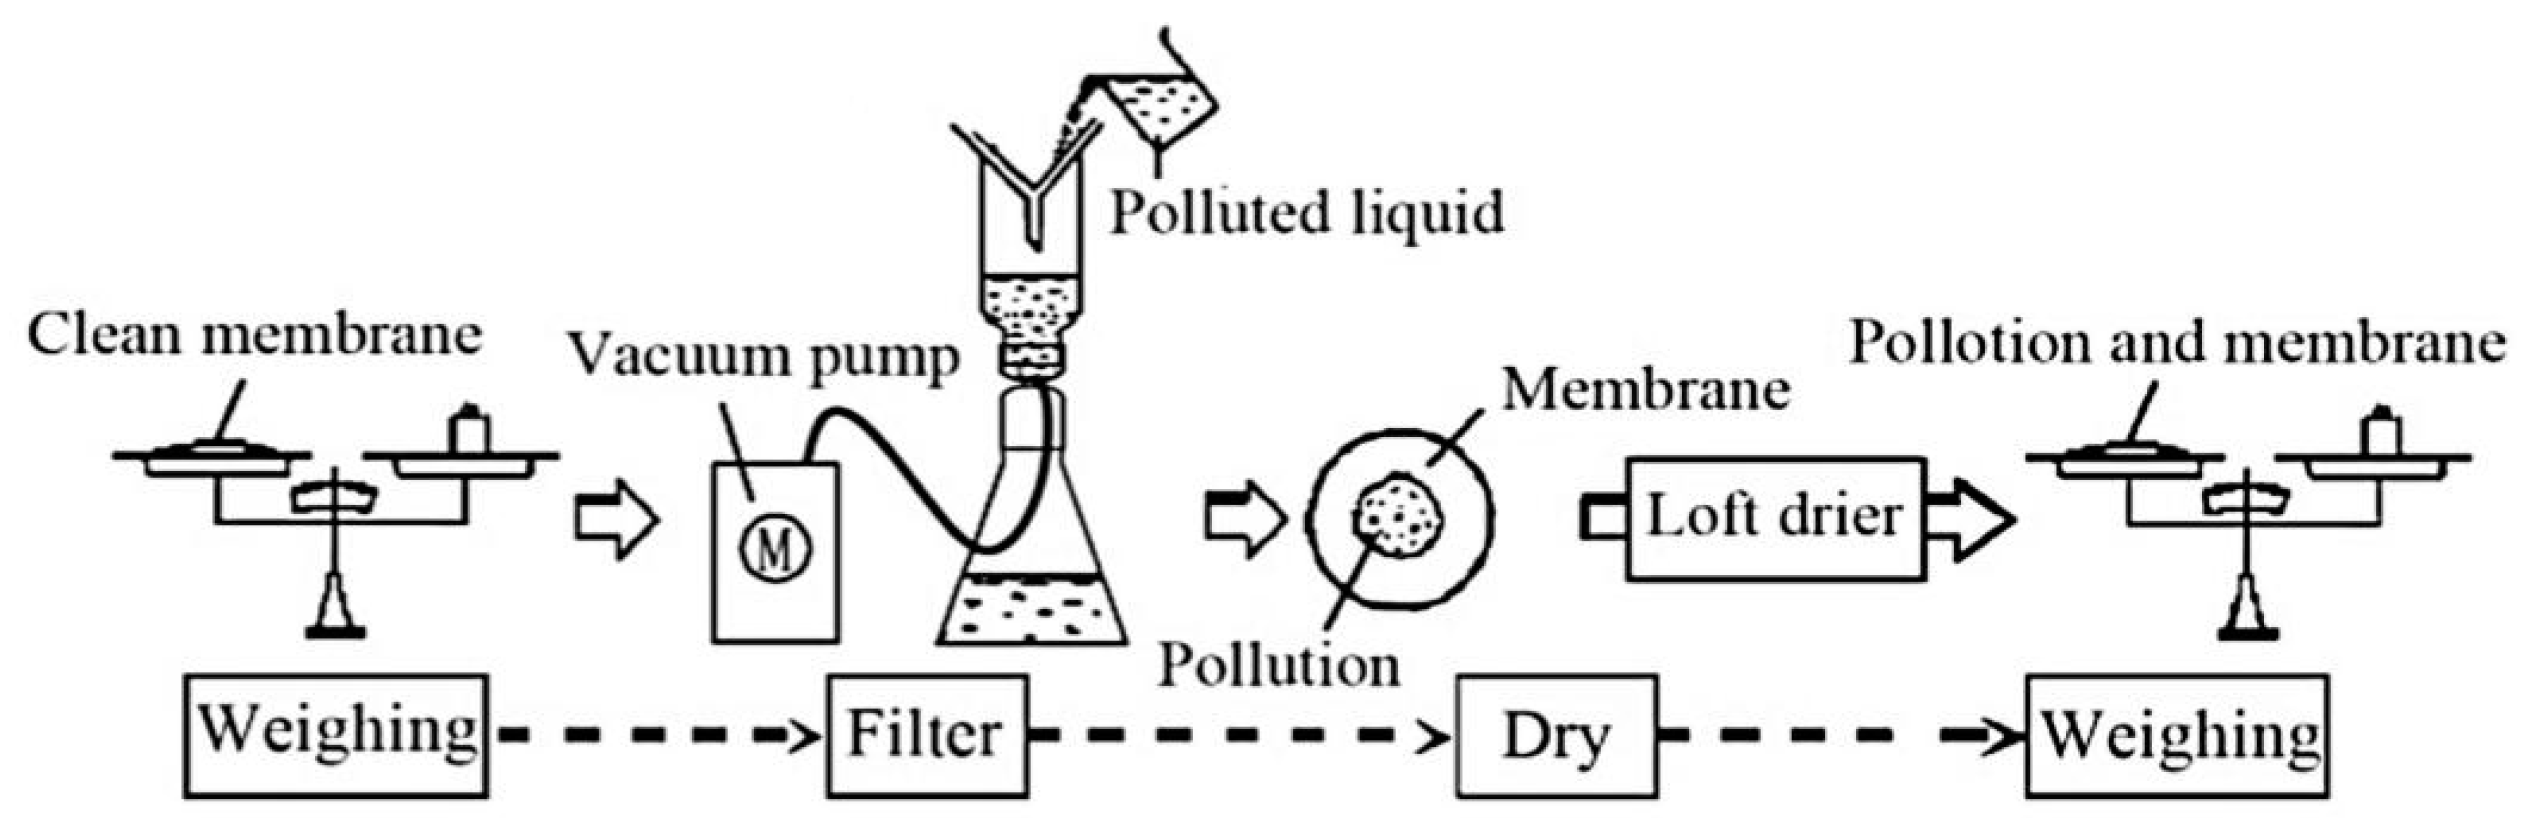
4.2. Electric Field Simulation
In this paper, a multi-physical field simulation software (Comsol) was used to calculate the electric field around the short sample of HVDC insulator strings, based on FEM. Under direct current, the electric field calculation domain governing the equations were as follows:
ρ is the charge density (C/m
3);
D is the electric flux density (C/m
2);
V is the electric potential (V); and
is the relative dielectric constant; which is 3.3 for silicon rubber. The 2D FEM simulation model was established by referring to the real-scale structure parameters of short samples.
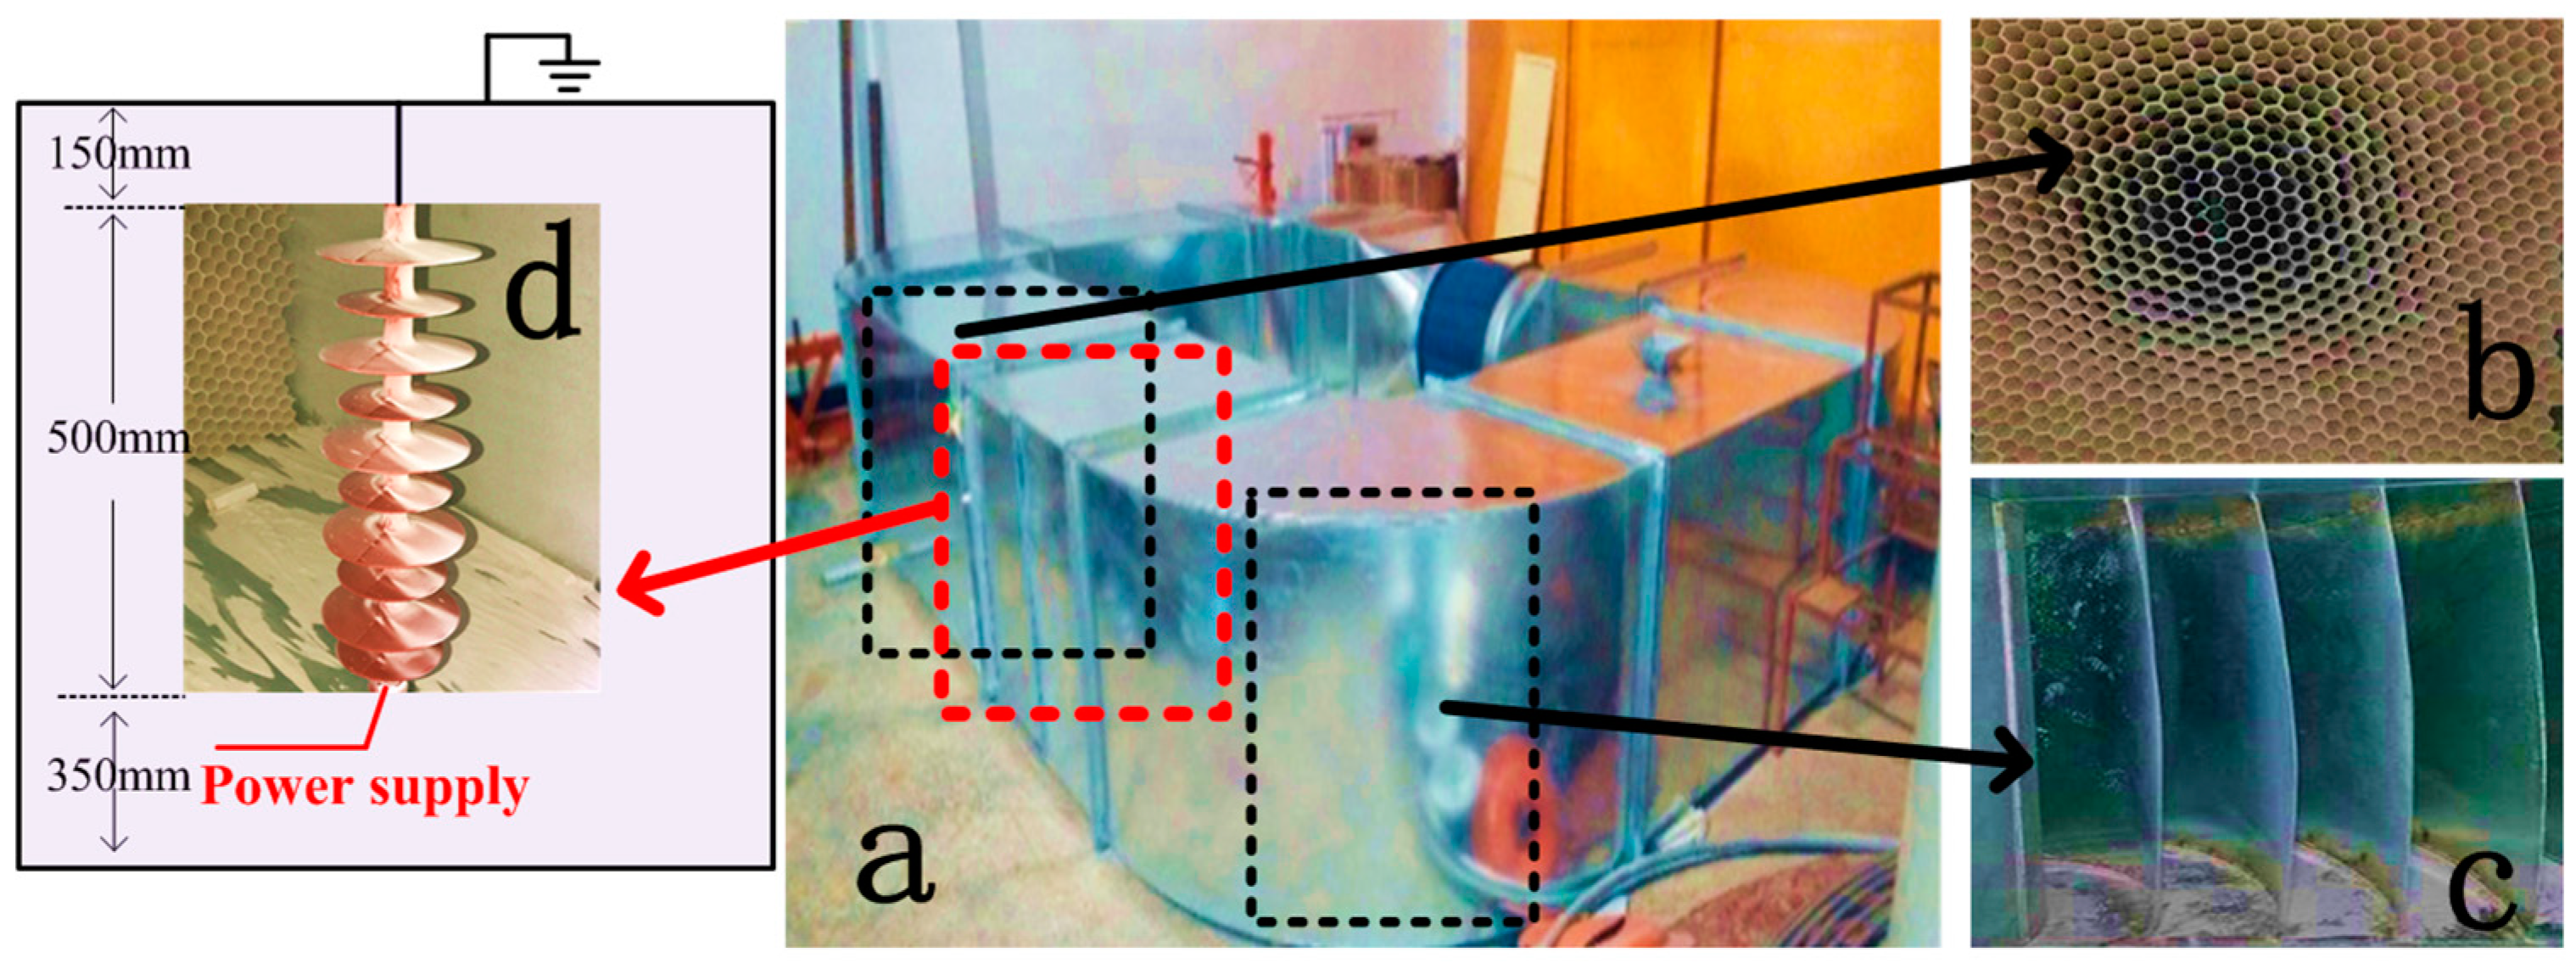
In the simulation model, the electrostatic field module and the fluid flow module were used for the coupling calculation, and a rectangular boundary was added around the insulator string, according to the dimensions of the wind tunnel. The boundary electric potential was set to 0, in the calculation region. Additionally, the short sample was defined with an Es of 70, 44, and 22 kV/m.
4.3. Effects of the Environment Parameters on Particles Motion Toward Insulator String
In [
22], it was concluded by means of numerical calculations that
Fp of contaminated particles in an electric field is much smaller than that of
Fe, and the
Fp can be neglected. Therefore, in order to reduce the computational load, only the main force (
Fe,
Fd, and
Fg) of the contaminated particles were considered in the calculation model of this paper.
A multi-physical field simulation software was used to simulate the trajectory of particle motion and the trajectory of particles motion affected by
Fe,
Fd, and
Fg. It should be mentioned that, first, the electric field around the insulator was calculated, where a steady-state model and a direct solver was used. The coupling effect between the electric field and the flow field was further calculated, where the transient model and an iterative solver was used. Supposing that when the particles reached the insulator surface they stopped moving, then by setting the wall boundary condition on the insulator surface to “freeze”, the end velocity and trajectory of particles from the outside air flow to the insulator surface could be recorded. For example,
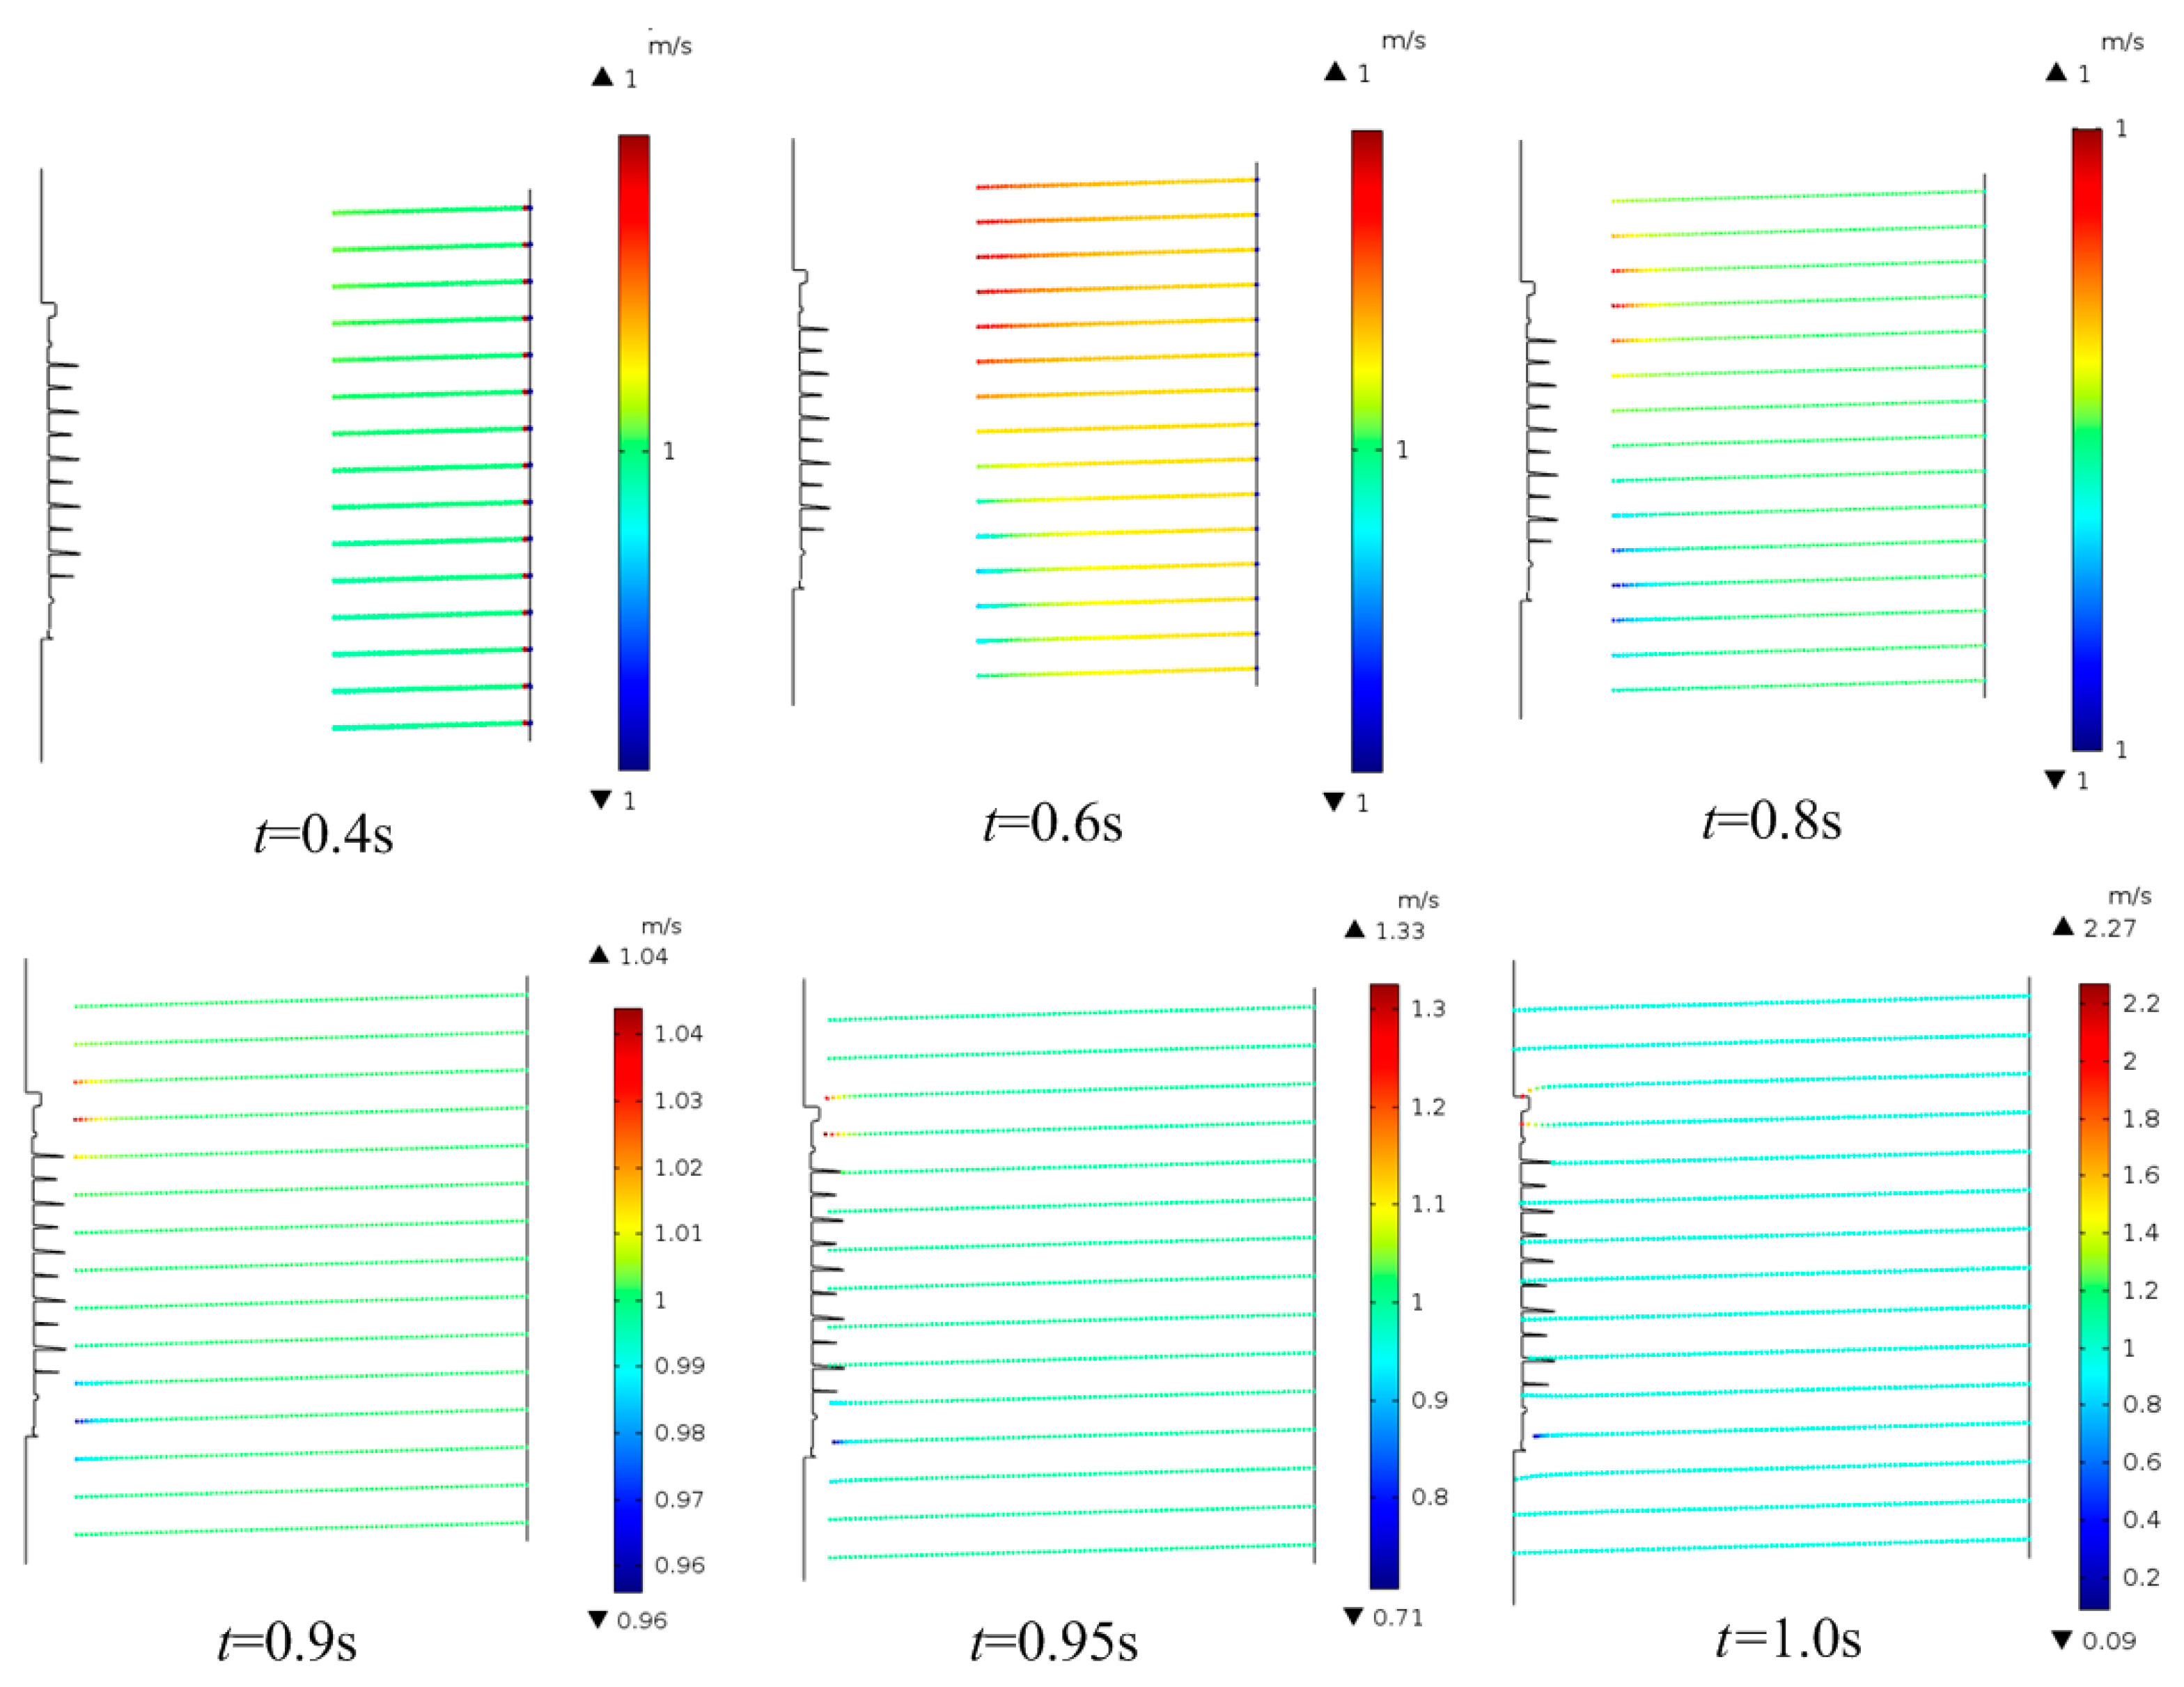
Figure 5 shows the simulation results of the particle movement process when
ws = 1 m/s and
dp = 20 μm energized the short sample with an
Es of 70 kV/m.
Figure 5 shows that, initially,
Fd played a major role in the particle movement, and the contaminated particles move to the insulator surface in a straight line, at a constant speed, under the action of air resistance and gravity balance force. However, when the contaminated particles were close to the insulator string, the motion speed of the contaminated particles changed due to the action of
Fe. Specifically, the velocity of the particles had hardly changed before 0.4 s. When the motion time reached 0.6 s, a velocity change of particles (observed from color) was found in the picture, but the value was still about 1 m/s. At 0.9 s, the particle velocity changed numerically. The maximum velocity of particle motion was 1.04 m/s and the minimum velocity was 0.96 m/s. Finally, at 1 s, the particles had collided with the insulator surface and the terminal velocity (
vt) had changed significantly. The maximum velocity of the particle motion could reach 2.27 m/s and the minimum velocity was 0.09 m/s. Therefore, it could be concluded that the DC electric field had a greater influence on the particle motion around the insulator. To study particle motion of different environmental parameters, particle motion under different wind speeds, particle diameters, and electrical stress, was calculated. The calculated results are shown in
Figure 6,
Figure 7 and
Figure 8.
Reference [
20] shows that pollution increased with the increment of
ws, within a certain range of
ws. In addition, the process of collision and adhesion between the contaminated particles and insulator surface was very complex, so in this work only the
vt was studied under different environmental parameters, which was used to characterize the effect of the electric field on contamination.
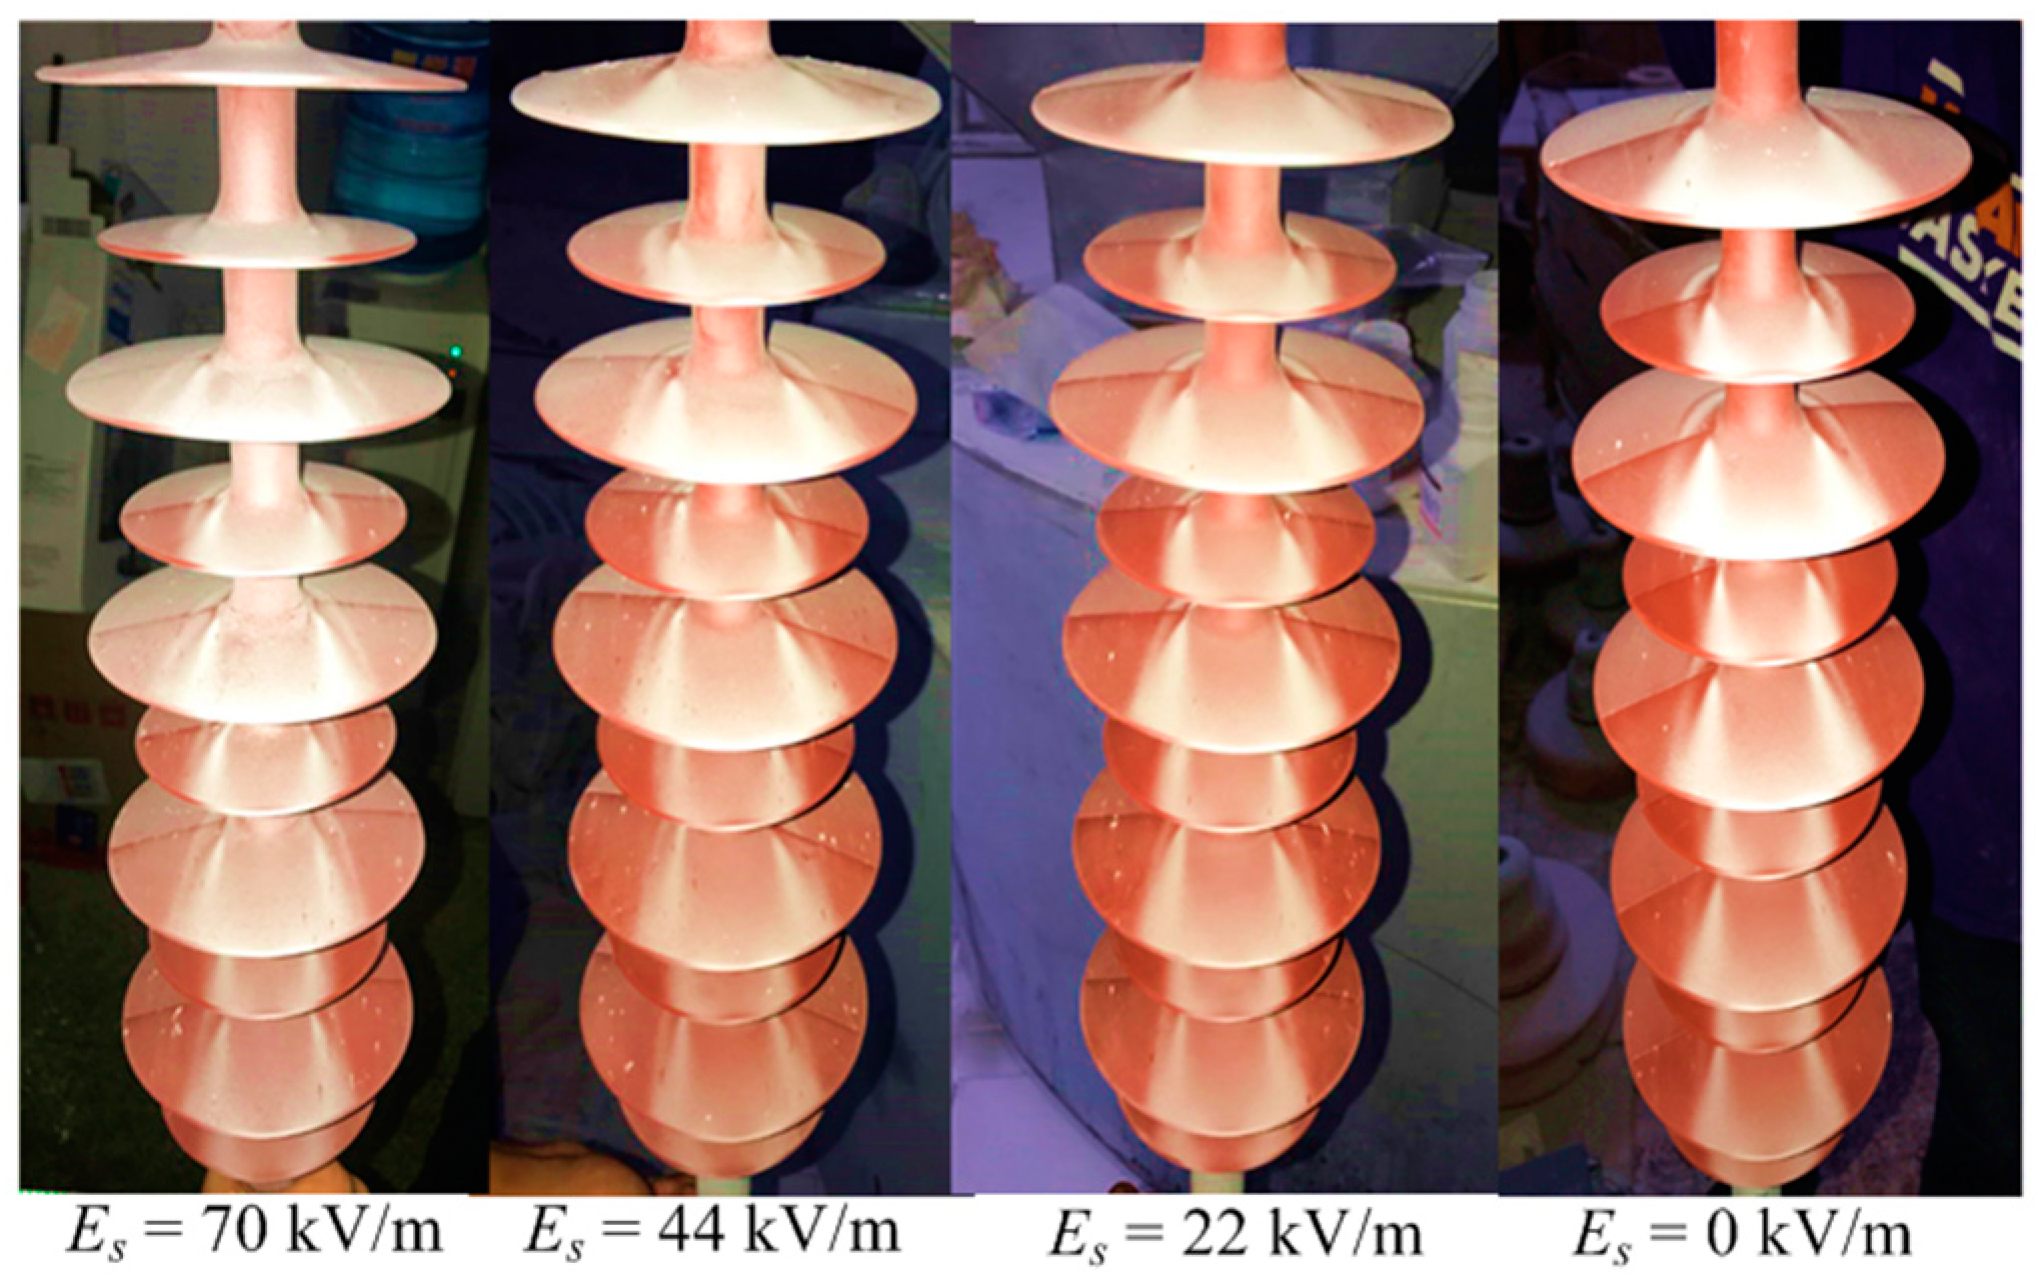
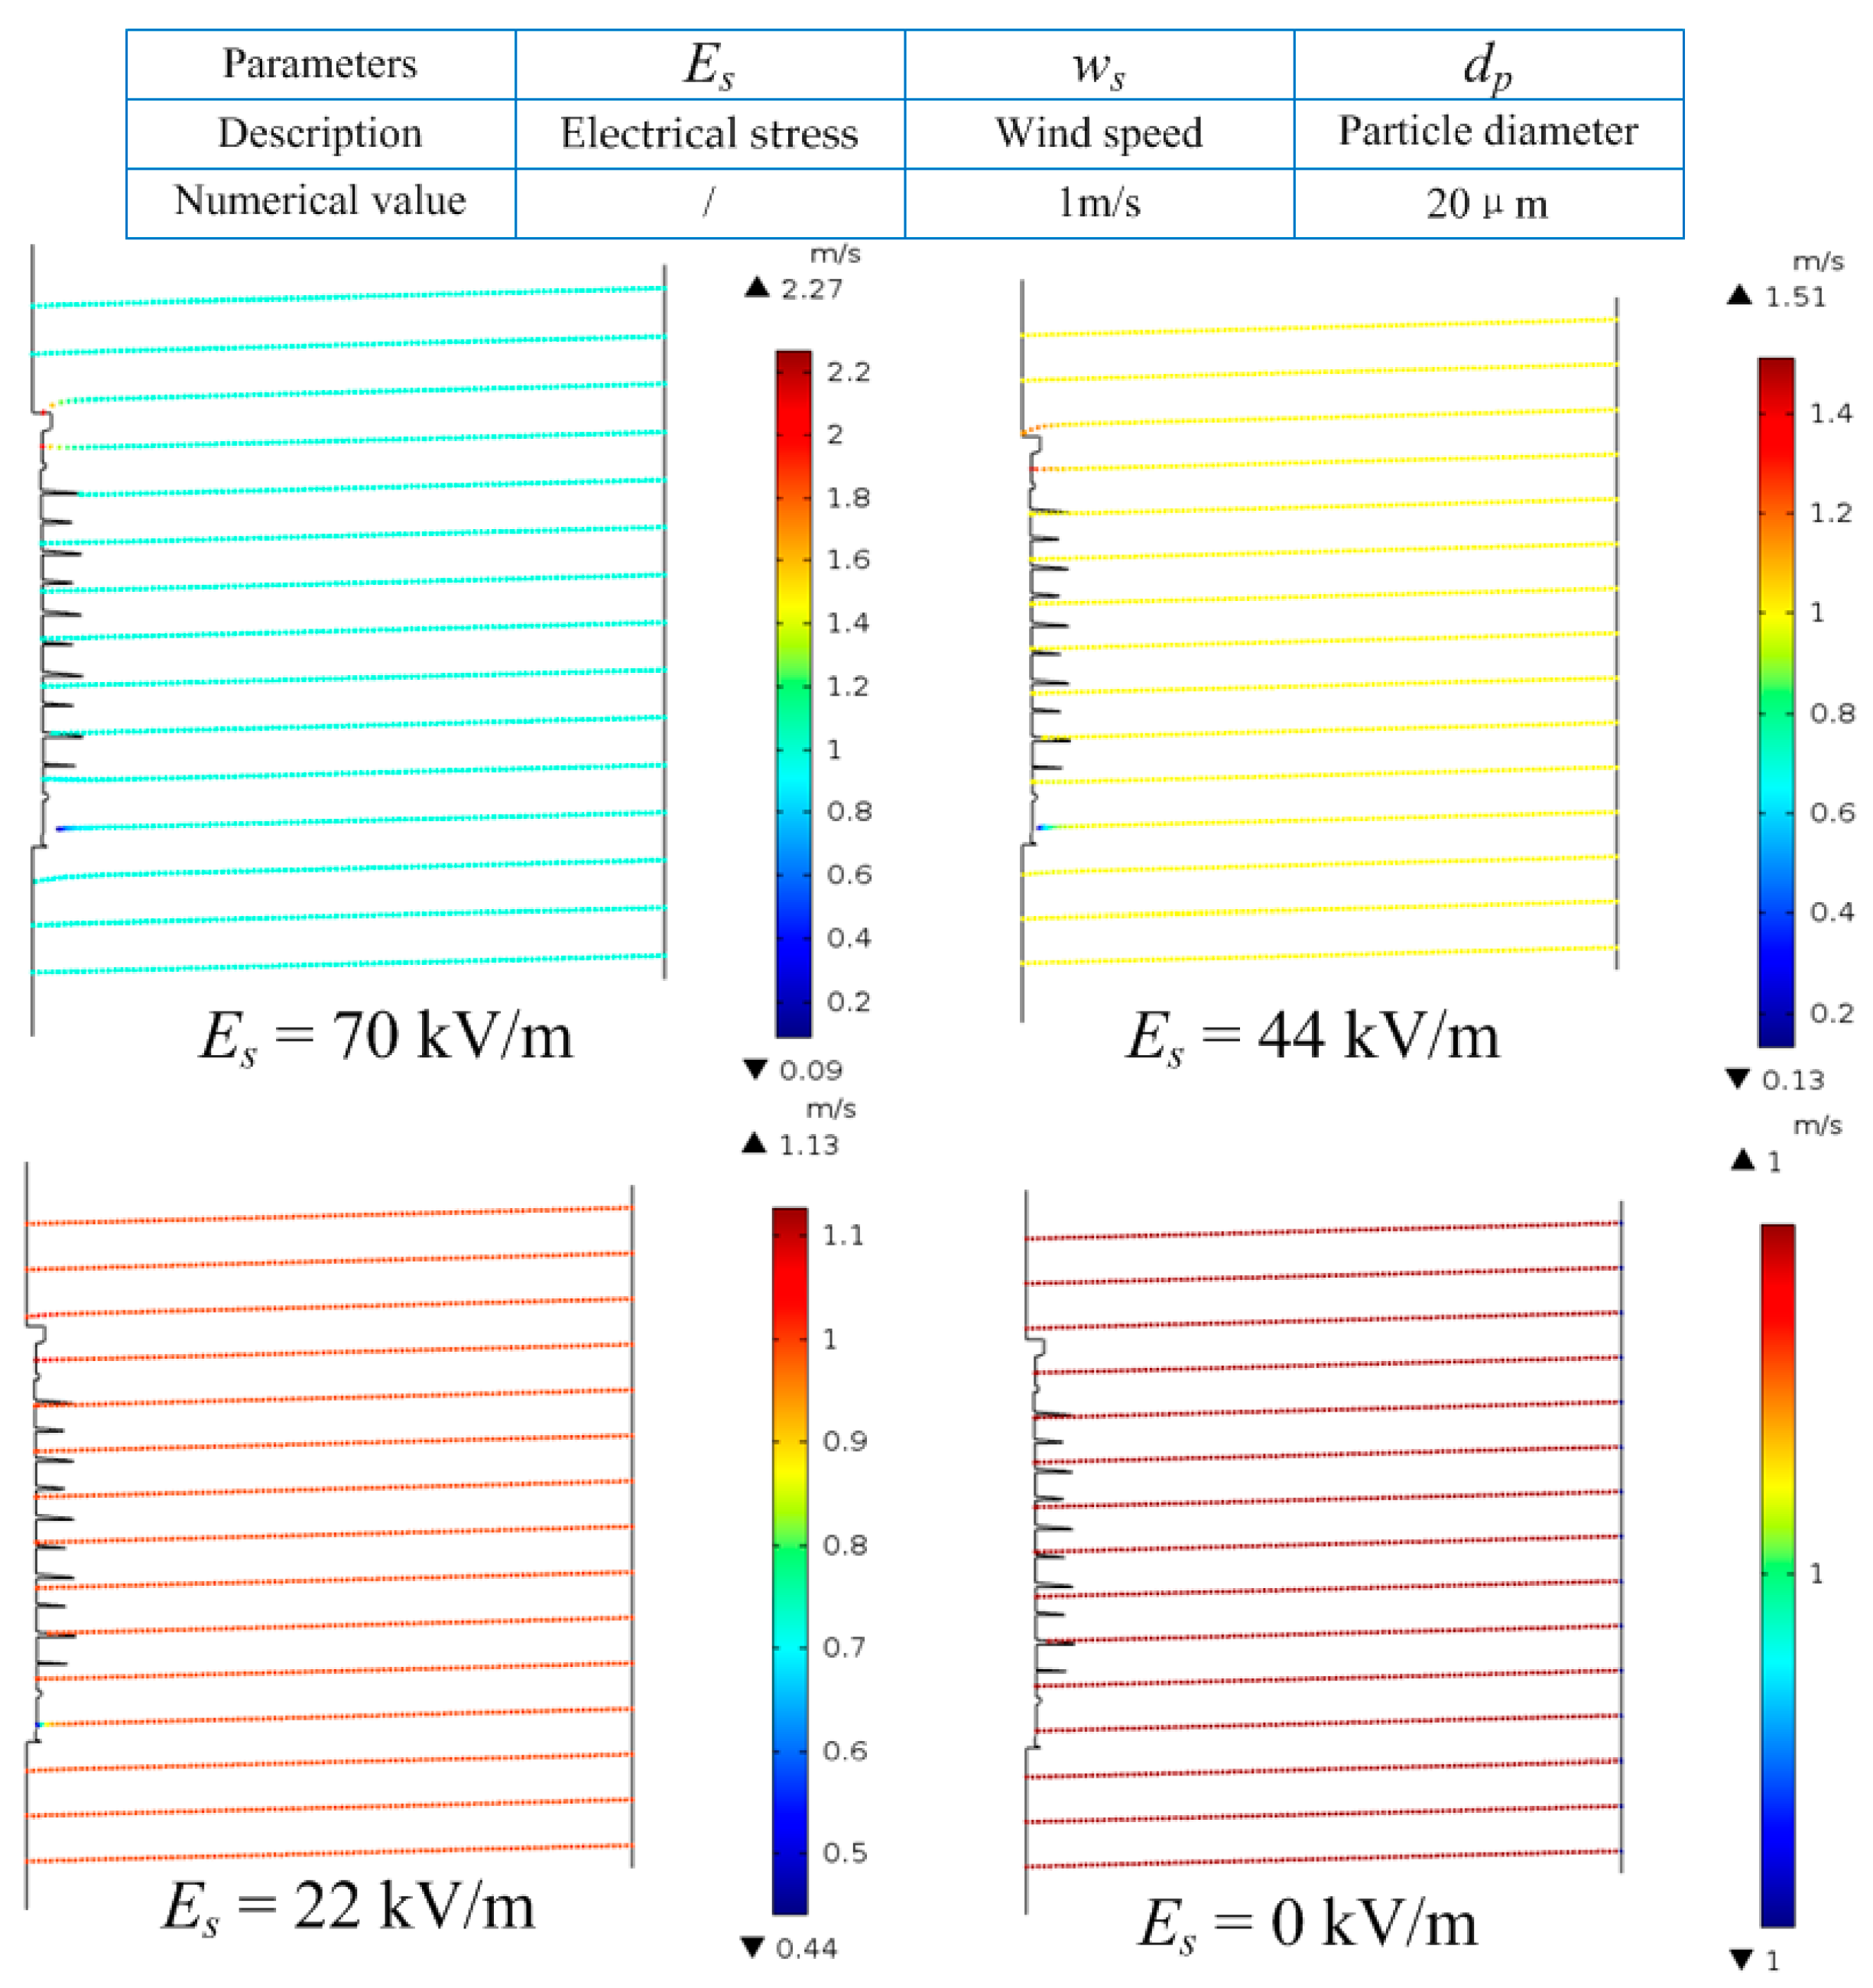
Figure 6 shows the obvious effect of electrical stress on particle motion. Specifically, when
Es was 0, 22, 44, and 70 kV/m, the maximum speed of the particles reaching the insulator was 1, 1.13, 1.51, and 2.27 m/s, respectively. The particle velocities increased by 13% (22 kV/m), 51% (44 kV/m), and 127% (70 kV/m), respectively, compared to that without an electric field.
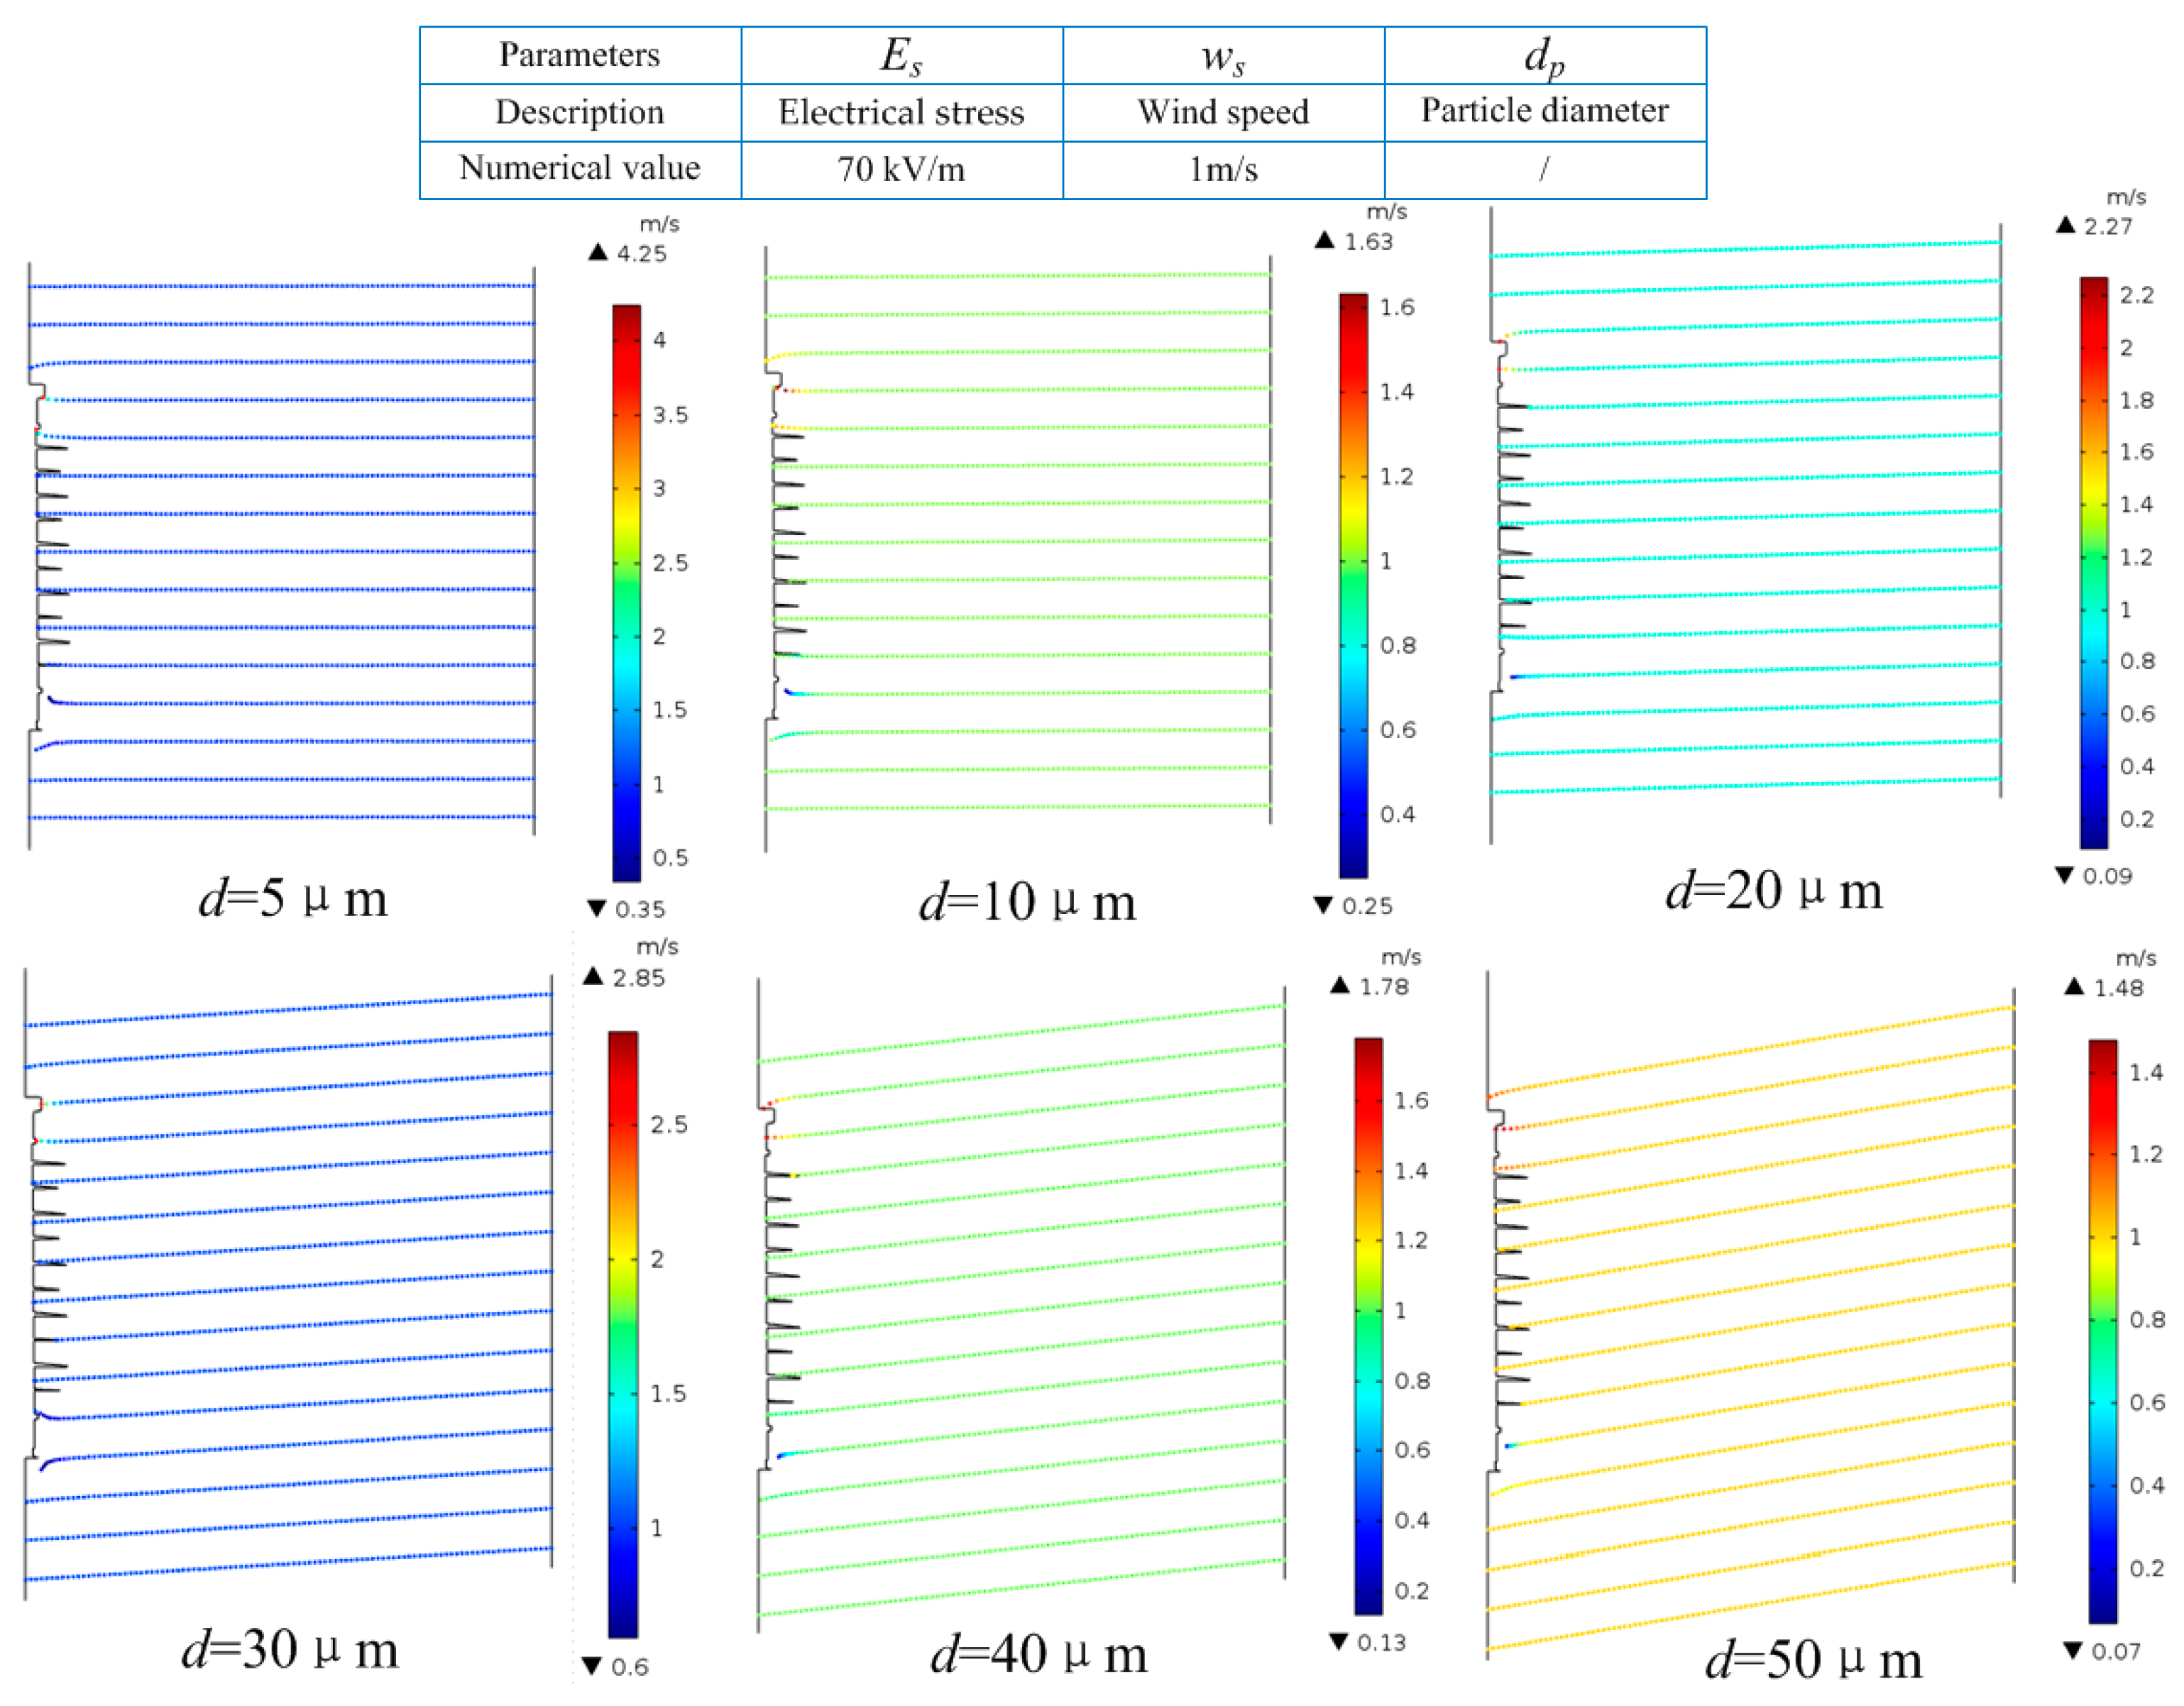
Figure 7 shows the effect of particle diameter on particle motion. When 70 kV/m electrical stress was applied and
ws was 1 m/s, the motion of particles with diameters of 5, 10, 20, 30, 40, and 50 μm was calculated, as shown in
Figure 7.
vt of particles with diameters of 5 μm ranked at the top, standing at 4.25 m/s, by contrast,
vt of particles with diameters of 50 μm was the minimal, with nearly 1.48 m/s. Of note, as the diameter increased,
vt did not always decrease.
vt increased by 325% (5 μm), 63% (10 μm), 127% (20 μm), 185% (30 μm), 78% (40 μm), and 48% (50 μm), respectively, compared to that without an electric field.
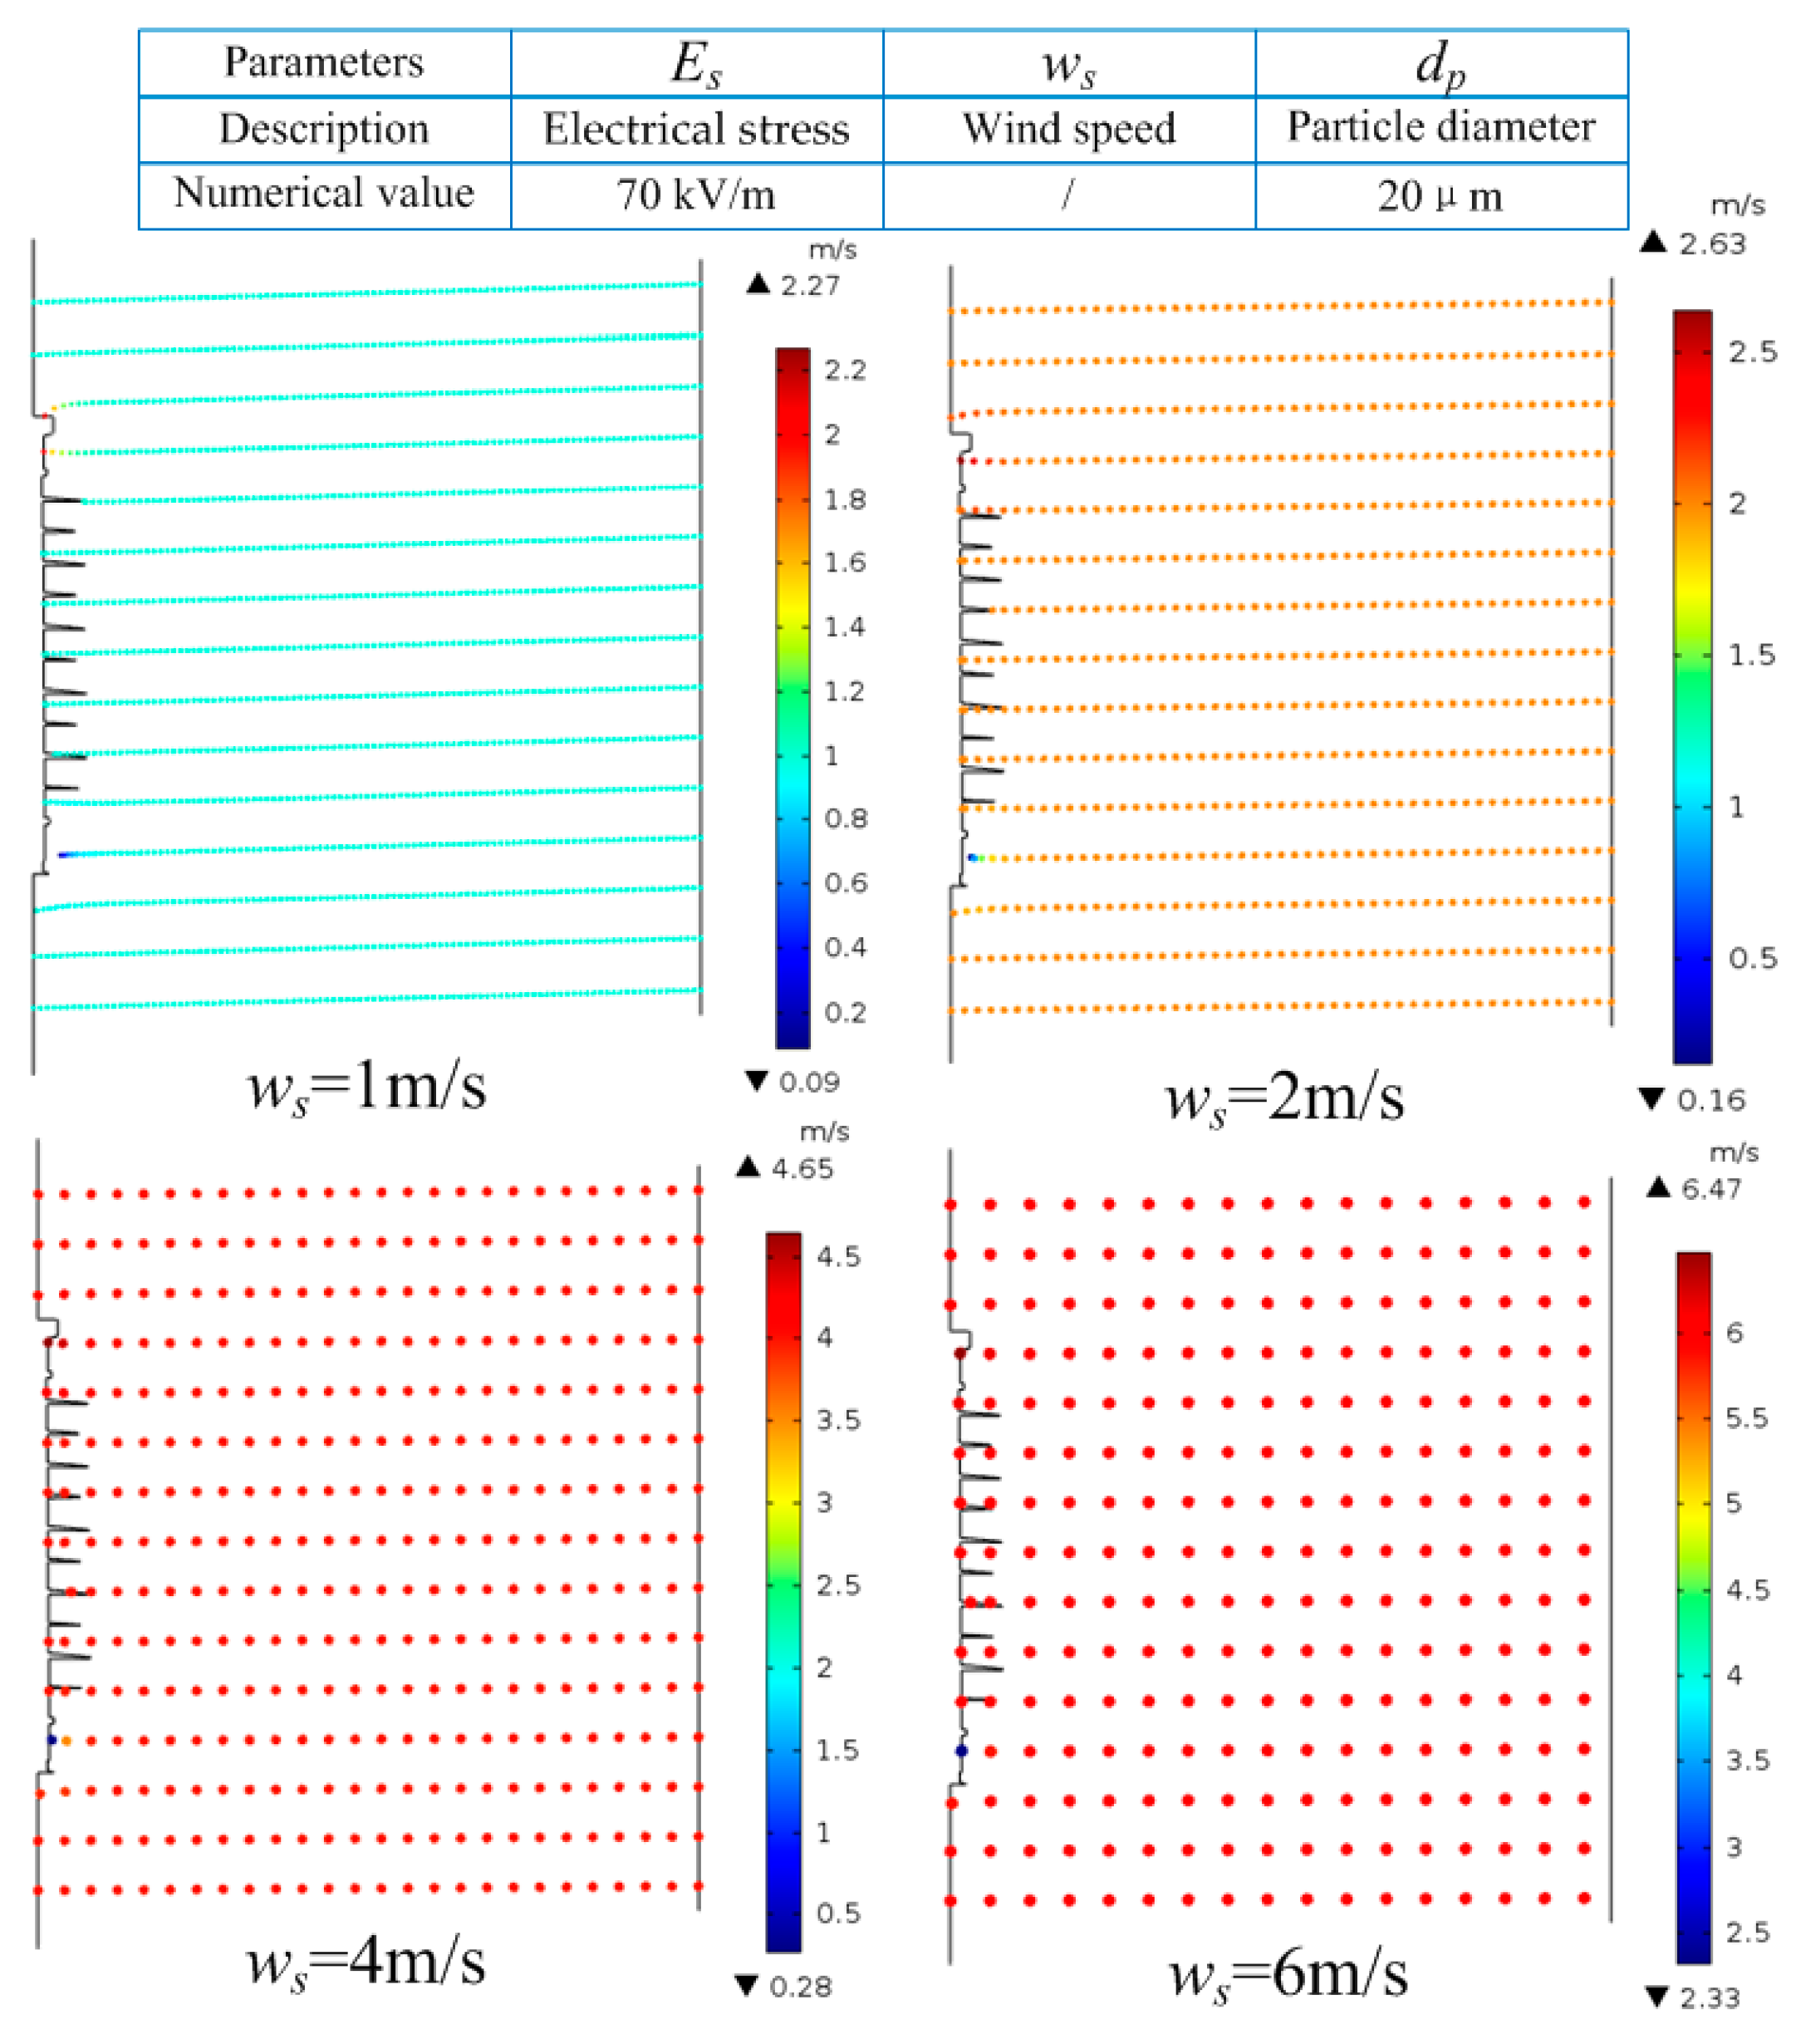
Figure 8 shows the effect of wind speed on particle motion. It can be seen that with the increment of
ws, the influence of electric field on particle motion was gradually weakened. More concretely,
vt increased by 127% (1 m/s), 31.5% (2 m/s), 16.25% (4 m/s), and 7.83% (6 m/s), compared to that without an electric field.
In this section, the effect of electric field on particle motion under different environmental parameters was preliminarily explored by means of simulation calculation. The effects of electrical stress, wind speed, and particle diameter on particle motion were obtained. In order to obtain the pollution ratio k under different environmental parameters, the results of the wind tunnel contamination experiment were further analyzed in this paper.


