Climate Classification for the Use of Solar Thermal Systems in East Asia


1
Platform of Inter/Transdisciplinary Energy Research, Kyushu University, Fukuoka 8190395, Japan
2
Energy Innovation Center, Central Research Institute of Electric Power Industry, Yokosuka 2400196, Japan
*
Author to whom correspondence should be addressed.
Energies 2019, 12(12), 2286; https://doi.org/10.3390/en12122286
Submission received: 25 April 2019
/
Revised: 10 June 2019
/
Accepted: 12 June 2019
/
Published: 14 June 2019
(This article belongs to the Special Issue Modeling, Control, and Optimization of Hybrid Energy Systems in Buildings)
Abstract
:To examine the effects of solar heat utilization, it is necessary to classify the solar-use climate in East Asia based on climatic factors that affect load reduction by solar heating systems. In this study, annual load simulations are performed on weather data in 842 sites in Japan to analyze the climatic factors that impact the load reduction effect of the solar heating system. The analysis results were based on three climatic factors that strongly affect the heating load of a building: heating degree day (HDD18-18), daily solar global horizontal irradiance, and solar-heat available days. Furthermore, to distinguish the climate for the use of solar heat in East Asia, climate classification was done according to three climatic factors using the weather data of 1176 sites in East Asia. Consequently, the climate of solar thermal utilization in East Asia can be classified into 88 areas. Based on the regional classification for solar heat utilization proposed in this study, it will be possible to examine the effect of load reduction and applicability according to the use of solar heat in each region in the future.
1. Introduction
In recent years, the demand for the utilization of natural energy has been on the rise, owing to mandatory energy efficiency standards and global warming. In particular, because of the development of new technology and the production of low-cost solar collectors, the use of solar heating is increasing all over the world. Various studies are being conducted on the relationship between solar energy and the global environment [1,2]. More than 70% of the capacity of liquid-type solar collectors around the world are in China, and the use of solar heating in East Asia is rapidly increasing [3]. In addition, in Japan, the use of air-based solar heating systems is on the increase, as convective heating is usually utilized [4]. Extensive research has been conducted on collectors. In a study evaluating the performance of liquid-type collectors, Hill and Streed proposed a test method for determining the efficiency of a solar collector [5]. Similarly, Choi measured and compared the performance of various types of collectors [6]. To increase heat collection performance, Minardi and Chuang made and evaluated a flat-plate type collector using a black liquid as a thermal medium [7]. In the same vein, Bergene and Løvvik developed a performance prediction model of the collector by simulation, and evaluated its feasibility through comparative analysis [8]. In addition, three-dimensional (3D), two-dimensional (2D), and one-dimensional (1D) models were constructed as a method for evaluating the performance of a PV/T system that can be used as a solar thermal and photovoltaic module at the same time, and the accuracy was confirmed through comparison with the experimental collector. In their study, Bergene and Løvvik suggested the necessity of a time-dependent model for more accurate performance prediction. Kovarik and Lesse studied the optimal control of a liquid-type collecting system by numerical calculation [9]. In a study on air-based solar heating, Choi and colleagues introduced an air-based solar system for indoor heating and hot water, and suggested a method for improving the performance of the system through experimentation [10]. Yeh and Ho proposed a method to increase heat collection efficiency by installing internal fins in the solar heating system. Furthermore, through simulation, Yeh and Ho evaluated the method of increasing fluid velocity to reduce heat transfer resistance and decrease the temperature difference [11]. However, because these solar-use systems vary considerably in performance, depending on local climatic conditions, consumers are questioned about the effect of the system on initial costs. As the results show, the spread of solar thermal utilization systems is delayed. In addition to the climate conditions, the effect of load reduction by the solar heating system varies, due to factors such as the shape, specification, and operation schedule of the building. This study examines the application of a solar heating system based on specific climate conditions that have the greatest influence on the performance of the solar heating system. This study suggests that consumers can judge the relative effectiveness of the solar heating system in each region.
In this study, we aim to calculate the annual heating and hot water load reduction effect by experimenting with the liquid-type collecting system and the air-based collecting system in East Asia (China, Korea, and Japan). Based on these results, the feasibility of the solar heating system according to the climatic conditions in each region was examined. First, in order to examine the effect of solar heat utilization, it is necessary to classify the solar-use climate in East Asia based on the climatic factors that affect the load reduction of the solar heating system [12,13,14]. Therefore, in this study, annual load simulations were performed on the weather data of 842 sites in Japan to analyze the climatic factors that affect the load reduction effect of the solar heating system. The simulation of the correlation between the heating load of each region and the climatic factors, based on the outdoor air temperature and the solar radiation of the area, was then analyzed. Finally, based on the climatic factors that affect the effectiveness of the solar heating system, climate classification was done for the use of solar heating in East Asia.
2. Weather Factor Analysis Affecting the Heating Load
2.1. Simulation Condition
The annual heating load of a building using an air-based solar heating system was calculated, based on the weather condition of 842 points in Japan’s weather data (Expanded AMeDAS data). The Excel-based thermal load analysis (ExTLA) simulation used in this study is a thermal load calculation tool developed by the MAE Laboratory of the University of Tokyo. It calculates the convergence of simultaneous equations using the Gauss–Seidel method with a circular reference and an iterative calculation function in Microsoft Excel. Using this Excel-based simulation method, it is possible to input mathematical equations into each cell and to refer to the values of other cells inputted by users. To eliminate heat transfer and heat accumulation effects between rooms, the buildings in the experiment were simple models, the same as that of the laboratory experiments in the reference study [4]. Figure 1 and Table 1 show the conceptual diagrams of the target building and simulation conditions.
The annual simulation of 842 locations in Japan under the condition of the air-based solar heating system was carried out. Table 2 shows the regions of the 842 points of the weather data. The angle of the collector and the roof surface was entered as the latitude of each region, and the annual heating load when using the solar heating system was calculated. The meteorological factors for investigating the correlation between the climactic factors and the heating load were based on 12 items, according to the outside temperature and solar radiation. The solar-heat available days were defined as the number of days that the daily solar direct normal irradiance was 1000 Wh/(m2·day) or more during the heating period, that is, the days satisfying the minimum solar radiation available for solar heating. The daylight hours indicate the accumulation of the time when the solar direct normal irradiance was 120 Wh/m2 or more during the day. Table 3 shows the target items.
2.2. Correlation between a Load of the Solar Thermal Utilization System and Climatic Factors
Through the simulation of 842 locations in Japan, the correlation between the heating load results and the climatic factors of 12 items was analyzed. Table 4 shows the correlation between the heating load of the building with the air-based solar heating system and the climatic factors (12 items) obtained using the regression analysis of Microsoft Excel. From these results, ⑧ and ⑫, whose insignificant probabilities (p-value) exceeded 5%, were excluded. In addition, ⑤ and ⑥, in which the insignificant probability (p-value) did not appear either because there was a high correlation with other factors or there was no correlation with the heating load, were excluded. Finally, ②, ③, and ④, which had relatively large standard errors, were excluded. In the remaining five items, (①, ⑦, ⑨, ⑩, and ⑪), the correlation between the climate elements were analyzed because the relationship between climate elements was highly correlated with the effect of regression analysis on heating load because of mutual influences. Table 5 shows the results of the correlation analysis between climatic factors. Here, column 1 is ①, column 2 is ⑦, column 3 is ⑨, column 4 is ⑩, and column 5 is ⑪. As a result, there was a high correlation between columns 2 and 3, 2 and 5, and 3 and 5. As shown in Table 6, the regression analysis of the five climate elements and the heating load of the building with the air-based solar heating system was performed; the result determined the relationship between column 2 (⑦ daily solar direct normal irradiance) and column 5 (⑪ average solar direct normal irradiance during solar-heat available days).
Table 7 shows the regression analysis result of the heating load of the building with the air-based solar heating system and the three selected climatic factors. The three selected climatic factors showed a high correlation with the heating load, and the probability of insignificance was close to zero. Therefore, the three factors examined in this study are considered to be the major influences on the heating load of the solar heating system. Figure 2 shows the relationship between the results of the annual simulation and the estimation formula based on the three factors.
3. Climate Classification for Solar Thermal Utilization in East Asia
3.1. Climate Classification
In order to examine the heating load reduction effect (application possibility of the system) of the solar heating system for varying climate characteristics in each region of East Asia, climate classification in East Asia is conducted based on three climatic factors. The examined weather data of East Asia are a total of 1176 points: 842 points of expanded AMeDAS in Japan, 323 points of EPW (EnergyPlus Weather data) in China, 8 points in South Korea (The Korea Solar Energy Society), and 8 points of EPW in North Korea. Figure 3 shows the position of the weather data in East Asia. First, the criteria for heating degree day was created for 11 climate categories including the Japanese criteria for “standards of judgment for residential construction clients” and climate classification criteria in China (GB 50176-93 China Building Thermal Design Code) (Huang and Deringer, 2007). Table 8 and Table 9 show the heating degree day standards of Japan and China. Table 10 shows the East Asian heating degree day standards obtained based on Japanese and Chinese standards.
The solar global horizontal irradiance, as the second climate factor, incorporates both Japanese (technical information on energy conservation standards for houses and buildings, and technical standards for low carbon buildings) and Chinese standards. Table 11 shows the Japanese solar global horizontal irradiance classification criteria, and Figure 4 shows the Chinese solar irradiance standards. In the case of Japanese solar irradiance classification, it is divided into five regions in 10% ranges based on an annual solar global horizontal irradiance of 4456 MJ/m2. Table 12 shows the East Asian solar global horizontal irradiance classification criteria prepared from the standards of Japan and China.
As there are no standards available for solar-heat available days in China, South Korea, and Japan, the results of 1176 points in East Asia were created in the graph, and three extremely varied categories, ranging from 40% and 80%, were created. Figure 5 shows the ratio of solar-heat available days to days heating was required in East Asia. Table 13 shows the classification of solar-heat available days by region in this study.
The climate categorization of 1176 regions in East Asia is based on the climatic factors affecting solar thermal utilization in East Asia (11 regional divisions by heating degree day, six regional divisions by daily solar global horizontal irradiance, and three regional divisions by solar-heat available days). In the climate classification result, the climate of solar thermal utilization in East Asia can be classified into 88 areas, as shown in Table 14. Regional notation by climate classification is as shown in Figure 6; the first two digits represent 1 to 11 areas of the heating degree day, while the third one represents one to six areas of the daily solar global horizontal irradiance, and the fourth one is the three areas of solar-heat available days.
3.2. Map of Climate Classification
To visualize the results of the classification of solar thermal areas in East Asia, mapping was performed to distinguish each solar heat utilization climate areas by color from the latitude and longitude of other areas. The mapping program used MATLAB and the Miller projection map model, as proposed by Osborne Maitland Miller at the American Geography Society in 1942. A grid with an interval of 0.001° was created, with the longitude as the x-axis and the latitude as the y-axis. Then, the climate classification results were presented by color on the z-axis. Miller Projection (Snyder, 1994) is a method involving the planar representation of the earth latitude and longitude coordinates. The x and y axes are calculated as Equation (1). Mapping was done by classifying the heating degree day (HDD18-18), daily solar global horizontal irradiance, and solar-heat available days in East Asia. Figure 7, Figure 8 and Figure 9 show the region classification results by the heating load, solar global horizontal irradiance, and solar-heat available days.
where λ: Longitude [°] and φ: Latitude [°].
x = λ
y = 5/4 × ln[tan(1/4 × π + 2/5 × φ)]
y = 5/4 × ln[tan(1/4 × π + 2/5 × φ)]
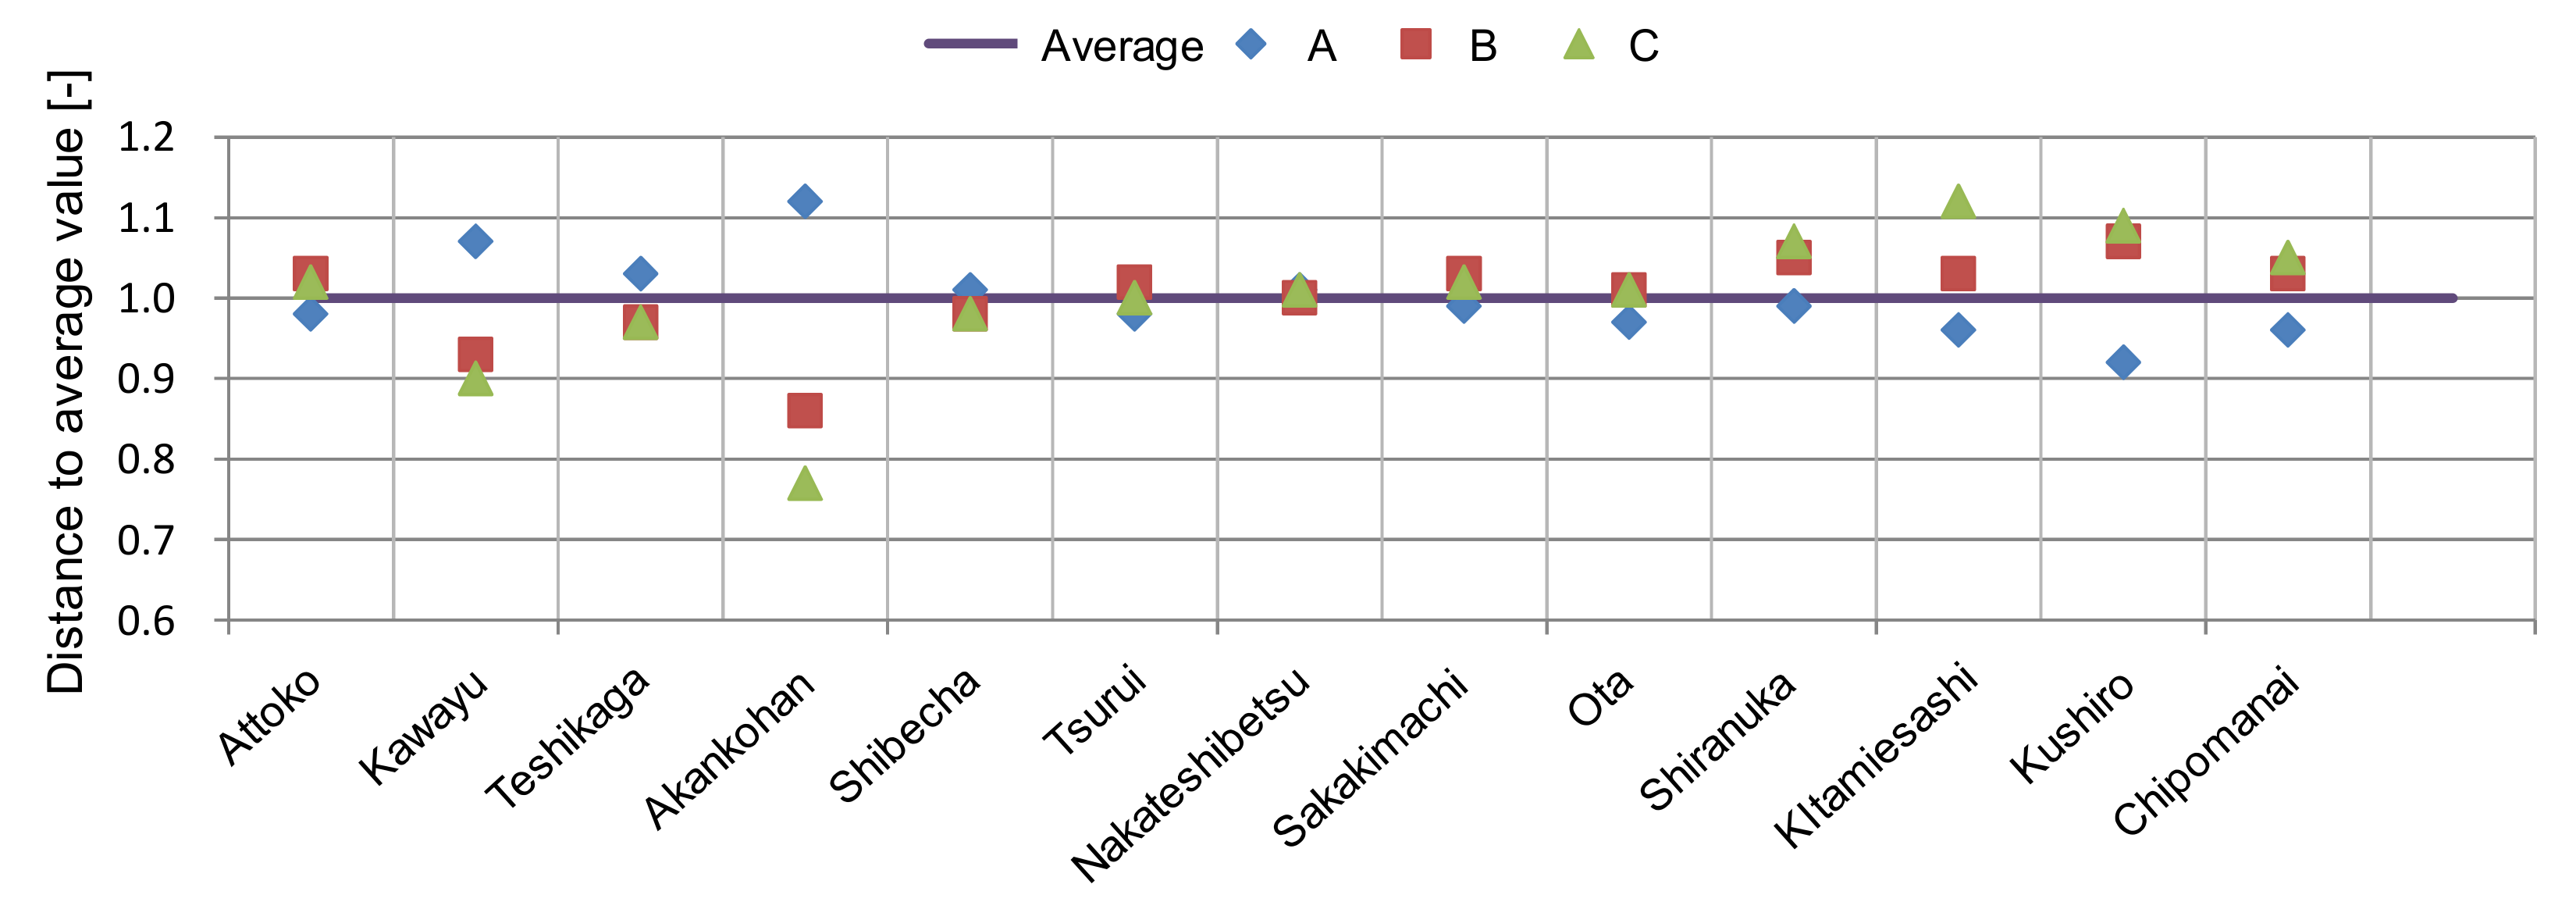
Figure 10 shows the climate classification results for the climatic factors of East Asia, encompassing the three climatic factors, using solar thermal energy (heating degree day, daily solar global horizontal irradiance, and solar-heat available days). To choose the representative point of each climate, the classification method calculated the average value for each climate using Equation (2), and calculated A, B, and C from the mean value of the climate and the ratio of the regional result. The area having the least distance (Dt) from the average value in each area was set as a representative point. Figure 11 and Table 15 show an example of the distance between the climate element and the average value of each region and of selecting representative points. Table 16 shows the representative points in the 88 regions of solar thermal climate in East Asia which are suggested in this study.
where As: heating degree day [K]; Bs: daily solar global horizontal irradiance [Wh/(m2 day]]; Cs: solar-heat available days [%]; Aave: average heating degree day of the same climate [K]; Bave: average daily solar global horizontal irradiance of the same climate [Wh/ (m2 day)]; Cave: average solar-heat available days of the same climate [%]; Dt: distance from average value, standard deviation [–].
A = As/Aave
B = Bs/Bave
C = Cs/Cave
Dt = [(1 − A)2+ (1 − B)2+ (1 − C)2]0.5
B = Bs/Bave
C = Cs/Cave
Dt = [(1 − A)2+ (1 − B)2+ (1 − C)2]0.5
4. Conclusions
In this study, we studied the climatic factors that influence the heating load of a building, applying the solar thermal system as the basis for solar thermal climate classification in East Asia. The weather condition of the simulation was calculated using Japan’s Expanded AMeDAS weather data to calculate the heating load by applying the solar thermal system to 842 points. A building that was free from influences, such as heat transfer from other rooms and heat storage effect, was targeted for a simple experiment. The outside air temperature and solar radiation determined the 12 climatic factors: ① heating degree day (HDD18-18), ② daily average outside temperature, ③ daily average outside temperature during the heating period, ④ daily maximum outside temperature, ⑤ daily minimum outside temperature, ⑥ daily temperature difference, ⑦ daily solar direct normal irradiance, ⑧ daily solar diffuse horizontal irradiance, ⑨ daily solar global horizontal irradiance, ⑩ solar-heat available days, ⑪ average solar direct normal irradiance during solar-heat available days, and ⑫ daylight hours. The climatic factors with low correlation with the heating load, large standard error, and highly correlated elements were excluded from the examined items. Finally, the three climatic factors that strongly affect the heating load of the building were selected. The three selected climatic factors are shown below:
- Heating degree day (HDD18-18);
- Daily solar global horizontal irradiance;
- Solar-heat available days.
Furthermore, in order to distinguish the climate for the use of solar heat in East Asia, using the weather data of 1176 sites in East Asia (842 Expanded AMeDAS in Japan, 323 EPW data in China, 8 EPW data in Korea, 3 EPW data in North Korea), climate classification was done according to the three climatic factors. Consequently, the climate classification according to solar thermal utilization in East Asia can be classified into 88 areas. To visualize the climate classification, the study used MATLAB to map climate zones to East Asia maps by color.
To choose the representative point of each climate division, the ratio of the value of each region to the same climate average value is calculated, and the area showing the closest distance to the average value was adjudged the representative point. Based on the regional classification for solar heat utilization proposed in this study, it will be possible to examine the effect of load reduction and applicability according to the use of solar heat in each region in the future.
Author Contributions
Conceptualization, Y.C.; Methodology, Y.C.; Formal Analysis, Y.C.; Investigation, H.K.; Writing-Original Draft Preparation, Y.C.; Writing-Review & Editing, H.K.; Visualization, Y.C.; Supervision, H.K.; Project Administration, Y.C.
Funding
This research received no external funding.
Conflicts of Interest
The authors declare no conflict of interest.
References
- Varotsos, C. Comment on connections between the 11-year solar cycle, the Q.B.O. and total ozone. J. Atmos. Terr. Phys. 1989, 51, 367–370. [Google Scholar] [CrossRef]
- Varotsos, C.A.; Cracknell, A.P. New features observed in the 11-year solar cycle. Int. J. Remote Sens. 2004, 25, 2141–2157. [Google Scholar] [CrossRef]
- Ge, T.S.; Wang, R.Z.; Xu, Z.Y.; Pan, Q.W.; Du, S.; Chen, X.M.; Ma, T.; Wu, X.N.; Sun, X.L.; Chen, J.F. Solar heating and cooling: Present and future development. Renew. Energy 2017, 126, 1126–1140. [Google Scholar] [CrossRef]
- Choi, Y.; Takase, K.; Mae, M. System performance of a residential building using the air-based solar heating system. Sol. Energy 2018, 171, 47–63. [Google Scholar] [CrossRef]
- Hill, J.E.; Streed, E.R. A method of testing for rating solar collectors based on thermal performance. Sol. Energy 1976, 18, 421–429. [Google Scholar] [CrossRef]
- Choi, Y. An Experimental Study of the Solar Collection Performance of Liquid-Type Solar Collectors under Various Weather Conditions. Energies 2018, 11, 1626. [Google Scholar] [CrossRef]
- Minardi, J.E.; Chuang, H.N. Performance of a “black” liquid flat-plate solar collector. Sol. Energy 1975, 17, 179–183. [Google Scholar] [CrossRef]
- Bergene, T.; Løvvik, O.M. Model calculations on a flat-plate solar heat collector with integrated solar cells. Sol. energy 1995, 55, 453–462. [Google Scholar] [CrossRef]
- Kovarik, M.; Lesse, P.F. Optimal control of flow in low temperature solar heat collector. Sol. Energy 1976, 18, 431–435. [Google Scholar] [CrossRef]
- Choi, Y.; Mae, M.; Bae Kim, H. Thermal performance improvement method for air-based solar heating systems. Sol. Energy 2019, 186, 277–290. [Google Scholar] [CrossRef]
- Yeh, H.M.; Ho, C.D. Effect of external recycle on the performances of flat-plate solar air heaters with internal fins attached. Renew. Energy 2009, 34, 1340–1347. [Google Scholar] [CrossRef]
- Lau, C.C.S.; Lam, J.C.; Yang, L. Climate classification and passive solar design implications in China. Energy Convers. Manag. 2007, 48, 2006–2015. [Google Scholar] [CrossRef]
- Robert, G. Fovell, M.-Y. C. F. Climate zones of the conterminous united states defined using cluster analysis. Am. Meteorol. Soc. 1993, 61, 2103–2135. [Google Scholar]
- Wan, K.K.W.; Li, D.H.W.; Yang, L.; Lama, J.C. Climate classifications and building energy use implications in China. Energy Build. 2010, 42, 1463–1471. [Google Scholar] [CrossRef]
Figure 1.
Target building. (a) elevation; (b) plan.
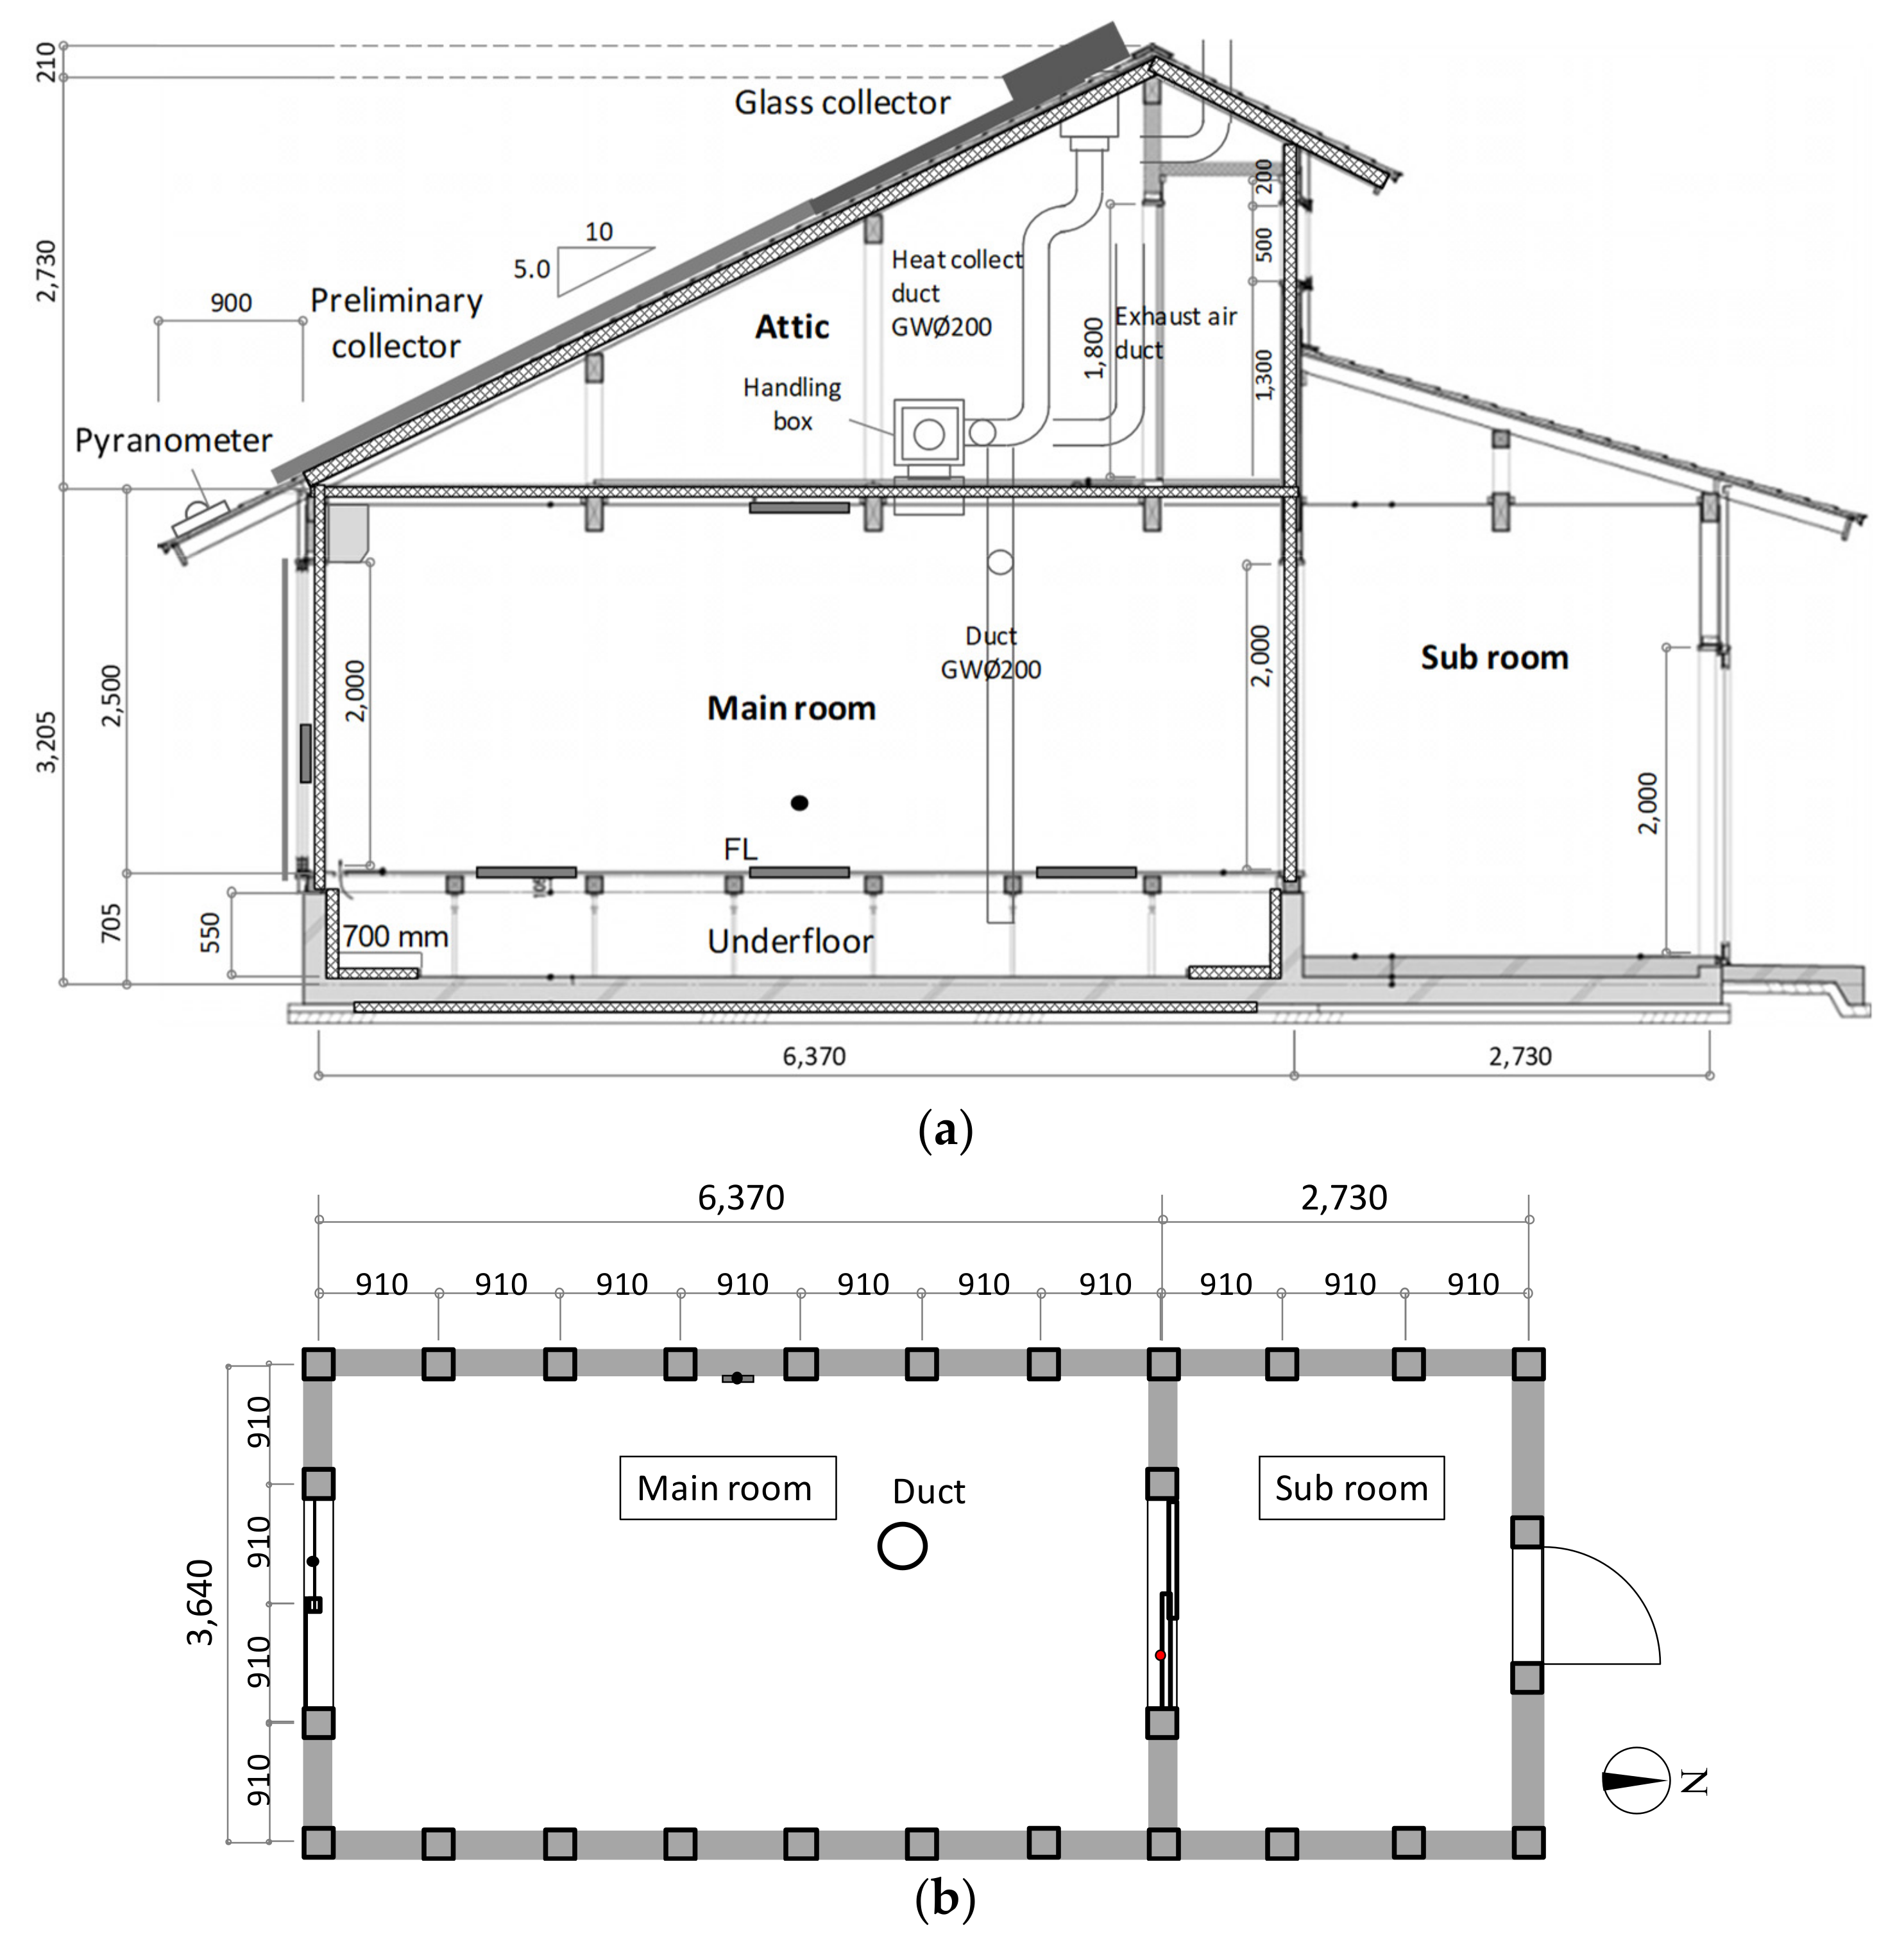
Figure 2.
Simulation and estimated equation results of annual heating load (842 points).
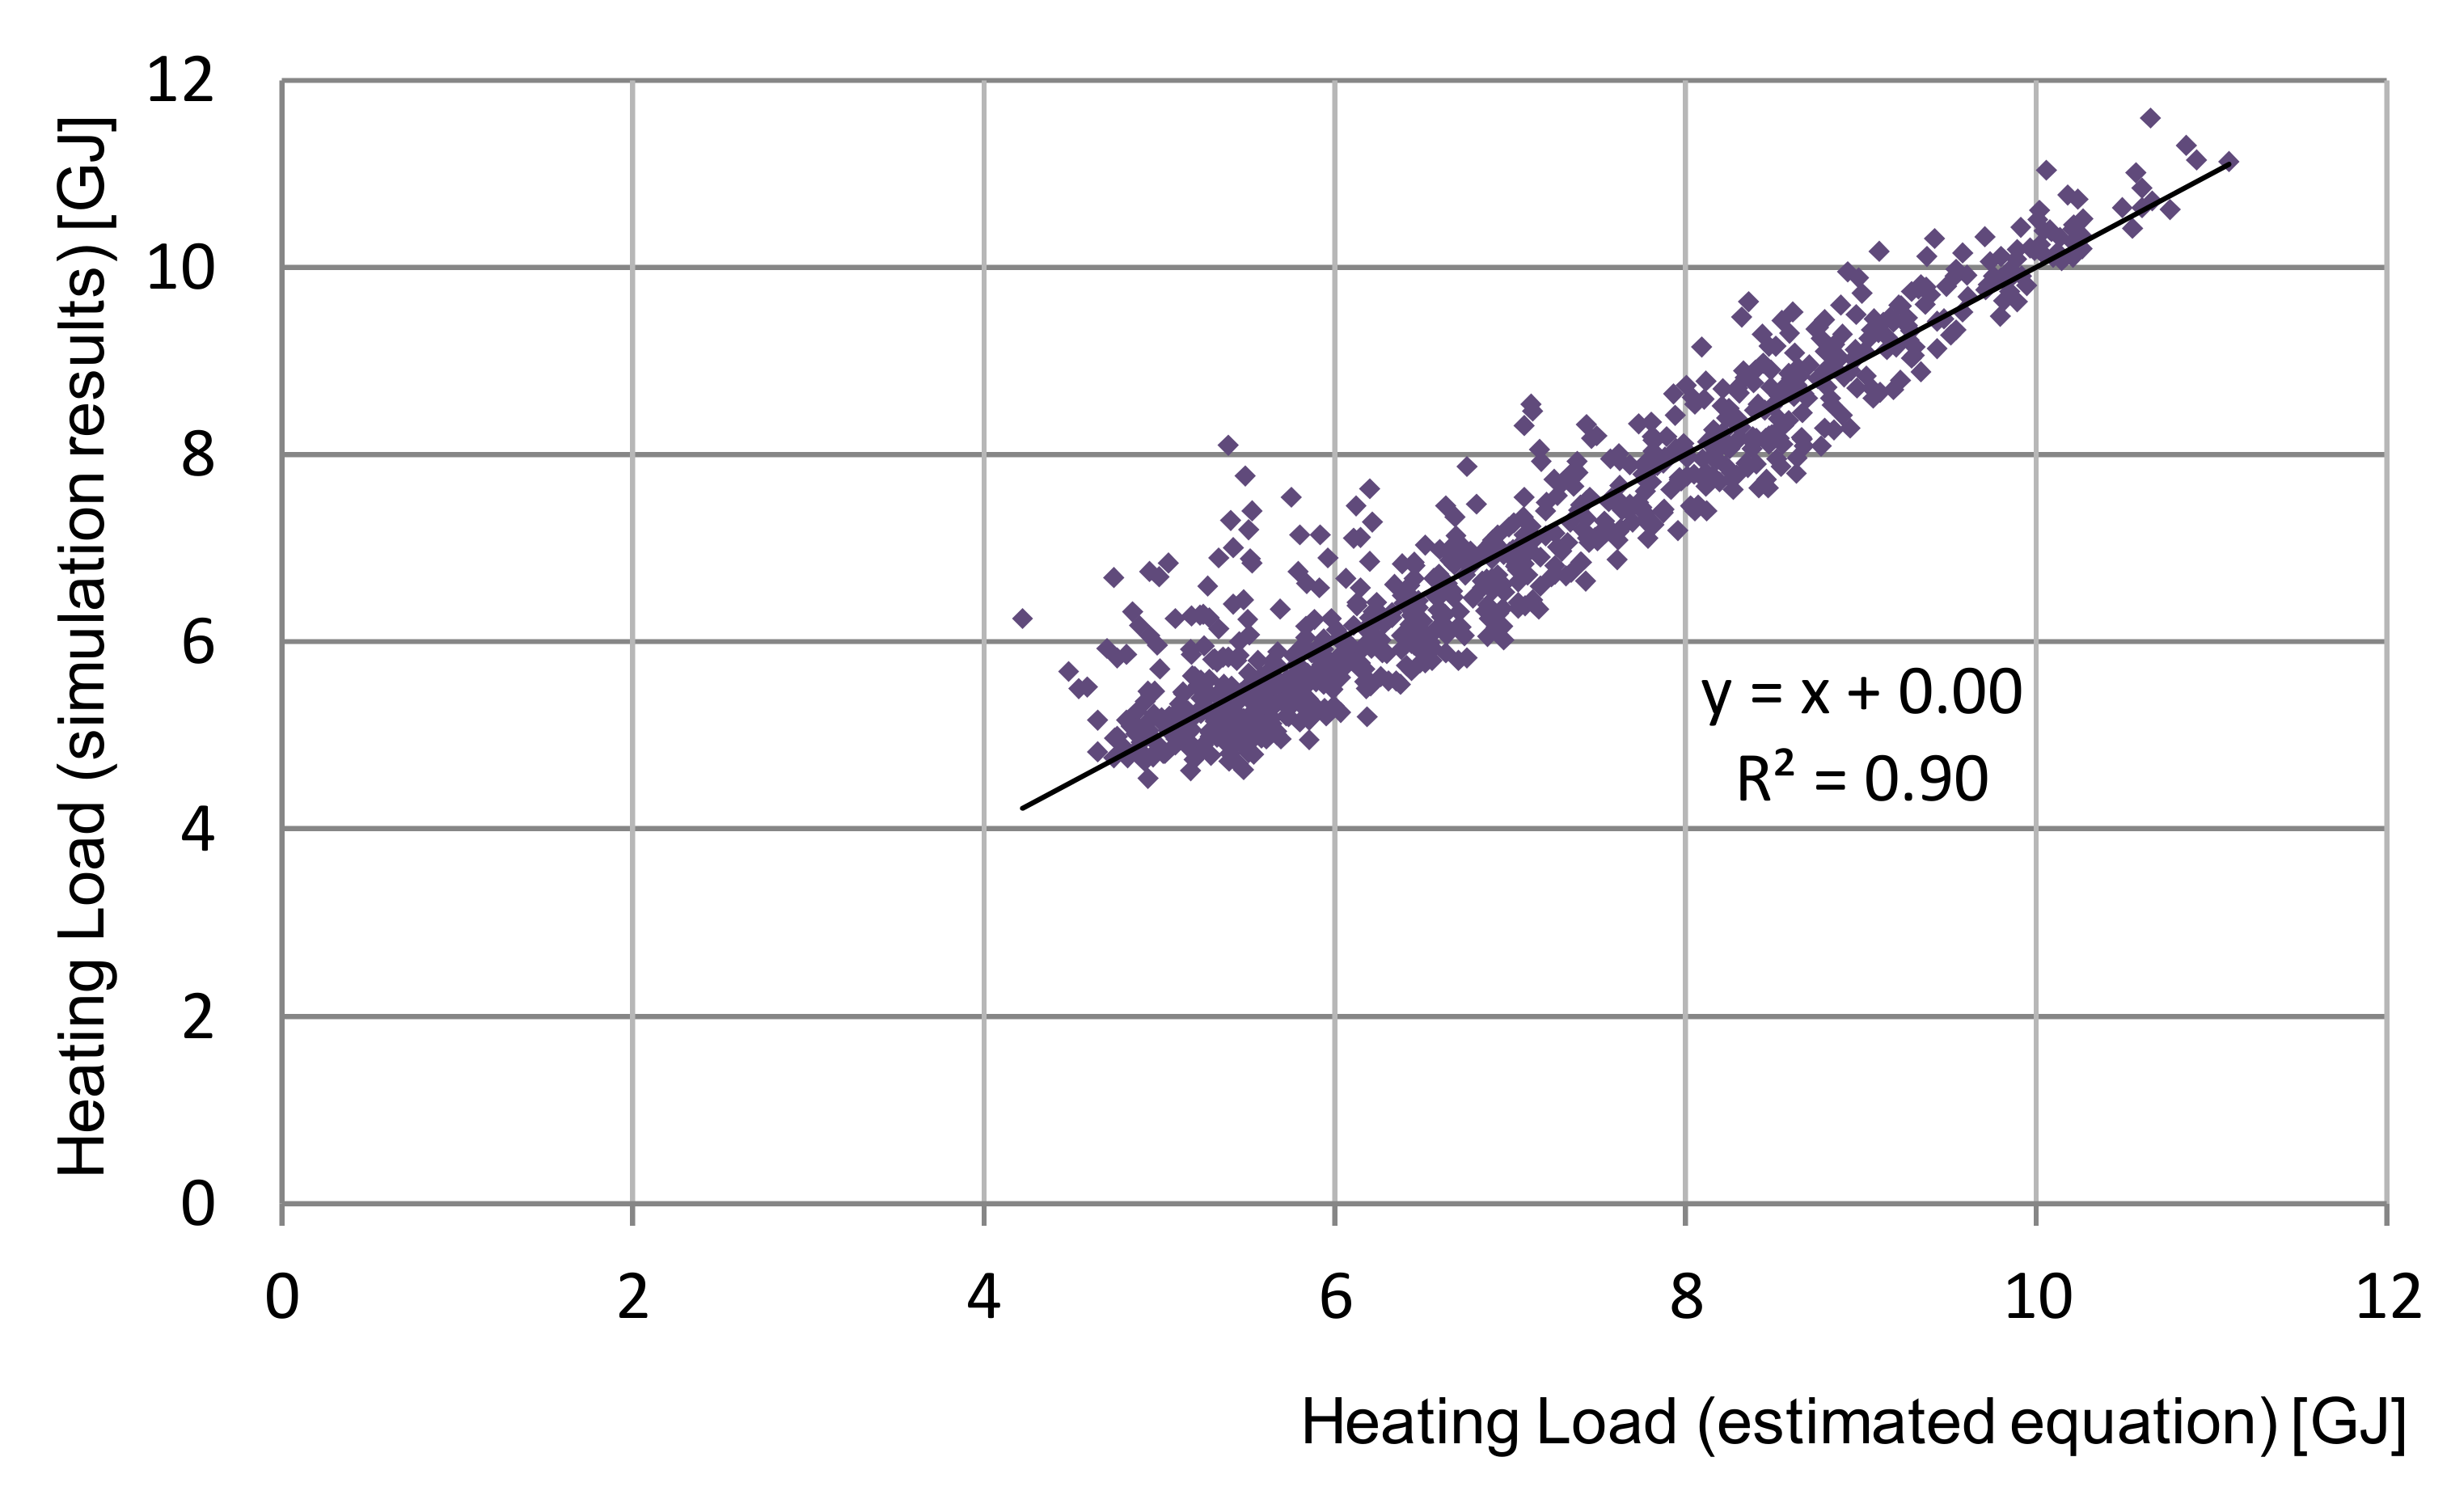
Figure 3.
Position of weather data.
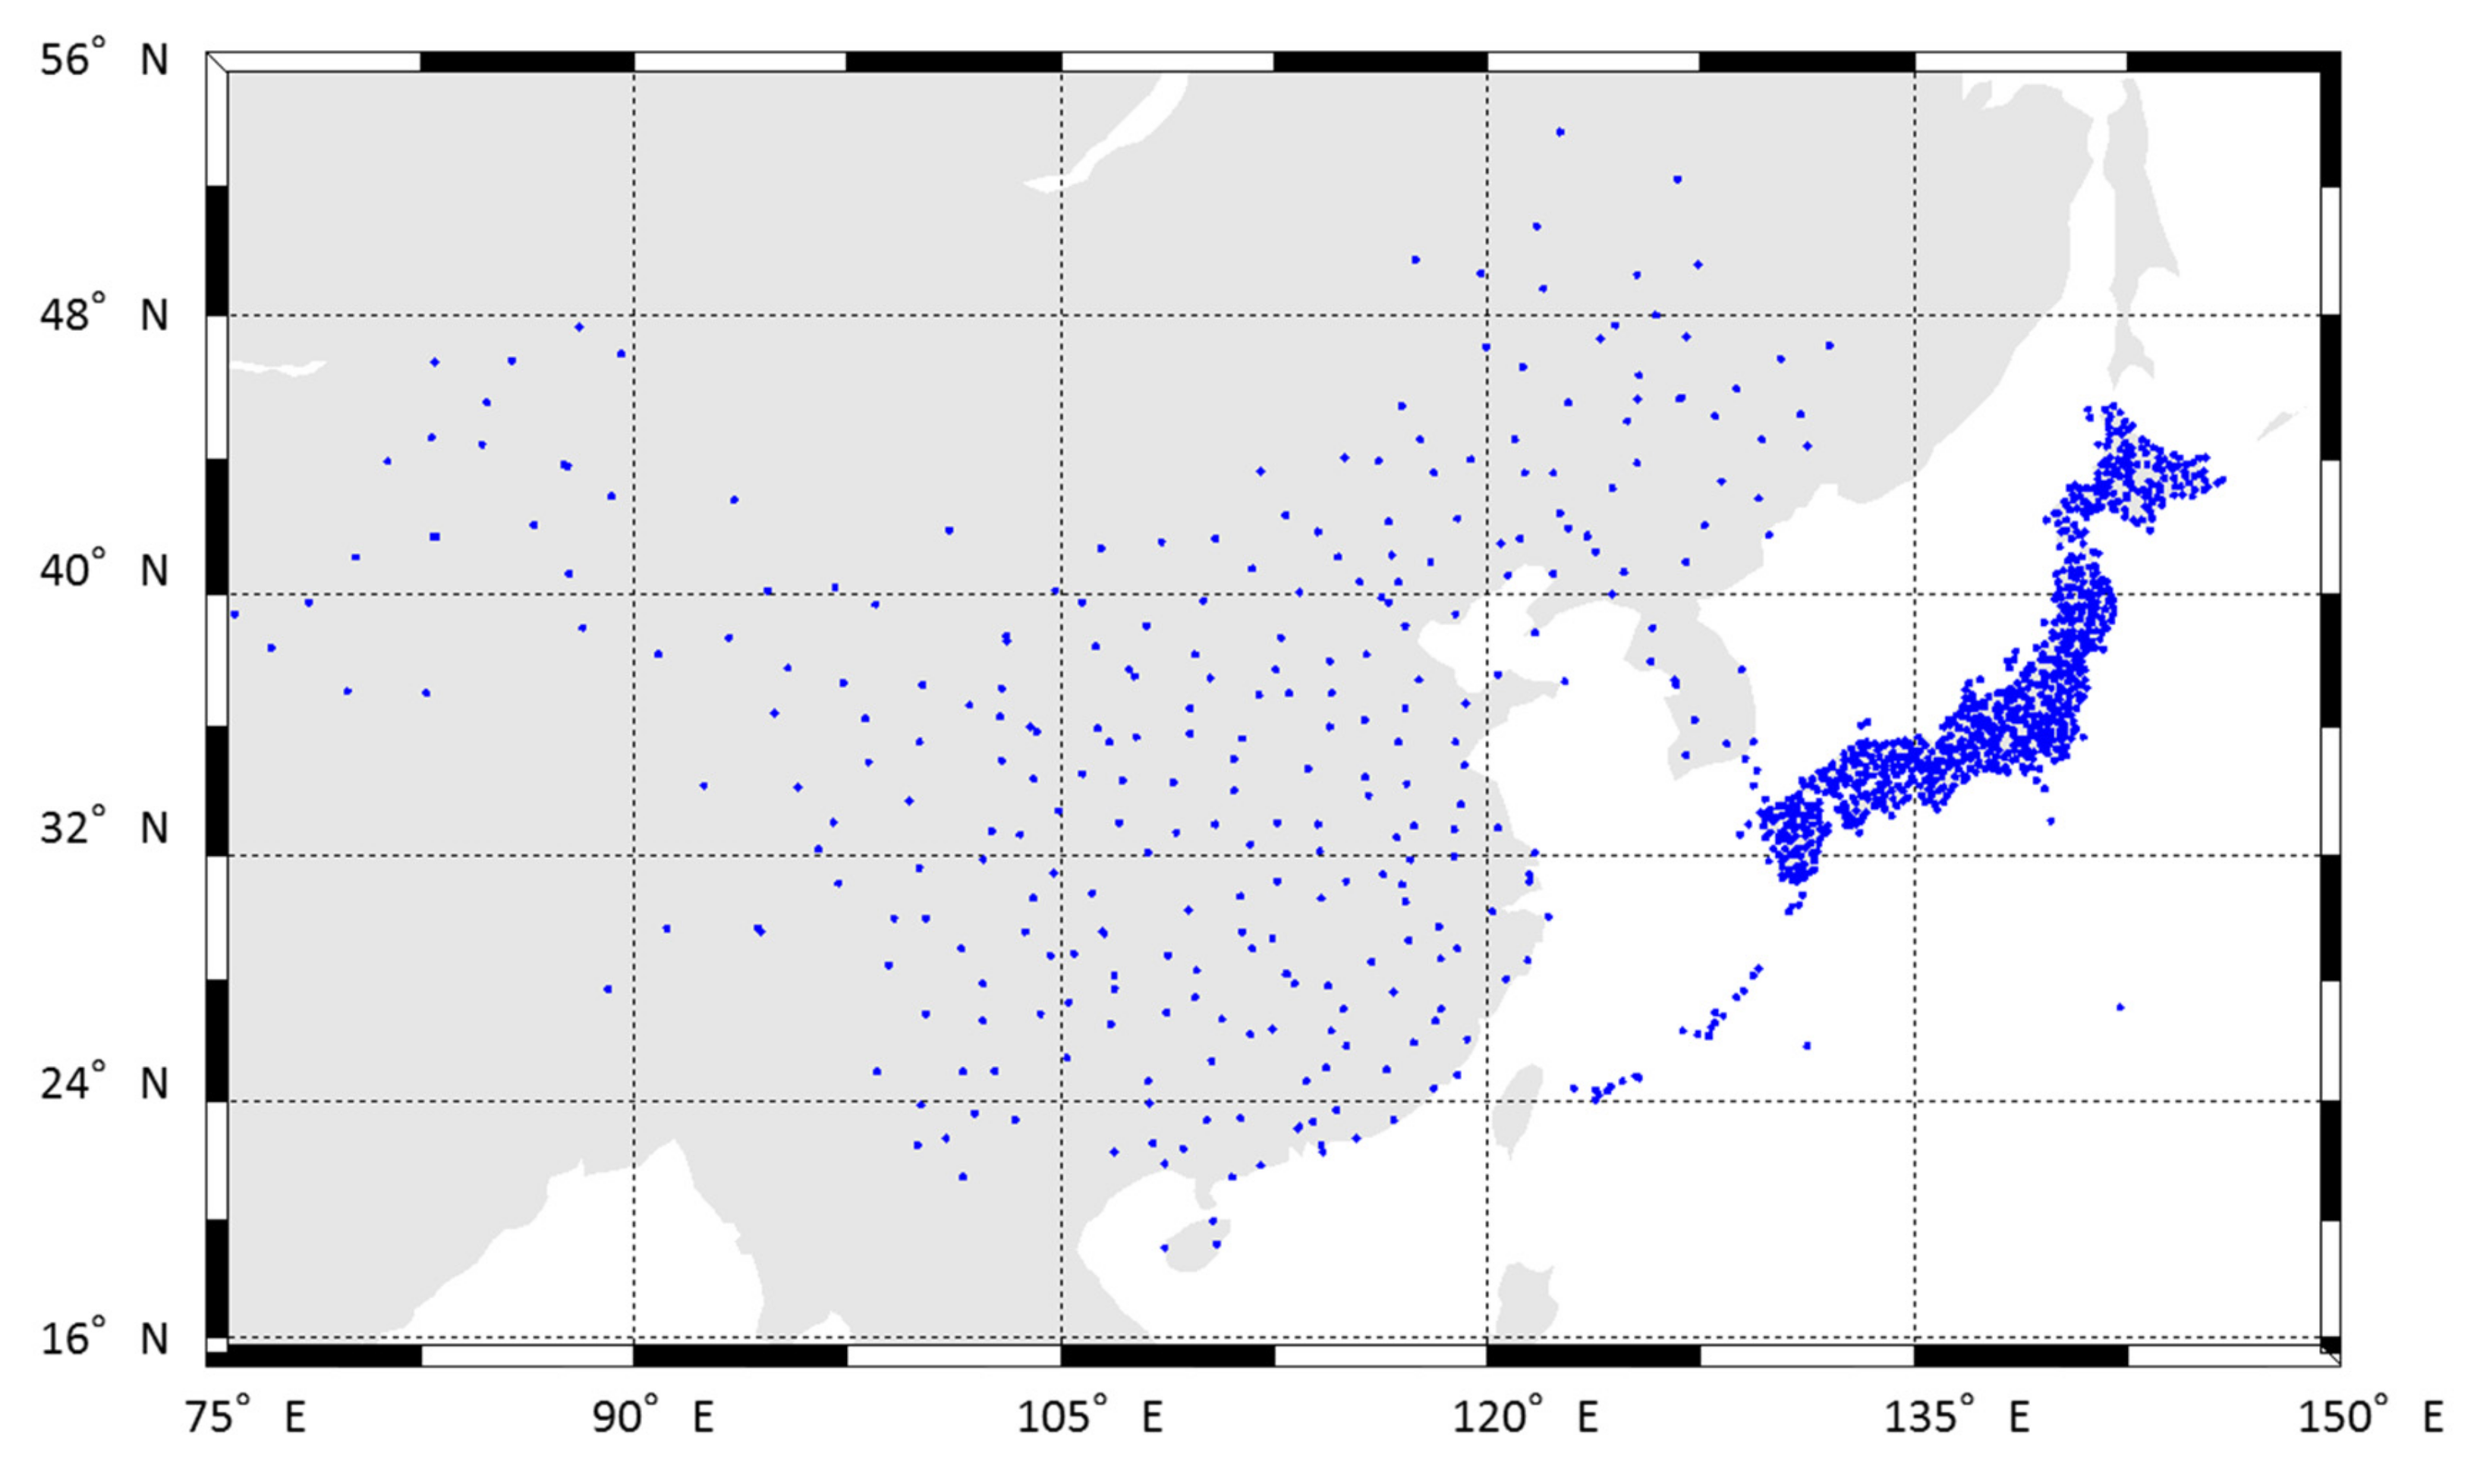
Figure 4.
Solar global horizontal irradiance classification criteria in China.
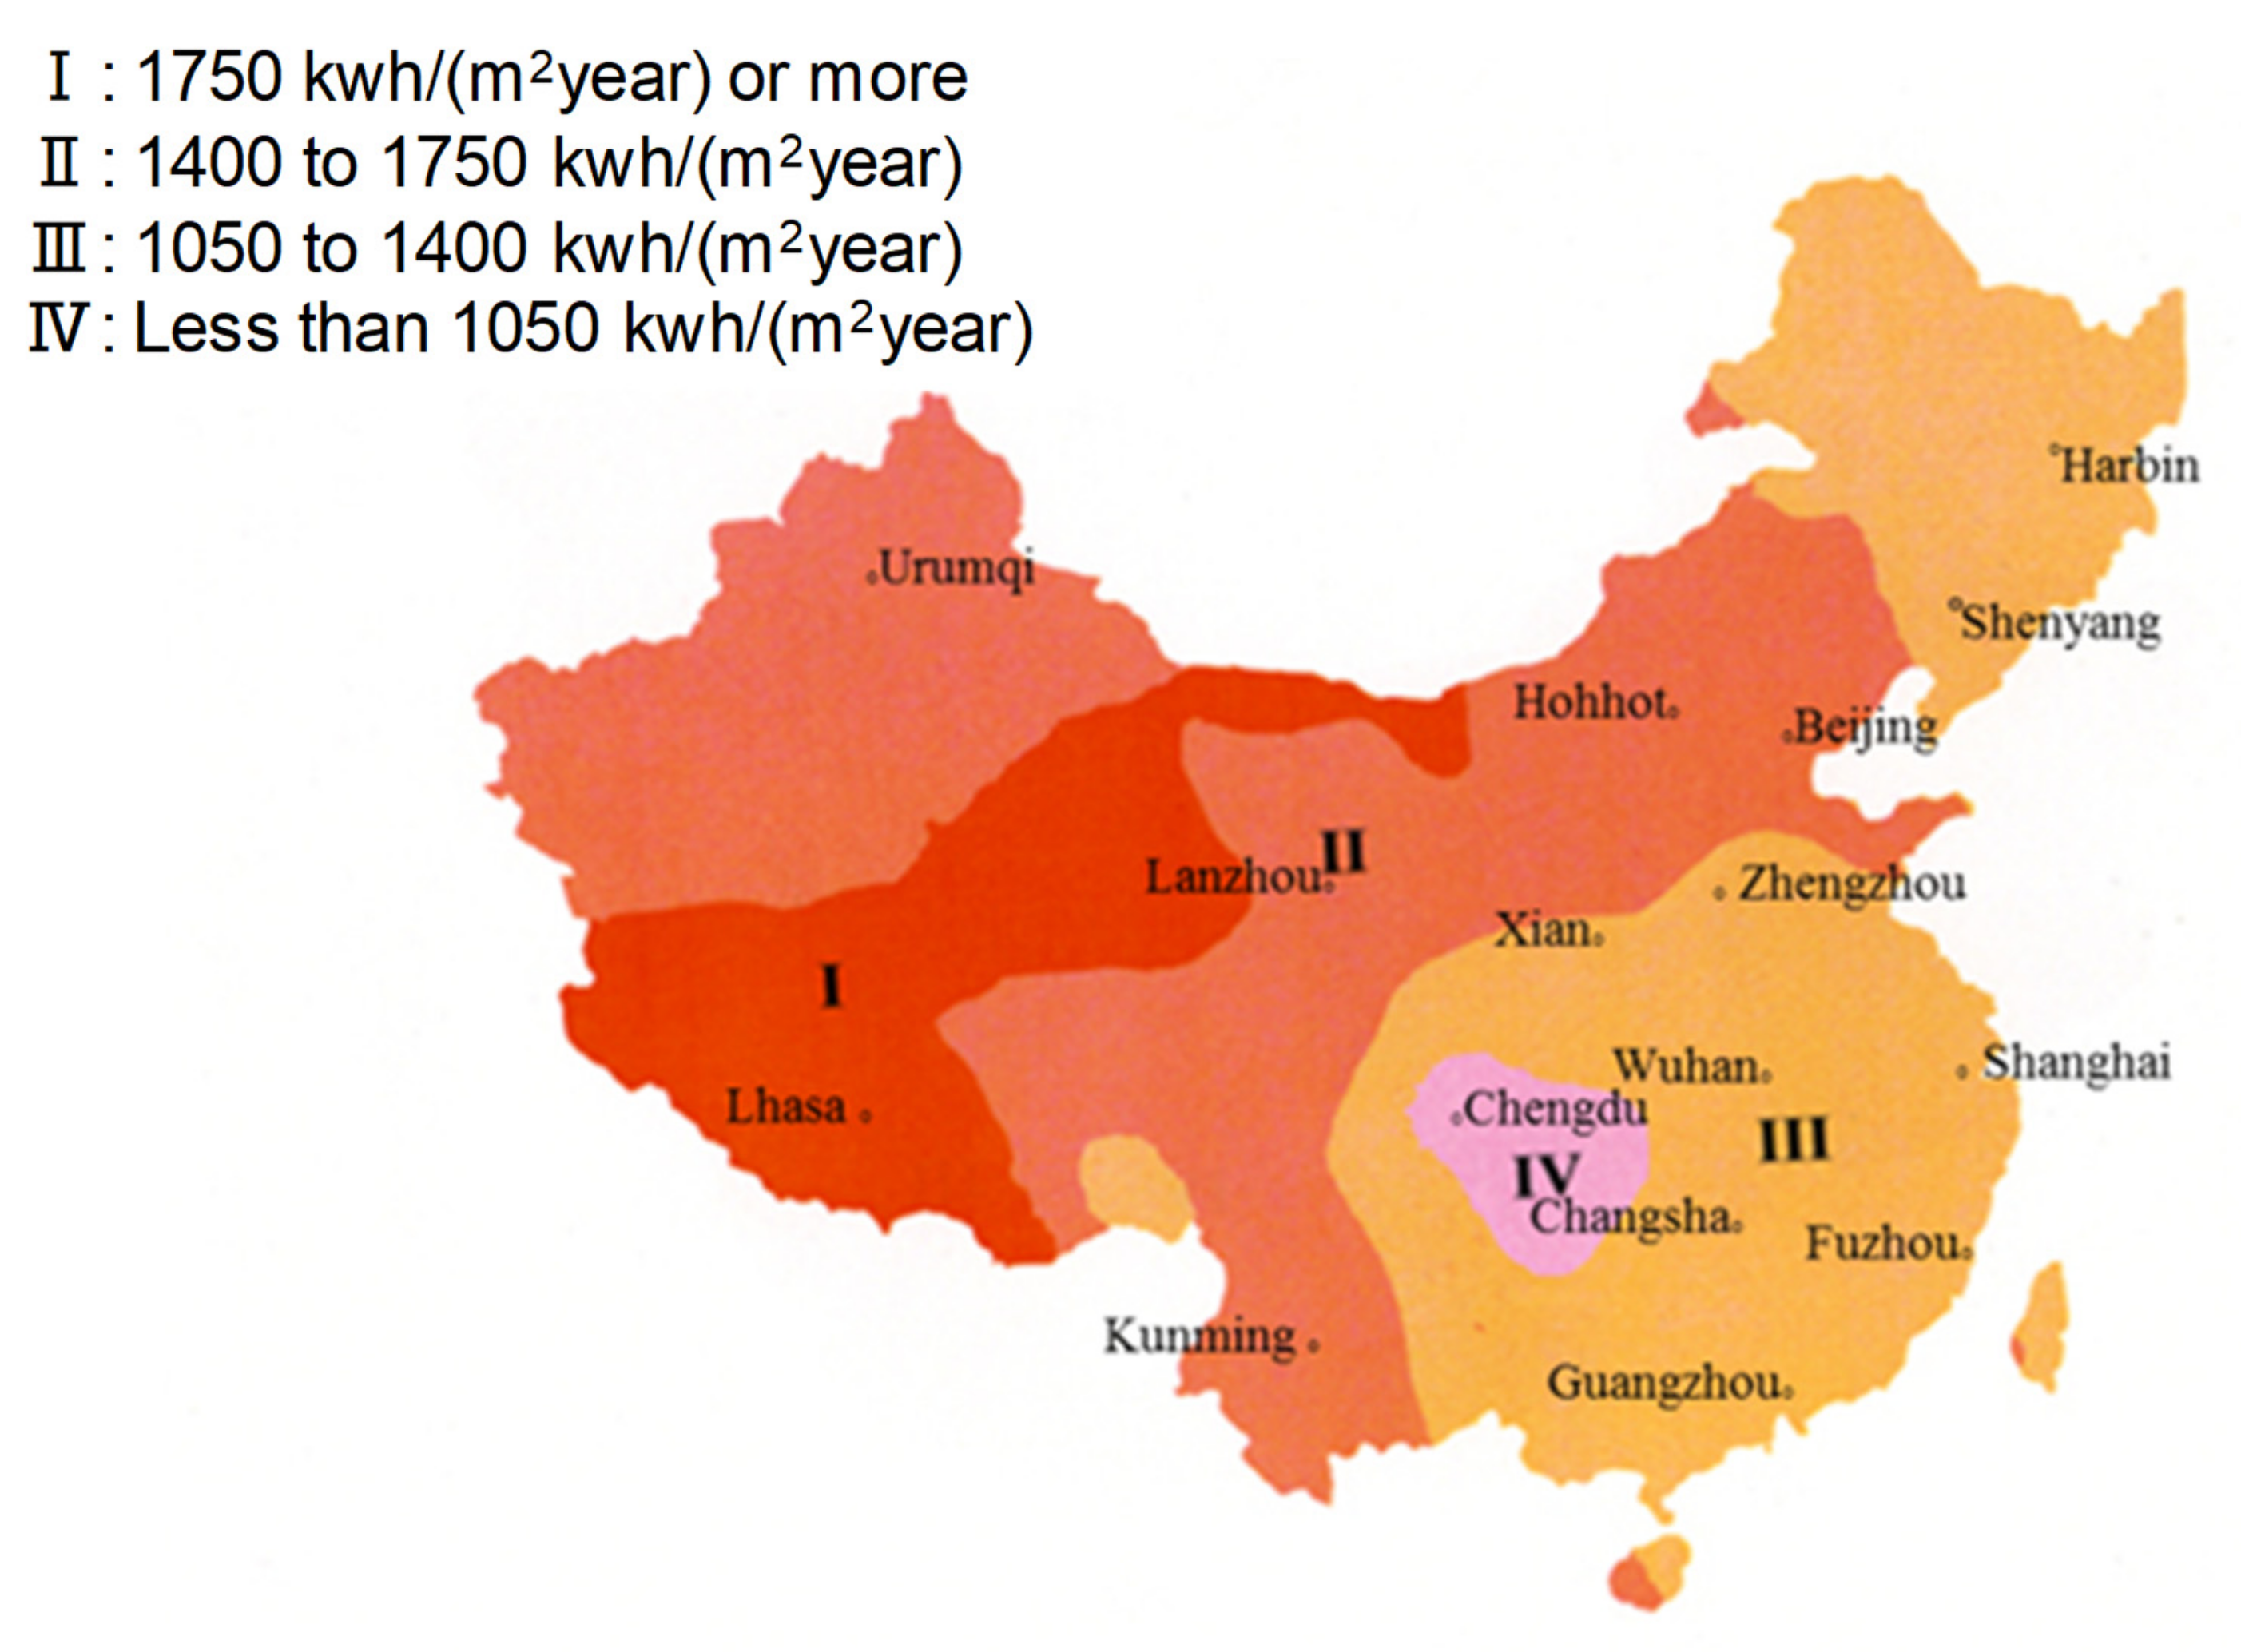
Figure 5.
Ratio of solar-heat available days to days required for heating.
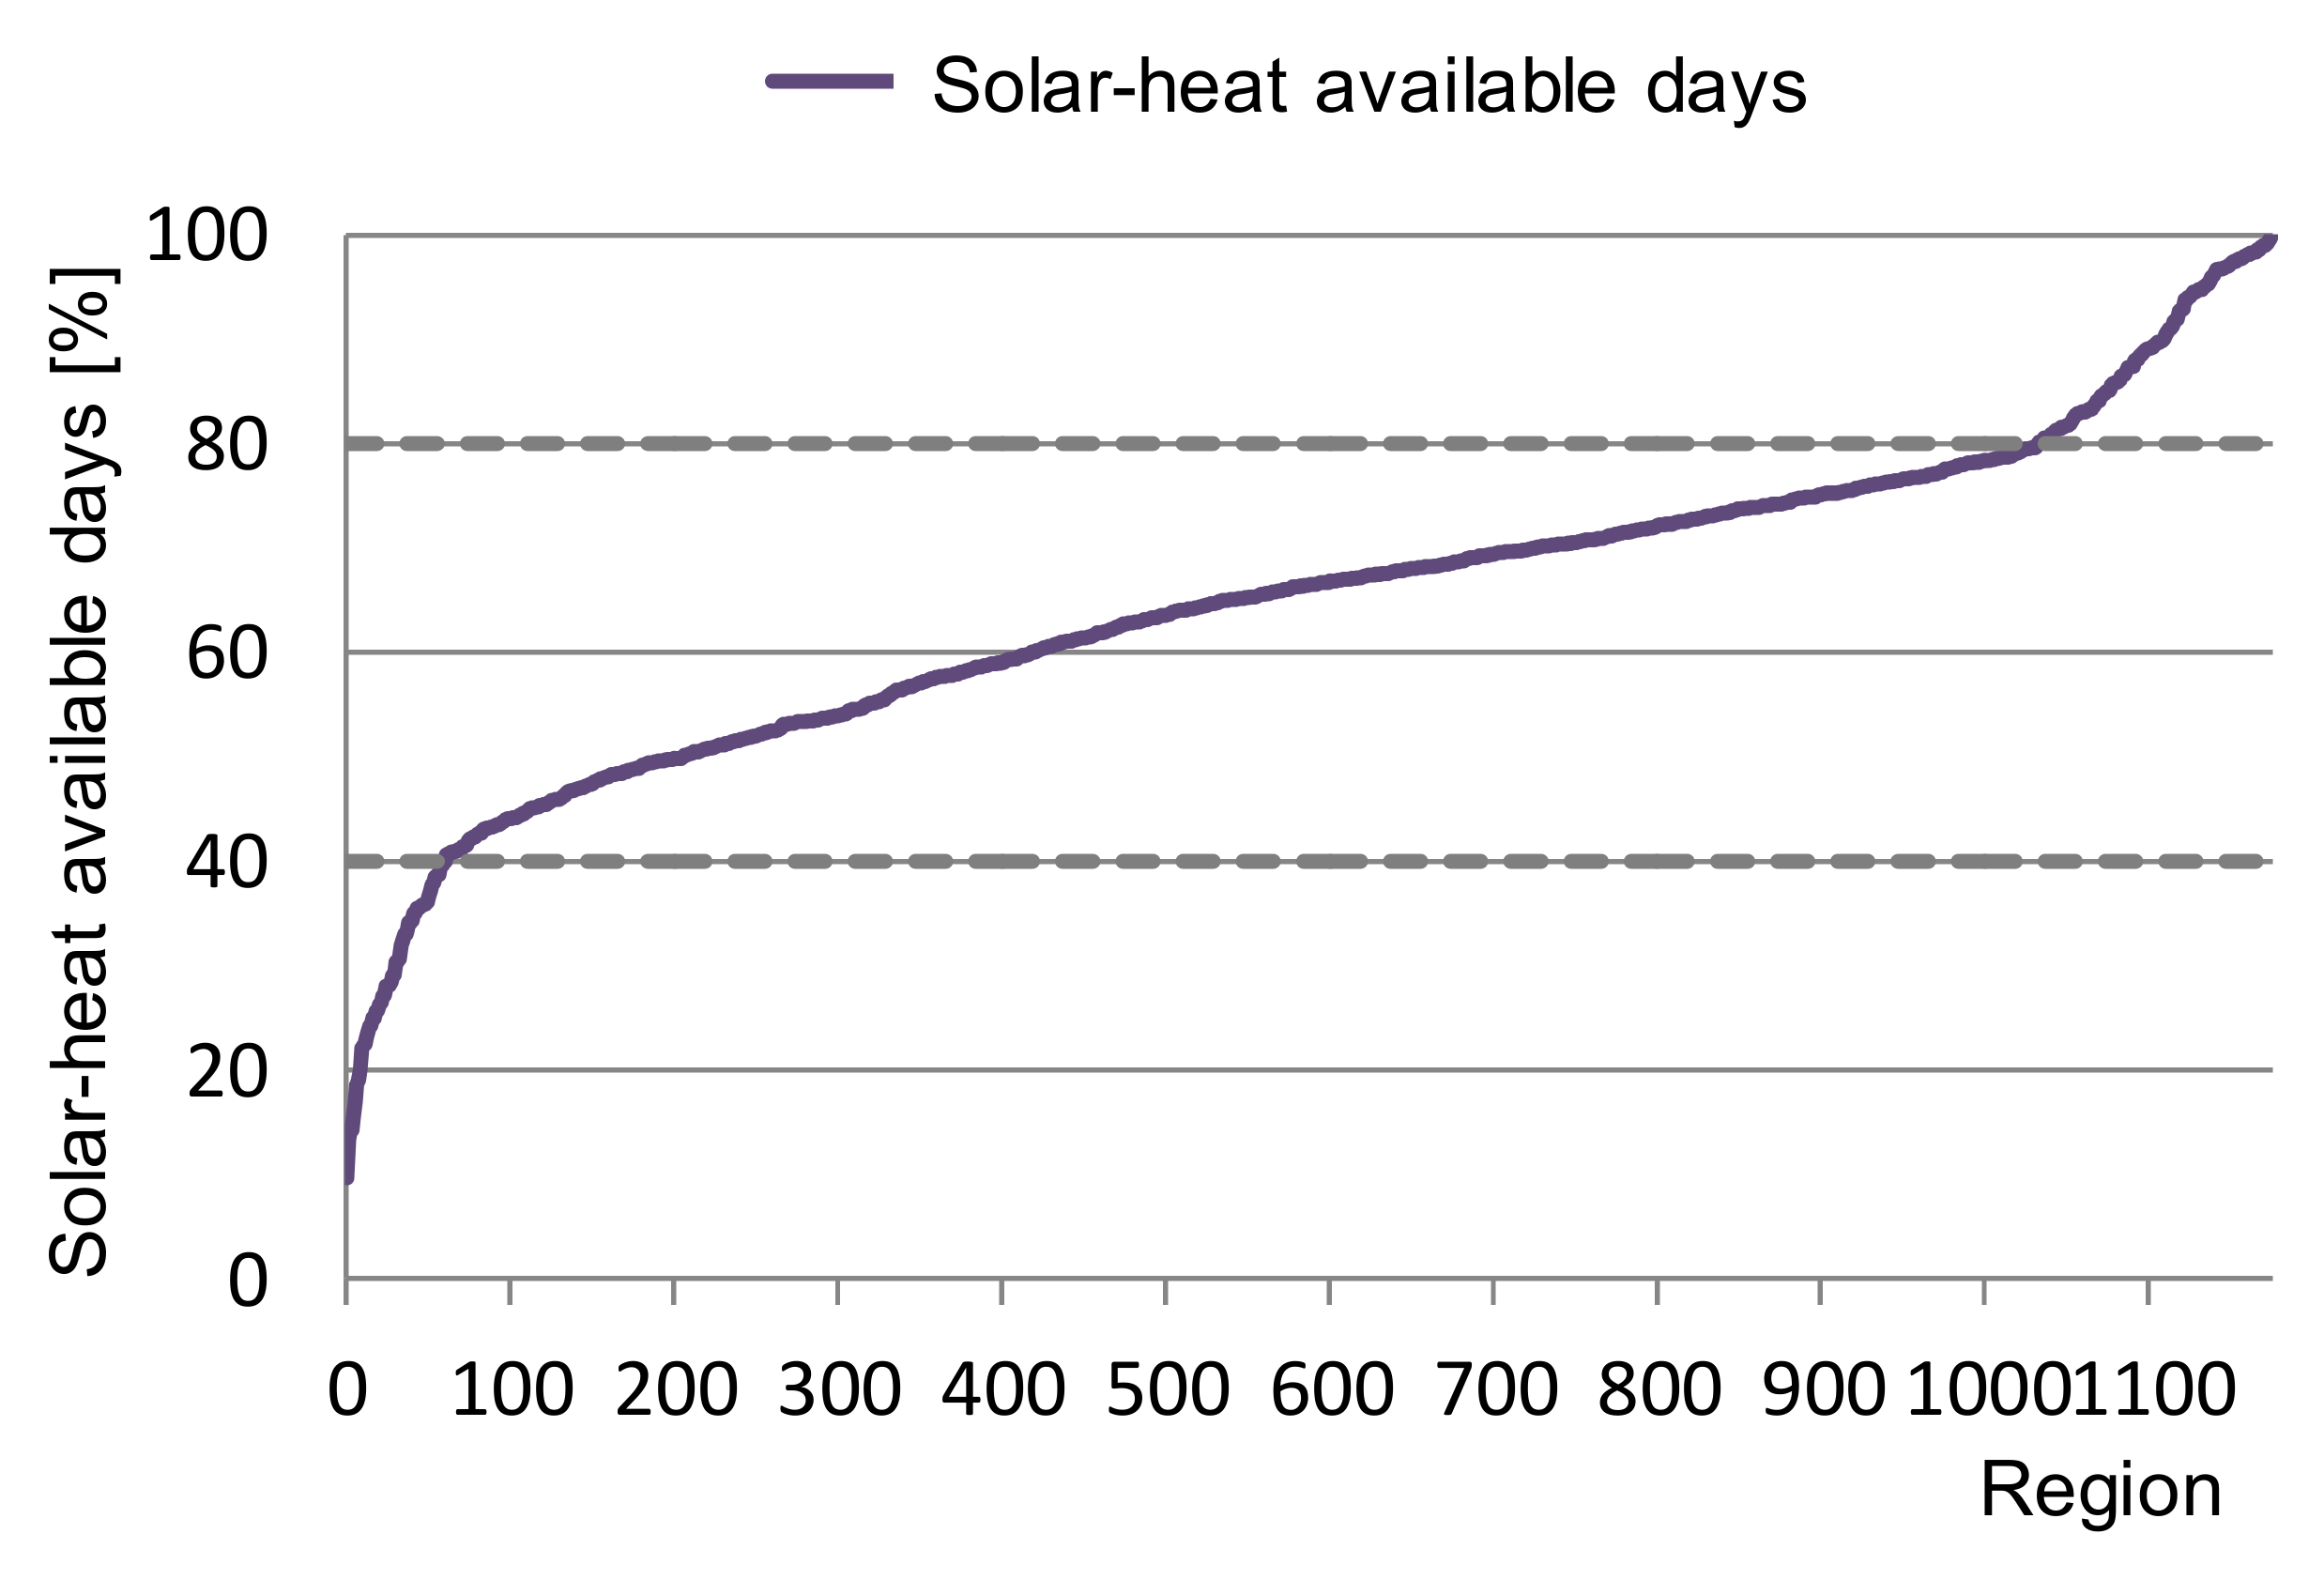
Figure 6.
Notation of region classification.

Figure 7.
Classification by heating degree day (based on Table 10).
Figure 7.
Classification by heating degree day (based on Table 10).
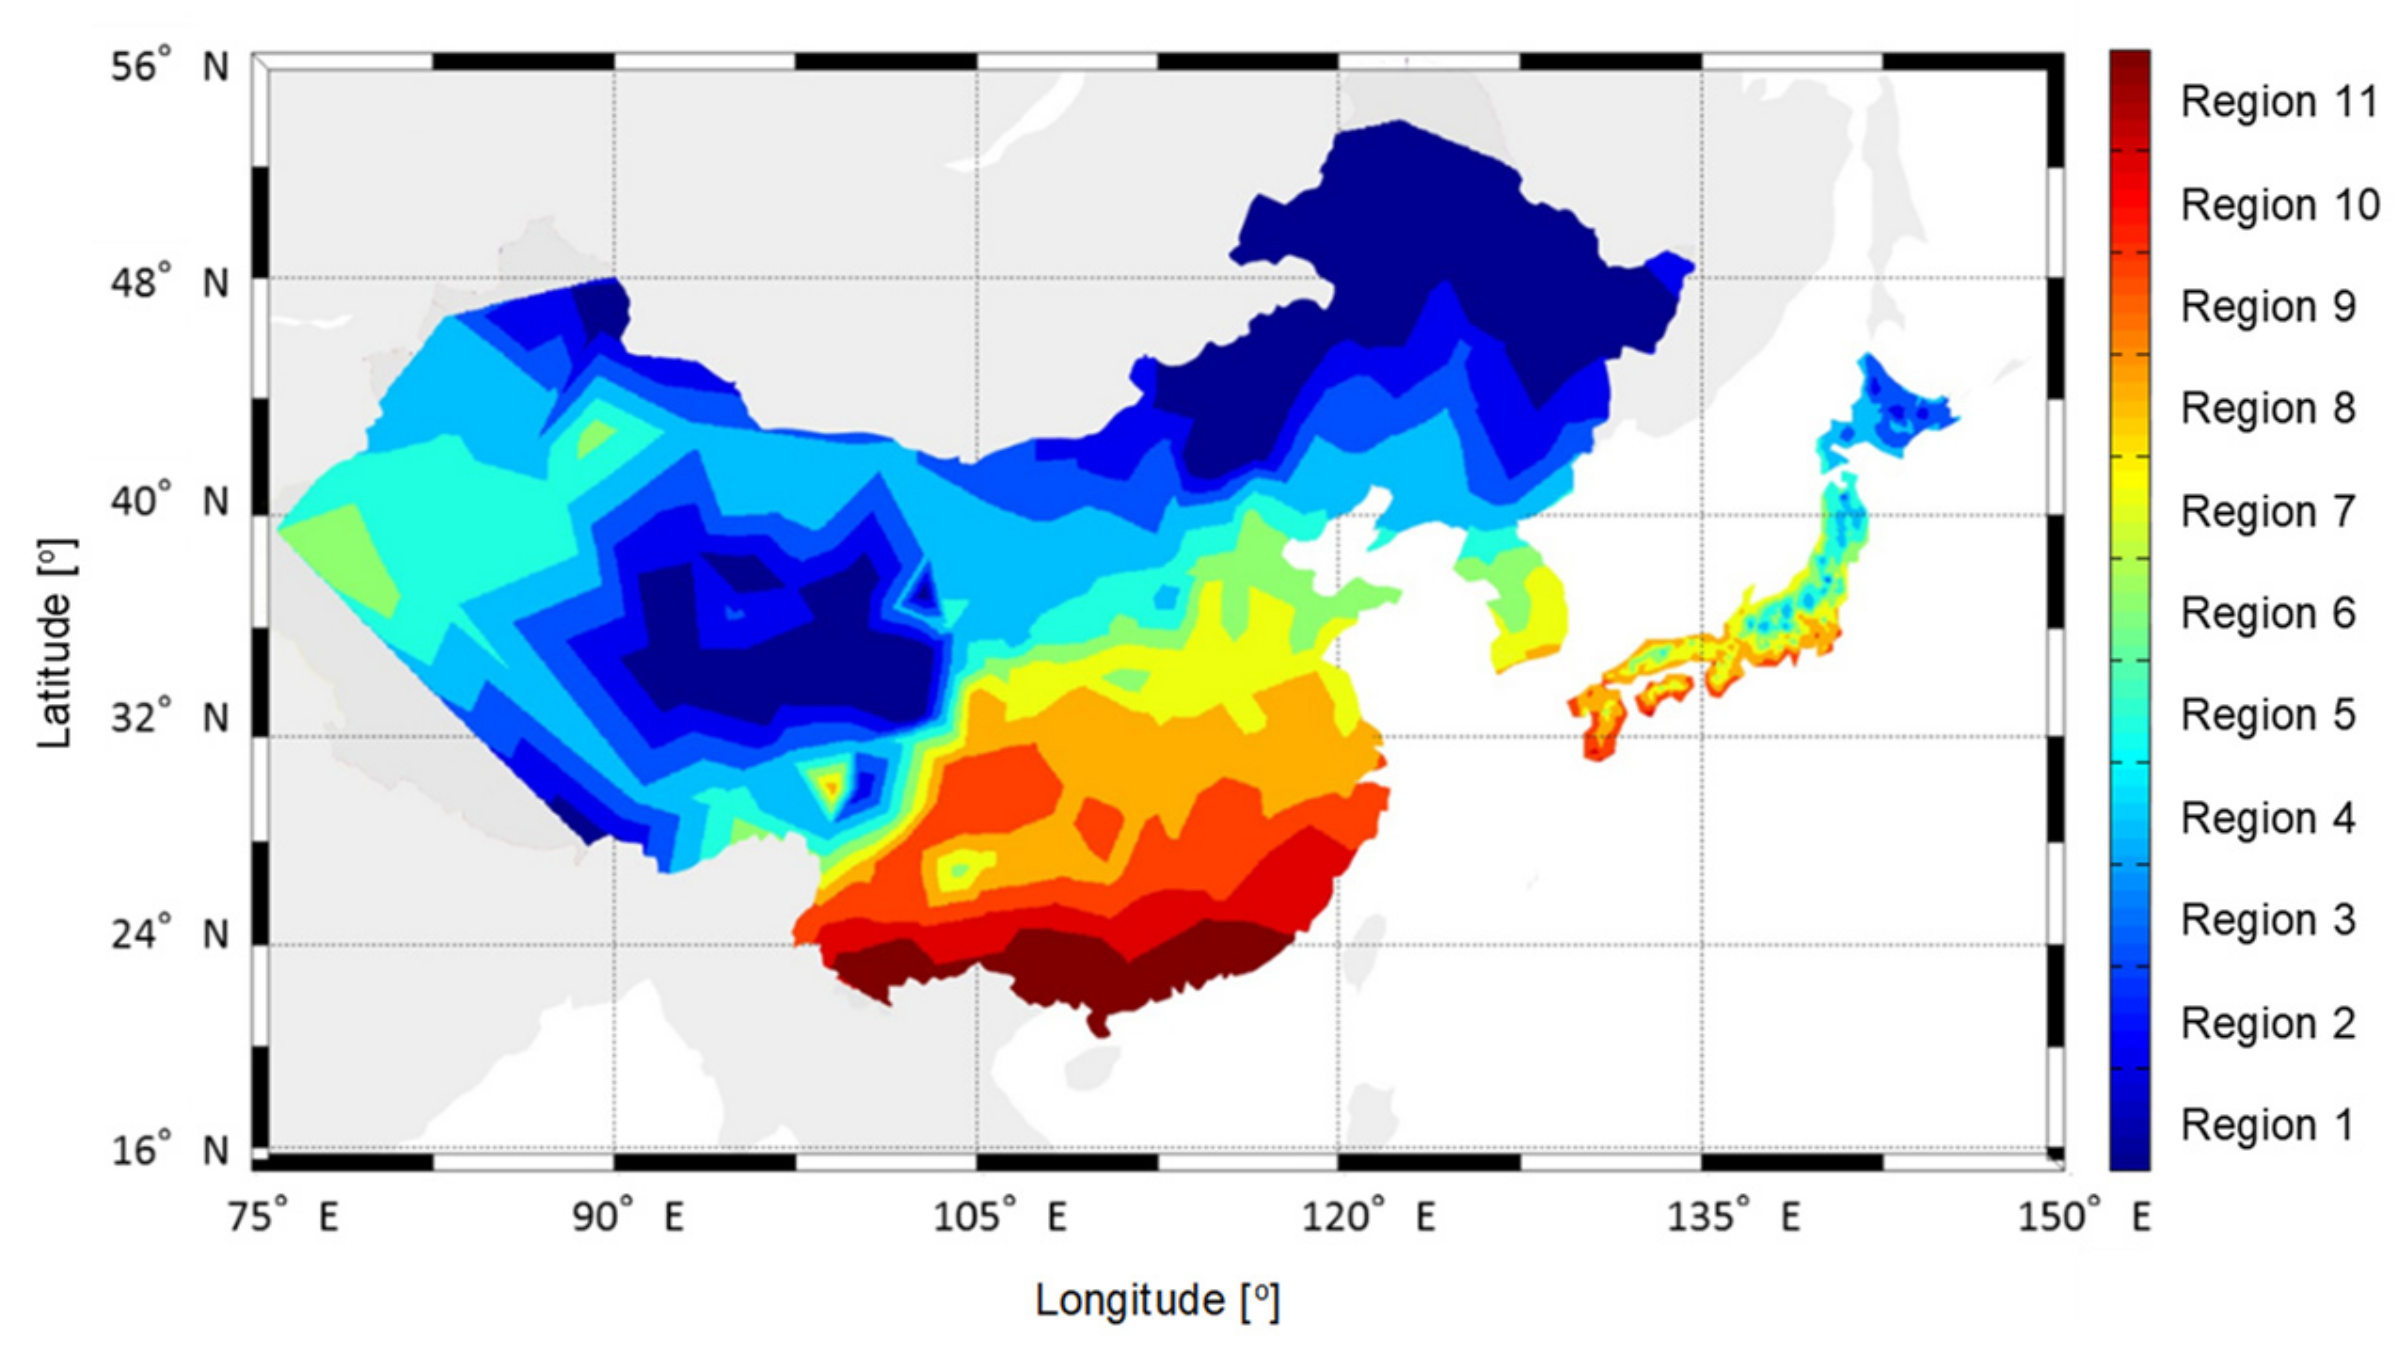
Figure 8.
Classification by daily solar global horizontal irradiance (based on Table 12).
Figure 8.
Classification by daily solar global horizontal irradiance (based on Table 12).
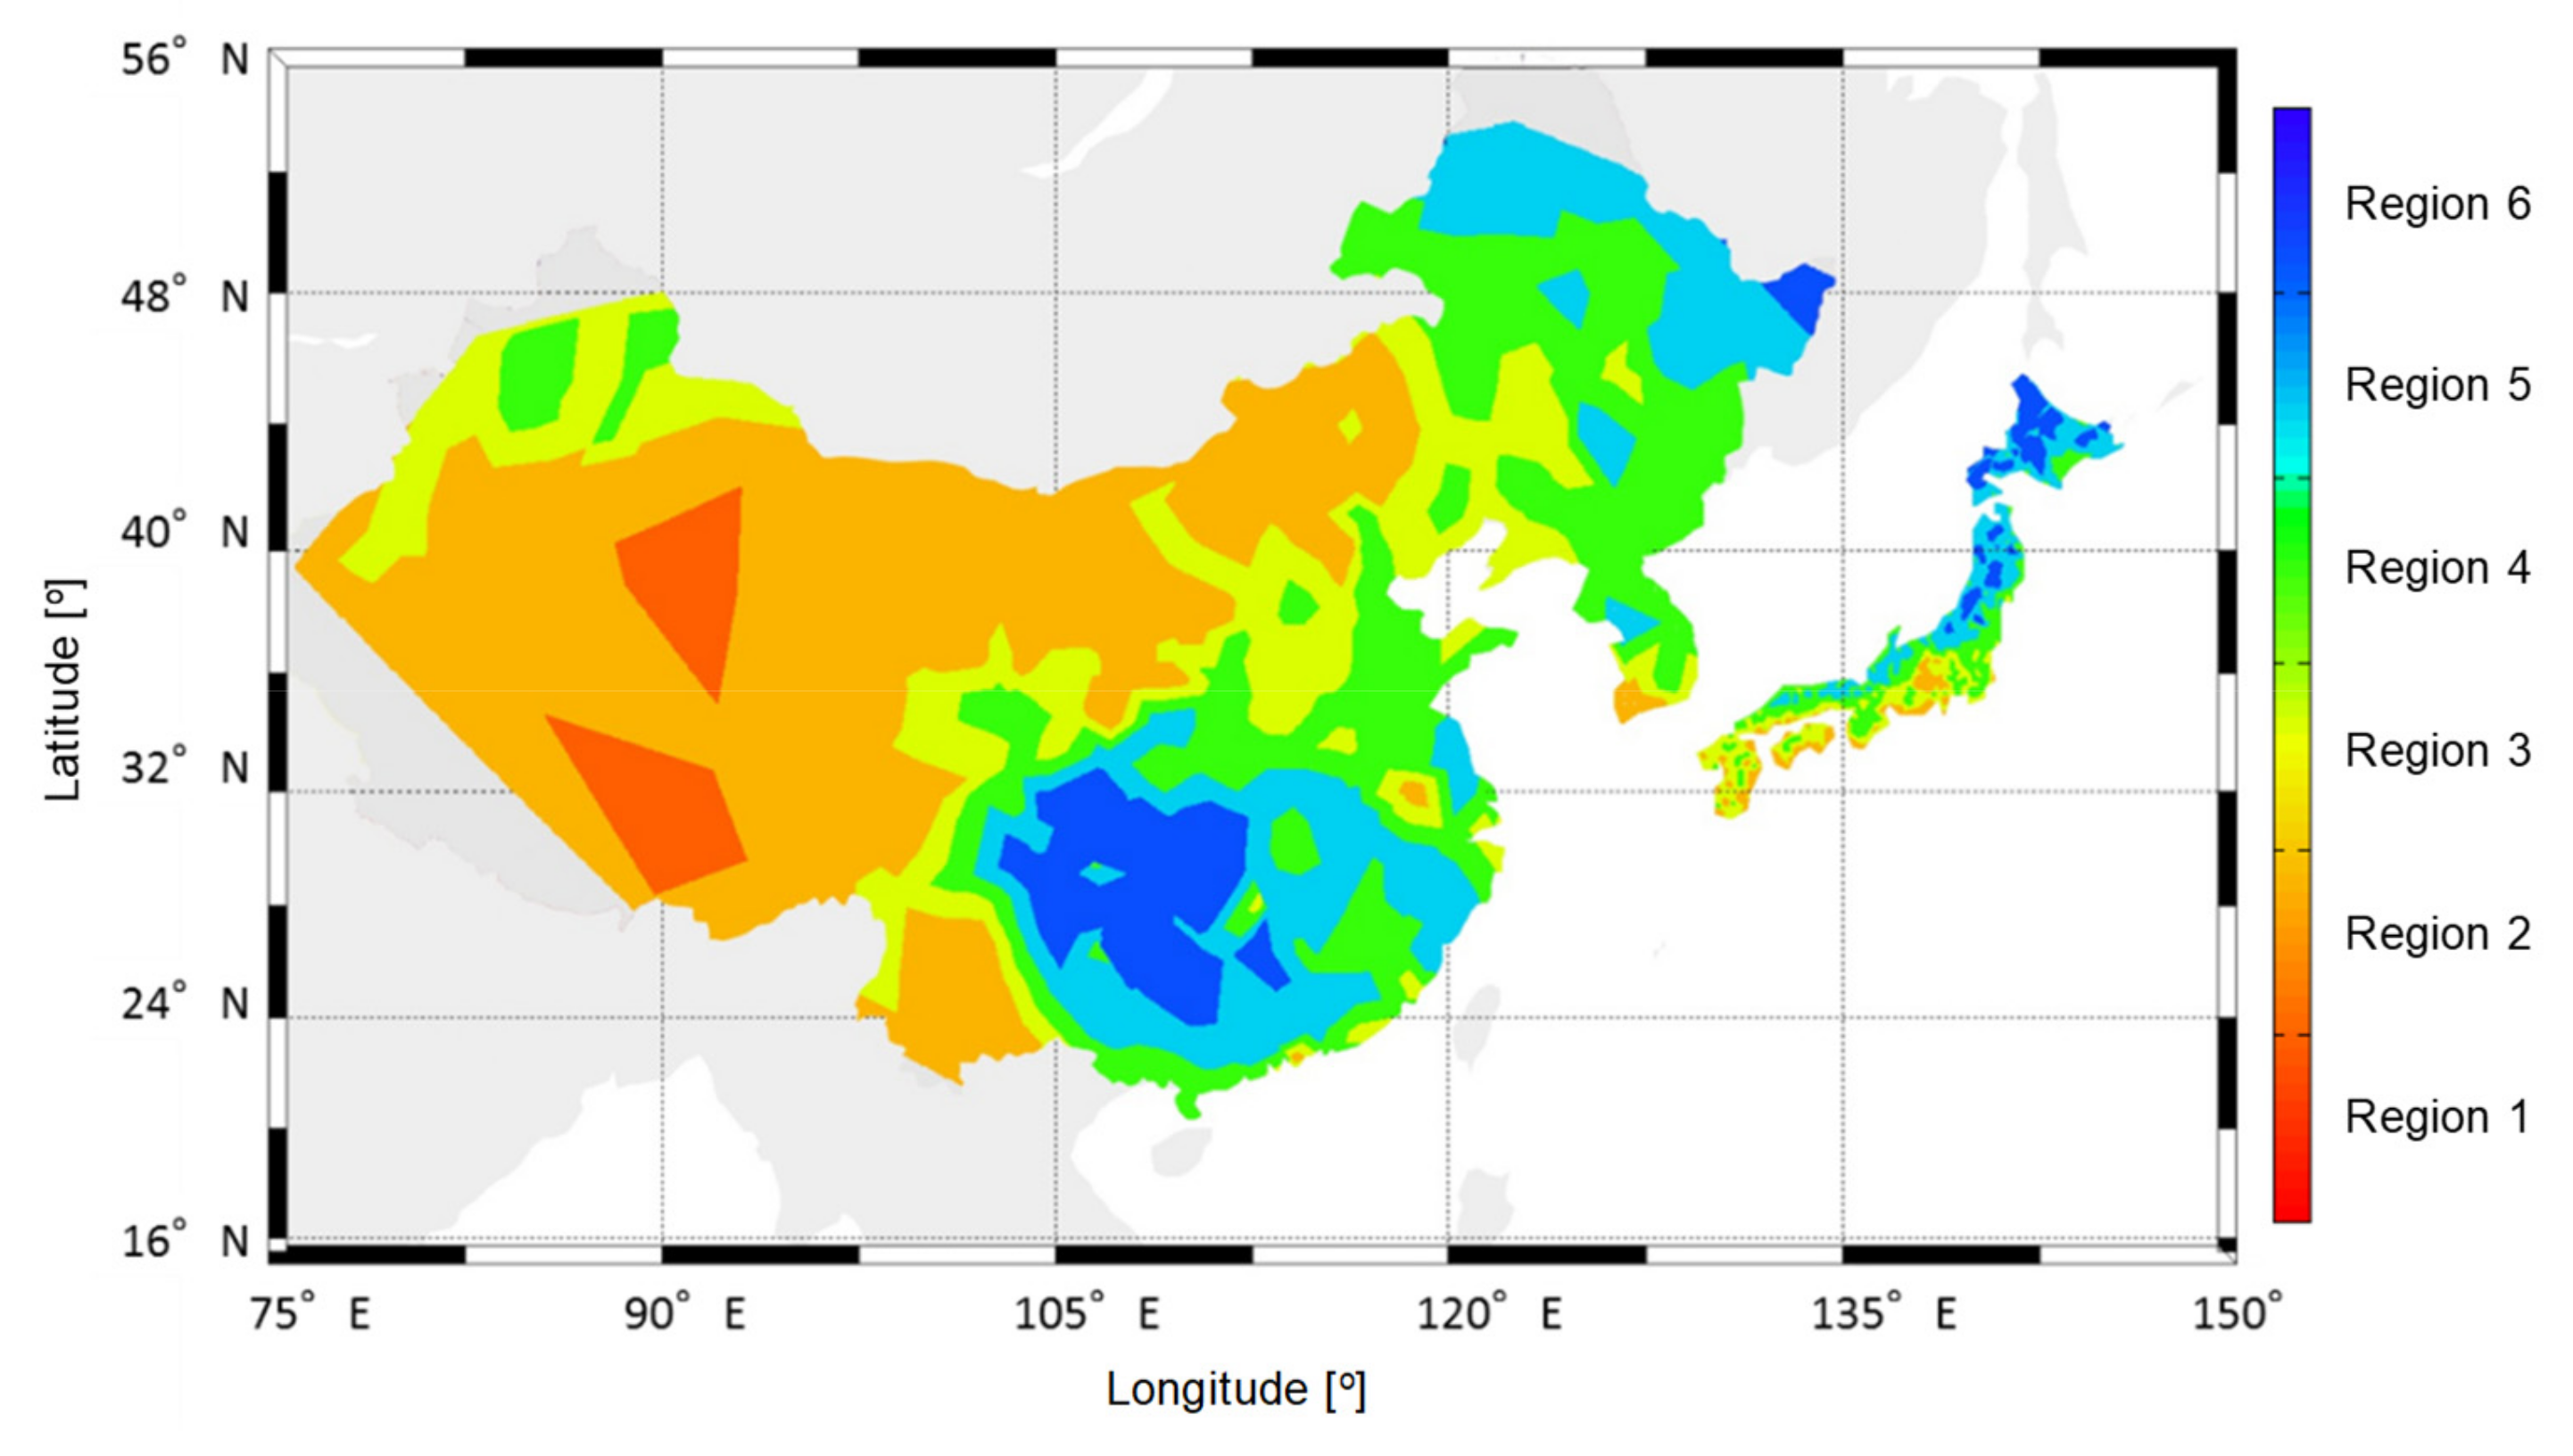
Figure 9.
Classification by solar-heat available days (based on Table 13).
Figure 9.
Classification by solar-heat available days (based on Table 13).
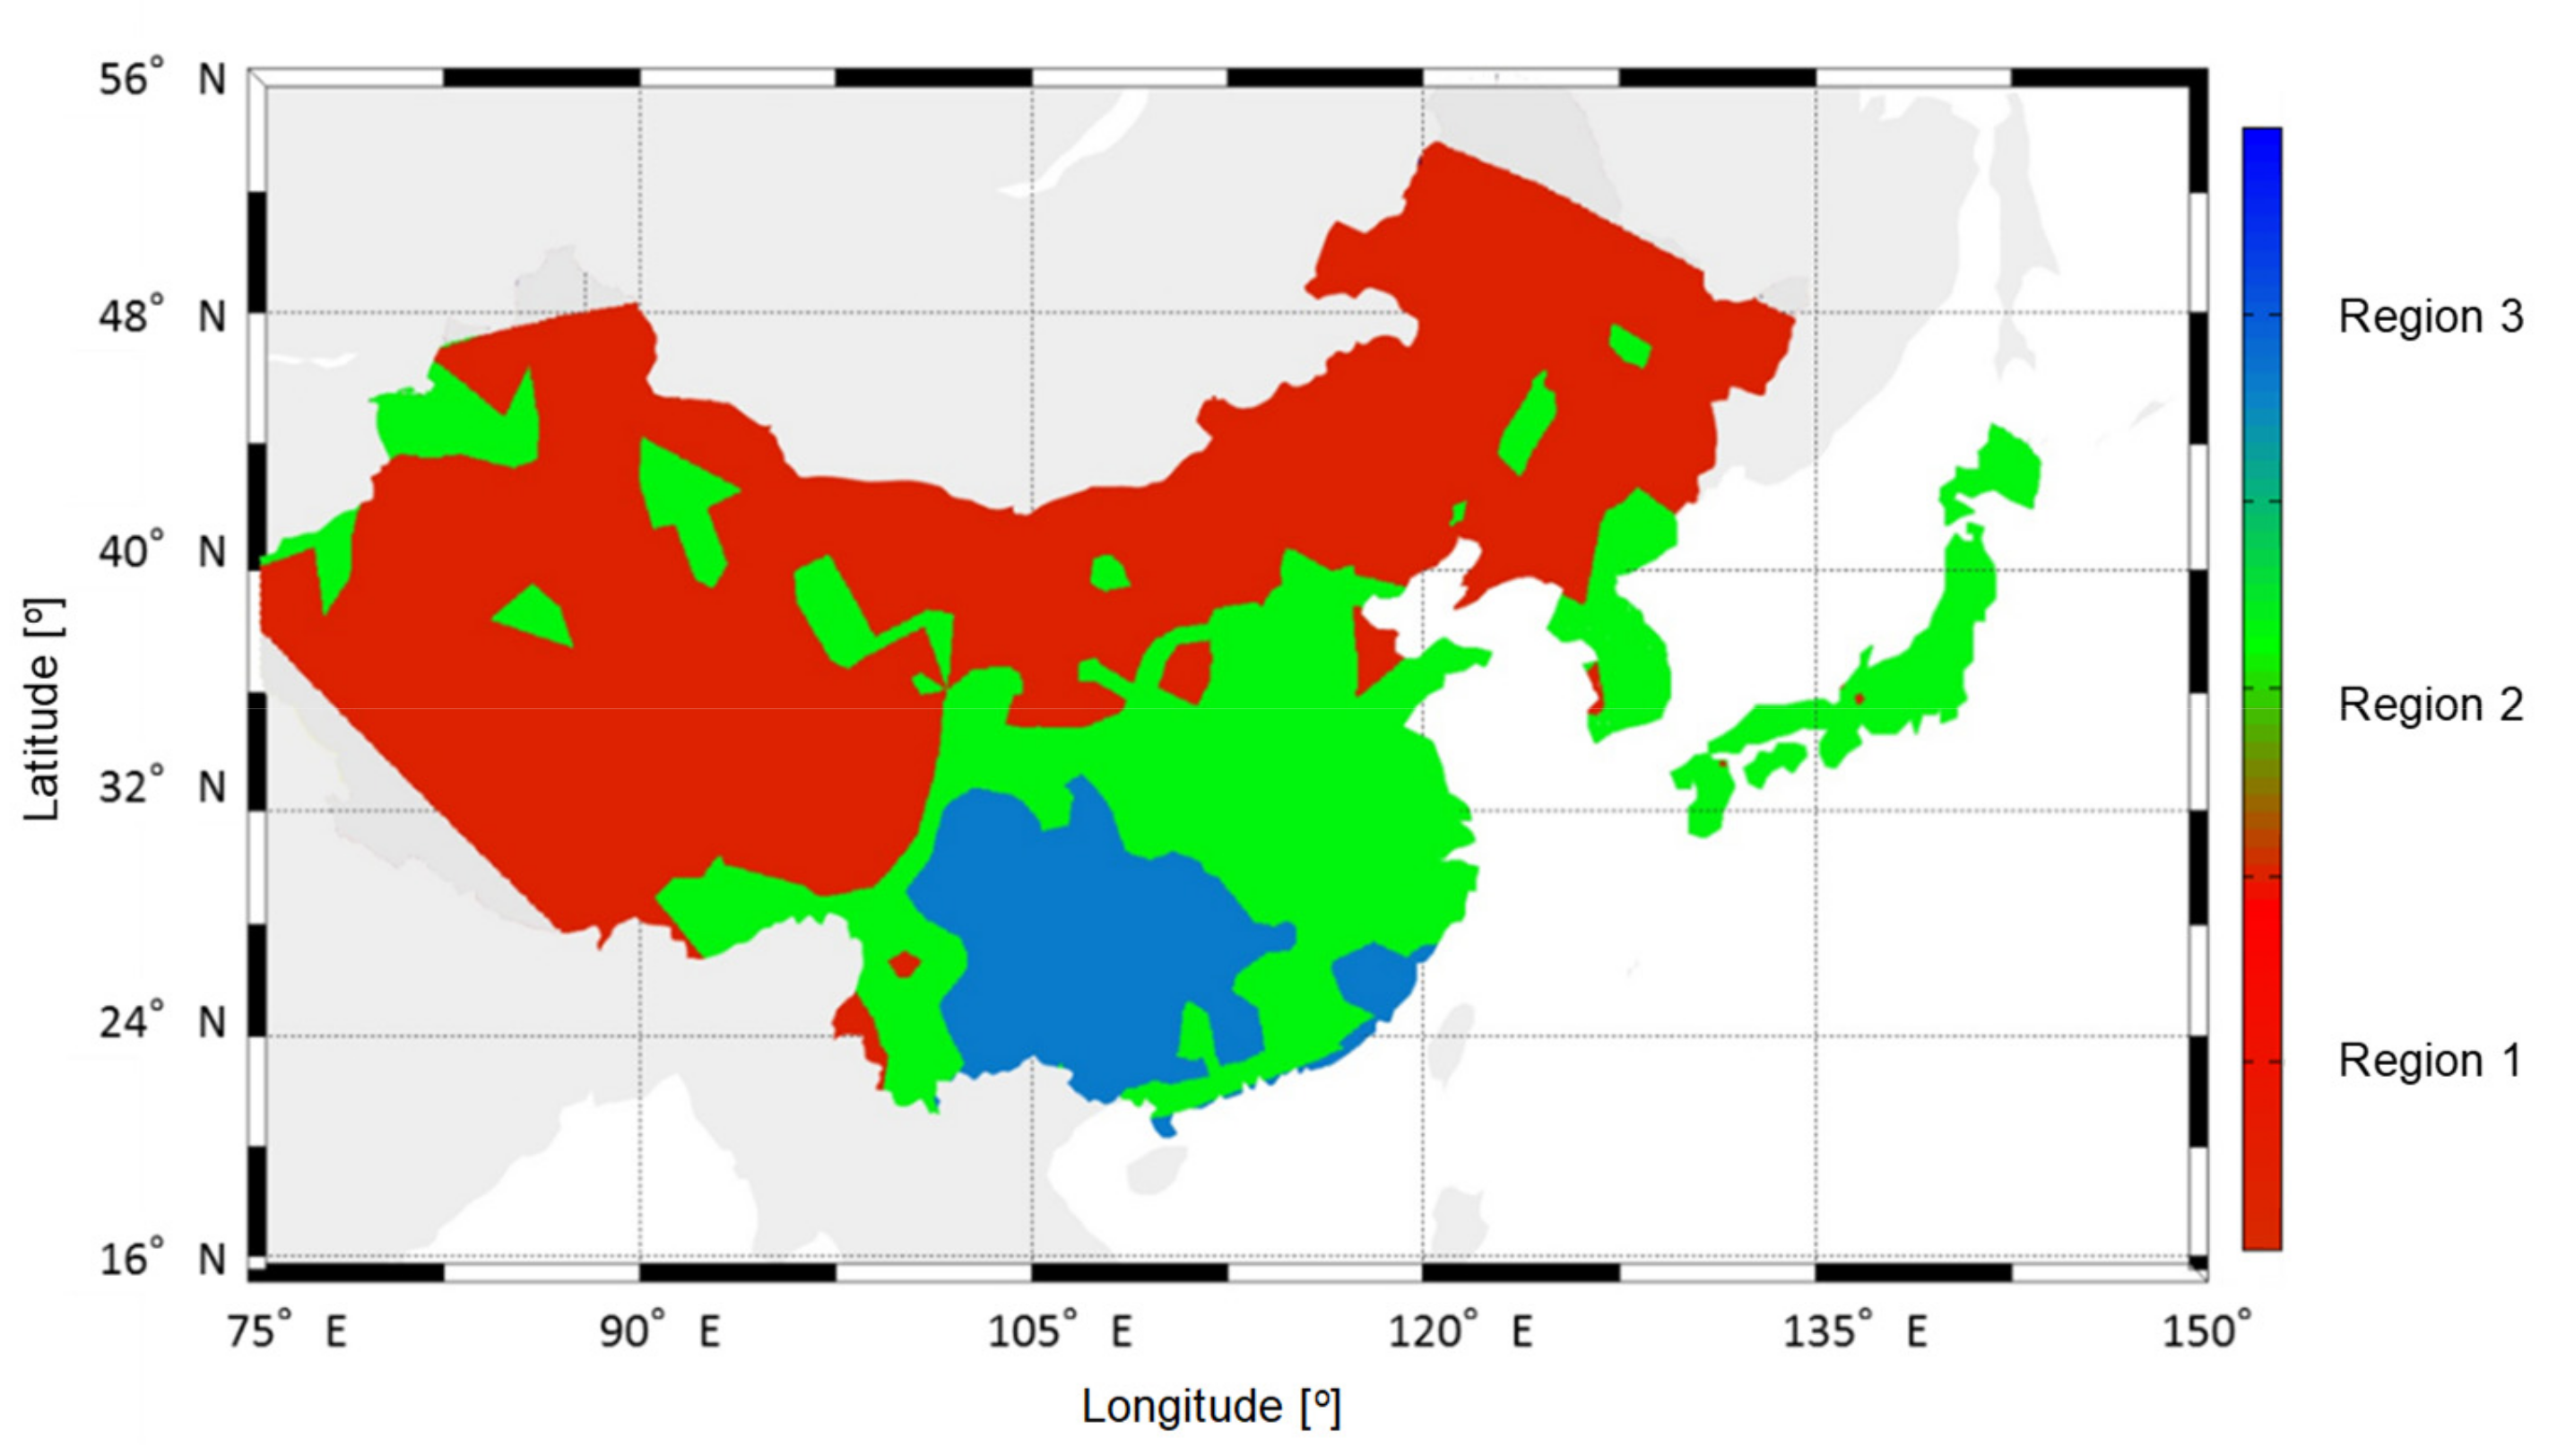
Figure 10.
Climate classification for solar thermal energy in East Asia (88 areas) (based on Table 14).
Figure 10.
Climate classification for solar thermal energy in East Asia (88 areas) (based on Table 14).
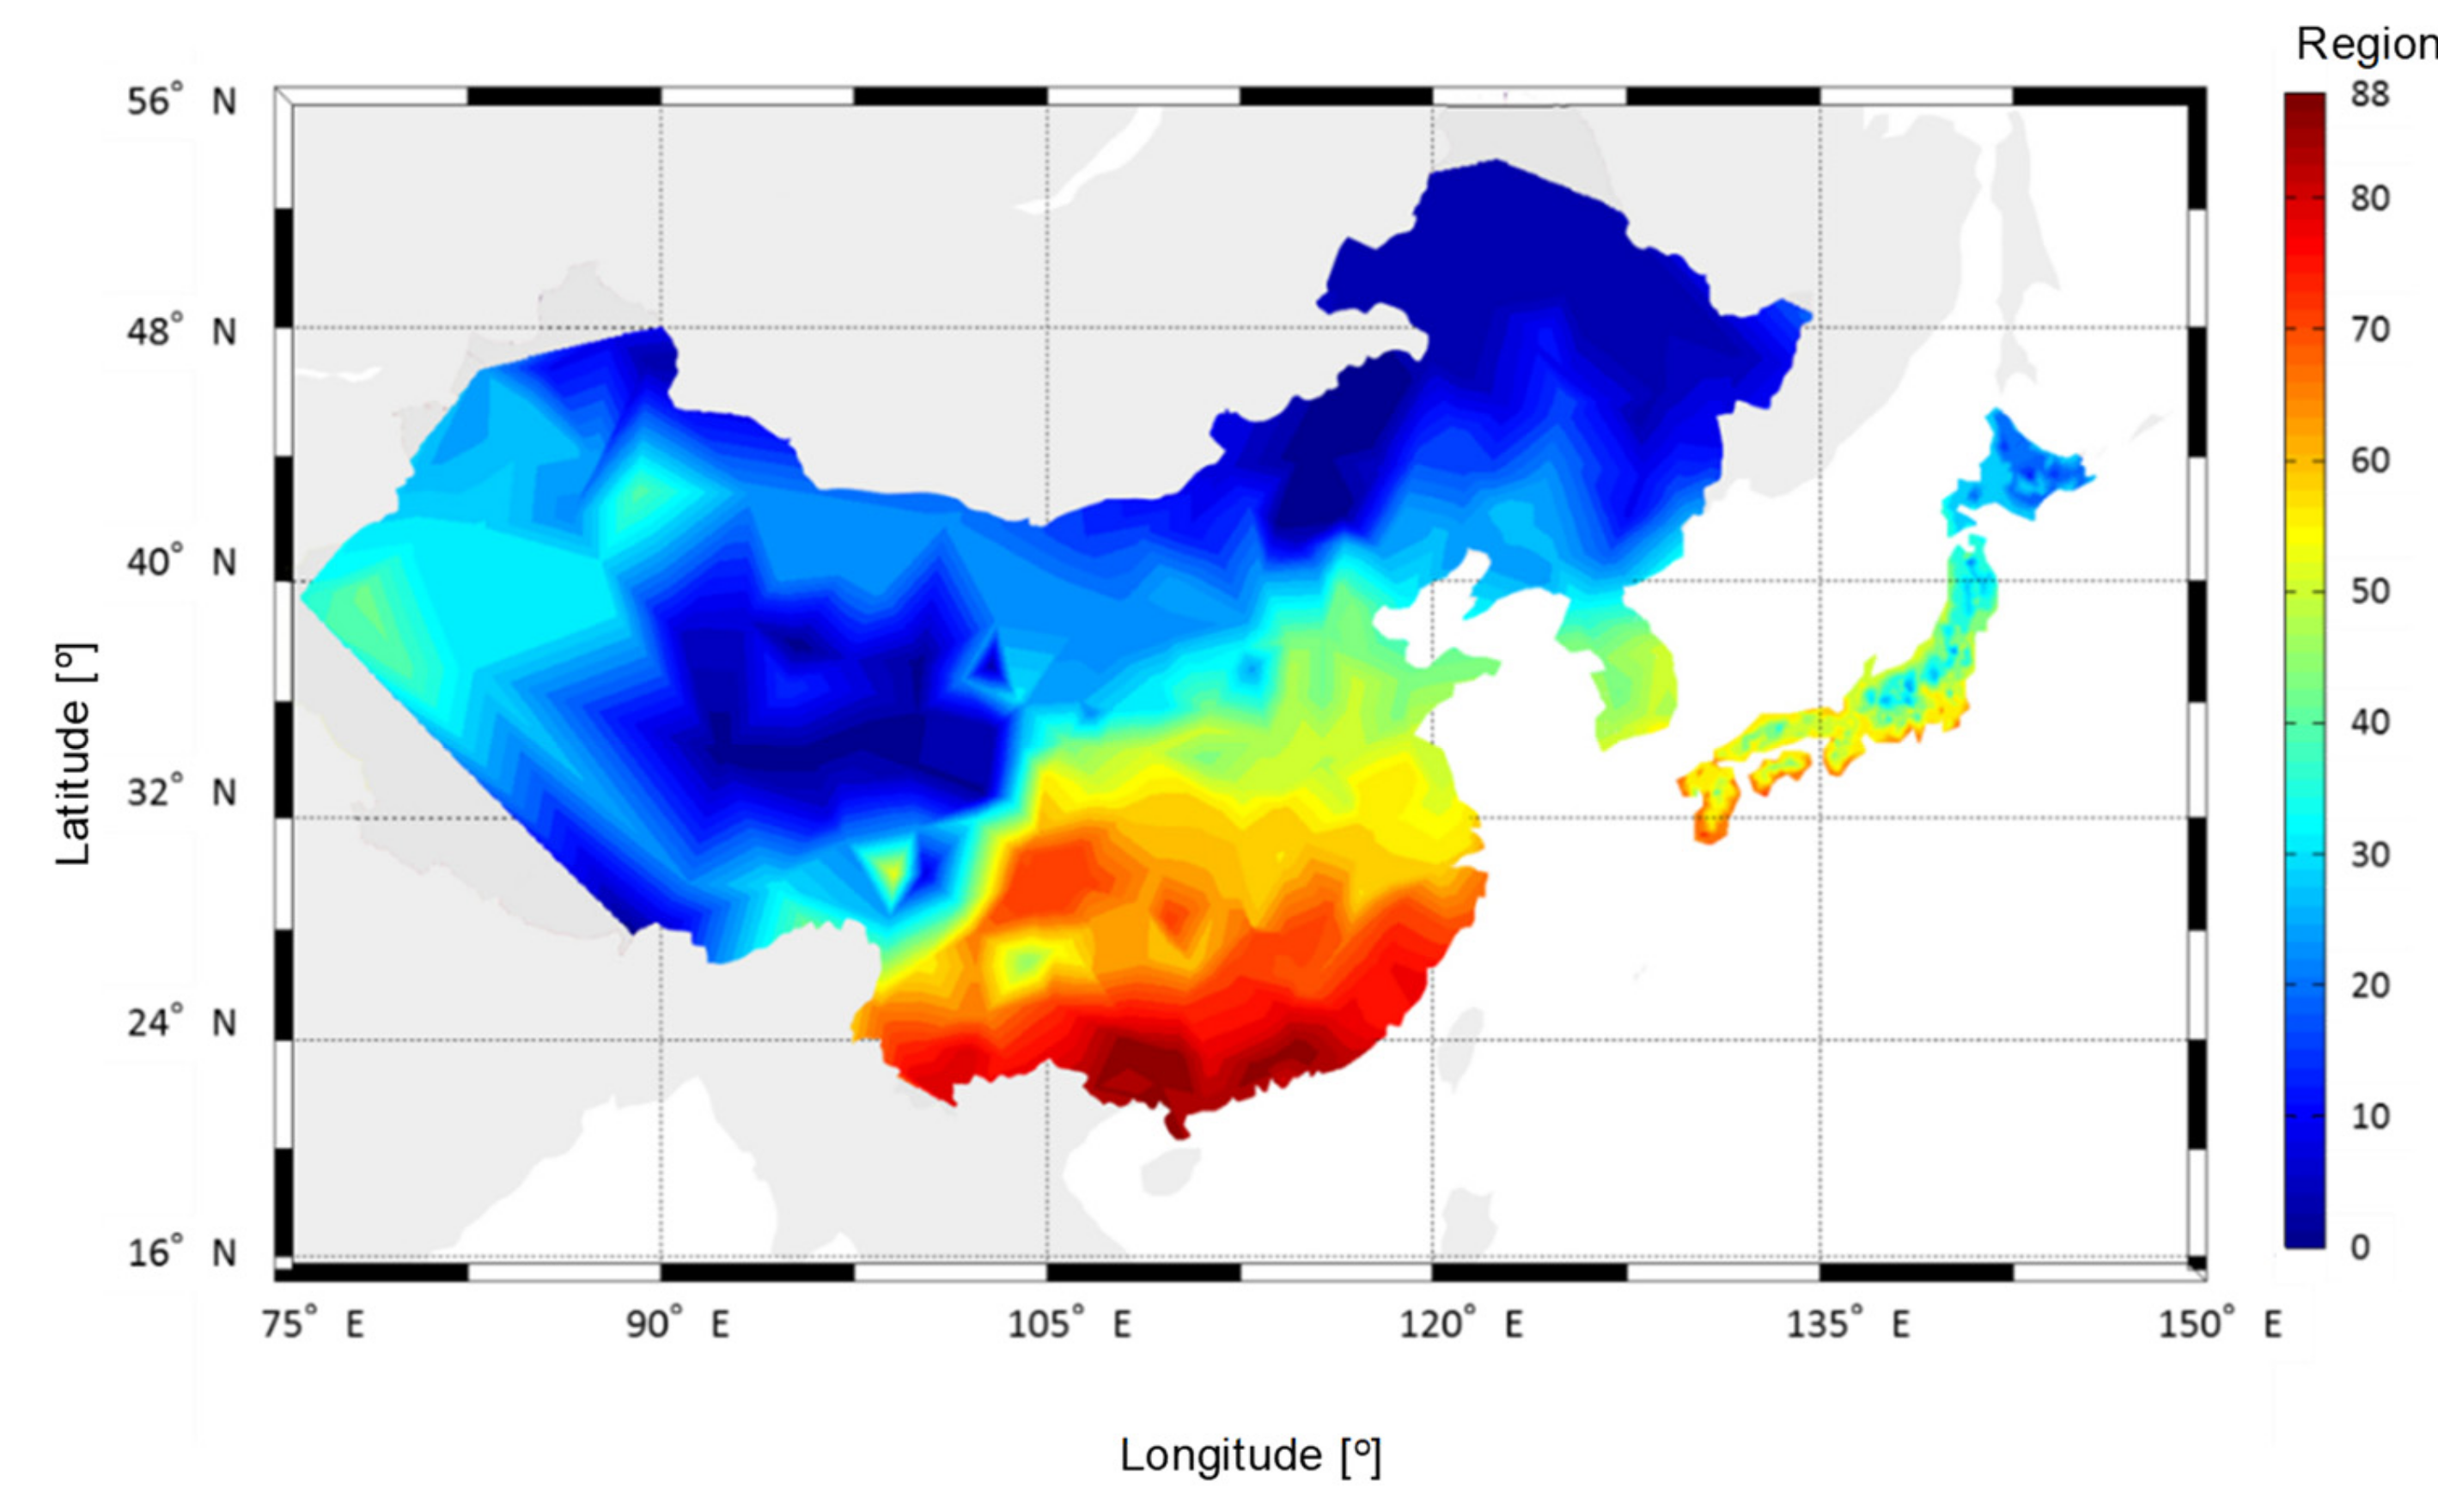
Figure 11.
Distance between the climate element and the average value of each region (example).

Table 1.
Simulation conditions.
| Weather data | Expanded AMeDAS data standard (2000), 842 points |
| Heating setpoint | 18 ℃ |
| Heating schedule | 07:00 to 10:00, 12:00 to 14:00, 16:00 to 23:00 |
| Inclination angle of collector | Latitude of each region |
| Calculation | Preliminary calculation: From 1 January to 30 April; Target period: 1 May to 30 April of the following year |
| Time step | 1 h |
| Usage of hot water | 450 L/day (40 °C for using hot water) |
| Internal heat gain | 13.26 (kWh)/d |
| Collector area Air volume | Preliminary collector: 14.10 m2, glass collector: 5.34 m2 Air volume: 240 m3/h |
Table 2.
Recording points of weather data by region/prefecture.
| Region | Recorded Points | |
|---|---|---|
| Hokkaido | Souya (11), Kamikawa (20), Rumoi (9), Ishikari (9), Sorachi (12), Shiribeshi (11), Abashiri (20), Nemuro (8), Kushiro (11), Tokachi (18), Iburi (11), Hidaka (8), Oshima (8), Hiyama (6) | 162 points |
| Tohoku | Aomori (22), Akita (24), Iwate (33), Miyagi (18), Yamagata (20), Fukushima (20) | 146 points |
| Kanto | Ibaraki (14), Tochigi (14), Gunma (13), Saitama (8), Tokyo (12), Chiba (14), Kanagawa (5) | 80 points |
| Chubu | Nagano (29), Yamanashi (10), Shizuoka (17), Aichi (11), Gifu (23), Niigata (27), Toyama (9), Ishikawa (10), Fukui (9) | 145 points |
| Kinki | Osaka (7), Hyogo (19), Nara (6), Wakayama (11), Mie (12), Shiga (8), Kyoto (8) | 71 points |
| Chugoku, Shikoku | Okayama (15), Hiroshima (18), Shimane (16), Tottori (9), Tokushima (8), Kagawa (6), Ehime (14), Kochi (15), Yamaguchi (15) | 116 points |
| Kyushu, Okinawa | Fukuoka (12), Oita (14), Nagasaki (14), Saga (5), Kumamoto (17), Miyazaki (16), Kagoshima (26), Okinawa (18) | 122 points |
| Total | 7 Regions/47 Prefectures | 842 points |
Table 3.
Climatic factors.
| Number | Climatic Factors | Reference Weather Data |
|---|---|---|
| 1 | Heating degree day (HDD18-18) | Outside temperature |
| 2 | Daily average outside temperature | |
| 3 | Daily average outside temperature during the heating period | |
| 4 | Daily maximum outside temperature | |
| 5 | Daily minimum outside temperature | |
| 6 | Daily temperature difference | |
| 7 | Daily solar direct normal irradiance | Solar radiation |
| 8 | Daily solar diffuse horizontal irradiance | |
| 9 | Daily solar global horizontal irradiance | |
| 10 | Solar-heat available days | |
| 11 | Average solar direct normal irradianceduring solar-heat available days | |
| 12 | Daylight hours |
Table 4.
Correlation between heating load of air-based solar heating system and climatic factors (12 items).
Table 4.
Correlation between heating load of air-based solar heating system and climatic factors (12 items).
| Regression Statistics | ||||||
| Multiple R | 0.98 | |||||
| R Square | 0.96 | |||||
| Adjusted R Square | 0.96 | |||||
| Standard Error | 0.31 | |||||
| Observations | 842 | |||||
| ANOVA | ||||||
| df | SS | MS | F | Significance F | ||
| Regression | 12 | 2142.7 | 178.56 | 1963.66 | 0 | |
| Residual | 830 | 82.33 | 0.1 | |||
| Total | 842 | 2225.03 | ||||
| Coefficients | Standard Error | t Stat | p-Value | Lower 95% | Upper95% | |
| Intercept | 6.632 | 0.864 | 7.675 | 0 | 4.936 | 8.329 |
| ① | 0.002 | 0 | 20.2 | 0 | 0.002 | 0.003 |
| ② | −0.174 | 0.042 | −4.123 | 0 | −0.256 | −0.091 |
| ③ | 0.329 | 0.066 | 4.984 | 0 | 0.2 | 0.459 |
| ④ | 0.17 | 0.071 | 2.401 | 0.017 | 0.031 | 0.308 |
| ⑤ | 0 | 0 | 65535 | #NUM! | 0 | 0 |
| ⑥ | −0.214 | 0.038 | −5.670 | #NUM! | −0.289 | −0.140 |
| ⑦ | 0.001 | 0 | 2.389 | 0.017 | 0 | 0.001 |
| ⑧ | 0 | 0.001 | −0.780 | 0.436 | −0.001 | 0.001 |
| ⑨ | −0.001 | 0 | −2.221 | 0.027 | −0.001 | 0 |
| ⑩ | −0.025 | 0.001 | −19.041 | 0 | −0.028 | −0.023 |
| ⑪ | −0.001 | 0 | −8.041 | 0 | −0.001 | 0 |
| ⑫ | 0.096 | 0.086 | 1.112 | 0.267 | −0.074 | 0.266 |
p-value is #NUM! (There is no correlation or high correlation with other factors); p-value is high (low correlation); Standard error is relatively large.
Table 5.
Correlation analysis between elements (five items).
| Row 1 | Row 2 | Row 3 | Row 4 | Row 5 | |
|---|---|---|---|---|---|
| Column 1 | 1.000 | ||||
| Column 2 | −0.353 | 1.000 | |||
| Column 3 | −0.331 | 0.947 | 1.000 | ||
| Column 4 | 0.640 | 0.385 | 0.406 | 1.000 | |
| Column 5 | −0.370 | 0.846 | 0.763 | 0.126 | 1.000 |
Table 6.
Correlation between heating load of air-based solar heating system and climatic factors (five items).
Table 6.
Correlation between heating load of air-based solar heating system and climatic factors (five items).
| Regression Statistics | ||||||
| Multiple R | 0.95 | |||||
| R Square | 0.9 | |||||
| Adjusted R Square | 0.9 | |||||
| Standard Error | 0.51 | |||||
| Observations | 842 | |||||
| ANOVA | ||||||
| df | SS | MS | F | Significance F | ||
| Regression | 5 | 2008.76 | 401.75 | 1552.96 | 0 | |
| Residual | 836 | 216.27 | 0.26 | |||
| Total | 841 | 2225.03 | ||||
| Coefficients | Standard Error | t Stat | p-Value | Lower 95% | Upper 95% | |
| Intercept | 8.453 | 0.407 | 20.765 | 0 | 7.654 | 9.252 |
| ① | 0.002 | 0 | 33.59 | 0 | 0.001 | 0.002 |
| ⑦ | 0 | 0 | 1.814 | 0.07 | 0 | 0 |
| ⑨ | −0.001 | 0 | −4.388 | 0 | −0.001 | 0 |
| ⑩ | −0.019 | 0.002 | −11.969 | 0 | −0.022 | −0.016 |
| ⑪ | 0 | 0 | −2.451 | 0.014 | 0 | 0 |
p-value is high (low correlation).
Table 7.
Correlation between heating load of air-based solar heating system and climatic factors (three items).
Table 7.
Correlation between heating load of air-based solar heating system and climatic factors (three items).
| Regression Statistics | |||||||
| Multiple R | 0.95 | ||||||
| R Square | 0.90 | ||||||
| Adjusted R Square | 0.90 | ||||||
| Standard Error | 0.51 | ||||||
| Observations | 842 | ||||||
| ANOVA | |||||||
| df | SS | MS | F | Significance F | |||
| Regression | 3 | 2007.20 | 669.07 | 2573.96 | 0 | ||
| Residual | 838 | 217.83 | 0.26 | ||||
| Total | 841 | 2225.03 | |||||
| Coefficients | Standard Error | t Stat | p-Value | Lower 95% | Upper 95% | ||
| Intercept | 7.923 | 0.276 | 28.709 | 0.000 | 7.381 | 8.464 | |
| ① | 0.002 | 0.000 | 39.965 | 0.000 | 0.001 | 0.002 | |
| ⑨ | −0.001 | 0.000 | −6.858 | 0.000 | −0.001 | −0.001 | |
| ⑩ | −0.017 | 0.001 | −13.793 | 0.000 | −0.019 | −0.014 | |
Table 8.
Japanese heating degree day (HDD18-18) classification.
| Region Classification According to 1999 Standard | Region Classification According to 2013 Standard | Heating Degree Day (HDD18-18) |
|---|---|---|
| Region I | Region 1 | 4500 ≦ HDD |
| Region 2 | 3500 ≦ HDD < 4500 | |
| Region II | Region 3 | 3000 ≦ HDD < 3500 |
| Region III | Region 4 | 2500 ≦ HDD < 3800 |
| Region IV | Region 5 | 2000 ≦ HDD < 2500 |
| Region 6 | 1500 ≦ HDD < 2000 | |
| Region V | Region 7 | 500 ≦ HDD < 1500 |
| Region VI | Region 8 | HDD < 500 |
Table 9.
Chinese heating degree day (HDD18-18) classification (Huang and Deringer, 2007).
| Heating Degree Day (HDD18-18) | |
|---|---|
| Severe cold A | 5500 ≦ HDD < 8000 |
| Severe cold B | 5000 ≦ HDD < 5500 |
| Severe cold C | 3800 ≦ HDD < 5000 |
| Cold A | 2000 ≦ HDD < 3800 |
| Cold B | |
| Hot summer and cold winter (HSCW) A | 1000 ≦ HDD < 2000 |
| Hot summer and cold winter (HSCW) B | |
| Hot summer and cold winter (HSCW) C | 600 ≦ HDD < 1000 |
Table 10.
Heating degree day (HDD 18-18) classification of East Asia.
| Region Classification | Heating Degree Day (HDD18-18) |
|---|---|
| Region 1 | 5500 ≦ HDD |
| Region 2 | 5000 ≦ HDD < 5500 |
| Region 3 | 4500 ≦ HDD < 5000 |
| Region 4 | 3500 ≦ HDD < 4500 |
| Region 5 | 3000 ≦ HDD < 3500 |
| Region 6 | 2500 ≦ HDD < 3000 |
| Region 7 | 2000 ≦ HDD < 2500 |
| Region 8 | 1500 ≦ HDD < 2000 |
| Region 9 | 1000 ≦ HDD < 1500 |
| Region 10 | 500 ≦ HDD < 1000 |
| Region 11 | HDD < 500 |
Table 11.
Japanese solar global horizontal irradiance classification of each region.
| Region Classification | A1 | A2 | A3 | A4 | A5 |
|---|---|---|---|---|---|
| Range [-] | ˂0.85 | 0.85 to 0.95 | 0.95 to 1.05 | 1.05 to 1.15 | 1.15≥ |
| Solar irradiance [MJ/m2] | ˂3787.6 | 3787.6 to 4233.2 | 4233.2 to 4678.8 | 4678.8 to 5124.4 | 5124.4≥ |
| Solar irradiance [kWh/m2] | ˂1052.1 | 1052.1 to 1175.9 | 1175.9 to 1299.7 | 1299.7 to 1423.4 | 1423.4≥ |
Table 12.
Solar global horizontal irradiance classification in East Asia.
| Region Classification | Yearly Solar Global Horizontal Irradiance [kWh/m2] |
|---|---|
| Region 1 | ≥1750 |
| Region 2 | 1400 to 1750 |
| Region 3 | 1300 to 1400 |
| Region 4 | 1176 to 1300 |
| Region 5 | 1050 to 1176 |
| Region 6 | ˂1050 |
Table 13.
Region classification of solar-heat available days.
| Region Classification | Solar-Heat Available Days [%] |
|---|---|
| Region 1 | ≥80% |
| Region 2 | 40 to 80% |
| Region 3 | ≤40% |
Table 14.
Climate division area and map number.
| Climate Region | Map Number | Climate Region | Map Number | Climate Region | Map Number | Climate Region | Map Number | Climate Region | Map Number | ||
| 121 | 1 | 211 | 7 | 321 | 16 | 411 | 22 | 521 | 31 | ||
| 122 | 2 | 221 | 8 | 331 | 17 | 421 | 23 | 522 | 32 | ||
| 131 | 3 | 231 | 9 | 341 | 18 | 422 | 24 | 532 | 33 | ||
| 141 | 4 | 232 | 10 | 342 | 19 | 431 | 25 | 541 | 34 | ||
| 151 | 5 | 241 | 11 | 352 | 20 | 432 | 26 | 542 | 35 | ||
| 152 | 6 | 242 | 12 | 362 | 21 | 441 | 27 | 552 | 36 | ||
| 251 | 13 | 442 | 28 | 562 | 37 | ||||||
| 252 | 14 | 452 | 29 | 563 | 38 | ||||||
| 262 | 15 | 462 | 30 | ||||||||
| Climate Region | Map Number | Climate Region | Map Number | Climate Region | Map Number | Climate Region | Map Number | Climate Region | Map Number | Climate Region | Map Number |
| 611 | 39 | 721 | 47 | 821 | 55 | 921 | 64 | 1021 | 74 | 1121 | 80 |
| 621 | 40 | 722 | 48 | 822 | 56 | 922 | 65 | 1022 | 75 | 1122 | 81 |
| 622 | 41 | 732 | 49 | 832 | 57 | 931 | 66 | 1032 | 76 | 1123 | 82 |
| 631 | 42 | 741 | 50 | 842 | 58 | 932 | 67 | 1042 | 77 | 1132 | 83 |
| 632 | 43 | 742 | 51 | 843 | 59 | 933 | 68 | 1052 | 78 | 1133 | 84 |
| 642 | 44 | 752 | 52 | 852 | 60 | 942 | 69 | 1053 | 79 | 1142 | 85 |
| 652 | 45 | 753 | 53 | 853 | 61 | 943 | 70 | 1143 | 86 | ||
| 662 | 46 | 763 | 54 | 862 | 62 | 952 | 71 | 1152 | 87 | ||
| 863 | 63 | 953 | 72 | 1153 | 88 | ||||||
| 963 | 73 | ||||||||||
Table 15.
Example of selecting representative points for each climate.
| Heating Degree Day | Daily Solar Global Horizontal Irradiance | Solar-Heat Available Days | A | B | C | Distance from Average Value (Dt) | |
|---|---|---|---|---|---|---|---|
| Attoko | 4543.1 | 1158.1 | 65.6 | 0.98 | 1.03 | 1.02 | 0.038 |
| Kawayu | 4920.4 | 1043.3 | 58.1 | 1.07 | 0.93 | 0.90 | 0.139 |
| Teshikaga | 4760.5 | 1084.9 | 62.8 | 1.03 | 0.97 | 0.97 | 0.053 |
| Akankohan | 5175.3 | 962.7 | 49.7 | 1.12 | 0.86 | 0.77 | 0.296 |
| Shibecha | 4670.9 | 1103.0 | 62.9 | 1.01 | 0.98 | 0.98 | 0.033 |
| Tsurui | 4533.9 | 1147.8 | 64.4 | 0.98 | 1.02 | 1.00 | 0.028 |
| Nakateshibetsu (representative point) | 4664.2 | 1123.7 | 65.2 | 1.01 | 1.00 | 1.01 | 0.014 |
| Sakakimachi | 4563.0 | 1162.7 | 65.6 | 0.99 | 1.03 | 1.02 | 0.040 |
| Ota | 4488.7 | 1137.6 | 64.9 | 0.97 | 1.01 | 1.01 | 0.031 |
| Shiranuka | 4583.4 | 1176.3 | 69.1 | 0.99 | 1.05 | 1.07 | 0.085 |
| Kitamiesashi | 4448.8 | 1153.9 | 72.0 | 0.96 | 1.03 | 1.12 | 0.125 |
| Kushiro | 4264.2 | 1207.5 | 70.5 | 0.92 | 1.07 | 1.09 | 0.141 |
| Chipomanai | 4437.5 | 1153.0 | 67.8 | 0.96 | 1.03 | 1.05 | 0.069 |
| Average | 4619.5 | 1124.2 | 64.5 |
Table 16.
Representative points in the 88 regions of solar thermal climate in East Asia.
| Representative Point | Representative Point | Representative Point | |||
|---|---|---|---|---|---|
| 1 | CHN_Nei.Mongol.Abag.Qi.Hot | 31 | CHN_Shaanxi.Luochuan | 61 | CHN_Hunan.Nanxian |
| 2 | CHN_Qinghai.Gangca | 32 | CHN_Xinjiang.Uygur.Ruoqiang | 62 | CHN_Hubei.Yichang |
| 3 | CHN_Gansu.Wushaoling | 33 | CHN_Gansu.Lanzhou | 63 | CHN_Guizhou.Guiyang |
| 4 | CHN_Nei.Mongol.Manzhouli | 34 | CHN_Sichuan.Barkam | 64 | CHN_Sichuan.Huili |
| 5 | CHN_Heilongjiang.Huma | 35 | JPN_Ikari | 65 | JPN_Shimabara |
| 6 | CHN_Heilongjiang.Jiamusi | 36 | JPN_Oma | 66 | JPN_Kochi |
| 7 | CHN_Qinghai.Mangnai | 37 | JPN_Kumaishi | 67 | JPN_Shibushi |
| 8 | CHN_Qinghai.Yushu | 38 | JPN_Yuze | 68 | CHN_Hunan.Changsha |
| 9 | CHN_Heilongjiang.Harbin | 39 | CHN_Kinjiang.Uyhur.Hotan | 69 | JPN_Kamigoto |
| 10 | CHN_Sichuan.Litang | 40 | CHN_Xinjiang.Uygur.Shache | 70 | CHN_Chongqing.Shapingba |
| 11 | CHN_Heilongjiang.Suifenhe | 41 | JPN_Iijima | 71 | CHN_Jiangxi.Nanchang |
| 12 | CHN_Xinjiang.Uygur.Altay | 42 | CHN_Beijing.Beijing | 72 | CHN_Guizhou.Xingyi |
| 13 | CHN_Heilongjiang.Fuyu | 43 | JPN_Ikawa | 73 | CHN_Sichuan.Leshan |
| 14 | JPN_Nukabira | 44 | JPN_Yamagata | 74 | CHN_Yunnan.Lincang |
| 15 | JPN_Akankohan | 45 | JPN_Akana | 75 | JPN_Ashizuri |
| 16 | CHN_Nei.Mongol.Tongliao | 46 | JPN_Oguni | 76 | CHN_Fujian.Congwu |
| 17 | CHN_Nei.Mongol.Kailu | 47 | JPN_Katsunuma | 77 | CHN_Fujian.Yongan |
| 18 | CHN_Nei.Mongol.Tongliao | 48 | KOR_Kwangju | 78 | CHN_Fujian.Shanghang |
| 19 | JPN_Sarabetsu | 49 | JPN_Kito | 79 | CHN_Fujian.Fuzhou |
| 20 | JPN_Shibecha | 50 | KOR_Daegu | 80 | CHN_Yunnan.Lancang |
| 21 | JPN_Utanobori | 51 | JPN_Niigata | 81 | JPN_Kin |
| 22 | CHN_Tibet.Lhasa | 52 | JPN_Hamochi | 82 | JPN_Miyakojima |
| 23 | CHN_Tibet.Qamdo | 53 | JPN_Awashima | 83 | JPN_Isen |
| 24 | CHN_Gansu.Minqin | 54 | CHN_Guizhou.Bijie | 84 | JPN_Iriomotejima |
| 25 | CHN_Hebei.Chengde | 55 | CHN_Sichuan.Batang | 85 | JPN_Itokazu |
| 26 | CHN_Xinjiang.Uygur.Tacheng | 56 | JPN_Bungotakata | 86 | CHN_Guangxi.Zhuang.Longzhou |
| 27 | CHN_Hebei.Fengning | 57 | JPN_Kikuchi | 87 | CHN_Guangdong.Guangzhou |
| 28 | JPN_Kushiro | 58 | JPN_Saita | 88 | CHN_Guangxi.Zhuang.Duan |
| 29 | JPN_Shinshinotsu | 59 | CHN_Guizhou.Guiyang | ||
| 30 | JPN_Kutsugata | 60 | CHN_Hubei.Zhongxiang | ||
© 2019 by the authors. Licensee MDPI, Basel, Switzerland. This article is an open access article distributed under the terms and conditions of the Creative Commons Attribution (CC BY) license (http://creativecommons.org/licenses/by/4.0/).
Share and Cite
MDPI and ACS Style
Choi, Y.; Kim, H.B. Climate Classification for the Use of Solar Thermal Systems in East Asia. Energies 2019, 12, 2286. https://doi.org/10.3390/en12122286
AMA Style
Choi Y, Kim HB. Climate Classification for the Use of Solar Thermal Systems in East Asia. Energies. 2019; 12(12):2286. https://doi.org/10.3390/en12122286
Chicago/Turabian StyleChoi, Youngjin, and Hyun Bae Kim. 2019. "Climate Classification for the Use of Solar Thermal Systems in East Asia" Energies 12, no. 12: 2286. https://doi.org/10.3390/en12122286
Note that from the first issue of 2016, this journal uses article numbers instead of page numbers. See further details here.