Climate Classification for the Use of Solar Thermal Systems in East Asia


Abstract
:1. Introduction
2. Weather Factor Analysis Affecting the Heating Load
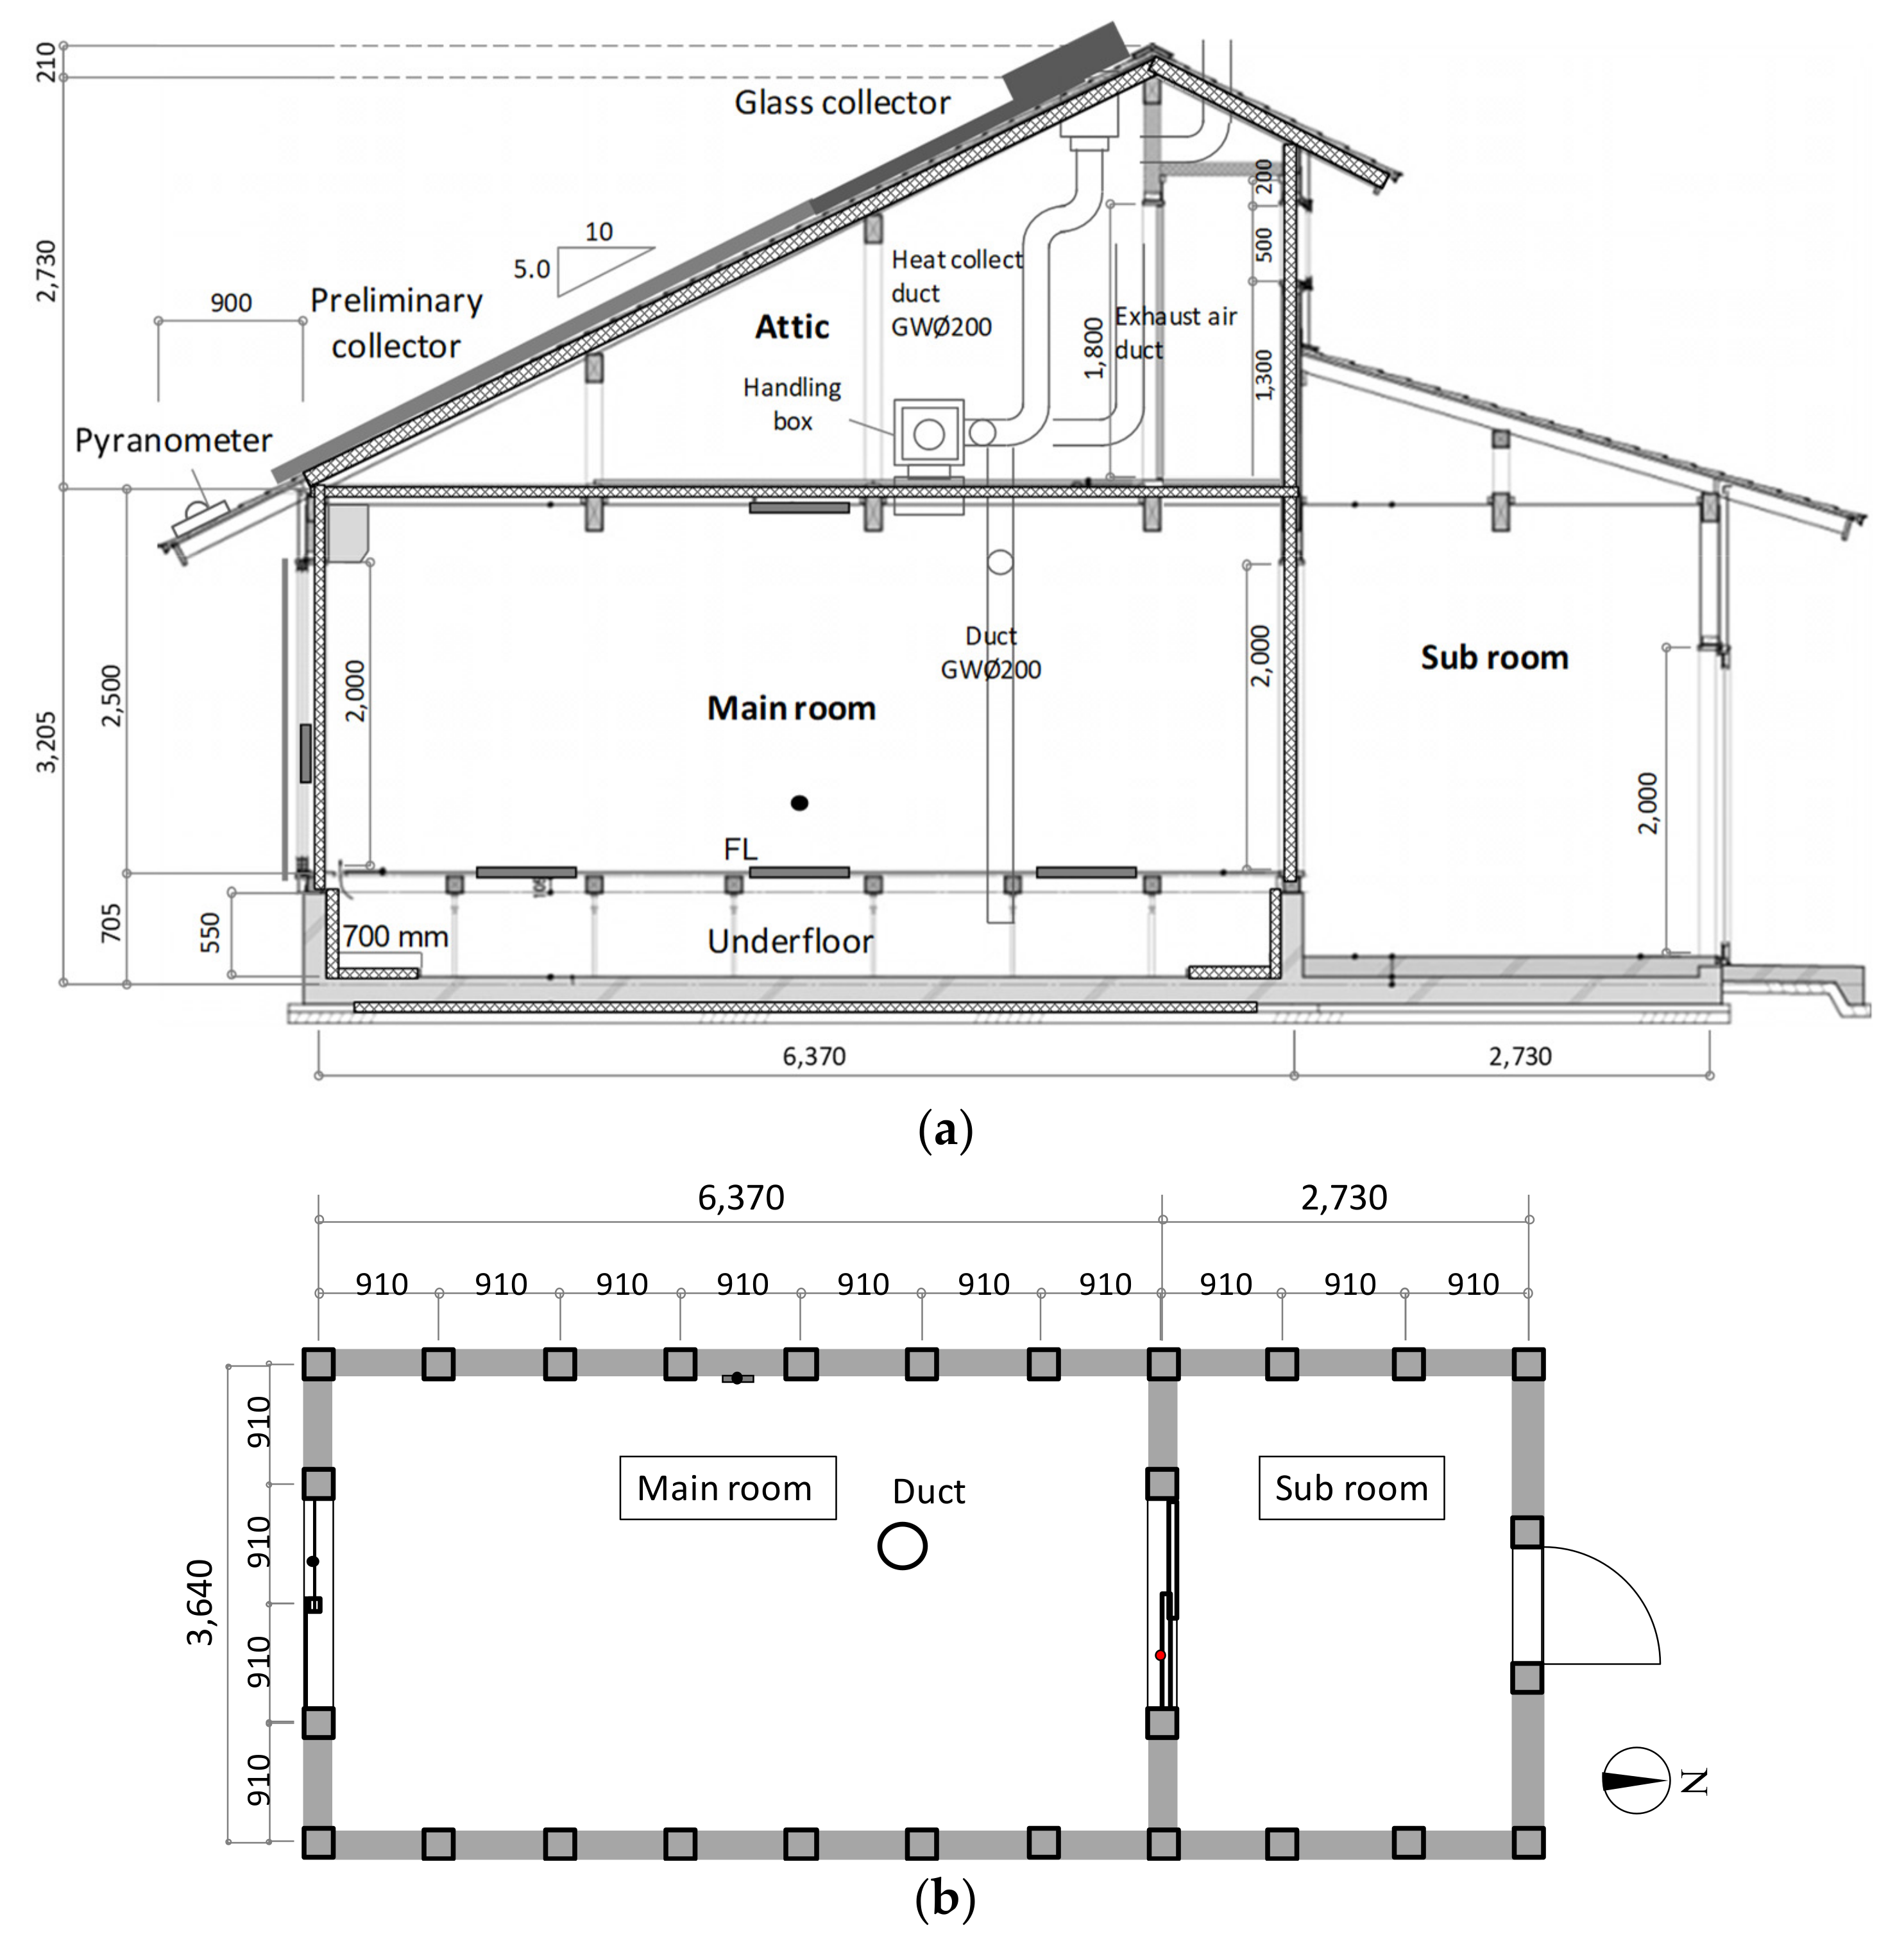
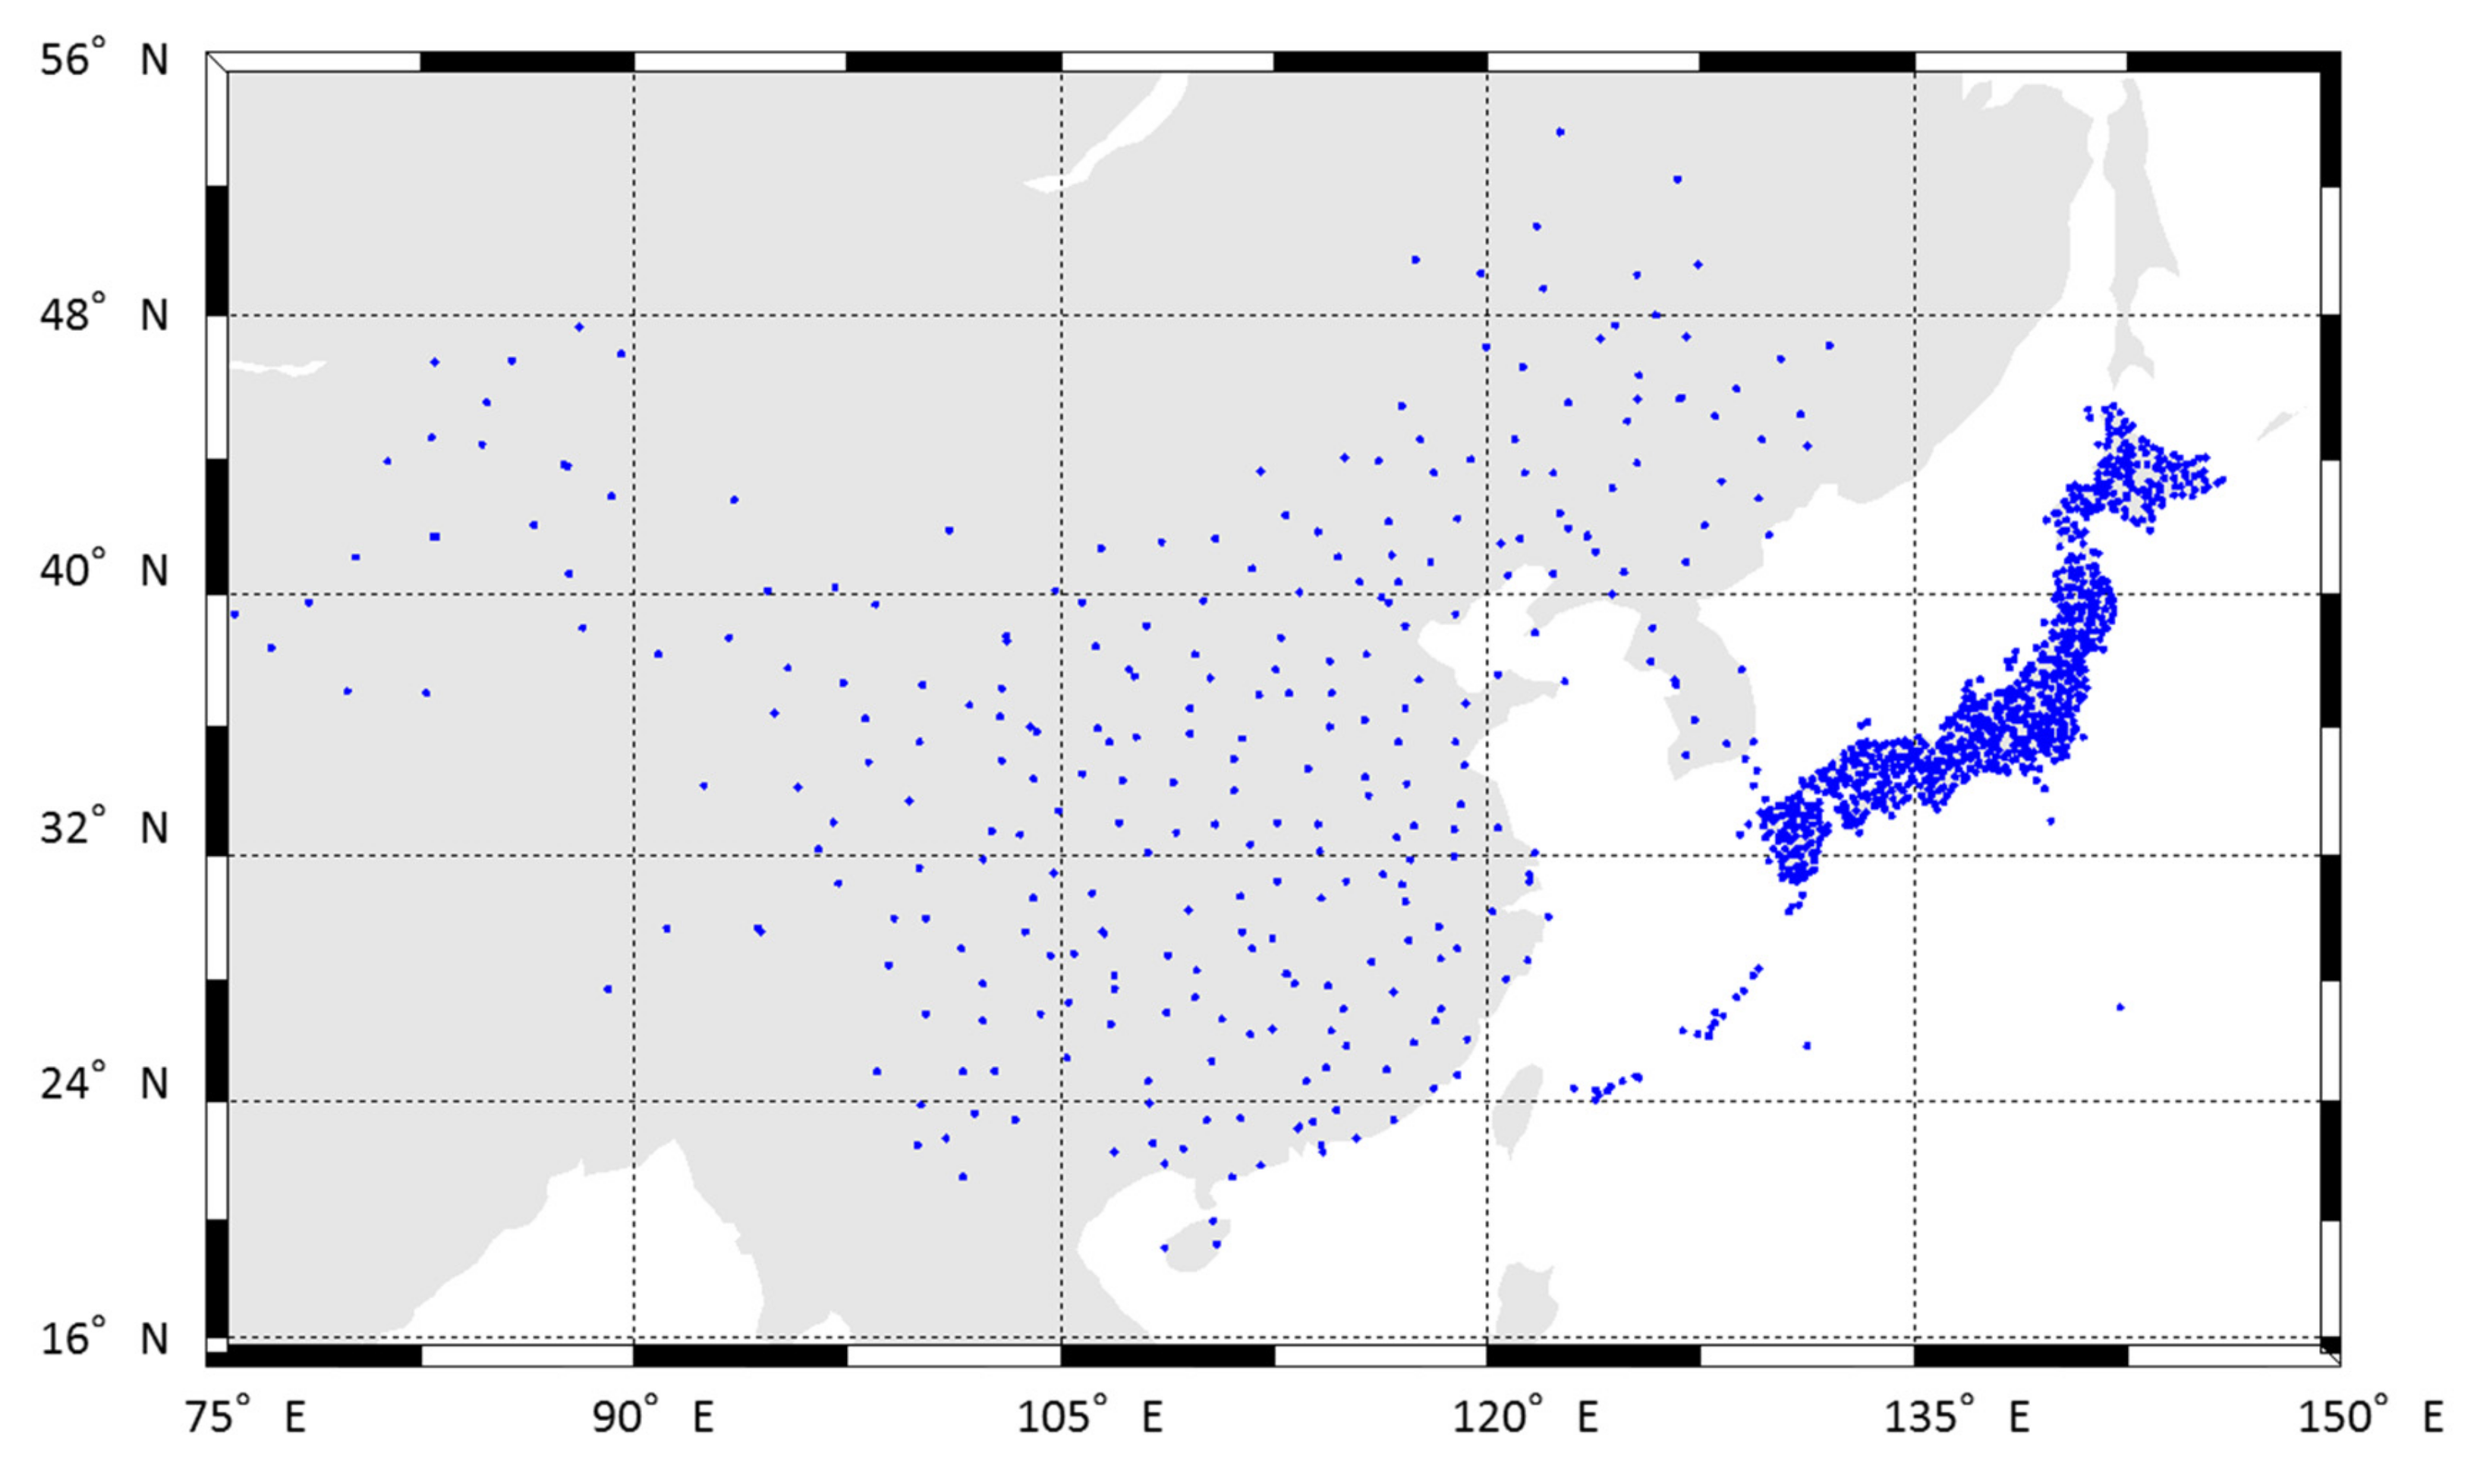
2.1. Simulation Condition
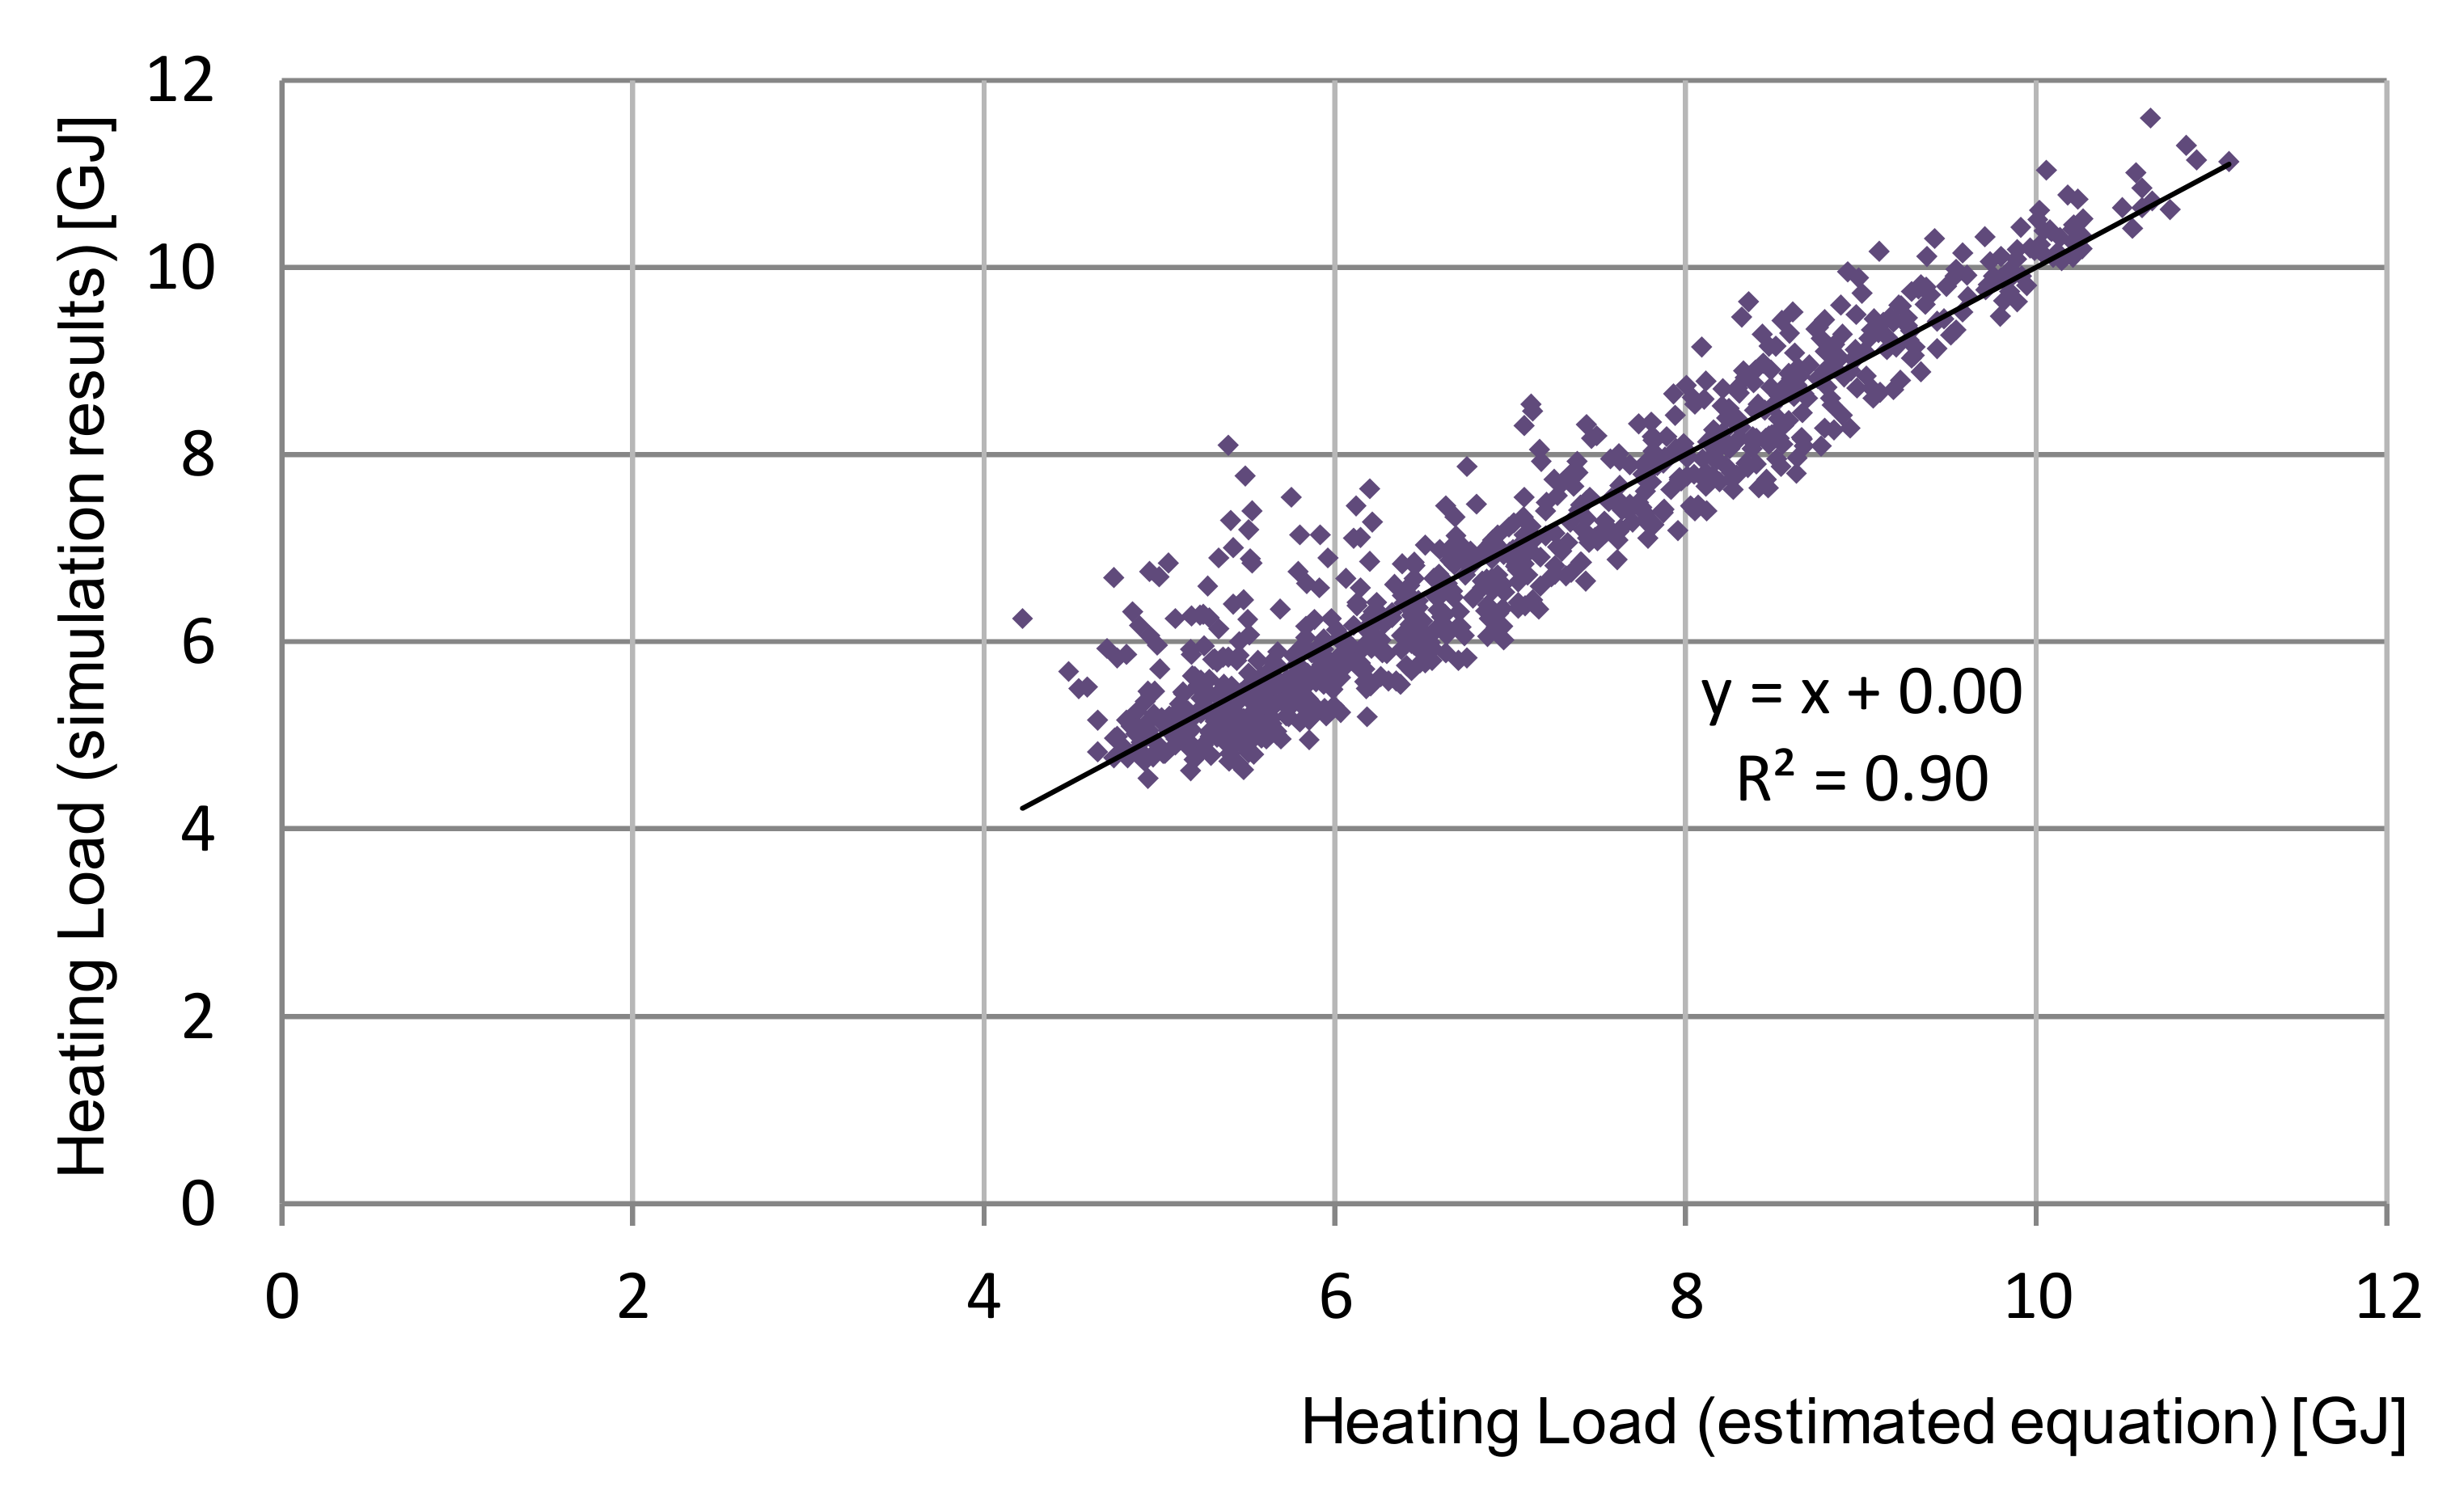
2.2. Correlation between a Load of the Solar Thermal Utilization System and Climatic Factors
3. Climate Classification for Solar Thermal Utilization in East Asia
3.1. Climate Classification
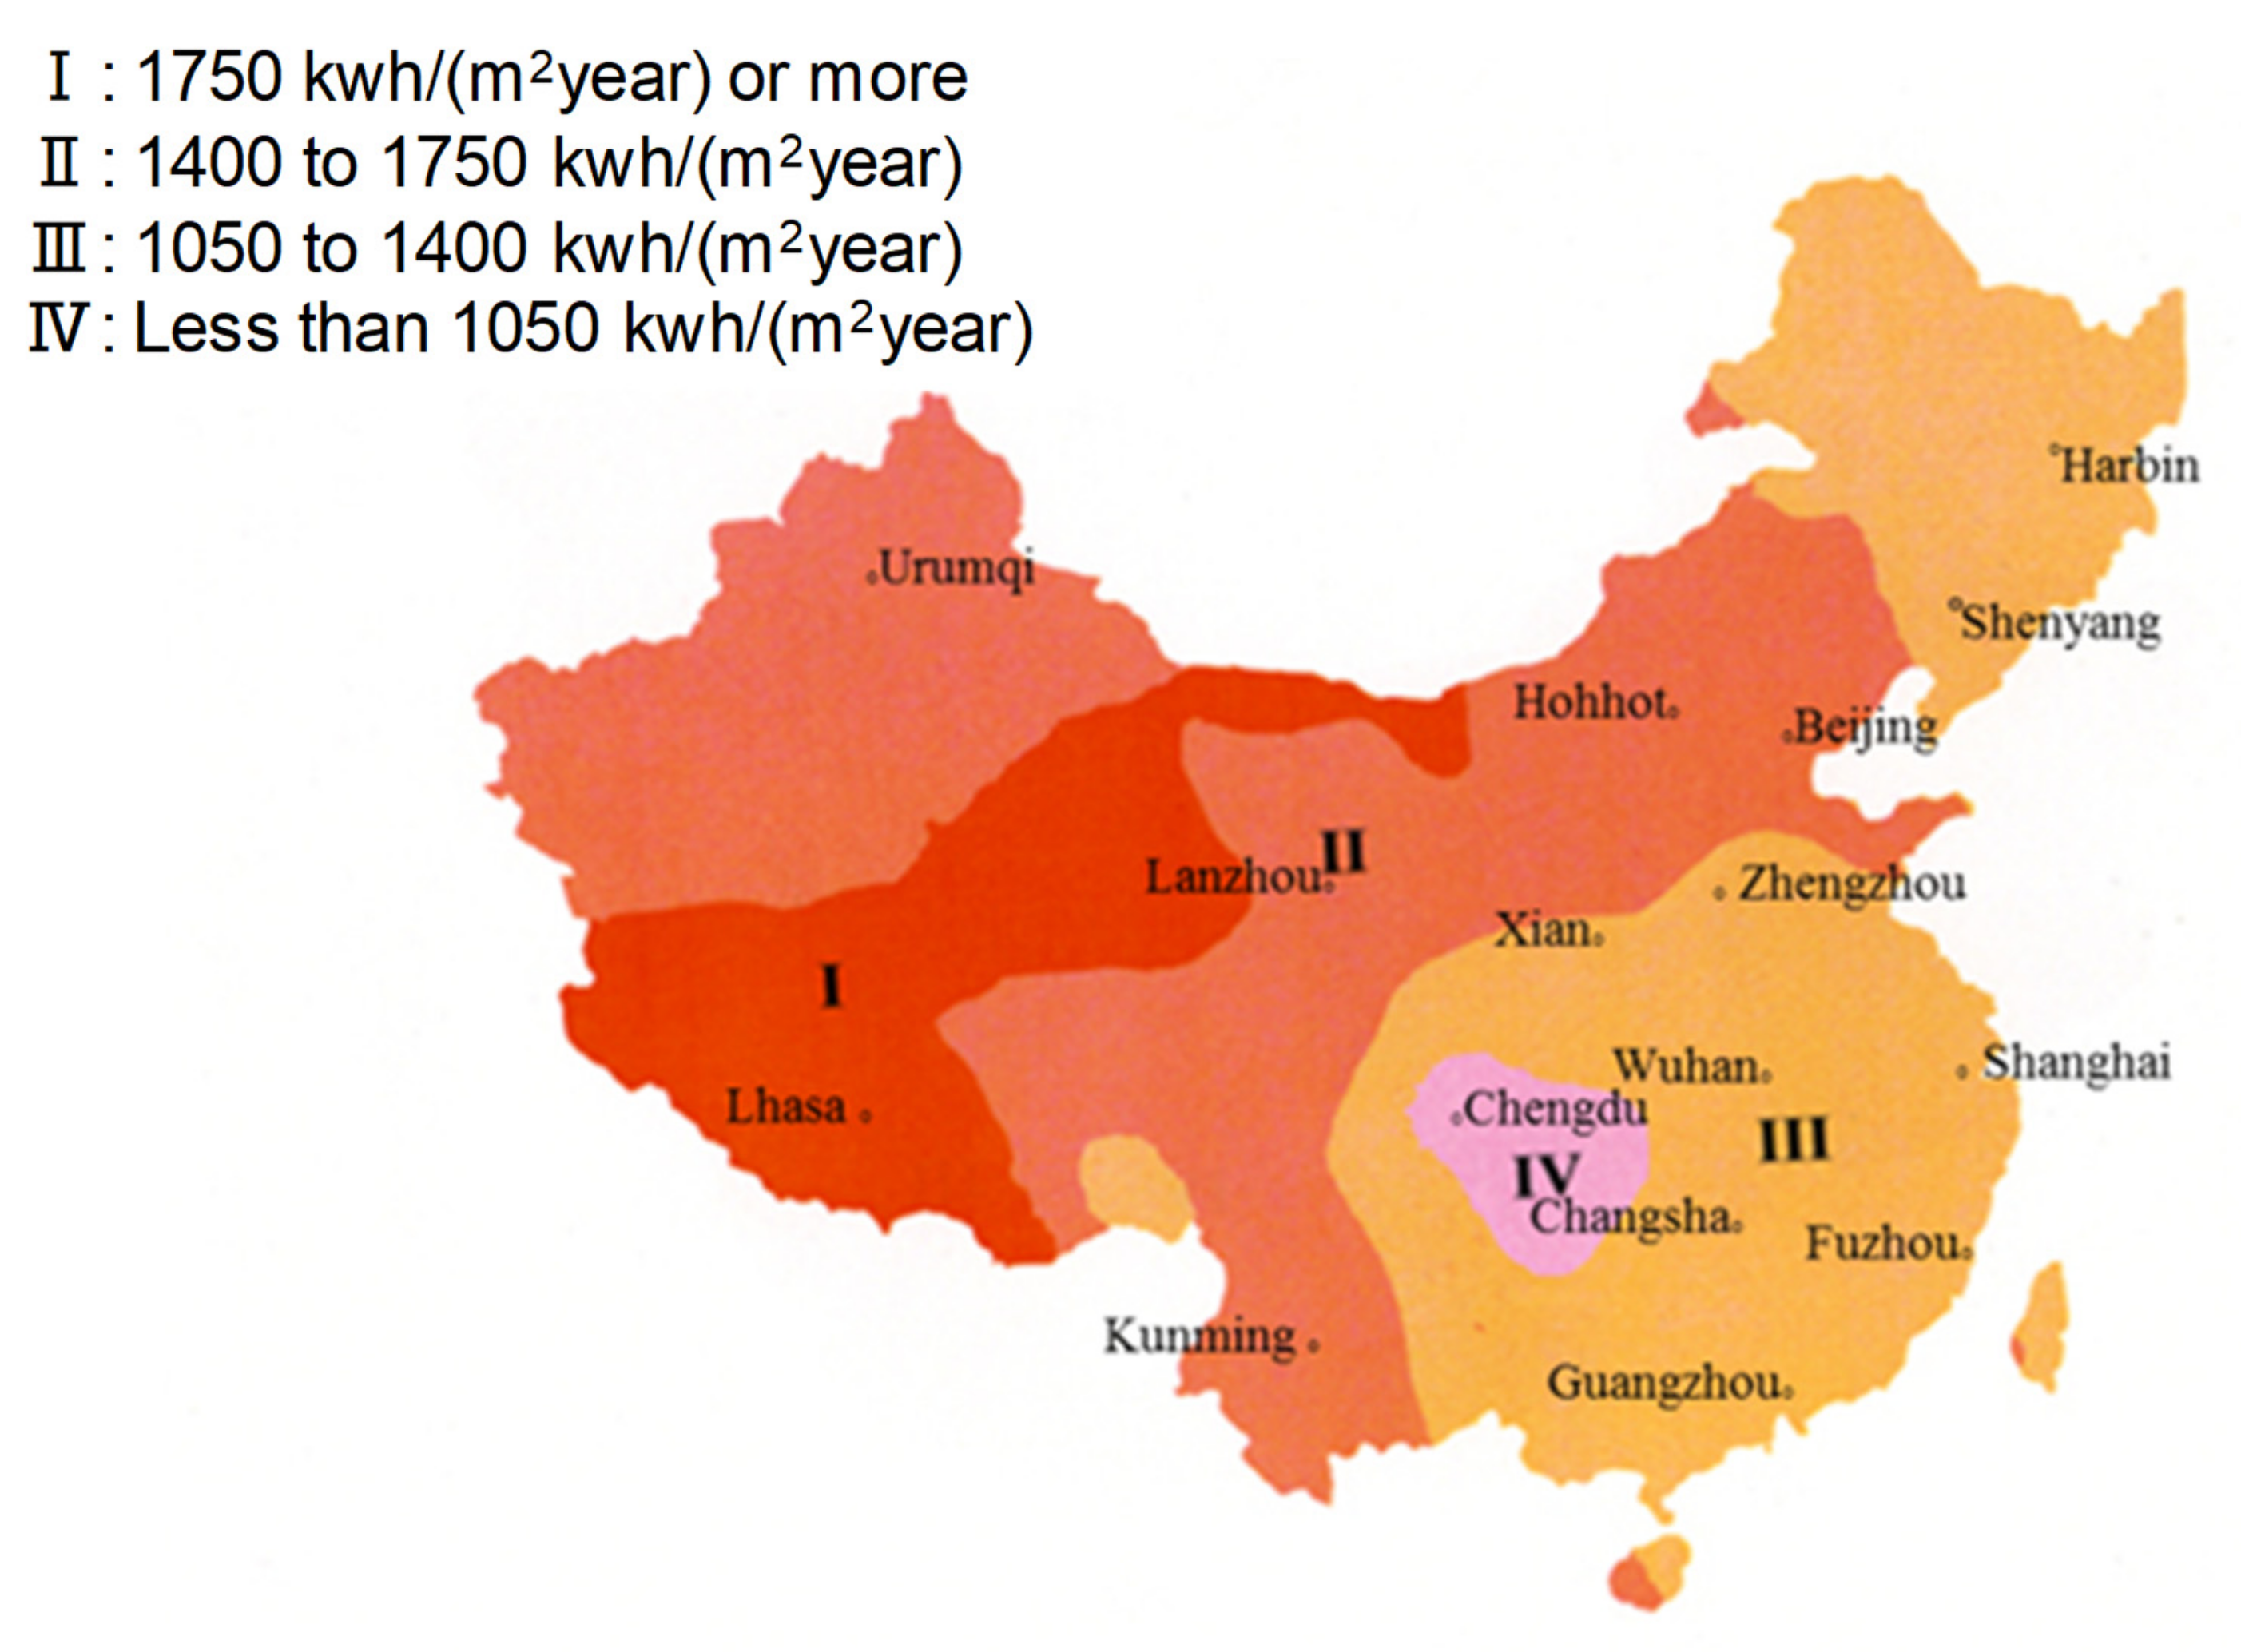
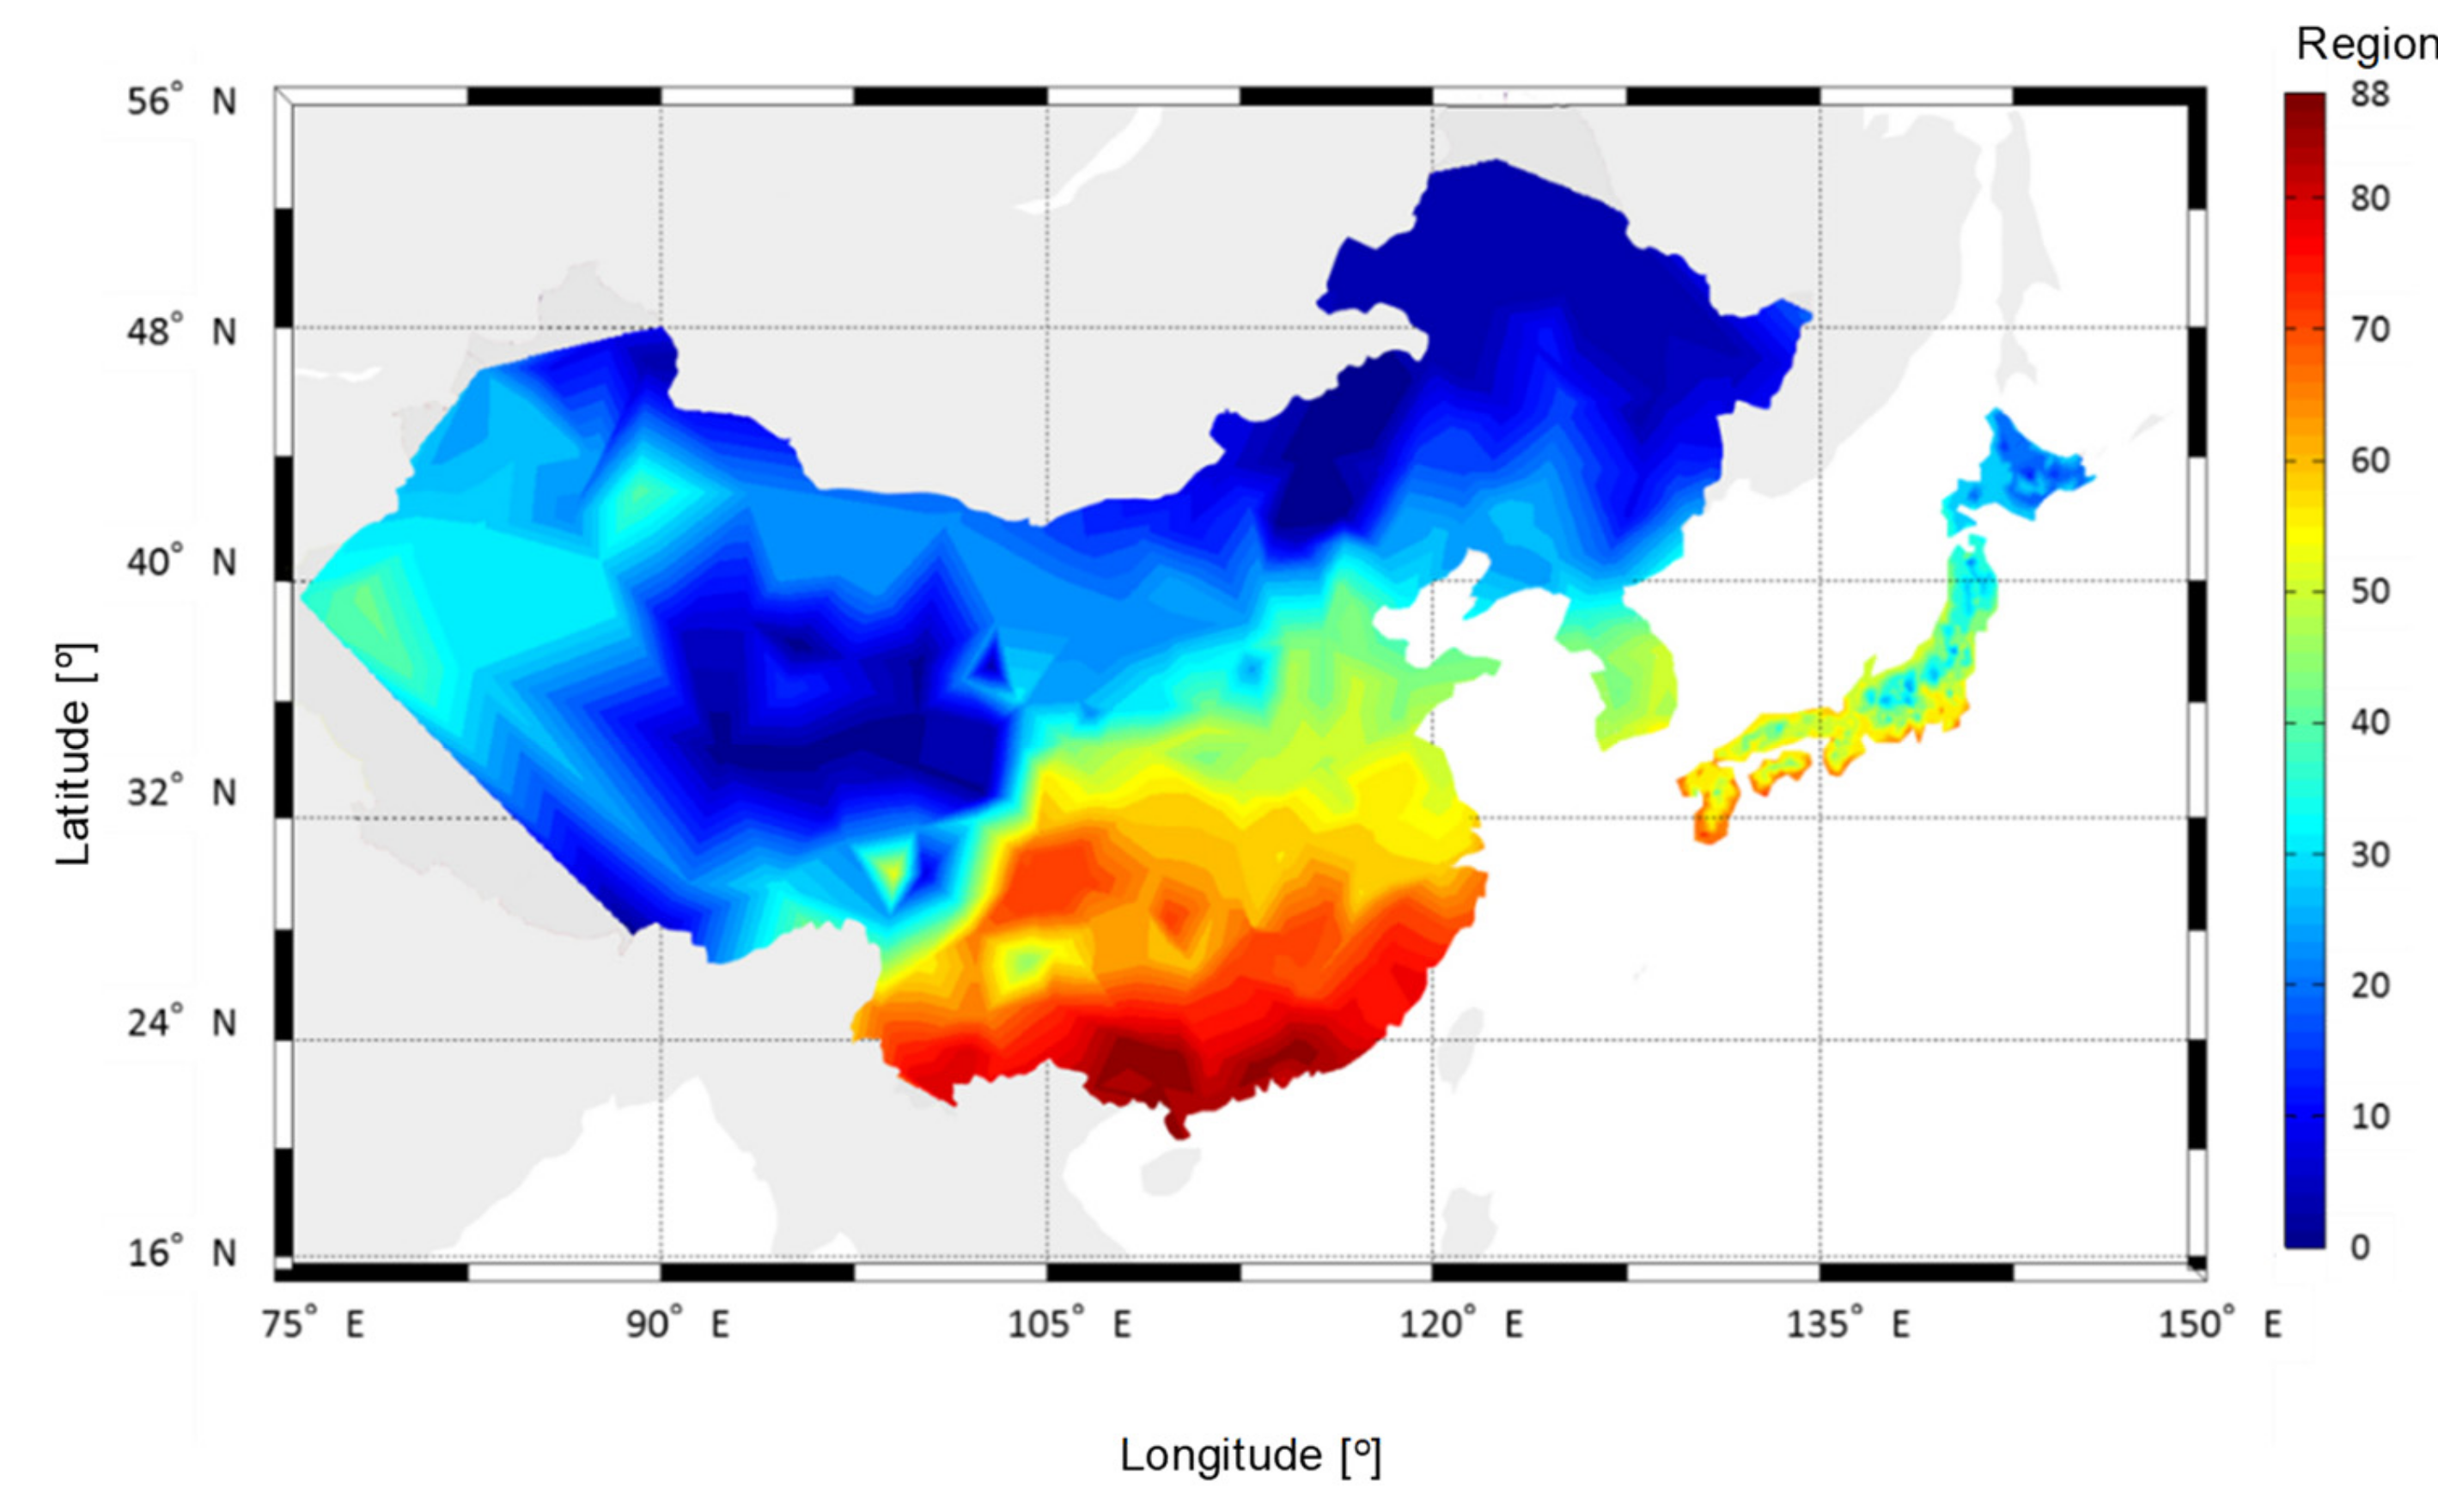
3.2. Map of Climate Classification
y = 5/4 × ln[tan(1/4 × π + 2/5 × φ)]
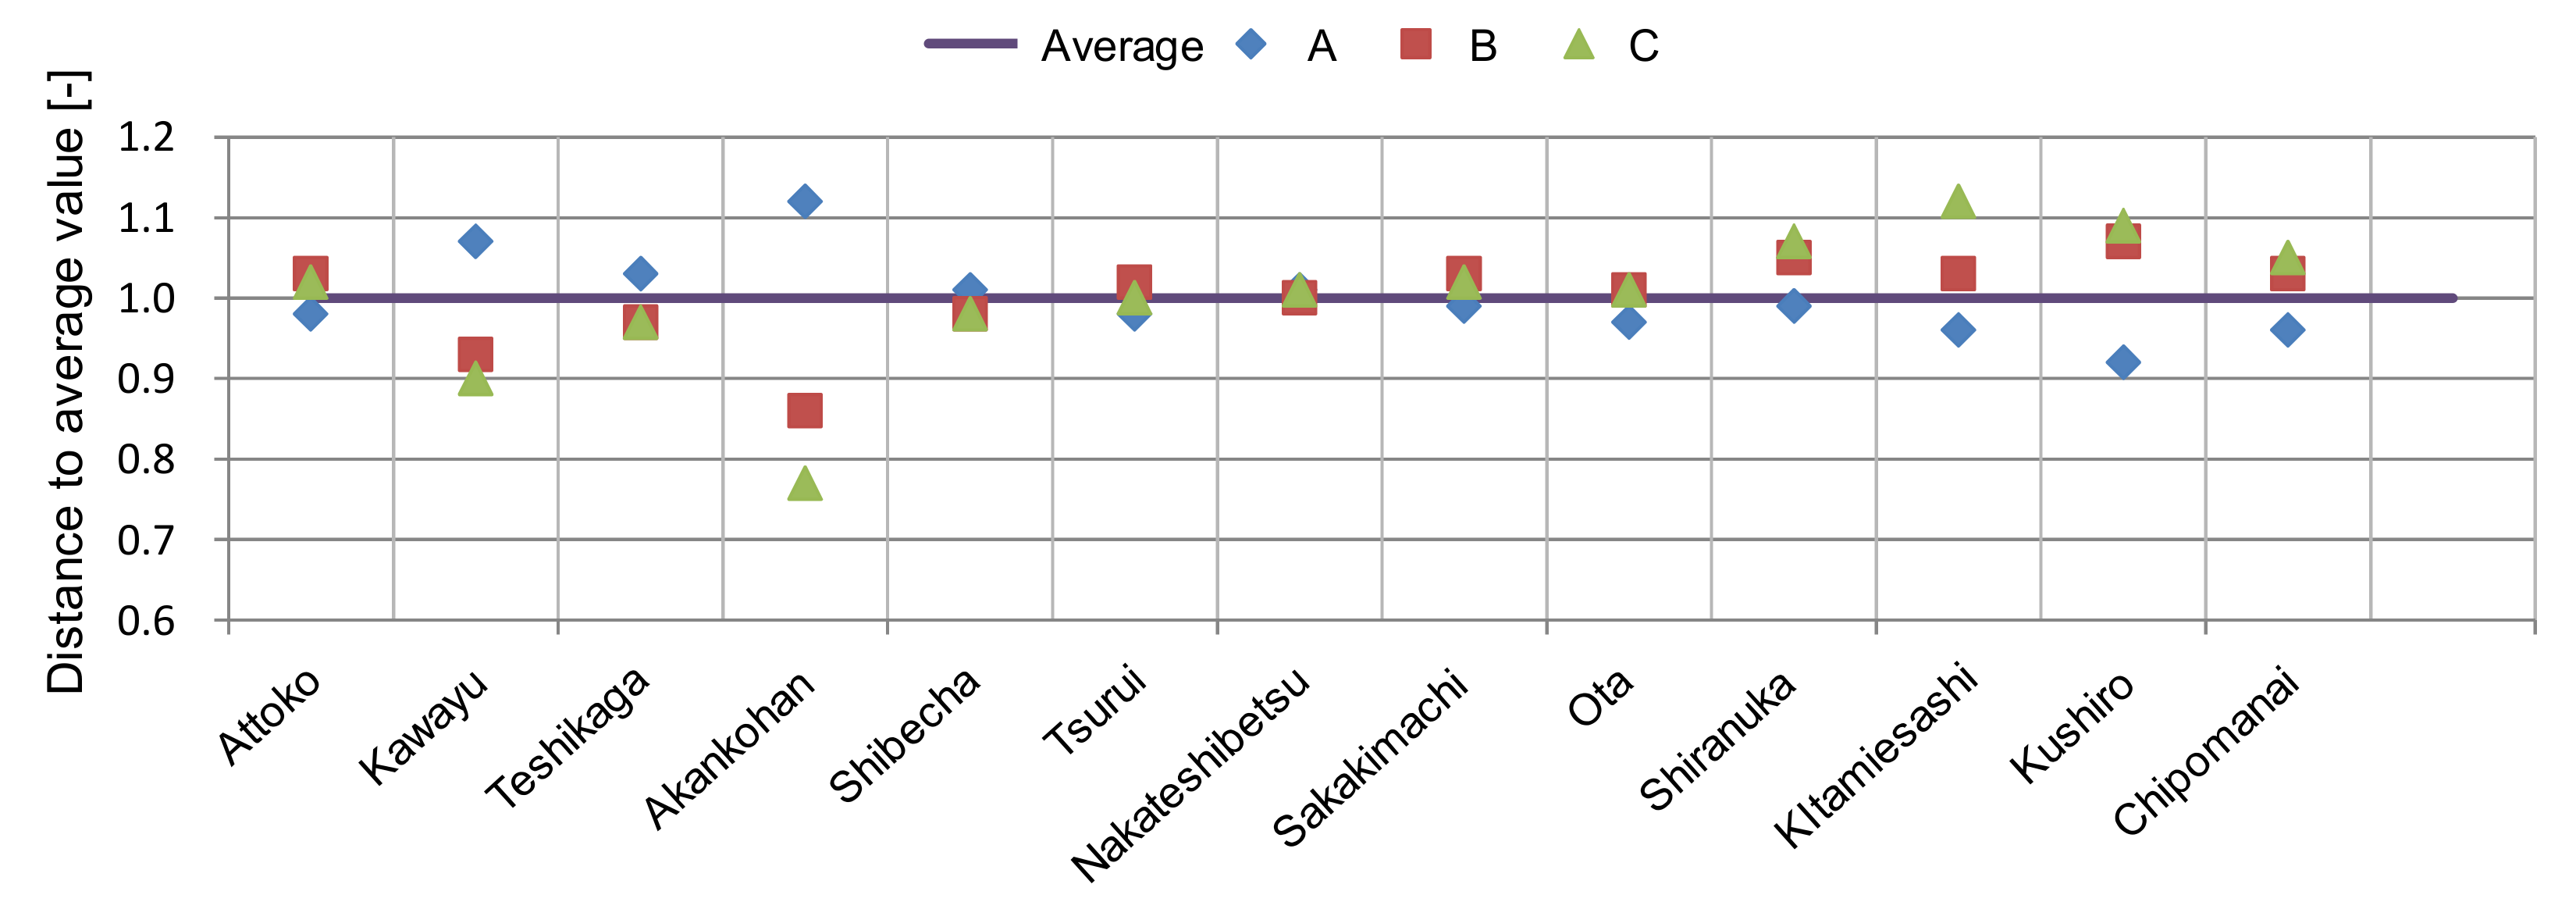
B = Bs/Bave
C = Cs/Cave
Dt = [(1 − A)2+ (1 − B)2+ (1 − C)2]0.5
4. Conclusions
- Heating degree day (HDD18-18);
- Daily solar global horizontal irradiance;
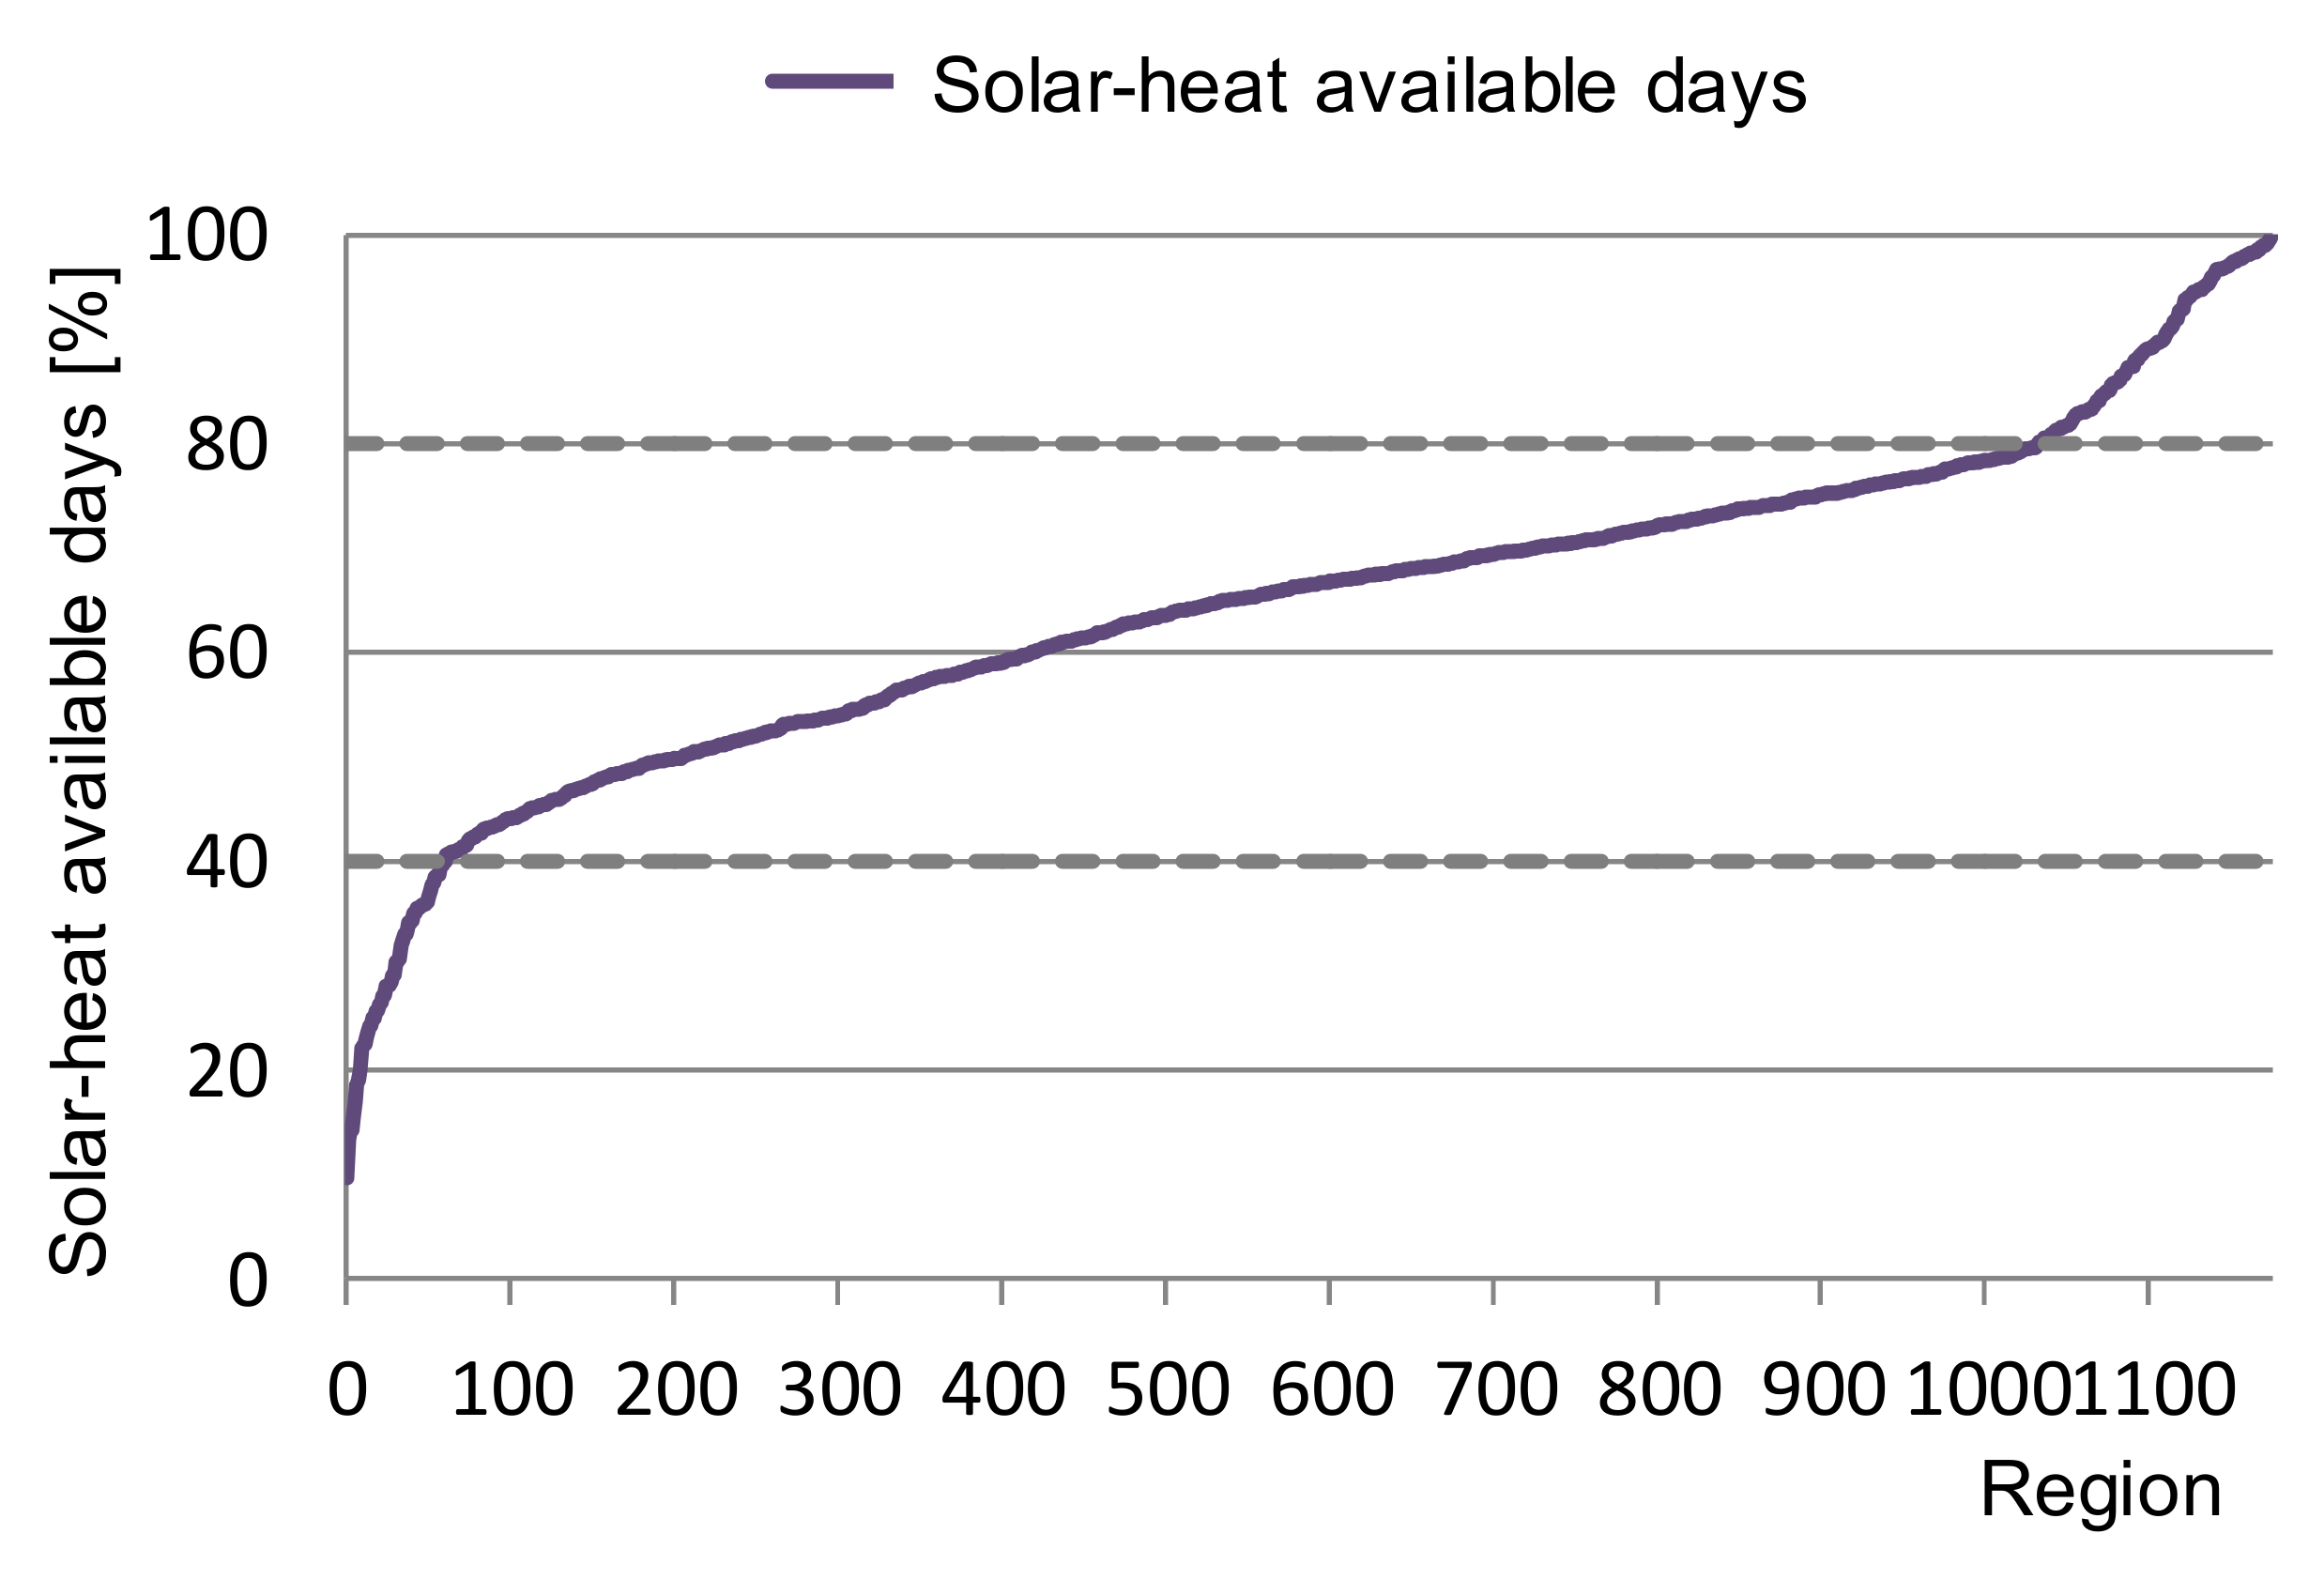
- Solar-heat available days.
Author Contributions
Funding
Conflicts of Interest
References
- Varotsos, C. Comment on connections between the 11-year solar cycle, the Q.B.O. and total ozone. J. Atmos. Terr. Phys. 1989, 51, 367–370. [Google Scholar] [CrossRef]
- Varotsos, C.A.; Cracknell, A.P. New features observed in the 11-year solar cycle. Int. J. Remote Sens. 2004, 25, 2141–2157. [Google Scholar] [CrossRef]
- Ge, T.S.; Wang, R.Z.; Xu, Z.Y.; Pan, Q.W.; Du, S.; Chen, X.M.; Ma, T.; Wu, X.N.; Sun, X.L.; Chen, J.F. Solar heating and cooling: Present and future development. Renew. Energy 2017, 126, 1126–1140. [Google Scholar] [CrossRef]
- Choi, Y.; Takase, K.; Mae, M. System performance of a residential building using the air-based solar heating system. Sol. Energy 2018, 171, 47–63. [Google Scholar] [CrossRef]
- Hill, J.E.; Streed, E.R. A method of testing for rating solar collectors based on thermal performance. Sol. Energy 1976, 18, 421–429. [Google Scholar] [CrossRef]
- Choi, Y. An Experimental Study of the Solar Collection Performance of Liquid-Type Solar Collectors under Various Weather Conditions. Energies 2018, 11, 1626. [Google Scholar] [CrossRef]
- Minardi, J.E.; Chuang, H.N. Performance of a “black” liquid flat-plate solar collector. Sol. Energy 1975, 17, 179–183. [Google Scholar] [CrossRef]
- Bergene, T.; Løvvik, O.M. Model calculations on a flat-plate solar heat collector with integrated solar cells. Sol. energy 1995, 55, 453–462. [Google Scholar] [CrossRef]
- Kovarik, M.; Lesse, P.F. Optimal control of flow in low temperature solar heat collector. Sol. Energy 1976, 18, 431–435. [Google Scholar] [CrossRef]
- Choi, Y.; Mae, M.; Bae Kim, H. Thermal performance improvement method for air-based solar heating systems. Sol. Energy 2019, 186, 277–290. [Google Scholar] [CrossRef]
- Yeh, H.M.; Ho, C.D. Effect of external recycle on the performances of flat-plate solar air heaters with internal fins attached. Renew. Energy 2009, 34, 1340–1347. [Google Scholar] [CrossRef]
- Lau, C.C.S.; Lam, J.C.; Yang, L. Climate classification and passive solar design implications in China. Energy Convers. Manag. 2007, 48, 2006–2015. [Google Scholar] [CrossRef]
- Robert, G. Fovell, M.-Y. C. F. Climate zones of the conterminous united states defined using cluster analysis. Am. Meteorol. Soc. 1993, 61, 2103–2135. [Google Scholar]
- Wan, K.K.W.; Li, D.H.W.; Yang, L.; Lama, J.C. Climate classifications and building energy use implications in China. Energy Build. 2010, 42, 1463–1471. [Google Scholar] [CrossRef]


| Weather data | Expanded AMeDAS data standard (2000), 842 points |
| Heating setpoint | 18 ℃ |
| Heating schedule | 07:00 to 10:00, 12:00 to 14:00, 16:00 to 23:00 |
| Inclination angle of collector | Latitude of each region |
| Calculation | Preliminary calculation: From 1 January to 30 April; Target period: 1 May to 30 April of the following year |
| Time step | 1 h |
| Usage of hot water | 450 L/day (40 °C for using hot water) |
| Internal heat gain | 13.26 (kWh)/d |
| Collector area Air volume | Preliminary collector: 14.10 m2, glass collector: 5.34 m2 Air volume: 240 m3/h |
| Region | Recorded Points | |
|---|---|---|
| Hokkaido | Souya (11), Kamikawa (20), Rumoi (9), Ishikari (9), Sorachi (12), Shiribeshi (11), Abashiri (20), Nemuro (8), Kushiro (11), Tokachi (18), Iburi (11), Hidaka (8), Oshima (8), Hiyama (6) | 162 points |
| Tohoku | Aomori (22), Akita (24), Iwate (33), Miyagi (18), Yamagata (20), Fukushima (20) | 146 points |
| Kanto | Ibaraki (14), Tochigi (14), Gunma (13), Saitama (8), Tokyo (12), Chiba (14), Kanagawa (5) | 80 points |
| Chubu | Nagano (29), Yamanashi (10), Shizuoka (17), Aichi (11), Gifu (23), Niigata (27), Toyama (9), Ishikawa (10), Fukui (9) | 145 points |
| Kinki | Osaka (7), Hyogo (19), Nara (6), Wakayama (11), Mie (12), Shiga (8), Kyoto (8) | 71 points |
| Chugoku, Shikoku | Okayama (15), Hiroshima (18), Shimane (16), Tottori (9), Tokushima (8), Kagawa (6), Ehime (14), Kochi (15), Yamaguchi (15) | 116 points |
| Kyushu, Okinawa | Fukuoka (12), Oita (14), Nagasaki (14), Saga (5), Kumamoto (17), Miyazaki (16), Kagoshima (26), Okinawa (18) | 122 points |
| Total | 7 Regions/47 Prefectures | 842 points |
| Number | Climatic Factors | Reference Weather Data |
|---|---|---|
| 1 | Heating degree day (HDD18-18) | Outside temperature |
| 2 | Daily average outside temperature | |
| 3 | Daily average outside temperature during the heating period | |
| 4 | Daily maximum outside temperature | |
| 5 | Daily minimum outside temperature | |
| 6 | Daily temperature difference | |
| 7 | Daily solar direct normal irradiance | Solar radiation |
| 8 | Daily solar diffuse horizontal irradiance | |
| 9 | Daily solar global horizontal irradiance | |
| 10 | Solar-heat available days | |
| 11 | Average solar direct normal irradianceduring solar-heat available days | |
| 12 | Daylight hours |
| Regression Statistics | ||||||
| Multiple R | 0.98 | |||||
| R Square | 0.96 | |||||
| Adjusted R Square | 0.96 | |||||
| Standard Error | 0.31 | |||||
| Observations | 842 | |||||
| ANOVA | ||||||
| df | SS | MS | F | Significance F | ||
| Regression | 12 | 2142.7 | 178.56 | 1963.66 | 0 | |
| Residual | 830 | 82.33 | 0.1 | |||
| Total | 842 | 2225.03 | ||||
| Coefficients | Standard Error | t Stat | p-Value | Lower 95% | Upper95% | |
| Intercept | 6.632 | 0.864 | 7.675 | 0 | 4.936 | 8.329 |
| ① | 0.002 | 0 | 20.2 | 0 | 0.002 | 0.003 |
| ② | −0.174 | 0.042 | −4.123 | 0 | −0.256 | −0.091 |
| ③ | 0.329 | 0.066 | 4.984 | 0 | 0.2 | 0.459 |
| ④ | 0.17 | 0.071 | 2.401 | 0.017 | 0.031 | 0.308 |
| ⑤ | 0 | 0 | 65535 | #NUM! | 0 | 0 |
| ⑥ | −0.214 | 0.038 | −5.670 | #NUM! | −0.289 | −0.140 |
| ⑦ | 0.001 | 0 | 2.389 | 0.017 | 0 | 0.001 |
| ⑧ | 0 | 0.001 | −0.780 | 0.436 | −0.001 | 0.001 |
| ⑨ | −0.001 | 0 | −2.221 | 0.027 | −0.001 | 0 |
| ⑩ | −0.025 | 0.001 | −19.041 | 0 | −0.028 | −0.023 |
| ⑪ | −0.001 | 0 | −8.041 | 0 | −0.001 | 0 |
| ⑫ | 0.096 | 0.086 | 1.112 | 0.267 | −0.074 | 0.266 |
| Row 1 | Row 2 | Row 3 | Row 4 | Row 5 | |
|---|---|---|---|---|---|
| Column 1 | 1.000 | ||||
| Column 2 | −0.353 | 1.000 | |||
| Column 3 | −0.331 | 0.947 | 1.000 | ||
| Column 4 | 0.640 | 0.385 | 0.406 | 1.000 | |
| Column 5 | −0.370 | 0.846 | 0.763 | 0.126 | 1.000 |
| Regression Statistics | ||||||
| Multiple R | 0.95 | |||||
| R Square | 0.9 | |||||
| Adjusted R Square | 0.9 | |||||
| Standard Error | 0.51 | |||||
| Observations | 842 | |||||
| ANOVA | ||||||
| df | SS | MS | F | Significance F | ||
| Regression | 5 | 2008.76 | 401.75 | 1552.96 | 0 | |
| Residual | 836 | 216.27 | 0.26 | |||
| Total | 841 | 2225.03 | ||||
| Coefficients | Standard Error | t Stat | p-Value | Lower 95% | Upper 95% | |
| Intercept | 8.453 | 0.407 | 20.765 | 0 | 7.654 | 9.252 |
| ① | 0.002 | 0 | 33.59 | 0 | 0.001 | 0.002 |
| ⑦ | 0 | 0 | 1.814 | 0.07 | 0 | 0 |
| ⑨ | −0.001 | 0 | −4.388 | 0 | −0.001 | 0 |
| ⑩ | −0.019 | 0.002 | −11.969 | 0 | −0.022 | −0.016 |
| ⑪ | 0 | 0 | −2.451 | 0.014 | 0 | 0 |
| Regression Statistics | |||||||
| Multiple R | 0.95 | ||||||
| R Square | 0.90 | ||||||
| Adjusted R Square | 0.90 | ||||||
| Standard Error | 0.51 | ||||||
| Observations | 842 | ||||||
| ANOVA | |||||||
| df | SS | MS | F | Significance F | |||
| Regression | 3 | 2007.20 | 669.07 | 2573.96 | 0 | ||
| Residual | 838 | 217.83 | 0.26 | ||||
| Total | 841 | 2225.03 | |||||
| Coefficients | Standard Error | t Stat | p-Value | Lower 95% | Upper 95% | ||
| Intercept | 7.923 | 0.276 | 28.709 | 0.000 | 7.381 | 8.464 | |
| ① | 0.002 | 0.000 | 39.965 | 0.000 | 0.001 | 0.002 | |
| ⑨ | −0.001 | 0.000 | −6.858 | 0.000 | −0.001 | −0.001 | |
| ⑩ | −0.017 | 0.001 | −13.793 | 0.000 | −0.019 | −0.014 | |
| Region Classification According to 1999 Standard | Region Classification According to 2013 Standard | Heating Degree Day (HDD18-18) |
|---|---|---|
| Region I | Region 1 | 4500 ≦ HDD |
| Region 2 | 3500 ≦ HDD < 4500 | |
| Region II | Region 3 | 3000 ≦ HDD < 3500 |
| Region III | Region 4 | 2500 ≦ HDD < 3800 |
| Region IV | Region 5 | 2000 ≦ HDD < 2500 |
| Region 6 | 1500 ≦ HDD < 2000 | |
| Region V | Region 7 | 500 ≦ HDD < 1500 |
| Region VI | Region 8 | HDD < 500 |
| Heating Degree Day (HDD18-18) | |
|---|---|
| Severe cold A | 5500 ≦ HDD < 8000 |
| Severe cold B | 5000 ≦ HDD < 5500 |
| Severe cold C | 3800 ≦ HDD < 5000 |
| Cold A | 2000 ≦ HDD < 3800 |
| Cold B | |
| Hot summer and cold winter (HSCW) A | 1000 ≦ HDD < 2000 |
| Hot summer and cold winter (HSCW) B | |
| Hot summer and cold winter (HSCW) C | 600 ≦ HDD < 1000 |
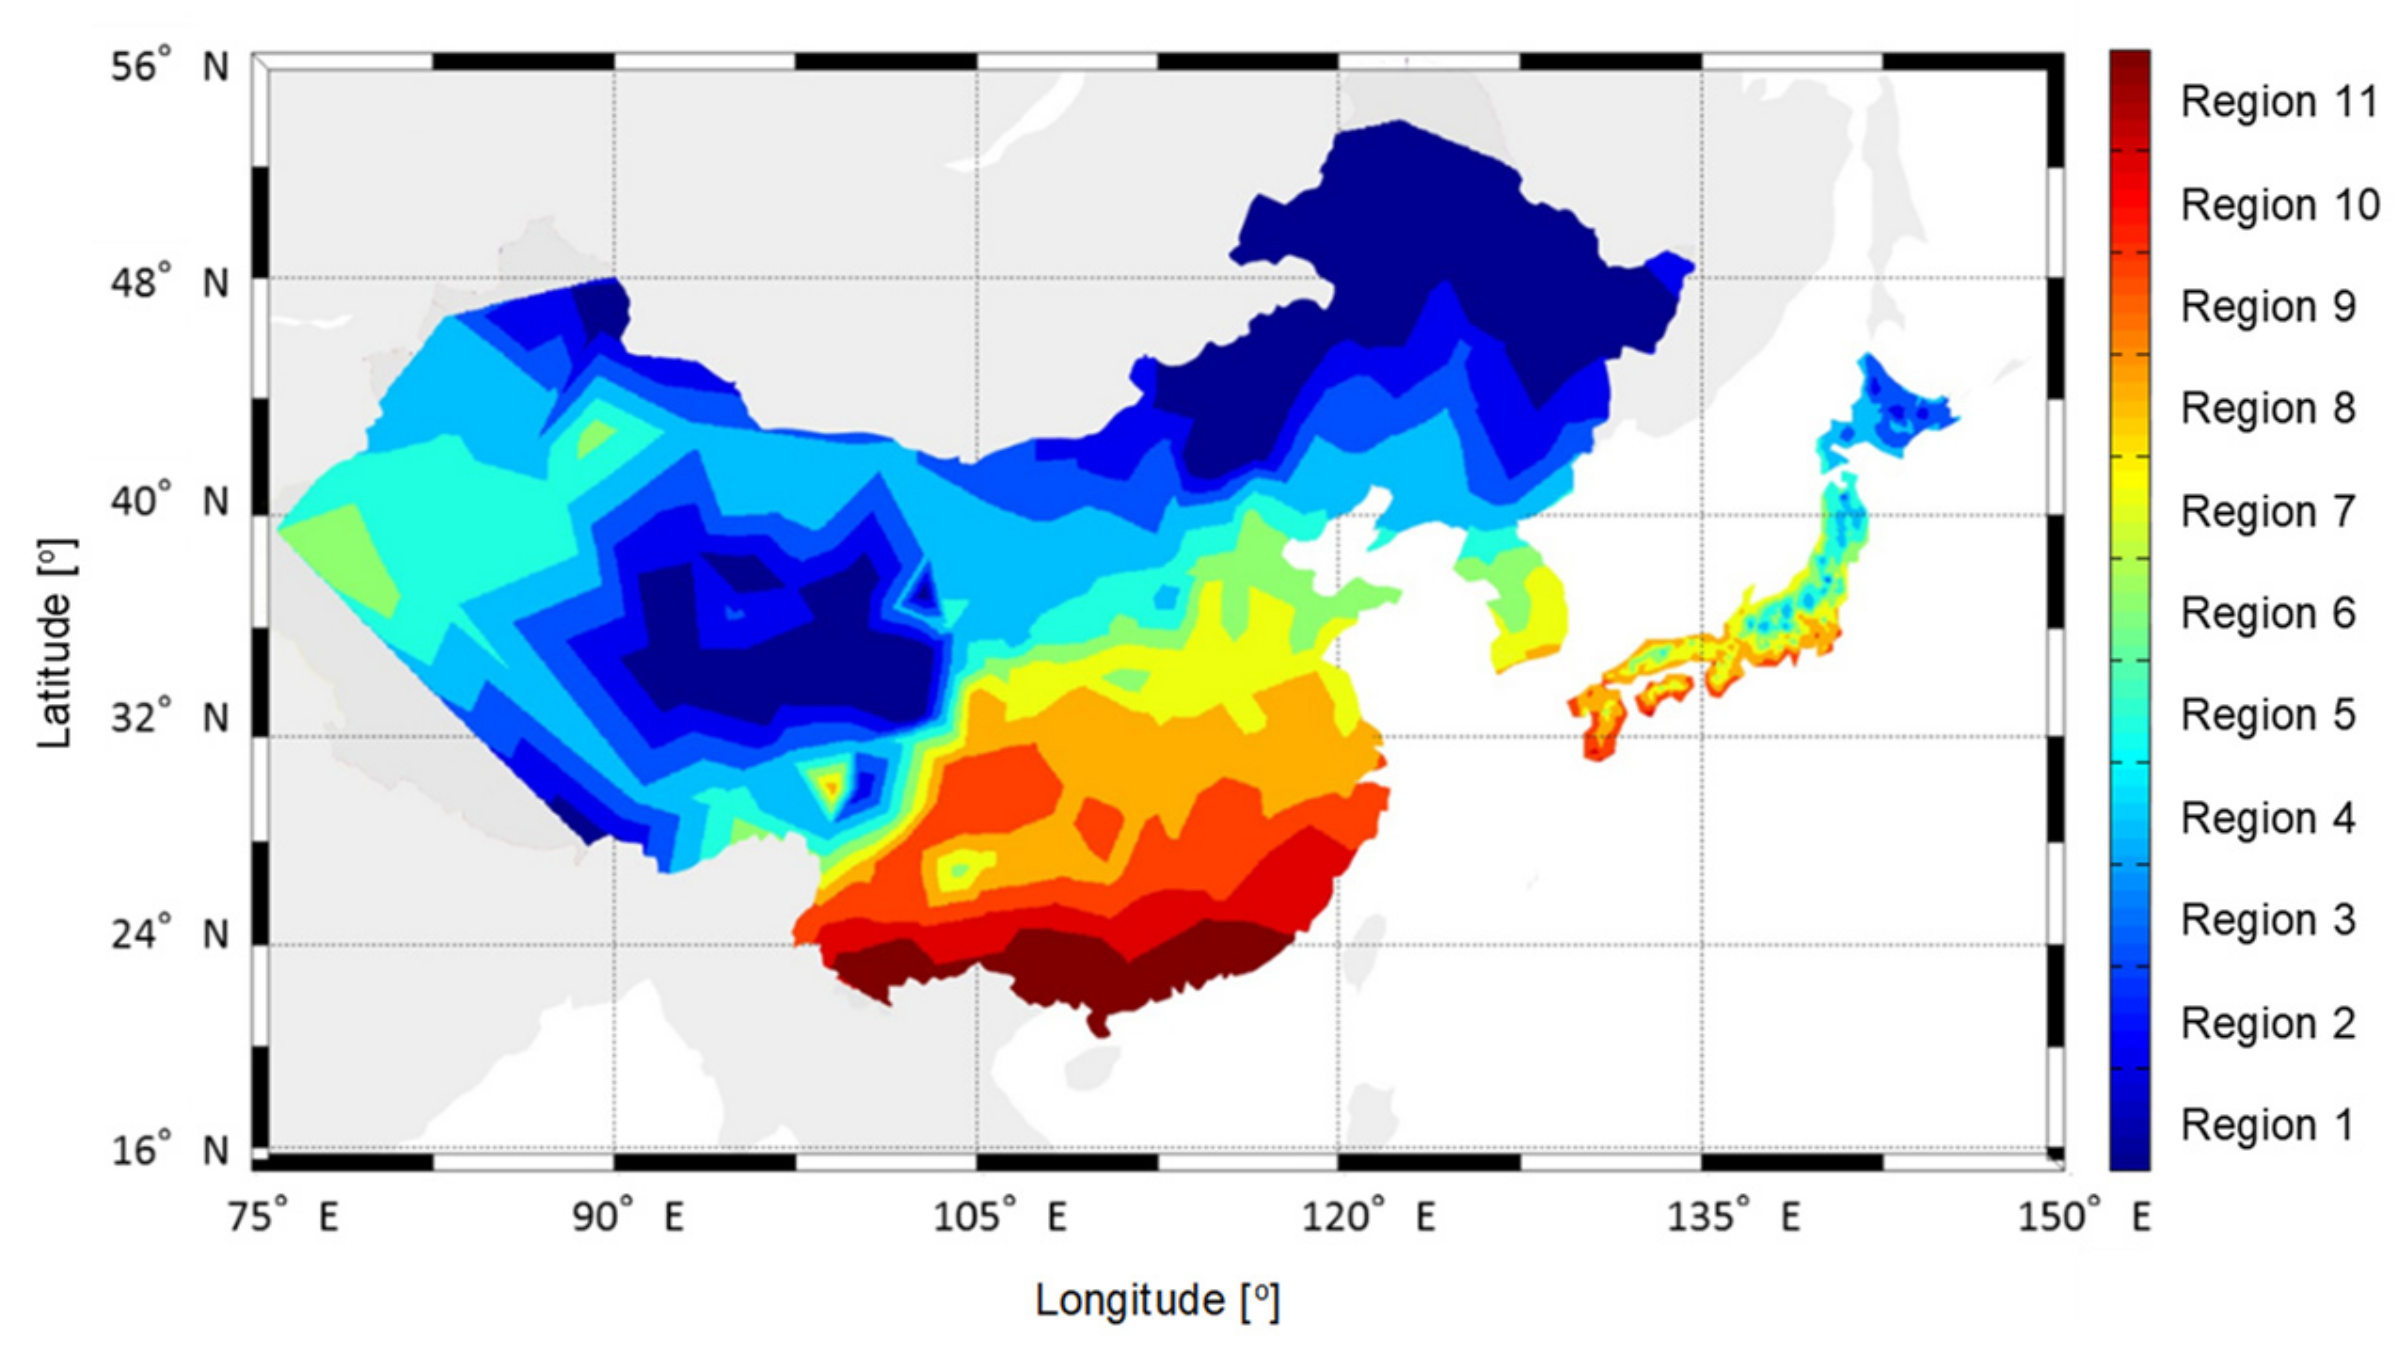
| Region Classification | Heating Degree Day (HDD18-18) |
|---|---|
| Region 1 | 5500 ≦ HDD |
| Region 2 | 5000 ≦ HDD < 5500 |
| Region 3 | 4500 ≦ HDD < 5000 |
| Region 4 | 3500 ≦ HDD < 4500 |
| Region 5 | 3000 ≦ HDD < 3500 |
| Region 6 | 2500 ≦ HDD < 3000 |
| Region 7 | 2000 ≦ HDD < 2500 |
| Region 8 | 1500 ≦ HDD < 2000 |
| Region 9 | 1000 ≦ HDD < 1500 |
| Region 10 | 500 ≦ HDD < 1000 |
| Region 11 | HDD < 500 |
| Region Classification | A1 | A2 | A3 | A4 | A5 |
|---|---|---|---|---|---|
| Range [-] | ˂0.85 | 0.85 to 0.95 | 0.95 to 1.05 | 1.05 to 1.15 | 1.15≥ |
| Solar irradiance [MJ/m2] | ˂3787.6 | 3787.6 to 4233.2 | 4233.2 to 4678.8 | 4678.8 to 5124.4 | 5124.4≥ |
| Solar irradiance [kWh/m2] | ˂1052.1 | 1052.1 to 1175.9 | 1175.9 to 1299.7 | 1299.7 to 1423.4 | 1423.4≥ |
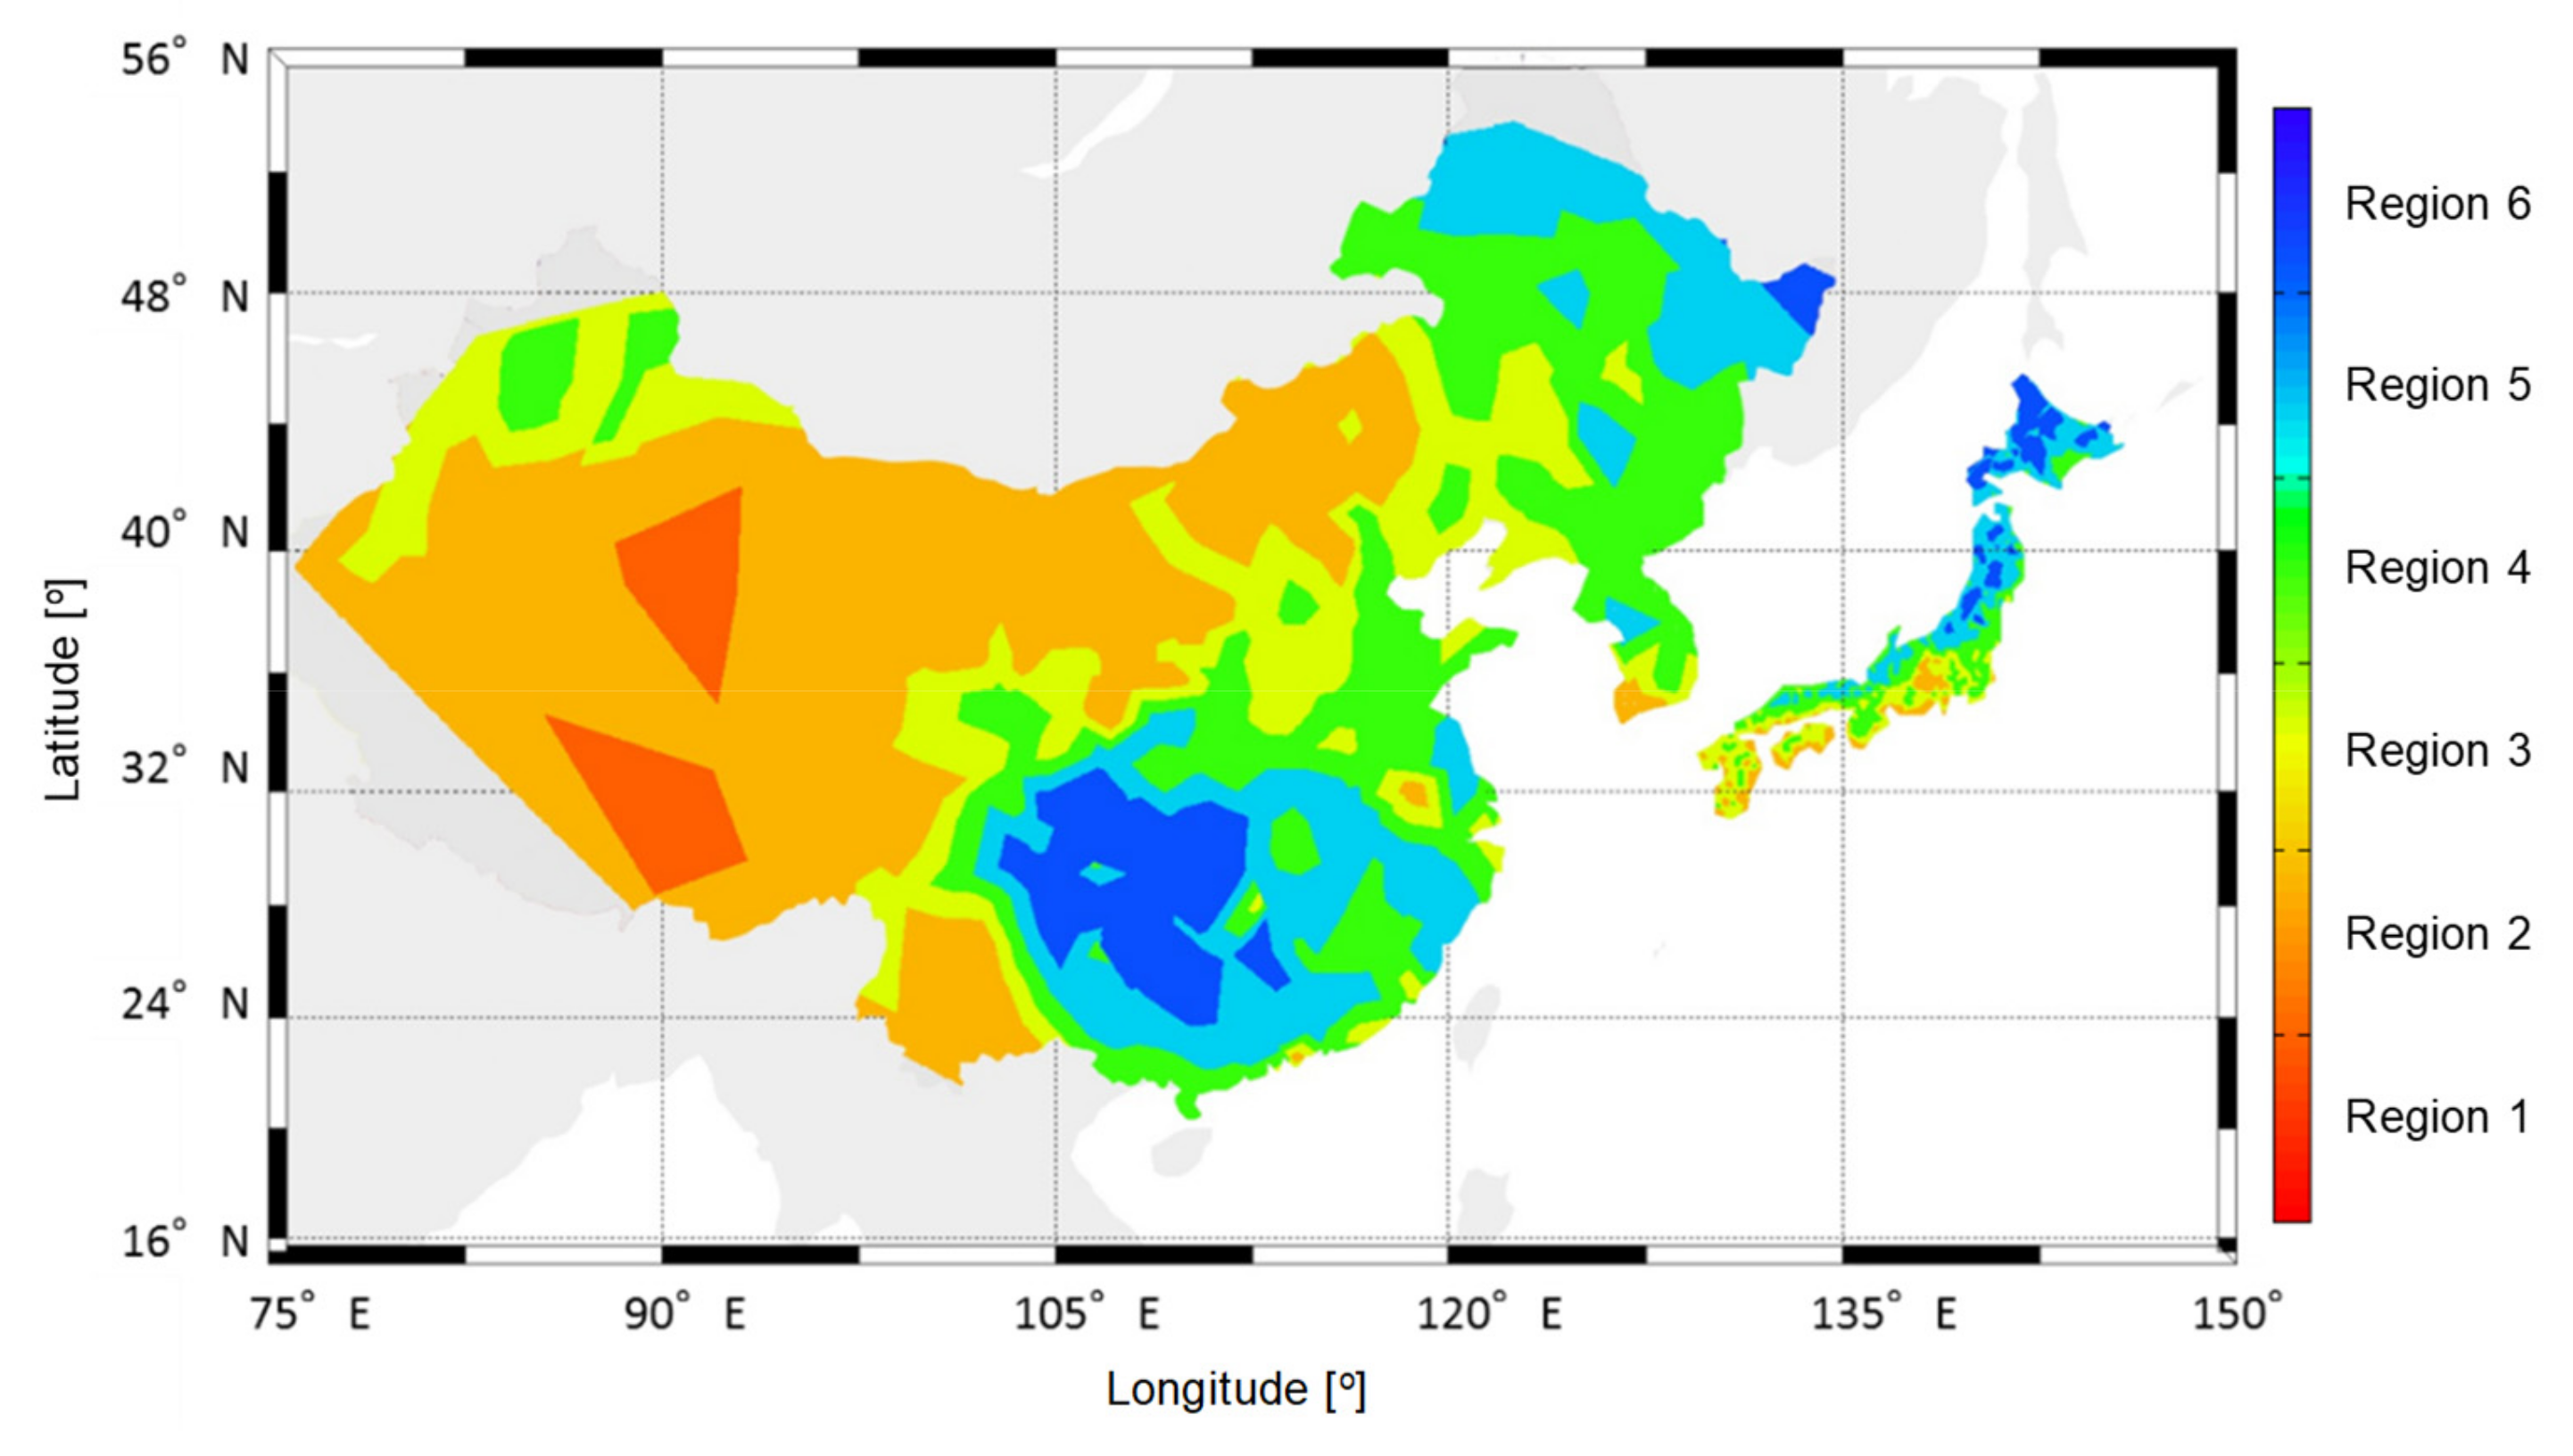
| Region Classification | Yearly Solar Global Horizontal Irradiance [kWh/m2] |
|---|---|
| Region 1 | ≥1750 |
| Region 2 | 1400 to 1750 |
| Region 3 | 1300 to 1400 |
| Region 4 | 1176 to 1300 |
| Region 5 | 1050 to 1176 |
| Region 6 | ˂1050 |
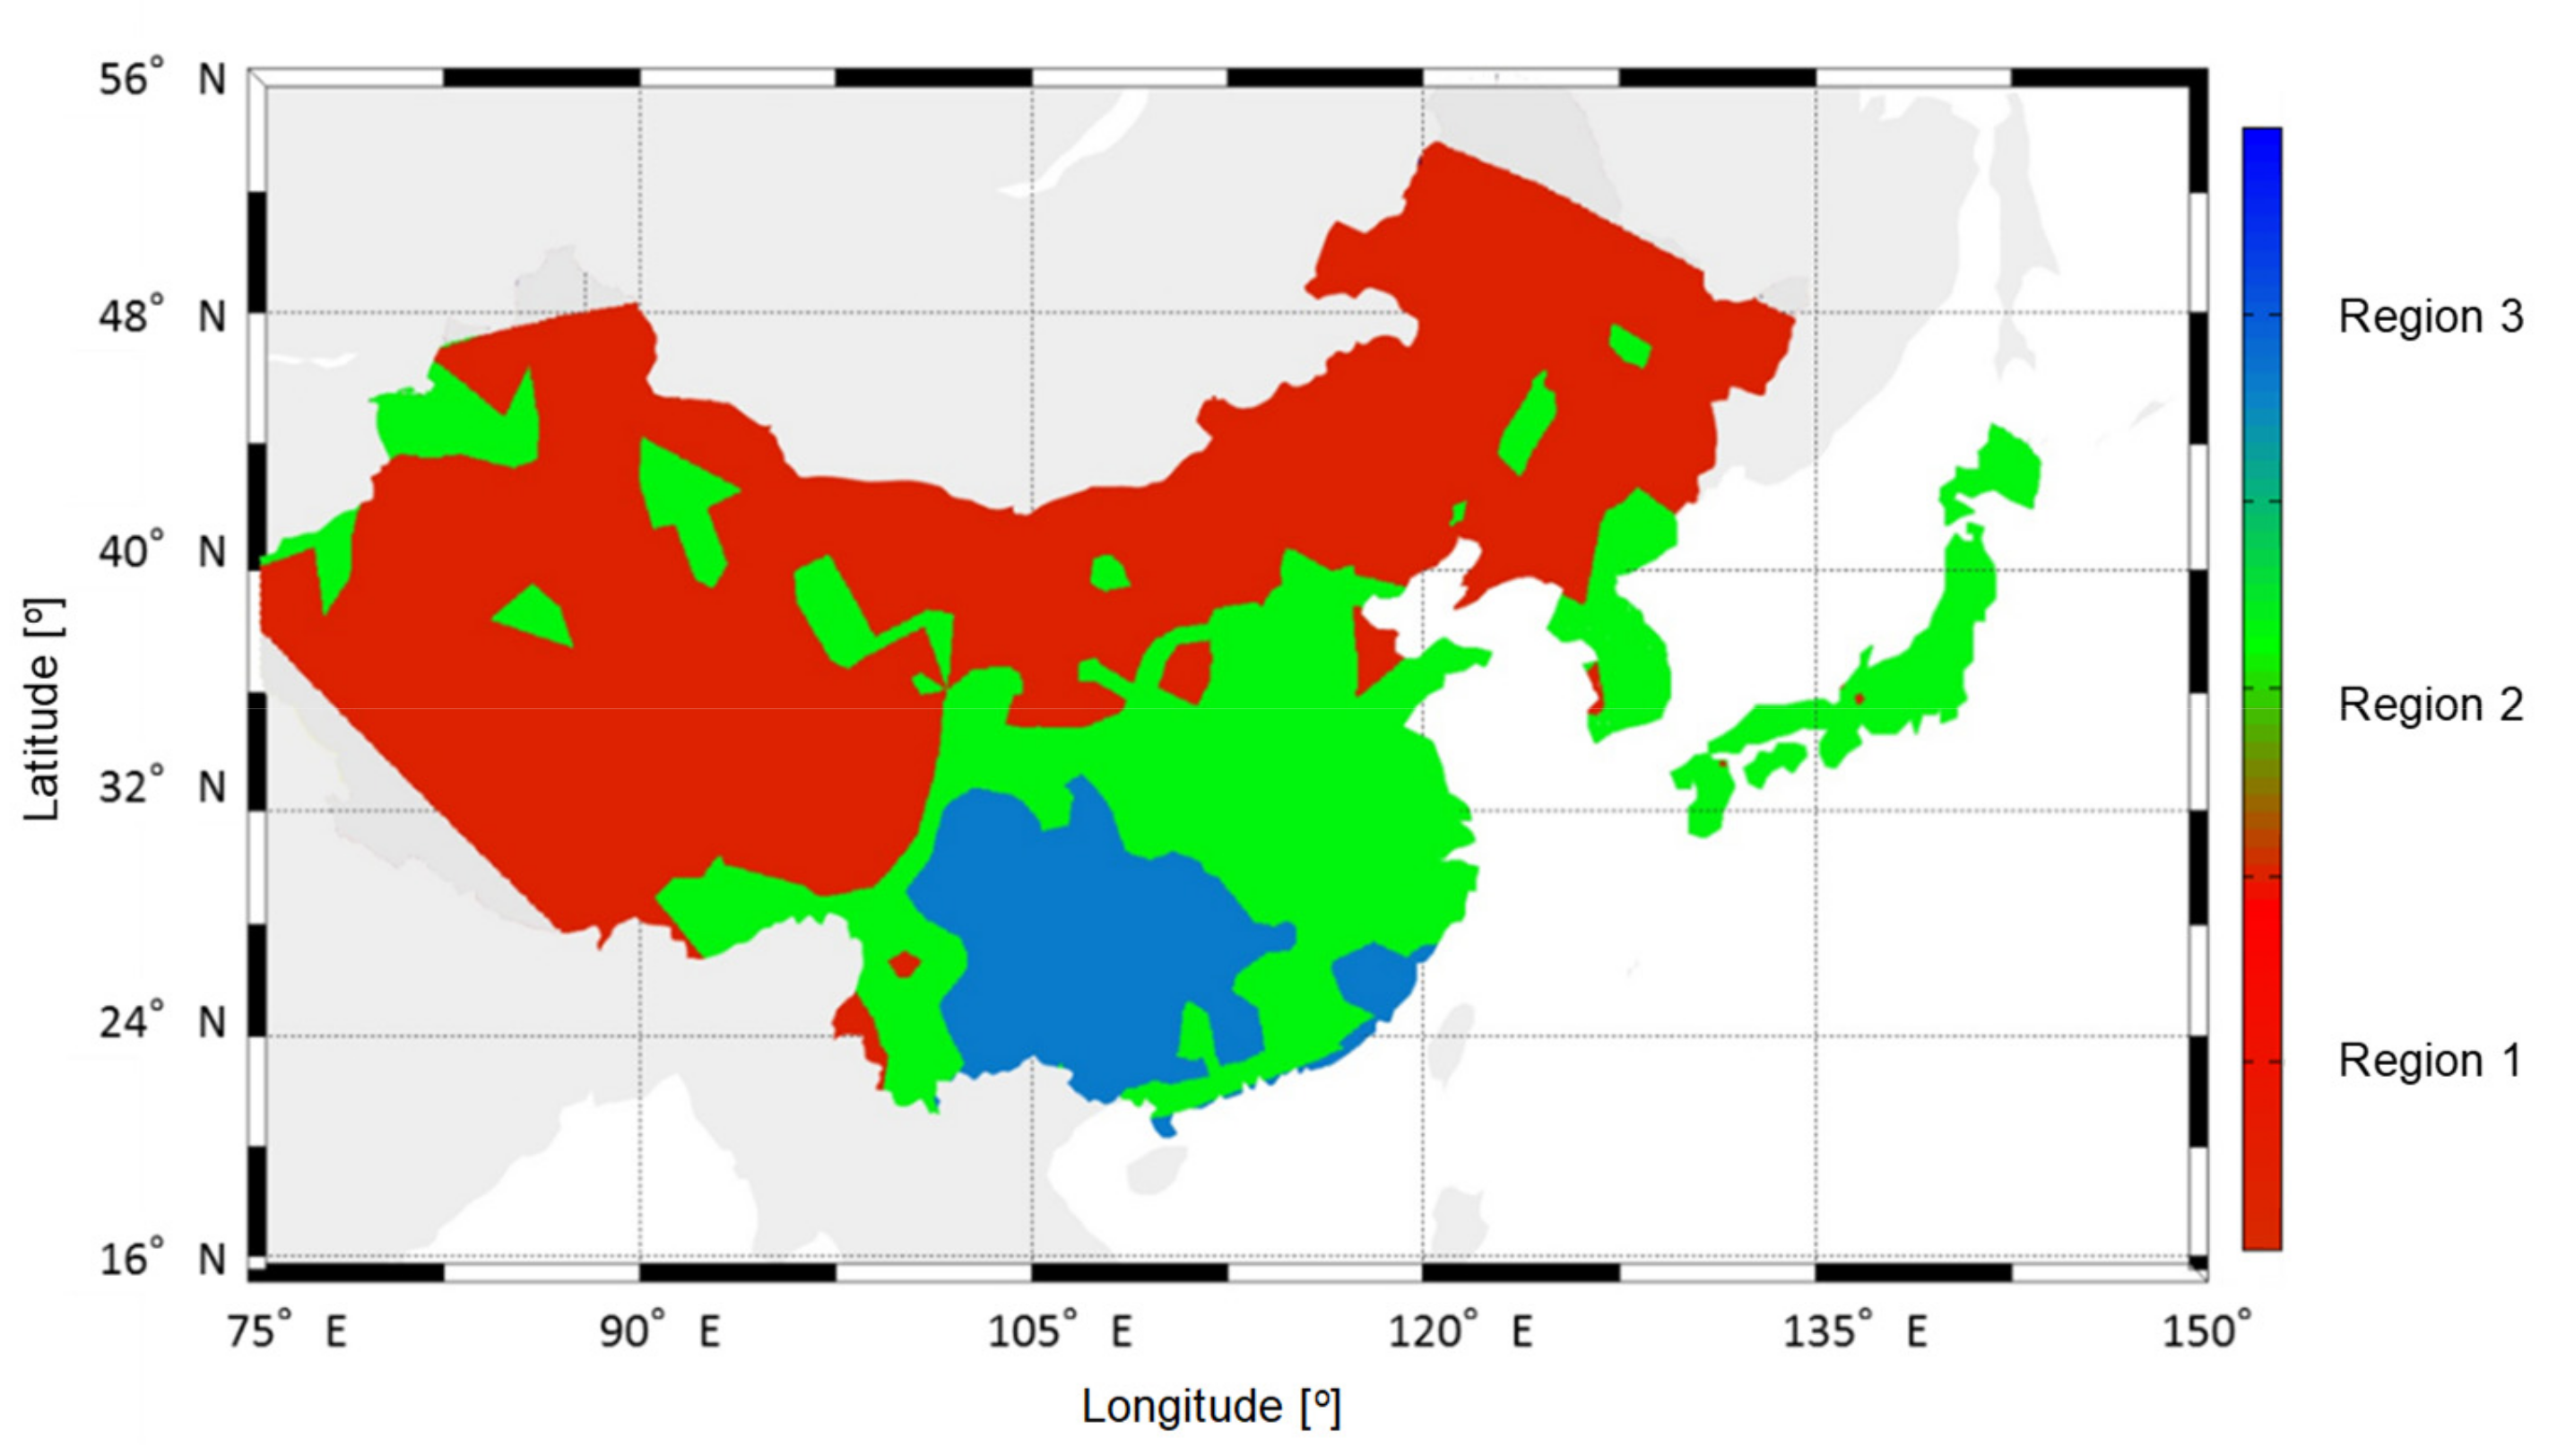
| Region Classification | Solar-Heat Available Days [%] |
|---|---|
| Region 1 | ≥80% |
| Region 2 | 40 to 80% |
| Region 3 | ≤40% |
| Climate Region | Map Number | Climate Region | Map Number | Climate Region | Map Number | Climate Region | Map Number | Climate Region | Map Number | ||
| 121 | 1 | 211 | 7 | 321 | 16 | 411 | 22 | 521 | 31 | ||
| 122 | 2 | 221 | 8 | 331 | 17 | 421 | 23 | 522 | 32 | ||
| 131 | 3 | 231 | 9 | 341 | 18 | 422 | 24 | 532 | 33 | ||
| 141 | 4 | 232 | 10 | 342 | 19 | 431 | 25 | 541 | 34 | ||
| 151 | 5 | 241 | 11 | 352 | 20 | 432 | 26 | 542 | 35 | ||
| 152 | 6 | 242 | 12 | 362 | 21 | 441 | 27 | 552 | 36 | ||
| 251 | 13 | 442 | 28 | 562 | 37 | ||||||
| 252 | 14 | 452 | 29 | 563 | 38 | ||||||
| 262 | 15 | 462 | 30 | ||||||||
| Climate Region | Map Number | Climate Region | Map Number | Climate Region | Map Number | Climate Region | Map Number | Climate Region | Map Number | Climate Region | Map Number |
| 611 | 39 | 721 | 47 | 821 | 55 | 921 | 64 | 1021 | 74 | 1121 | 80 |
| 621 | 40 | 722 | 48 | 822 | 56 | 922 | 65 | 1022 | 75 | 1122 | 81 |
| 622 | 41 | 732 | 49 | 832 | 57 | 931 | 66 | 1032 | 76 | 1123 | 82 |
| 631 | 42 | 741 | 50 | 842 | 58 | 932 | 67 | 1042 | 77 | 1132 | 83 |
| 632 | 43 | 742 | 51 | 843 | 59 | 933 | 68 | 1052 | 78 | 1133 | 84 |
| 642 | 44 | 752 | 52 | 852 | 60 | 942 | 69 | 1053 | 79 | 1142 | 85 |
| 652 | 45 | 753 | 53 | 853 | 61 | 943 | 70 | 1143 | 86 | ||
| 662 | 46 | 763 | 54 | 862 | 62 | 952 | 71 | 1152 | 87 | ||
| 863 | 63 | 953 | 72 | 1153 | 88 | ||||||
| 963 | 73 | ||||||||||
| Heating Degree Day | Daily Solar Global Horizontal Irradiance | Solar-Heat Available Days | A | B | C | Distance from Average Value (Dt) | |
|---|---|---|---|---|---|---|---|
| Attoko | 4543.1 | 1158.1 | 65.6 | 0.98 | 1.03 | 1.02 | 0.038 |
| Kawayu | 4920.4 | 1043.3 | 58.1 | 1.07 | 0.93 | 0.90 | 0.139 |
| Teshikaga | 4760.5 | 1084.9 | 62.8 | 1.03 | 0.97 | 0.97 | 0.053 |
| Akankohan | 5175.3 | 962.7 | 49.7 | 1.12 | 0.86 | 0.77 | 0.296 |
| Shibecha | 4670.9 | 1103.0 | 62.9 | 1.01 | 0.98 | 0.98 | 0.033 |
| Tsurui | 4533.9 | 1147.8 | 64.4 | 0.98 | 1.02 | 1.00 | 0.028 |
| Nakateshibetsu (representative point) | 4664.2 | 1123.7 | 65.2 | 1.01 | 1.00 | 1.01 | 0.014 |
| Sakakimachi | 4563.0 | 1162.7 | 65.6 | 0.99 | 1.03 | 1.02 | 0.040 |
| Ota | 4488.7 | 1137.6 | 64.9 | 0.97 | 1.01 | 1.01 | 0.031 |
| Shiranuka | 4583.4 | 1176.3 | 69.1 | 0.99 | 1.05 | 1.07 | 0.085 |
| Kitamiesashi | 4448.8 | 1153.9 | 72.0 | 0.96 | 1.03 | 1.12 | 0.125 |
| Kushiro | 4264.2 | 1207.5 | 70.5 | 0.92 | 1.07 | 1.09 | 0.141 |
| Chipomanai | 4437.5 | 1153.0 | 67.8 | 0.96 | 1.03 | 1.05 | 0.069 |
| Average | 4619.5 | 1124.2 | 64.5 |
| Representative Point | Representative Point | Representative Point | |||
|---|---|---|---|---|---|
| 1 | CHN_Nei.Mongol.Abag.Qi.Hot | 31 | CHN_Shaanxi.Luochuan | 61 | CHN_Hunan.Nanxian |
| 2 | CHN_Qinghai.Gangca | 32 | CHN_Xinjiang.Uygur.Ruoqiang | 62 | CHN_Hubei.Yichang |
| 3 | CHN_Gansu.Wushaoling | 33 | CHN_Gansu.Lanzhou | 63 | CHN_Guizhou.Guiyang |
| 4 | CHN_Nei.Mongol.Manzhouli | 34 | CHN_Sichuan.Barkam | 64 | CHN_Sichuan.Huili |
| 5 | CHN_Heilongjiang.Huma | 35 | JPN_Ikari | 65 | JPN_Shimabara |
| 6 | CHN_Heilongjiang.Jiamusi | 36 | JPN_Oma | 66 | JPN_Kochi |
| 7 | CHN_Qinghai.Mangnai | 37 | JPN_Kumaishi | 67 | JPN_Shibushi |
| 8 | CHN_Qinghai.Yushu | 38 | JPN_Yuze | 68 | CHN_Hunan.Changsha |
| 9 | CHN_Heilongjiang.Harbin | 39 | CHN_Kinjiang.Uyhur.Hotan | 69 | JPN_Kamigoto |
| 10 | CHN_Sichuan.Litang | 40 | CHN_Xinjiang.Uygur.Shache | 70 | CHN_Chongqing.Shapingba |
| 11 | CHN_Heilongjiang.Suifenhe | 41 | JPN_Iijima | 71 | CHN_Jiangxi.Nanchang |
| 12 | CHN_Xinjiang.Uygur.Altay | 42 | CHN_Beijing.Beijing | 72 | CHN_Guizhou.Xingyi |
| 13 | CHN_Heilongjiang.Fuyu | 43 | JPN_Ikawa | 73 | CHN_Sichuan.Leshan |
| 14 | JPN_Nukabira | 44 | JPN_Yamagata | 74 | CHN_Yunnan.Lincang |
| 15 | JPN_Akankohan | 45 | JPN_Akana | 75 | JPN_Ashizuri |
| 16 | CHN_Nei.Mongol.Tongliao | 46 | JPN_Oguni | 76 | CHN_Fujian.Congwu |
| 17 | CHN_Nei.Mongol.Kailu | 47 | JPN_Katsunuma | 77 | CHN_Fujian.Yongan |
| 18 | CHN_Nei.Mongol.Tongliao | 48 | KOR_Kwangju | 78 | CHN_Fujian.Shanghang |
| 19 | JPN_Sarabetsu | 49 | JPN_Kito | 79 | CHN_Fujian.Fuzhou |
| 20 | JPN_Shibecha | 50 | KOR_Daegu | 80 | CHN_Yunnan.Lancang |
| 21 | JPN_Utanobori | 51 | JPN_Niigata | 81 | JPN_Kin |
| 22 | CHN_Tibet.Lhasa | 52 | JPN_Hamochi | 82 | JPN_Miyakojima |
| 23 | CHN_Tibet.Qamdo | 53 | JPN_Awashima | 83 | JPN_Isen |
| 24 | CHN_Gansu.Minqin | 54 | CHN_Guizhou.Bijie | 84 | JPN_Iriomotejima |
| 25 | CHN_Hebei.Chengde | 55 | CHN_Sichuan.Batang | 85 | JPN_Itokazu |
| 26 | CHN_Xinjiang.Uygur.Tacheng | 56 | JPN_Bungotakata | 86 | CHN_Guangxi.Zhuang.Longzhou |
| 27 | CHN_Hebei.Fengning | 57 | JPN_Kikuchi | 87 | CHN_Guangdong.Guangzhou |
| 28 | JPN_Kushiro | 58 | JPN_Saita | 88 | CHN_Guangxi.Zhuang.Duan |
| 29 | JPN_Shinshinotsu | 59 | CHN_Guizhou.Guiyang | ||
| 30 | JPN_Kutsugata | 60 | CHN_Hubei.Zhongxiang | ||
© 2019 by the authors. Licensee MDPI, Basel, Switzerland. This article is an open access article distributed under the terms and conditions of the Creative Commons Attribution (CC BY) license (http://creativecommons.org/licenses/by/4.0/).
Share and Cite
Choi, Y.; Kim, H.B. Climate Classification for the Use of Solar Thermal Systems in East Asia. Energies 2019, 12, 2286. https://doi.org/10.3390/en12122286
Choi Y, Kim HB. Climate Classification for the Use of Solar Thermal Systems in East Asia. Energies. 2019; 12(12):2286. https://doi.org/10.3390/en12122286
Chicago/Turabian StyleChoi, Youngjin, and Hyun Bae Kim. 2019. "Climate Classification for the Use of Solar Thermal Systems in East Asia" Energies 12, no. 12: 2286. https://doi.org/10.3390/en12122286
APA StyleChoi, Y., & Kim, H. B. (2019). Climate Classification for the Use of Solar Thermal Systems in East Asia. Energies, 12(12), 2286. https://doi.org/10.3390/en12122286