Article

Classification of Renewable Sources of Electricity in the Context of Sustainable Development of the New EU Member States

1
Department of Quantitative Methods, The Faculty of Management, Rzeszow University of Technology, 35-959 Rzeszow, Poland
2
Department of Economics and Economy, Faculty of Social Economics Relationships, Alexander Dubcek University of Trencin, 911 50 Trencin, Slovakia
3
Department of Business Informatics and Mathematics, Tyumen Industrial University, 625000 Tyumen, Russia
*
Author to whom correspondence should be addressed.
Energies 2019, 12(12), 2271; https://doi.org/10.3390/en12122271
Submission received: 12 May 2019 / Revised: 28 May 2019 / Accepted: 10 June 2019 / Published: 13 June 2019
(This article belongs to the Special Issue Market Design for a High-Renewables Electricity System)

Abstract

:
Climate change and awareness of the need to care for the environment have resulted in a global increase in the interest in renewable energy sources. The European Union (EU) is active in this respect and requires Member States to fulfill specific plans in the transformation of their energy systems. We employed hierarchical cluster analysis in an attempt to distinguish those countries among the new EU Member States that increased their electrical capacity from renewable energy sources to the greatest extent while paying attention to their energy intensity. The analyses were conducted in two scenarios for both 2004 and 2016. The first scenario assumed an analysis of all known renewable energy sources, whereas in the second scenario, only renewable energy sources from wind and solar power plants were included. The division of analyses into these two variants showed the importance of the differences in the energy assessment of individual countries, depending on classification of renewable energy sources. We identified groups of countries where electrical capacity from renewable energy sources increased the most. Conducting analyses using two variants allowed distinguishing countries that based most of their renewable energy on modern renewable energy sources, such as solar and wind power plants. The inclusion of gross domestic product in the analyses allowed us to identify countries with the worst energy efficiency value.

1. Introduction

Electricity is the basis for the functioning of the modern world, but its acquisition is often not environmentally friendly. Nearly 200 years have passed since the beginning of the industrial revolution, but many countries still base their energy on fossil fuels [1,2,3]. Along with an increase in ecological awareness, many countries are aiming to reduce human interference in the natural environment and obtain energy from renewable sources. Wind energy, solar radiation, precipitation, tides, sea waves, and geothermal energy are considered renewable energy sources [4,5]. Biofuels, biomass, and biogas are also considered renewable energy sources if their origin is ecological, but their conversion into energy through combustion is not [6,7]. Similarly, the qualification of hydroelectric power plants as renewable energy sources is controversial. Large hydroelectric plants have a negative impact on the environment [8,9,10,11,12,13,14,15,16], and for this reason, as in case of biofuels, they are often not included in studies on renewable energy sources [17,18,19,20,21,22].
Many factors impact the introduction of pro-ecological solutions into the energy policy of states. Apart from the most obvious, such as the level of economic development and the volume of energy production, there are also important geographical determinants [23,24] or social acceptance factors of renewable energy prices must be considered [25,26,27]. In the literature, these factors are often analyzed in pairs or groups, e.g., gross domestic product (GDP) and CO2 emissions [28,29,30,31,32,33].
Regardless of the region of the world, the majority of energy demand forecasts show that demand will grow in the within several years or even a few decades [3,34,35,36,37,38,39,40,41,42]. Various studies show a relationship between economic development and energy demand. Most of the papers indicate that economic growth determines energy demand, which is referred to as the “conservation hypothesis” [43,44,45,46,47,48,49]. The “growth hypothesis” states that economic growth depends on energy production, but, as research shows, economic growth happens when a government policy leads to an excessive reduction of energy consumption [38,50,51,52,53]. Regardless of which of the listed factors is a determinant, individual countries need to implement a sustainable growth policy that maintains a balance between the development of countries and regions and the demand for energy [24,54,55,56,57,58,59,60]. International commitments and growing environmental awareness result in the same countries often deciding to subsidize investments in renewable energy sources to ensure uninterrupted energy supply to customers, and to simultaneously to provide green energy [2,61,62,63,64,65]. Notably, subsidies do not include hydroelectric power plants because they cannot always be considered environmentally friendly and, due to the need to diversify energy sources, do not fit into sustainable development policy [10,17,18,66].
In Europe, the need to reduce energy consumption and care for the environment started being widely discussed in the late 1960s [67,68,69]. The oil crises of 1973–1974 and 1979–1982 contributed to discussions on the common energy market, which was reflected in the Treaty of Lisbon in 1992. The four main assumptions of the common energy policy were contained in Article 194 of the Treaty on the Functioning of the European Union (TFEU) and they concerned: guaranteeing the functioning of the energy market; guaranteeing energy supplies to European Union (EU) countries; promoting energy efficiency and development of new, renewable energy sources of energy; and promoting inter-state energy connections.
In subsequent years, further documents and directives were published, e.g., Green Paper, White Paper, and Directives 96/92/EC and 98/30/EC, aimed at regulating the common energy market in the EU, considering the specific energy markets of individual Member States. The low effectiveness in the implementation of new laws in the Member States and the largest enlargement of the EU in history in 2004 created a need to develop a new law that would effectively regulate the common energy market. The Directive of 2009 imposed an obligation on Member States to reduce greenhouse gas emissions considering the structure of energy systems of individual countries and the level of their economic development.
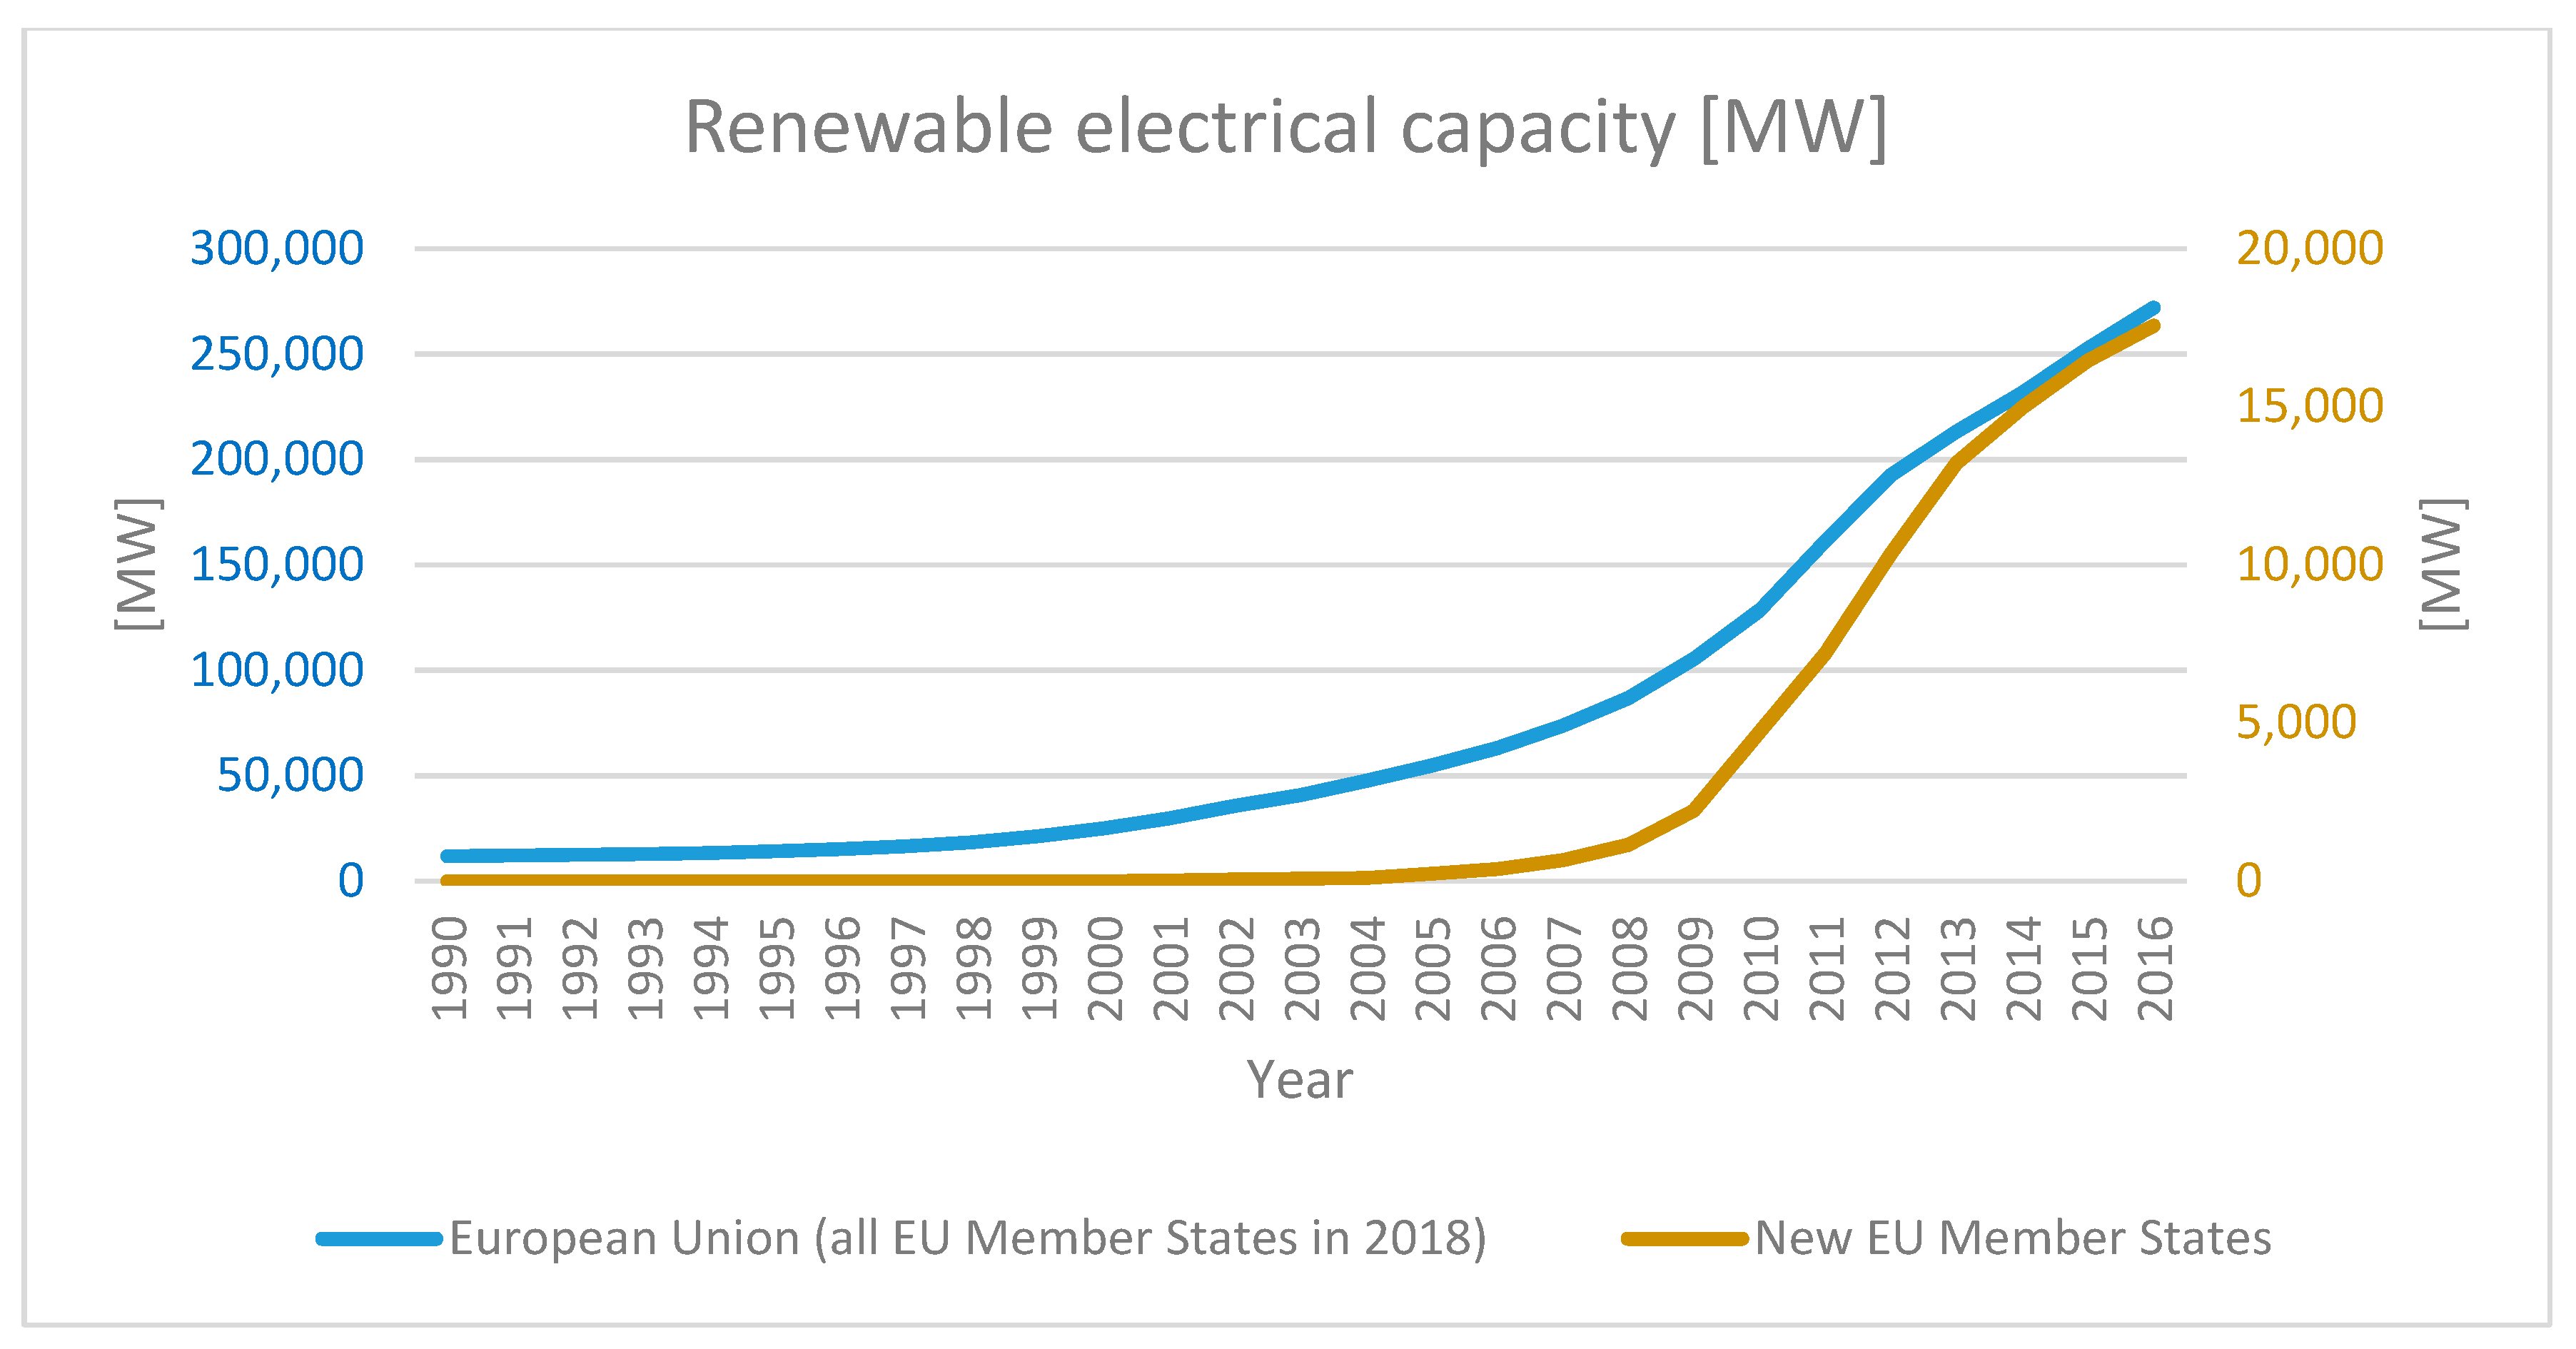
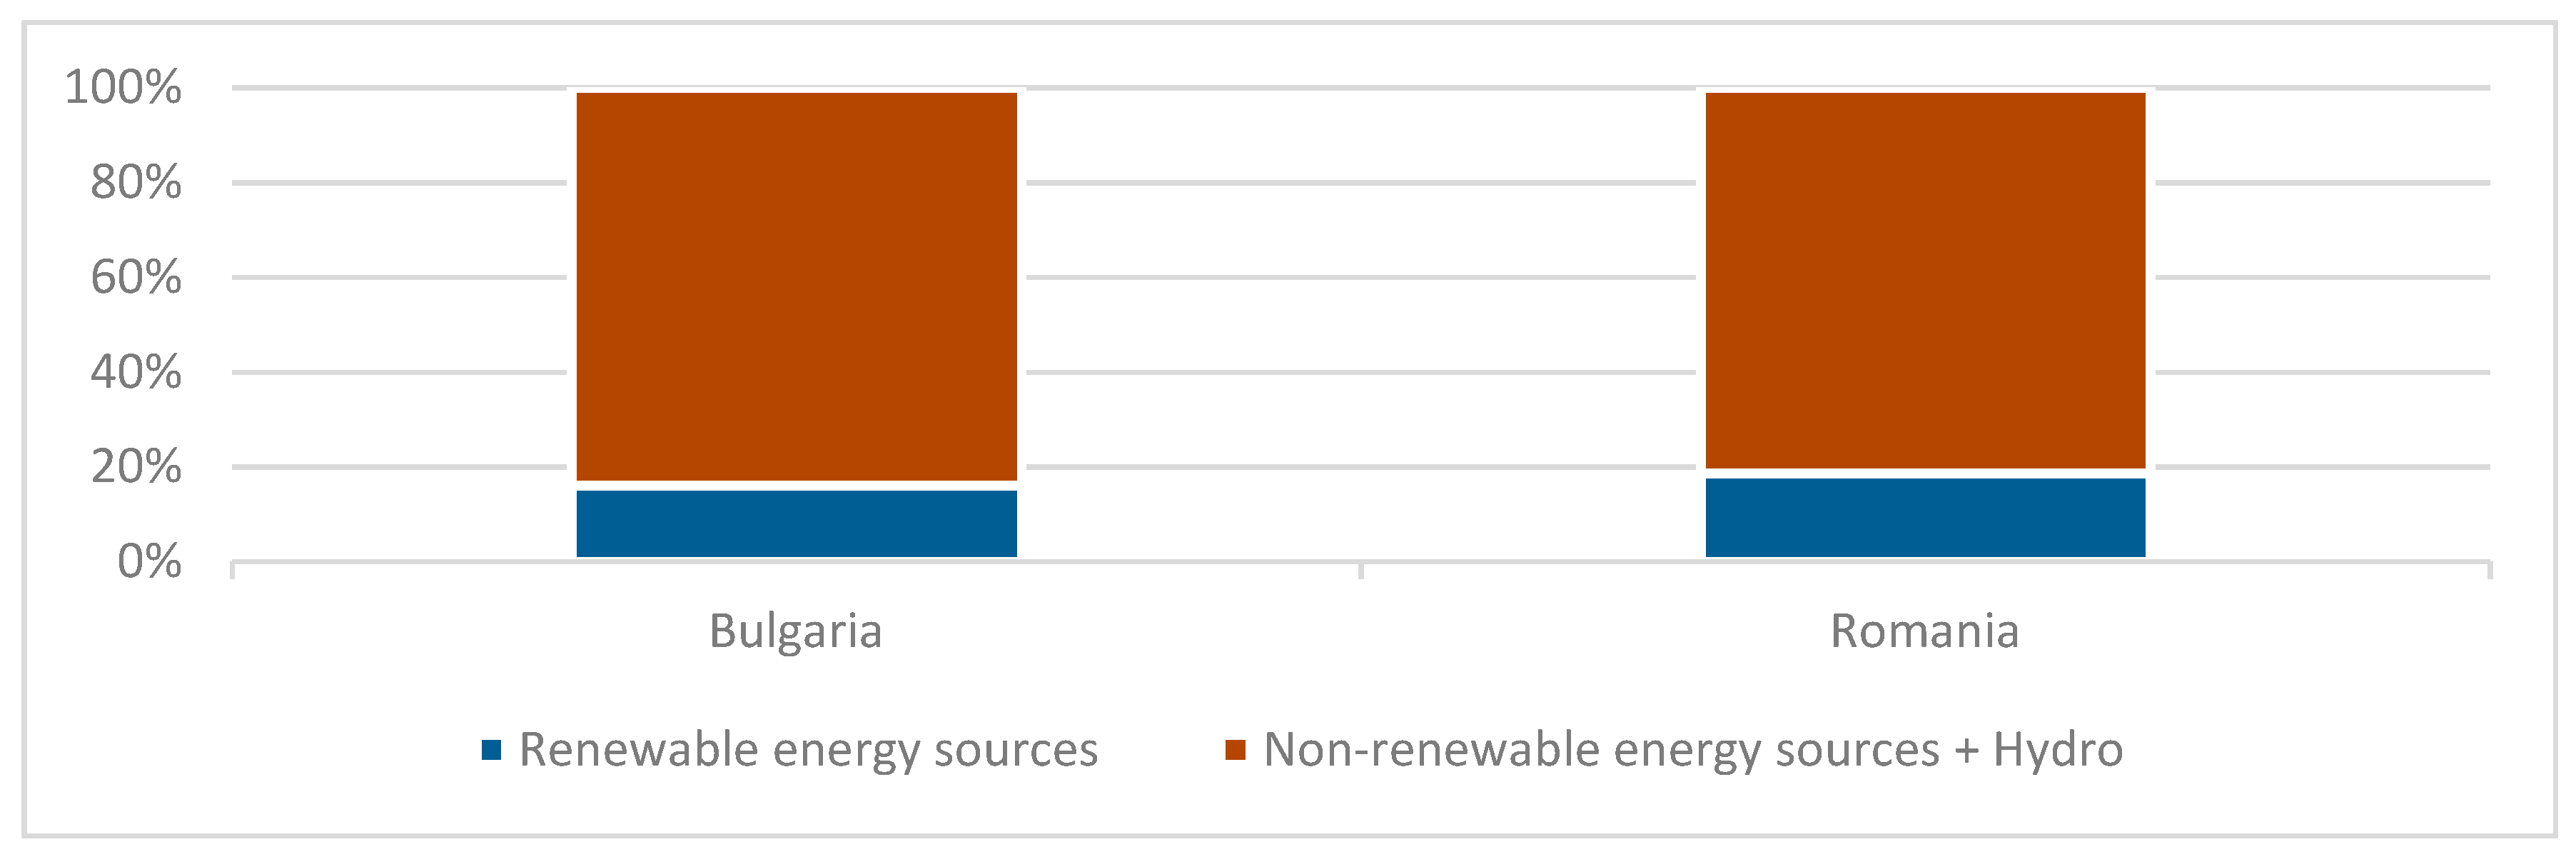
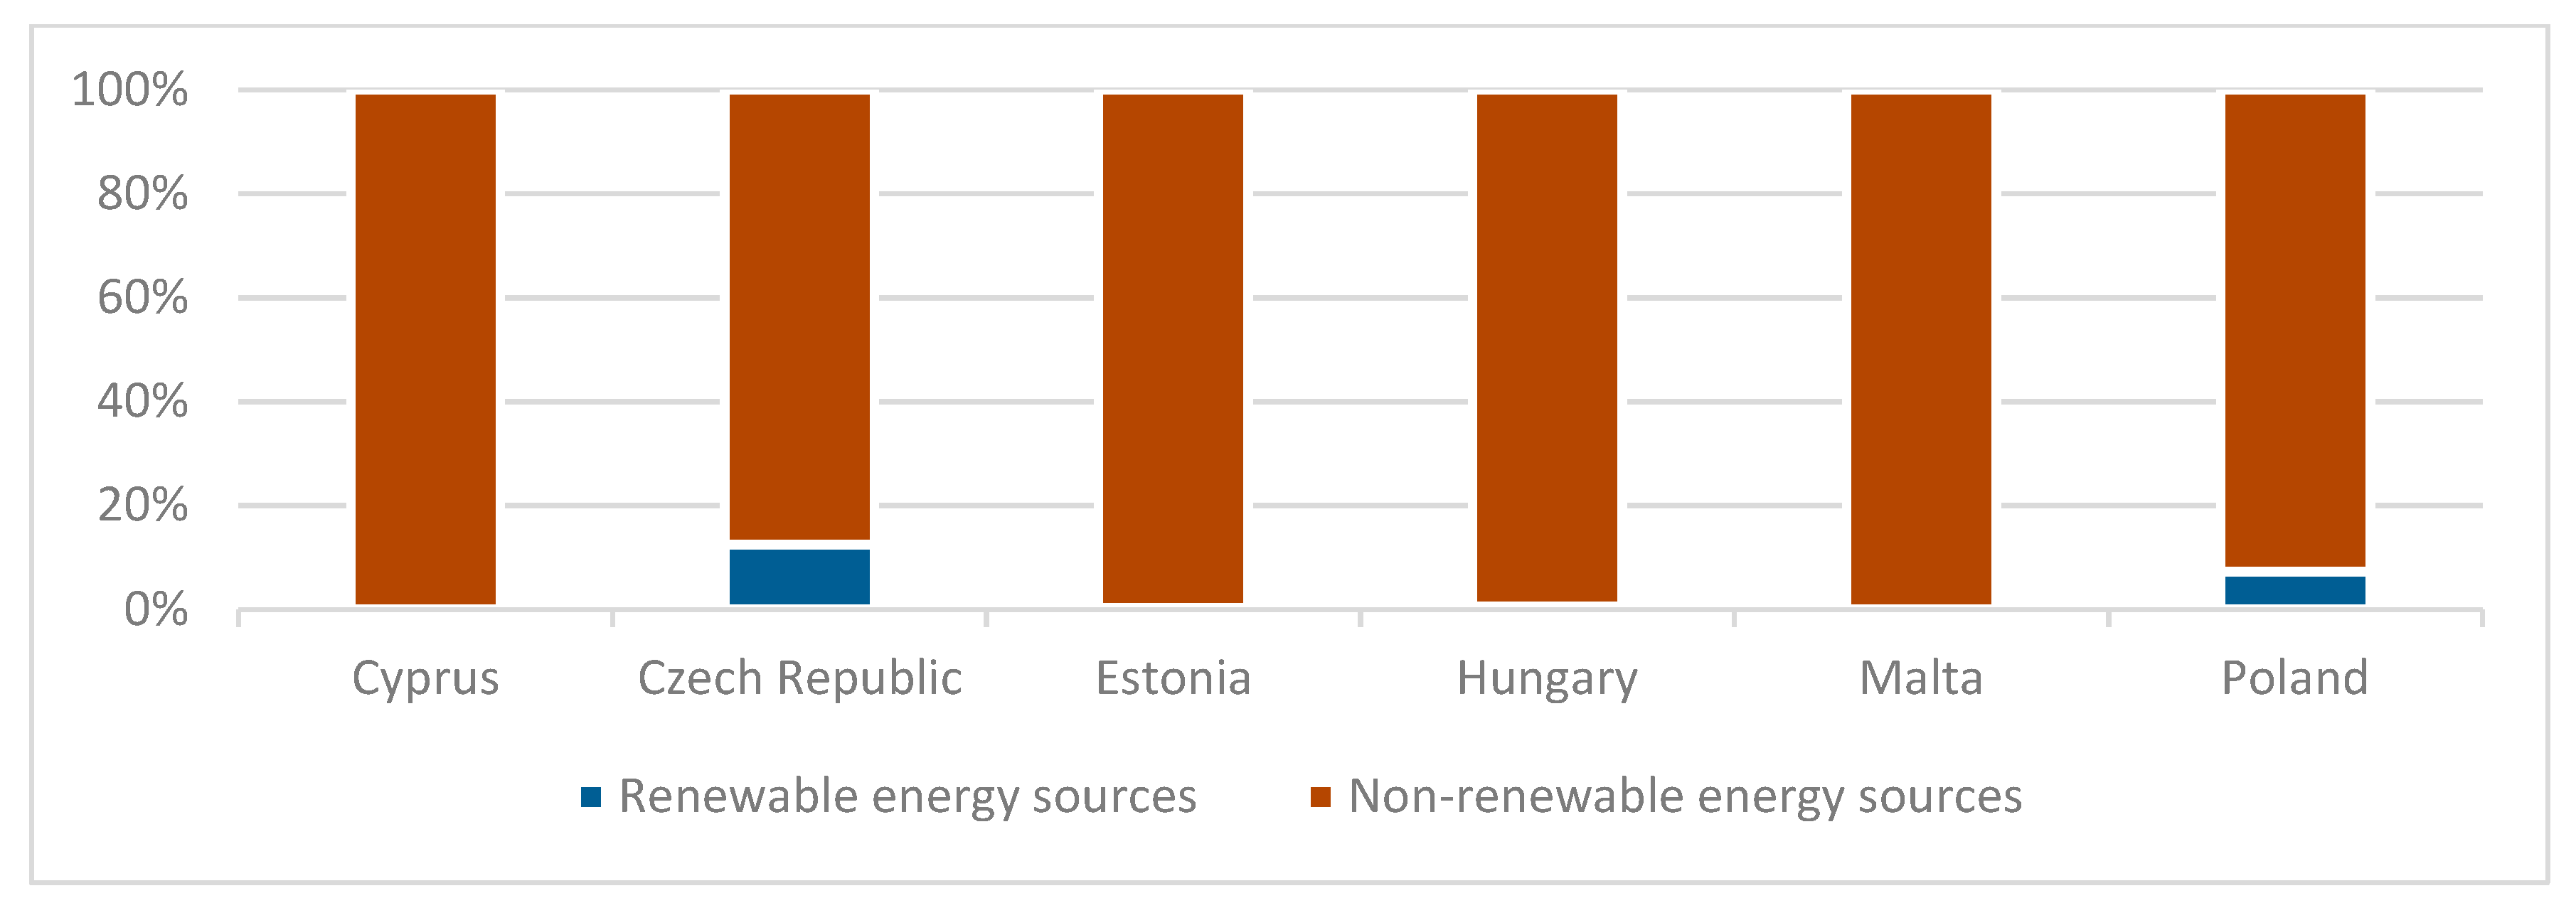
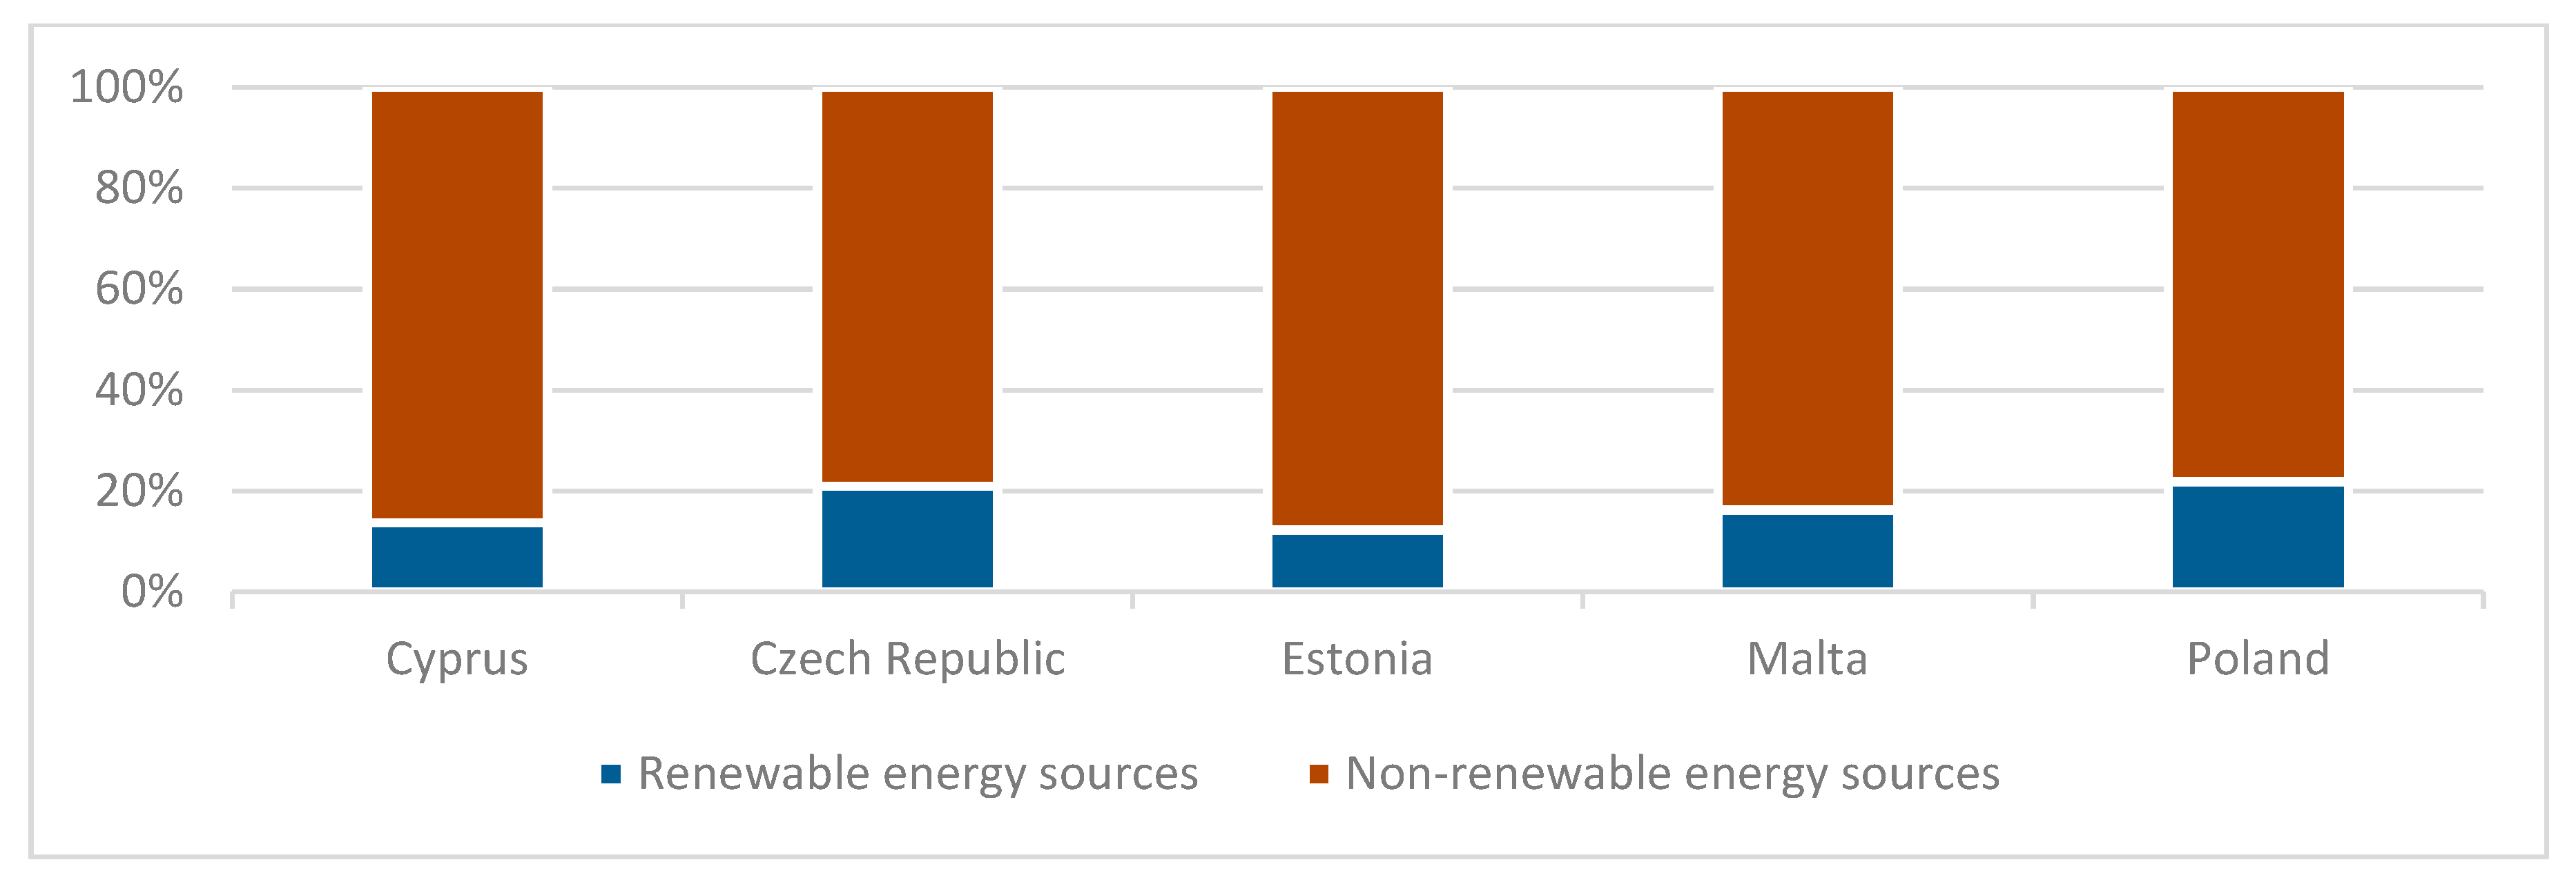
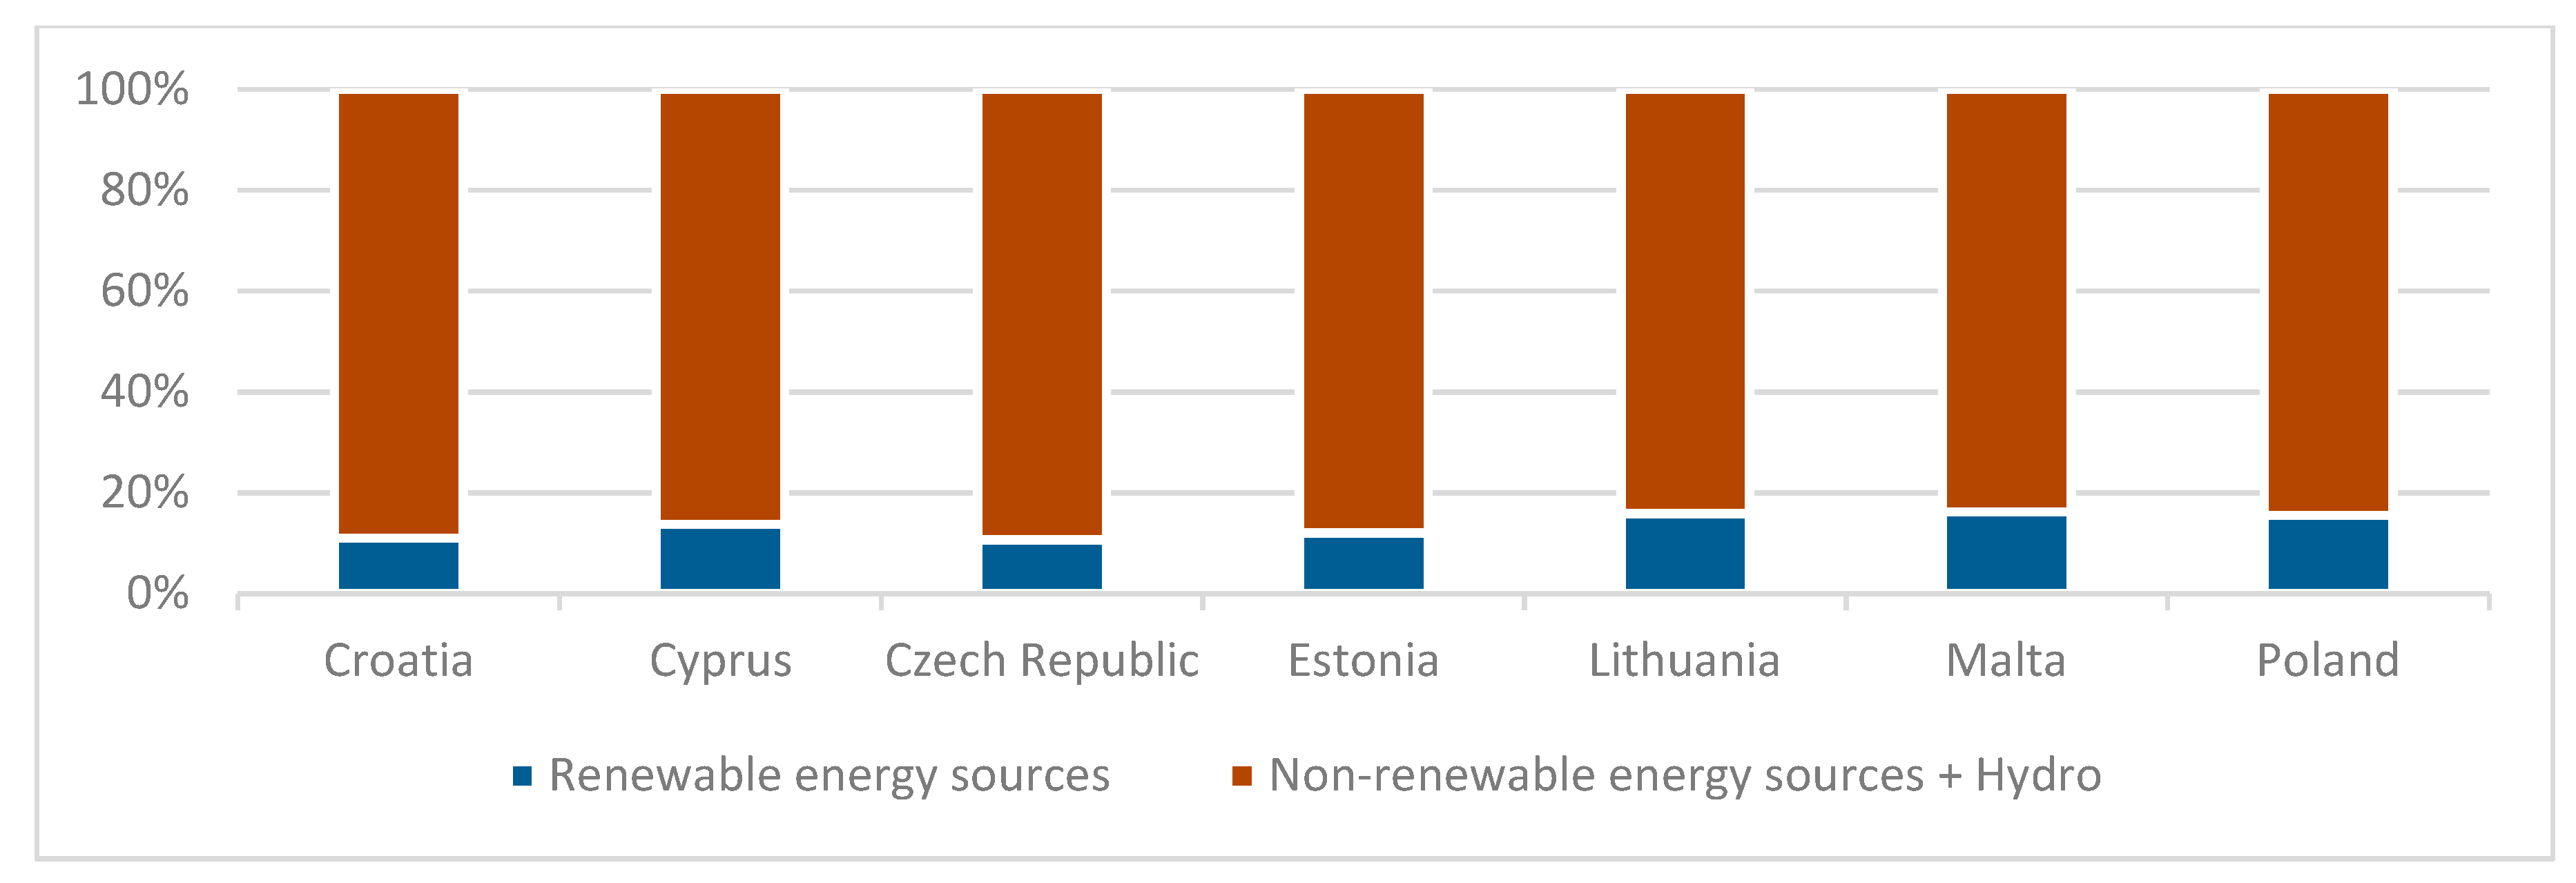
The presented legal regulations are reflected in data on renewable energy sources in EU. The data show that at the beginning of the 21st century, the energy infrastructure was modernized to a greater extent so that it would be less harmful to the environment [1]. This is visible for the entire EU and even more so among its new Member States, as shown in Figure 1. This chart includes the aggregated capacity of renewable energy sources from wind and solar power plants.
As mentioned above, the EU, while regulating the common energy market, pays special attention to caring for the natural environment, but simultaneously understands that the energy markets and economies of individual countries differ. It is important to consider these differences in requirements for individual countries as, for example, in Central and Eastern European countries, (CEECs) rapid growth of energy production from renewable sources to the level in richer countries of Western Europe cannot be expected. Germany, for example, produces 42% of electricity from renewable sources [25]. Not only is the level of wealth of a given country significant, as measured by GDP, but also the initial structure of renewable energy shares in all types of energy sources. The ratio of energy to gross domestic product (E/GDP), i.e., energy intensity, is also important [35,54,71,72,73,74,75,76]. This factor describes the energy efficiency of the state’s economy and indicates the cost of converting energy to GDP. The values of these factors differ significantly between the countries of Western Europe and Central and Eastern Europe and change dynamically over time. The best example for comparison is Germany and Romania. In 1992, energy intensity in Romania was four times higher than in Germany, and in 2013, it was only twice as much [
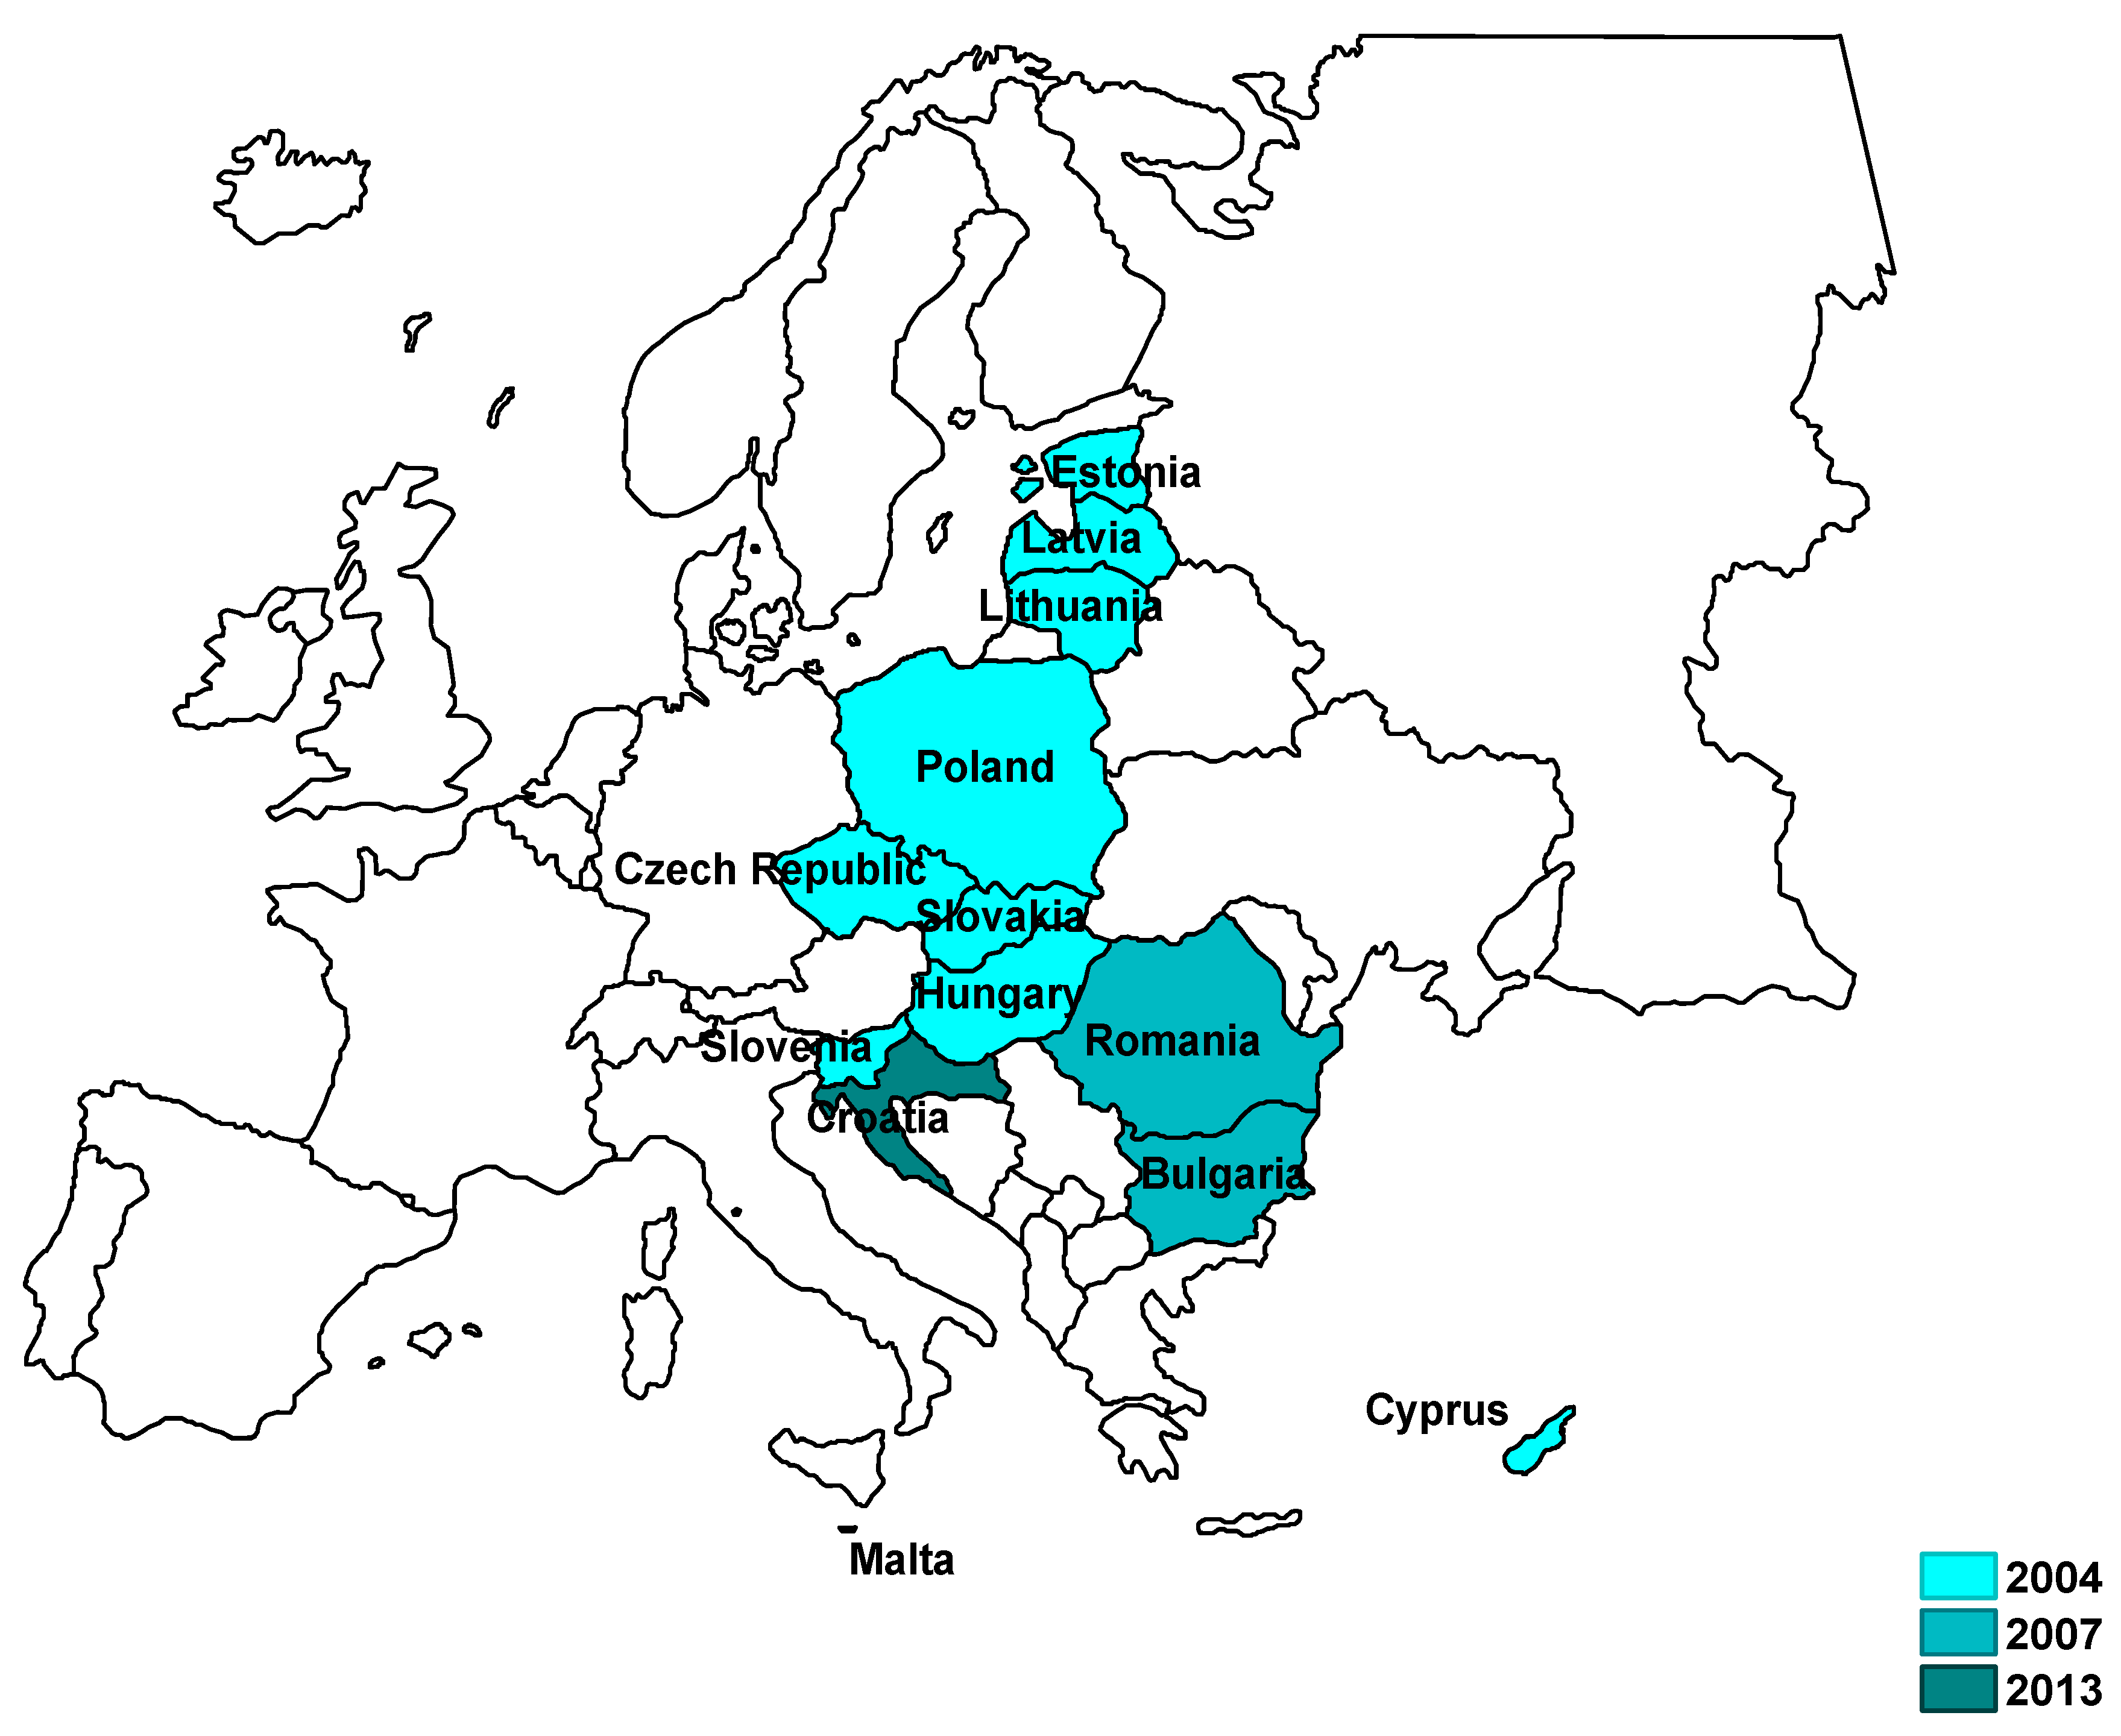
35]. Countries that joined the EU in 2004 and subsequent years [77,78] are significantly different from the older Member States of the EU. Differences are related to many aspects, among which the most important from the point of view of this paper are the level of economic development and the structure of energy sources. The GDP of new Member States of the EU was much lower than that of the Member States of the EU from Western Europe [79,80], and with few exceptions, combustible fuels were the main sources of energy for new EU Member States [81,82,
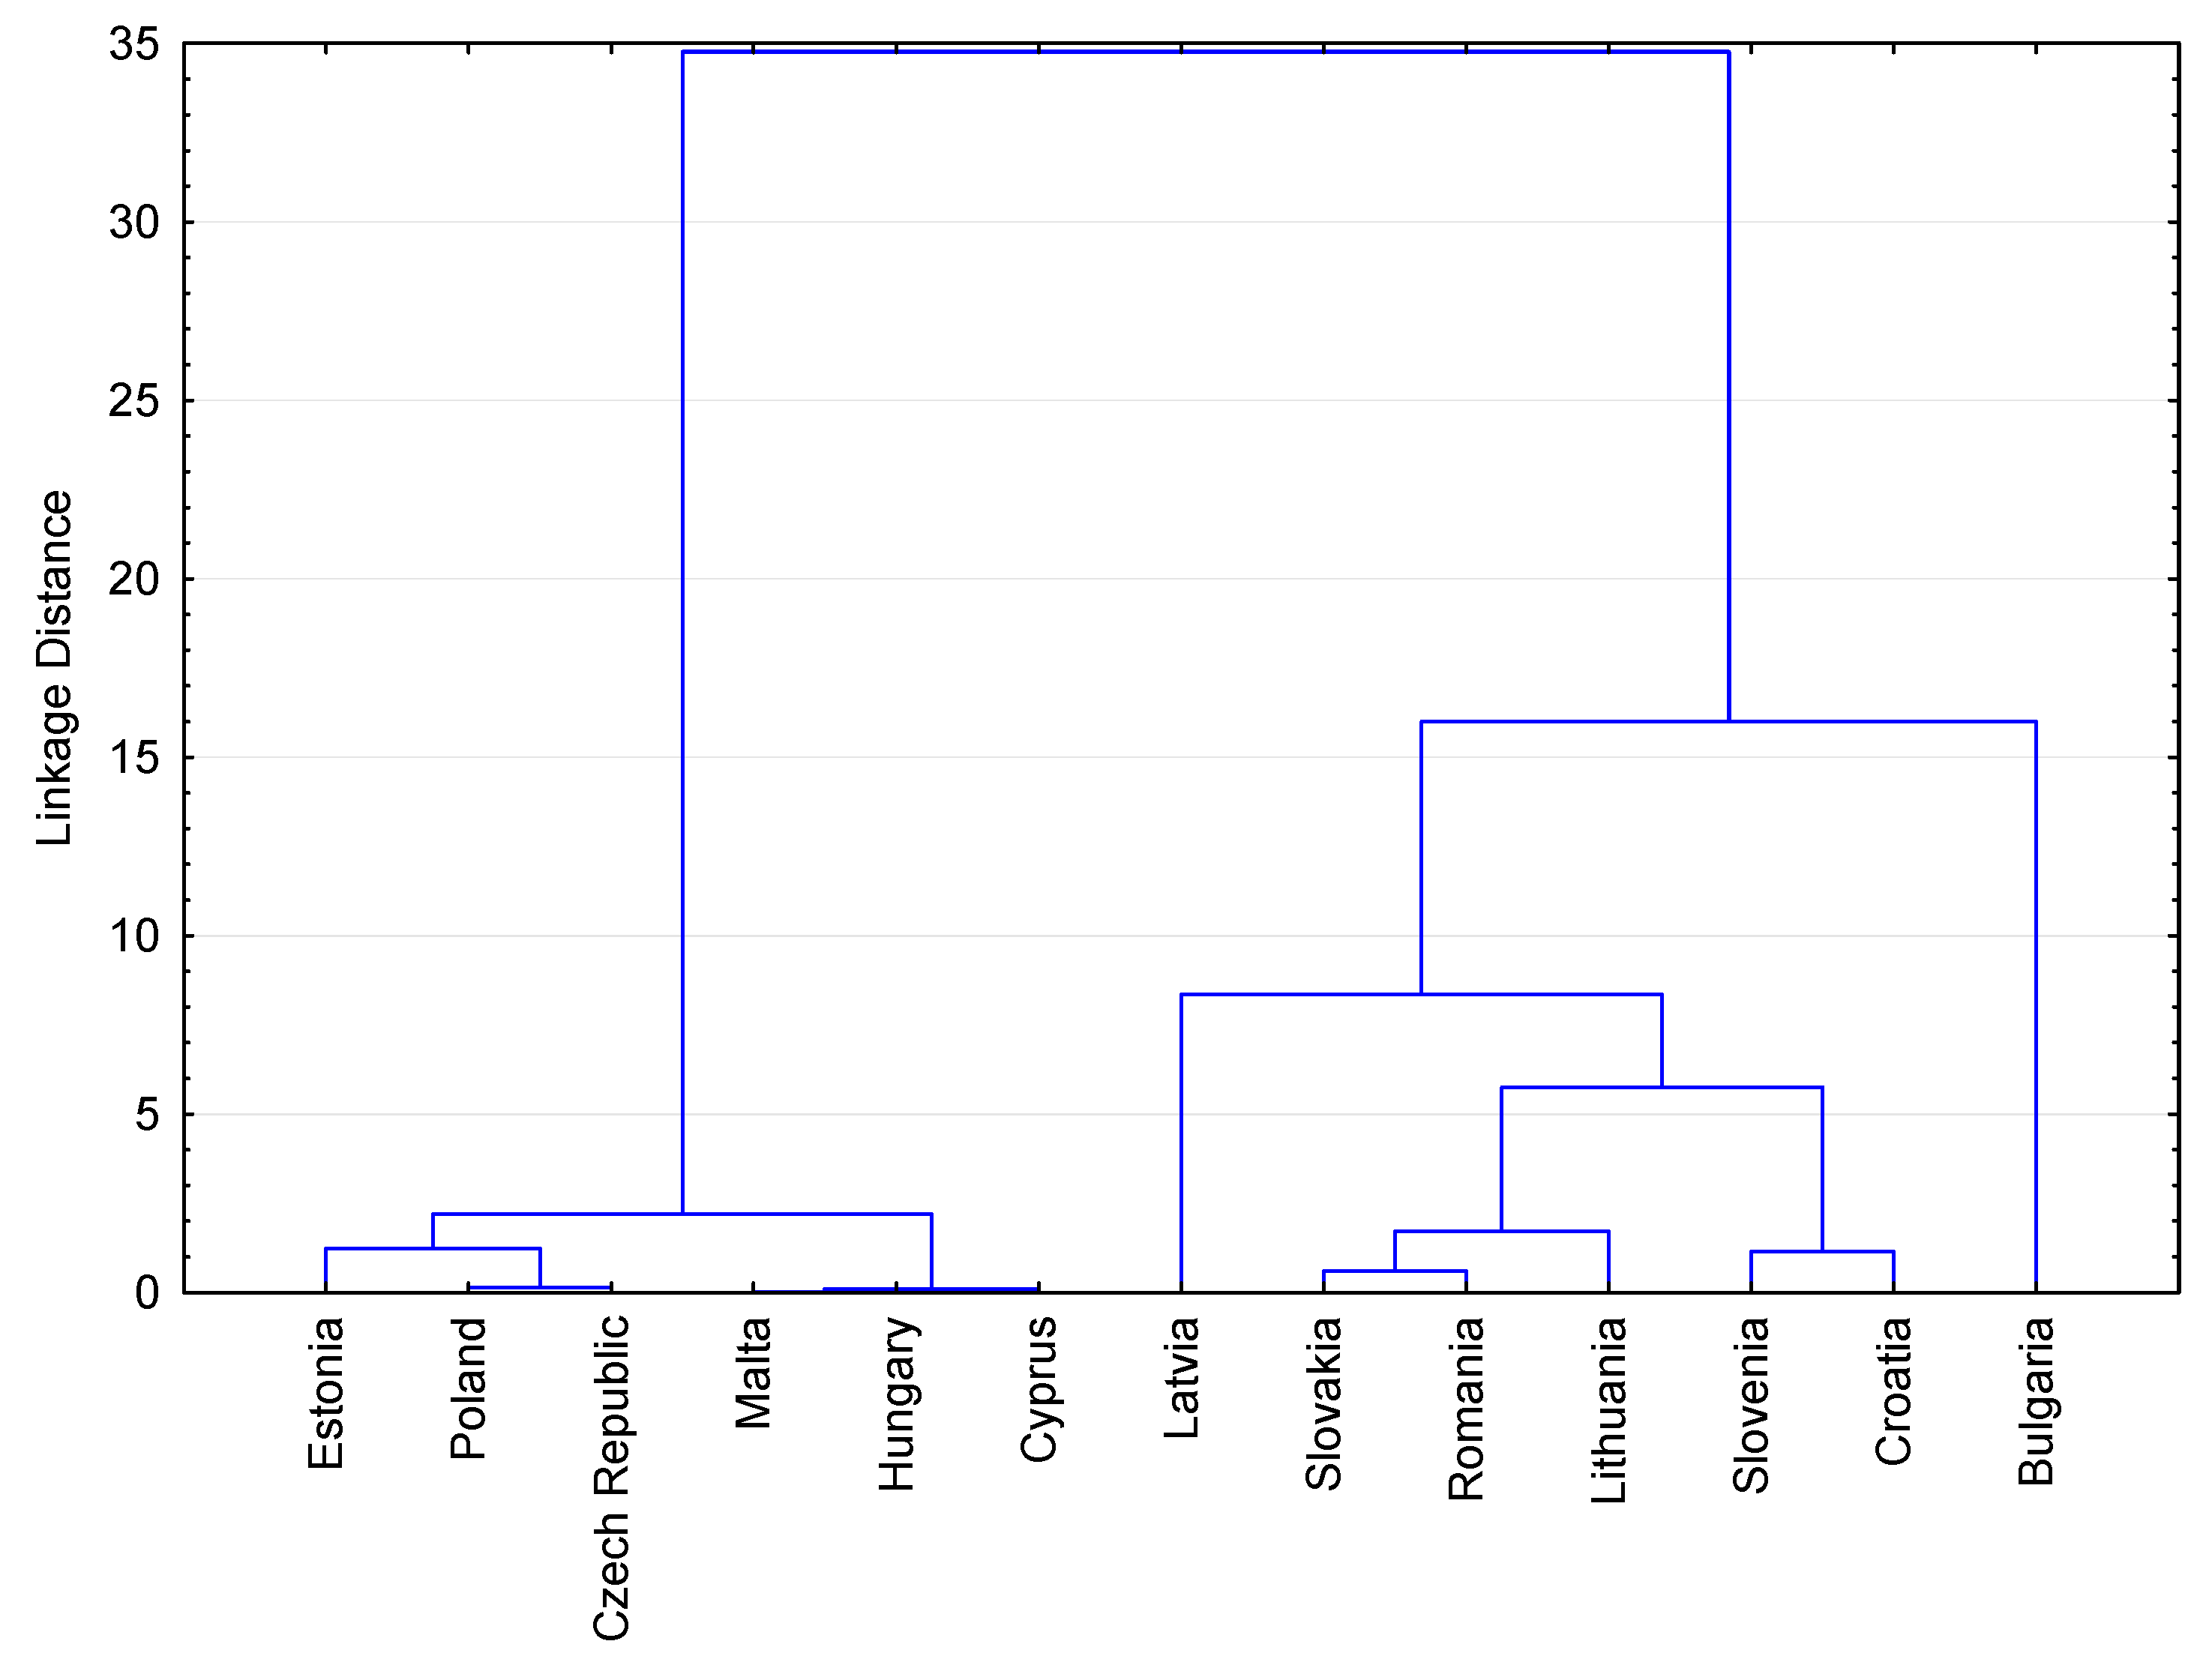
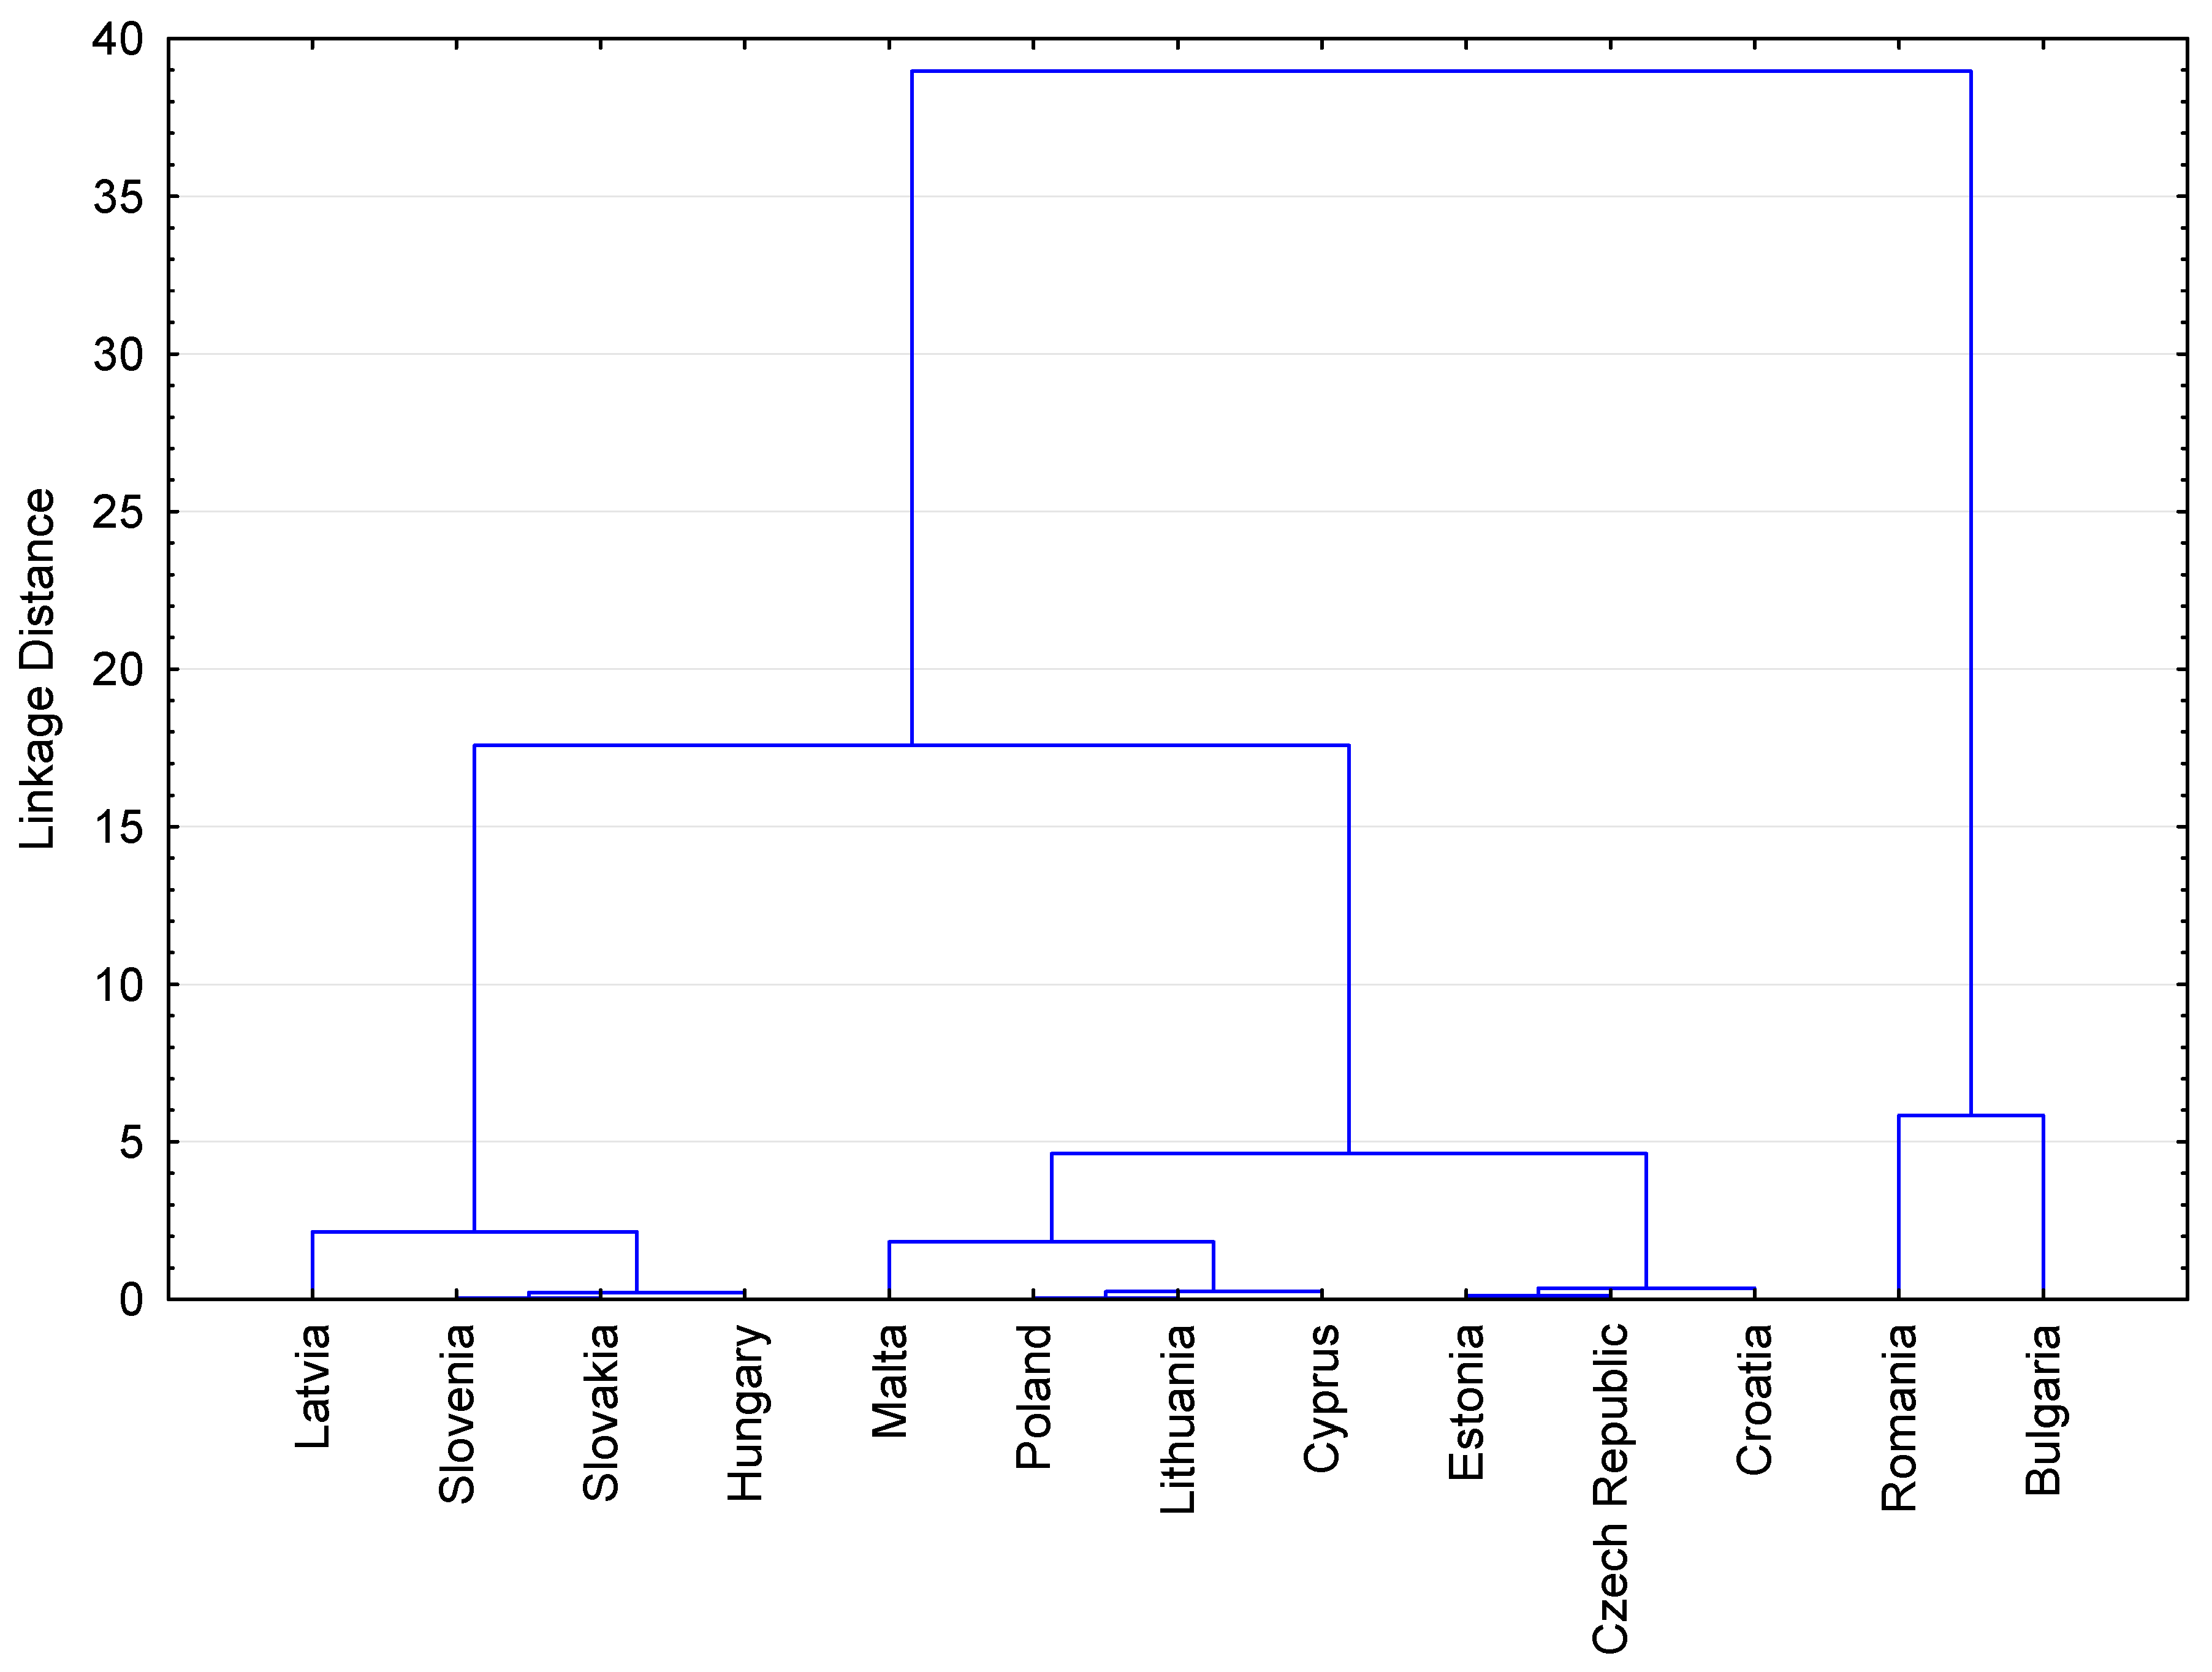
83]. For this reason, we focused on analyzing renewable energy sources against the background of economic growth only among new Member States of the EU. The sources of renewable energy were analyzed using two variants. In the first, all officially recognized renewable energy sources were considered as renewable energy sources. In the second variant, to remove the impact of the hydroelectric power stations built several dozens of years ago, only wind and solar power plants were accepted as renewable sources. Both options for the classification of renewable energy sources were analyzed for 2004 and 2016 to determine the level of change. The tests were performed with an application of cluster analysis [84,85,86,87], enabling us to create groups of countries similar to each other in terms of renewable energy sources and GDP in 2004 and 2016.
In the literature, many publications have separately analyzed renewable energy sources as a whole or individually. A novelty in our article is a comparative analysis that considered the different classifications of renewable energy sources. As such, we were able to determine the differences in the energy assessment of individual countries, depending on the classification of renewable energy sources. Separation of modern energy sources from all energy sources in comparison with the GDP also enabled an assessment of the energy efficiency from these renewable energy sources.

2. Materials and Methods

2.1. Data

We analyzed the changes in the capacity of the electrical infrastructure with a special focus on renewable energy sources and their relationship with GDP. The analysis included countries that have been Member States of the EU since 2004. The largest number of countries joined the EU on May 1, 2004: Cyprus, the Czech Republic, Estonia, Hungary, Latvia, Lithuania, Malta, Poland, Slovakia, and Slovenia. On January 1, 2007, Bulgaria and Romania joined, as did Croatia on July 1, 2013. Since 2004, the EU expanded by 13 countries; the main ones were from Central and Eastern Europe, as presented in Figure 2.
The analyzed data included the capacity of the electrical infrastructure and the GDP of the aforementioned countries, and they were collected from Eurostat websites [70,88]. We are aware of possible errors during the process of data sampling [89]; therefore, the data were collected and verified again after a few weeks. The data have annual periodicity. Recent data on electrical infrastructure (accessed on June 14, 2018) were from 2016, and GDP data were from 2017. Therefore, the surveys included a 13-year period from 2004 to 2016. The data on the capacity of the electrical infrastructure are expressed in megawatts (MW), and GDP at current prices in million euro.

2.2. Methodology

For data sets that contain different features, clustering can be used to compare them [84]. A taxonomic analysis was used to designate groups of countries similar in terms of the capacity of the electrical infrastructure and share in the GDP [85] using Ward’s clustering, which is a hierarchical method [86]. This method, which is an agglomerative clustering method, is one of the best, through which homogeneous aggregates can be obtained.
In this method, at the beginning, it is assumed that each observation vector is a separate cluster. Then, between all pairs of vectors in Equations (1) and (2), using the squared Euclidean distance (SED) in Equation (3), a distance matrix is determined, using Equation (4), which describes their similarity.
a = [ a 1 , , a i ]
  b = [ b 1 , , b i ]
where a and b are the observation vector
d ( a , b ) = i = 1 p ( a i b i ) 2
where p denotes the number of variables (vector length).
d ( a , b ) = [ 0 d 12 d 1 n d 21 0 d 2 n d n 1 d n 2 0 ]
where dij is the distance between the ith and the jth observation
The above distance matrix is based on physical space. This is reminiscent of the topological distance matrix based on network structures [90,91]. Clusters (groups) are created by applying one of several available grouping methods on the distance matrix [92,93,94]. In Ward’s method, the distance between clusters is estimated by an analysis of variance. It is assumed that each cluster is represented by a centroid, as shown in Figure 3.
At each stage of the agglomeration hierarchical grouping process into a new cluster, the two most similar clusters are combined, e.g., A and B (Figure 4), for which there is the smallest increase in the sum of the squared error (SSE):
d ( A , B ) = S S E A B ( S S E A + S S E B )
S S E A B = i = 1 n A B ( y i y A B ¯ ) ( y i y A B ¯ )
S S E A = i = 1 n A ( a i a ¯ ) ( a i a ¯ )
S S E B = i = 1 n B ( b i b ¯ ) ( b i b ¯ )
where ai represents the ith observation vector in cluster A, a ¯ is the centroid of cluster A, bi represents the ith observation vector in cluster B, b ¯ the centroid of cluster B, yi represents the ith observation vector in cluster AB, and y A B ¯ the centroid of newly formed cluster AB.
The minimize function using the Ward minimal variance method can also be written as:
d ( A , B ) = n A n B n A + n B ( a ¯ b ¯ ) ( a ¯ b ¯ )
where a ¯ and b ¯ represent the centroids of clusters A and B, respectively.
The process of determining the distance between clusters and joining them ends when all clusters are combined into one large cluster, e.g., ABCDEF in Figure 4.
Variables analyzed with the use of the Ward’s method should have a coefficient of variation greater than 10% and should not be very strongly correlated. However, leaving variables out that do not meet these criteria for an analysis is allowed if these variables are significant from the point of view of the studied phenomenon.

3. Results

3.1. Cluster Analysis

As mentioned above, the data used for the analyses included the electrical capacity and GDP in the new EU Member States. Their short forms are introduced for the analysis: EC is the Electrical Capacity, which is the sum of the capacity of all types of electricity sources; ECR is the Electrical Capacity Renewable, which is the total capacity of the renewable energy sources by the most commonly used divisions, i.e., hydro, geothermal, wind, and solar; and ECRN denotes Electrical Capacity Renewable New, which is the total capacity of only new types of renewable energy sources, i.e., wind and solar.
Cluster analysis was conducted for the data from the beginning and end of the analyzed period, i.e., 2004 and 2016. For this purpose, the variable designations introduced above were additionally determined for the relevant year: EC2004, ECR2004, ECRN2004, GDP2004, EC2016, ECR2016, ECRN2016, and GDP2016. These variables were used to create indicators describing the ratio of electrical capacity from renewable sources to total electric capacity and the ratio of electrical capacity from renewable sources and all sources in the ratio of GDP, which is referred to in the literature as energy intensity. The developed indicators were divided into those concerning the analysis of all renewable energy sources (indicators renewable energy; IRE) and those that concern only renewable energy sources of new type (indicators renewable energy new; IREN) for both 2004 and 2016, as presented in Table 1 and Table 2.
The above division of indicators allowed us to perform four cluster analyses (two for each of the analyzed years) to check how these groups changed over the period, but also to determine how the type of selected energy influenced the formation of these groups. The coefficients of variation of all indicators presented in Table 3 are 10% above the criterion, which means that they could be used for the cluster analysis.
Correlation coefficients between indicators are presented in Table 4.
The coefficient of correlation only exceeded 90% for the pairs of ECRN2004/GDP2004—ECRN2004/EC2004. However, due to the high volatility of ECRN2004/GDP2004 of 227.0%, ECRN2004/EC2004 of 240.0%, and the need to examine this indicator, it was not rejected. The need to maintain the same set of variables to ensure comparability of results was also an argument for including these indicators. When analyzing the source data for 2004, we confirmed that the resulting correlation is apparent because it resulted from the lack of renewable energy sources of a new type in almost all studied countries, which further affected the almost zero value of the discussed factors. In subsequent years, the electrical capacity from new types of renewable energy sources increased, which confirms the need to retain all indicators to ensure the comparability of groups.
Countries were grouped separately for each year: once for the indicators including all renewable energy sources (IRE), and the second for the indicators where only wind and solar power plants (IRENs) were accepted as renewable energy sources. In total, four analyses were performed, where the division of the optimal number of clusters was determined [40,41]. Statistica 12.5 (TIBCO Software Inc., Palo Alto, CA, USA) was used as a tool to develop clusters.

3.1.1. Groups for IRE Indicators in 2004

In 2004 (and many years before), hydroelectric and geothermal power plants were the most frequently used renewable sources of electricity in the world, and the main source of energy in the Central and Eastern European countries (CEES) was hydroelectric power plants. While grouping such data in 2004, a tree diagram was developed, as shown in Figure 5.
Cutting off the tree diagram at a distance of 10 resulted in three clusters containing countries (Table 5) with the averages of the groups shown in Table 6. The analysis of variance (ANOVA) for the indicators from Table 6 was completed at the 0.05 significance level. The P-value for each of the indicators is smaller than the assumed level of significance, which means statistically significant differences exist between the groups of countries listed in Table 5.
To compare groups, on the basis of Table 6, the values of indicators in each group were determined in relation to the general average, as shown in Figure 6.
When using cluster analysis for traditional renewable energy sources, three clusters were created for the IRE data in 2004. In Table 5, groups A and B contain six countries, while group C only contains Bulgaria. When analyzing Figure 6, in this group (and the only country in this group), renewable energy sources (ECR2004/EC2004) mean that it is ranked in the middle of the surveyed countries. However, high energy intensity (EC2004/GDP2004 and ECR2004/GDP2004) was the main reason for the creation of this group, which means high energy costs are responsible for generating the GDP of Bulgaria. Groups A and B are opposites in terms of traditional, renewable energy sources. Group A included countries whose main sources of electricity were non-renewable energy sources, and renewable energy sources accounted for only a small percentage of all electrical capacity or none at all, as shown in Figure 7.
In the countries from group B, traditional renewable energy sources accounted for for several dozen percent of all electricity sources, and the cost of electricity converted into GDP was moderate. This means that group B is the most ecological group of countries according to the assumed criterion for 2004.

3.1.2. Groups for IRE Indicators in 2016

After joining the EU, new countries are obliged to implement a pro-ecological policy. For example, the Directive 2009/29/EC obliged Member States to reduce greenhouse gas emissions. With the increasing demand for electricity and restrictions resulting from EU directives, the most reasonable solution was to increase the electrical infrastructure capacity through investments in renewable energy sources. Treating all types of renewable energy sources in the same way and subjecting the countries to a re-analysis of clusters for 2016, a tree diagram was produced, as shown in Figure 8.
By cutting off the tree diagram at a distance of 10 for 2016 and 2004, three clusters re-emerged. Countries belonging to individual groups and average values in these groups are listed in Table 7 and Table 8.
The differences between groups are statistically significant, as demonstrated in the analysis of variance (p-value in Table 8). The values of the indicators in the groups in relation to the average of all groups are presented in Figure 9.
When comparing the results of the clustering analysis for 2016 with previously obtained results from 2004, no major changes are visible. The number of created groups is the same and their composition is identical. When comparing Figure 9 with its counterpart for data from 13 years ago (Figure 6), the similarities are noticeable. When analyzing Figure 9 more precisely, the biggest change is visible in group A, where the share of electrical capacity from renewable energy sources increased the most, both in relation to the total electrical capacity and the GDP. This conclusion is also confirmed by the analysis of the distribution of types of energy sources in the countries of group A, which is presented in Figure 10.
The traditional classification of renewable energy sources means that, as in the analyses presented above, the actual investment of countries in switching their economies to greener and more modern energy sources can be overlooked. This is due to the fact that hydroelectric power plants are also renewable energy sources, which in some countries have been a large part of electricity capacity for decades. This situation mean that with relatively young wind and solar energy infrastructure, expenditure on their development may be unnoticeable or misinterpreted if their electrical capacity in the analysis is included with the electric capacity from hydropower. Despite the classification of hydroelectric power plants as renewable energy sources, only small power plants with a capacity of up to several megawatts are considered as such. Larger hydropower plants have a negative impact on the environment, and thus should not be treated as renewable energy sources.

3.1.3. Groups for IREN Indicators in 2004

In the last dozen or so years when writing about renewable energy, we were rather thinking of dynamically developing wind and solar energy, not about hydroelectric power plants. This trend resulted from the global energy policy, which assumes that renewable energy is not enough—it needs to be sustainable. For this reason, the analyses for 2004 and 2016 were reconstructed for a comparison with the assumption that only wind and solar power plants are renewable energy sources. These analyses showed the extent to which the new type of renewable energy sources affect the classification of countries and the ratio of electrical capacity only from this type of energy in relation to GDP. These indicators designated for this type of energy were designated as IREN.
Assuming that only wind and solar power plants are renewable sources of energy, in 2004, they constituted only 0.08% of the total electrical capacity. For comparison, the electrical capacity of the hydroelectric plants alone was 18.60%. The introduced change fully altered the tree diagram (Figure 11) resulting from cluster analysis for IREN indicators compared to that presented earlier for IRE indicators in 2004.
Cutting off the tree diagram as in the previous analyses at a distance of 10 resulted in the creation of three groups, but other than the C group, the groups included different countries (Table 9).
Group averages and their values in relation to the overall average are presented in Table 10 and Figure 12. The analysis of variance at the significance level of 0.05 showed statistically significant differences between the values of indicators in these groups, which means the groups have been correctly created and are significantly different from each other.
As mentioned above, the groups based on IREN indicators have different compositions, but, as shown in Figure 12, their nature is also different. Group A only contains Latvia, which stands out from the rest of the world in having the largest electrical capacity from wind energy. Group C, as in previous analyses, contains only Bulgaria. Again, the main reason for this situation is the high cost of energy in relation to GDP. The largest group B contains as many as 11 countries where the electrical capacity from wind and solar plants in relation to the total electrical capacity of each of these countries is negligible.

3.1.4. Groups for IREN Indicators in 2016

An increase in demand for electricity and the EU’s climate policy has forced the Member States countries to invest in renewable energy sources. Wind and solar power plants belong to the most frequently developed investments in recent years. In most countries, the construction of new power plants for combustible fuels was practically discontinued due to their negative impact on the environment and long construction time and high costs. Similarly, the construction of nuclear power plants requires large financial outlays and building time. The security of these facilities and the use of radioactive waste are also debatable. Hydroelectric plants, although they are classified as renewable energy sources, but as mentioned before, have a negative impact on the natural environment if their power generated is greater than a dozen or so megawatts, and the vast majority of hydroelectric power plants in the studied countries produce much more power. The time required to design and build such plants is also quite long. Wind and solar power plants have become a natural choice as their construction time is shorter compared to power plants. The electrical capacity of wind and solar power plants depends mainly on the space they occupy, meaning smaller investors can also build them and create a dispersed network of small power plants. Considering only this type of power plants in cluster analysis allowed us to eliminate data disturbances caused by hydroelectric plants, and thus to more accurately group countries in terms of their investments in renewable energy sources. The tree diagram created for IREN indicators for 2016 is presented in Figure 13.
By cutting off the tree diagram, as in previous analyses, at a distance of 10, three clusters ere formed. Despite the same number of clusters as in the analysis for IRE 2016 indicators (Table 7), the clusters for IREN 2016 contain other countries (Table 11).
Cluster averages were calculated to characterize clusters (Table 12) and the results are presented in relation to the average of all figures in Figure 14. As in all previous clusters, the analysis of variance of indicators in newly created groups was conducted. With the assumed significance level of 0.05, Table 12 shows that the p-value is always less than this value, indicating statistically significant differences between the clusters.
The average values in the groups of IREN indicators for 2016 (Figure 14) are similar for IRE indicators for 2016 (Figure 9). However, this similarity is only accidental as the countries in particular groups for IREN indicators (Table 11) only slightly overlap the countries in the groups for the IRE indicators (Table 7). Groups A and B contain countries whose cost of obtaining energy is moderate in relation to GDP, whereas Romania is also in group C in addition to Bulgaria. Group C, therefore, contains the poorest countries of the EU, where the energy cost is highest in relation to GDP, but the share of wind and solar power plants in the electrical capacity simultaneously increased the most in these countries (Figure 15).
The structure of the electrical capacity divided into wind and solar power plants (renewable energy sources) and sum of non-renewable energy sources and hydro power is presented for groups A and B in Figure 16 and Figure 17, respectively.
The exclusion of hydroelectric power plants from renewable energy sources led to the level of investments of individual countries in ecological sources of electricity being more visible in the conducted analyses. The countries of groups A and B in 2016 had a similar cost of energy conversion to GDP, but the level of investment in renewable energy sources was significantly different. Four countries from group A during the 13 years only slightly increased the production of electricity from wind and solar power plants, which means that this group can be considered the least ecological. Group B contains 7 of the 13 countries and is characterized by a much higher increase in energy production from wind and solar farms than the B group with a similar cost of energy conversion to GDP.

4. Discussion

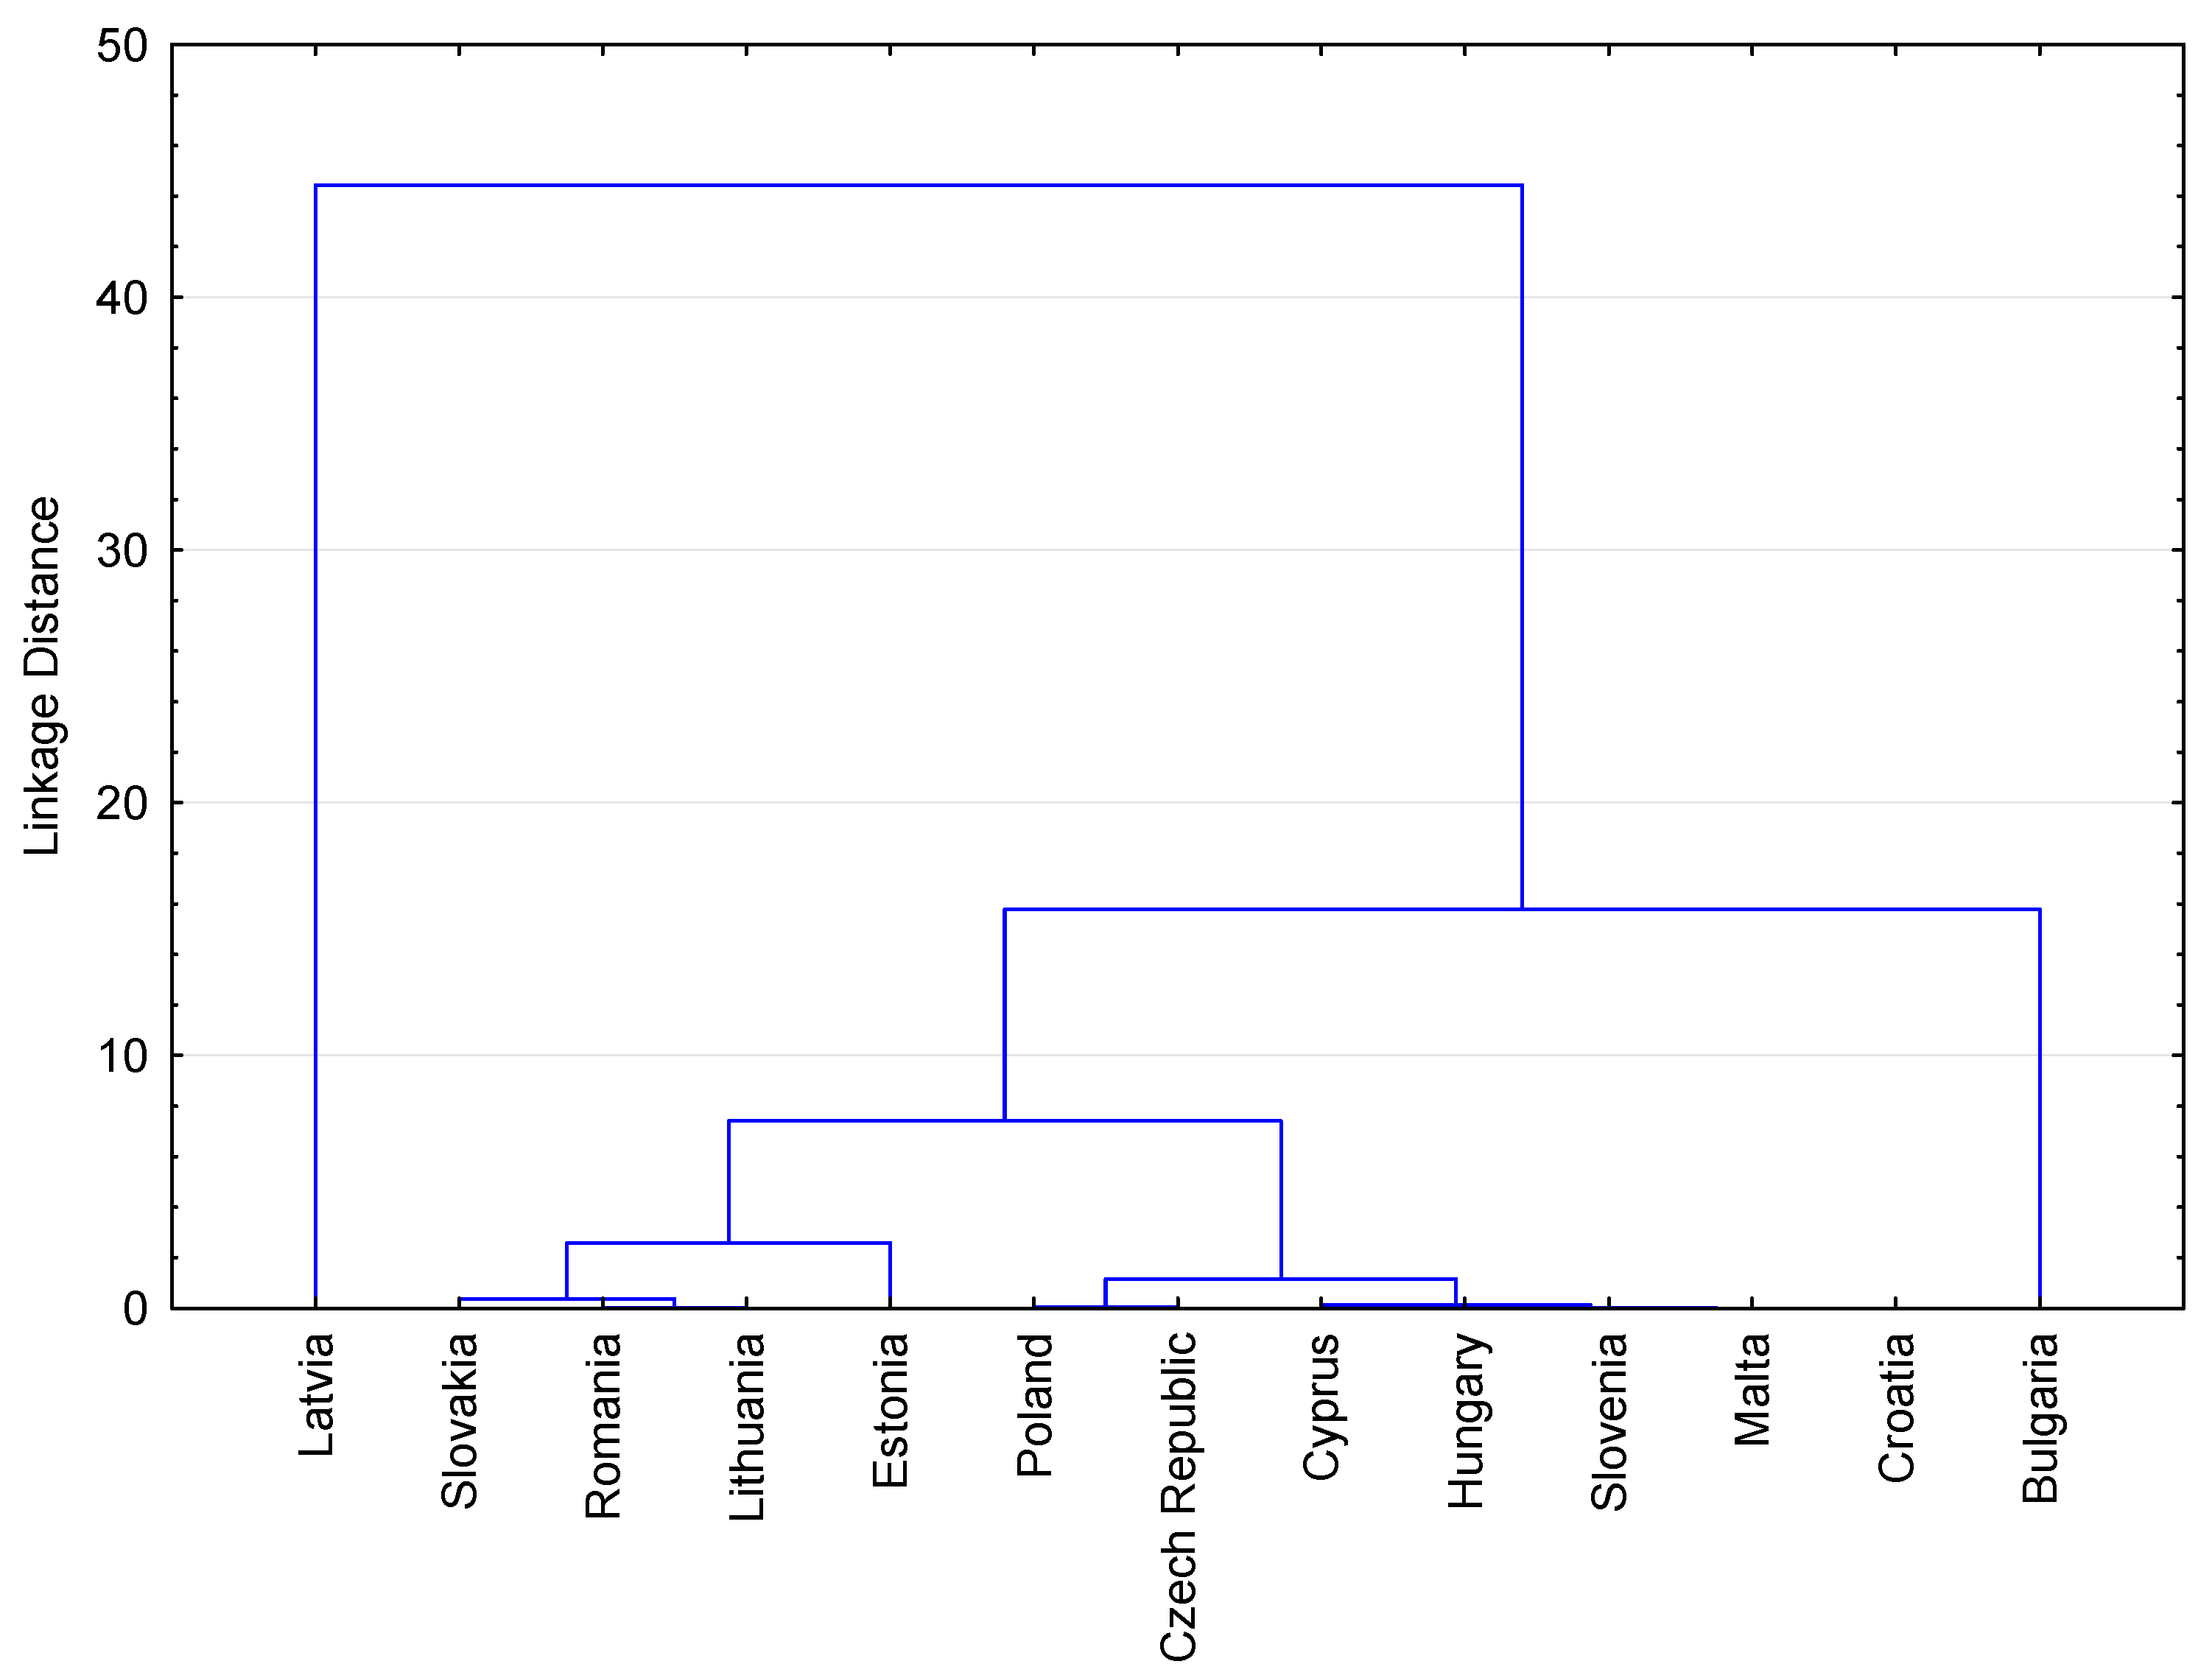
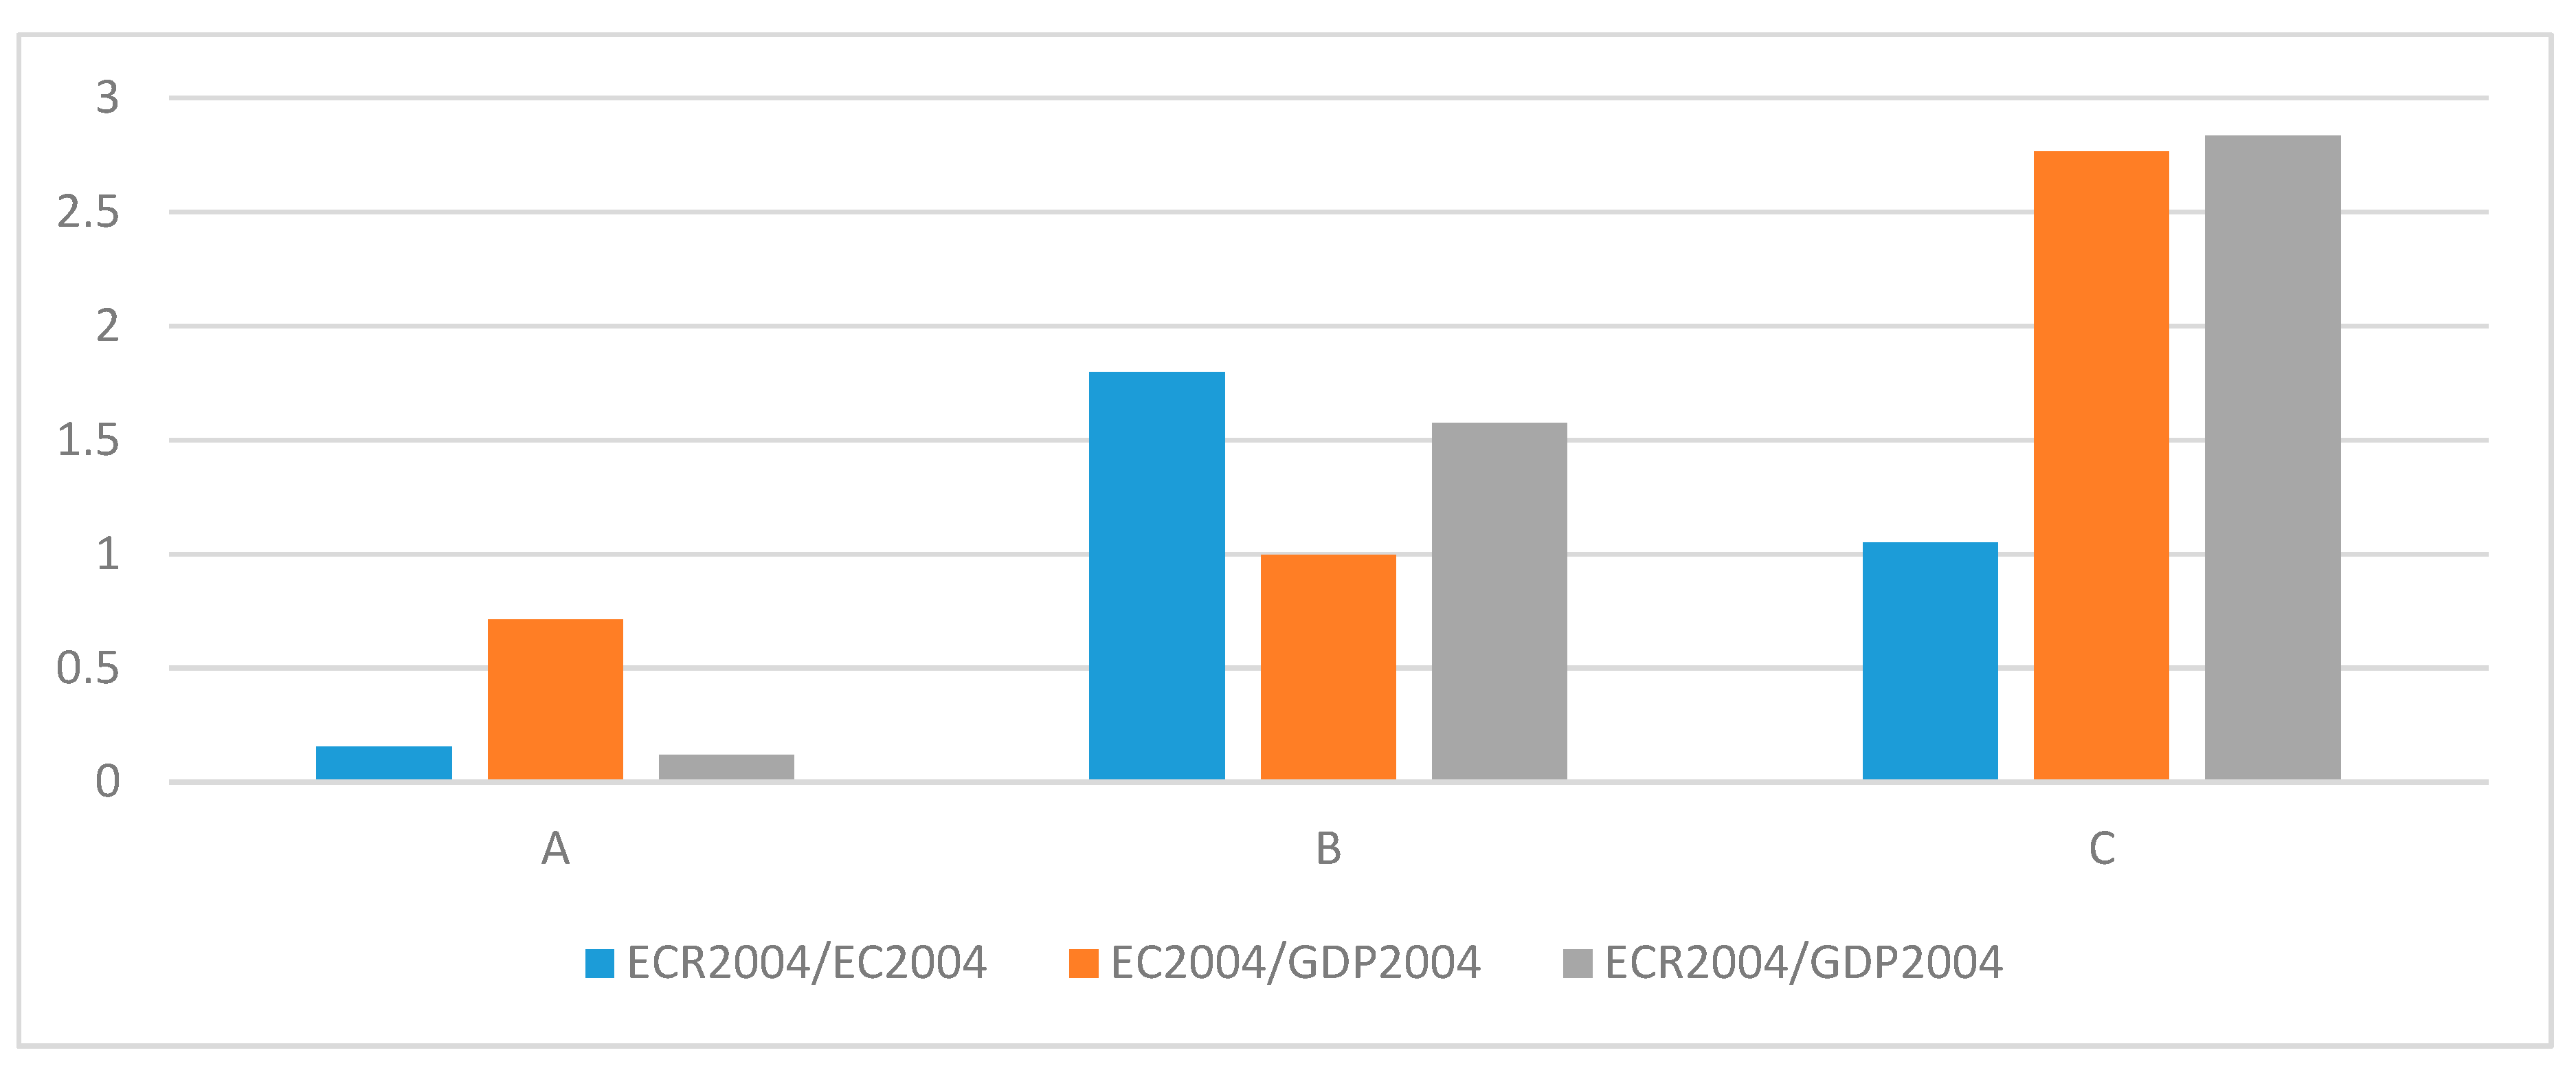
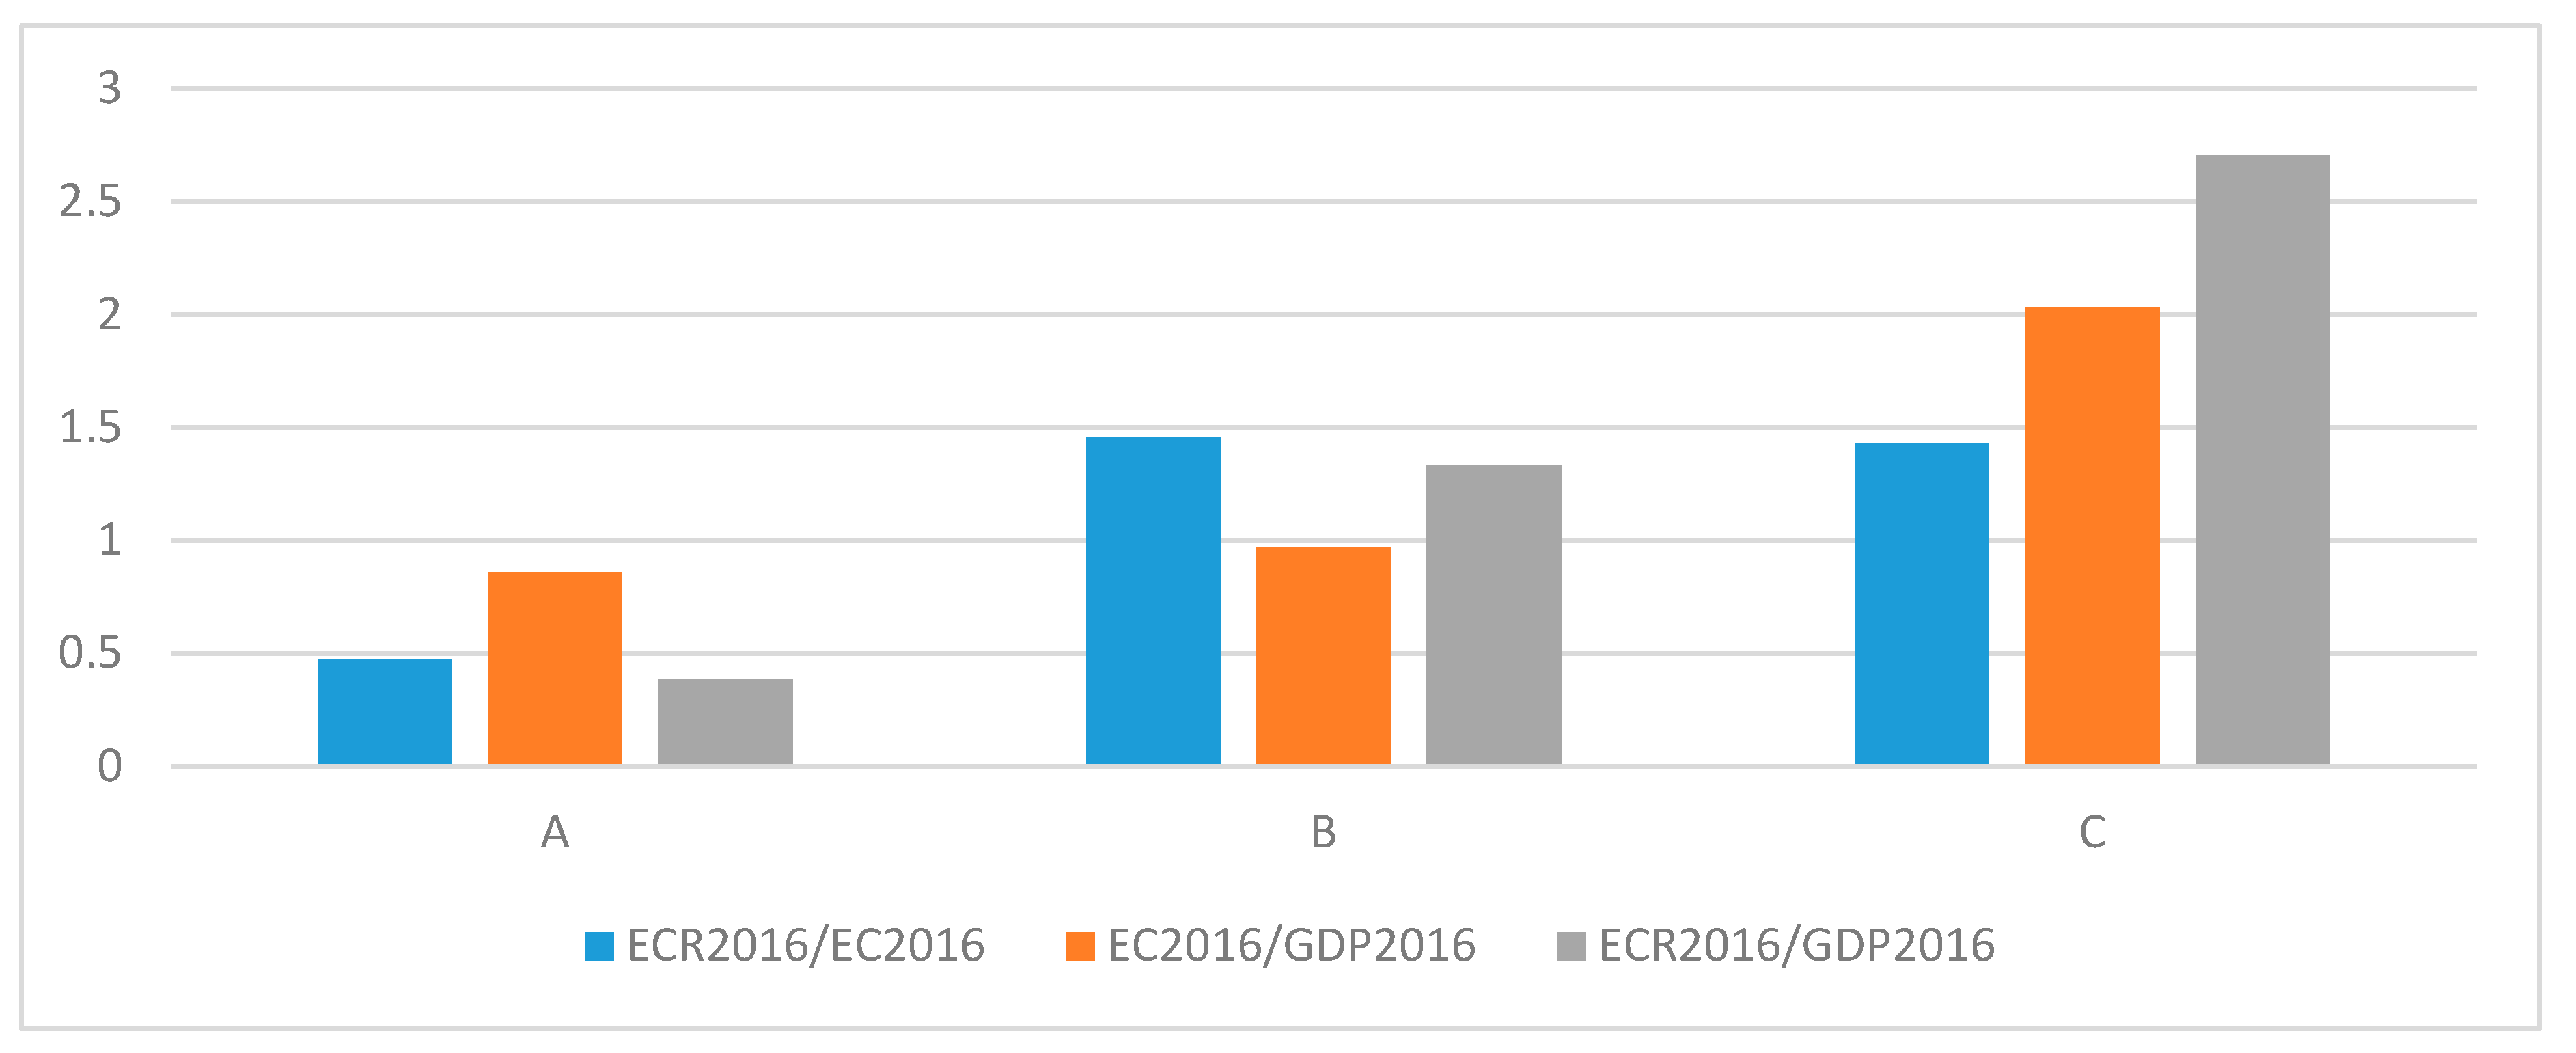
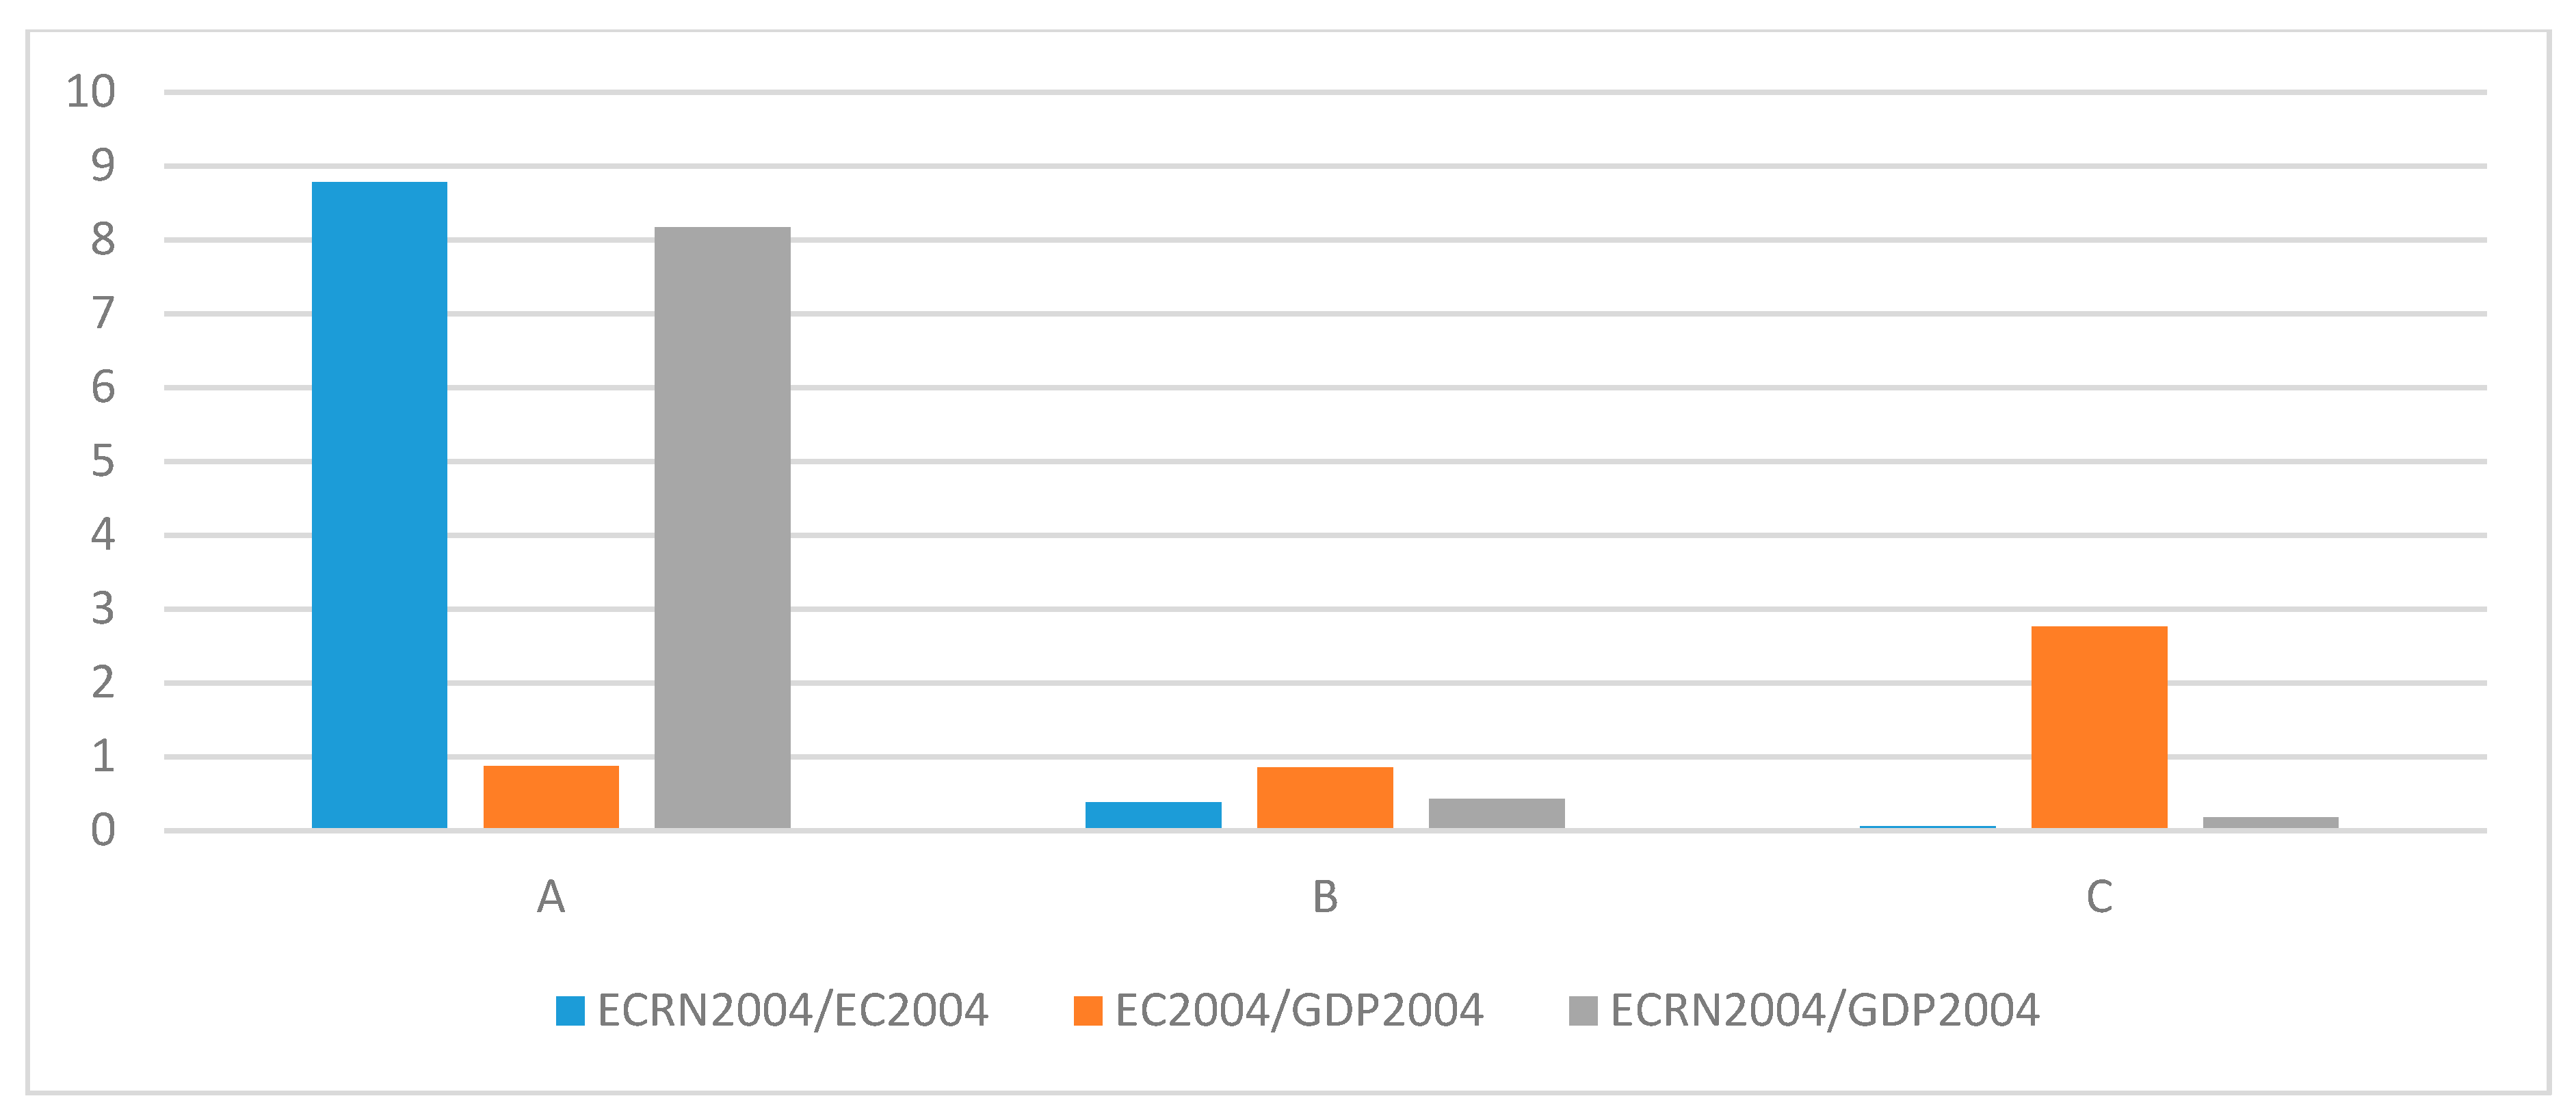
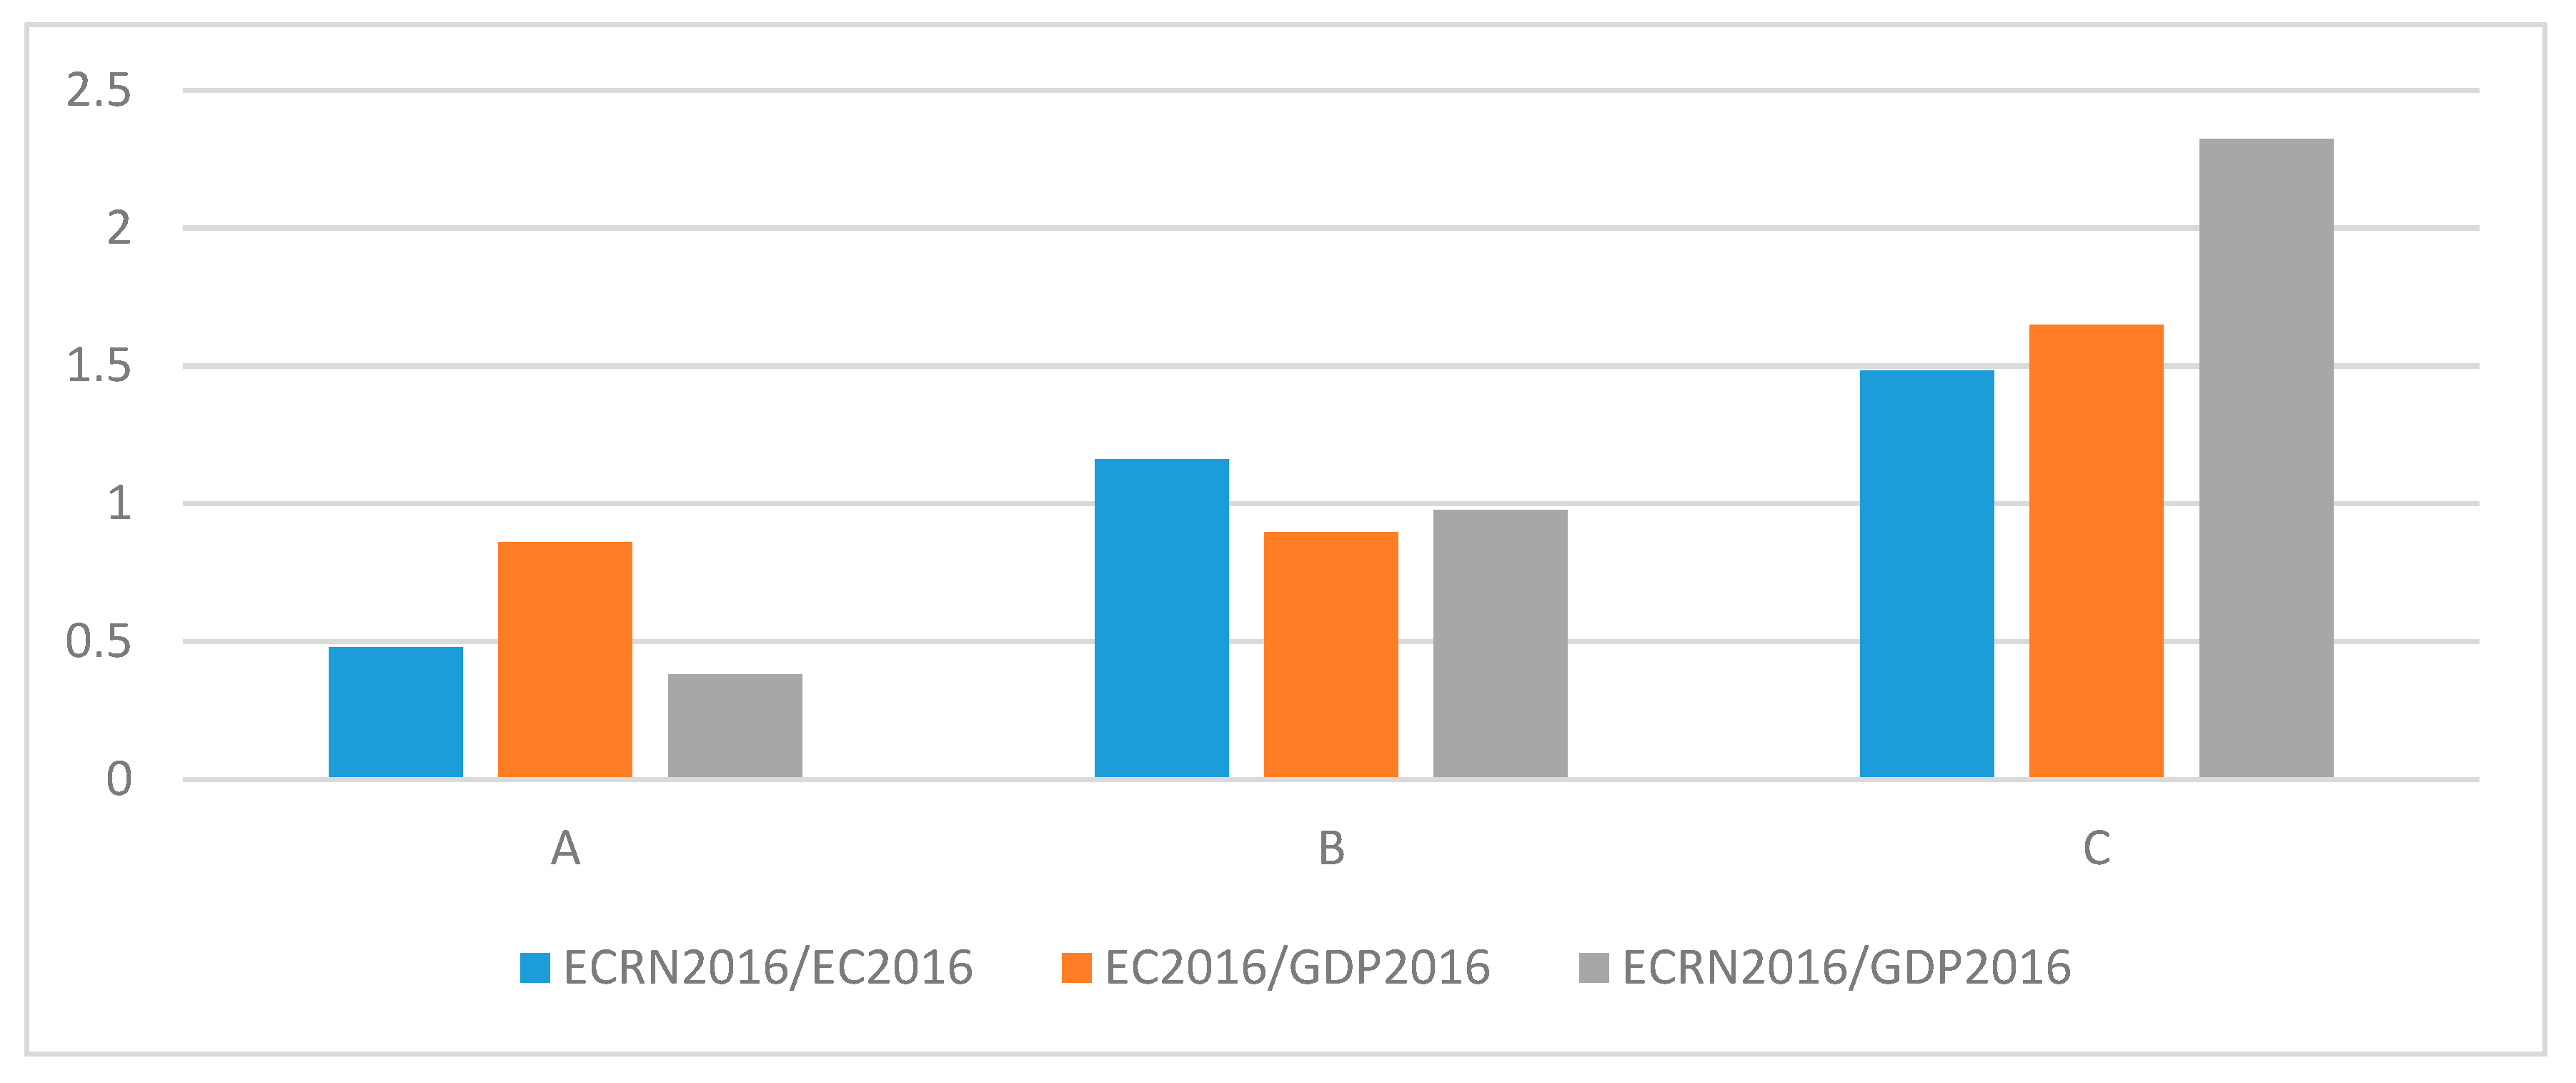
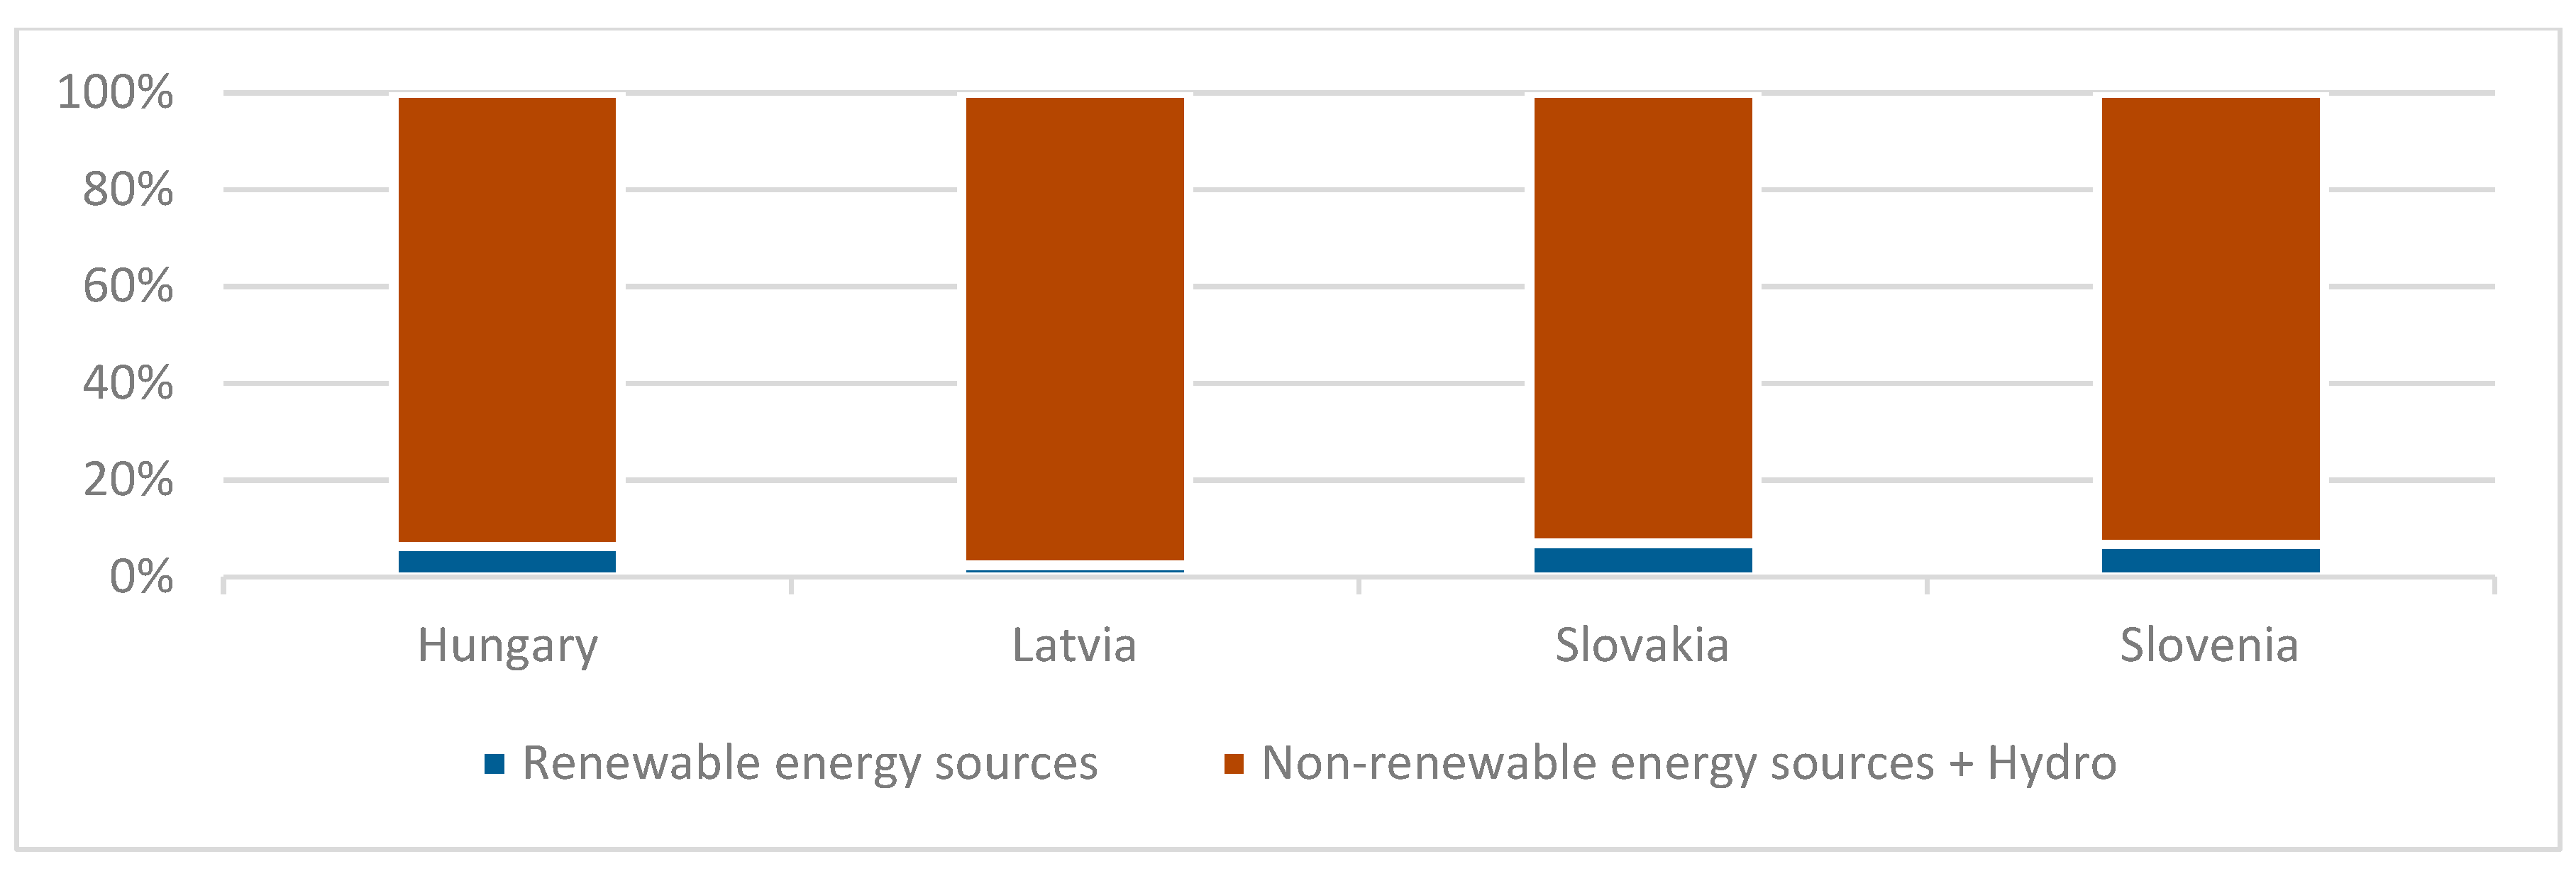
In the context of the global development of renewable energy sources, we attempted to classify new EU Member States in terms of their progress in this area, and presented energy costs against their GDP. The electrical capacity selected for the analysis was divided into renewable and non-renewable energy sources as well as GDP. In order to compare the progress in the implementation of EU directives related to the reduction of greenhouse gas emissions through a change in the structure of energy sources, two variants of a cluster analysis were conducted for 2004 and 2016. In the first variant, the analyses were conducted for all known renewable energy sources. These analyses showed that all new EU countries in the analyzed period implemented a policy of increasing the electrical capacities from renewable sources to a similar level, which caused the groups of countries similar to each other in 2004 and 2016 to be identical. The distinctive group was group C, which contained only Bulgaria. Bulgaria is characterized by a large energy intensity, which is the cost of transforming energy into GDP. However, the significant reduction in energy intensity over the considered period can be regarded as a country success. In order to omit the influence of large hydropower plants on the results, analogous cluster analyses of only renewable energy sources of a new type, i.e., wind and solar power plants, were completed. The analysis for 2004 showed that the differences from previous analyses for 2004 were significant. The number of created groups was the same, but their characteristics and composition were different. The only group that remained was C, containing Bulgaria, again due to its high energy intensity. Group A only contained Latvia, which at the time was characterized by the possession of wind energy sources. The remaining 11 countries were so similar to each other that all were categorized into group B. This group was characterized in 2004 by zero electrical capacity from wind and solar power plants. Another analysis for 2016 showed which groups of countries increased their electrical capacity from modern renewable energy sources to the greatest extent. In this respect, the largest changes occurred in Group C, which included Bulgaria and Romania. In the two poorest countries of the EU, where the energy cost in relation to GDP was the highest, the electricity from hydropower and solar plants was already nearly 20% of the total electrical capacity. Group B, consisting of seven countries, where this type of energy constitute for over a dozen percent of electricity, can also be positively assessed. The smallest increase in electrical capacity from hydro and solar power plants occurred in group A, which included Hungary, Latvia, Slovakia, and Slovenia. It is particularly worth paying attention to Latvia, which was already distinguished in 2004 by having wind energy sources, and yet within 13 years it achieved the smallest increase (2%) in electrical capacity from wind and solar plants among all the surveyed countries. The division of analyses into the two options discussed above, apart from selecting groups of countries similar to each other in terms of electrical capacity and GDP, also showed the importance of the differences in the energy assessment of individual countries in the context of sustainable development, depending on whether their environmental achievements included current, often dozens-of-years-old and large hydropower plants, or whether only modern sources of energy from water and sun were analyzed.
By making analogous analyses, as in this article, the research can be extended to the entire EU. This would allow assessing whether a similar increase in investments in new types of renewable energy sources occurred countries that were members of the EU before 2004, as in the countries that joined in 2004 and later. Conducting analyses for all EU Member States would allow us to determine the differences between old and new members. Further questions could be posed about the composition of the groups in 2004 and 2016: Is there a division between old and new Member States in 2004? Are there any noticeable changes in the groups in 2016 among only old EU countries? Are there groups of mixed old and new Member States in the 2016 groups?
Questions of this type could help determine whether, for example, the new Member States are able to match the old EU Member States, or, despite investments in renewable energy sources, the old Member States do it even more efficiently. An analysis for the entire EU would also show differences in energy efficiency between old and new Member States.
Subsequent research could include Eastern European countries that are not members of the EU. Investigating the level of investments in various types of renewable energy sources in these countries, their development in relation to EU countries could be determined. Depending on the results obtained, it would be possible to analyze whether EU membership and legislation stimulates larger investments in renewable energy sources. Would the new Member States have developed these branches of energy if they did not become members of the EU?
In recent years, the high costs of producing energy from renewable sources have been widely discussed. The proposed classification of renewable energy sources could also be used to assess their impact on electricity prices, production costs, inflation, and consumer purchasing power, among others.

Author Contributions

Conceptualization, J.B.; Methodology, J.B., G.M. and G.S.; Formal Analysis, J.B., G.M., E.I. and G.S.; Investigation, J.B.; Resources, G.S.; Data Curation, J.B.; Writing—Original Draft Preparation, J.B. and G.S.; Writing—Review & Editing, J.B., G.M., G.S. and E.I.; Visualization, J.B.; Supervision, J.B., G.M. and G.S.; Funding Acquisition, G.M., E.I., and G.S.

Funding

This research received no external funding.

Conflicts of Interest

The authors declare no conflict of interest.

References

  1. Smil, V. Energy Transitions: History, Requirements, Prospects; Praeger: Santa Barbara, CA, USA, 2010; ISBN 978-0-313-38177-5. [Google Scholar]
  2. Sampedro, J.; Arto, I.; González-Eguino, M. Implications of switching fossil fuel subsidies to solar: A case study for the European Union. Sustainability 2017, 10, 50. [Google Scholar] [CrossRef]
  3. Liao, H.; Liu, Y.; Gao, Y.; Hao, Y.; Ma, X.-W.; Wang, K. Forecasting residential electricity demand in provincial China. Environ. Sci. Pollut. Res. 2017, 24, 6414–6425. [Google Scholar] [CrossRef] [PubMed]
  4. Ellabban, O.; Abu-Rub, H.; Blaabjerg, F. Renewable energy resources: Current status, future prospects and their enabling technology. Renew. Sustain. Energy Rev. 2014, 39, 748–764. [Google Scholar] [CrossRef]
  5. Resch, G.; Held, A.; Faber, T.; Panzer, C.; Toro, F.; Haas, R. Potentials and prospects for renewable energies at global scale. Energy Policy 2008, 36, 4048–4056. [Google Scholar] [CrossRef]
  6. Ketsetzi, A.; Capraro, M.M. Renewable energy sources. In A Companion to Interdisciplinary STEM Project-Based Learning; Sense Publishers: Rotterdam, The Netherlands, 2016; pp. 145–153. ISBN 978-94-6300-485-5. [Google Scholar]
  7. Simionescu, M.; Albu, L.-L.; Szeles, M.R.; Bilan, Y. The impact of biofuels utilisation in transport on the sustainable development in the European Union. Technol. Econ. Dev. Econ. 2017, 23, 667–686. [Google Scholar] [CrossRef]
  8. Auestad, I.; Nilsen, Y.; Rydgren, K. Environmental restoration in hydropower development—Lessons from norway. Sustainability 2018, 10, 3358. [Google Scholar] [CrossRef]
  9. Nguyen, T.H.T.; Everaert, G.; Boets, P.; Forio, M.A.E.; Bennetsen, E.; Volk, M.; Hoang, T.H.T.; Goethals, P.L.M. Modelling tools to analyze and assess the ecological impact of hydropower dams. Water 2018, 10, 259. [Google Scholar] [CrossRef]
  10. Frey, G.W.; Linke, D.M. Hydropower as a renewable and sustainable energy resource meeting global energy challenges in a reasonable way. Energy Policy 2002, 30, 1261–1265. [Google Scholar] [CrossRef]
  11. Tromp, T.K.; Shia, R.-L.; Allen, M.; Eiler, J.M.; Yung, Y.L. Potential environmental impact of a hydrogen economy on the stratosphere. Science 2003, 300, 1740–1742. [Google Scholar] [CrossRef]
  12. Galy-Lacaux, C.; Delmas, R.; Jambert, C.; Dumestre, J.-F.; Labroue, L.; Richard, S.; Gosse, P. Gaseous emissions and oxygen consumption in hydroelectric dams: A case study in French Guyana. Glob. Biogeochem. Cycles 1997, 11, 471–483. [Google Scholar] [CrossRef]
  13. Rosa, L.P.; dos Santos, M.A.; Matvienko, B.; dos Santos, E.O.; Sikar, E. Greenhouse gas emissions from hydroelectric reservoirs in tropical regions. Clim. Chang. 2004, 66, 9–21. [Google Scholar] [CrossRef]
  14. Fearnside, P.M. Greenhouse gas emissions from hydroelectric dams: Controversies provide a springboard for rethinking a supposedly ‘clean’ energy source. An editorial comment. Clim. Chang. 2004, 66, 1–8. [Google Scholar] [CrossRef]
  15. Hidrovo, A.; Uche, J.; Martínez, A. Accounting for GHG net reservoir emissions of hydropower in Ecuador. Renew. Energy 2017, 112, 209–221. [Google Scholar] [CrossRef] [Green Version]
  16. Kemenes, A.; Melack, J.; Forsberg, B. Downstream emissions of CH4 and CO2 from hydroelectric reservoirs (Tucuruí, Samuel, and Curuá-Una) in the Amazon basin. Inland Waters 2016, 6, 295–302. [Google Scholar] [CrossRef]
  17. Citizens United for Renewable Energy and Sustainability Steps Toward a Sustainable Energy Future: Position Paper of the CURES Network for the CSD 2006.
  18. The EU Environmental NGO Statement on CSD 15. Available online: http://www.wecf.eu/english/articles/2007/03/euro_csd15.php (accessed on 24 November 2018).
  19. Zhang, H.; Zheng, Y.; Zhou, D.; Zhu, P. Which subsidy mode improves the financial performance of renewable energy firms? A panel data analysis of wind and solar energy companies between 2009 and 2014. Sustainability 2015, 7, 16548–16560. [Google Scholar] [CrossRef]
  20. Abazaj, J.; Moen, Ø.; Ruud, A. Striking the balance between renewable energy generation and water status protection: Hydropower in the context of the European renewable energy directive and water framework Directive. Environ. Policy Gov. 2016, 26, 409–421. [Google Scholar] [CrossRef]
  21. More Bang for the Buck: Record New Renewable Power Capacity Added at Lower Cost. Available online: https://about.bnef.com/blog/bang-buck-record-new-renewable-power-capacity-added-lower-cost/ (accessed on 24 May 2018).
  22. Arıoğlu Akan, M.Ö.; Selam, A.A.; Oktay Fırat, S.Ü.; Er Kara, M.; Özel, S. A comparative analysis of renewable energy use and policies: Global and turkish perspectives. Sustainability 2015, 7, 16379–16407. [Google Scholar] [CrossRef]
  23. Franzitta, V.; Curto, D.; Rao, D. Energetic sustainability using renewable energies in the Mediterranean Sea. Sustainability 2016, 8, 1164. [Google Scholar] [CrossRef]
  24. Qoaider, L.; Steinbrecht, D. Photovoltaic systems: A cost competitive option to supply energy to off-grid agricultural communities in arid regions. Appl. Energy 2010, 87, 427–435. [Google Scholar] [CrossRef]
  25. Ntanos, S.; Kyriakopoulos, G.; Chalikias, M.; Arabatzis, G.; Skordoulis, M. Public perceptions and willingness to pay for renewable energy: A case study from Greece. Sustainability 2018, 10, 687. [Google Scholar] [CrossRef]
  26. Stigka, E.K.; Paravantis, J.A.; Mihalakakou, G.K. Social acceptance of renewable energy sources: A review of contingent valuation applications. Renew. Sustain. Energy Rev. 2014, 32, 100–106. [Google Scholar] [CrossRef]
  27. Piao, M.; Piao, Y.; Lee, J.Y. Symmetrical uncertainty-based feature subset generation and ensemble learning for electricity customer classification. Symmetry 2019, 11, 498. [Google Scholar] [CrossRef]
  28. Bengochea-Morancho, A.; Higón-Tamarit, F.; Martínez-Zarzoso, I. Economic growth and CO2 emissions in the European Union. Environ. Resour. Econ. 2001, 19, 165–172. [Google Scholar] [CrossRef]
  29. Azomahou, T.; Laisney, F.; Nguyen Van, P. Economic development and CO2 emissions: A nonparametric panel approach. J. Public Econ. 2006, 90, 1347–1363. [Google Scholar] [CrossRef] [Green Version]
  30. Narayan, P.K.; Narayan, S. Carbon dioxide emissions and economic growth: Panel data evidence from developing countries. Energy Policy 2010, 38, 661–666. [Google Scholar] [CrossRef]
  31. Al-mulali, U. Factors affecting CO2 emission in the Middle East: A panel data analysis. Energy 2012, 44, 564–569. [Google Scholar] [CrossRef]
  32. Odhiambo, N. Economic growth and carbon emissions in South Africa: An empirical investigation. Int. Bus. Econ. Res. J. 2012, 28, 37–46. [Google Scholar]
  33. Brożyna, J.; Mentel, G.; Szetela, B. Renevable energy and economic development in the European Union. Acta Polytech. Hung. 2017, 14, 11–34. [Google Scholar]
  34. Mehedintu, A.; Sterpu, M.; Soava, G. Estimation and forecasts for the share of renewable energy consumption in final energy consumption by 2020 in the European Union. Sustainability 2018, 10, 1515. [Google Scholar] [CrossRef]
  35. Malla, S.; Timilsina, G.R. Long-Term Energy Demand Forecasting in Romania: An End-Use Demand; The World Bank: Washington, DC, USA, 2016; pp. 1–38. [Google Scholar]
  36. Ardakani, F.J.; Ardehali, M.M. Long-term electrical energy consumption forecasting for developing and developed economies based on different optimized models and historical data types. Energy 2014, 65, 452–461. [Google Scholar] [CrossRef]
  37. Hamedmoghadam, H.; Joorabloo, N.; Jalili, M. Australia’s long-term electricity demand forecasting using deep neural networks. arXiv 2018, arXiv:1801.02148. [Google Scholar]
  38. Rodríguez-Caballero, C.V.; Ventosa-Santaulària, D. Energy-growth long-term relationship under structural breaks. Evidence from Canada, 17 Latin American economies and the USA. Energy Econ. 2017, 61, 121–134. [Google Scholar] [CrossRef]
  39. Kishita, Y.; Yamaguchi, Y.; Umeda, Y.; Shimoda, Y.; Hara, M.; Sakurai, A.; Oka, H.; Tanaka, Y. Describing long-term electricity demand scenarios in the telecommunications industry: A case study of Japan. Sustainability 2016, 8, 52. [Google Scholar] [CrossRef]
  40. McCarthy, R.; Yang, C.; Ogden, J.M. California Energy Demand Scenario Projections to 2050; Institute of Transportation Studies, University of California: Davis, CA, USA, 2008. [Google Scholar]
  41. Brożyna, J.; Mentel, G.; Szetela, B. A mid-term forecast of maximum demand for electricity in Poland. Montenegrin J. Econ. 2016, 12, 73–88. [Google Scholar] [CrossRef]
  42. Kharlamova, G.; Chernyak, O.; Nate, S. Renewable energy and security for Ukraine: Challenge or smart way? J. Int. Stud. 2016, 9, 88–115. [Google Scholar] [CrossRef] [PubMed]
  43. Sadorsky, P. Renewable energy consumption and income in emerging economies. Energy Policy 2009, 37, 4021–4028. [Google Scholar] [CrossRef]
  44. Sari, R.; Ewing, B.T.; Soytas, U. The relationship between disaggregate energy consumption and industrial production in the United States: An ARDL approach. Energy Econ. 2008, 30, 2302–2313. [Google Scholar] [CrossRef]
  45. Lee, C.-C. The causality relationship between energy consumption and GDP in G-11 countries revisited. Energy Policy 2006, 34, 1086–1093. [Google Scholar] [CrossRef]
  46. Shahbaz, M.; Tang, C.F.; Shahbaz Shabbir, M. Electricity consumption and economic growth nexus in Portugal using cointegration and causality approaches. Energy Policy 2011, 39, 3529–3536. [Google Scholar] [CrossRef] [Green Version]
  47. Zhang, X.-P.; Cheng, X.-M. Energy consumption, carbon emissions, and economic growth in China. Ecol. Econ. 2009, 68, 2706–2712. [Google Scholar] [CrossRef]
  48. Caraiani, C.; Lungu, C.I.; Dascălu, C. Energy consumption and GDP causality: A three-step analysis for emerging European countries. Renew. Sustain. Energy Rev. 2015, 44, 198–210. [Google Scholar] [CrossRef]
  49. Li, H.; Lo, K.; Wang, M.; Zhang, P.; Xue, L. Industrial energy consumption in Northeast China under the revitalisation strategy: A decomposition and policy analysis. Energies 2016, 9, 549. [Google Scholar] [CrossRef]
  50. Fang, Y. Economic welfare impacts from renewable energy consumption: The China experience. Renew. Sustain. Energy Rev. 2011, 15, 5120–5128. [Google Scholar] [CrossRef]
  51. Inglesi-Lotz, R. The impact of renewable energy consumption to economic growth: A panel data application. Energy Econ. 2016, 53, 58–63. [Google Scholar] [CrossRef]
  52. Menegaki, A.N. Growth and renewable energy in Europe: A random effect model with evidence for neutrality hypothesis. Energy Econ. 2011, 33, 257–263. [Google Scholar] [CrossRef]
  53. Kayhan, S.; Adiguzel, U.; Bayat, T.; Lebe, F. Causality relationship between real GDP and electricity consumption in Romania (2001–2010). Romanian J. Econ. Forecast. 2010, 169, 169–183. [Google Scholar]
  54. Peñalvo-López, E.; Cárcel-Carrasco, F.J.; Devece, C.; Morcillo, A.I. A methodology for analysing sustainability in energy scenarios. Sustainability 2017, 9, 1590. [Google Scholar] [CrossRef]
  55. Katre, A.; Tozzi, A. Assessing the sustainability of decentralized renewable energy systems: A comprehensive framework with analytical methods. Sustainability 2018, 10, 1058. [Google Scholar] [CrossRef]
  56. Cîrstea, S.D.; Moldovan-Teselios, C.; Cîrstea, A.; Turcu, A.C.; Darab, C.P. Evaluating renewable energy sustainability by composite index. Sustainability 2018, 10, 811. [Google Scholar] [CrossRef]
  57. Zhao, H.; Guo, S. External benefit evaluation of renewable energy power in China for sustainability. Sustainability 2015, 7, 4783–4805. [Google Scholar] [CrossRef]
  58. Saiah, S.B.D.; Stambouli, A.B. Prospective analysis for a long-term optimal energy mix planning in Algeria: Towards high electricity generation security in 2062. Renew. Sustain. Energy Rev. 2017, 73, 26–43. [Google Scholar] [CrossRef]
  59. Zhang, Y.; Zhao, X.; Zuo, Y.; Ren, L.; Wang, L. The development of the renewable energy power industry under feed-in tariff and renewable portfolio standard: A case study of China’s photovoltaic power industry. Sustainability 2017, 9, 532. [Google Scholar] [CrossRef]
  60. Kasperowicz, R.; Pinczyński, M.; Khabdullin, A. Modeling the power of renewable energy sources in the context of classical electricity system transformation. J. Int. Stud. 2017, 10, 264–272. [Google Scholar] [CrossRef]
  61. Nicolini, M.; Tavoni, M. Are renewable energy subsidies effective? Evidence from Europe. Renew. Sustain. Energy Rev. 2017, 74, 412–423. [Google Scholar] [CrossRef]
  62. Zhang, L.; Xue, B.; Liu, X. Carbon emission reduction with regard to retailer’s fairness concern and subsidies. Sustainability 2018, 10, 1209. [Google Scholar] [CrossRef]
  63. Choi, Y. The Asian values of Guānxì as an economic model for transition toward green growth. Sustainability 2018, 10, 2150. [Google Scholar] [CrossRef]
  64. Choi, G.; Heo, E.; Lee, C.-Y. Dynamic economic analysis of subsidies for new and renewable energy in South Korea. Sustainability 2018, 10, 1832. [Google Scholar] [CrossRef]
  65. Bowden, N.; Payne, J.E. The causal relationship between U.S. energy consumption and real output: A disaggregated analysis. J. Policy Model. 2009, 31, 180–188. [Google Scholar] [CrossRef]
  66. Li, X. Diversification and localization of energy systems for sustainable development and energy security. Energy Policy 2005, 33, 2237–2243. [Google Scholar] [CrossRef]
  67. First Orientation for a Common Energy Policy, Communication from the EC to the Council 1968.
  68. Jasiński, P.; Skoczny, T. Polityka Energetyczna Wspólnot Europejskich—Tło Historyczne; CE UW: Warszawa, Poland, 1996. [Google Scholar]
  69. Immenga, U. The developement of European energy policy: From ECSC treaty to the internal market. In Natural Gas in the Internal Market; Mestmäcker, E.J., Ed.; Kluwer Law International: London, UK, 1992; ISBN 978-1-85333-795-6. [Google Scholar]
  70. Eurostat, Infrastructure—Electricity. Available online: http://appsso.eurostat.ec.europa.eu/nui/show.do?dataset=nrg_113a (accessed on 14 June 2018).
  71. Wurlod, J.-D.; Noailly, J. The impact of green innovation on energy intensity: An empirical analysis for 14 industrial sectors in OECD countries. Energy Econ. 2018, 71, 47–61. [Google Scholar] [CrossRef] [Green Version]
  72. Voigt, S.; De Cian, E.; Schymura, M.; Verdolini, E. Energy intensity developments in 40 major economies: Structural change or technology improvement? Energy Econ. 2014, 41, 47–62. [Google Scholar] [CrossRef] [Green Version]
  73. Tvaronavičienė, M.; Prakapienė, D.; Garškaitė-Milvydienė, K.; Prakapas, R.; Nawrot, Ł. Energy efficiency in the long-run in the selected European countries. Econ. Sociol. 2018, 11, 245–254. [Google Scholar] [CrossRef] [PubMed]
  74. Bi, C.; Jia, M.; Zeng, J. Nonlinear effect of public infrastructure on energy intensity in China: A panel smooth transition regression approach. Sustainability 2019, 11, 629. [Google Scholar] [CrossRef]
  75. Sequeira, T.; Santos, M. Education and energy intensity: Simple economic modelling and preliminary empirical results. Sustainability 2018, 10, 1–17. [Google Scholar] [CrossRef]
  76. Wiśnicki, B.; Chybowski, L.; Czarnecki, M. Analysis of the efficiency of port container terminals with the use of the data envelopment analysis method of relative productivity evaluation. Manag. Syst. Prod. Eng. 2017, 25, 9–15. [Google Scholar] [CrossRef]
  77. European Union. The 28 Member Countries of the EU. Available online: https://europa.eu/european-union/about-eu/countries_en#tab-0-1 (accessed on 22 May 2018).
  78. McCormick, J. Understanding the European Union: A Concise Introduction; Palgrave Macmillan: London, UK, 2017; ISBN 978-1-137-60776-8. [Google Scholar]
  79. Pastor, J.M.; Peraita, C.; Serrano, L.; Soler, Á. Higher education institutions, economic growth and GDP per capita in European Union countries. Eur. Plan. Stud. 2018, 26, 1616–1637. [Google Scholar] [CrossRef]
  80. Campos, N.F.; Coricelli, F.; Moretti, L. Economic Growth and Political Integration: Estimating the Benefits from Membership in the European Union Using the Synthetic Counterfactuals Method; Social Science Research Network: Rochester, NY, USA, 2014. [Google Scholar]
  81. Gawlik, L. The polish power industry in energy transformation process. Miner. Econ. 2018, 31, 229–237. [Google Scholar] [CrossRef]
  82. Dogan, E.; Seker, F. Determinants of CO2 emissions in the European Union: The role of renewable and non-renewable energy. Renew. Energy 2016, 94, 429–439. [Google Scholar] [CrossRef]
  83. Scarlat, N.; Dallemand, J.-F.; Monforti-Ferrario, F.; Banja, M.; Motola, V. Renewable energy policy framework and bioenergy contribution in the European Union—An overview from national renewable energy action plans and progress reports. Renew. Sustain. Energy Rev. 2015, 51, 969–985. [Google Scholar] [CrossRef]
  84. Everitt, B.S.; Landau, S.; Leese, M.; Stahl, D. Cluster Analysis, 5th ed.; John Wiley & Sons: New York, NY, USA, 2011; ISBN 978-0-470-97844-3. [Google Scholar]
  85. Bailey, K.D. Typologies and Taxonomies: An Introduction to Classification Techniques; Typologies and Taxonomies: An Introduction to Classification Techniques; Sage Publications, Inc.: Thousand Oaks, CA, US, 1994; ISBN 978-0-8039-5259-1. [Google Scholar]
  86. Ward, J.H.J. Hierarchical grouping to optimize an objective function. J. Am. Stat. Assoc. 1963, 58, 236–244. [Google Scholar] [CrossRef]
  87. Pacesila, M.; Burcea, S.G.; Colesca, S.E. Analysis of renewable energies in European Union. Renew. Sustain. Energy Rev. 2016, 56, 156–170. [Google Scholar] [CrossRef]
  88. Eurostat GDP and Main Components. Available online: http://appsso.eurostat.ec.europa.eu/nui/show.do?dataset=nama_10_gdp (accessed on 14 June 2018).
  89. Shang, Y. Subgraph robustness of complex networks under attacks. IEEE Trans. Syst. Man Cybern. Syst. 2019, 49, 821–832. [Google Scholar] [CrossRef]
  90. Shang, Y. Distance estrada index of random graphs. Linear Multilinear Algebra 2015, 63, 466–471. [Google Scholar] [CrossRef]
  91. Shang, Y. Estimating the distance estrada index. Kuwait J. Sci. 2016, 43, 14–19. [Google Scholar]
  92. Giudici, P. Applied Data Mining: Statistical Methods for Business and Industry; John Wiley & Sons: New York, NY, USA, 2005; ISBN 978-0-470-87139-3. [Google Scholar]
  93. Hastie, T.; Tibshirani, R.; Friedman, J. The Elements of Statistical Learning: Data Mining, Inference, and Prediction, 2nd ed.; Springer: New York, NY, USA, 2009; ISBN 978-0-387-84857-0. [Google Scholar]
  94. Szekely, G.J.; Rizzo, M.L. Hierarchical clustering via joint between-within distances: Extending ward’s minimum variance method. J. Classif. 2005, 22, 151–183. [Google Scholar] [CrossRef]
Figure 1. Joint electrical capacity in the European Union (EU). Source: Own visualizations based on [70].
Energies 12 02271 g001
Figure 2. Map of the studied countries with the year they joined the EU.
Energies 12 02271 g002
Figure 3. Centroids of clusters.
Energies 12 02271 g003
Figure 4. Hierarchical clustering.
Energies 12 02271 g004
Figure 5. Tree Diagram for IRE in 2004.
Energies 12 02271 g005
Figure 6. Comparison of group averages for IRE in 2004.
Energies 12 02271 g006
Figure 7. Energy sources of the countries in group A in 2004.
Energies 12 02271 g007
Figure 8. Tree diagram for IRE in 2016.
Energies 12 02271 g008
Figure 9. Comparison of group averages for IRE in 2016.
Energies 12 02271 g009
Figure 10. Energy sources in the countries of group A in 2016.
Energies 12 02271 g010
Figure 11. Tree diagram for IREN in 2004.
Energies 12 02271 g011
Figure 12. Comparison of group averages for IREN in 2004.
Energies 12 02271 g012
Figure 13. Tree diagram for IREN in 2016.
Energies 12 02271 g013
Figure 14. Comparison of group averages for IREN in 2016.
Energies 12 02271 g014
Figure 15. Energy sources in the countries of group C in 2016.
Energies 12 02271 g015
Figure 16. Energy sources in the countries of group A in 2016.
Energies 12 02271 g016
Figure 17. Energy sources in the countries of group B in 2016.
Energies 12 02271 g017
Table 1. Indicators of renewable energy.
IRE 2004IRE 2016
ECR2004/EC2004ECR2016/EC2016
EC2004/GDP2004EC2016/GDP2016
ECR2004/GDP2004ECR2016/GDP2016
Table 2. Indicators of new renewable energy.
IREN 2004IREN 2016
ECRN2004/EC2004ECRN2016/EC2016
EC2004/GDP2004EC2016/GDP2016
ECRN2004/GDP2004ECRN2016/GDP2016
Table 3. Coefficients of variation of the indicators.
IndicatorCoefficient of Variation (%)
ECR2004/EC2004104.3
ECR2010/EC201078.8
ECR2016/EC201654.0
ECRN2004/EC2004240.0
ECRN2010/EC201085.4
ECRN2016/EC201641.9
EC2004/GDP200465.2
EC2010/GDP201040.8
EC2016/GDP201636.8
ECR2004/GDP2004104.4
ECR2010/GDP201090.4
ECR2016/GDP201674.7
ECRN2004/GDP2004227.0
ECRN2010/GDP2010100.7
ECRN2016/GDP201667.8
Table 4. Coefficients of variation of indicators.
Indicator i—Indicator jCoefficient of Variation (%)
ECR2004/EC2004—EC2004/GDP20047.3
ECR2004/GDP2004—EC2004/GDP200463.0
ECR2004/GDP2004—ECR2004/EC200477.5
ECR2010/EC2010—EC2010/GDP201020.6
ECR2010/GDP2010—EC2010/GDP201062.2
ECR2010/GDP2010—ECR2010/EC201085.6
ECR2016/EC2016—EC2016/GDP201639.7
ECR2016/GDP2016—EC2016/GDP201680.9
ECR2016/GDP2016—ECR2016/EC201683.9
ECRN2004/EC2004—EC2004/GDP2004−4.4
ECRN2004/GDP2004—EC2004/GDP2004−0.8
ECRN2004/GDP2004—ECRN2004/EC200499.4
ECRN2010/EC2010—EC2010/GDP201025.4
ECRN2010/GDP2010—EC2010/GDP201069.5
ECRN2010/GDP2010—ECRN2010/EC201085.2
ECRN2016/EC2016—EC2016/GDP201623.9
ECRN2016/GDP2016—EC2016/GDP201682.3
ECRN2016/GDP2016—ECRN2016/EC201673.6
Table 5. Clusters for IRE in 2004.
Group No.ABC
1CyprusCroatiaBulgaria
2Czech RepublicLatvia
3EstoniaLithuania
4HungaryRomania
5MaltaSlovakia
6PolandSlovenia
Table 6. Group averages for IRE in 2004.
Group\IndicatorECR2004/EC2004EC2004/GDP2004ECR2004/GDP2004
A0.0340000.1508450.005761
B0.3968330.2108750.075654
C0.2320000.5857060.136107
All groups0.2209440.2120020.048046
p-value0.0007420.0021870.005618
Table 7. Clusters for IRE in 2016.
Group No.ABC
1CyprusCroatiaBulgaria
2Czech RepublicLatvia
3EstoniaLithuania
4HungaryRomania
5MaltaSlovakia
6PolandSlovenia
Table 8. Group averages for IRE in 2004.
Group IndicatorECR2016/EC2016EC2016/GDP2016ECR2016/GDP2016
A0.1533330.0942330.014727
B0.4698330.1065390.050602
C0.4610000.2231310.102849
All Groups0.3230770.1098280.038063
p-value0.0000270.0013630.000042
Table 9. Clusters for IREN in 2004.
No. GroupABC
1LatviaCroatiaBulgaria
2 Cyprus
3 Czech Republic
4 Estonia
5 Hungary
6 Lithuania
7 Malta
8 Poland
9 Romania
10 Slovakia
11 Slovenia
Table 10. Group averages for IREN in 2004.
Group\IndicatorECRN2004/EC2004EC2004/GDP2004ECRN2004/GDP2004
A0.0120540.1847810.002227
B0.0005200.1805040.000115
C0.0000820.5857060.000048
All Groups0.0013730.2120020.000273
p-value0.0000000.0000090.004595
Table 11. Clusters for IREN in 2016.
No. GroupABC
1HungaryCroatiaBulgaria
2LatviaCyprusRomania
3SlovakiaCzech Republic
4SloveniaEstonia
5 Lithuania
6 Malta
7 Poland
Table 12. Group averages for IREN in 2016.
Group/IndicatorECRN2016/EC2016EC2016/GDP2016ECRN2016/GDP2016
A0.0559080.0943320.005045
B0.1359490.0983450.012990
C0.1736440.1810120.030891
All Groups0.1171200.1098280.013300
p-value0.0001540.0000040.008662

