Article

An Optimal Scheduling Method for Multi-Energy Hub Systems Using Game Theory

1
Department of Automation, North China Electric Power University, Baoding 071003, China
2
Department of Engineering Electronics and Communication Engineering, North China Electric Power University, Baoding 071003, China
*
Author to whom correspondence should be addressed.
Energies 2019, 12(12), 2270; https://doi.org/10.3390/en12122270
Submission received: 22 May 2019 / Revised: 6 June 2019 / Accepted: 11 June 2019 / Published: 13 June 2019

Abstract

:
The optimal scheduling of multi-energy hub systems plays an important role in the safety, stability, and economic operation of the system. However, due to the strong uncertainty of renewable energy access, serious coupling, and the interaction among energy hubs of multi-energy hub systems, it is difficult for the traditional optimal scheduling method to solve these problems. Therefore, game theory was used to solve the optimal scheduling problem of multi-energy hub systems. According to the internal connection mode and energy conversion relationship of energy hubs, along with the competitive and cooperative relationship between multi-energy hubs, the game theoretic optimal scheduling model of the multi-energy hub system was established. Then, two cases and 50 groups of wind speed series were used to test the robustness of the proposed method. Simulation results show that the total power injection is −16,805.8, 104.1847, and −865.561 and the natural gas injection is 46,046.81, 27,727.65, and 63,039.54 in spring/autumn, summer, and winter, respectively, which is consistent with the characteristics of the four seasons. Furthermore, the optimal scheduling method using game theory has a strong robustness in multi-energy hub systems.

1. Introduction

Optimal scheduling of multi-energy hub systems is a main challenge in the global energy industry, which can efficiently realize the interconnection and complementarity between different energy forms, promote the local absorption of uncertain renewable energy sources, and increase the proportion of renewable energy sources [1]. The traditional optimal scheduling method poses difficulties in solving the optimal scheduling model of multi-energy hub systems, because there are many problems in multi-energy hub systems, such as serious coupling, strong uncertainty of renewable energy access, and interaction among energy hubs. Therefore, it is of great significance to study the optimal scheduling of multi-energy hub systems.
With the emergence of Combined Heat and Power (CHP) and Absorption Chiller (AC) technologies, the energy flow of the system generates complementary capabilities, and at the same time aggravates the coupling of the system, leading to increased difficulty in the optimal scheduling of the system. Orehounig et al. [2], from the Swiss Federal Institute of Technology, established the concept of energy hubs, which have been applied to different aspects of optimal design [3,4], optimal power flow [5], and optimal scheduling [6,7]. Moreover, considering the specific characteristic constraints of the system network, scholars have studied the coupling operation calculation of the power grid and natural gas [8], the interaction between the power grid and heating network [9], and the interaction of electricity/heat/gas [10].
Researchers have been focusing on the optimal scheduling problem of multi-energy hub systems, including the establishment and solution of the optimal scheduling model. In establishing an optimal scheduling model of multi-energy hub systems, a mixed integer linear programming model is incorporated to solve the coupling relationship between different energy sources [11]. Previous work has proposed the robust security-constrained unit commitment (SCUC) [12] to enhance the operational reliability of the system. However, there are strong uncertainties in the integrated energy system, such as the wind power and load. Hence, in [13], a comprehensive optimal bidding strategy model is established to solve uncertain problems, such as market price and wind power. An optimal probabilistic scheduling model of energy hub operations is presented, and simulation results show that the model can meet the time-varying load and price [14]. A model based on a mixed integer linear programming (MILP) framework is also proposed for stochastic user behaviour and uncertain renewable energy [15].
With respect to solving the optimal scheduling model, particle the swarm optimization method is used to calculate the output of Combined Cold, Heat and Power (CCHP) units [16]. A hybrid optimization method based on the genetic algorithm (GA) and a nonlinear interior point method (IPM) is utilized to solve the optimal day-ahead scheduling model for an integrated urban energy system [17]. To consider the uncertain energy input and output problem, reference [18] presents an improved particle swarm optimization and two-point estimate method for reducing the computational complexity. Considering the uncertainties of wind power, energy prices, and energy demands, [19] proposes a hybrid stochastic/IGDT (information gap decision theory) optimization method to solve the optimal scheduling problem of wind integrated energy hub systems. Nevertheless, much equipment and complex relations in the system exist and lead to the large dimension of the mathematical model. Therefore, in [20], an integrated approach to designing electrical hubs is proposed, which combines optimization, multi-criteria evaluation, and decision-making.
The above-mentioned methods provide a useful reference for the design and solution of the optimal scheduling model of multi-energy hub systems. However, energy hubs are characterized by a mutual influence and restriction; that is, each energy hub is influenced and restricted by other hubs while pursuing the minimum payment of itself. Therefore, game theory was used to solve this problem. Game theory has been studied and applied in many fields, such as power grid vulnerability analysis [21], power plant pricing [22], and profit distribution [23,24]. In the field of integrated energy systems, a cooperative game model is established to determine the optimal scheduling strategy of the integrated energy system, aiming at the daytime economic optimal scheduling problem of the system [25]. Moreover, an energy grand coalition is constructed using a cooperative game, which can effectively reduce the variability in the local network load and minimize the running energy cost [26]. To further increase energy sharing, reference [27] develops a real-time demand response model based on the Stackelberg game. Game theory has achieved some results in solving the energy system scheduling problem. In the paper, game theory was applied to the optimal scheduling of a multi-energy hub system to improve its economy and robustness. Firstly, the internal coupling model of multi-energy hubs was established, including an internal coupling model of an energy hub and transmission network model between energy hubs, according to the internal connection mode and energy conversion relationship of energy hubs. Secondly, based on the competition and cooperation among multi-energy hubs, the game theoretic model of the energy flow scheduling was established. Moreover, the quantum particle swarm optimization was used to obtain the game theoretic optimal scheduling solution for multi-energy hub systems. Finally, the economy and robustness of the proposed game theoretic optimal scheduling was tested by using two cases of a multi-energy hub system with 50 different wind power output sequences.
The rest of the study proceeds as follows: Section 2 introduces the optimal scheduling model of multi-energy hub systems in detail; Section 3 presents research on the game theoretic optimal scheduling method for multi-energy hub systems; Section 4 discusses the results of the optimal scheduling and the effects of wind speed change on the optimal scheduling of the system; and finally, several conclusions are summarized in Section 5.

2. The Optimal Scheduling Model of Multi-Energy Hub Systems

A multi-energy hub system coordinates the balance of energy supply and demand by changing the injection volume of electric power and natural gas to ensure the coordination, stability, and economic operation of the energy system with traditional energy and renewable energy. In general, the optimal scheduling model of multi-energy hub systems mainly includes an internal coupling model of the energy hub and a transmission network model among energy hubs.

2.1. Internal Coupling Model of the Energy Hub

An energy hub is considered to be a unit that can convert, regulate, and store multiple energy carriers, representing an interface between different energy infrastructures and/or loads [28]. In the multi-energy hub system, the energy hub makes different energy flow inputs meet the output demand of the system through the optimal scheduling strategy. The simplified structural diagram of an energy hub is shown in Figure 1. In Figure 1, Pe, Pg, and Ph represent the power, natural gas, and thermal inputs to the energy hub, respectively. Le, Lc, and Lh represent the electrical, cold, and thermal output of the energy hub, respectively. The supply side of the energy hub includes the electricity, natural gas, and heat, and the demand side of the user is the demand for electricity, heat, and cold. A coupling matrix model is used to establish the input carriers that are mapped to the outputs of an energy hub, as illustrated in Equation (1) [29].
[ L α L β . . . L ψ ] = [ c α , α c β , α . . . c ψ , α c α , β c β , β . . . c ψ , β c α , ω c β , ω . . . c ψ , ω ] × [ P α P β . . . P w ]
Here, Lj and Pi denote the j load at the hub output port and i energy carrier at its input port, respectively, and cij is the coupling factor of the energy hub input and output (0 ≤ cij ≤ 1). For a single-input single-output system, the coupling factor is the converter efficiency. When considering multiple-input multiple-output systems, the coupling factor is generally represented as the matrix of the corresponding converter efficiency. A scheduling factor is introduced to determine how the power that flows from the input carrier is distributed among the converters of the hub. The energy hub input–output relationship can be defined as Equations (2a)–(2c).
[ P α P β . . . P ω ] = [ ν α , α ν β , α . . . ν ψ , α ν α , β ν β , β . . . ν ψ , β ν α , ω ν β , ω . . . ν ψ , ω ] × [ P α P β . . . P ω ]
[ L α L β . . . L ω ] = [ η α , α η β , α . . . η ψ , α η α , β η β , β . . . η ψ , β η α , ω η β , ω . . . η ψ , ω ] × [ P α P β . . . P ω ]
[ L ] = [ η ] × [ N ] × [ P ]
Energy carriers received at the input port of hub converters are represented as P , and the input carrier vector of hub energy carriers is defined as P. v is the scheduling factor, the range of which is 0 ≤ v ≤ 1, and η and N are the efficiency and scheduling factor matrices of energy hubs, respectively. For simplicity, the converter efficiency is assumed to be constant, which leads to a constant efficiency matrix. In this study, the scheduling factor is a variable factor in the multi-energy hub system operation study. The energy hub optimizes the scheduling relationship between the input and output energy flows by adjusting the scheduling factor. This characteristic is proposed as the point where the multi-carrier economic scheduling method can prove its novelty and necessity in research on the multi-energy hub system.
The energy hub shown in Figure 1 is taken as an example, but the energy storage and refrigeration equipment are not considered. The inputs of the energy hub are electricity and natural gas, and the outputs are the electrical load and thermal load. By using the law of energy conservation, the output of the converter is expressed as the product of input and efficiency:
L e ( t ) η C o n v P w ( t ) = L e n e t ( t )
{ L e n e t ( t ) = η e e T p e ( t ) + ν η g e G T p g ( t ) L h ( t ) = [ ν η g h G T + ( 1 ν ) η g h F ] p g ( t )
Having set the relationship matrix between input carriers and output loads in each hub, the amounts of input carriers can be obtained as follows:
[ L e n e t ( t ) L h ( t ) ] [ N t ] × [ η ] × [ P e ( t ) P g ( t ) ] = 0
[ P e ( t ) P g ( t ) ] = ( [ N t ] × [ η ] ) 1 [ L e n e t ( t ) L h ( t ) ]
In Equations (3a)–(3d), Pe(t) and Pg(t) represent the power and natural gas input of the energy hub at time t, respectively; Le(t) and Lh(t) indicate the power and heat demand of the user at the moment, respectively; Pw(t) represents the wind power input of the energy hub at time t; L e n e t ( t ) represents the power demand that the user needs from the energy hub converter; and η e e T , η g e G T , η g h G T , and η g h F are the conversion efficiencies of the transformer, gas-to-electricity in CHP, gas-to-heat in CHP, and gas-fired boiler, respectively, in the energy hub.
Pw(t) represents the wind power output to the energy hub at time t, which depends on the characteristics of the wind turbine and wind speed. For the study of the wind speed series, the probability distribution function is usually used to represent the change of wind speed in the power system, in which the wind speed distribution at the designated location accords with the Weibull distribution with time. The Weibull probability distribution function for wind speed is given by the following equation:
f θ ( V ) = ( k c ) ( θ c ) k 1 e ( θ c ) k
In Equation (4), k and c represent the shape factor and scale factor, respectively, and θ represents the random variables related to wind speed.
The output power of wind turbines is a nonlinear function of wind speed, and is effected by several factors, such as the turbine type, turbine rotor, and gearbox. A simplified linear formula is used to characterize wind power:
P w = { 0 V < v i n o r V v o u t P r ( V v i n ) v r v i n V < v r P r v r V < v o u t
In the formula, Pr represents the rated power of the wind turbine; V is the wind speed; and vin, vout, and vr are the cut-in speed, cut-off speed, and rated speed of the wind turbine, respectively.
According to Equations (3a)–(3d), the input electric and natural gas power of the energy hub can be expressed as a function of the energy demand L e n e t ( t ) and Lh(t). Equation (6) is obtained and presented as follows:
{ P e ( t ) = 1 η e e T L e n e t ( t ) ν η g e G T η e e T [ ν η g h G T + ( 1 ν ) η g h F ] L h ( t ) P g ( t ) = 1 [ ν η g h G T + ( 1 ν ) η g h F ] L h ( t )
The scheduling factor v is the proportion of natural gas used by CHP. Therefore, the boundary constraint of the scheduling factor is as follows:
0 ν 1

2.2. Transmission Network Model among Energy Hubs

Transmission loss needs to be considered in establishing the transmission network model among energy hubs because of the different locations of each energy hub in the multi-energy hub system. Therefore, the node power balance equation based on the energy cost and transmission loss is established to determine the energy flow transmission and loss relationship between energy hubs. Figure 2 describes the power flow in the energy network, where Hub is the energy hub, N is the natural gas injection, and G is the power generation device.
In Figure 2, each hub receives different energy flows as network nodes. Based on the lossless power balance of the nodes, the power flow balance model of each network node is established, as shown in Equations (8a) and (8b).
[ α 11 α 21 . . . α x 1 α 12 α 22 . . . α x 2 α 1 y α 2 y . . . α x y ] A α × [ F i α F j α . . . F ω α ] F α = [ P i α P j α . . . P ω α ] P α
A α F α = P α
In Equations (8a) and (8b), α represents different types of energy, including natural gas, electricity, and so on; Aα is the connection matrix among multi-energy hubs, for which the element value is {−1, 0, 1}; F represents the amount of external energy α injected into the multi-energy hub system through hub i; and P is the energy α value injected into the energy hub i.
The line loss is approximated as polynomial functions of the corresponding power flow [29]:
Λ i α = k = 1 K α f α | F i α | k
where Λ is the loss of the energy load α flowing into the energy hub i, fα is the loss factor of the energy load α flow process, and k is the order. The specific energy flow loss relationship depends on different energy carriers. For wires, the loss can be approximated by the quadratic function of the flow power. The loss of the gas pipe increases with the natural gas flow cube, so:
Λ i e = f i e F i e 2
Λ i g = f i g F i g 3
where fie and fig represent the energy loss coefficients of electricity and natural gas flowing into the energy hub i. All the wire and natural gas pipelines are assumed to have the same physical properties. At the same size, the loss factor is proportional to the line length.
The objective function of the economic dispatch model is proposed in this section to minimize electrical and gas costs. For routine economic dispatch, the consumption and supply of the energy network restrict energy scheduling. The polynomial functions of power flow are established to describe system costs. Ci is the total cost associated with the energy hub i and expressed as
C i = { α = e , g ( a α + q = 1 Q α b α q ( P α + Λ α ) q ) P α 0 α = e , g ( a α + r = 1 R α c α r | P α + Λ α | r ) P α < 0
In Equation (11), aα, bαq, and cαr are the price coefficients of energy flow α, and Qα and Rα represent the order of the energy flow α demand and output cost polynomial, respectively. The total cost of a multi-energy hub system can be expressed as follows:
C m = i = 1 m C i
In the formula, m is the number of energy hubs in the network. After integrating Equations (6), (8a), (8b) and (9) into (11), the input power and line loss of the hub can be expressed as a function of the scheduling factor v. Therefore, the total cost of a multi-energy hub can be expressed as follows:
C i = ( ν i , ν 2 , , ν i , , v n ) C m = f ( ν i )
In Equations (10a), (10b), (12) and (13), energy dispatch is constrained by different energy hubs in pursuit of optimal payment in the multi-energy hub system. The game theoretic optimal scheduling method is used to deal with the optimal scheduling problem and ensure that energy hubs make more realistic decisions.

3. Game Theoretic Optimal Scheduling Method for the Multi-Energy Hub System

Game theory refers to making the best decisions or actions for one’s own party on the premise of fully understanding the optimal decision making and payment information of other participants. According to the degree of cooperation among participants, game theory can be divided into cooperative and non-cooperative theory. According to the change in the game theoretic process over time, the theory can be divided into dynamic games and static games. When establishing a game pattern for a specific project, it is necessary to clarify the participants, strategies, and payments or benefits in the game theoretic process.

3.1. Equations of the Game Theoretic Optimal Scheduling Model Among Multi-Energy Hubs

The game theoretic optimal scheduling model among energy hubs can be modelled according to the three basic elements of game theory. The participants in the game theoretic model among energy hubs are N energy hubs, which are represented by K1, K2, …, KN, and the set of participants is recorded as follows:
N = { K 1 , K 2 , , K i , , K N }
The strategy variable of game theoretic participants is v; that is, the proportion of natural gas used by CHP in N energy hubs. The vi decision variable can be continuously valued in a certain range. According to Equation (7), each participant has a continuous strategy space Ωi that is specifically expressed as follows:
v i Ω i = [ 0 , 1 ]
According to Equation (6), the payment cost Ci of the energy hub is a polynomial function of the input power Pi. A functional relationship exists between the input power and the decision variable vi. Therefore, the payment set of the game theory is as follows:
C = ( C 1 , C 2 , , C i , , C N )
The game theoretic optimal scheduling model of the multi-energy hub system is established according to Equations (6), (10a), (10b), (11), (13)–(16). In the multi-energy hub system, the scheduling decision of the energy hub is affected by other decision makers; as such, game theory is advantageous for decision making in the optimal scheduling problem of the multi-energy hub system.
No mature solution is present because the game theoretic optimal scheduling model of the multi-energy hub system is a typical nonlinear model. In this paper, quantum particle swarm optimization [30] is used to obtain the optimal solution of the proposed game theoretic model.

3.2. Solution of the Game Theoretic Optimal Scheduling Model

In contrast to general multi-objective optimization, the Nash equilibrium problem makes its own optimal decision considering the interests of other participants. The steps taken to solve the game theoretic optimal scheduling of the multi-energy hub system are shown in Table 1.
In Table 1, j is the number of iterations, C i j ( t ) is the energy hub i policy cost for the j-th iteration at time t, Yi(t) denotes the minimal strategy profile for hub i, and C j ( t ) = ( C 1 j ( t ) , C 2 j ( t ) , , C i j ( t ) , C n j ( t ) ) is the vector of the strategy cost for all energy hubs in iteration j at time t. As shown in Table 1, the energy hubs interact with one another at the beginning of a day to determine the optimal electricity and natural gas load profiles for that day. In each iteration, the energy hub updates the scheduling factor and shares these values with other hubs for their updates. When no participant can receive less payment by independently changing the policy, the combination of strategies is considered as the Nash equilibrium solution.
In lines 1 and 2, the energy hub randomly initializes its strategy profile and establishes the game theoretic model. The loop in lines 3 to 6 describes the game relationship among energy hubs. Within this loop, the energy hub communicates the strategy profile to other energy hubs in line 4. The hub then updates the strategy profile as follows:
[ Y i ( t ) , v i j ( t ) ] = min C i ( v i j 1 ( t ) , v 2 j 1 ( t ) , v 3 j 1 ( t ) )
In line 6, the iteration number j is updated. In line 7, the stopping criterion for the algorithm is given, where ζ is the accuracy of the solution. In this solution step, quantum particle swarm optimization is used to solve the optimal strategy.

4. Case Studies

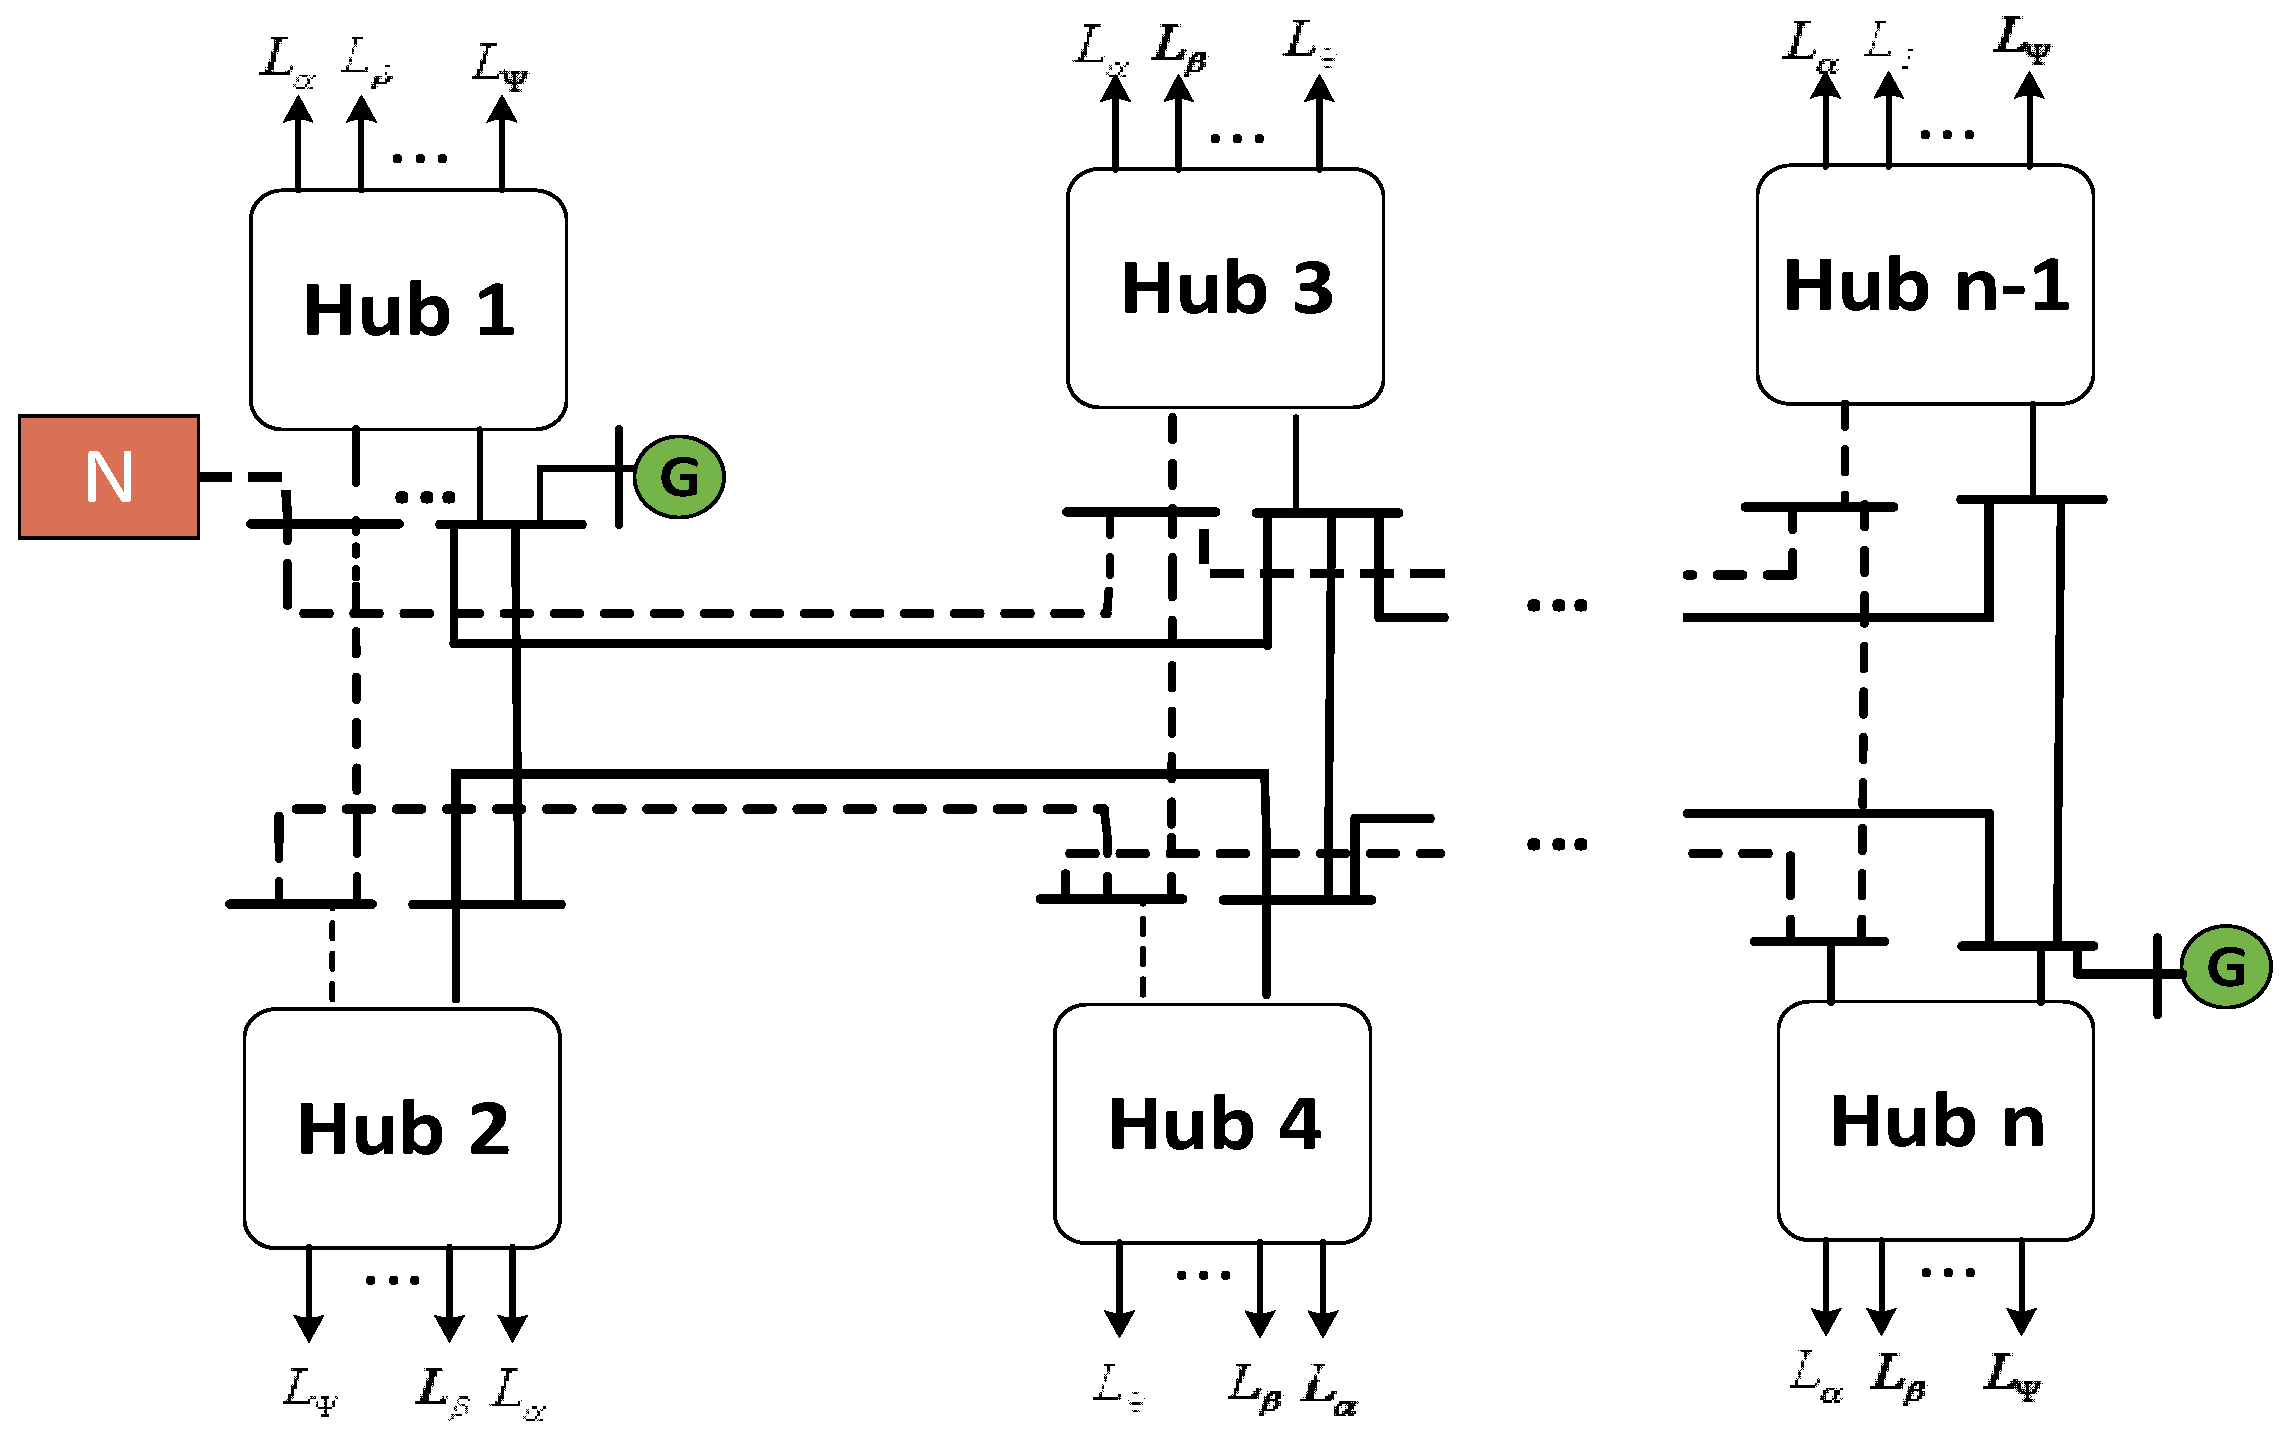
This section takes the simple multi-energy hub system shown in Figure 3 as an example to verify the applicability, stability, and efficiency of the proposed method.
In the system (Figure 3), the simplest power flow network is composed of three identically constructed hubs. Each hub is equipped with a CHP, gas furnace device, and power and natural gas input channels to meet the user’s electrical and thermal load demand. The multi-energy hub system exchanges power with the superior/adjacent system through the energy injection point and is injected into the network by the relaxed stream Fα0. In this network, according to the electrical and thermal load demand of each energy hub, the power inside the hub, the energy distribution of natural gas, the energy injection amount in the network, and the optimal energy transmission route are changed. Each energy hub changes the distribution strategy of electric power and natural gas to minimize its own energy cost. At the same time, the distribution strategy is constrained by the network location and the two other energy scheduling demands, thereby forming a pattern where three hubs compete with one another.

4.1. Game Theoretic Optimal Scheduling Model of the System

Because the multi-energy hub system has a game pattern of three hubs, this paper uses game theory to establish the optimal scheduling model of the system. According to the second section multi-energy hub system optimal scheduling model (1)–(13), the game optimal scheduling model of the system is
N = { K 1 , K 2 , K 3 }
v i [ 0 , 1 ] , i { 1 , 2 , 3 }
C = ( C 1 , C 2 , C 3 )
Among them, N represents the participant set; K1, K2, and K3 represent the three energy hubs in the multi-energy hubs system shown in Figure 3; vi is the scheduling factor of CHP in each energy hub; C is the payment set of the game theoretic optimal scheduling model; and C1, C2, and C3 are respectively the costs of three energy hubs and are expressed as follows:
C i = { α = e , g ( a α + q = 1 Q α b α q ( P i α + Λ i α ) q ) P i α 0 α = e , g ( a α + r = 1 R α c α r | P i α + Λ i α | r ) P i α < 0 i { 1 , 2 , 3 }
In Equation (21), the natural gas input Pig and electric power input Pie of the hub at t time can be expressed by Equation (22), and the electric loss Λie and gas loss Λig are shown in Equation (23).
{ P i e ( t ) = 1 η e e T L e n e t ( t ) ν i η g e G T η e e T [ ν i η g h G T + ( 1 ν i ) η g h F ] L h ( t ) P i g ( t ) = 1 [ ν i η g h G T + ( 1 ν i ) η g h F ] L h ( t ) i { 1 , 2 , 3 }
{ Λ i e = f i e F i e 2 Λ i g = f i g F i g 3 i { 1 , 2 , 3 }

4.2. Optimal Scheduling Solution

4.2.1. Case 1: Optimal Scheduling Solution of System Load and Wind Power Input without Considering Seasonal Variation

In this section, the game theoretic optimal scheduling model of the system is solved according to the 24-h electrical and thermal load demand of the three energy hubs [31]. The system data are all standard values.
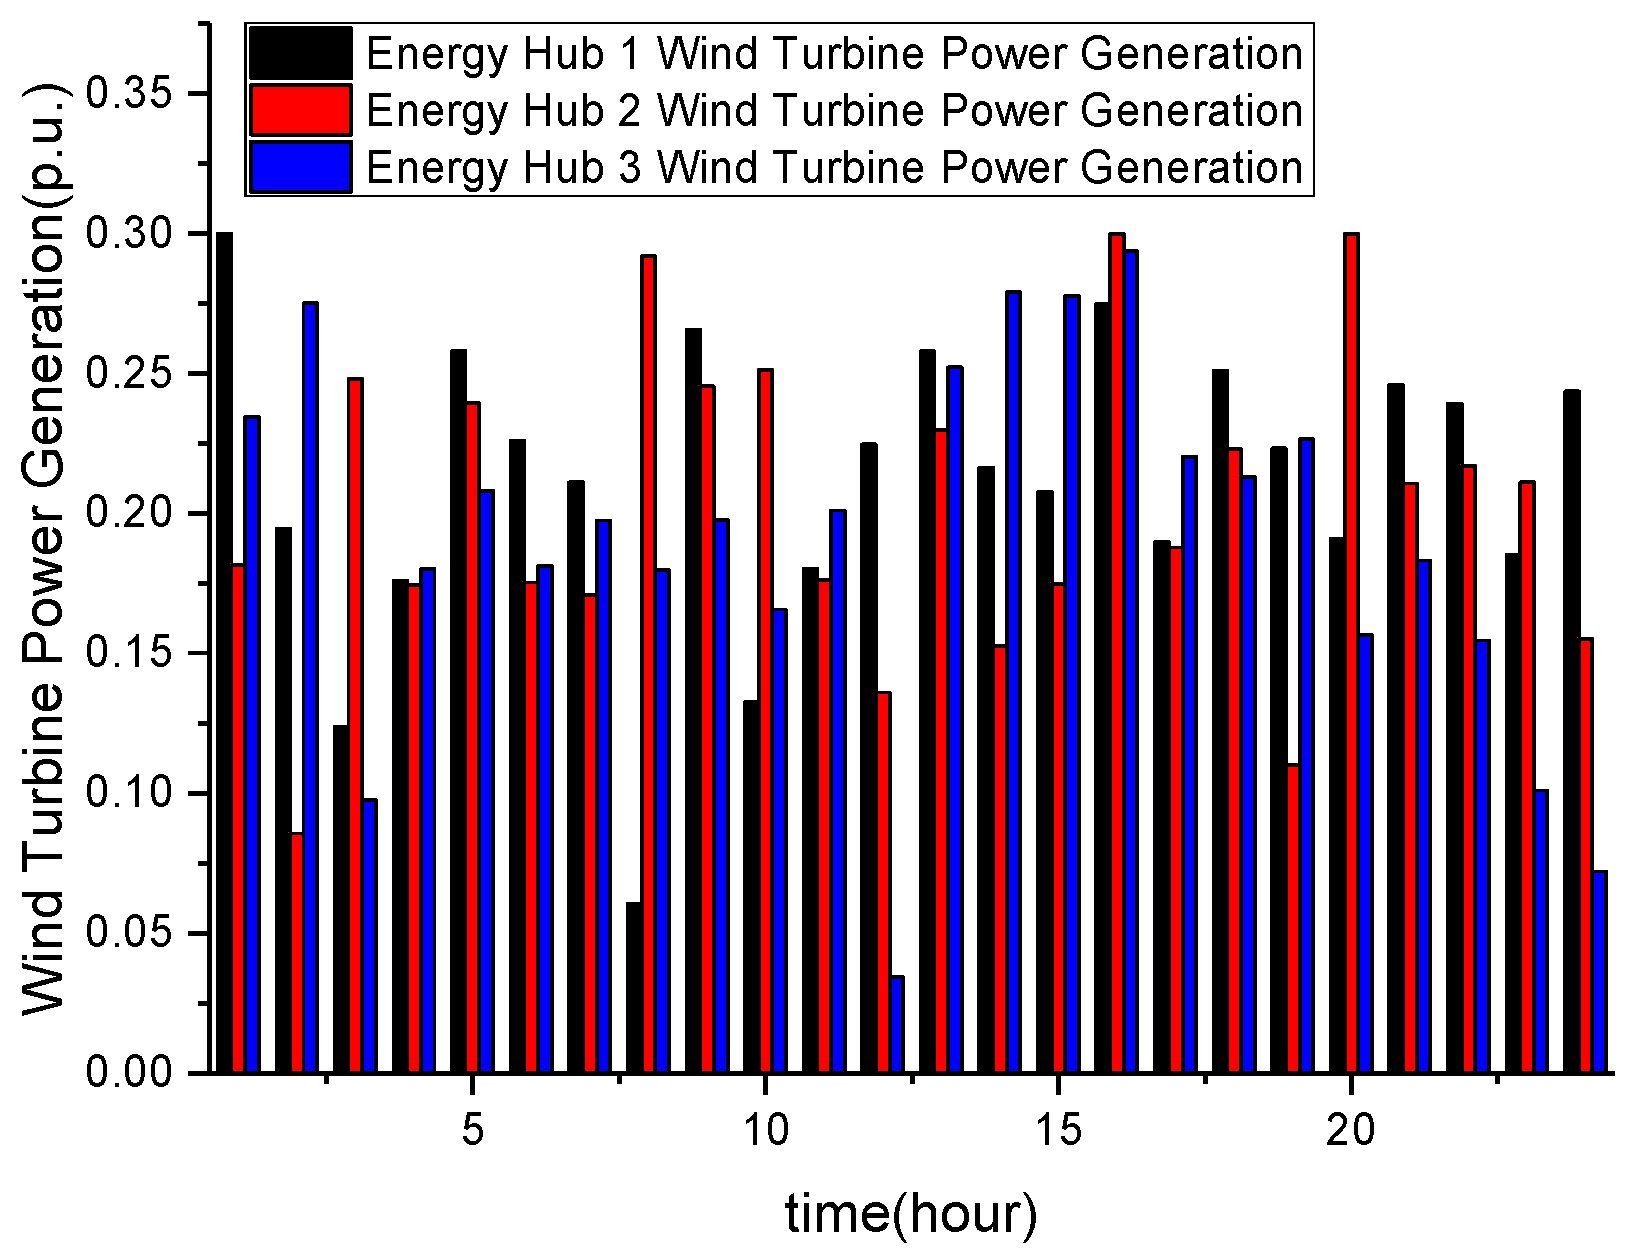
Figure 4 shows the variation in electrical and thermal loads for a one-day period, with three hubs having the same thermal and electrical load demand. Figure 5 shows the variation of wind turbine output in the three energy hubs; the injection wind speed random sequences of the three energy hubs conform to the Weibull distribution and satisfy wind speed variation of the actual wind farm. Energy prices are assumed to be linear, and the cost factors for the energy hub to input electricity and natural gas are shown in Table 2 [29]. In addition, the operating cost of wind power generation is very small and can be ignored. The same type of transmission line is assumed to have the same physical properties, the loss coefficient is proportional to the line length, and the line specifications are given in Table 3 [29]. The conversion efficiency in the system is ηee = 0.9, η g h G T = 0.3, ηF = 0.75, and ηge = 0.4, and the detailed data are referred to in [29].
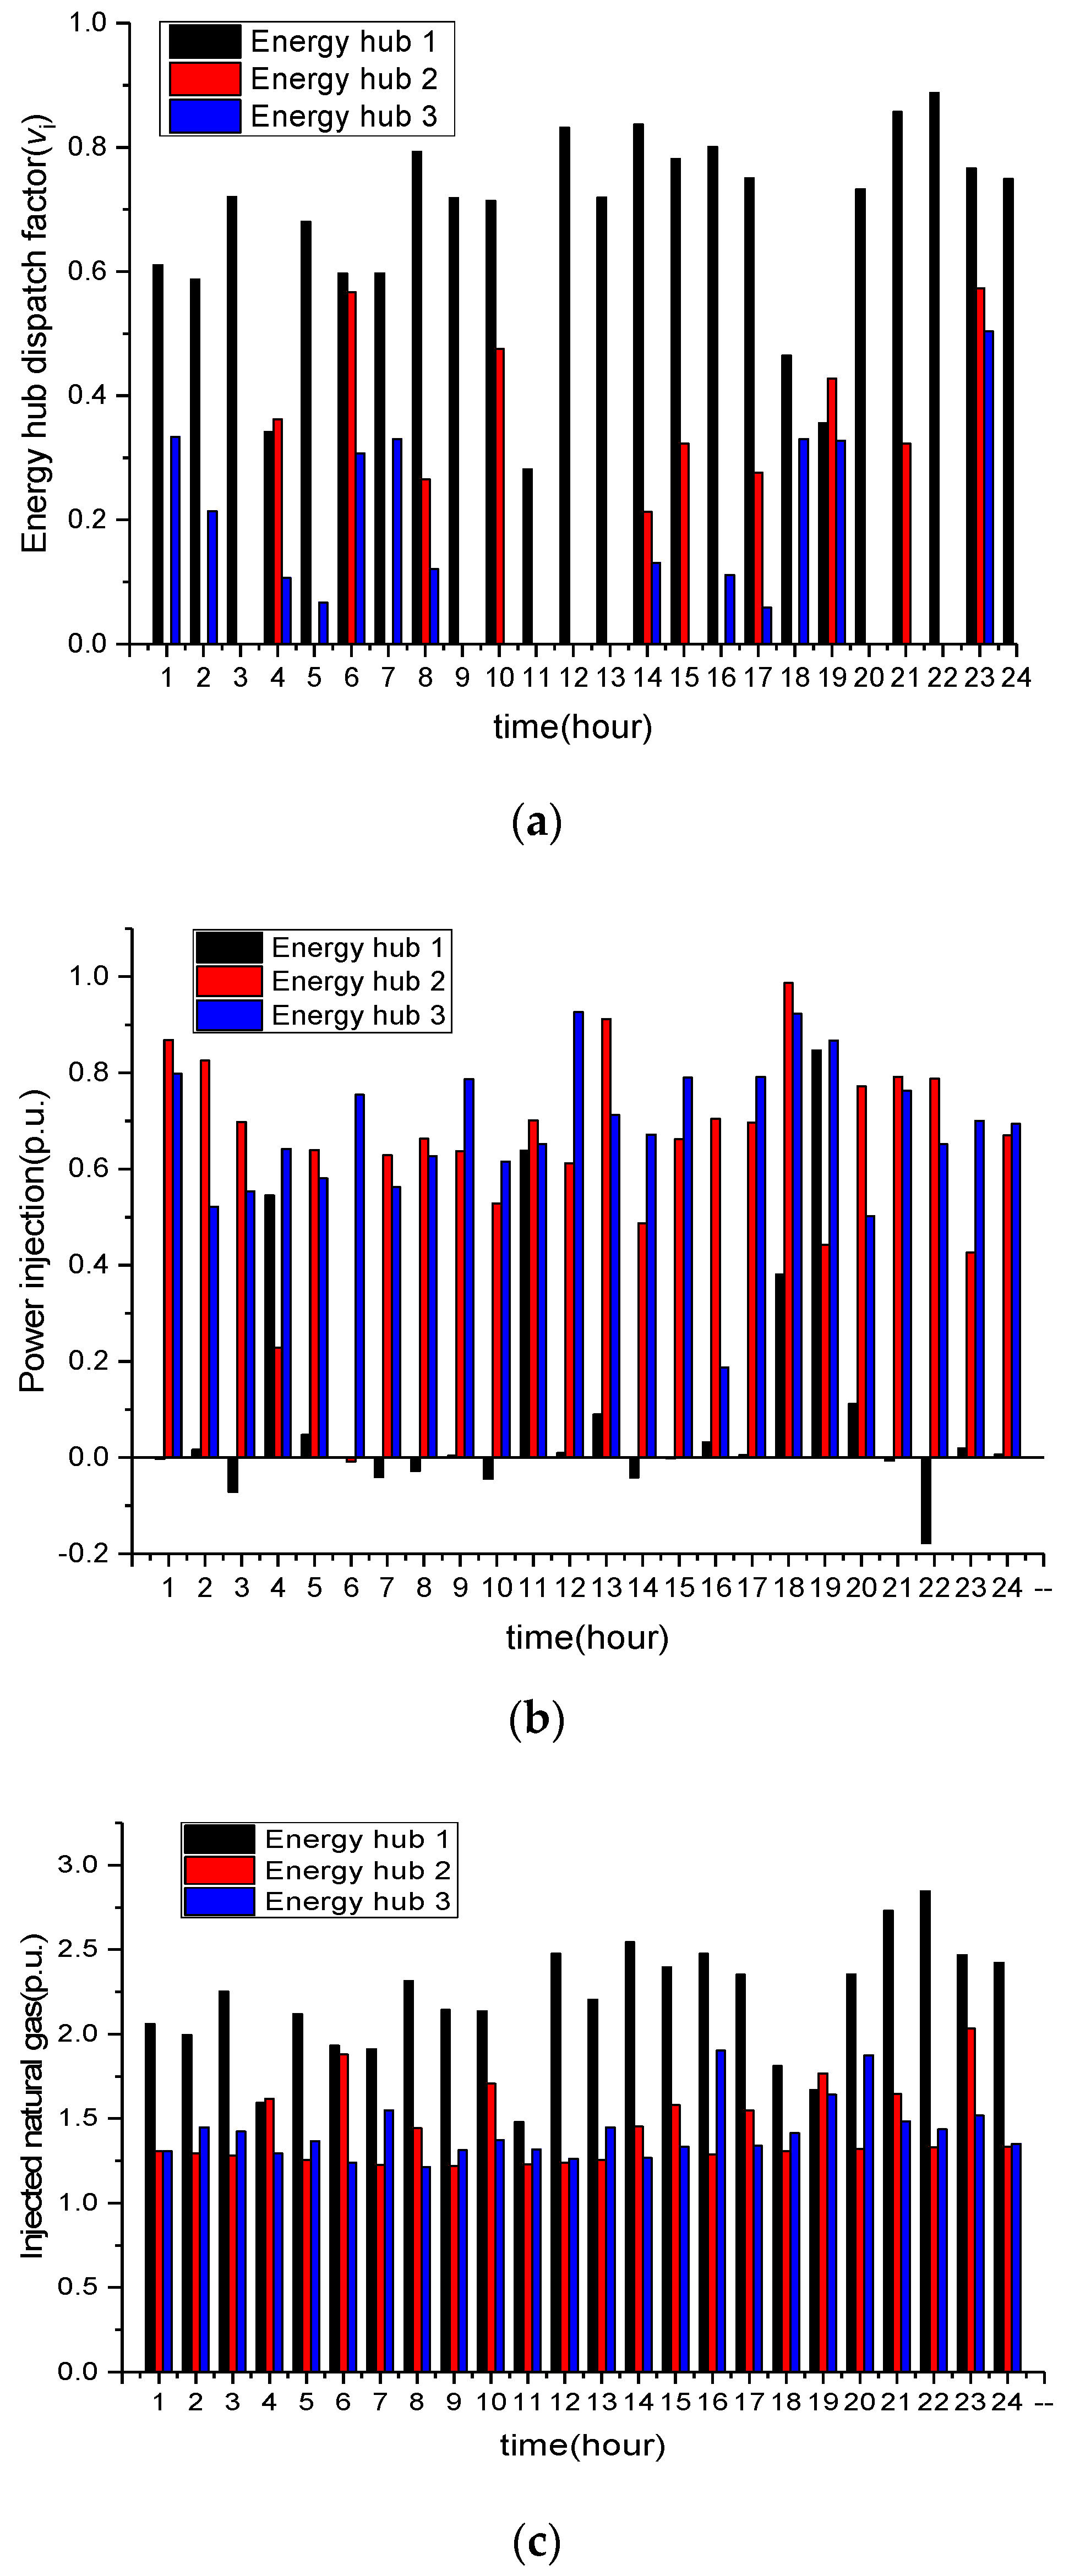
As shown in Figure 4 and Figure 5, the electrical and thermal loads of the three energy hubs are changed smoothly and slowly. The power and thermal demand of the network show a gradual upward trend in the afternoon, and the power demand decreases after 22:00. The output power of the wind turbines connected in the three energy hubs is unstable, fluctuating between 0.1 and 0.3 per unit power. Based on the above data and the established model, the optimal scheduling results of the multi-energy hub system are shown in Figure 6.
Figure 6a–c show that the variation trend of the scheduling factor is consistent with natural gas; the injection of electricity and natural gas fluctuates with the change of wind power generation. From Figure 6, it can see that the three energy hubs need to change the injected electricity and natural gas volume, as well as the scheduling factor of the three energy hubs, due to the fluctuation of the position and wind power generation. In energy hub 1, the scheduling factor v1 fluctuates around 0.7, and the injection of electricity is almost zero or even negative (the negative number represents the power provided by the energy hub to the outside), while a large amount of natural gas is injected. This is because energy hub 1 is close to the energy injection point and never causes energy transmission losses, and heating needs are then met by natural gas as much as possible. Meanwhile, because energy hubs 2 and 3 are far from the injection point and have more gas transmission losses, the scheduling factors v2 and v3 of energy hubs 2 and 3 are smaller, the amount of power injection is greater, and the amount of natural gas is lower. Therefore electricity is a better choice to meet power needs for fewer transmission losses in energy hubs 2 and 3 for a reasonable energy distribution.
The change in the energy supply mode of CHP can meet the demand for the electricity and heat load in several ways. This redundancy increases the reliability of the energy supply and provides the possibility of optimizing input energy, such as cost of use, availability, emissions, and so on.
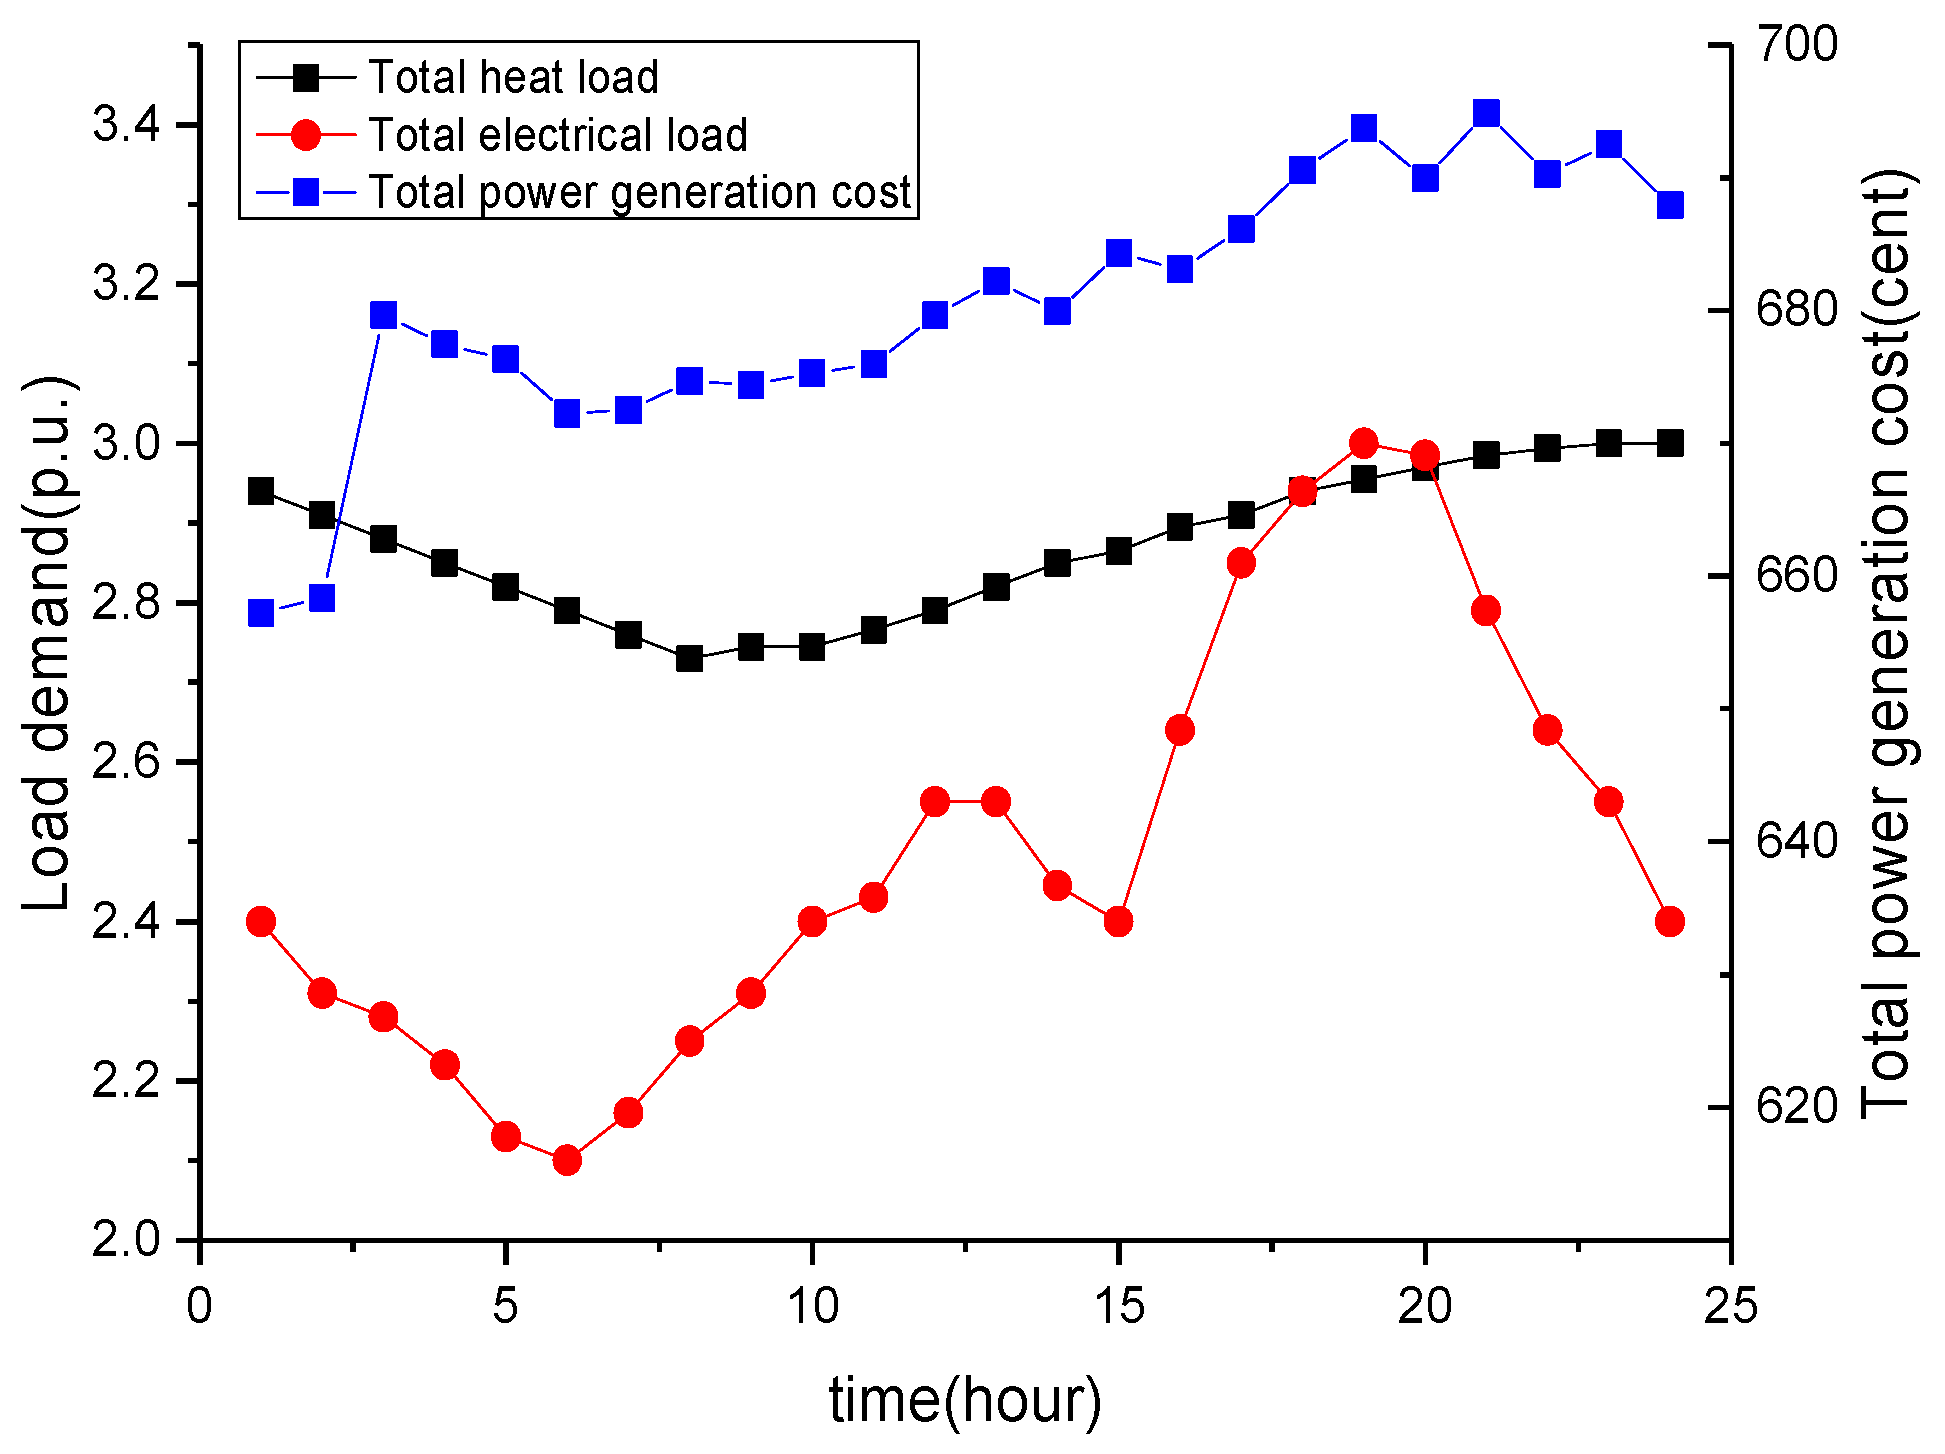
Figure 7 shows the changes in power, heat, and the total network consumption in a 24-h multi-energy hub system. The change trend of the total cost is basically consistent with the change trend of the total electrical load in the system, which is due to the high operating cost of the system power input; that is, the total electrical load is the direct influencing factor of the total cost. The neglect of the wind turbine power generation cost improves the wind utilization rate to the greatest extent. Therefore, the system heat demand forces the natural gas to be used to the maximum level; in other words, the heat load of the energy hub forces natural gas to rise to the maximum level allowed. Consequently, a decrease in the scheduling factor implies that natural gas is devoted to producing heat. When the heat load is large or the wind turbine output is insufficient, the system will increase the power injection.

4.2.2. Case 2: Optimal Scheduling Solution of the System When Considering Seasonal Variation

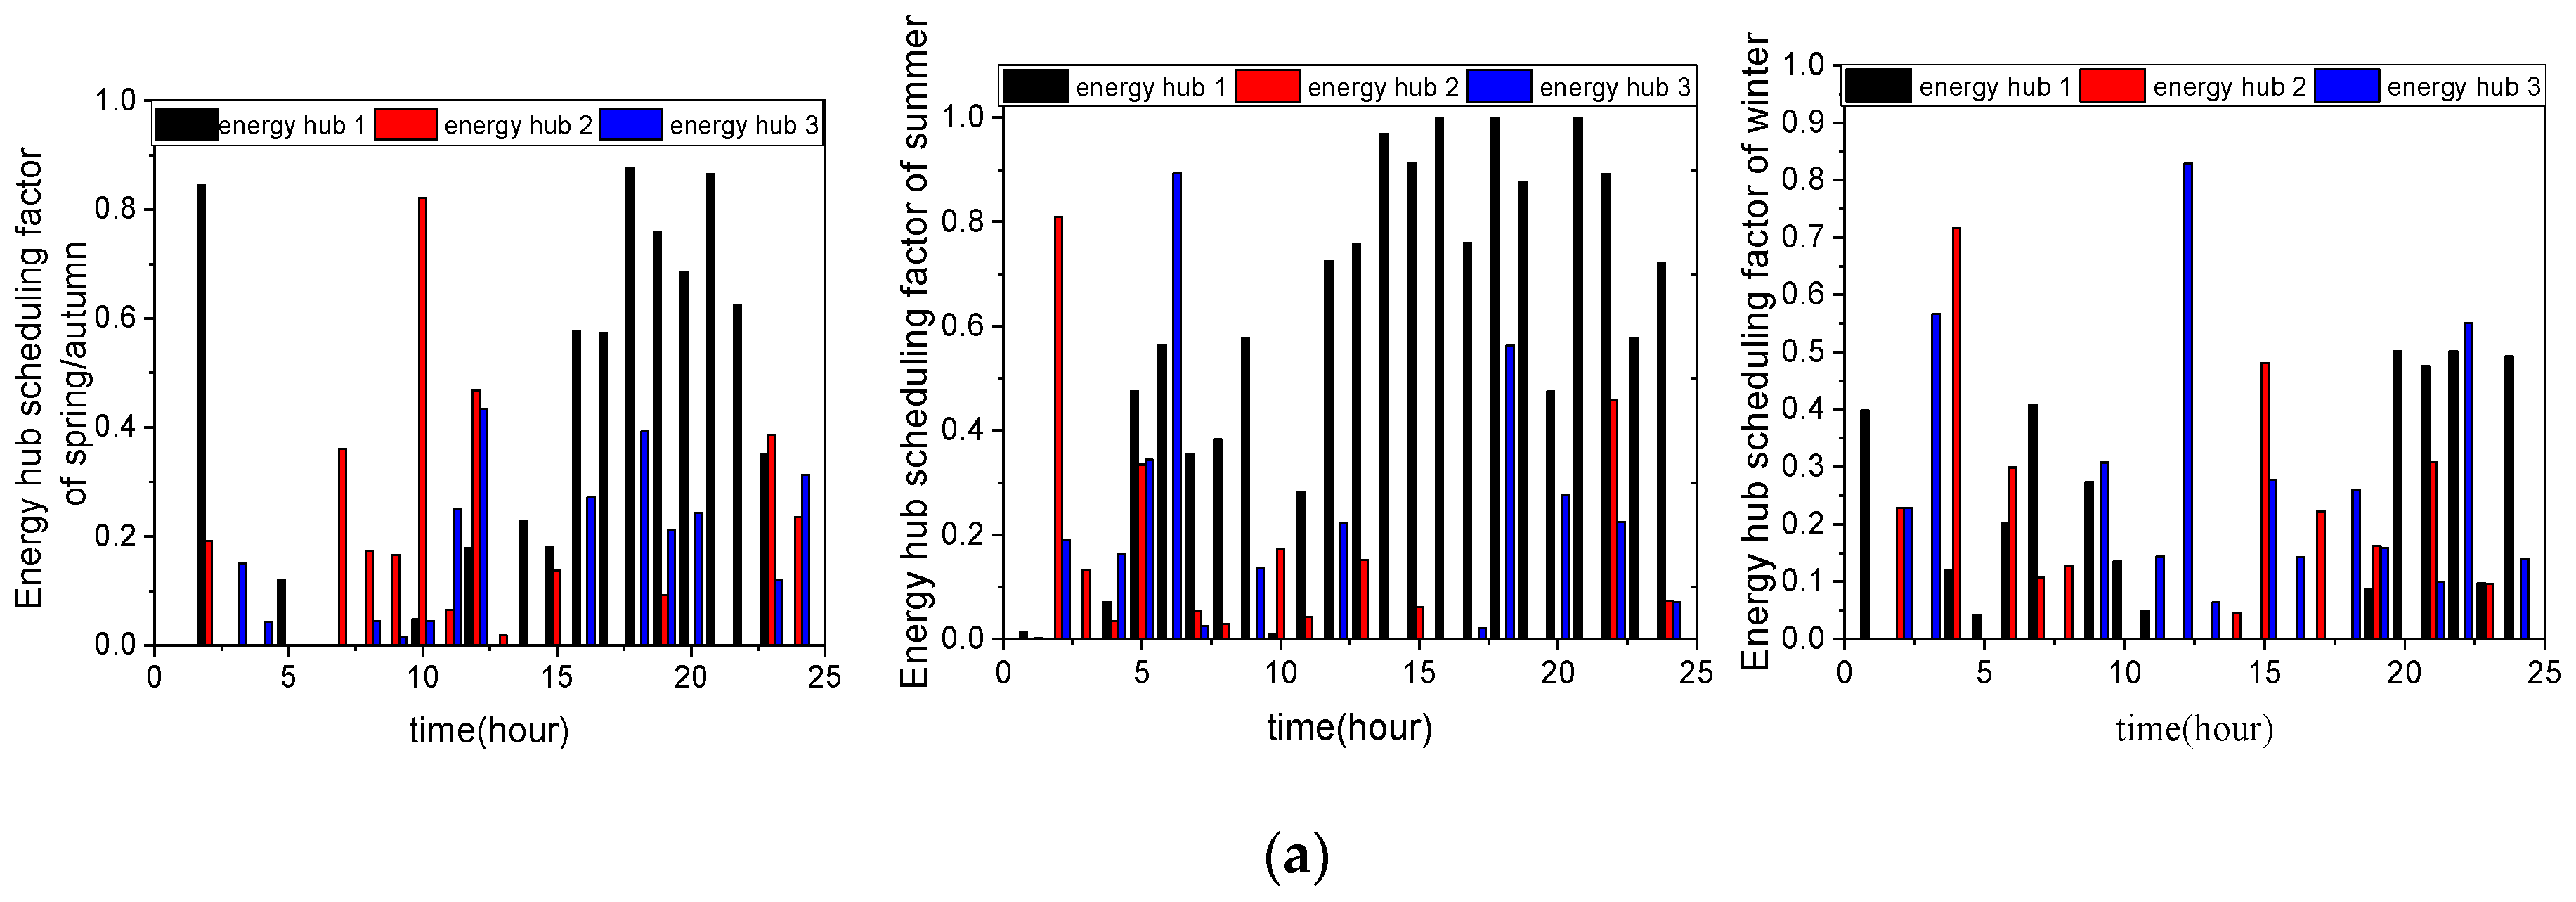
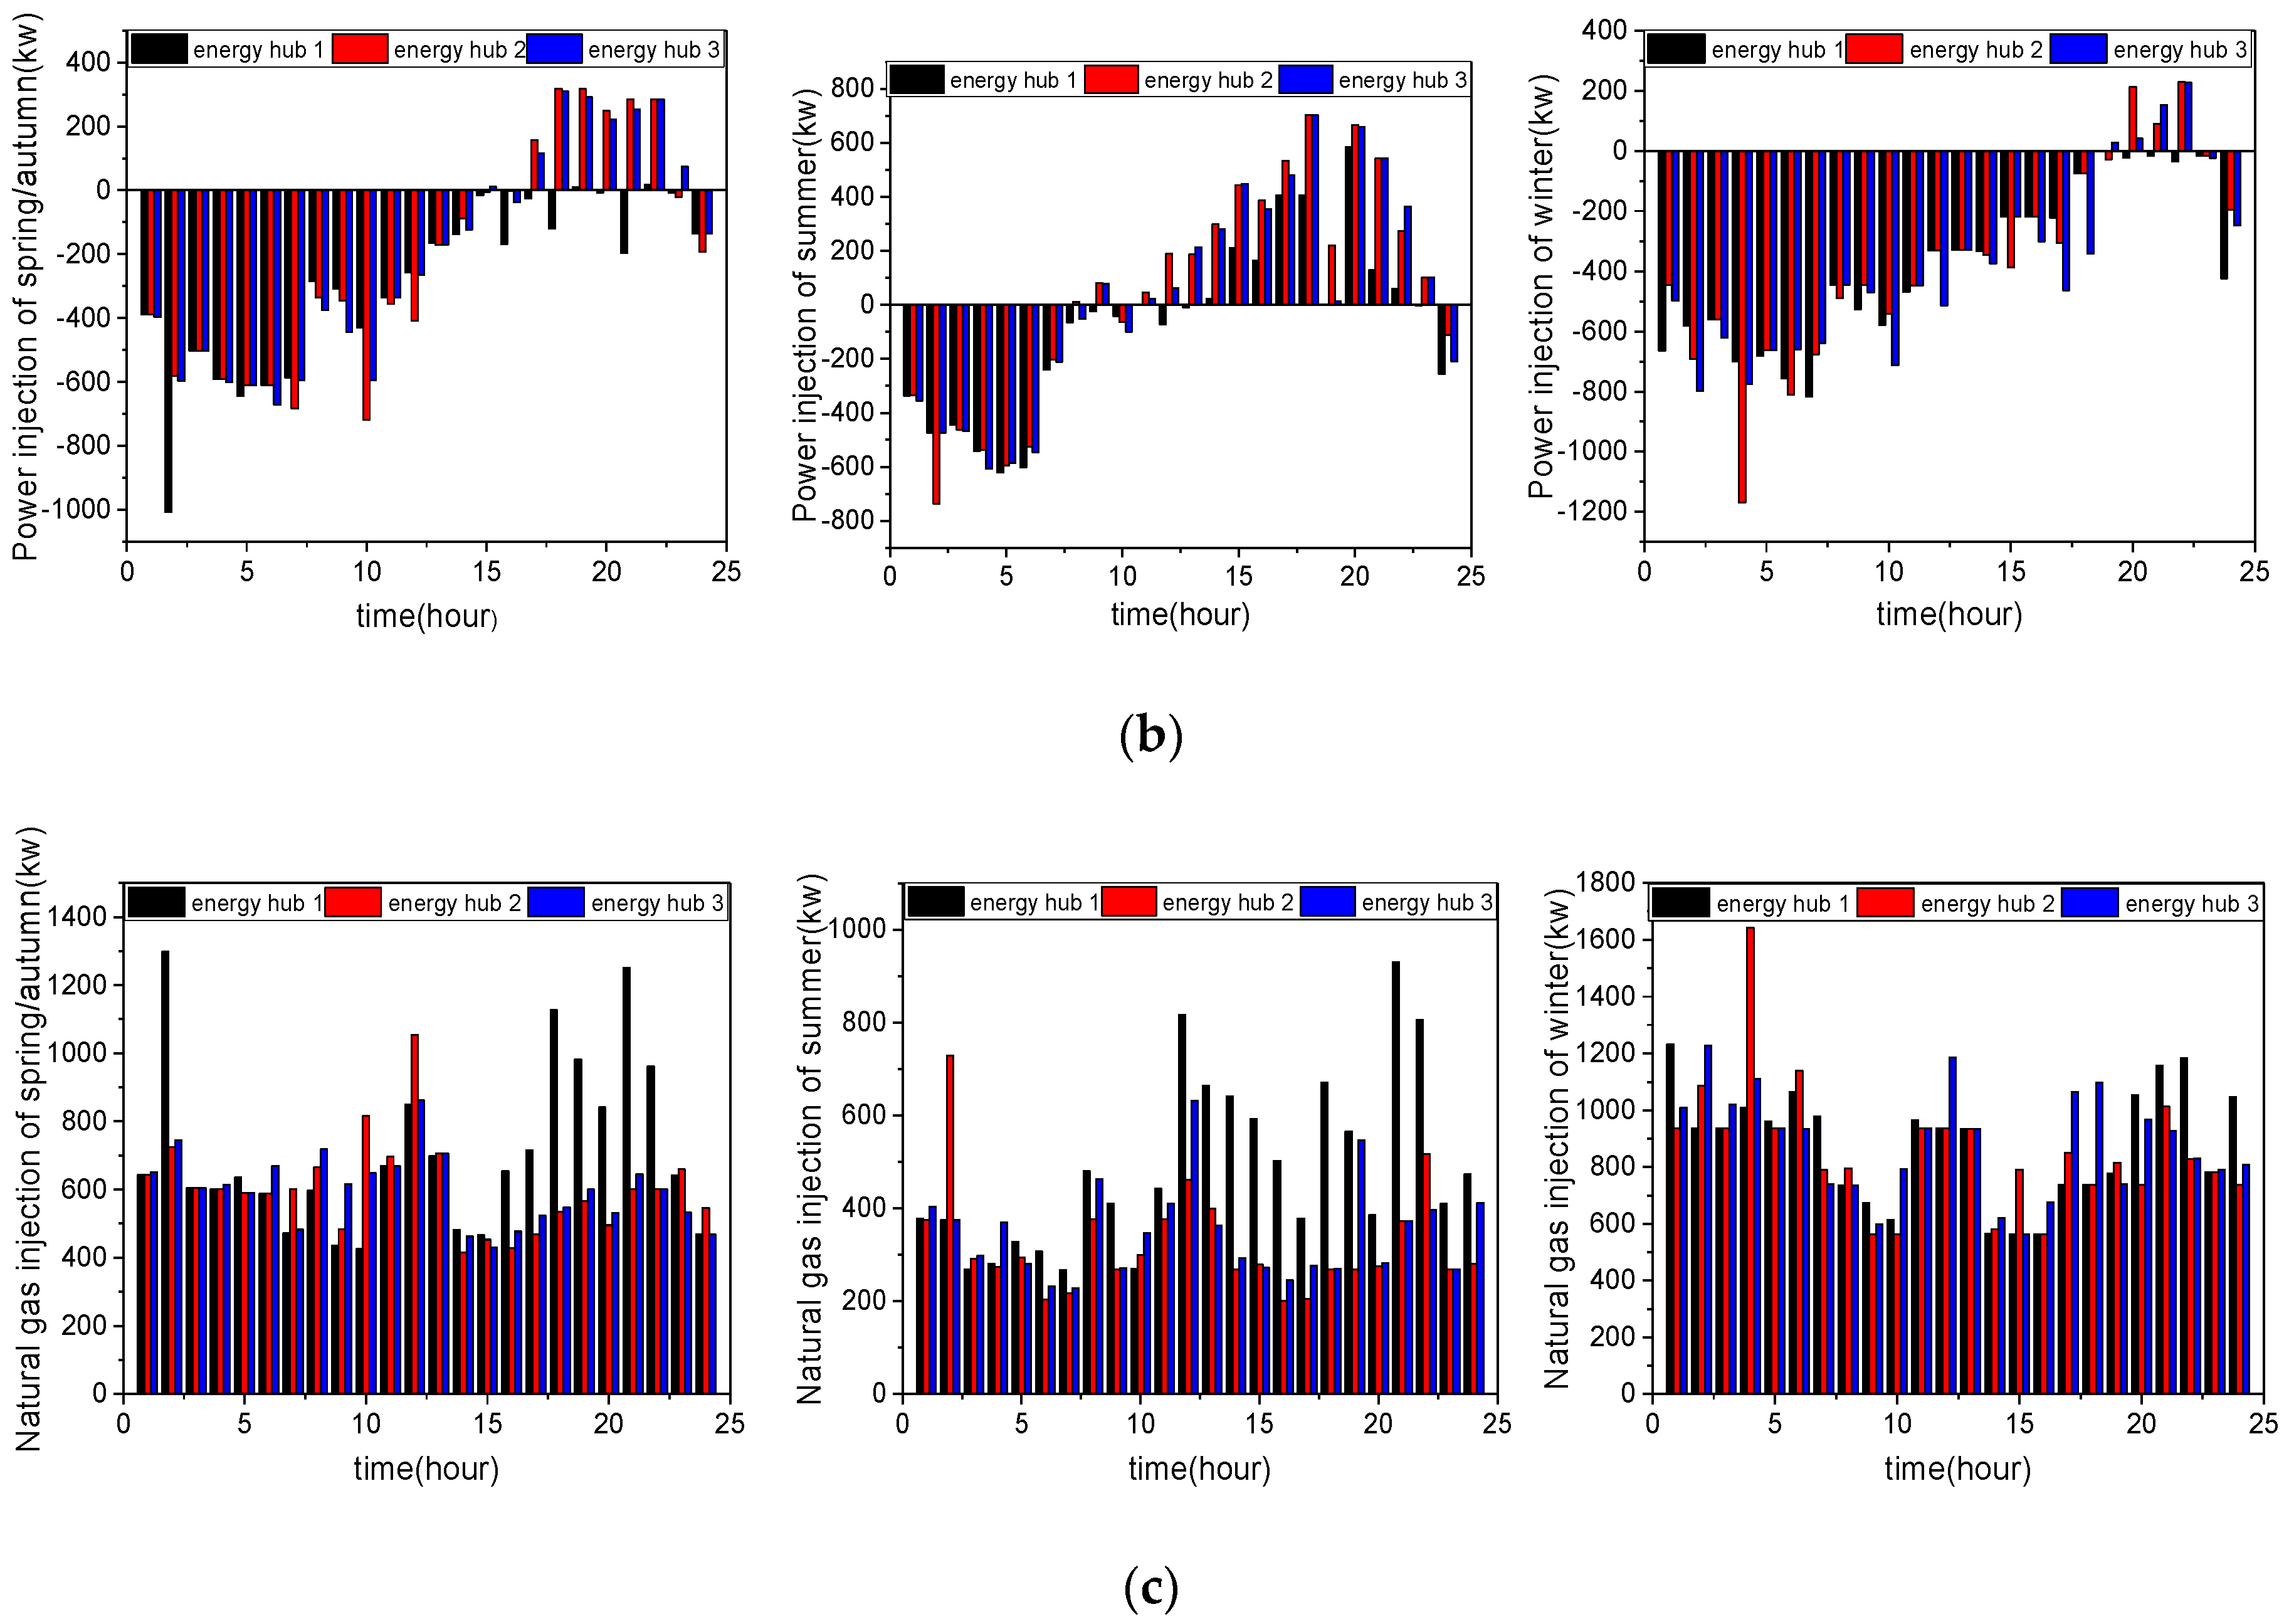
In this section, considering that the variation curves of the electrical and heat load are different in diverse seasonal scenarios, the relative data from reference [32] is applied to solve the optimal scheduling solution of the multi-energy hub system by game theory, which includes the electrical load, heat load, and wind speed sequence in spring, autumn, summer, and winter.
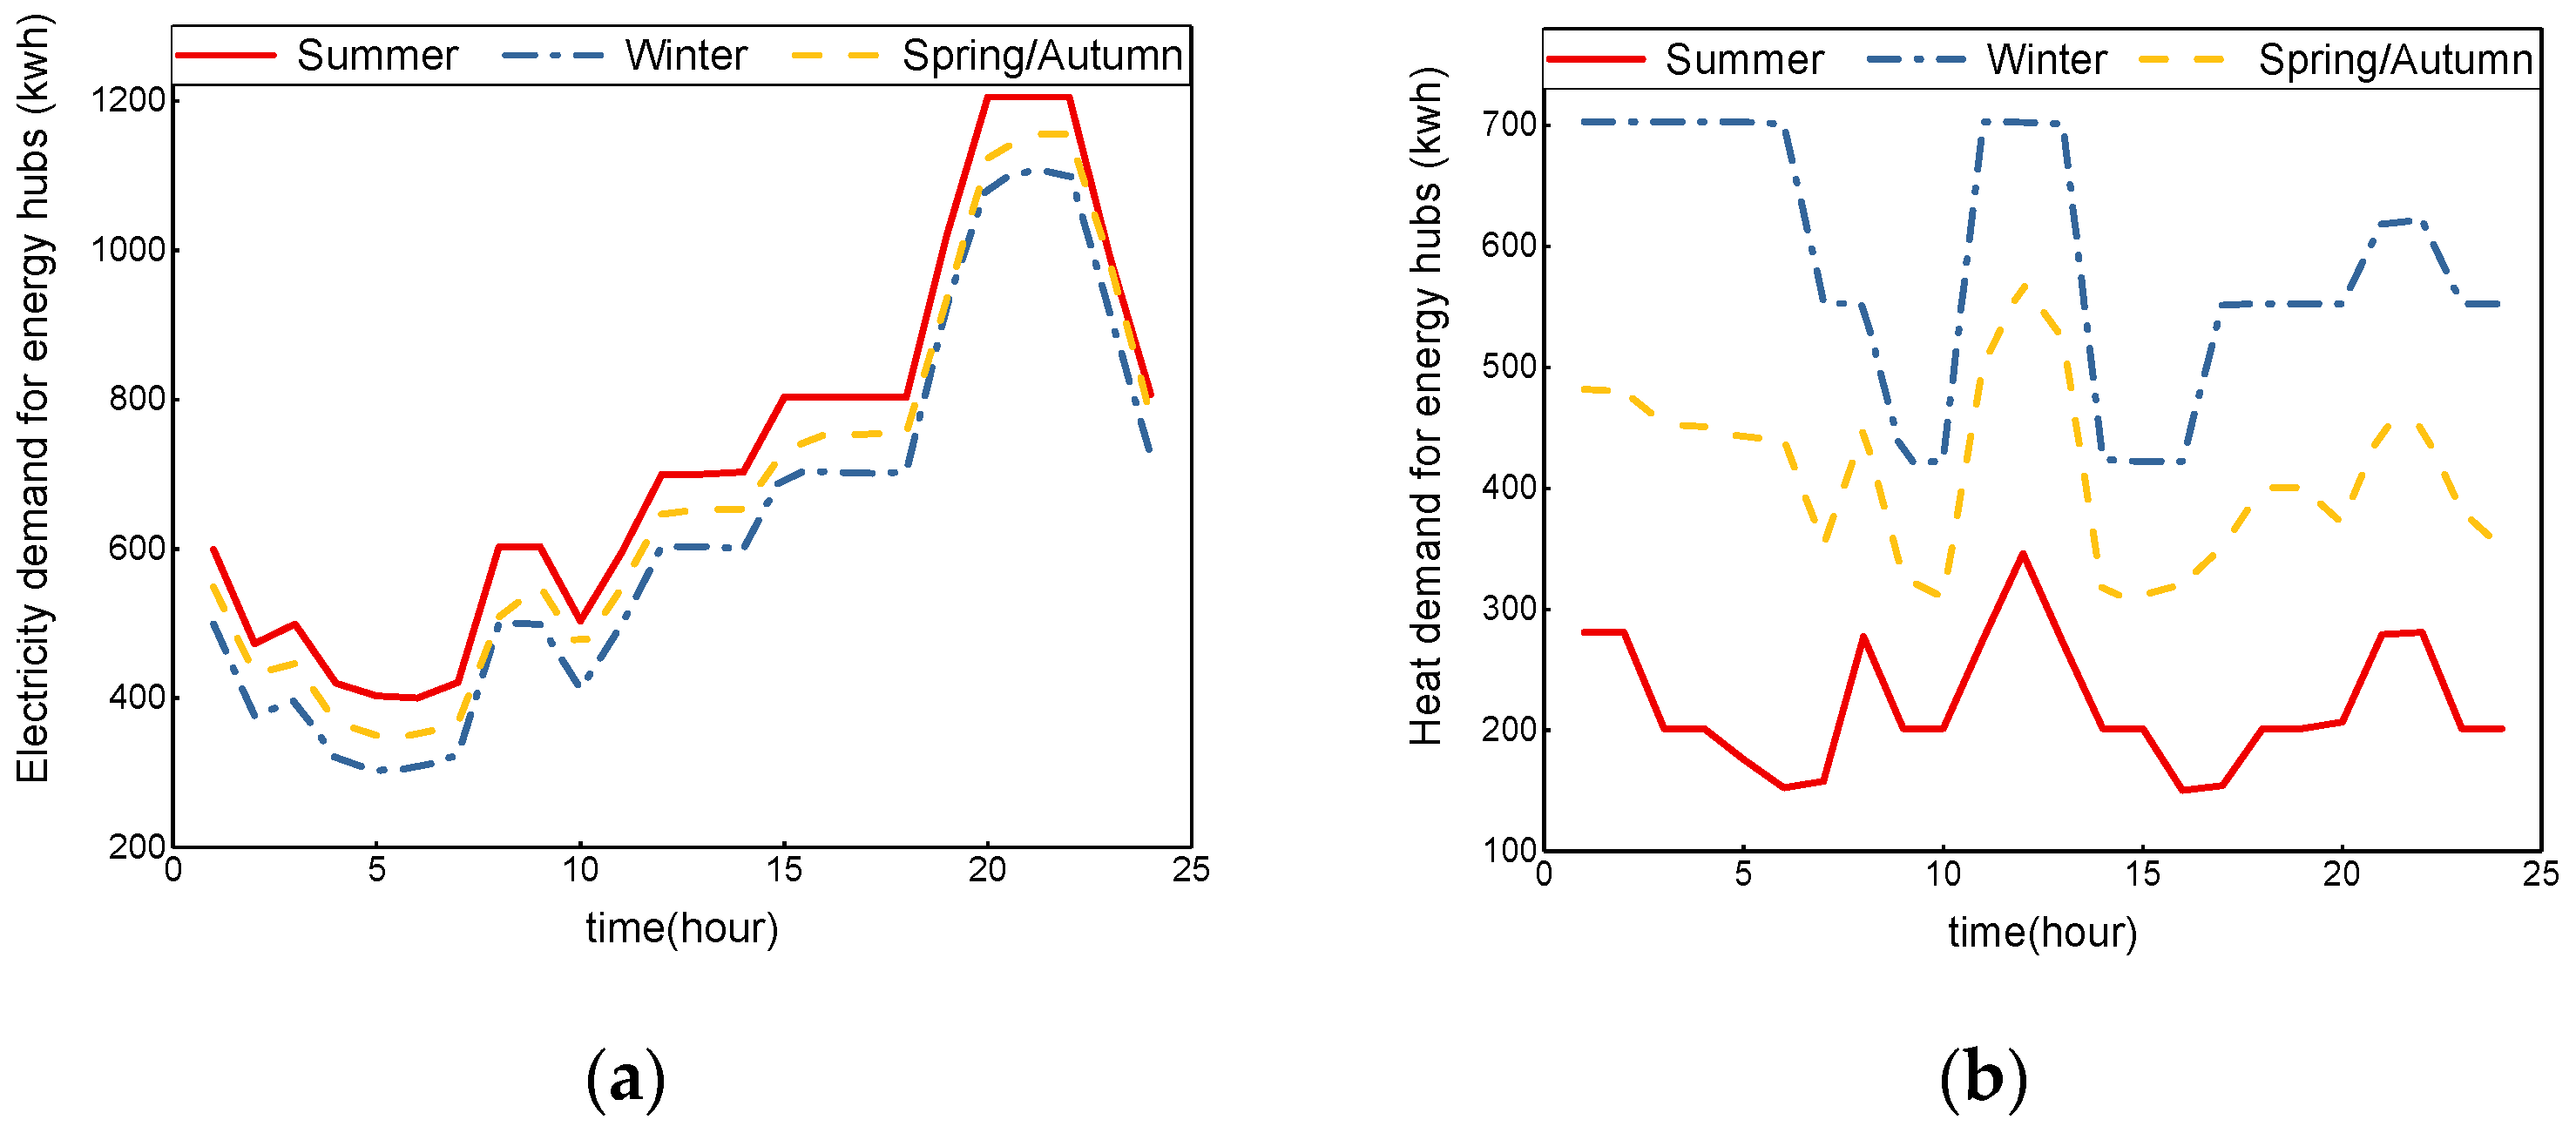
Figure 8 shows the daily variation of electrical and heat loads in different seasons, and assumes that the three energy hubs of the system have the same heat and electrical loads. The one-day variation of the system wind speed is displayed in Figure 9, where the rated power of the wind turbine is 900 kw [32], assuming that the input wind speed sequences of the three energy hubs are the same. The other input parameters of the system for optimal scheduling are the same as those in Case 1. Based on the above data, the optimal scheduling results of the multi-energy hub system in different seasons are shown in Figure 10.
Figure 10a–c show that the scheduling factor, power injection, and natural gas injection vary with the season; that is, when the electrical load, heat load, and wind turbine output change, the optimal scheduling solution of the multi-energy hub system will change accordingly. As can be seen from Figure 10, for energy hub 1, the scheduling factor of the hub is the smallest in winter and the largest in summer. This is caused by the seasonal variation of electrical load, heat load, and wind turbine output. In summer, in order to meet the demand of electricity consumption, the system uses CHP to generate the maximum amount of electricity, increasing the proportion of natural gas allocated to CHP (increasing the scheduling factor v1). Similarly, the power injection of energy hubs is greater in summer than in winter, and the amount of natural gas injection is the lowest in summer and the maximum in winter. Compared with energy hubs 2 and 3, energy hub 1 has a larger scheduling factor v1, less power injection, and higher natural gas injection. This is caused by the fact that hub 1 is directly connected to the energy injection point, which does not cause any network losses, and the natural gas line transmission loss is greater than the electric transmission loss.
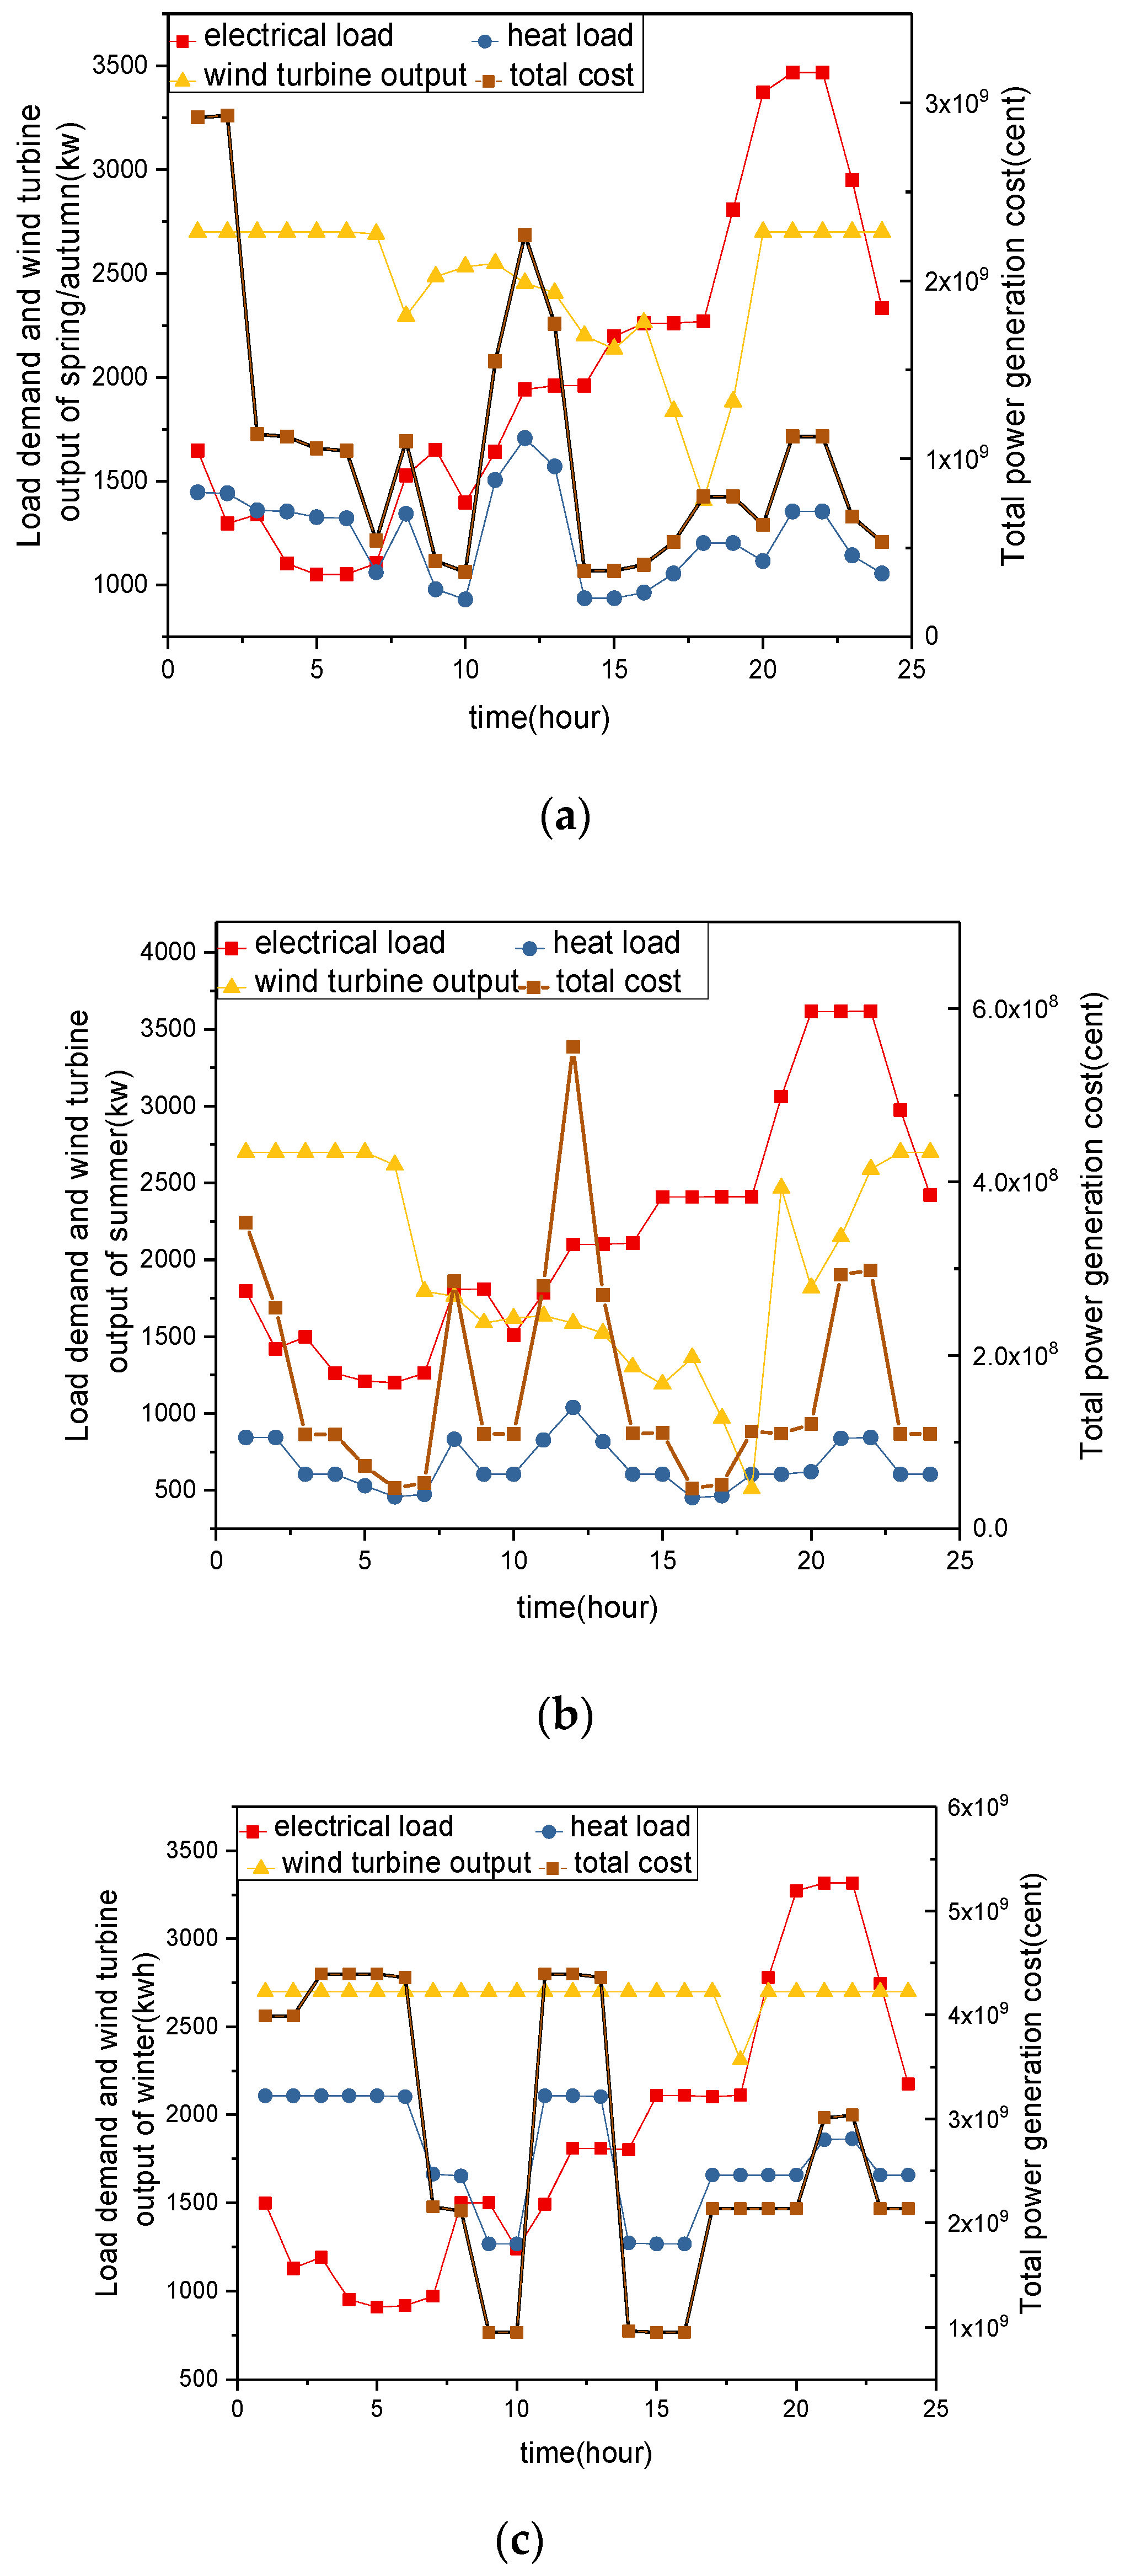
Figure 11 shows the changes of electrical load, heat load, wind turbine output, and total system cost in the multi-energy hub system within 24 h in different seasons. As illustrated in Figure 11, due to the phenomenon that the increase of heat load is much greater than the reduction of electrical load, the total cost of the multi-energy hub system is the highest in winter. Due to the small change of the total net power load in the spring/ autumn and an approximate doubling of the change in heat load, the total cost in spring/autumn is higher than that in summer, although the net power load in spring and autumn is less than that in summer and the electricity price is higher than the heat price. Therefore, the optimal scheduling results of the multi-energy hub system are affected by seasonal variation, and the simulation results are consistent with the actual system scheduling results.

4.3. Effect of Uncertainty of Wind Power on the Equilibrium Solution

Wind power access has economic and environmental advantages but brings uncertainty to energy scheduling. On the one hand, under the condition of meeting a safe operation and the access of wind power, the optimal economic operation of the multi-energy hub system is achieved by adjusting the schedule strategy. On the other hand, the uncertainty of available wind power may hinder the scheduling strategy to ensure the economic stability of the system. This section analyses the impact of wind power uncertainty on the game theoretic optimal scheduling strategy of a multi-energy hub system. Furthermore, the robustness of the proposed game theoretic method for multi-energy hub system optimal scheduling is discussed.

4.3.1. Case 1: Effect of Variation of Wind Speed Series Subjected to Weibull Distribution on the Equilibrium Solution without Considering Seasonal Variation

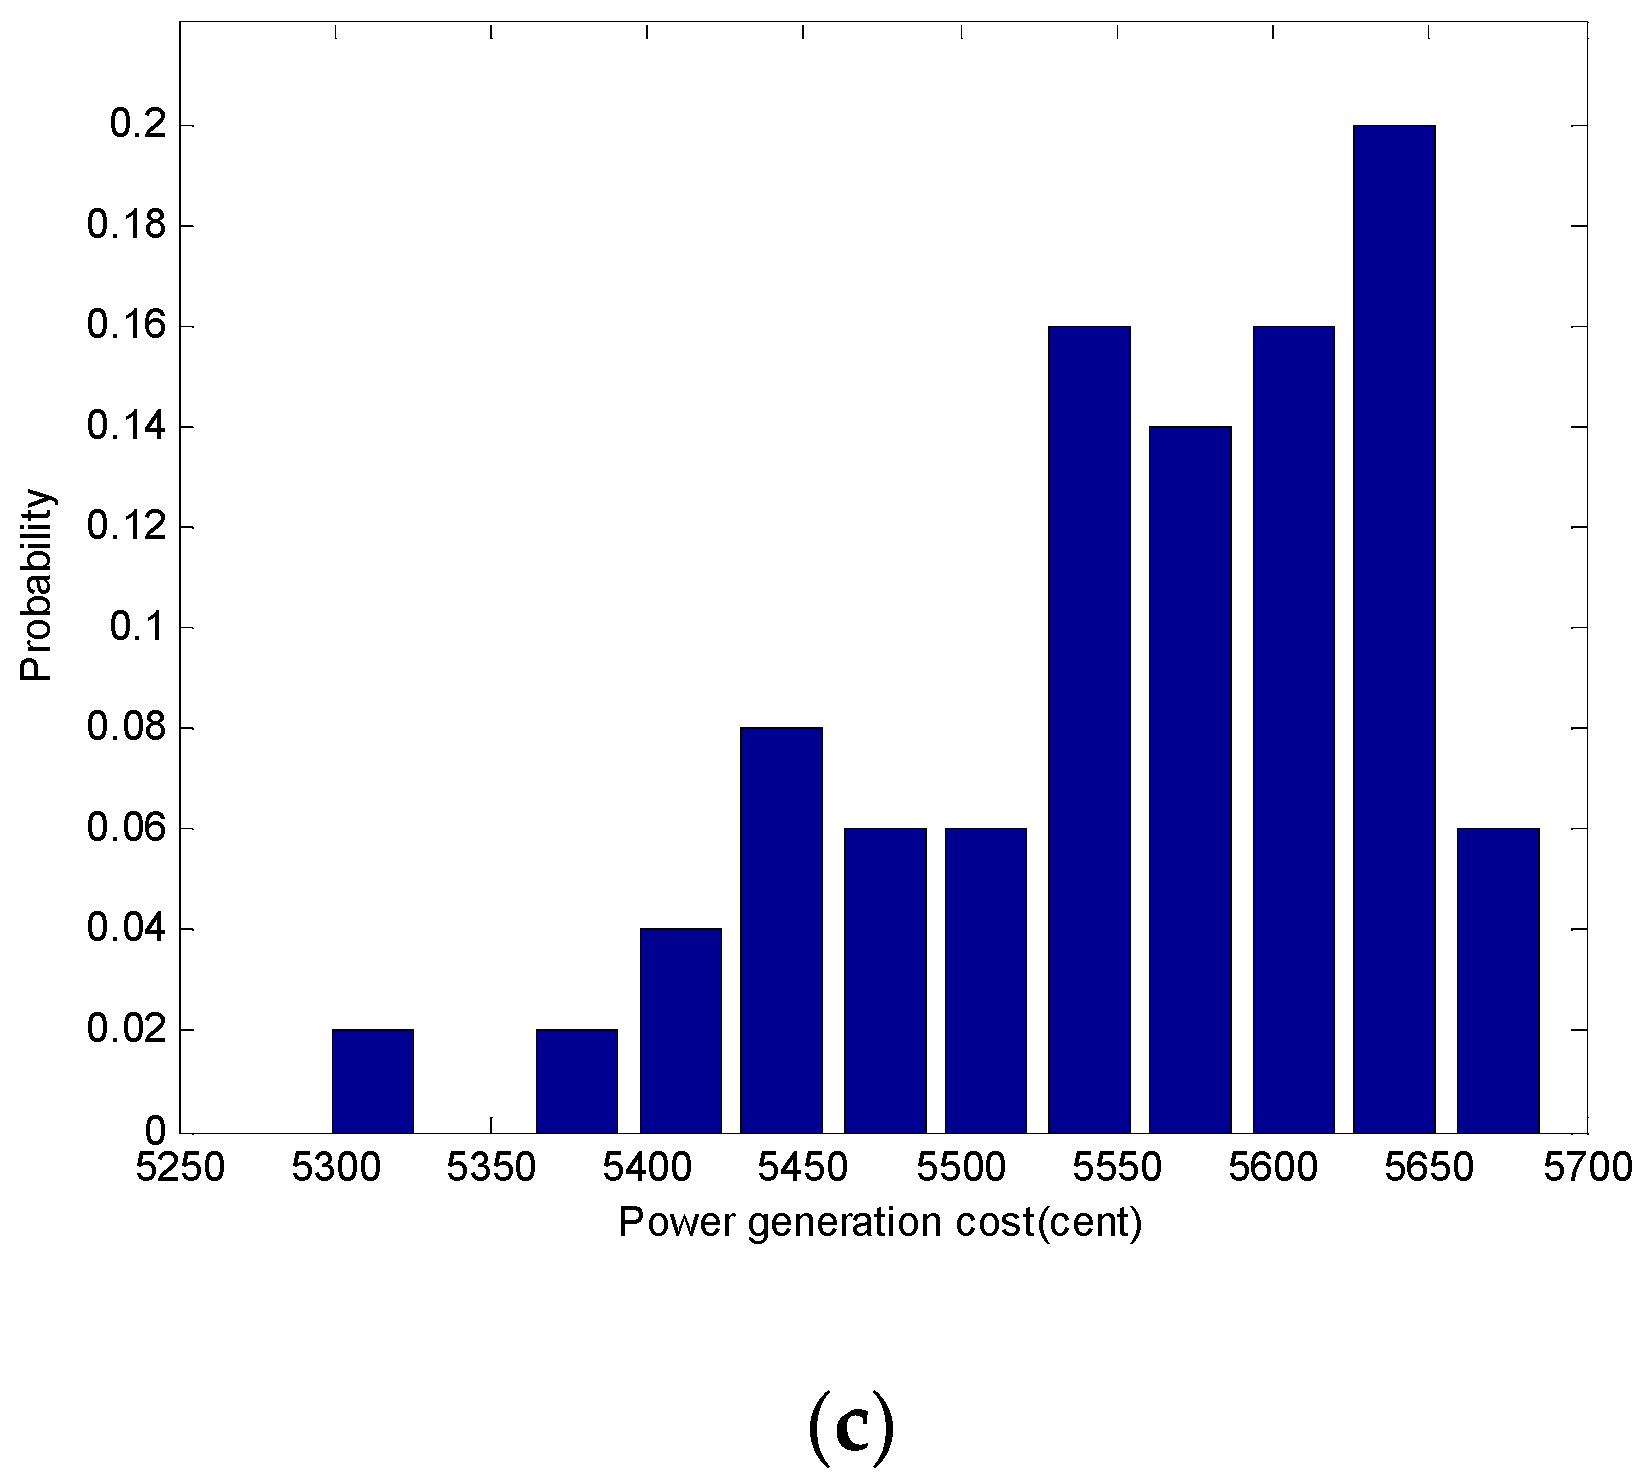
In this work, according to the variation of the wind turbine output in the three energy hubs, as shown in Figure 5, 50 different wind speed sequences that conform to the same Weibull distribution are selected; the wind turbine output is connected to the multi-energy hub system. The system is optimized to obtain a probability density diagram of the total power generation cost of the three hubs (Figure 12).
As shown in Figure 12, in 50 different wind speed sequences, the daily costs of energy hubs 1, 2, and 3 are mainly concentrated in 5100, 5500, and 5650, respectively, which are basically consistent with the results of game theoretic optimal scheduling of the system, where the daily costs of the three energy hubs are 5161.025, 5527.539, and 56,408.75, respectively. In addition, it can be seen that the cost probability density distribution curves of the three energy hubs follow a Weibull distribution. This is because the variation of wind turbine output affects the game theoretic optimal scheduling solution of the multi-energy hub system to a certain extent, so that, when the wind turbine output value becomes larger, the system buys less power from the outside to meet the load demand, and the total cost of the system is reduced. Moreover, the output power of the wind turbine is a nonlinear function of wind speed, which can be simplified as a piecewise linear function, so the turbine output values of 50 wind speeds approximately obeys the same Weibull distribution as the wind speed series. Therefore, the game theoretic optimal scheduling model of the multi-energy hub system can effectively overcome the impact of wind power uncertainty on the scheduling strategy and economy. Thereby, the robustness and economy of the model are verified.

4.3.2. Case 2: Effect of Wind Speed Series Change on the Equilibrium Solution When Considering Seasonal Variation

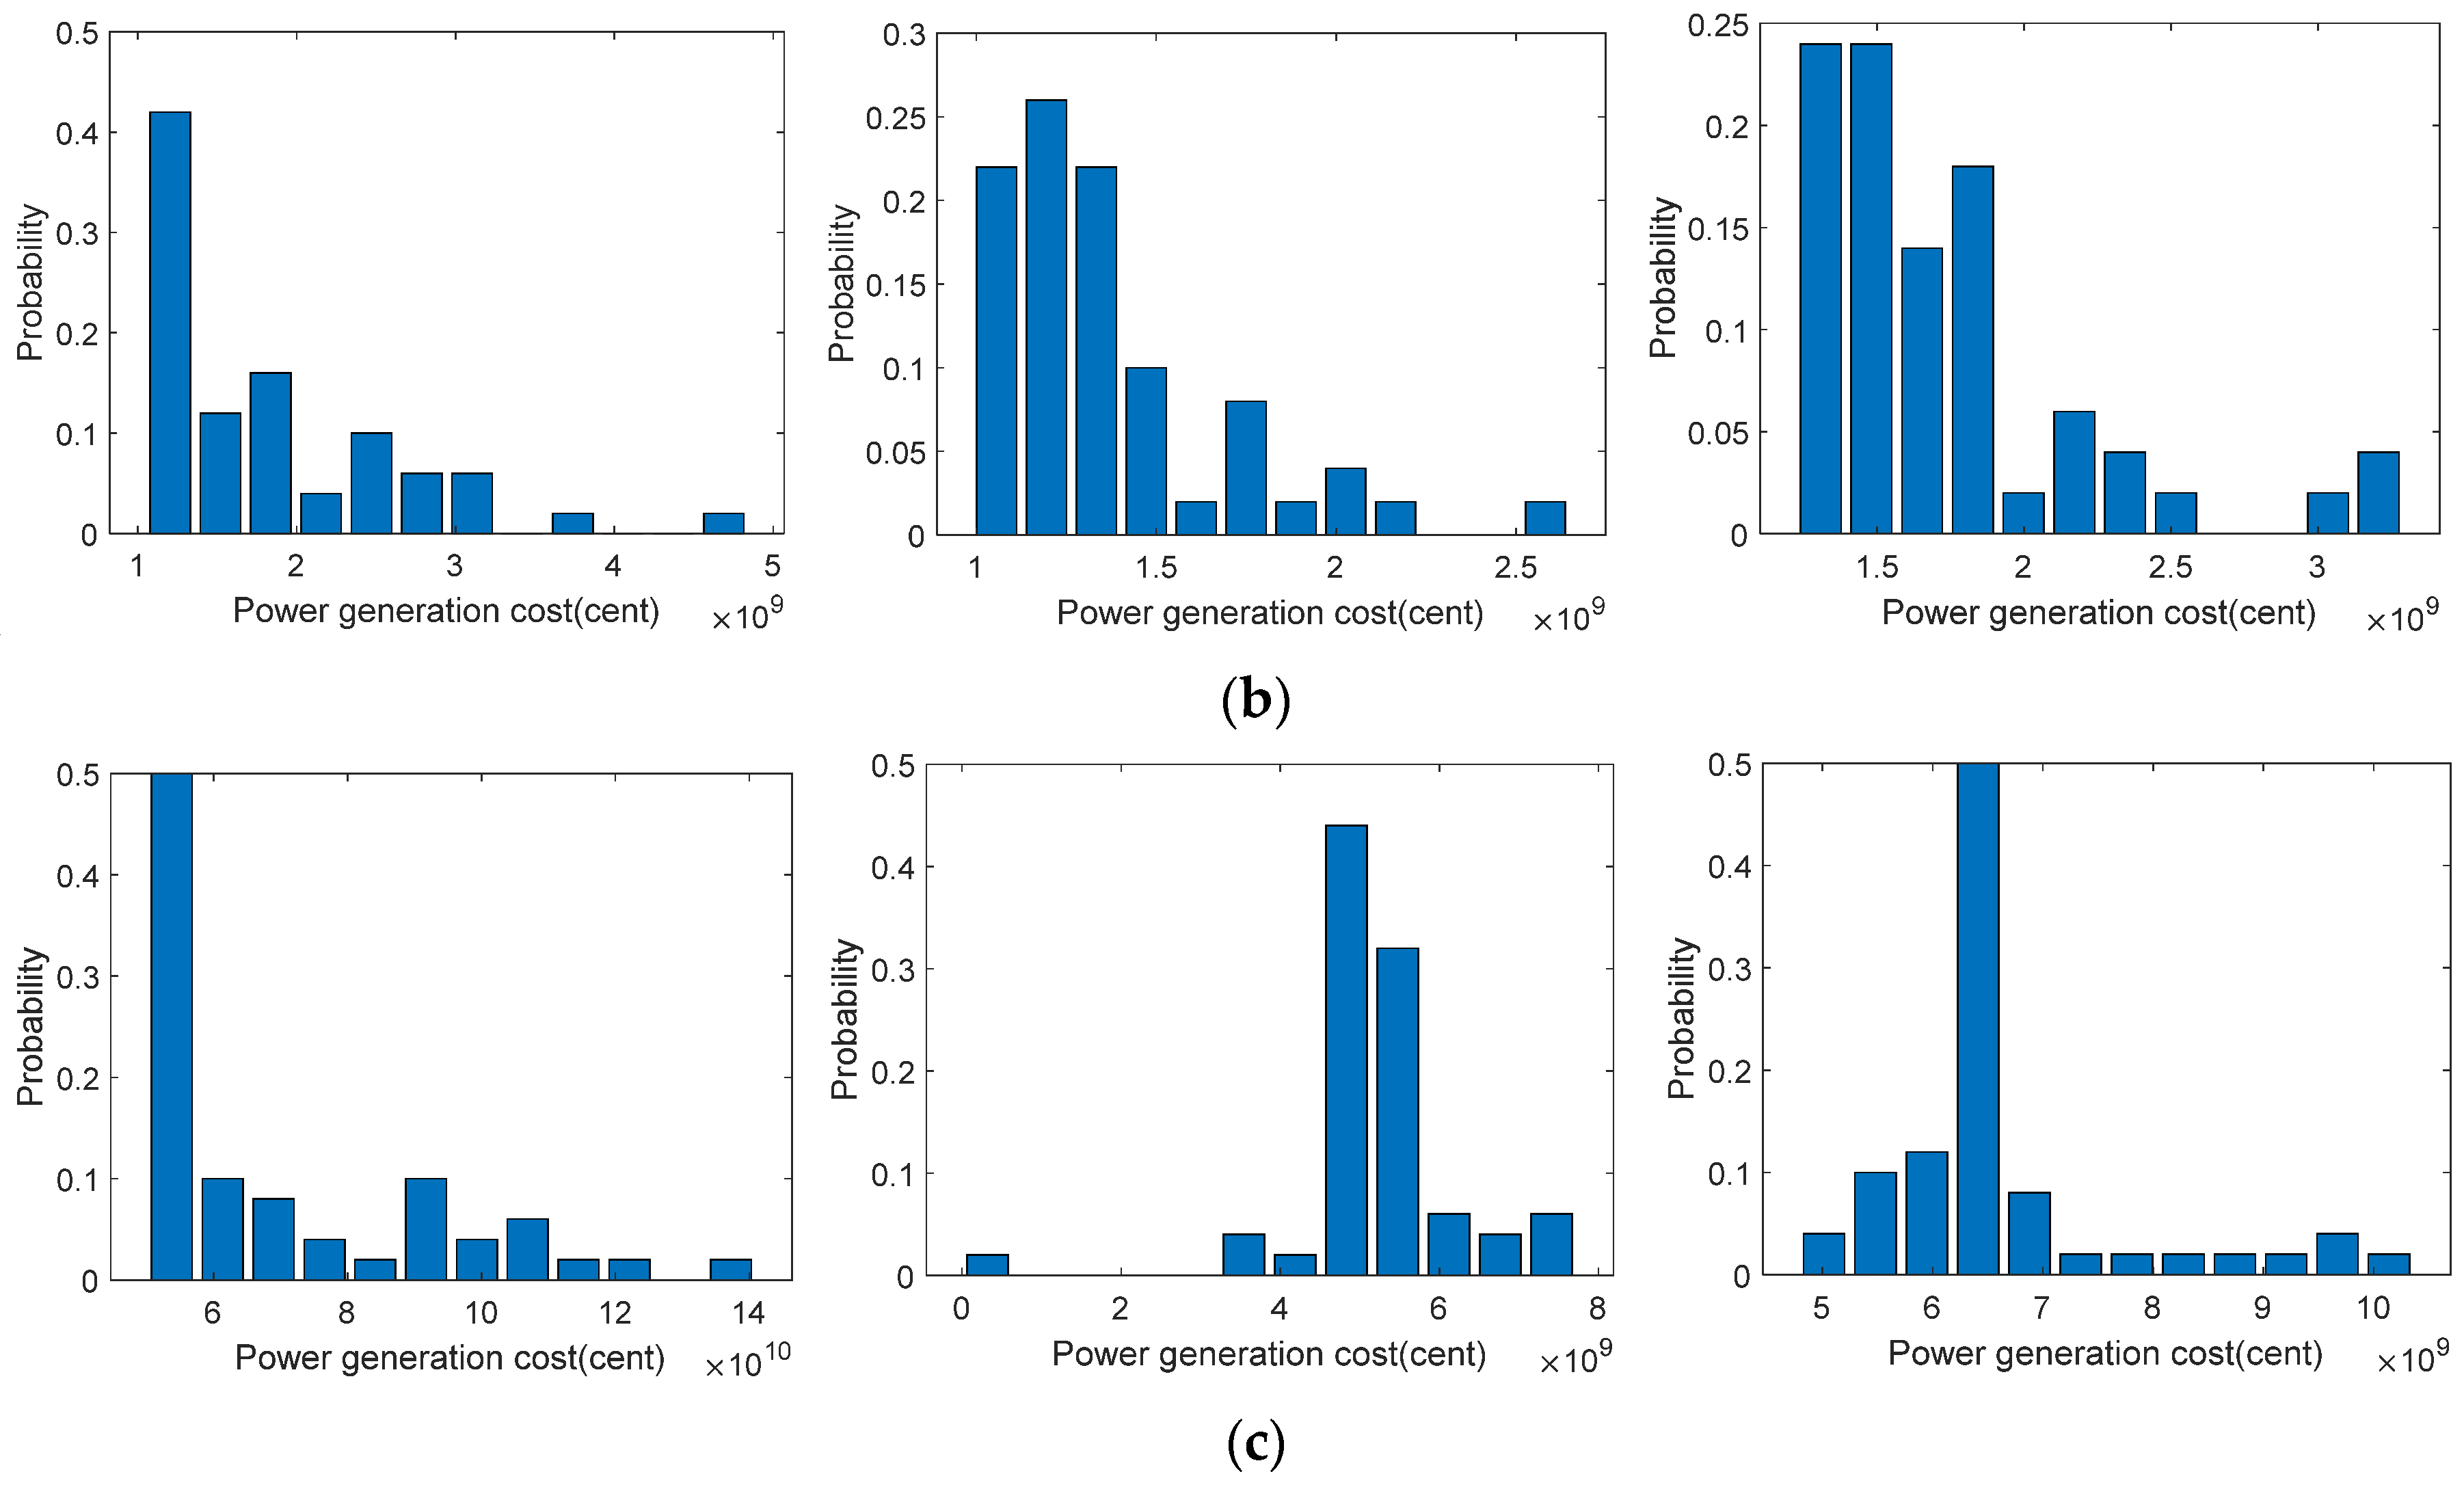
In this section, 50 sets of wind turbine output series are connected to the multi-energy hub system, and the system is optimized. The probability density maps of the total cost of the three energy hubs in spring, autumn, summer, and winter are obtained (Figure 13).
As shown in Figure 13, 50 total costs of energy hubs 1, 2, and 3 are concentrated near a certain value in different seasons. From the probability density distribution of the total cost of energy hub 1, it can be concluded that the winter cost is higher and concentrated at 5 × 10¹⁰ cent. From Section 4.2.2, it can be seen that energy hub 1 mainly works through the injection of natural gas into the CHP to meet the electrical demand, which results in a larger scheduling factor, larger natural gas injection, and smaller power injection. For the reason that the heat load of the energy hub needs to be satisfied by injecting natural gas, the total cost of energy hub 1 is mainly determined by the heat load in winter when the electrical load is small. Similar to energy hub 1, energy hubs 2 and 3 are more expensive in winter and cheaper in summer. This is basically consistent with the optimal scheduling result of the case 2 multi-energy hub system based on game theory in Section 4.2.2. In summary, the game theoretic optimal scheduling method for multi-energy hub systems proposed in this paper can effectively overcome the influence of wind power uncertainty and seasonal variation, which also verify the robustness of the method.

5. Conclusions

In this paper, game theory was used to solve the optimal scheduling of a multi-energy hub system with many variables, serious coupling, strong uncertainty of renewable energy access, and interaction among energy hubs, and quantum particle swarm optimization was used to solve the model of optimal scheduling. Two cases and 50 groups of different wind speed series were used to optimize the scheduling of the multi-energy hub system. The optimal scheduling result of Case 1 shows that the cost of the system varies with the total electric load, and the cost probability density distribution curve of each energy hub obeys a Weibull distribution under the condition of connecting 50 groups of wind speed series. From the results of Case 2, the optimal scheduling result of the system is affected by seasonal variation, such as the small scheduling factor and high cost in winter, and the probability density distribution map of the 50 groups’ total cost of each energy hub in different seasons is consistent with the actual characteristics of the four seasons. Therefore, the proposed game theoretic optimal scheduling method can effectively solve the system optimal scheduling problem, and can overcome the influence of uncertain wind power. To summarize, the optimal scheduling of multi-energy hub systems using game theory has strong economic value, robustness, and certain practical engineering value.

Author Contributions

Y.H. (Yu Huang) formulated the research problem; Y.H. (Yu Huang) and W.Z. developed the optimal scheduling models; W.Z., K.Y., and W.H. wrote the code and solved the optimization model; Y.H. (Yiran Huang) reviewed the manuscript. All of the authors were involved in writing this paper.

Funding

This research was funded by the National Key R&D Program of China under grant number 2016YFB0600701, and Central University Funds Project of China under grant number 2018MS093.

Conflicts of Interest

The authors declare no conflict of interest.

References

  1. Heussen, K.; Koch, S.; Ulbig, A.; Andersson, G. Unified systemlevel modeling of intermittent renewable energy sources and energy storage for power system operation. IEEE Syst. J. 2012, 6, 140–151. [Google Scholar] [CrossRef]
  2. Orehounig, K.; Evins, R.; Dorer, V. Integration of decentralized energy systems in neighbourhoods using the energy hub approach. Appl. Energy 2015, 154, 277–289. [Google Scholar] [CrossRef]
  3. Zhang, X.; Shahidehpour, M.; Alabdulwahab, A.; Abusorrah, A. Optimal expansion planning of energy hub with multiple energy infrastructures. IEEE Trans. Smart Grid 2015, 6, 2302–2311. [Google Scholar] [CrossRef]
  4. Evins, R.; Orehounig, K.; Dorer, V.; Carmeliet, J. New formulations of the ‘energy hub’ model to address operational constraints. Energy 2014, 73, 387–398. [Google Scholar] [CrossRef]
  5. Dolatabadi, A.; Mohammadi-ivatloo, B.; Abapour, M.; Tohidi, S. Optimal Stochastic Design of Wind Integrated Energy Hub. IEEE Trans. Ind. Inform. 2017, 13, 2379–2388. [Google Scholar] [CrossRef]
  6. Brahman, F.; Honarmand, M.; Jadid, S. Optimal electrical and thermal energy management of a residential energy hub, integrating demand response and energy storage system. Energy Build. 2015, 90, 65–75. [Google Scholar] [CrossRef]
  7. Rastegar, M.; Fotuhi-Firuzabad, M.; Lehtonen, M. Home load management in a residential energy hub. Electr. Power Syst. Res. 2015, 119, 322–328. [Google Scholar] [CrossRef]
  8. Martinez-Mares, A.; Fuerte-Esquivel, C.R. A Unified Gas and Power Flow Analysis in Natural Gas and Electricity Coupled Networks. IEEE Trans. Power Syst. 2012, 27, 2156–2166. [Google Scholar] [CrossRef]
  9. Liu, X.; Wu, J.; Jenkins, N.; Bagdanavicius, A. Combined analysis of electricity and heat networks. Appl. Energy 2016, 162, 1238–1250. [Google Scholar] [CrossRef] [Green Version]
  10. Liu, X.; Mancarella, P. Modelling, assessment and Sankey diagrams of integrated electricity-heat-gas networks in multi-vector district energy systems. Appl. Energy 2016, 167, 336–352. [Google Scholar] [CrossRef]
  11. Wang, Y.; Zhang, N.; Zhuo, Z.; Kang, C.; Kirschen, D. Mixed-integer linear programming-based optimal configuration planning for energy hub: Starting from scratch. Appl. Energy 2018, 210, 1141–1150. [Google Scholar] [CrossRef]
  12. He, Y.; Shahidehpour, M.; Li, Z.; Guo, C.; Zhu, B. Robust constrained operation of integrated electricity-natural gas system considering distributed natural gas storage. IEEE Trans. Sustain. Energy 2018, 9, 1061–1071. [Google Scholar] [CrossRef]
  13. Davatgaran, V.; Saniei, M.; Mortazavi, S.S. Optimal bidding strategy for an energy hub in energy market. Energy 2018, 148, 482–493. [Google Scholar] [CrossRef]
  14. Alipour, M.; Zare, K.; Abapour, M. MINLP probabilistic scheduling model for demand response programs integrated energy hubs. IEEE Trans. Ind. Inform. 2018, 14, 79–88. [Google Scholar] [CrossRef]
  15. Thomas, D.; Deblecker, O.; Ioakimidis, C.S. Optimal operation of an energy management system for a grid-connected smart building considering photovoltaics’ uncertainty and stochastic electric vehicles’ driving schedule. Appl. Energy 2018, 210, 1188–1206. [Google Scholar] [CrossRef]
  16. Fu, X.; Huang, S.; Li, R.; Sun, H. Electric power output optimization for CCHP using PSO theory. Energy Procedia 2016, 103, 9–14. [Google Scholar] [CrossRef]
  17. Jin, X.; Mu, Y.; Jia, H.; Wu, J.; Xu, X.; Yu, X. Optimal day-ahead scheduling of integrated urban energy systems. Appl. Energy 2016, 180, 1–13. [Google Scholar] [CrossRef] [Green Version]
  18. Huang, Y.; Wang, L.; Guo, W.; Kang, Q.; Wu, Q. Chance constrained optimization in a home energy management system. IEEE Trans. Smart Grid 2018, 9, 252–260. [Google Scholar] [CrossRef]
  19. Dolatabadi, A.; Jadidbonab, M.; Mohammadi-ivatloo, B. Short-term scheduling strategy for wind-based energy hub: A hybrid stochastic/IGDT approach. IEEE Trans. Sustain. Energy 2019, 10, 438–448. [Google Scholar] [CrossRef]
  20. Perera, A.T.D.; Nik, V.M.; Mauree, D.; Scartezzini, J.L. An integrated approach to design site specific distributed electrical hubs combining optimization, multi-criterion assessment and decision making. Energy 2017, 134, 103–120. [Google Scholar] [CrossRef] [Green Version]
  21. Cheng, M.X.; Crow, M.; Ye, Q. A game theory approach to vulnerability analysis: Integrating power flows with topological analysis. Int. J. Electr. Power Energy Syst. 2016, 82, 29–36. [Google Scholar] [CrossRef] [Green Version]
  22. Wang, Y.; Ai, X.; Tan, Z.; Yan, L.; Liu, S. Interactive dispatch modes and bidding strategy of multiple virtual power plants based on demand response and game theory. IEEE Trans. Smart Grid 2016, 7, 510–519. [Google Scholar] [CrossRef]
  23. Wu, Q.; Ren, H.; Gao, W.; Ren, J.; Lao, C. Profit allocation analysis among the distributed energy network participants based on Game-theory. Energy 2017, 118, 783–794. [Google Scholar] [CrossRef]
  24. Liu, J.; He, D. Profit allocation of hybrid power system planning in energy internet: A cooperative game study. Sustainability 2018, 10, 388. [Google Scholar] [CrossRef]
  25. Gao, B.; Liu, X.; Chen, C.; Li, Y. Economic optimization for distributed energy network with cooperative game. J. Renew. Sustain. Energy 2018, 10, 055101. [Google Scholar] [CrossRef]
  26. Han, L.; Morstyn, T.; McCulloch, M. Incentivizing Prosumer Coalitions with Energy Management using Cooperative Game Theory. IEEE Trans. Power Syst. 2019, 34, 303–313. [Google Scholar] [CrossRef]
  27. Liu, N.; Cheng, M.; Yu, X.; Zhong, J.; Lei, J. Energy Sharing Provider for PV Prosumer Clusters: A Hybrid Approach using Stochastic Programming and Stackelberg Game. IEEE Trans. Ind. Electron. 2018, 65, 6740–6750. [Google Scholar] [CrossRef]
  28. Geidl, M.; Koeppel, G.; Favre-Perrod, P.; Klockl, B.; Andersson, G.; Frohlich, K. Energy hubs for the future. IEEE Power Energy Mag. 2007, 5, 24–30. [Google Scholar] [CrossRef]
  29. Geidl, M.; Andersson, G. A modeling and optimization approach for multiple energy carrier power flow. In Proceedings of the 2005 IEEE Russia Power Tech, Saint Petersburg, Russia, 27–30 June 2005; pp. 1–7. [Google Scholar]
  30. Xu, X.Z.; Shan, D.; Wang, G.Y.; Jiang, X.Y. Multimodal medical image fusion using PCNN optimized by the QPSO algorithm. Appl. Soft Comput. 2016, 46, 588–595. [Google Scholar] [CrossRef]
  31. Moeini-Aghtaie, M.; Dehghanian, P.; Fotuhi-Firuzabad, M.; Abbaspour, A. Multiagent genetic algorithm: An online probabilistic view on economic dispatch of energy hubs constrained by wind availability. IEEE Trans. Sustain. Energy 2014, 5, 699–708. [Google Scholar] [CrossRef]
  32. Pazouki, S.; Haghifam, M.R. Optimal planning and scheduling of energy hub in presence of wind, storage and demand response under uncertainty. Int. J. Electr. Power Energy Syst. 2016, 80, 219–239. [Google Scholar] [CrossRef]
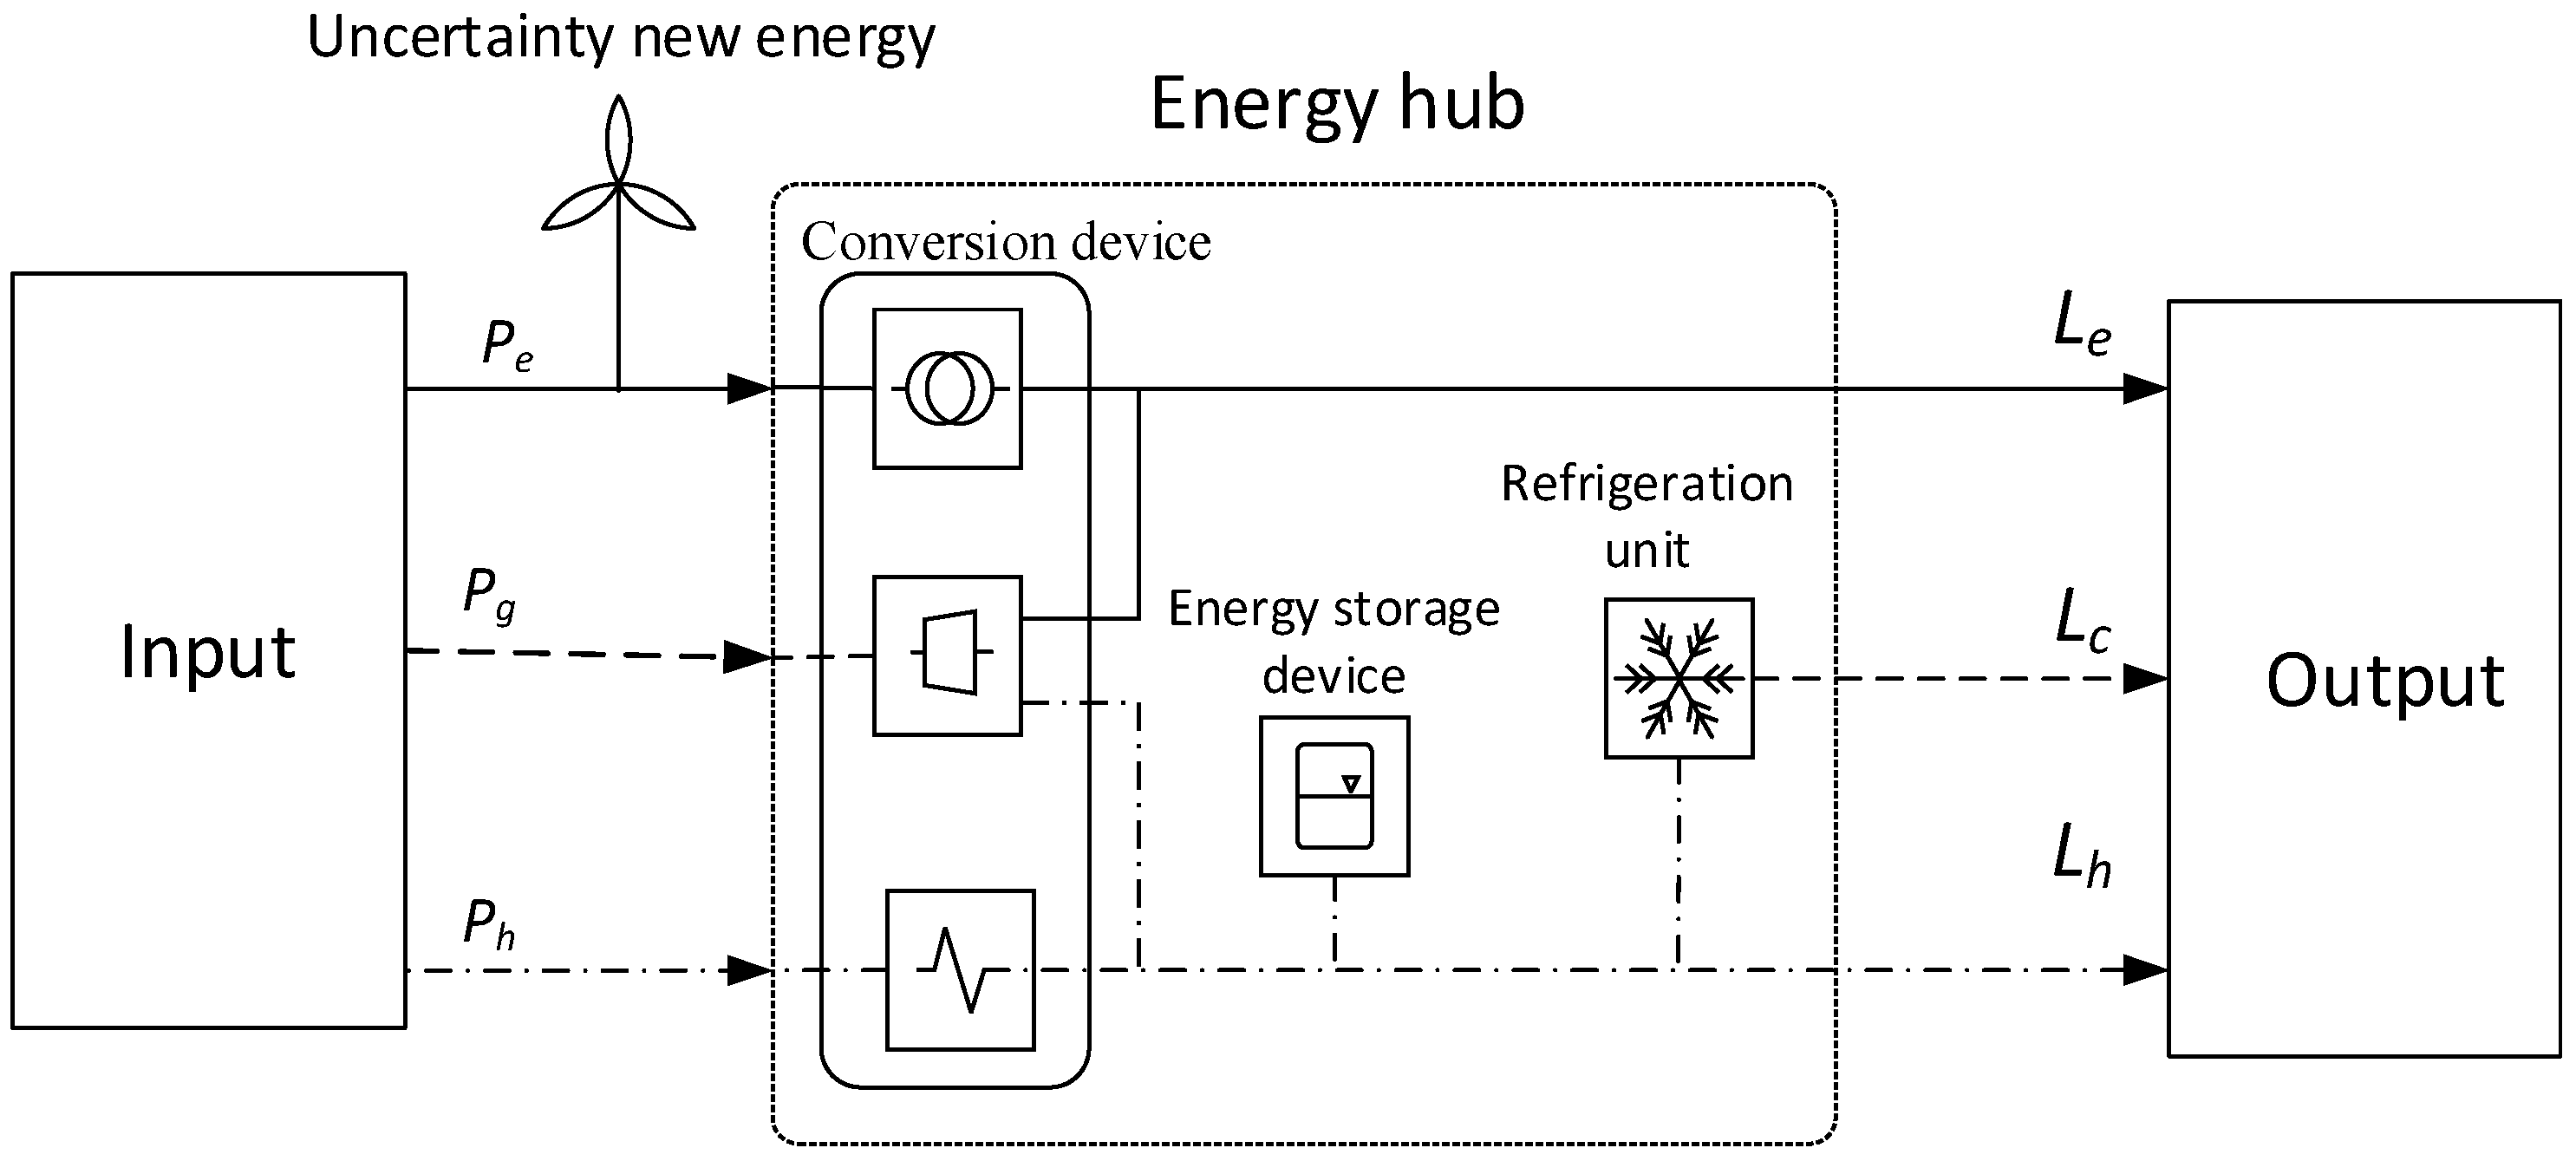
Figure 1. Simplified structural diagram of an energy hub.
Energies 12 02270 g001
Figure 2. Energy flow interaction diagram between energy hubs.
Energies 12 02270 g002
Figure 3. Simplified structural diagram of the multi-energy hub system.
Energies 12 02270 g003
Figure 4. Simulated electrical load and heat load.
Energies 12 02270 g004
Figure 5. Simulated wind turbine production.
Energies 12 02270 g005
Figure 6. System variables of three energy hubs’ change in 24 h: (a) Scheduling factor; (b) input electricity; (c) input natural gas.
Energies 12 02270 g006
Figure 7. 24-h change in total cost of power generation, total electrical load, and total heat load.
Energies 12 02270 g007
Figure 8. The multi-energy hub system electrical and heat demands in different seasons at 24 h a day: (a) electrical demand; (b) heat demand.
Energies 12 02270 g008
Figure 9. Wind speed at 24 h a day in different seasons.
Energies 12 02270 g009
Figure 10. 24-h variations of scheduling factors, power injection, and natural gas injection for three energy hubs in different seasons: (a) scheduling factor (spring and autumn, summer, winter); (b) power injection (spring and autumn, summer, winter); (c) natural gas injection (spring and autumn, summer, winter).
Energies 12 02270 g010aEnergies 12 02270 g010b
Figure 11. 24-h variation of total cost, total electrical load, total wind turbine output, and total heat load in different seasons: (a) spring and autumn; (b) summer; (c) winter.
Energies 12 02270 g011
Figure 12. The probability density diagram of the total power generation cost of the three hubs in the multi-energy hub system under different wind speed sequences: (a) Energy hub 1; (b) energy hub 2; (c) energy hub 3.
Energies 12 02270 g012aEnergies 12 02270 g012b
Figure 13. Probabilistic density maps of the total cost of three energy hubs under different wind speed series in different seasons: (a) spring and autumn (energy hub1, energy hub2, energy hub3); (b) summer (energy hub1, energy hub2, energy hub3); (c) winter (energy hub1, energy hub2, energy hub3).
Energies 12 02270 g013aEnergies 12 02270 g013b
Table 1. Solving steps of optimal scheduling based on game theory for multi-energy hub system.
1: Give relevant parameters of multi-energy hub system η g e G T , η g h F , η e e T , η g h G T , j = 0 .
2: Establish cooperative game model for multi-energy hub system.
Randomly select equilibrium point initial value ( ν 1 0 , ν 2 0 , ν 3 0 ) .
3: Repeat.
4: Energy hubs make independent optimal decision in turn.
ν 1 j = arg min v 1 C 1 ( ν 1 , ν 2 j 1 , ν 3 j 1 )
ν 2 j = arg min v 2 C 2 ( ν 1 j 1 , ν 2 , ν 3 j 1 )

ν n j = arg min v n C n ( ν 1 j 1 , ν 2 j 1 , ν n )
5: Communicate with other participants in the multi-energy hub system about own optimal information.
6: j : = j + 1
7: Until | ( v 1 j , v 2 j , v 3 j ) ( v 1 j 1 , v 2 j 1 , v 3 j 1 ) | ξ ( v 1 j , v 2 j , v 3 j ) = ( v 1 , v 2 , v 3 ) .
Table 2. Assumed energy prices.
Input Carrieraα (cent/pu)bα(cent/pu)cα(cent/pu)
Electricity(e)10010−5
Gas(g)1005−2.5
Table 3. Assumed line data.
Line from-toLength lj in pu fiefig
1-26 f 13 , g 3 0.02
1-34 f 42 , g 3 0.02
2-33 F e max 10