1. Introduction
Electrical power is a vital element of our society. The system in charge of guaranteeing an uninterrupted power supply is the Electric Power System (EPS). In an EPS, the electrical power is transported from generation plants to load centers through a set of transmission networks. Substations play an important role, transforming voltage values to levels considered suitable for transmission, distribution and consumption processes [
1].
Due to several factors, such as the growing demand for electrical power and the difficulties to expand the available transmission networks, an EPS may be sporadically required to operate at its capacity bound, increasing the chance for blackouts due to external system disturbances. Consequently, it is necessary to rely upon specialized control and supervision schemes spread throughout the EPS, to ensure the required responsiveness to such disturbances. Typically, control and supervision schemes are implemented at the substation level, making them one of the most automated parts of the EPS, named as Substation Automation Systems (SAS). In an SAS, the easiness to integrate Intelligent Electronic Devices (IEDs) provided by different manufacturers is an important requirement. The IEC 61850 standard directly targets this integration, establishing guidelines for the interoperability among components of an SAS [
2].
Whenever designing an EPS communication system, a major challenge is to ensure that the system operation meets its timing and reliability requirements. The analysis of the timing constraints associated to IEC 61850 message exchanges is required for the assessment of the EPS operation, especially in what concerns those involved in the control and protection of the SAS. Examples of critical messages are SV (Sampled Values) and GOOSE (Generic Object Oriented Substation Events) messages [
1]. Therefore, the availability during the system design phase of analytical and/or simulation tools that enable the timing assessment of message exchanges is highly desirable.
In this paper is presented an analytical assessment tool that is based on legacy response time analysis research works [
3,
4,
5,
6] previously proposed for the analysis of CAN (Controller Area Network) communication. This is a novel approach for the timing assessment of SV and GOOSE message streams supported by an IEC 61850 process bus. The use of adequate analytical models may both enable the response time analysis and scalability analysis of deployed IEC 61850 communication systems. These two features may represent an important advantage during the system design and setup times.
The analytical model proposed in this paper was experimentally validated using both a simulation model and a specifically built prototype of a small-size SAS bay. The performed comparison highlights its ability to map real IEC 61850 implementations.
This paper is divided in seven sections.
Section 2 describes the basics of the IEC 61850 standard and discusses relevant related works.
Section 3 presents the proposed analytical model that enables the assessment of the worst-case message communication delay within the context of IEC 61850 process bus communications.
Section 4 exemplifies a potential use of the proposed analytical model, by applying it for the timing assessment of an IEC 61850 process bus under high communication load.
Section 5 describes the usage of a specific IEC 61850 simulation model and also of an experimental prototype specifically built to validate the proposed analytical model.
Section 6 extends the response time analysis introduced in
Section 3 assuming a PTP (Precision Time Protocol) background traffic and also a process bus with gigabit Ethernet capability. Finally,
Section 7 provides some conclusions and addresses some relevant future work directions.
2. Background
2.1. IEC 61850 and Process Bus Protocols
Due to a large number of devices that need to be interconnected within a typical SAS and also due to the need to support a broad range of applications, the usage of standardized interconnection procedures is required to enforce the system interoperability. This was the main purpose of the IEC 61850 standard [
7,
8,
9]. Among other characteristics, this standard allows the modeling of complex IED functions as a set of simpler functions, called Logical Nodes (LN). Another important contribution is an information model that defines both the data to be communicated between functions and the communication services, specifying how the information model should be transmitted among IEDs.
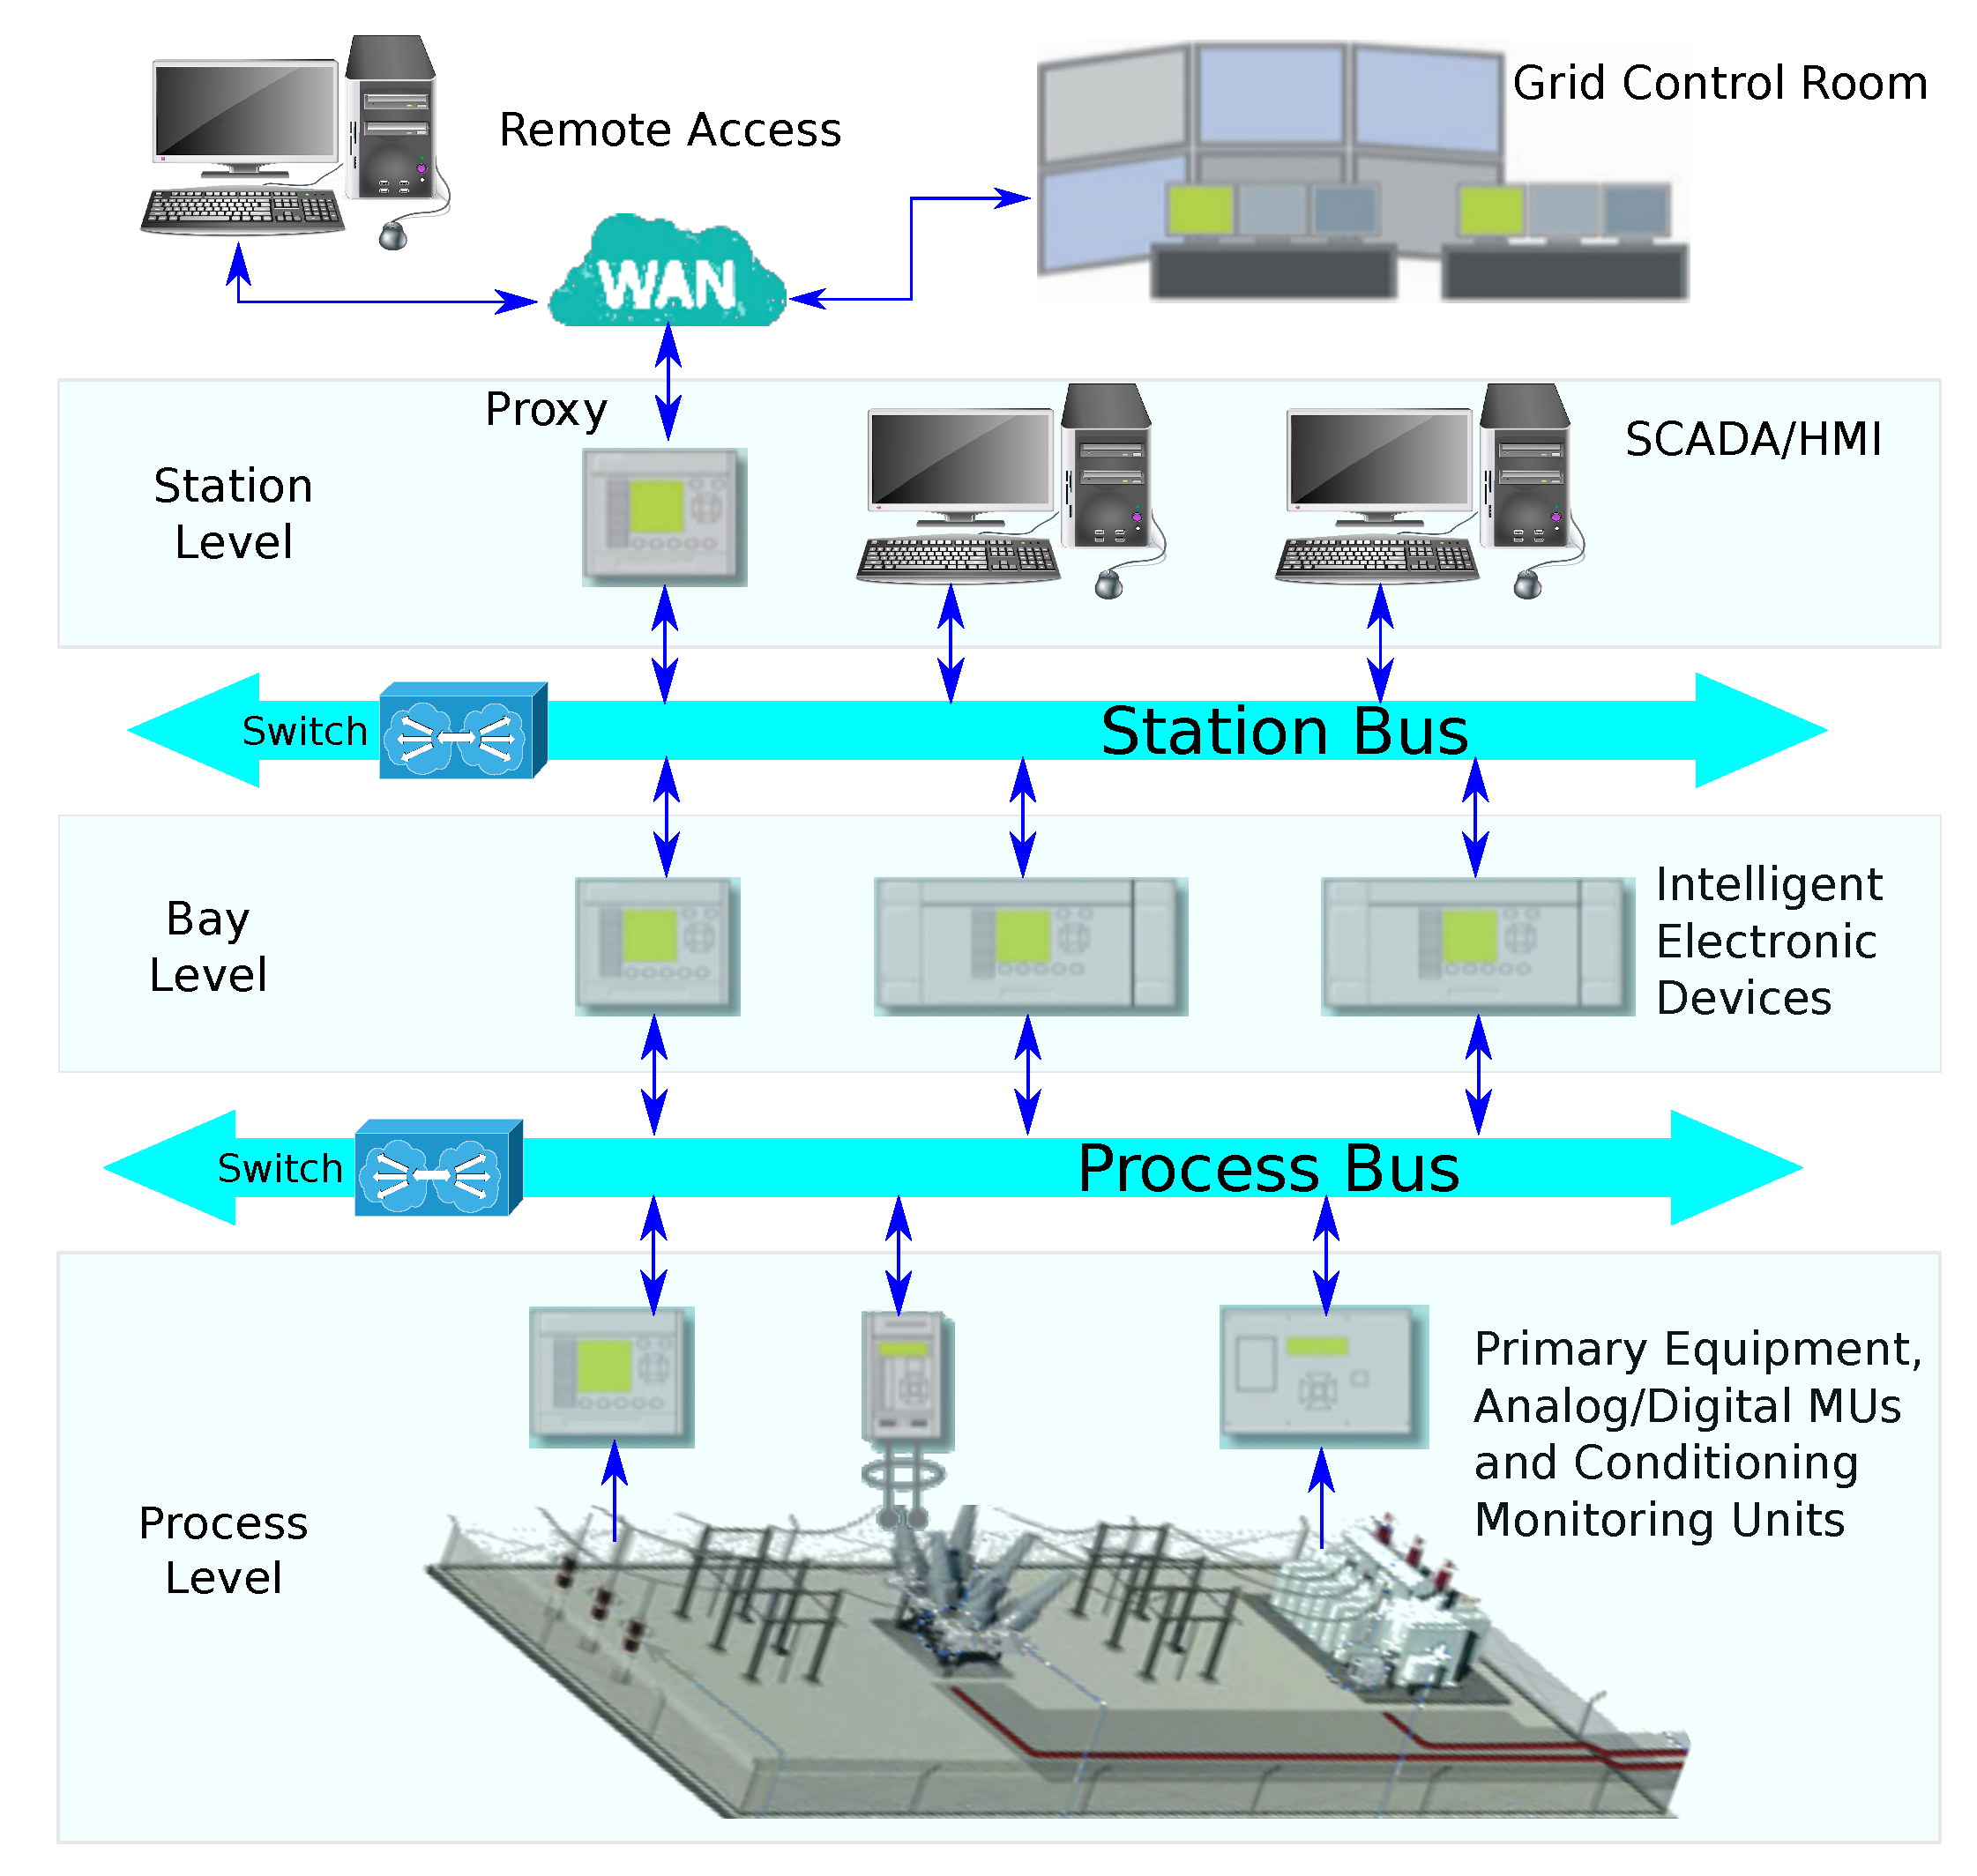
The IEC 61850 standard defines a networking architecture for SAS with three automation levels—station, bay and process—connected through two communication buses (
Figure 1) [
8,
10,
11]. The first—station bus—carries messages among the Supervision, Control and Data Acquisition (SCADA) systems, substation operators and protection relays. This bus is used for monitoring and control operations. The second—process bus—interconnects instrument transformers, Merging Units (MUs) and protection relay devices.
Two of the protocols that can be used within this context are SV and GOOSE, predominantly used for process bus transactions. These protocols are described, respectively, in parts 8 and 9 of the IEC 61850 standard [
9,
11]. They operate in a publisher-subscriber model and implement just the application, data link, and physical layers of the communication stack. While GOOSE is typically used to transfer information closely related to monitoring and control functions (circuit breaker status etc.), SV is used to transfer numerical samples of current and voltage signals.
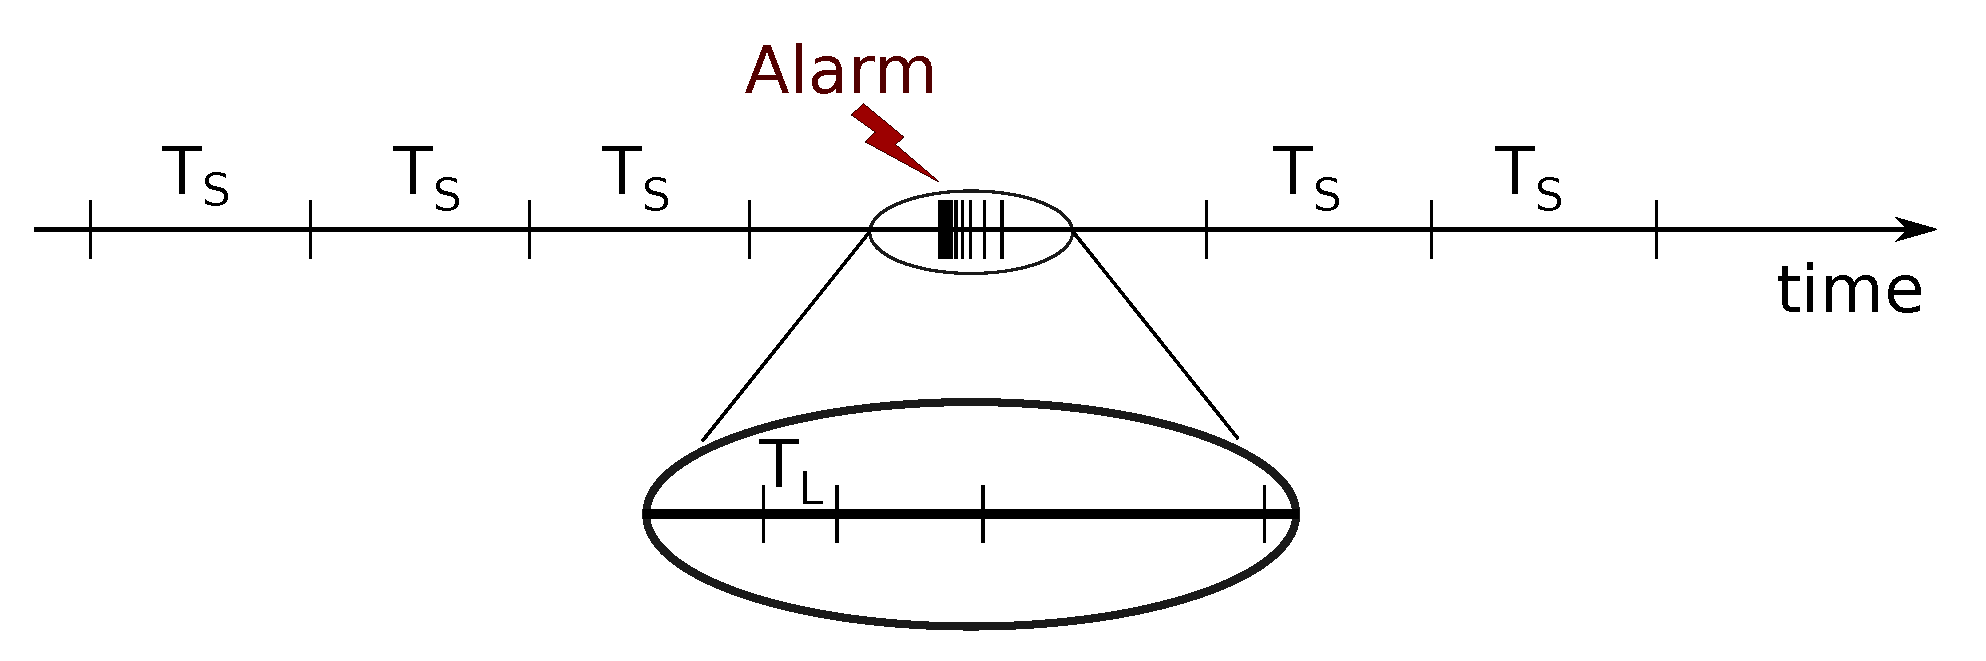
The SV protocol works on a periodic information transmission model, regularly sending messages at a fixed rate. For protection purposes, the default rate is 4000 or 4800 messages per second for, respectively, 50 or 60 Hz power systems. On the other hand, the GOOSE protocol operates in a sporadic information transmission model, where a continuous flow of data is maintained among LNs to increase communication reliability. Each message in a GOOSE transmission sequence has an attribute called Time allowed To Live (TTL) that informs the receiver about the maximum time to wait for the next transmission. As shown in
Figure 2, upon the occurrence of a relevant event (e.g., circuit breaker tripped), this time interval is immediately reduced to a minimum configured value (
). Subsequently, the TTL of these messages will be increased at each transmission, until reaching the initial steady state periodicity value (
).
IEC 61850 standard specifies the timing constraints for messages typically used in substations (
Table 1). GOOSE and SV messages are assumed as time critical messages, having the tightest deadlines (maximum allowed transfer time) among all IEC 61850 messages, corresponding to 3 ms.
Both GOOSE and SV run on the top of the Ethernet standard (IEEE 802.3). IEC 61850 also proposes the usage of IEEE 802.1Q upon IEEE 802.3 to deal with timing constraints in process bus applications. IEEE 802.1Q allows both (i) processing of messages with priority-based scheduling policies, and (ii) segmentation of the process bus into virtual local area networks (VLAN) to upper-bound the diffusion domain of both broadcast and multicast messages.
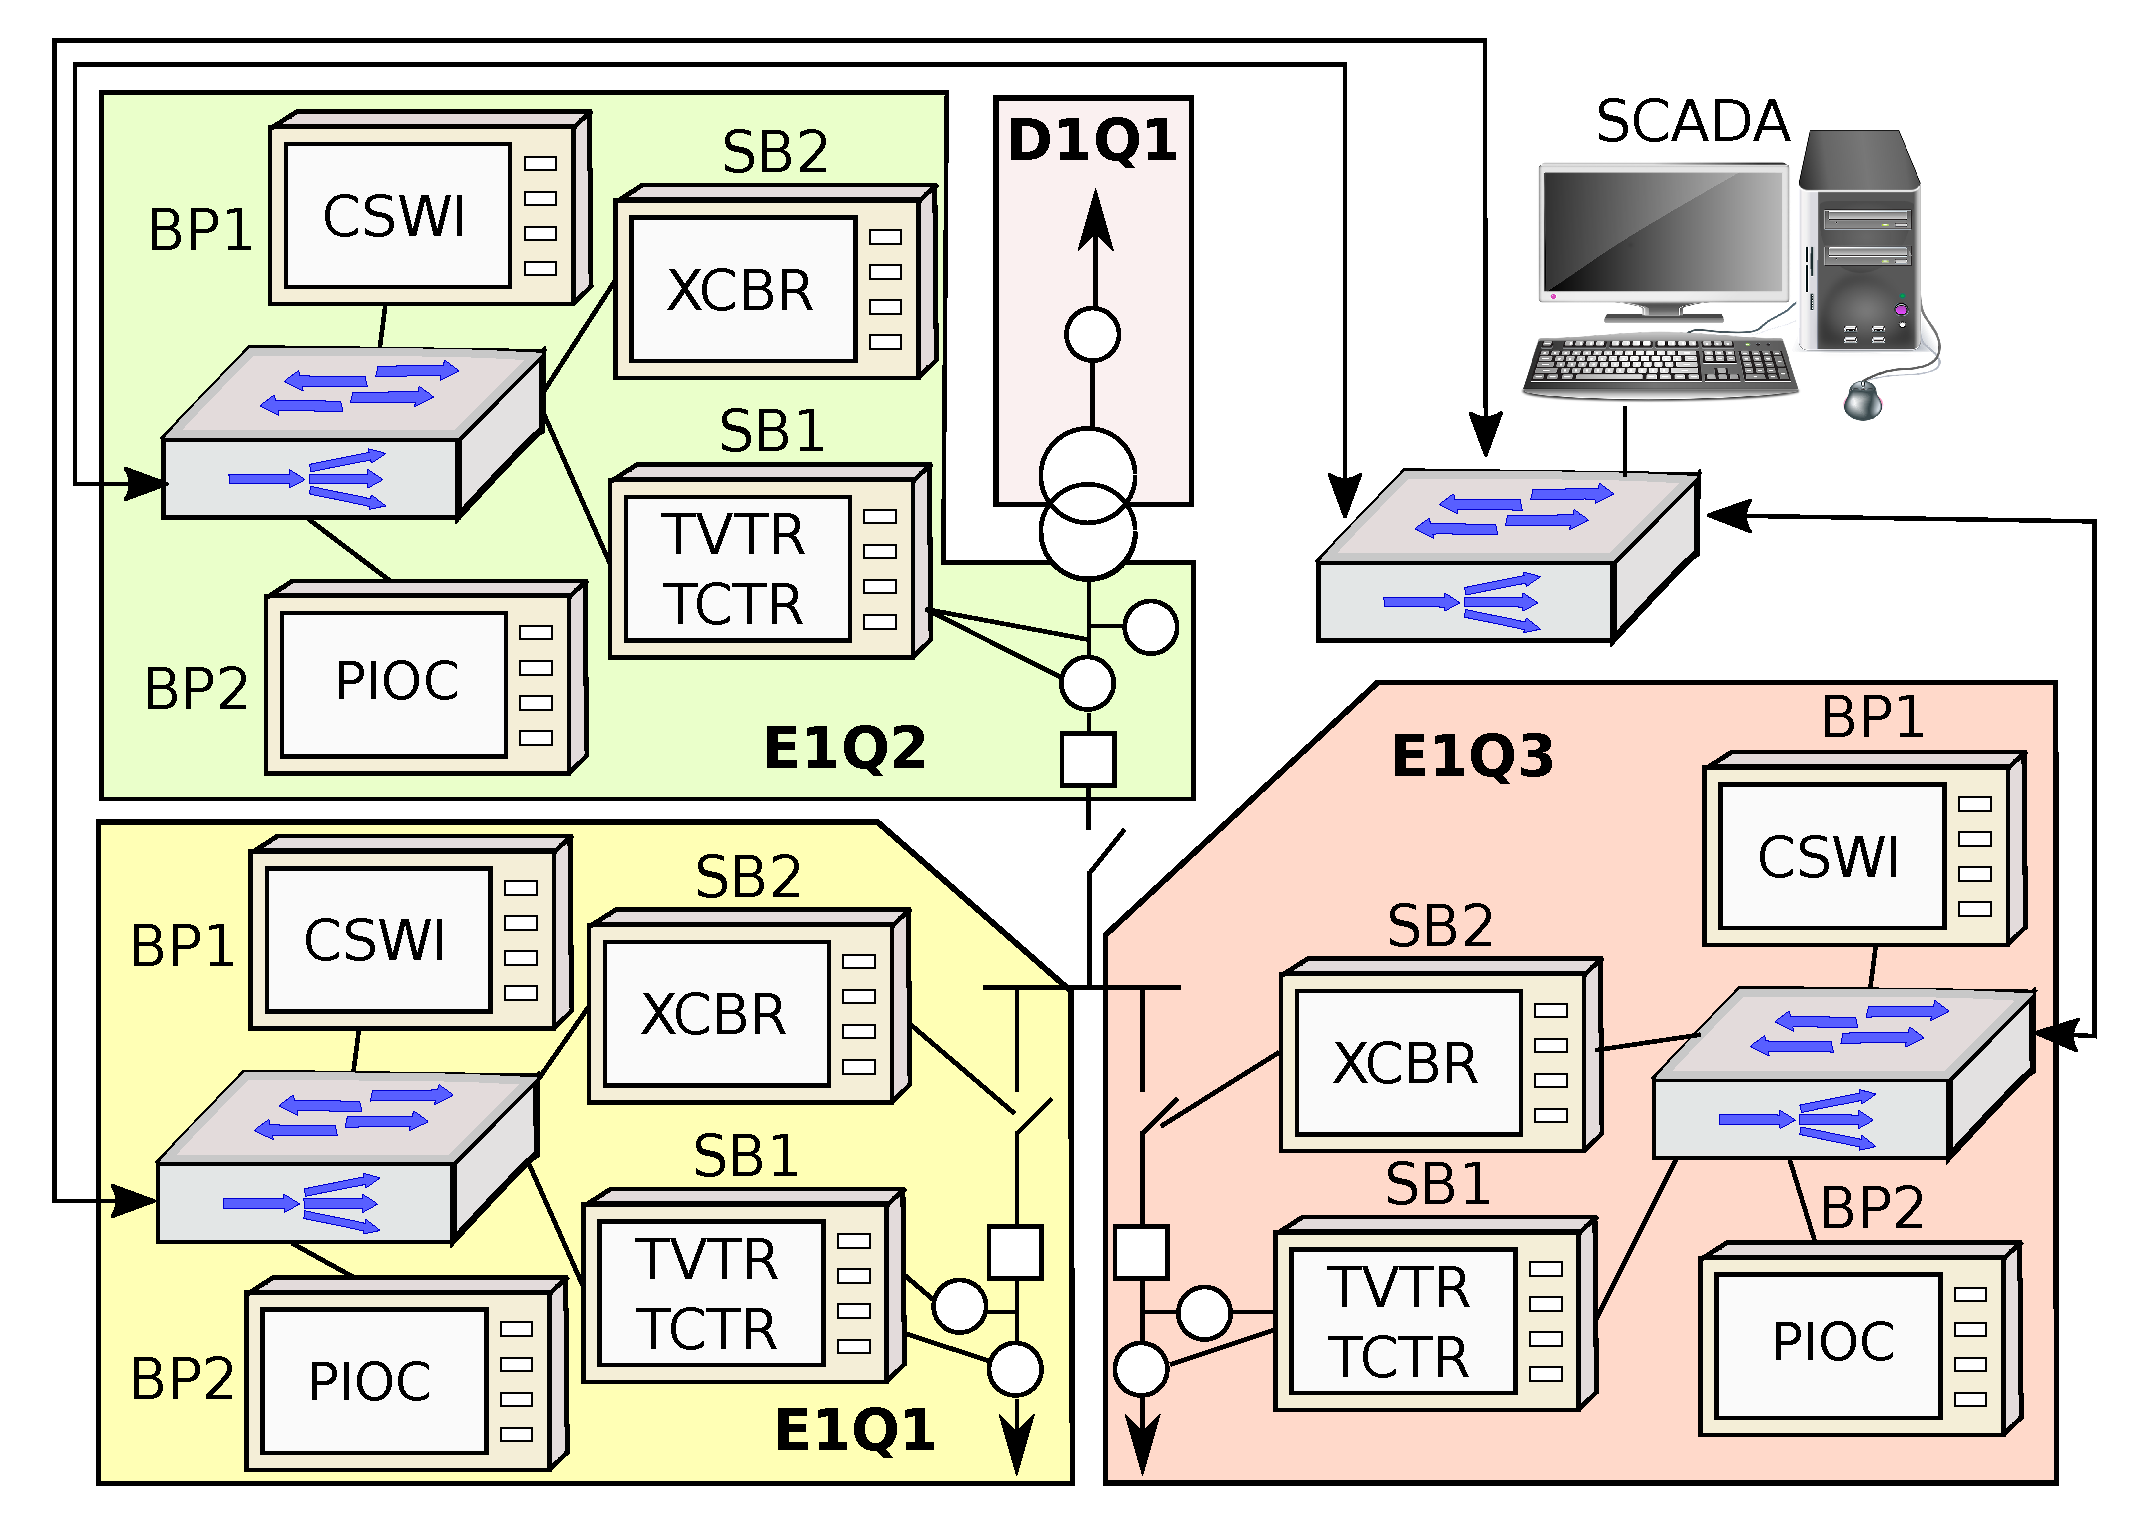
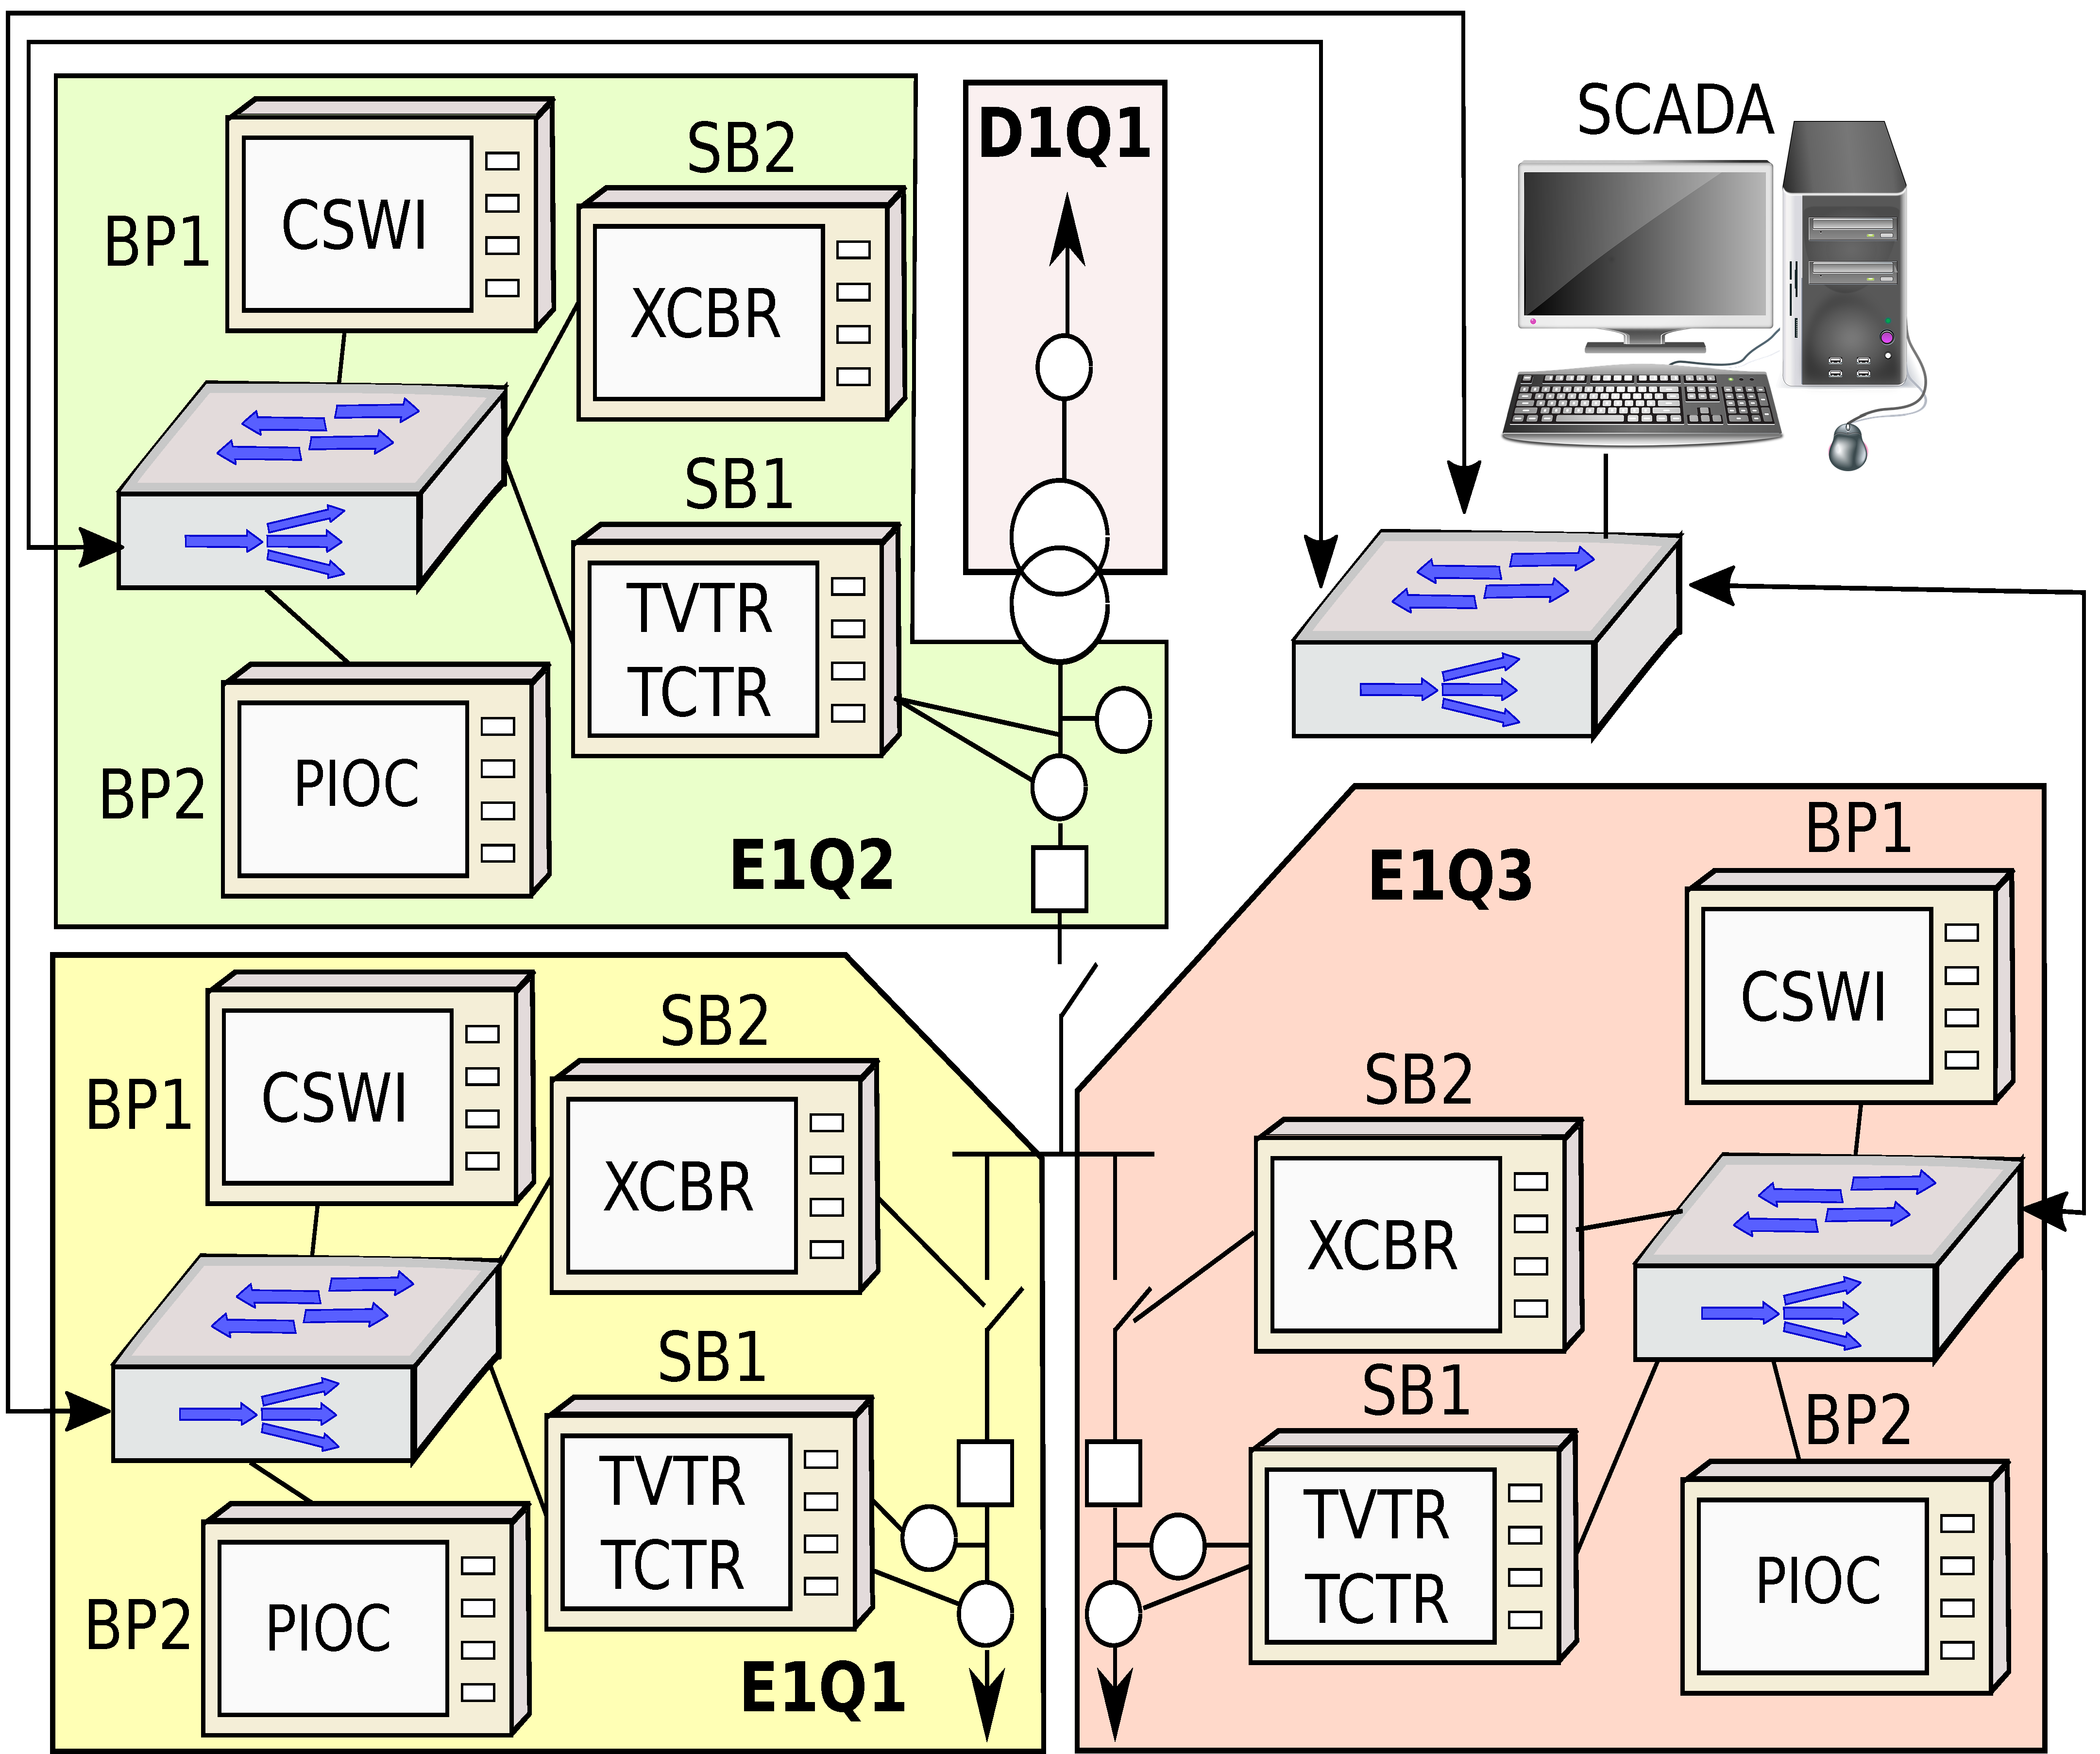
2.2. T1-1 Substation Reference Case Study
A relevant case study for the analysis of an SAS process bus operation has been described in Part 5 of the IEC-61850 standard as the T1-1 substation (
Figure 3). This case study is normally used as a reference for a substation that transforms voltage levels from 220 kV to 132 kV [
13,
14,
15].
In the example of
Figure 3, it is assumed that the switch connected to the SCADA complies with the IEEE 802.1Q standard and is able to configure multiple VLANs in order to logically isolate each feeder bay. Consequently, there will be no data transmission between different bays. Therefore, the following description may refer to the traffic of any of the bays of the T1-1 architecture (E1Q1, E1Q2 or E1Q3).
In each bay, a star topology has been selected to interconnect the SAS devices. There is one MU (SB1) that is an IED able to generate SV messages, and three Protection & Control (P&C) IEDs (BP1, BP2 and SB2), able to generate GOOSE messages. In
Figure 3, the names inside each device indicate the LN assigned to them. SB1 devices are intended to measure electrical parameters, and each one of them is composed of both a TVTR (Voltage transformer) and a TCTR (Current transformer) LNs. BP1 devices are responsible for the interlocking logic and are composed of a CSWI (Switch controller) LN. BP2 is responsible for the protection and is formed by a PIOC (Over current protection) LN. Finally, SB2 is responsible for the commands, and it is composed of an XCBR (Circuit Breaker) LN.
Table 2 presents the assumed network configurations for this T1-1 case study. While the new edition of IEC 61850 foresees the usage of Gigabit Ethernet, the bandwidth of the channel has been set to 100 Mbps which is a de facto speed value used in digital substations deployed projects [
16,
17]. In
Section 6, this assumption will be relaxed by simulation, analyzing a 1 Gigabit Ethernet process bus system.
The sizes of GOOSE and SV messages are set, respectively, to 160 and 140 bytes. While the standard allows larger messages, these values can be considered as typical maximum values for a T1-1 case study. It is important to note that P&C devices can operate in two modes: safe and emergency. When operating in emergency mode, these devices generate a traffic load of GOOSE messages 32 times greater than when operating in safe mode.
A typical operation scenario was defined to support the assessment of the timing behavior for the message exchanges.
Figure 4 illustrates the sequence of events for a specific feeder bay of this T1-1 case study: In safe operating conditions, SB1 transmits voltage and current samples for protection applications using multicast messages according to the SV protocol; that is, 4800 messages per second, containing information of four voltage-current pairs. At instant ➀, an electrical fault (e.g., over-current) occurs in the bay. In event ➁, the LN PIOC of BP2 receives and processes the message from SB1 reporting an “emergency” value. As a result, in event ➂, a sequence of GOOSE messages notifying this event is forwarded by BP2. In event ➃, the LN CSWI of BP1 processes these messages. Another sequence of GOOSE messages is then transmitted by CSWI as represented in event ➄. In event ➅, these messages are processed by the LN XCBR of SB2, in order to open the circuit breaker of the affected bay. Once performed the relay opening operation, in event ➆, a new sequence of GOOSE messages will be generated by SB2. In event ➇, CSWI processes these messages to become aware of the contact status change.
2.3. Related Work
Three main approaches can be found in the literature about how to deal with the timing assessment of IEC 61850 process bus communication: analytical models, simulation approaches and experimental studies mixing prototypes and multi-vendor equipments.
In order to assess the service provided by the communication network, analytical models usually consider worst-case operational conditions. However, depending on the application, the use of analytical models may increase the complexity of the analysis and introduce an excessive level of pessimism. Stochastic approaches [
18,
19], for example, have been used to quantify communication delays in SAS. In [
18], assuming a specific service model, a network calculus-based algorithm is proposed to evaluate the maximum delay of messages in an SAS communication bus. Results were compared against experimental measurements acquired from real equipments. The assessment results showed some level of pessimism, and also a dependence on the adopted arrival and service probabilistic distribution functions. In [
19], the authors propose a different network calculus-based algorithm to model the communication delay for a substation-area protection scheme. The results were compared with data obtained from a simulation platform developed in OPNET. In [
20], the authors use timed automata and model checking to perform formal verification of the IEC 61850 real-time communication requirements.
On the other hand, the use of simulation approaches allows the assessment of multiple substation scenarios at a relatively small cost and risk. However, it must be carefully considered that simulation models are prone to excessive simplifications. Therefore, the selection of adequate simulation models is a crucial step to obtain reliable results. In [
13,
14,
15] some specific simulation platforms are presented. Ref. [
13] proposes simulation models for the OMNeT++/INETMANET framework to support IEC 61850 based communication. An interface to incorporate messages from external networks as part of the simulator was also developed. Ref. [
14] proposes the modeling of a Phasor Measurement Unit and also presented simulation models of IEDs for the OMNeT++/INET platforms. Ref. [
15] proposes simulation models for SAS devices using the OPNET tool. Ref. [
21] adopts the OPNET simulator configured to assess the use of Constrained Application Protocol (CoAP) in an IEC 61850-based SAS. The work in [
22] targets Distributed Automation Systems (DAS) addressing the autonomous execution of distributed applications, enabling IEDs to handle dynamic topologies and establishing data flows between independent IEDs. To assess the proposed approach, a case study has been setup and implemented through a simulated DAS.
Finally, lessons learned from experimental assessments with real equipments provide also important inputs to understand typical SAS behaviors. However, the use of experimental assessments usually faces scalability problems, in what concerns the number of considered IEDs, and can hardly replicate real conditions in complex operational scenarios. In [
23], electrical signal generators, IED emulators and network traffic capture boards were used to study the interaction between time synchronization protocols and IEC 61850 communication protocols. Other works, as in [
24], used the so-called Real-Time Digital Simulator (RTDS) to assess the behavior of SAS close to real situations. Ref. [
25] describes a specific calibration setup composed of analog signal generators, hardware for SV capture and analog-to-digital converters.
The use of specific hardware setups combined with numerical simulations can be used to assess complex systems, using techniques known as hardware-in-the-loop simulation. As an example, due to the higher complexity of protection and communication systems of IEC 61850-9-2LE substations, in [
26] is proposed the use of this simulation technique in a laboratory test bed for analyzing the performance of complex substation topologies that are prone to faults.
In [
27,
28], methodologies with some similarities to the one proposed in this paper are proposed. In [
27], the authors analyzed a bay of an IEEE-39 bus system model consisting of one bay controller, one circuit breaker, 2 MUs, and 2 protection relays. The assessment of the GOOSE and SV protocols in this bay was done both through simulation using OPNET and through analytical measures using network calculus-based equations. An atypical configuration for SV messages in protection applications, which is not compliant with the recommendations of IEC61850-9-2LE, was used. Furthermore, although being stated that the system uses 802.1Q, the paper does not describe how VLANs and priorities were configured and managed.
In [
28], the network delays in a multi-hop process bus substation network are also characterized through analytical and simulation models. However, as almost all above-mentioned works [
13,
14,
15,
19,
23,
24,
25,
28], the focus lies upon the modeling of communication interactions from the application layer perspective, disregarding existing data link layer communication services, such as VLANs and prioritization mechanisms. In particular, such works typically ignore the behavior of IEEE 802.1Q standard services, which are of critical importance for the study of IEC 61850 communications.
In this paper, we aim to explore the advantages of using a combination of these methodologies, in order to obtain a more accurate assessment of the messages’ timing behavior for different IEC 61850 based communication scenarios.
3. Analytical Model for IEC 61850 Process Bus
This section introduces a worst-case response time analysis tool that can be used for the assessment of typical SAS communications compliant with the IEC 61850 standard.
3.1. Real-Time Scheduling Concepts and Notation
A real-time task is an abstraction used in real-time scheduling theory [
29], which corresponds to some entity that can be scheduled for execution according to a predefined policy. In the context of an IEC 61850 process bus, a real-time task may correspond to a GOOSE or an SV message stream. In this case, the resource shared by the message streams is the transmission medium or, in the case of switched networks, the transmission queue at the switch. An SV message stream can be modeled as a periodic task. On the other hand, a GOOSE message stream may correspond to a sporadic task which, in real-time scheduling theory, consists of an aperiodic task with a minimal interarrival time.
A basic way of modeling a real-time system and assessing the feasibility to meet its deadlines is by performing this related schedulability analysis. Real-time systems usually follow a priority-based scheduling, where the access to the shared resource can be preemptive or non-preemptive. Considering that, when a message is being transmitted, it occupies the channel until the end of its transmission, the IEC 61850 process bus shall be modeled as non-preemptive scheduling system.
In this particular case study involving an SAS, the main real-time scheduling attributes of the message streams and their notations are highlighted in
Table 3.
In
Table 3, the value of
i refers to the index of the message stream, where all the messages share the same attributes. For example,
refers to the longest transmission time of message stream
i, but it also refers to the longest transmission time of all messages in stream
i.
3.2. Message Priority Assignment Policy for Substation T1-1
Among the priority-based scheduling methods, those using static priority assignments have been widely adopted by industry due to its easy implementation, low execution overhead and greater predictability in case of failures [
29]. Static approaches follow basically three steps. First, at design time, priorities are assigned to the message streams according to some specific policy. Then, a schedulability test is applied to verify whether each message stream will meet or not its deadlines. If all message streams meet individual deadlines, then it is said that the system is schedulable or feasible. Finally, at runtime, a scheduler triggers the transmission of a message from the stream that has the highest priority among those that have a message ready to be transmitted. In the case of substation T1-1, the IEEE 802.1Q compliant switch has the responsibility for implementing the priority scheduler that will schedule the GOOSE and SV messages.
For the first of the three aforementioned steps, the Rate Monotonic algorithm (RM) will be used in this paper. It is well-known that there is no optimal priority assignment policy when the system is non-preemptive and the tasks have arbitrary deadlines (deadlines that can be greater than the periods) [
5]. The basic idea of the RM assignment policy is to assign higher priorities to the message streams with lower periods.
The assessment of a real-time system must be made under worst-case operation scenarios.
Table 4 presents the message streams parameters of a T1-1 bay, when the system changes from “alert” to “emergency” state. This is the moment when GOOSE message streams shorten their periods to the minimum configured value, thus increasing the network load to its maximum (see
Table 2). The first column of
Table 4 refers to the message streams names that will be used throughout this work. The numbers in the second column refer to the events shown in
Figure 4.
According to the IEEE 802.1Q standard, compliant switches have eight priority levels, where 0 indicates the lowest and 7 the highest priority level. Thus, applying a RM scheduling policy, the highest priority level in the system was assigned to SV streams from SB1 (
). The three GOOSE message streams have the same periodicity and therefore priorities were sequentially assigned following the chronological order of events occurred during the over-current fault described in
Figure 4, as follows: priority 6 assigned to GOOSE message streams produced by BP2 protection devices (
); priority 5 assigned to GOOSE message streams produced by BP1 interlocking devices (
); and priority 4 assigned to GOOSE message streams produced by SB2 command devices (
). It is important to highlight that this priority assignment do not reflect the relative importance of tasks: When the schedulability test is positive, all the message streams will meet their deadlines, even the lowest priority stream.
Table 4 shows the
value for each of the T1-1 process bus message streams under analysis. These
values already include the Inter Frame Gap (IFG) value specified by the IEEE 802.3 protocol, which is a time interval after a message transmission during which the channel must remain free. The IFG value corresponds to the time required to transmit 96 bits in the communication channel. Thus, assuming a 100 Mbps Ethernet, for a
of 10 ns, IFG is equal to 960 ns. In this sense, for an SV message, with a size of 140 bytes,
10 ns + 960 ns, resulting in
s. Similarly, for a GOOSE message of 160 bytes, this calculation results in
s.
Another value that appears in
Table 4 corresponds to the delay jitter. As the typical delay jitter for Ethernet switch queues has values around 100 ns, it was adopted the value of 1000 ns for a worst-case jitter value (
) of the message streams for a 100 Mbps Ethernet, and 200 ns for a 1 Gbps Ethernet [
30].
It is important to note that GOOSE message streams are treated as periodic tasks. This approach, although pessimistic, is usual in real-time scheduling theory due to its simplicity when handling sporadic tasks. According to this, a real-time sporadic task can be modeled as a real-time periodic task with a period equal to the minimum interarrival time between two consecutive instances. Consequently, in
Table 4, GOOSE sporadic message streams will be handled with a periodicity of 31,000
s. This value was selected to match the minimum TTL values reported on the equipment manuals used in the experimental assessment [
31,
32] (see
Section 5.2).
In this case study, it is assumed that there is no background traffic in the process bus of T1-1 substation, for example, generated by PTP message streams. The rationale behind this assumption was that this type of traffic can be avoided in the SAS process bus by using VLANs, and segregating the network traffic into synchronization traffic and protection/automation traffic. Nevertheless, this assumption will be relaxed in
Section 6, where we illustrate how to integrate the PTP background traffic in the schedulability analysis.
3.3. Real-Time Scheduling Analysis
The response time analysis for a non-preemptive fixed-priority system, as proposed in [
3,
4,
5], can be adapted to estimate the maximum response time of message exchanges in an IEC 61850 process bus communication system Equation (1).
where
and
In parts (1b) and (1c) of Equation (1), term represents the i-busy-period, that is, the window of time within which messages with priority higher than or equal to message i (that is, )) are being continuously transmitted. As the task model of the system is non-preemptive and admits arbitrary deadlines, in order to determine , it is necessary to analyze multiple instances of a message i within the busy period. These instances are represented by the term q and form a finite set bounded by the value of Equation (1b).
In part (1d), the term represents the delay that a message from stream i suffers before its execution. This term includes the interference caused by messages from streams of higher priority and a block term caused by a given message from a lower priority stream that was already using the communication bus before the message from stream i has been released.
For the calculation of both terms
and
, it is considered that equations are monotonically increasing and, therefore, they can be iteratively solved, until their convergence. In the procedure proposed by [
5],
is assumed as the initial value of
and
as the initial value for
.
3.4. Worst-Case Response Time Analysis Results
Assuming values of
Table 4, Equation (1) may be used to verify the schedulability of the T1-1 set of message streams from the point of view of the switch ports. By demonstrating that this message stream set is schedulable, it can be concluded if the system meets (or not) the timing requirements of the supported SAS applications.
It is important to note that as the system is non-preemptive, a message can be only blocked once by a lower priority message, and therefore it is necessary to assume a worst-case blocking time. For the particular case of the T1-1 set of message streams, as
,
and
have the same
(see
Table 4), the respective blocking times are similar. For this reason, and for the sake of simplicity, in the following analysis it is assumed that
is always the message stream that blocks other streams, as shown below.
Calculation of : starting with
as the initial value of
and assuming
s, whose value corresponds to the computation time of
, we have:
Iterating again:
Therefore, 7-busy-period value converged in
s. By applying Equation (1b):
The value of
indicates that the
q value in Equation (1) is equal to 0. Therefore, in order to obtain the worst-case response time for
, it is enough to examine its first instance within the 7-busy period.
Calculation of: Since
is the highest priority message stream, in Equation (1d) there is no element in
. Because
, this equation can be simplified to
. Therefore,
converges to
s. Through Equation (1a),
s. As this worst-case response time is smaller than the deadline
(
s), we conclude that
is schedulable and it will always meet its deadline.
Calculation of : starting with
as the initial value of
, and assuming
, we have:
Iterating again:
This iteration converges with the value of 6-busy-period equal to
s, then:
This value of
Q indicates that the
q value in Equation (1) is equal to 0 and it is enough to examine the first instance of
within the 6-busy period.
Calculation of: starting with
as the initial value of
, this results in
s. By applying Equation (1d):
As
(0) converges in
s, then
s. This time value is smaller than
(
s) and therefore this message stream is always schedulable.
Applying similar reasoning, the worst-case response times can be evaluated for all the T1-1 set of message streams (the complete scheduling calculation is provided as
Supplementary Material available online).
Table 5 summarizes these values. Since
,
message streams set, we may conclude that this set of message streams is schedulable according to the RM policy. Moreover, it can be observed that all
obtained by the response time analysis are much smaller than the corresponding
. This situation occurs because the analyzed system has a lot of slack time. This can be corroborated by direct inspection of
Table 4, where the total utilization of the system (sum of column
) is rather small, being less than 6%, leaving a large margin for the system expansion. This expansion can be achieved, for example, by increasing the number of devices in the bay. The analytical tool presented in this section may become highly useful for the scalability analysis of a process bus based on IEC 61850. In the next section we will present an example of a typical scalability analysis that can be made.
4. Scalability of T1-1 Networks
The IEEE 802.1Q standard provides a limited number of just 8 different priorities. This restriction may lead to the case where different message streams with the same priority have messages waiting to be transmitted in the switch queue. In the case study of
Section 3, this situation was intentionally avoided by keeping the load on the bus at a low value and assigning different priorities to T1-1 network message streams. Consequently, the output buffers of the switch never had more than one message with the same priority ready to be transmitted. This is a convenient solution for small scale systems. However, whenever the complexity of an SAS bay increases, it will be unavoidable to have more than one IED sending messages with the same priority.
As an example, assume now that in the T1-1 scenario of
Section 3 there are
N MU devices sending SV messages at a rate of 5376.09 kbps, and three P&C devices, each one sending GOOSE messages at a rate of 41.29 kbps (see
Table 2). A naive test to find the maximum number of MU devices that the system would be able to support, would divide the bus bandwidth by the MU transmission rate, that is:
This type of test may become very optimistic, whenever different periodicities are used to send messages by multiple SV and GOOSE message streams. A more adequate test to find an upper bound value for
N would be based on the concept of total utilization, which consists in accounting the sum of the utilization of the individual message streams in the system:
As N must be an integer number, . However, it is important to point out that this is just a “necessary but not sufficient” test. Again, this type of utilization-based tests only defines an upper bound for the number of MUs, being unable to provide the exact maximum number. What this type of necessary test points out is that the T1-1 system is not schedulable for more than 17 MUs. However, it is not able to confirm if a system with 17 or less MUs is schedulable or not.
Figure 5 illustrates a timeline for the execution of this system assuming 17 MUs (note that the timeline presented is optimistic because it does not account for jitter values). For the sake of convenience, the 17 MU message streams are represented as a single stream called
. This task has the same period and deadline of
but its maximum transmission time is equivalent to
s, that is,
s. In the timeline, it is also assumed the critical instant concept [
3], where all streams (
,
,
and
) are simultaneously released at time instant 0.
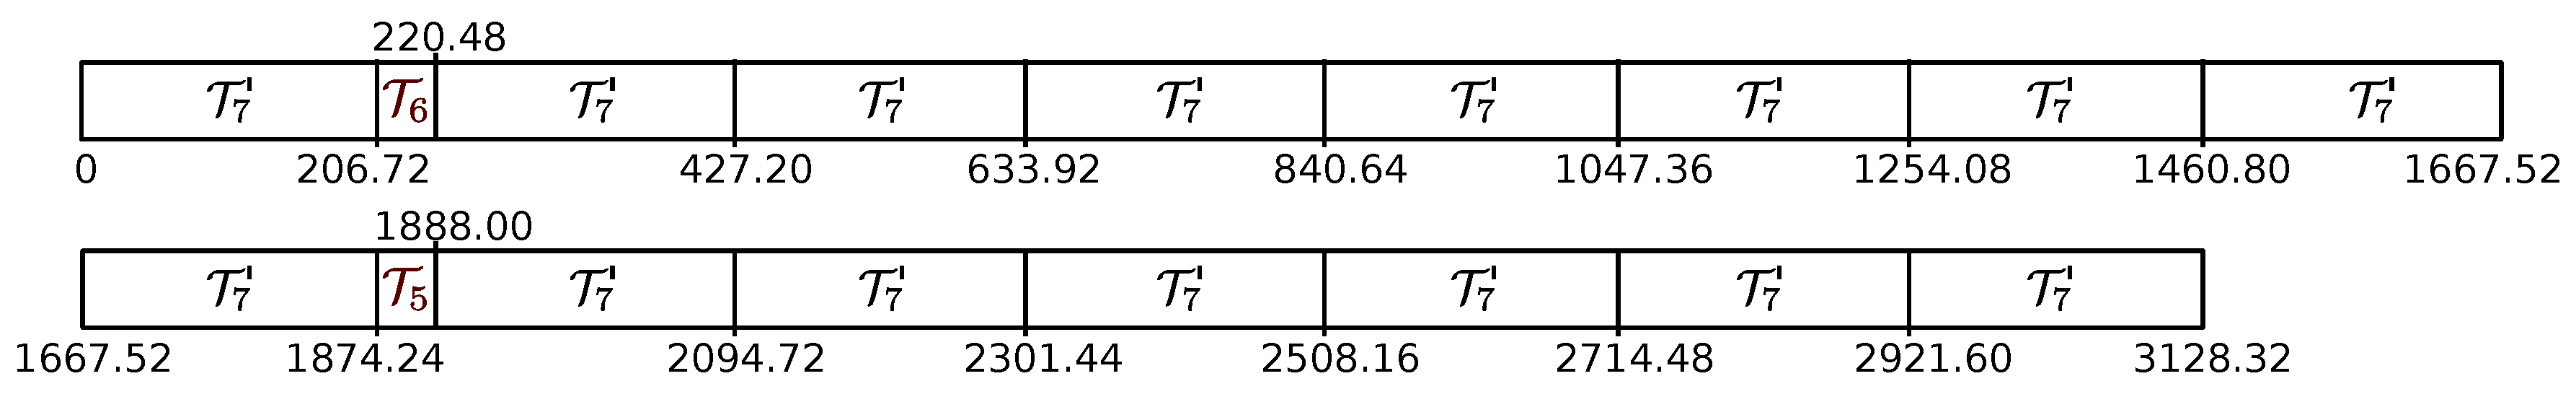
finishes its first instance at s and then executes until s. The second instance of had arrived at s, but since the system is not preemptive, it is blocked by . This instance and subsequent sequence of instances arrive and run consecutively until s. Then executes until s. The tenth instance of had arrived at s but it had to wait for the completion of . Again, a sequence of instances of arrives and runs consecutively until s. As were not able to execute until its deadline (s), the system is not schedulable. This behavior highlights the “necessary but not sufficient” label of utilization-based tests, which are not able to guarantee the schedulability of the system.
Instead, by using response time analysis based tests, it would be possible to show that this system is not feasible with 17 MUs, but feasible with 16 MUs. In this sense, it is necessary to test every message stream of the system. For the sake of convenience, we will just illustrate the results for . Now, s. Thus, for the calculation, applying Equation (1c): s. The next iterations result in s. Then, using Equation (1b): . As , for the calculation, it is enough to analyze just the first instance of . By applying Equation (1d): s. The next iterations result in s. Therefore s.
These results show that is schedulable when the T1-1 system has 16 MUs. In this configuration, the system has a total utilization of: , which characterizes a system with high network load.
5. Simulation and Experimental Assessment of Similar T1-1 Case Studies
In this section, the worst-case response time analysis tool is validated by comparison with both simulation and experimental setups. Initially, it is presented the simulation setup configured as a small-size SAS bay with VLANs. In the sequence, results from an experimental setup with the same configuration are compared with results obtained through both simulation and analytical assessments.
5.1. Simulation Assessment
The same scenario presented in
Figure 4 was assessed using a set of simulation models developed for the OMNeT++ and INET frameworks, previously presented in [
33] and available in [
34]. In addition to the simulation models originally available in OMNeT++, a set of specific models were developed for the simulation of elements of an SAS control bus. The conformance statements of this simulator are presented in
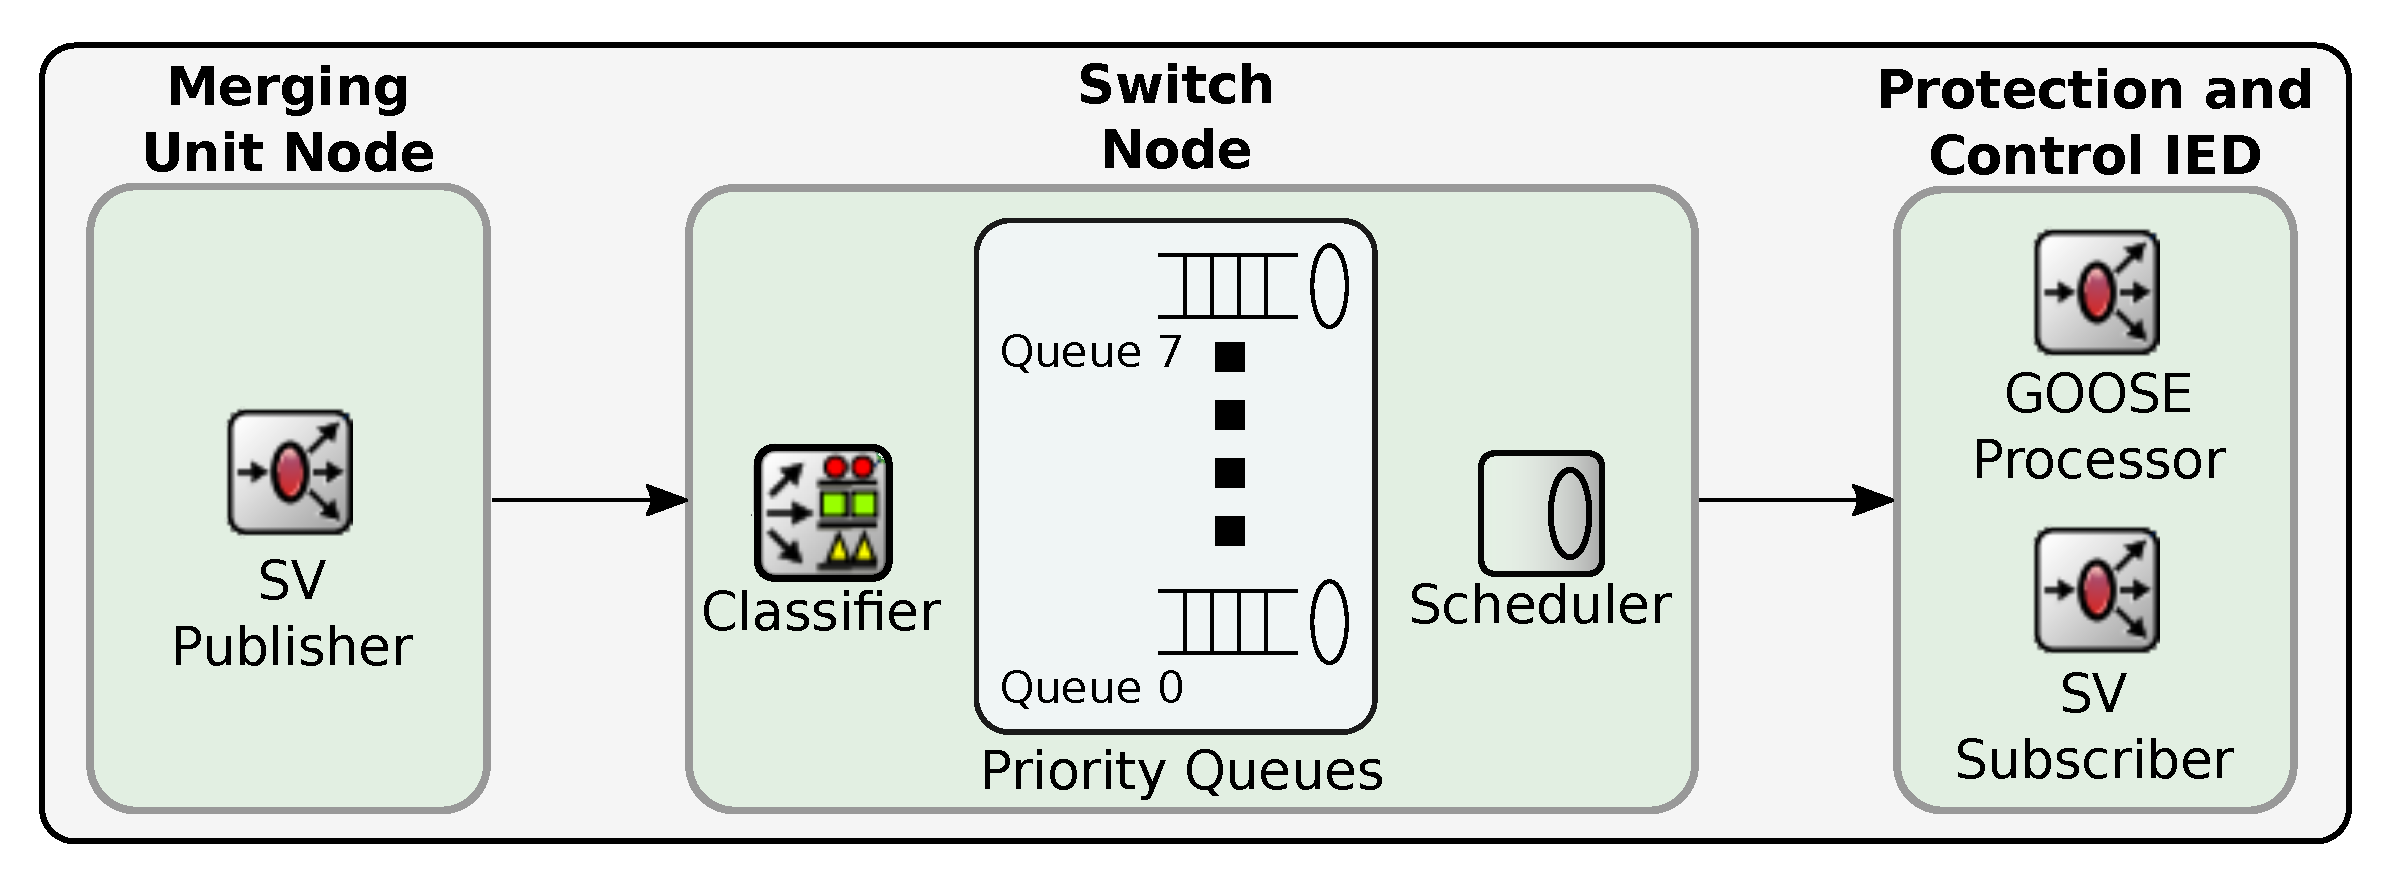
Appendix A.
Figure 6 depicts the three main developed components: Merge Unit Node, Switch Node and Protection and Control IED. The main communication flow is also illustrated in the figure, where SV messages generated by MU IEDs are classified within the switch, forwarded to their respective priority queues and scheduled to be sent to P&C IEDs. These P&C devices, besides being able to process SV messages, they can also generate and process GOOSE messages during emergency operations.
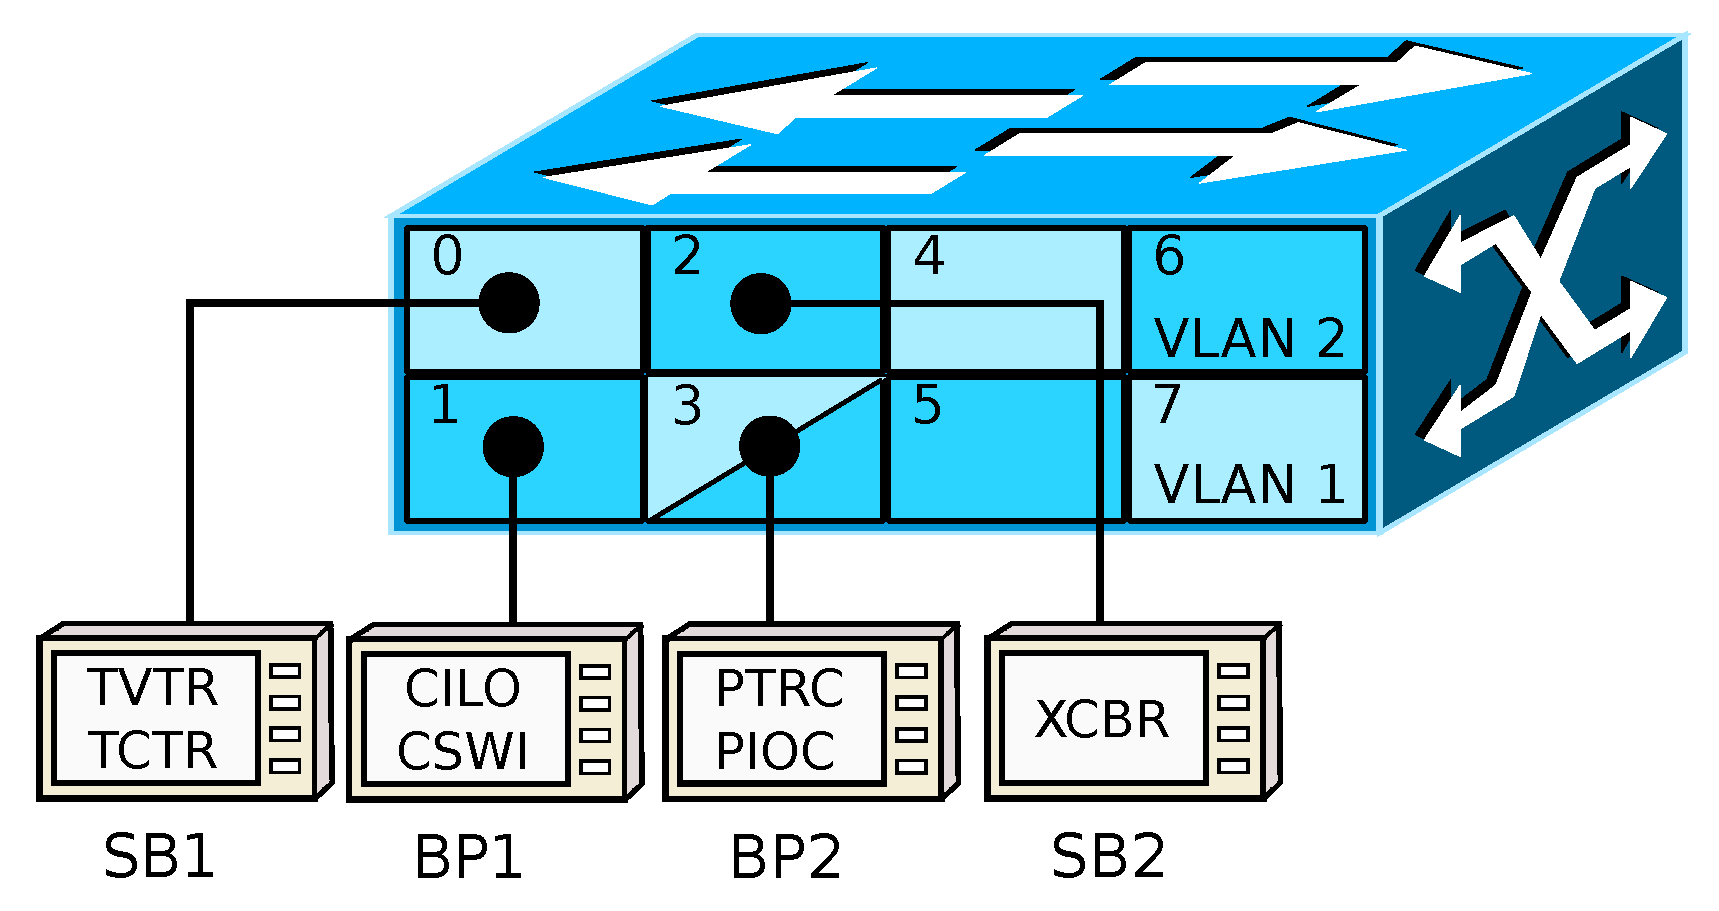
The switch simulation model was also developed according to the protocol requirements specified by the IEEE 802.3 and IEEE 802.1Q standards, focusing on full-duplex operation mode, VLAN configuration and message prioritization. The switch was configured with SB1, BP1, SB2 and BP2 devices connected to port 0, 1, 2 and 3, respectively. Two VLANs were created, with port 0 associated with VLAN1, ports 1 and 2 to VLAN2, and port 3 allocated to both VLAN1 and VLAN2 (
Figure 7).
As a consequence of the segmentation of the network and the use of messages with multicast destination address, each P&C device processes GOOSE messages from two different sources with the exception of BP2, which belongs to both VLANs. This device, in addition to processing GOOSE messages, also processes SV messages from SB1.
Table 6 summarizes the source/destination of each message stream and its corresponding VLAN. As BP2 is configured as processor of SV messages, instead of generator, it does not generate SV messages, just process the ones generated by SB1. For this reason, SB1 and port 0 do not appear as a destination and output port of BP2 in this table.
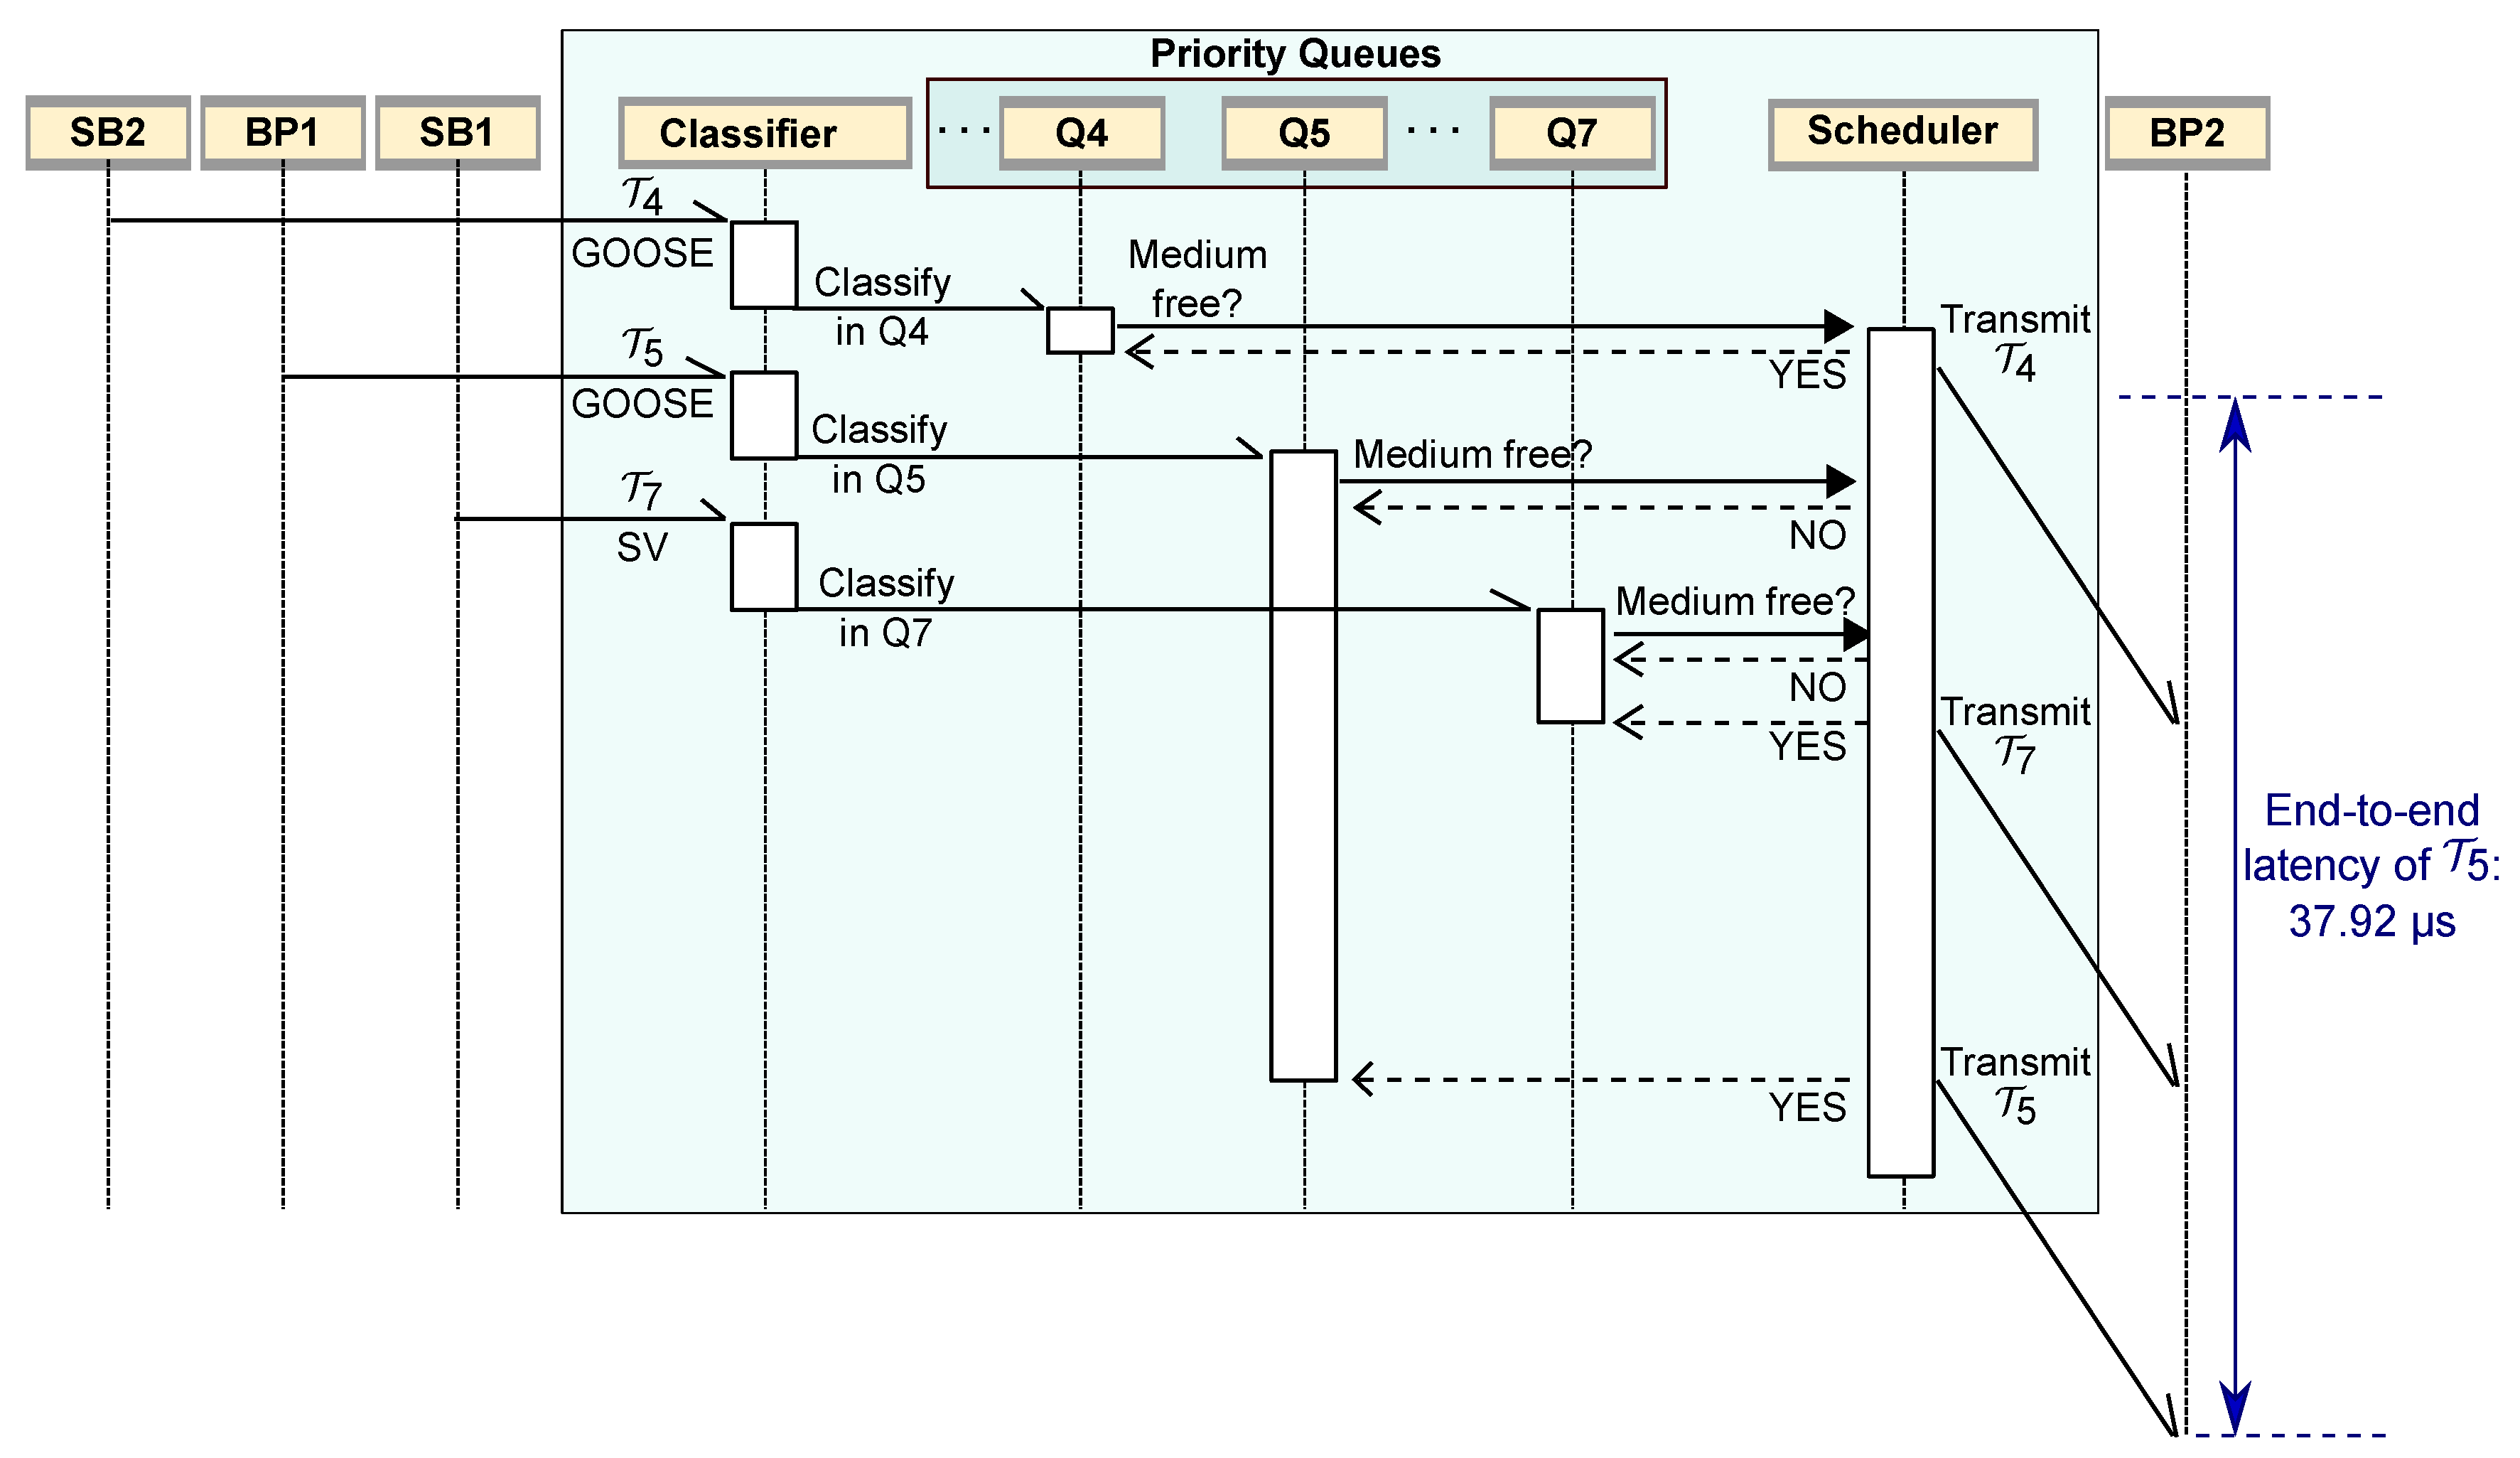
The communication snapshot illustrated in
Figure 8 represents a message exchange scenario that highlights the worst-case end-to-end communication delay for a GOOSE message sent by BP1 (
) that was obtained during the simulations. This scenario give emphasis to a situation where message
arrives at the output port 3 of the switch, but a lower priority GOOSE message (
) sent by SB2 already is occupying the communication channel. During the interval that
is blocked, a SV message of higher priority
arrives at the output port 3 and is also blocked by
. When the
message ends, the switch starts sending
. The switch only starts transmitting
after the end of
. For this specific communication-case scenario, where
receives a blocking from
and an interference from
, it was obtained in the simulator the maximum measured response time of
s.
In this snapshot, the IEDs were configured to have buffers that allow the switch to retransmit a message whenever the channel is released (while respecting the IFG time interval). Therefore, the interferences and blockages between messages in the switch are not affected by the IED processing times. The simulation results are illustrated in
Table 7.
When comparing these results with the worst-case analytical results from
Table 5, it can be observed that the analytically-obtained results incorporate some pessimism and may consider the occurrence of interferences and blocking that could have been avoided through a careful configuration of VLANs.
To better understand the traffic behavior of the switch, it is important to detail its operational model (see
Table 6).
,
and
compete for the output queue of port 3,
and
compete for the output queue of port 1, and
and
compete for the output queue of port 2. Consequently, analyzing this information, it can be stated that:
(i) never receives any interference from
;
(ii) never receives simultaneous interference from
and
(either it receives interference from
on port 3 or from
without being blocked by
on port 2); and
(iii) never receives simultaneous interference from
,
and
(just either from
and
on port 3, or from
on port 1).
Therefore, in order to build an analytical model that reflects this specific VLAN configuration, the following actions can be considered. Assuming item (i),
is no longer part of
, then
. Considering item (ii), it is assumed that
is no longer part of
, thus
. Finally, considering item (iii), it is assumed that
receives interferences only from both
and
, then
.
Table 8 highlights the results from the analytical model assuming the relaxations due to this specific VLANs configuration.
The vicinity of the results obtained from both the analytical model and the simulator is a strong indication that both were correctly designed to reflect the SAS behavior.
5.2. Experimental Assessment
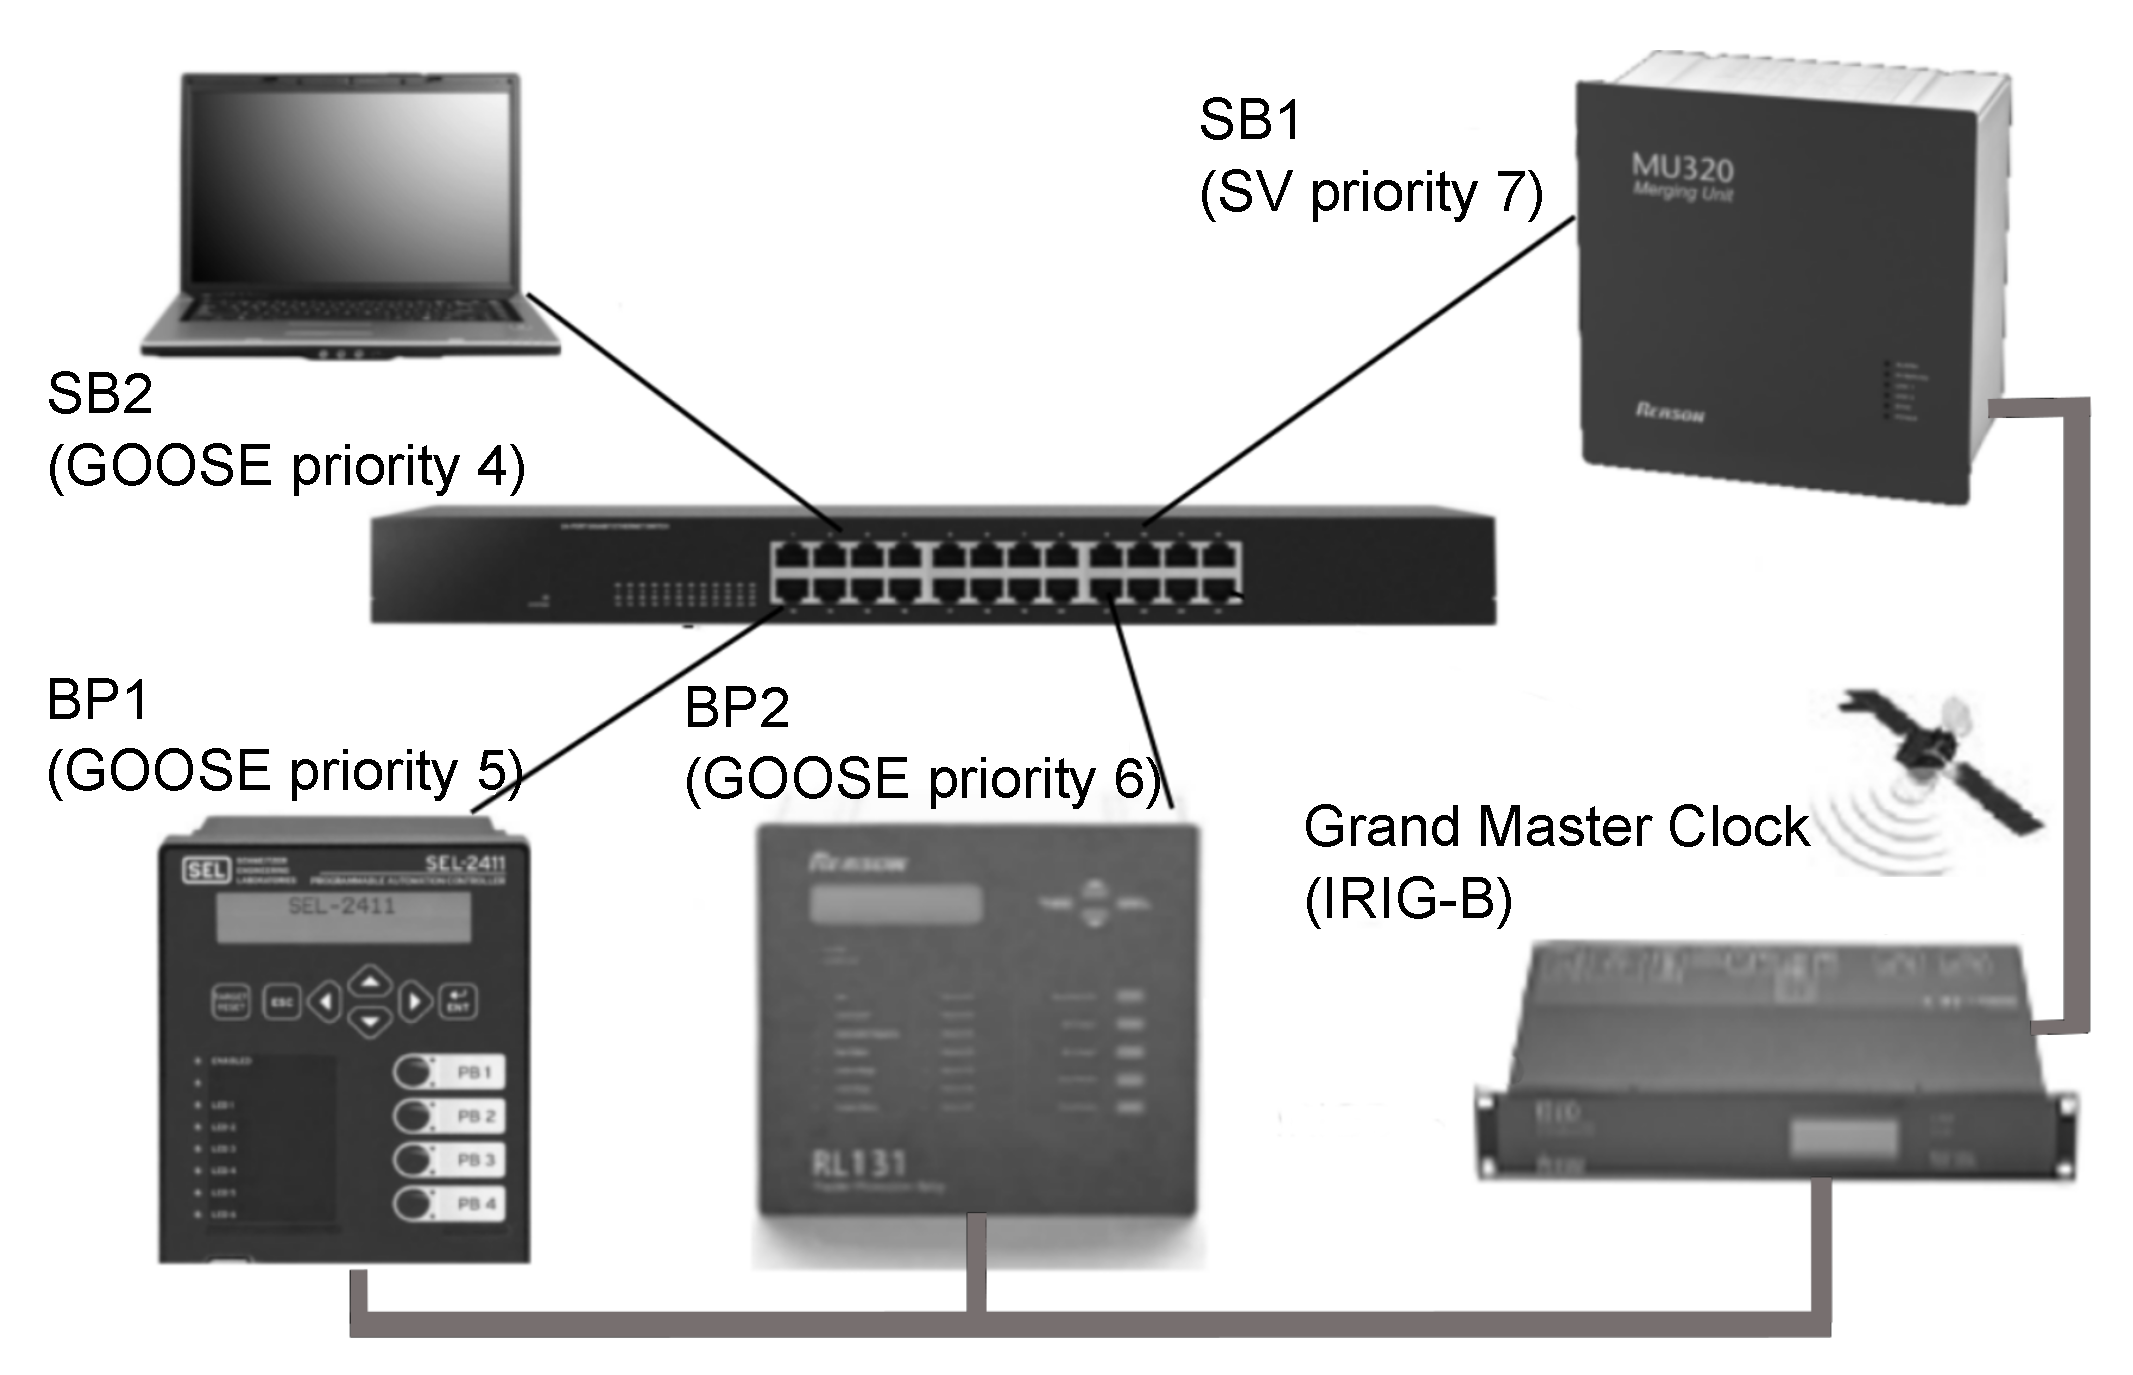
Finally, we present some experimental assessment results, obtained from a specifically-built experimental setup. The target of this experimental assessment was to validate the results obtained when using the analytical model and the simulation tool.
Figure 9 illustrates the implemented setup, which mimics the substation bay illustrated in
Figure 4, configured with the same VLANs (
Figure 7). The set of used equipments considers two bay controllers compliant with IEC 61850 and supplied by different manufacturers [
31,
32], an eight ports switch compliant with IEEE 802.1Q, a GPS clock with synchronization output compliant with various standards (IRIG-B, PTP etc.), and a computer for the emulation of GOOSE messages. During the experiments, the computer was also used for capture and record the network traffic for further analysis.
The following assumptions were made in the experiments:
The equipments were synchronized by using IRIG-B; and synchronization messages do not affect the GOOSE and SV messages exchanged over the process bus.
A signal generator was connected to the analog input channels of MU (SB1) simulating the voltages and currents values of the EPS.
The events were recorded by the equipments in the form of log, SoE (Sequence of Events) and COMTRADE files. These files kept the time stamps related to the occurrence of all the events.
The message processing time of each equipment was considered according to the values reported by the manufacturers. These processing time values needed to be subtracted from the end-to-end delays obtained during experiments.
The following steps were executed in order to assess the timing behavior of the network.
With the equipments powered on, one digital output of the GPS clock was activated in order to trigger the transmission of all SV and GOOSE messages. This strategy intended to replicate the worst-case scenario envisioned by the analytical tool were all messages arrived at the switch at the same time.
After five minutes of steady state operation, the signal generator was programmed to inject an over current signal to one of the analog input channels of the MU (SB1). With this, the Over Current protection function of the BP2 relay was triggered, and a trip message was sent to the rest of the network. This event also triggered the SoE and the COMTRADE recorder of the BP2 device.
Once the BP1 device received the alarm message from BP2, one of its LEDs lighted up, thus the event could be identified within the corresponding SoE file. Next, the BP1 device changed the value of the monitored variable, allowing the circuit breaker trip by the SB2 device.
Once the SB2 device has received the alarm messages from BP1, it recorded the event within a PCAP file generated by the Wireshark [
35] instance running in the device. The circuit breaker is simulated by a variable within the SB2 device. From this point, the acknowledgement of the events goes in the opposite direction (i.e., from SB2 to BP1, from BP1 to BP2 and so on).
After ten minutes of operation, the GPS clock disabled (via one of its digital outputs) the transmission of all GOOSE and SV messages, thus slowing down the activity in the network. Ten seconds later, the GPS clock enables the transmission of messages starting the process all over again.
The previously described steps were executed during two hours and the maximum end-to-end delay values were obtained by correlating the inputs and outputs of events registered within the log, SoE and COMTRADE files of each device.
Table 9 highlights a comparison among the three techniques used for the SAS communication assessment. The difference mentioned in the last line of this table refers to the variation between the lowest and highest values obtained for each message stream. The analytical approach presents slightly longer times for the maximum delays. This is an expected result because it is well known that prototype measurements and simulation approaches can present optimistic results and should not be used to determine worst-case response times. The reason is that, no matter how long these experiments take place, there is no guarantee that the worst-case of a code execution branch would occur.
6. T1-1 Substation with Background PTP Traffic and 1 Gigabit Network Links
This section presents a simulation scenario involving a T1-1 substation architecture with IEDs in conformance with 1 Gigabit Ethernet and the addition of a timing synchronization background traffic, namely a stream of PTP (IEEE 1588) messages. The purpose of this section is to highlight the ability of the proposed response time analysis to handle different sets of message streams.
The PTP stream of sync messages produced by a Grand Master Clock is modeled as a background message stream (
) with message size of 255 bytes, which is assumed as the maximum size of PTP Sync messages. Following the RM policy, the lowest priority was assigned to
.
Table 10 illustrates the parameters for this new message stream. The parameters for other message streams (
,
,
and
) are similar to the ones presented in
Table 4.
The VLAN settings of
Figure 7 and
Table 6 were preserved. In addition, the traffic generated by the Grand Master Clock (
) is associated to VLAN2. Thus, as occurred before with
, the stream
will never receive any interference from
in port 3, and also the maximum transmission duration of
will become the blocking time for the others higher priority message streams.
Table 11 presents both the simulated and analytical results. For the sake of comparability, this table also shows the results obtained with and without background traffic, and with megabit or gigabit links.
The obtained results illustrate that both analytical and simulation tools yield good performance in the response time analysis and proved to be flexible enough to accurately analyze different configurations of SAS systems.
7. Final Remarks
This paper highlights how the classical real-time scheduling theory can be used to analyze the communication response time in an SAS, in conformance with the IEC 61850 standard. The proposed analytical model allows the assessment of the worst-case response times of IEC 61850 process bus message streams. This is an innovative approach because, to the best of our knowledge, there is no other work in the literature providing a similar approach for the assessment of IEC 61850 process bus communication.
A simulation tool and an experimental setup were used to experimentally validate the proposed analytical model. The system was modeled and assessed assuming the use of VLANs and prioritization mechanisms of the IEEE 802.1Q. The following key conclusions can be summarized:
The combined use of analytical models and simulation tools during the system design phase may allow a systematic analysis of the process bus schedulability, even for high load communication scenarios. Similar tools may become mandatory for the assessment of future complex SAS configurations. It is possible to make a parallel with another area of application—the automobile industry. The adoption of similar analysis tools in the context of CAN networks leveraged the average bus utilization from around 35% to 80% due to the designers’ confidence that the time constraints of all tasks would be met even for high load conditions [
5].
The use of VLANs and prioritization mechanisms of the IEEE 802.1Q are mandatory for the proper configuration of a typical SAS process bus. Therefore, the used assessment tools must be able to consider this type of lower layers’ features of the communication stack.
The use of analytical assessment tools will always provide slightly longer times for the worst-case response times, when compared to the maximum response times obtained by simulation or experimental setups. These last approaches usually present optimistic results because, no matter how long their experiments take place, there is no guarantee that the worst-case of a code execution branch would occur.
In the future, it is expected that more complex SAS configurations will require the use of analytical tools similar to the one proposed in this paper. Besides, techniques such as high-performance computing and computational intelligence will enable these systems to behave intelligently, handling more devices with lower response time and with the ability of making failure predictions in the system components.
A further continuation of this work is to handle GOOSE messages with a sporadic server, reducing the inherent pessimism of the analysis. Another alternative is to model and implement the IEC 61869 series standards in the simulator.


