Article

In Situ Measurements of Energy Consumption and Indoor Environmental Quality of a Pre-Retrofitted Student Dormitory in Athens

by
Nikolaos Barmparesos
*,
Dimitra Papadaki
,
Michalis Karalis
,
Kyriaki Fameliari
and
Margarita Niki Assimakopoulos
Department of Applied Physics, Faculty of Physics, University of Athens, Building Physics 5, University Campus, 157 84 Athens, Greece
*
Author to whom correspondence should be addressed.
Energies 2019, 12(11), 2210; https://doi.org/10.3390/en12112210
Submission received: 15 May 2019 / Revised: 4 June 2019 / Accepted: 8 June 2019 / Published: 11 June 2019
(This article belongs to the Special Issue Energy Performance and Indoor Climate Analysis in Buildings)

Abstract

:
In the following years all European Union member states should bring into force national laws on the energy performance of buildings. Moreover, university campus dormitories are buildings of great importance, due to their architectural characteristics and their social impact. In this study, the energy performance along with the indoor environmental conditions of a dormitory of a university has been analysed. The in situ measurements included temperature, relative humidity, concentrations of carbon dioxide, total volatile organic compounds, and electrical consumption; lastly, the energy signature of the whole building was investigated. The study focused on the summer months, during which significantly increased thermal needs of the building were identified. The ground floor was found to be the floor with the highest percentage of thermal conditions within the comfort range, and the third floor the lowest. Lastly, a significant correlation between electrical consumption and the outdoor temperature was presented, highlighting the lack of thermal insulation. Overall, it was clear that a redesign of the cooling and heating system, the installation of a ventilation system, and thermal insulation are essential for improving the energy efficiency of this building.

1. Introduction

During the last decades the subjects of energy efficiency and indoor air quality of different types of building have gained the attention of the scientific community. In the European Union (EU), the Member States are intensively trying to improve energy efficiency in all end-use sectors, on the one hand by increasing the usage of renewable energy sources (RES), and on the other, by minimizing the environmental threats caused by energy consumption of fossil fuels, thus, supporting energy security [1]. Moreover, the EU directive on the energy performance of buildings [2] states that all EU members should bring into force national laws, regulations, and administrative provisions for setting minimum requirements on the energy performance of new and existing buildings that are subject to major renovations. For that reason, the Greek Regulation on the Energy Efficiency of Buildings [3] sets specific limitations and minimum requirements for energy efficiency for the design and the construction of different types of building (residential, educational, cultural, etc.).
Numerous scientific publications set the main target as energy retrofitting of buildings, such as decreasing the negative impact on the ambient environment, creating thermal comfort zones for tenants, and controlling the consumption of energy and material resources effectively [4,5,6,7,8,9,10,11,12]. However, research by Szodrai et al. reported that several environmental parameters within the indoor environment of a building, should also be taken into account before the implementation of deep energy retrofitting actions [13]. Recent experiments have demonstrated that indoor climate has either improved or deteriorated as a result of additional energy efficiency measures in a building’s envelope [14,15]. Specifically, for the case of offices or educational buildings, which usually contain large glazed areas, the indoor air temperature may rise to very high levels, reducing the thermal comfort conditions for tenants. On the contrary, additional improvement of air tightness could have a negative impact on indoor environmental quality (IEQ) [16,17,18,19,20]. For similar building types, different strategies of ventilation have also been suggested, with the personalized ventilation system reported as the most appropriate solution in order to combine significant energy savings together with acceptable levels of IEQ [21,22,23,24,25,26].
Along with IEQ, an additional parameter that strongly influences the levels of energy consumption within a building is the economic profile and the behaviour of tenants. Several research studies demonstrated results of an experimental campaign in 124 households in China, which showed that on average, education on energy-conscious behaviour for tenants could result in reduction of household electricity consumption by more than 10% [27,28]. Moreover, other studies reported that personal exposure indoors is also correlated with the social status of the occupants in different parts of the world, such as the United States, France, Germany, Japan, and South Africa. They concluded that within lower income dwellings, concentrations of air pollutants, such as carbon dioxide (CO2), total volatile organic compounds (TVOC), fine particulate matters (PM2.5), carbon monoxide (CO), and formaldehyde (CH2O) were found to be higher due to frequent smoking, use of cleaning products, disinfectants, and sprays, and wooden stoves [29,30,31,32,33,34]. As people spend a significant proportion of time within their houses, exposure to the air pollutants mentioned above can have a serious impact on their health [35,36].
Different studies have investigated the impact of energy retrofitting on IEQ in buildings by comparing the results from field measurements or data modelling before and after renovation actions [37,38,39]. All researchers highlighted the development of a state-of-the-art ventilation system as the optimum solution in order to achieve adequate levels of IEQ along with energy efficiency. That is because in some cases occupants tend to frequently keep the window shut after renovation actions, and thus, even though the thermal comfort conditions had been improved, concentrations of different indoor air pollutants were found to be increased. Characteristically, short term increases in PM2.5 and CH2O concentrations immediately after the retrofit process have led to a long-term decrease. Previous studies [40,41] reported that concentrations of CH2O and nitrogen dioxide (NO2) increased in some instances. A research study conducted on fifteen social houses in Ireland highlighted the importance of securing good IEQ levels within the building after energy retrofitting in order to protect the health of the inhabitants [42]. Similarly, in another case study, thirty-five renovated apartments in Estonia were inspected, studied, and tested. The researchers report that indoor air temperature was found to be higher (by 1.6 °C on average) after the renovation even though occupants were satisfied. In addition, they suggested that central or apartment-based air supply and exhaust ventilation units with heat recovery as an optimal ventilation system [43].
Moreover, the scientific community is focusing on energy efficiency and IEQ measurements for student housing. University campus dormitories are buildings of great importance, firstly because of their architectural and technical characteristics (such as large glazed spaces, common use areas, numerous apartments, etc.), and secondly because of their social impact (as they host students). Lastly, the impact of energy savings of public buildings is significant, but also the decrease of the operating costs positively influence the quality of life of the users. Different studies in Italy [44], Serbia [45], the United States [46,47,48], and China [49] have remarked on the importance of renovating such buildings in order to achieve better energy efficiency and living conditions for the occupants, reduce CO2 emissions, and motivate more students to inhabit them. A novel holistic methodology to design the refurbishment of educational buildings in Mediterranean regions is described in the research of Assimakopoulos et al. conducted in 2018 [50]. Particularly in Greece, five different scenarios have been tested concerning the reduction of energy consumption for a dormitory at the University of Crete campus. This research concluded that the installation of a photovoltaic roof panel led to satisfactory results (62% energy savings) for the target of near-zero energy performance [51].
In this study, the energy performance and the evaluation of the IEQ conditions of a dormitory within the campus of the University of Athens is presented. An experimental campaign (field measurements) took place in order to demonstrate the energy profile of the building’s current state. A deep retrofitting of the building is planned in 2019 under the framework of “Proactive synergy of inteGrated Efficient Technologies on buildings’ Envelopes” (Pro-GET-onE -Horizon 2020 Grant Agreement number 723747). Pro-GET-onE is based on the integration of different technologies to achieve a multi-benefit approach through the closer integration between energy and non-energy related benefits, promoting a holistic vision in order to achieve the highest performance of buildings in terms of energy requirements, safety, and socio-economic sustainability [52]. The present research focuses on the investigation of the levels of energy consumption and IEQ conditions within the student housing during different monitoring periods based on already established and further developed protocols, highlighting the specific needs on which the renovation actions should focus on. This work will help building designers in decision making processes towards sustainable design in these types of buildings, taking into account both energy efficiency methods and also IEQ aspects.

2. Materials and Methods
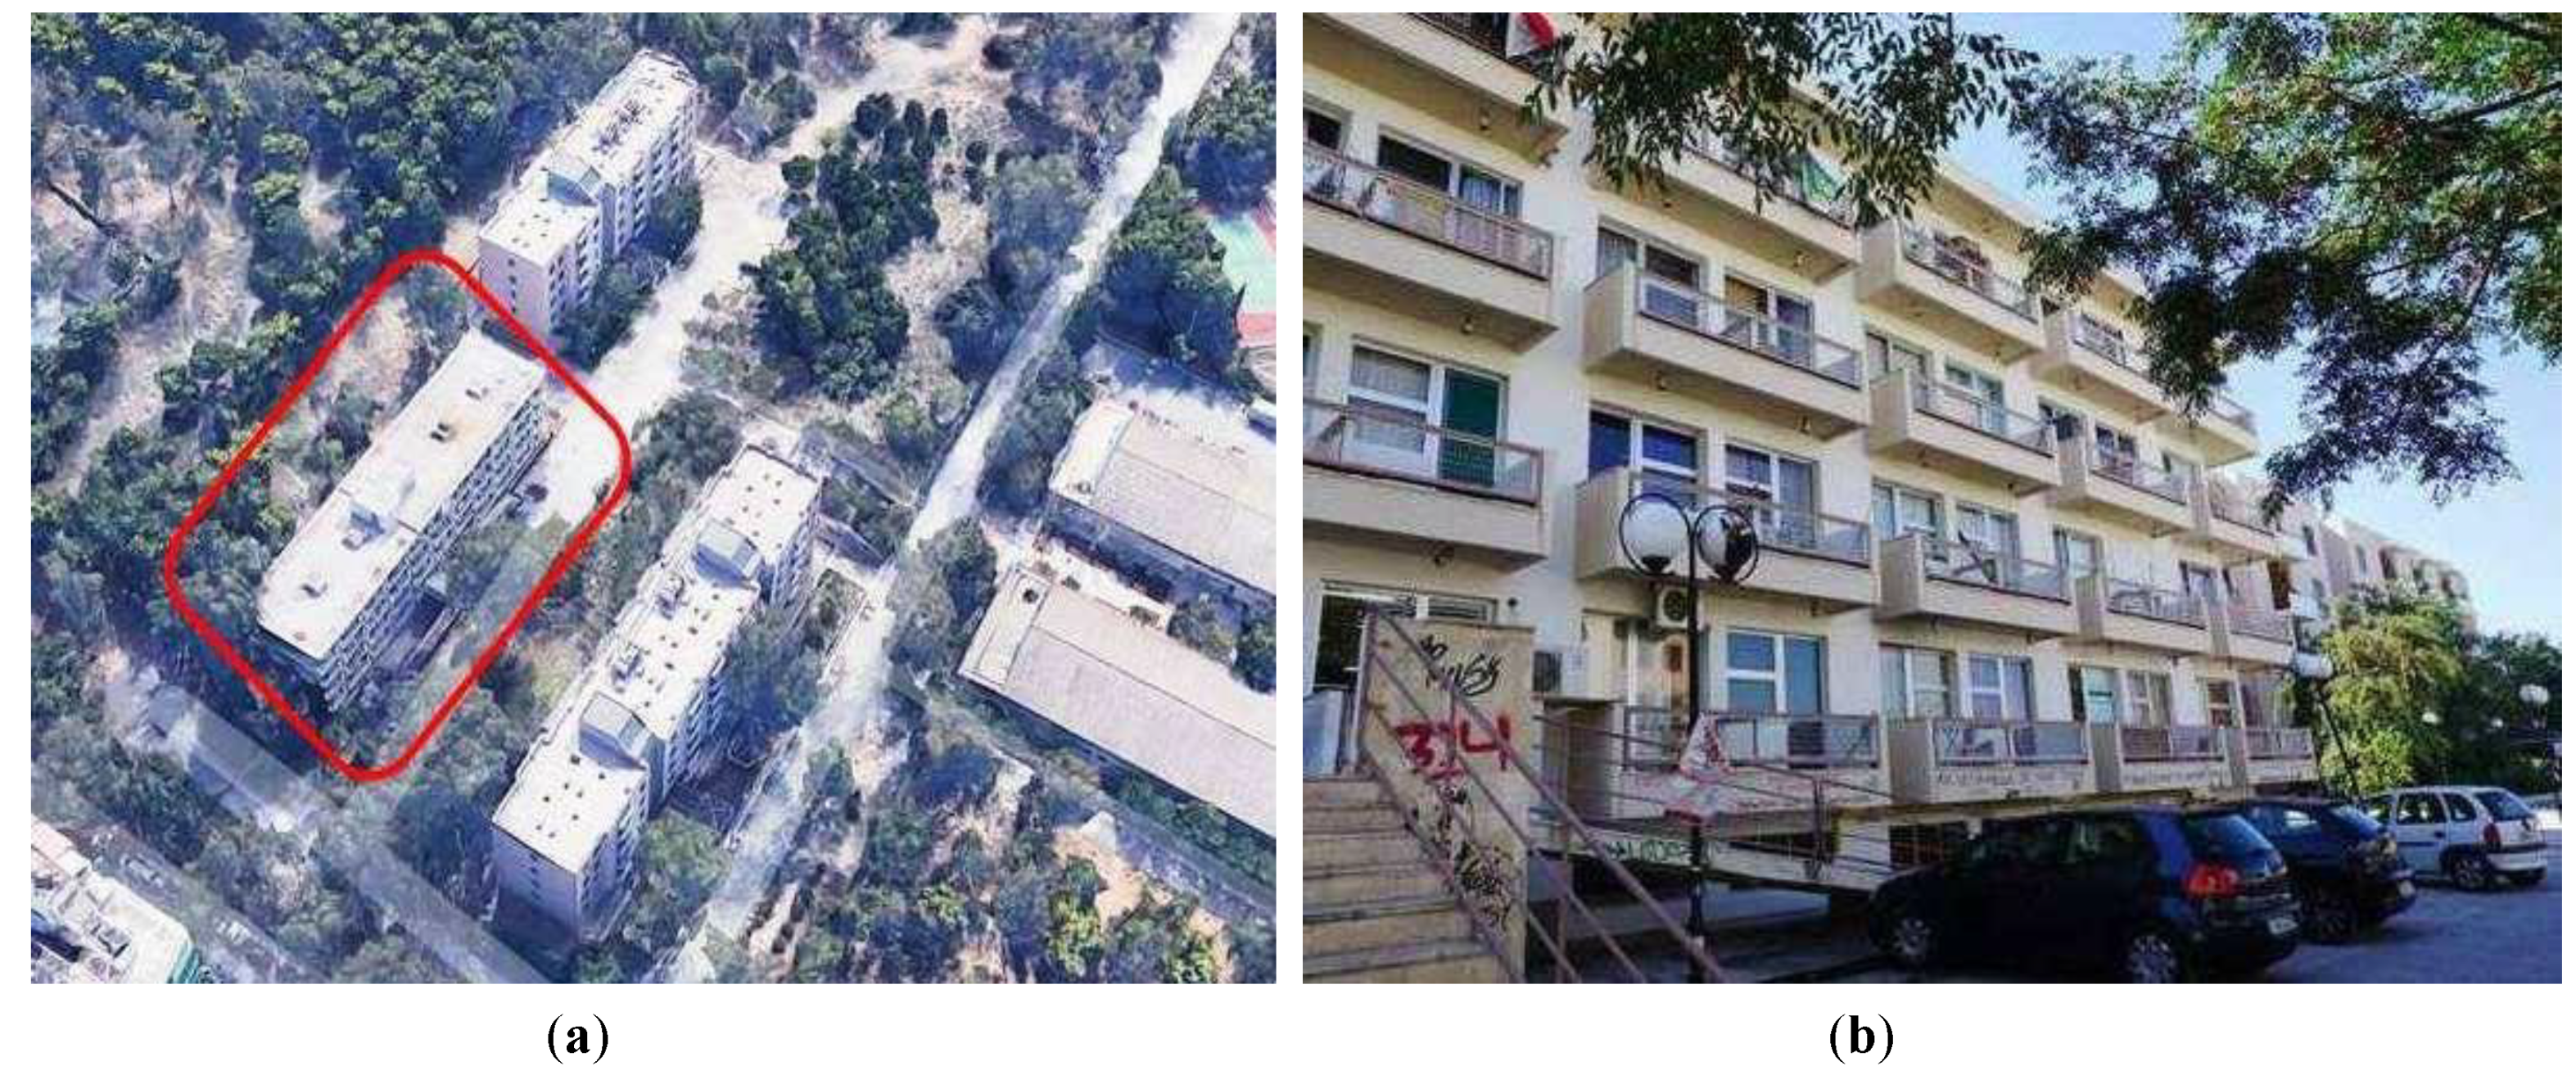
2.1. Building Site

The selected case study, named “Dormitory of the University of Athens—Building B” (B FEPA), is a student dormitory that consists of 138 single rooms for students. It is a property of the National and Kapodistrian University of Athens, located in the University campus of Zografou, a suburb in Athens, Greece. All available technical details have been provided by the technical service of the University of Athens. Figure 1a,b shows a global view of the site, where it can be seen that the building has 4 floors (ground level included) and a basement. Latitude and Longitude of the site are, respectively, 37.97° and 23.76°. The building is located next to a busy road (Taxilou Street) with an altitude of 153 m above sea level. The building was constructed in 1986. It has been in continuous operation since then. The net height of each room is 2.40 m, while in the basement floor the net height is 2.60 m. The main entrance is on the northwest side.
Additionally, the building has a rectangular shape. The gross building area is around 3642 m2 with 138 bedrooms, which in many cases have a surface area of 9.50 m2. The building is accessible from a central staircase or two lifts. The net conditioned building volume is equal to 6960 m3. Table 1 summarizes the main geometrical characteristics of each floor; each area represents the net liveable area.
The building mainly consists of a reinforced concrete structure. The bearing body of the building is formed by two pillars, separated by a joint. Separation is probably due to the large overall length of the building, so as to limit individual lengths below 40 m. Moreover, the two sub-frames have been formed with a similar grid and cross-sectional dimensions. The surfaces of the two vectors per floor are: (a) around 290 m2; and (b) around 430 m2. External walls have an overall thickness of 0.25 m, consisting of plaster (2.5 cm) on both sides and brick (double wall without insulation). Mortars and beams of thickness of 0.30 m do not have external insulation. The basement is made with the use of 3 cm of marble and 20 cm of concrete, while the roof is composed, from the outer side to inner side, of: asphalt cover (6 mm), perlite-bitumen bonded layer (3 cm), concrete (20 cm), and plaster (2.5 cm). Windows and glazed doors are made of single glass with an aluminium frame (5 cm width). They can be divided into four types whose dimensions are specified, including the frame:
  • Type 1: 1.30 m × 1.10 m and Type 2: 1.00 m × 2.30 m in single rooms;
  • Type 3: 5.70 m × 2.30 m balcony door in common use zones;
  • Type 4: 2.16 m × 0.6 m in the basement.
For heating purposes, the building is equipped with a centralized boiler (natural gas), which provides the thermal vector fluid to in-room radiators. The thermal power plant is installed in the basement floor. In the beginning of 2017, the boilers that used oil were replaced with natural gas boilers, one with nominal power of 850,000 kcal/h (≈988.6 kW) and another one with nominal power of 630,000 kcal/h (≈732.7 kW), with nominal efficiency of around 94%. The heating system is turned on for 7 h each day (cycle of 2 + 2 + 3 h) for around 5 months, depending on the year. The local emitters are very old static radiators. There are no thermostatic valves or zone thermostats. Moreover, the pipes delivering hot water are not isolated. This decreases the efficiency of the system, as there are high distribution losses from the basement floor across each floor. There is no central air conditioning system, and only few rooms (warden’s room and living room on the ground floor) have autonomous split systems. There is no mechanical ventilation system—only natural ventilation is provided through the external frames.
Furthermore, for lighting needs, the dormitory has, in total, installed power of 26.5 kW for the rooms and 18.7 kW for shared floors, with the addition of 12.5 kW for an external lighting system. It is also important to note that the building includes the following functions per floor:
  • Basement: technical rooms and warehouses;
  • Ground floor: central entrance, staircase and 2 elevators, seating area, 30 single rooms, public bathroom (for men), common kitchen;
  • 1st, 2nd, 3rd floors: 36 single rooms and shared kitchens for men and women, living rooms.
There is a call center area on the ground floor. A TV set is installed in the ground floor lounge. Electrical equipment consists of 6 washing machines per floor and 1 large refrigerator per floor in the kitchen.

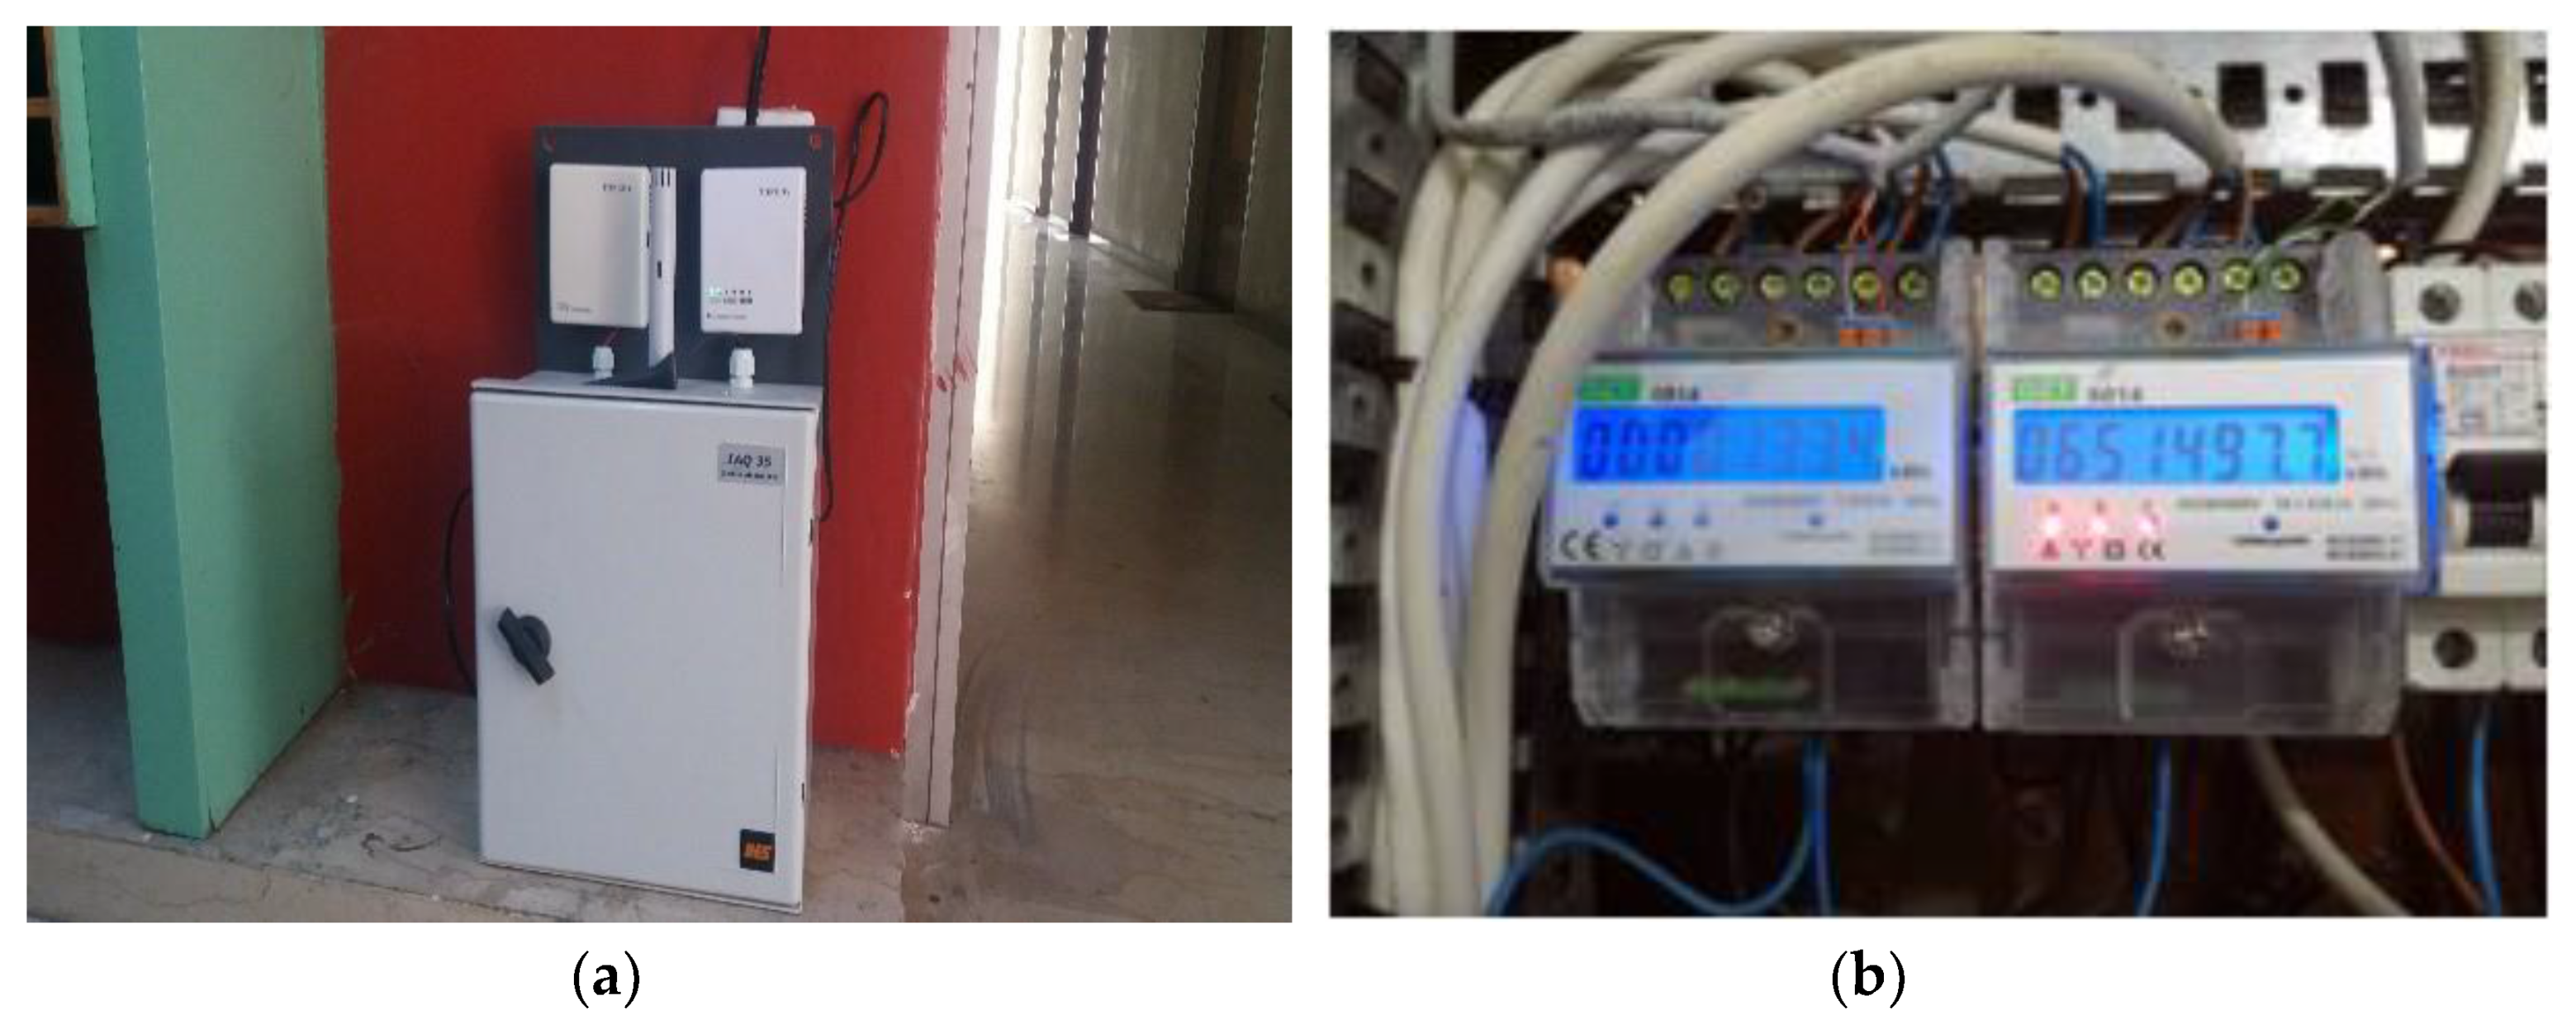
2.2. Experimental Campaign and Monitoring Protocols

Guideline 14-2002, created by a committee of the American Society of Heating, Refrigerating, and Air-Conditioning Engineers (ASHRAE) members, addresses the determination of energy savings by comparing before and after energy use measurements. The basic method involves the projection of energy use or demand patterns of the pre-retrofit (baseline) period into the post-retrofit period. Typical adjustments to the baseline energy use or demands include weather, occupancy, and system variables. Savings represent the amount of energy use between the projected baseline and the post-retrofit consumption and are calculated using the following formula [53]:
Savings = (Baseline energy use or demand projected for Post-Retrofit conditions) - (Post-Retrofit energy use or demands)
The monitoring process followed in this study is designed based on the ASHRAE Guideline 14 on Measurement of Energy and Demand Savings, a protocol which was designed for the following six performance categories: energy use, water use, thermal comfort, indoor air quality, lighting, and acoustics, measuring post-retrofit energy use and comparing that to the measured pre-retrofit use, which will take place in 2020, after the retrofit of the student housing (within Pro-GET-onE project) is finished. The following investigations have been done:
(1) Building environmental parameters (including thermal and IEQ conditions)
The measurements of IEQ took place from April 2018 to March 2019 in order to investigate the annual behaviour of the building. The equipment consisted of portable continuous recording Tongdy sensors simultaneously measuring temperature (T), relative humidity (RH), and concentrations of CO2 and TVOC. The CO2 sensor had a recording range from 0 to 2000 ppm, and accuracy of ± 40 ppm at 25 °C and TVOC ranging from 1 to 30 ppm with accuracy of 1 ppm. In addition, the measuring ranges for temperature and RH were 0 to 50 ℃ and 0 to 95% (non-condensing). These sensors operate under conditions of 0 to 50 ℃ and 5 to 95%, respectively. All parameters were recorded on a 24 h basis at 15-min intervals. Quality assurance for the equipment was performed on several occasions during the experiment and all of the instruments were calibrated according to the manufacturers’ standards. Four sensors were placed within the commonly used areas of the building on each floor. Thus, the influence of different occupancy patterns on the results could be investigated. Furthermore, in order to ensure that differences between mean values (depending on the floor) are statistically significant, a Kruskal-Wallis (non-parametric) test (p < 0.05) was implemented. Each case includes four grouping variables (ground, first, second, and third floor) and one parameter (T, RH, CO2, or TVOC). For all cases, the p-value was found to be close to zero, depicting a statistically significant difference between parameters among the floors.
(2) Meteorological parameters
Moreover, the following meteorological parameters were recorded from nearby stations of the National Observatory of Athens on an hourly basis: air temperature and relative humidity, provided by the National Observatory of Athens Institute of Environmental Research.
(3) Energy use
All energy data refer to electricity consumption of the building, as data from the direct hot water (DHW) system are not available. Electrical consumption was measured constantly by Landis+Gyr Ε650 meters [54] installed in the central power supply network of the University Campus. These data were acquired from the “Students Achieving Valuable Energy Savings 2” (SAVES2) project, H2020 Grant Agreement number 754203. All data were transferred to an EMM100 system [55] via S0 output pulse according to international protocol IEC 62056-21. The uploaded measurements (from April 2018 to January 2019) were obtained from an online platform (hourly or daily) in order to assess the electrical consumption patterns of the dormitory under investigation during different time periods. Figure 2a,b illustrates the sensors used for all types of measurements. The impact of different weather conditions on the energy behaviour of the building was also investigated, defined as the “energy signature” of the building. Specifically, the mathematical identification of electrical consumption (E in kWh) and ambient temperature (Tout in °C) is expressed in the form of Equation (1):
E = C0 + C1 ∙ Tout
Two simple linear regression models have been used for cooling (from April to October) and heating (from November to January) periods, respectively, in order to highlight the influence of seasonality on the results.

3. Results and Discussion

3.1. Indoor Environmental Quality

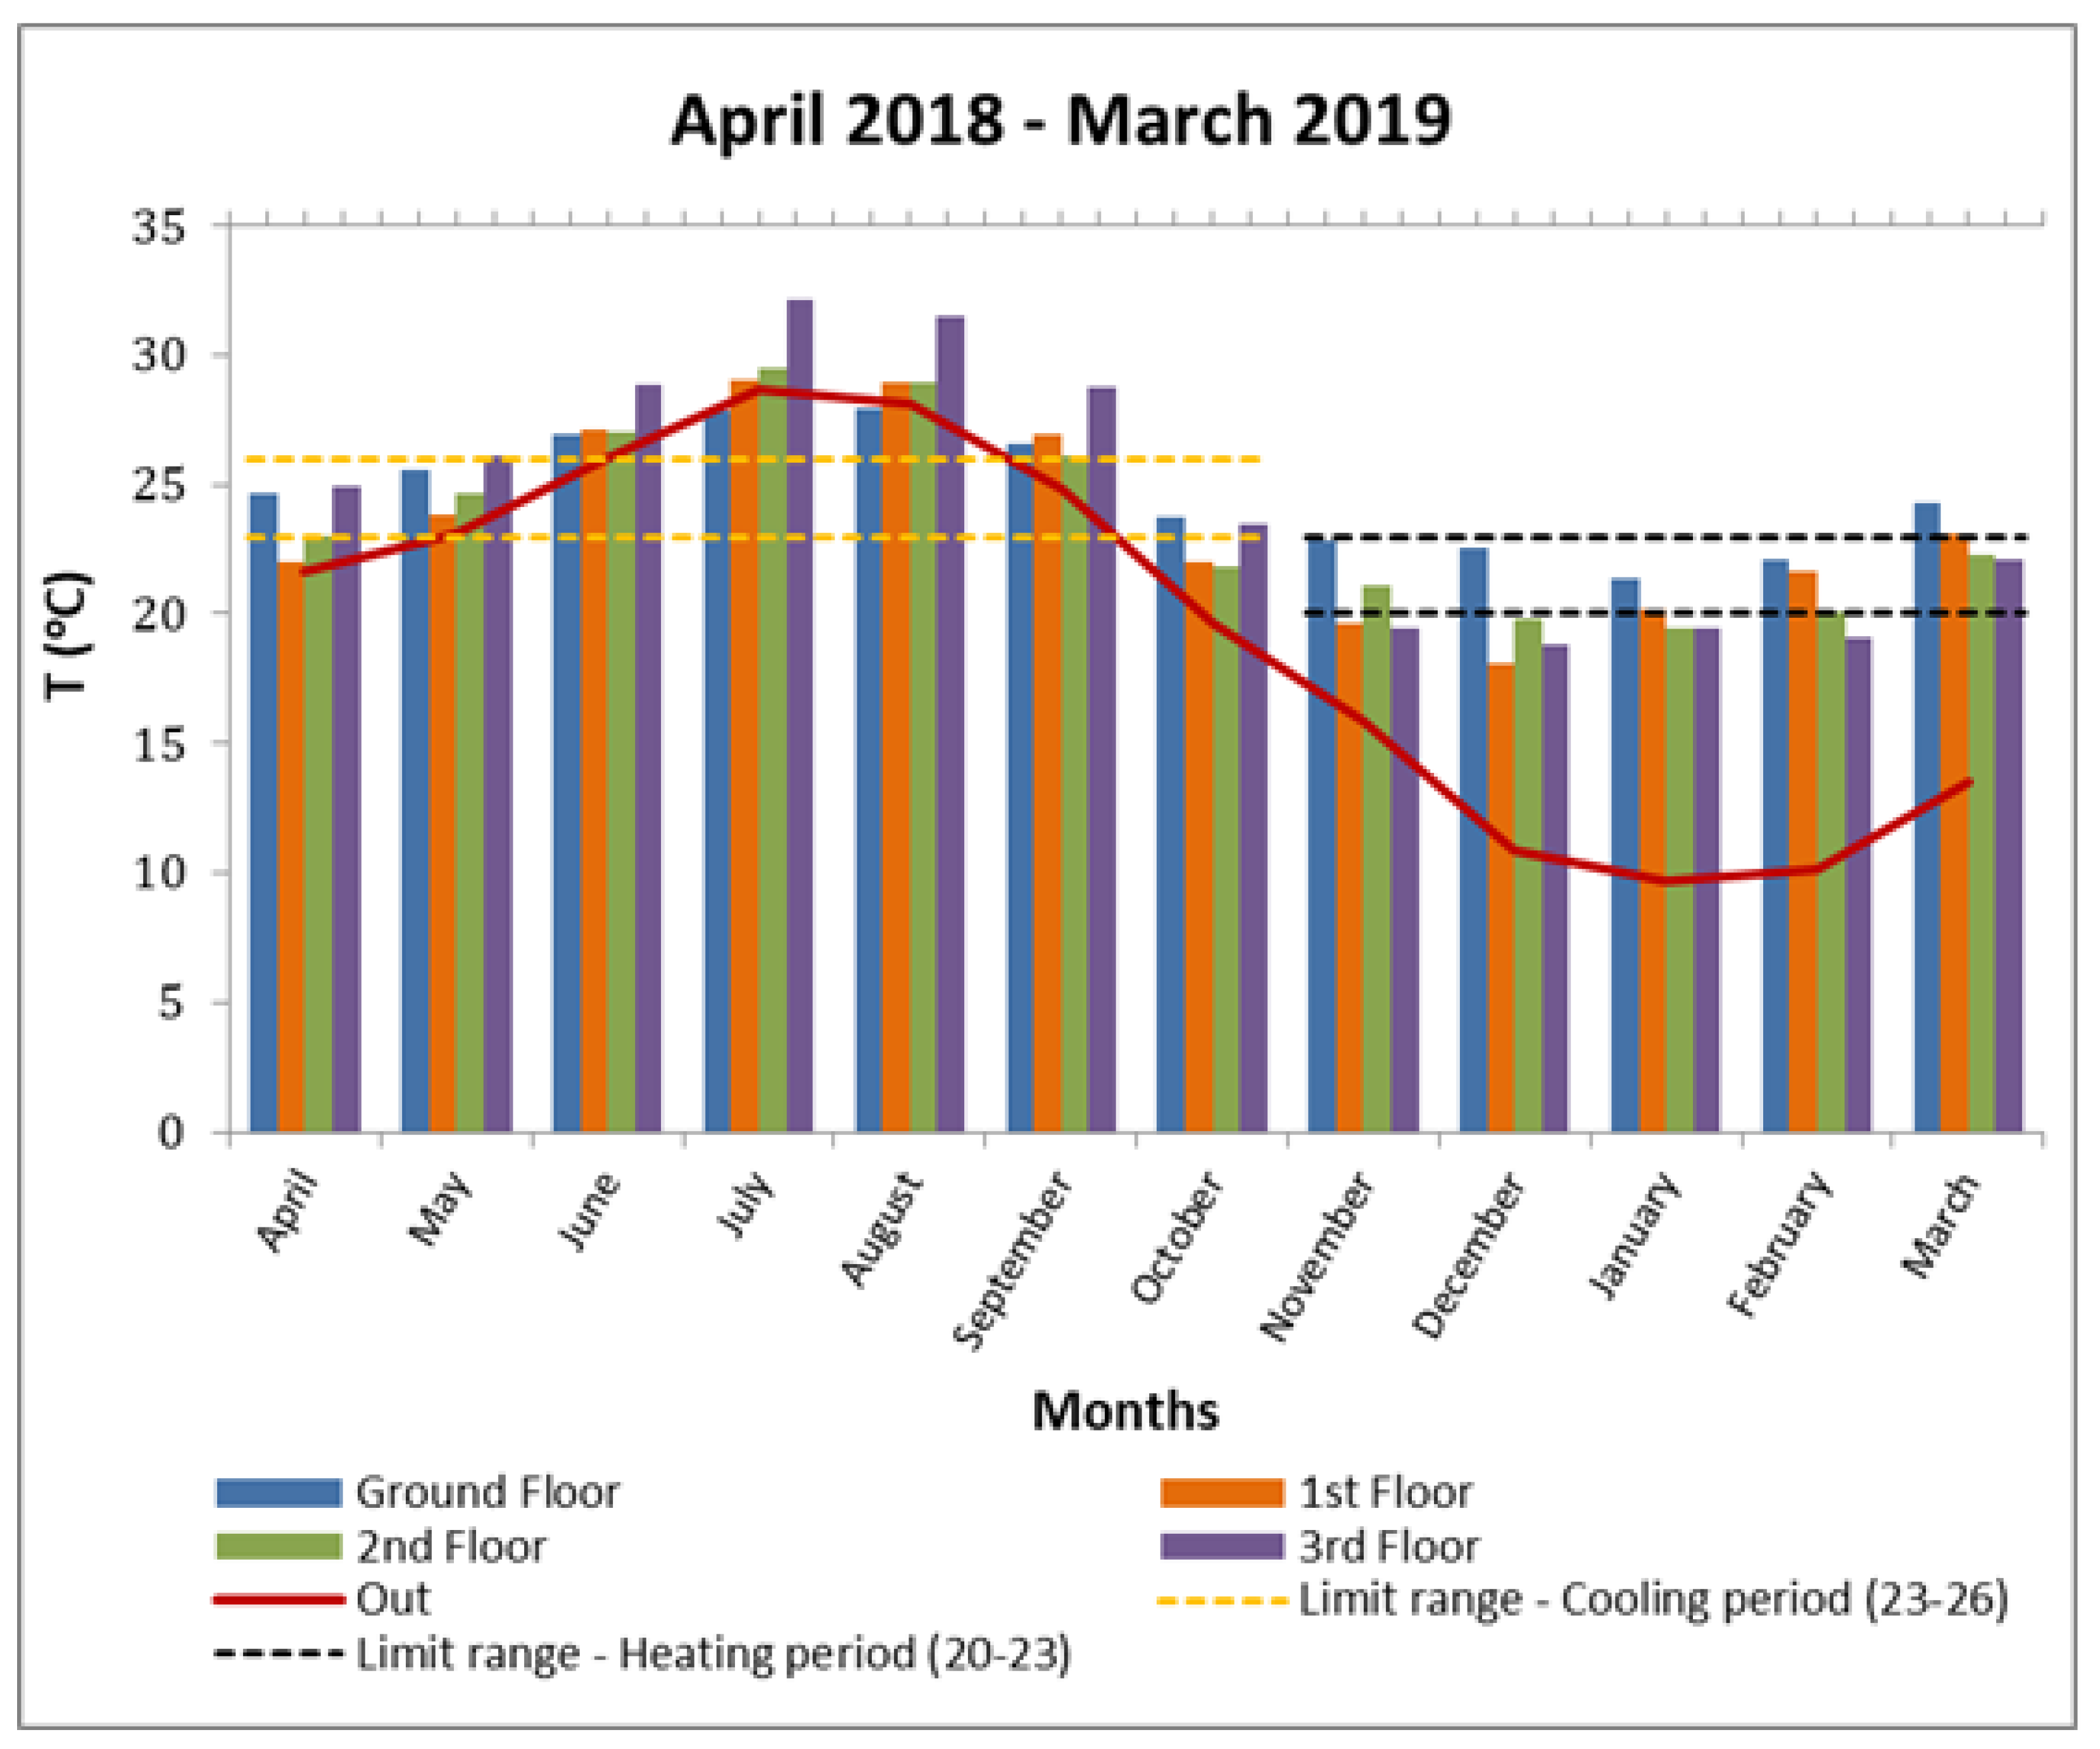
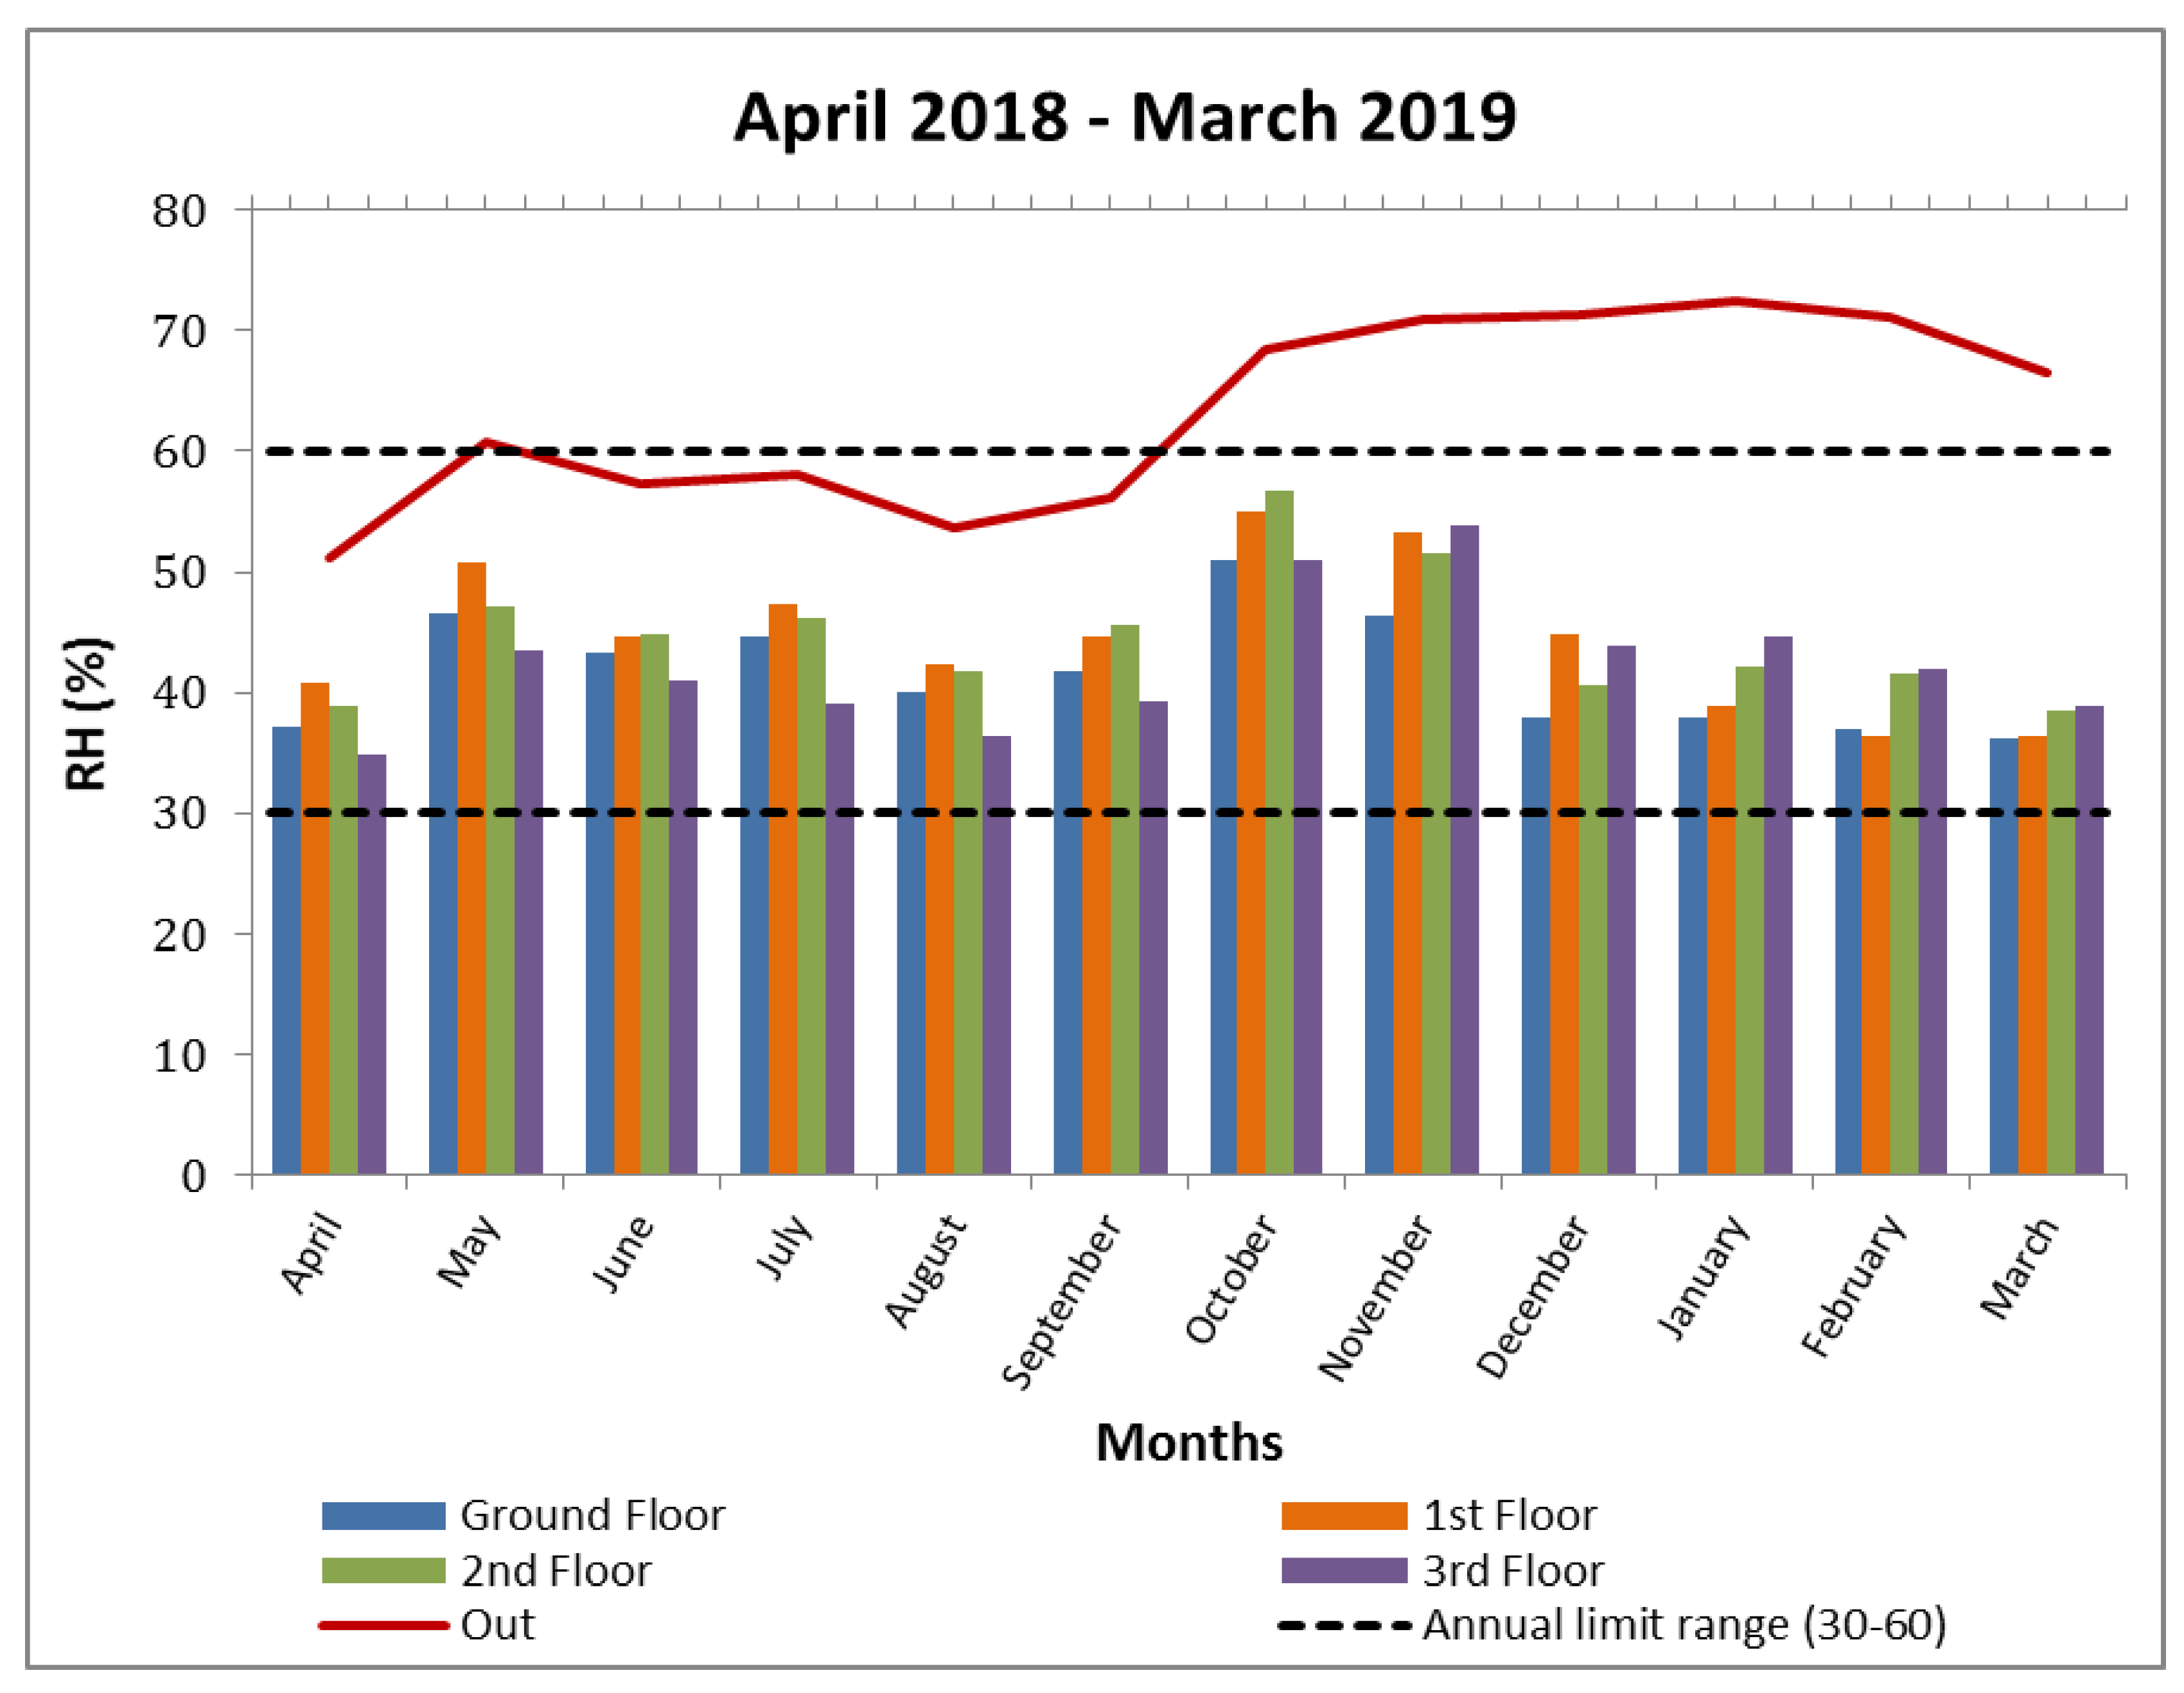
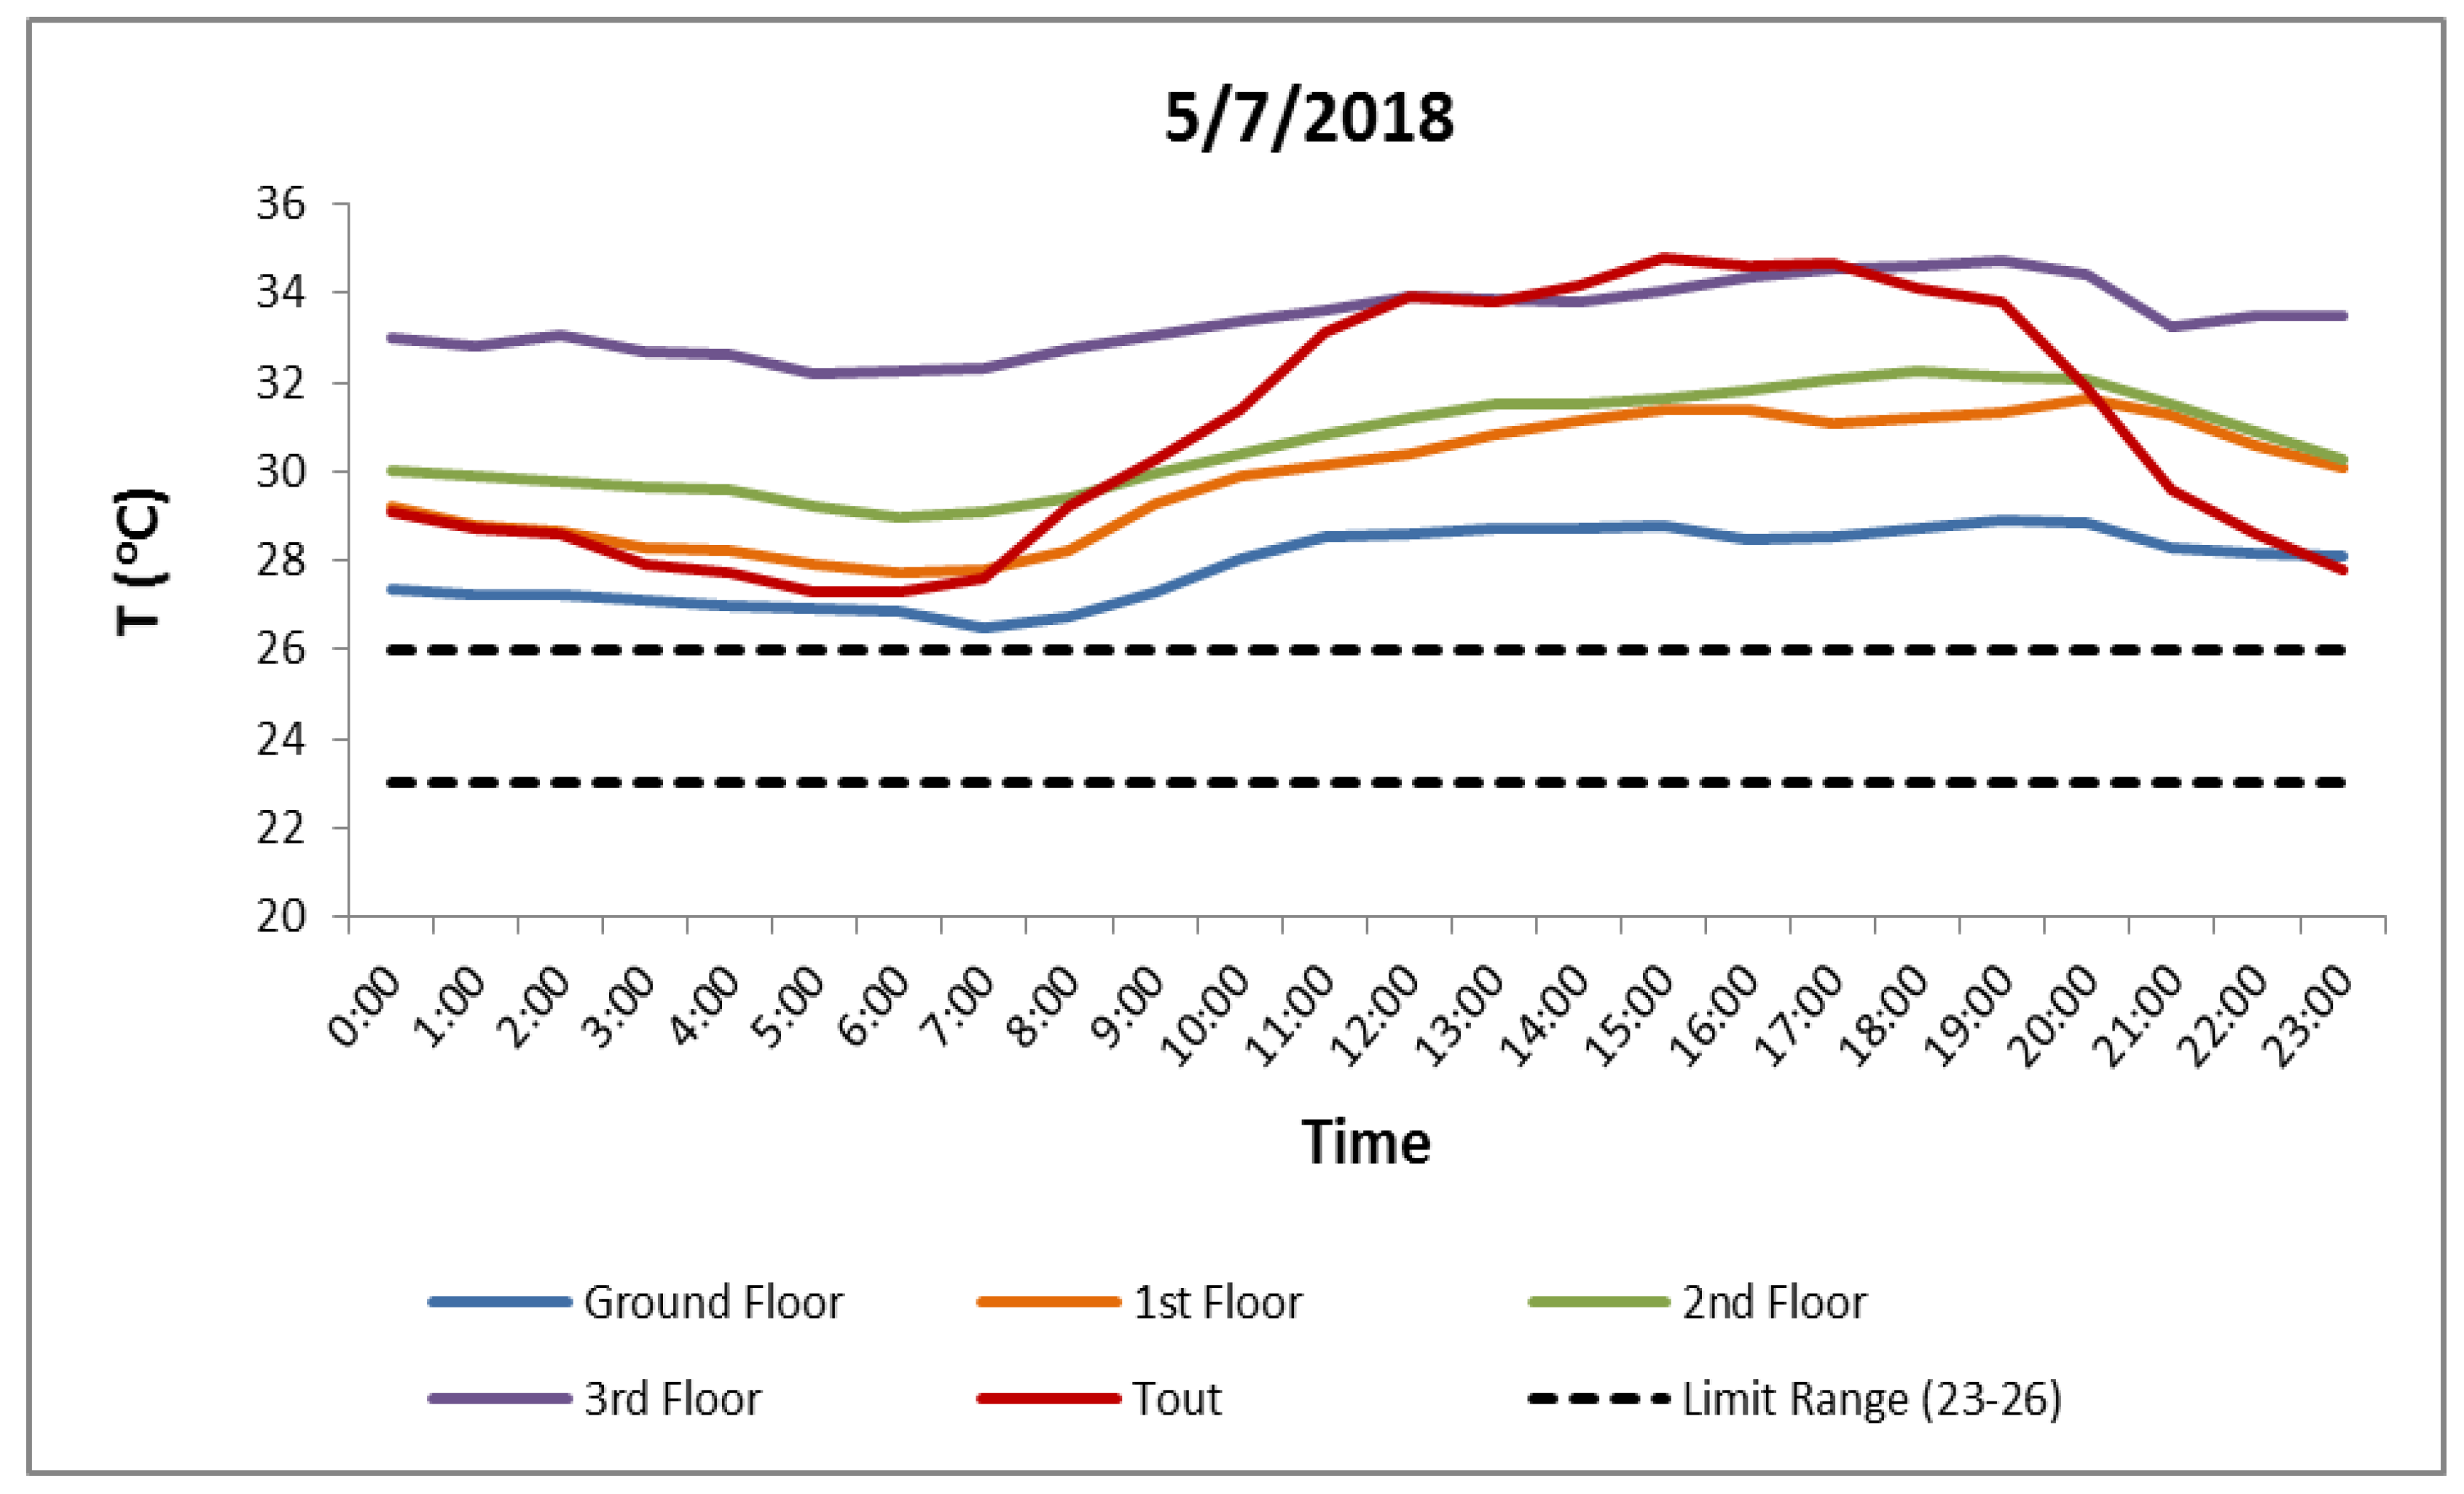
3.1.1. Thermal Conditions

In order to investigate the thermal conditions of the B FEPA building, temperature and RH measurements were implemented within the common spaces of each floor. All data were collected from April 2018 to March 2019. Ambient temperature and relative humidity data was provided by the National Observatory of Athens from a local meteorological station [56].
The thermal behaviour of each floor differs, and therefore it is important to look into the thermal conditions of each floor separately. Table 2 summarizes the results of temperature and RH levels at every experimental point.
On the ground floor, the highest internal mean temperature was found in August (27.93 °C) and the lowest in January (21.36 °C). One may also notice that standard deviations of temperature during cold months (November to March) are slightly higher, as expected, due to sudden decrease of temperature levels caused by increased air infiltration as the main entrance opens more frequently. However, fluctuations of indoor temperature within this floor are not significant, especially compared to the respective outdoors. Based on the analysis of the aforementioned data, it is the only floor where the mean temperature levels remain lower than the respective outside level during summer, while it retains relatively higher temperature levels during the cold months in comparison with the other floors. The frequent air exchange with the ambient environment does not significantly affect monthly average values. This result is due to the increased presence of people in the living room of the ground floor and the usage of extra electrical heaters for some hours during the day. The ground floor is also favoured, since it is situated close to the central heating system (the two boilers located in the basement). This, combined with the enhanced thermal stability provided by the rest of the floors, minimizes thermal losses and means this space is (relatively) unaffected by the outdoor conditions. The highest mean levels of RH are observed in October (50.96%), while the lowest during March (36.14%). Standard deviations are relatively lower during winter, due to closed windows and regular functioning of the building’s central heating system. The highest standard deviation (7.48%), reported in October, demonstrates that the influence of the external environment is significant during this month. The windows remain open more often when external levels of RH are relatively high (68.37%).
For the first floor, the maximum mean value is observed in July (29.03 °C) and the lowest is in December (18.10 °C). Standard deviations follow the same pattern as in the ground floor. It is also important to notice that the difference between the maximum mean temperature and the minimum mean temperature is higher on this floor (almost 9 °C) compared to the underlying (ground) floor. As a building’s level increases, thermal insulation decreases; therefore, the heat losses are more significant. Based on the results of RH levels, it is obvious that throughout the year, the most humid month for this floor is October (55%) and the least humid is February (36.38%). These results are in alignment with the ground floor. Because of higher ambient temperature levels, the occupants tend to open the windows frequently for ventilation and cooling purposes, allowing the outdoor humid air of October to infiltrate into the building.
The mean temperature level on the second floor follows the same pattern as the aforementioned floors. The warmest month is found to be July with 29.46 °C and the coldest is January with 19.43 °C. The difference between the maximum and minimum mean temperature for this floor is 10 °C (almost 1 degree higher than the respective difference of the first floor). Regarding relative humidity levels, October was found to be, once again, the month with the highest mean RH (56.82%), and March is the month with the lowest (38.86%).
The third floor demonstrated some interesting results. On average, the hottest month was found to be July (32.11 °C) and the coldest December (18.81 °C). The mean internal temperature during the summer months exceeded the respective outdoor temperature by 5–6 °C. For the same period, temperature levels within this floor were measured to be higher compared to the rest of the building by approximately 3–4 °C. Despite the continuous inflow of outdoor air through the open windows, the indoor temperature remained elevated. The third floor, as the highest of the building, is directly exposed to solar radiation, which is in abundance during summer due to the Earth’s angle. The thermal mass of the building is able to absorb the extra energy during the day and gradually yield it afterwards. In addition, during the heating period temperature levels within this floor are comparable to the first and second floors because of central heating. As for RH levels, November was found to be, on average, the most humid month (with internal levels of 53.79%), while April was the least humid (34.92%). RH values of the cold period are comparable to the warmer months. The third floor presents a high dependency on the ambient climate conditions, especially for warm months. Increased solar radiation during summer causes internal overheating due to insufficient thermal insulation of the roof (directly exposed to solar radiation) and inadequate ventilation rates.
The results are also presented graphically, demonstrating a significant difference between internal and external temperature levels for different periods. Figure 3 illustrates that during the cooling period (from April to October), the indoor and outdoor temperature values are comparable. It should be noted that the building is naturally ventilated with the absence of central heating, ventilation, and an air conditioning (HVAC) system or possible night ventilation. Therefore, the opening of windows and doors is the only way to cool the building, especially the common areas (such as corridors). As a result, air exchange rate between indoor and outdoor environments during the cooling period is higher, and thus, the thermal condition is almost similar. On the other hand, for the heating period (from November to March), the inflow of cold and humid air that causes discomfort to the occupants is avoided as the windows stay mainly closed for most of the time. In addition, the central heating system (natural gas-radiators) operates for 7 h per day, preserving indoor temperature at relatively high levels. Figure 4 shows similar results for RH levels. The indoor mean RH values for each floor are close to the respective outdoor values during the cooling period, although during the heating period the difference is significant. Interestingly, the monthly internal mean RH peaks in between the end of the cooling period (October) and the start of the heating period (November) follow the pattern of the respective external levels. As mentioned above, during those months ambient climatic conditions are not severe and tenants tend to open the windows more frequently. On the contrary, during the cold months, even if outdoor RH increases, the opposite behaviour is observed for indoor RH in all floors. Closed windows, as well as the operation of a central heating system, mitigate internal levels of RH. In both figures, the dotted lines represent temperature and RH limit ranges in which adequate thermal comfort conditions for the tenants are achieved, based on the standards reported in the available literature [57,58]. The limit ranges for internal temperature and RH levels are the following:
  • 23°26 οC: refers to the warm period, from April to October.
  • 20°23 οC: refers to the cold period, from November to March.
  • 30–60%: refers to the entire year.
Additionally, Figure 5 illustrates the daily behavior of temperature levels within different floors when the external air temperature reached its highest recorded value. The selected date of interest (May 7, 2018) was found to be the warmest day during the entire experimental period, and therefore, the examination of the building’s thermal behavior on that specific day should be examined. One may notice that the ground floor presented the lowest levels of indoor air temperature and the third floor presented the highest. All measured values were found to overcome the proposed limit range of comfort. Specifically, from 12:00 to 17:00, all floors appear to be cooler in respect to the ambient environment. Nevertheless, during night hours (from 0:00 to 7:00 and from 20:00 to 23:00), all floors (except the ground floor) retained higher temperature levels than outdoors. The delayed thermal response of the building is presumably because of its high heat capacity.
In order to assess the percentage within the range of the thermal comfort conditions, percentages of hourly measurements that were recorded within the recommended limit ranges of temperature and RH were calculated. The range of indoor RH within the respective limit is fairly wide, and thus, the percentage of values exceeding the limit is not significant. However, measurements of temperature levels showed some interesting results. Table 3 illustrates that in all floors, thermal conditions are considered within the range of thermal comfort for tenants only for 34.62% of the total measurements. This result, even though it is considered general, highlights the poor thermal behaviour of this building and the need for deep retrofitting actions. Indoor thermal conditions were found to be improved in February (51.11%), during the heating period, and in April (53.57%) and May (53.68%) amid the cooling period. The time period when thermal conditions are admittedly insufferable is definitely summer. The percentage within the comfort range decreases below 20% in June and is calculated from 0 to 5.77% during July and August, respectively. It should be noted that for these two warm months, none of the temperature data collected on the third floor were found to be within the recommended limit range. This floor is considered to be within the range of thermally comfortable conditions for only 28.97% of the total measurements, which is the lowest estimated percentage among the whole building. The highest percentage (43.26% in total) was found in the ground floor, which is expected to have the most satisfied tenants, especially during the heating period.

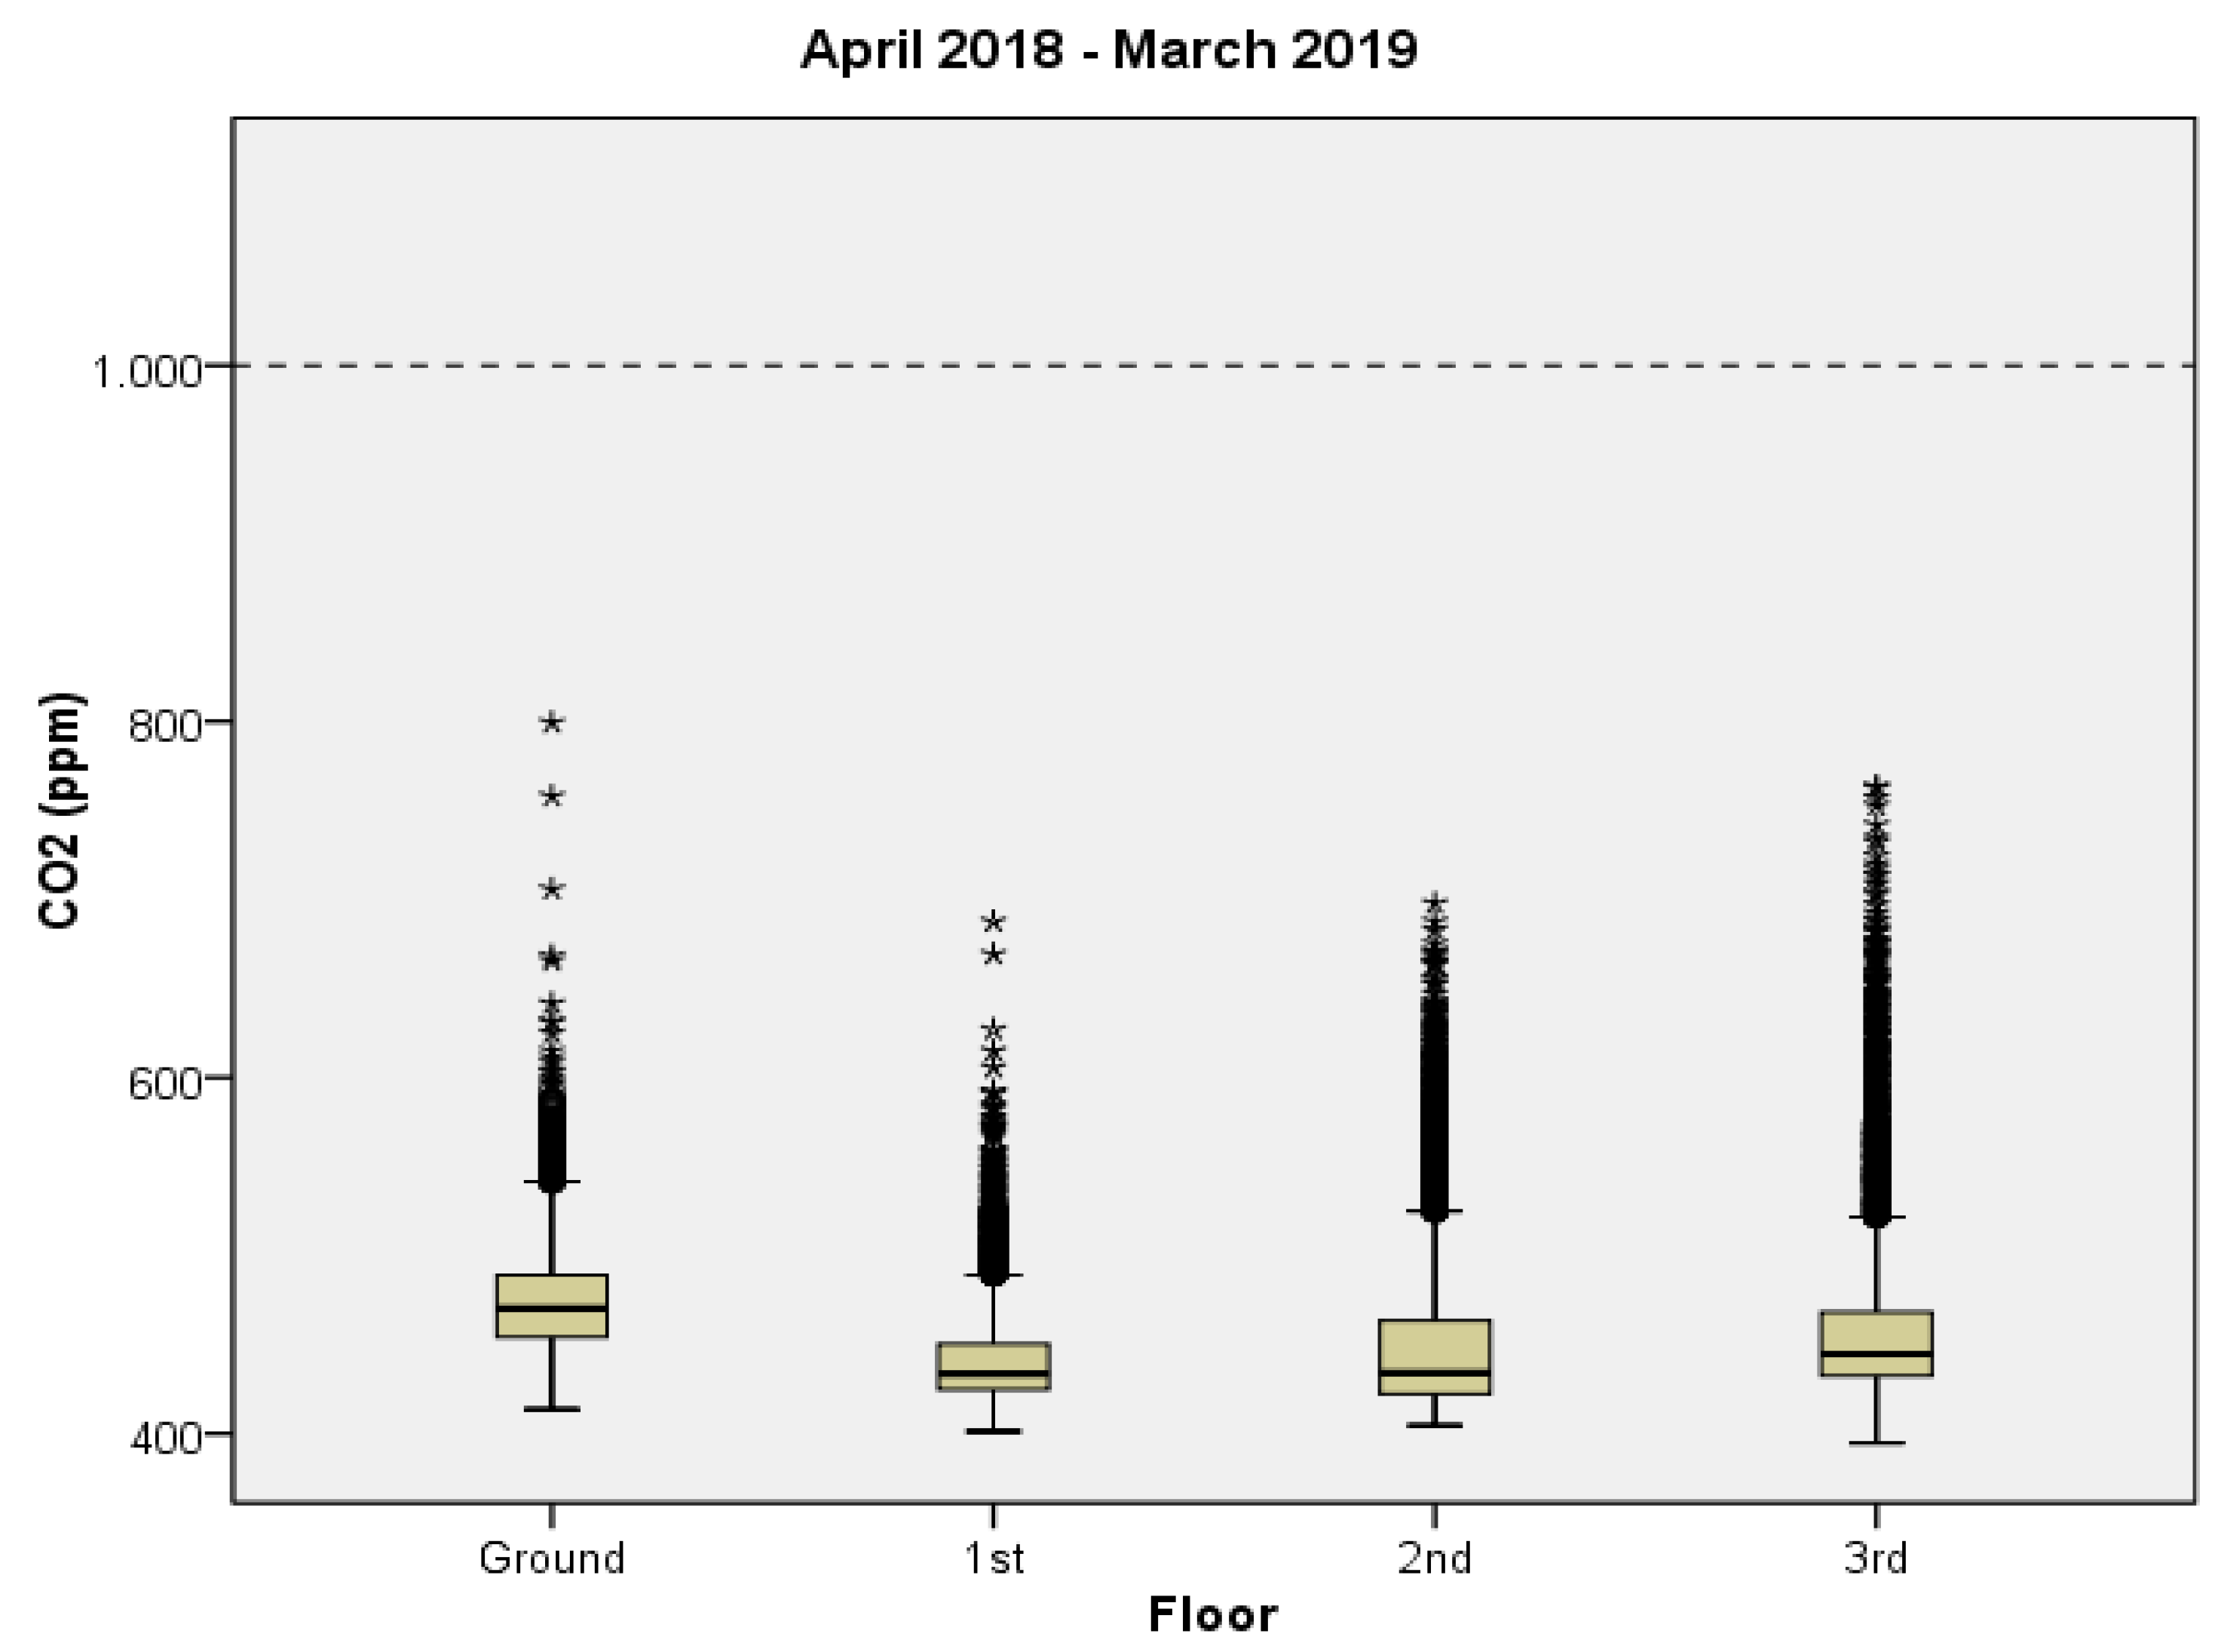
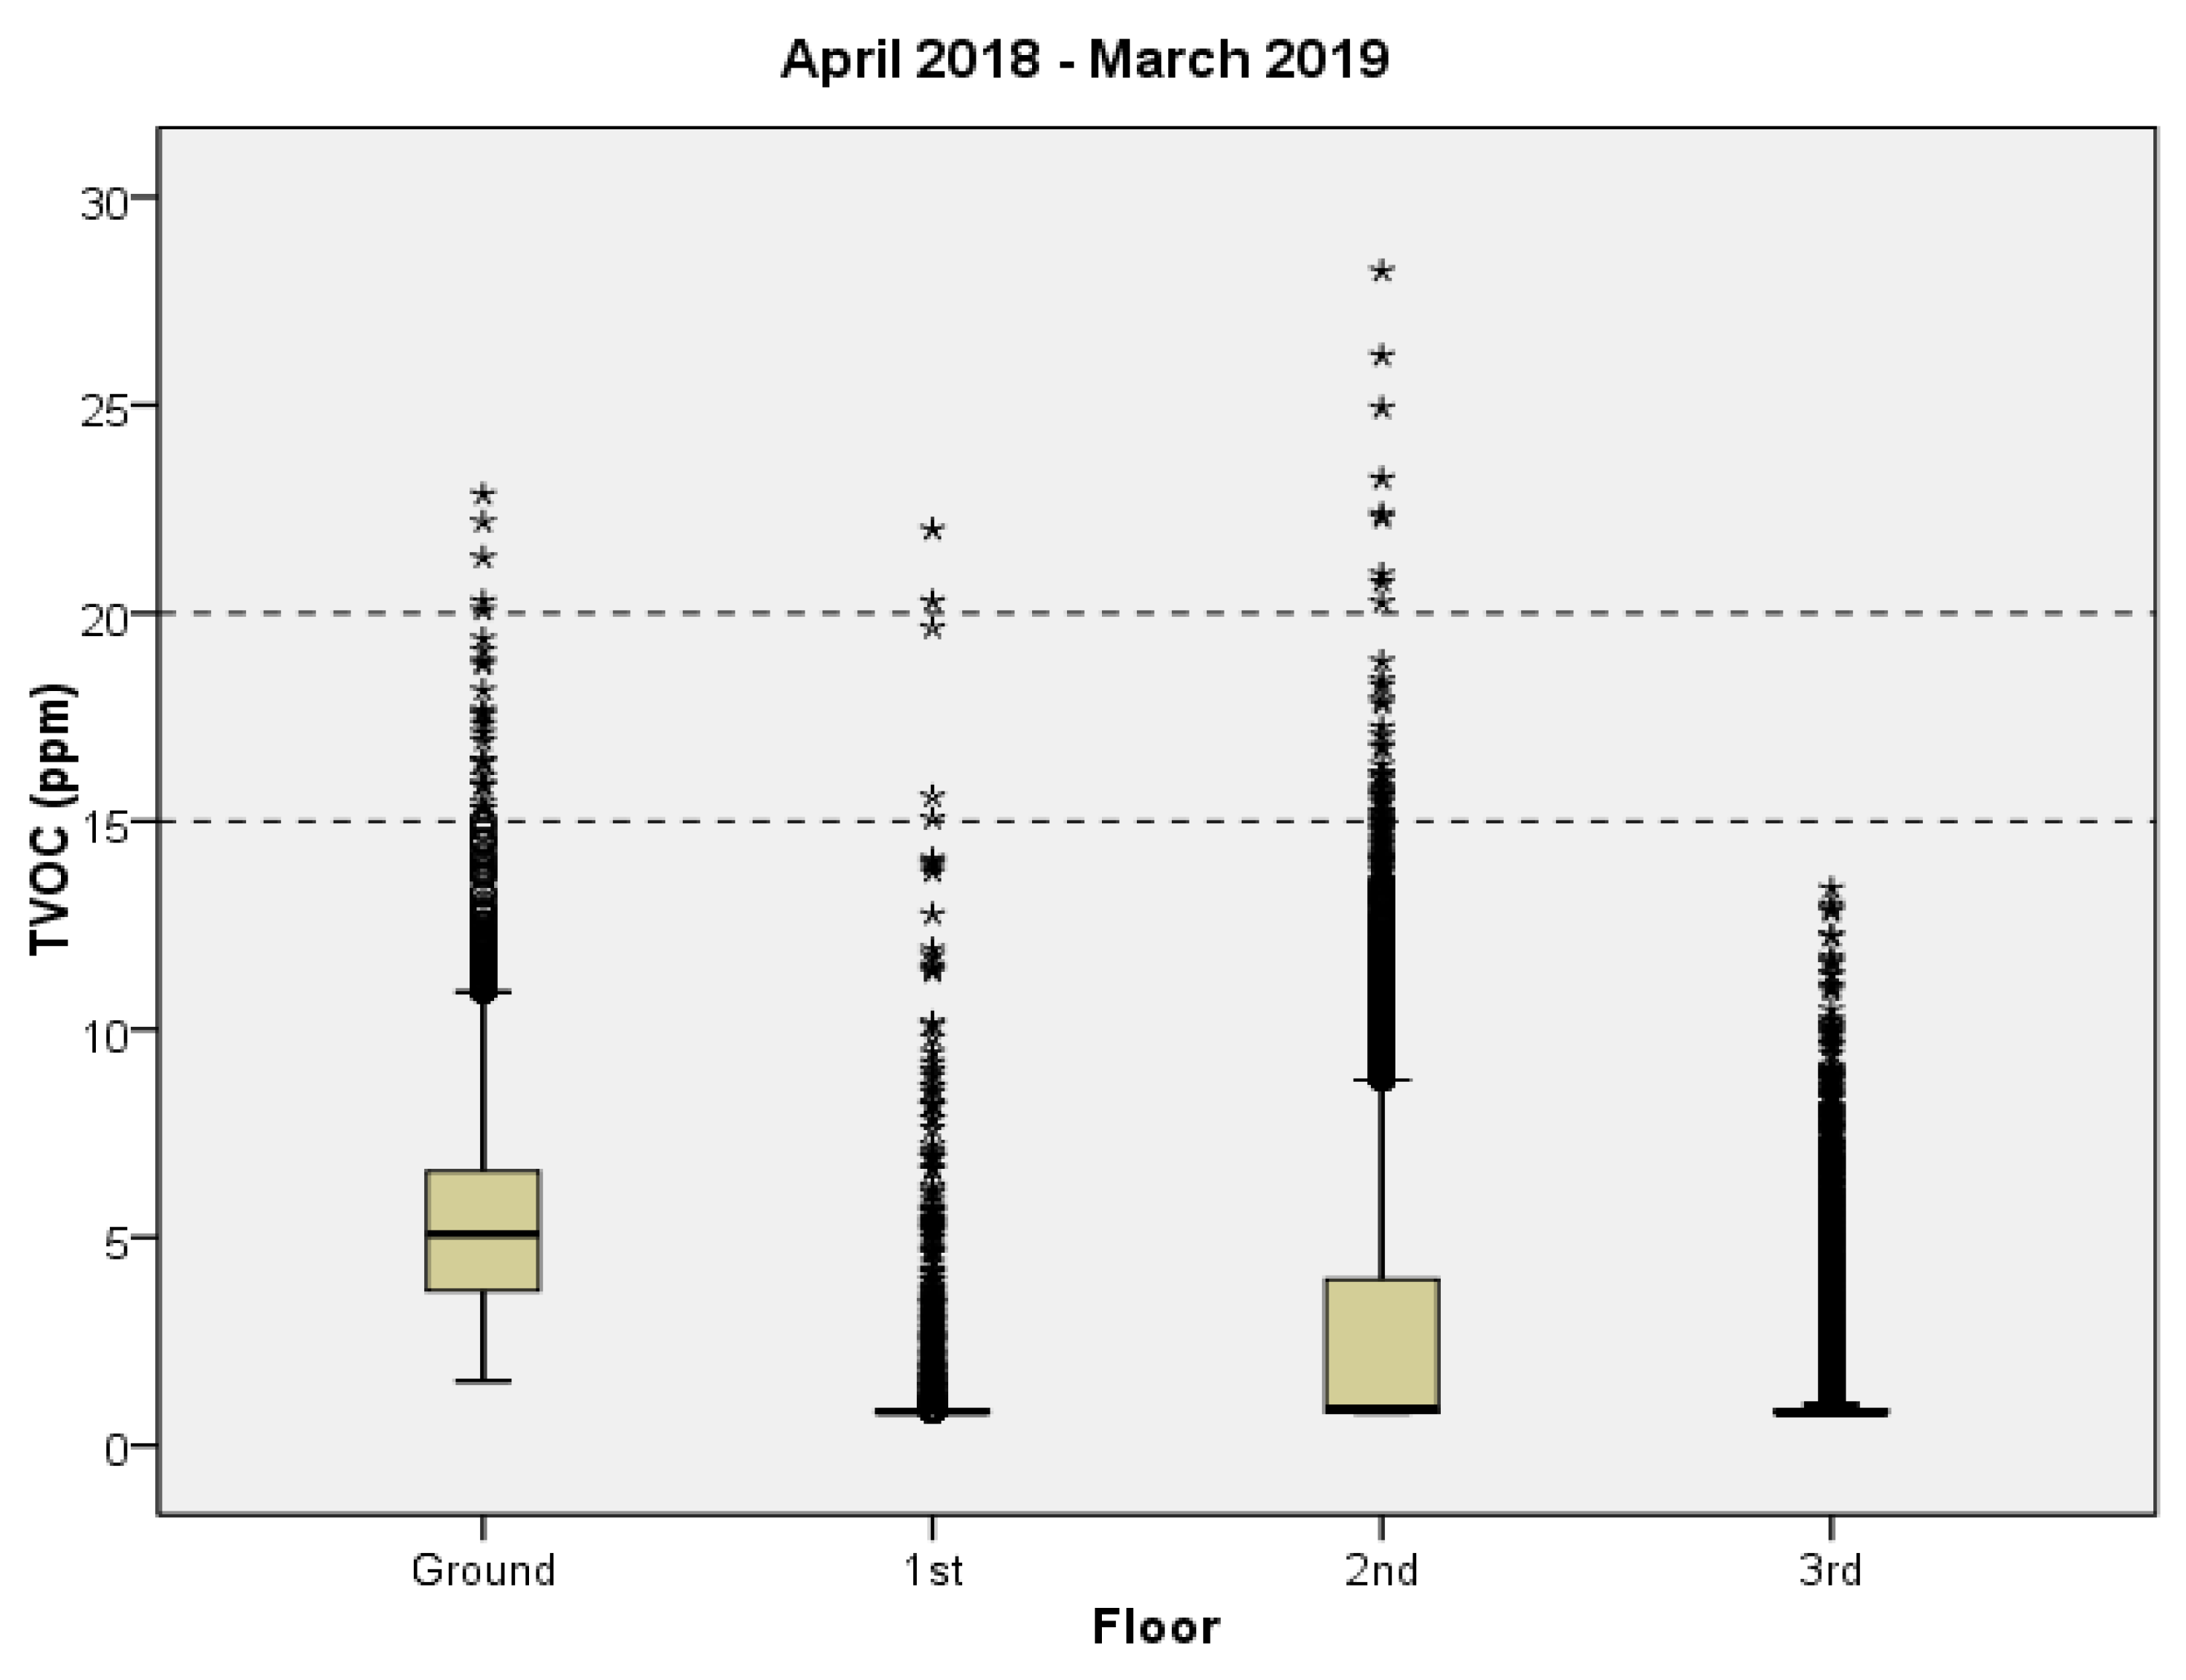
3.1.2. Air Pollution

Indoor air pollution levels were also investigated in the common spaces of the B FEPA building. For that reason, concentrations of CO2 and TVOC were measured from the ground to the third floor. It has to be noted that indoor CO2 is mainly derived from human exhalation and that in some cases it is used as an indicator of adequate ventilation [59]. Additionally, the study of Yrieix et al. notes that the main internal emission sources of TVOC are building materials, paints, furnishings, and smoking [60]. A critical limit of exposure to indoor CO2 is 1000 ppm, according to ASHRAE Standard 62-2001 [61], while the limit range of tolerance for internal TVOC is from 15 to 20 ppm, as Raatikainen et al. reported [62].
Concentrations of CO2 were found to be very low during the experimental period, as they did not exceed the respective limit of exposure for any observation. As expected, the ground floor demonstrated the highest average (474 ppm) and maximum (799 ppm) concentrations, due to the increased occupancy of the shared space and numerous people passing by continuously (entering and exiting the building) (Table 4). However, the measured values within all floors are comparable, demonstrating non-significant differences. Standard deviations were also found to be decreased in all floors (from 28 to 48 ppm), demonstrating a relatively stable pattern of CO2 within the building. This behaviour can also be noticed in the results of coefficient of variation, ranging from 5.88% in the first floor to 10.41% in the third floor, respectively. The low occupancy levels in common, areas along with the frequent window openings (due to natural ventilation), mitigate CO2 fluctuations. Similarly, TVOC concentrations were found to be significantly decreased without surpassing the respective limit range. Table 5 shows that once again, the ground floor demonstrates the highest mean concentration (5.38 ppm). As mentioned above, it is the space with the most frequent human activity (such as smoking) compared to the other floors. However, it should be noted that the values of coefficient of variation, especially from the first to the third floor, are extremely high (92.47% to 113.62%), indicating a large dispersion of data. Thus, in these microenvironments, mean values of TVOC are not representative. An additional explanation for the low levels of TVOC within the building is that no refurbishing actions have been implemented recently (absence of fresh paint, new building materials, and furnishings).
Furthermore, the behaviour of extreme instant observations (outliers) for both air pollutants has been examined for all experimental periods. Figure 6 depicts that in all floors, none of the CO2 observations exceed the limit of 1000 ppm, even during the time of high occupancy. On the contrary, Figure 7 illustrates that from the ground to the third floor a large number of instant maximum values of TVOC appeared. Individual extreme measurements were reported during specific events that took place in the dormitory when numerous people were present. However, from the same figure it is clear that only a negligible number of outliers are found to be higher than the upper limit of 20 ppm. It is obvious that for this building, indoor levels of CO2 and TVOC are found to be relatively low.

3.2. Energy Assessment

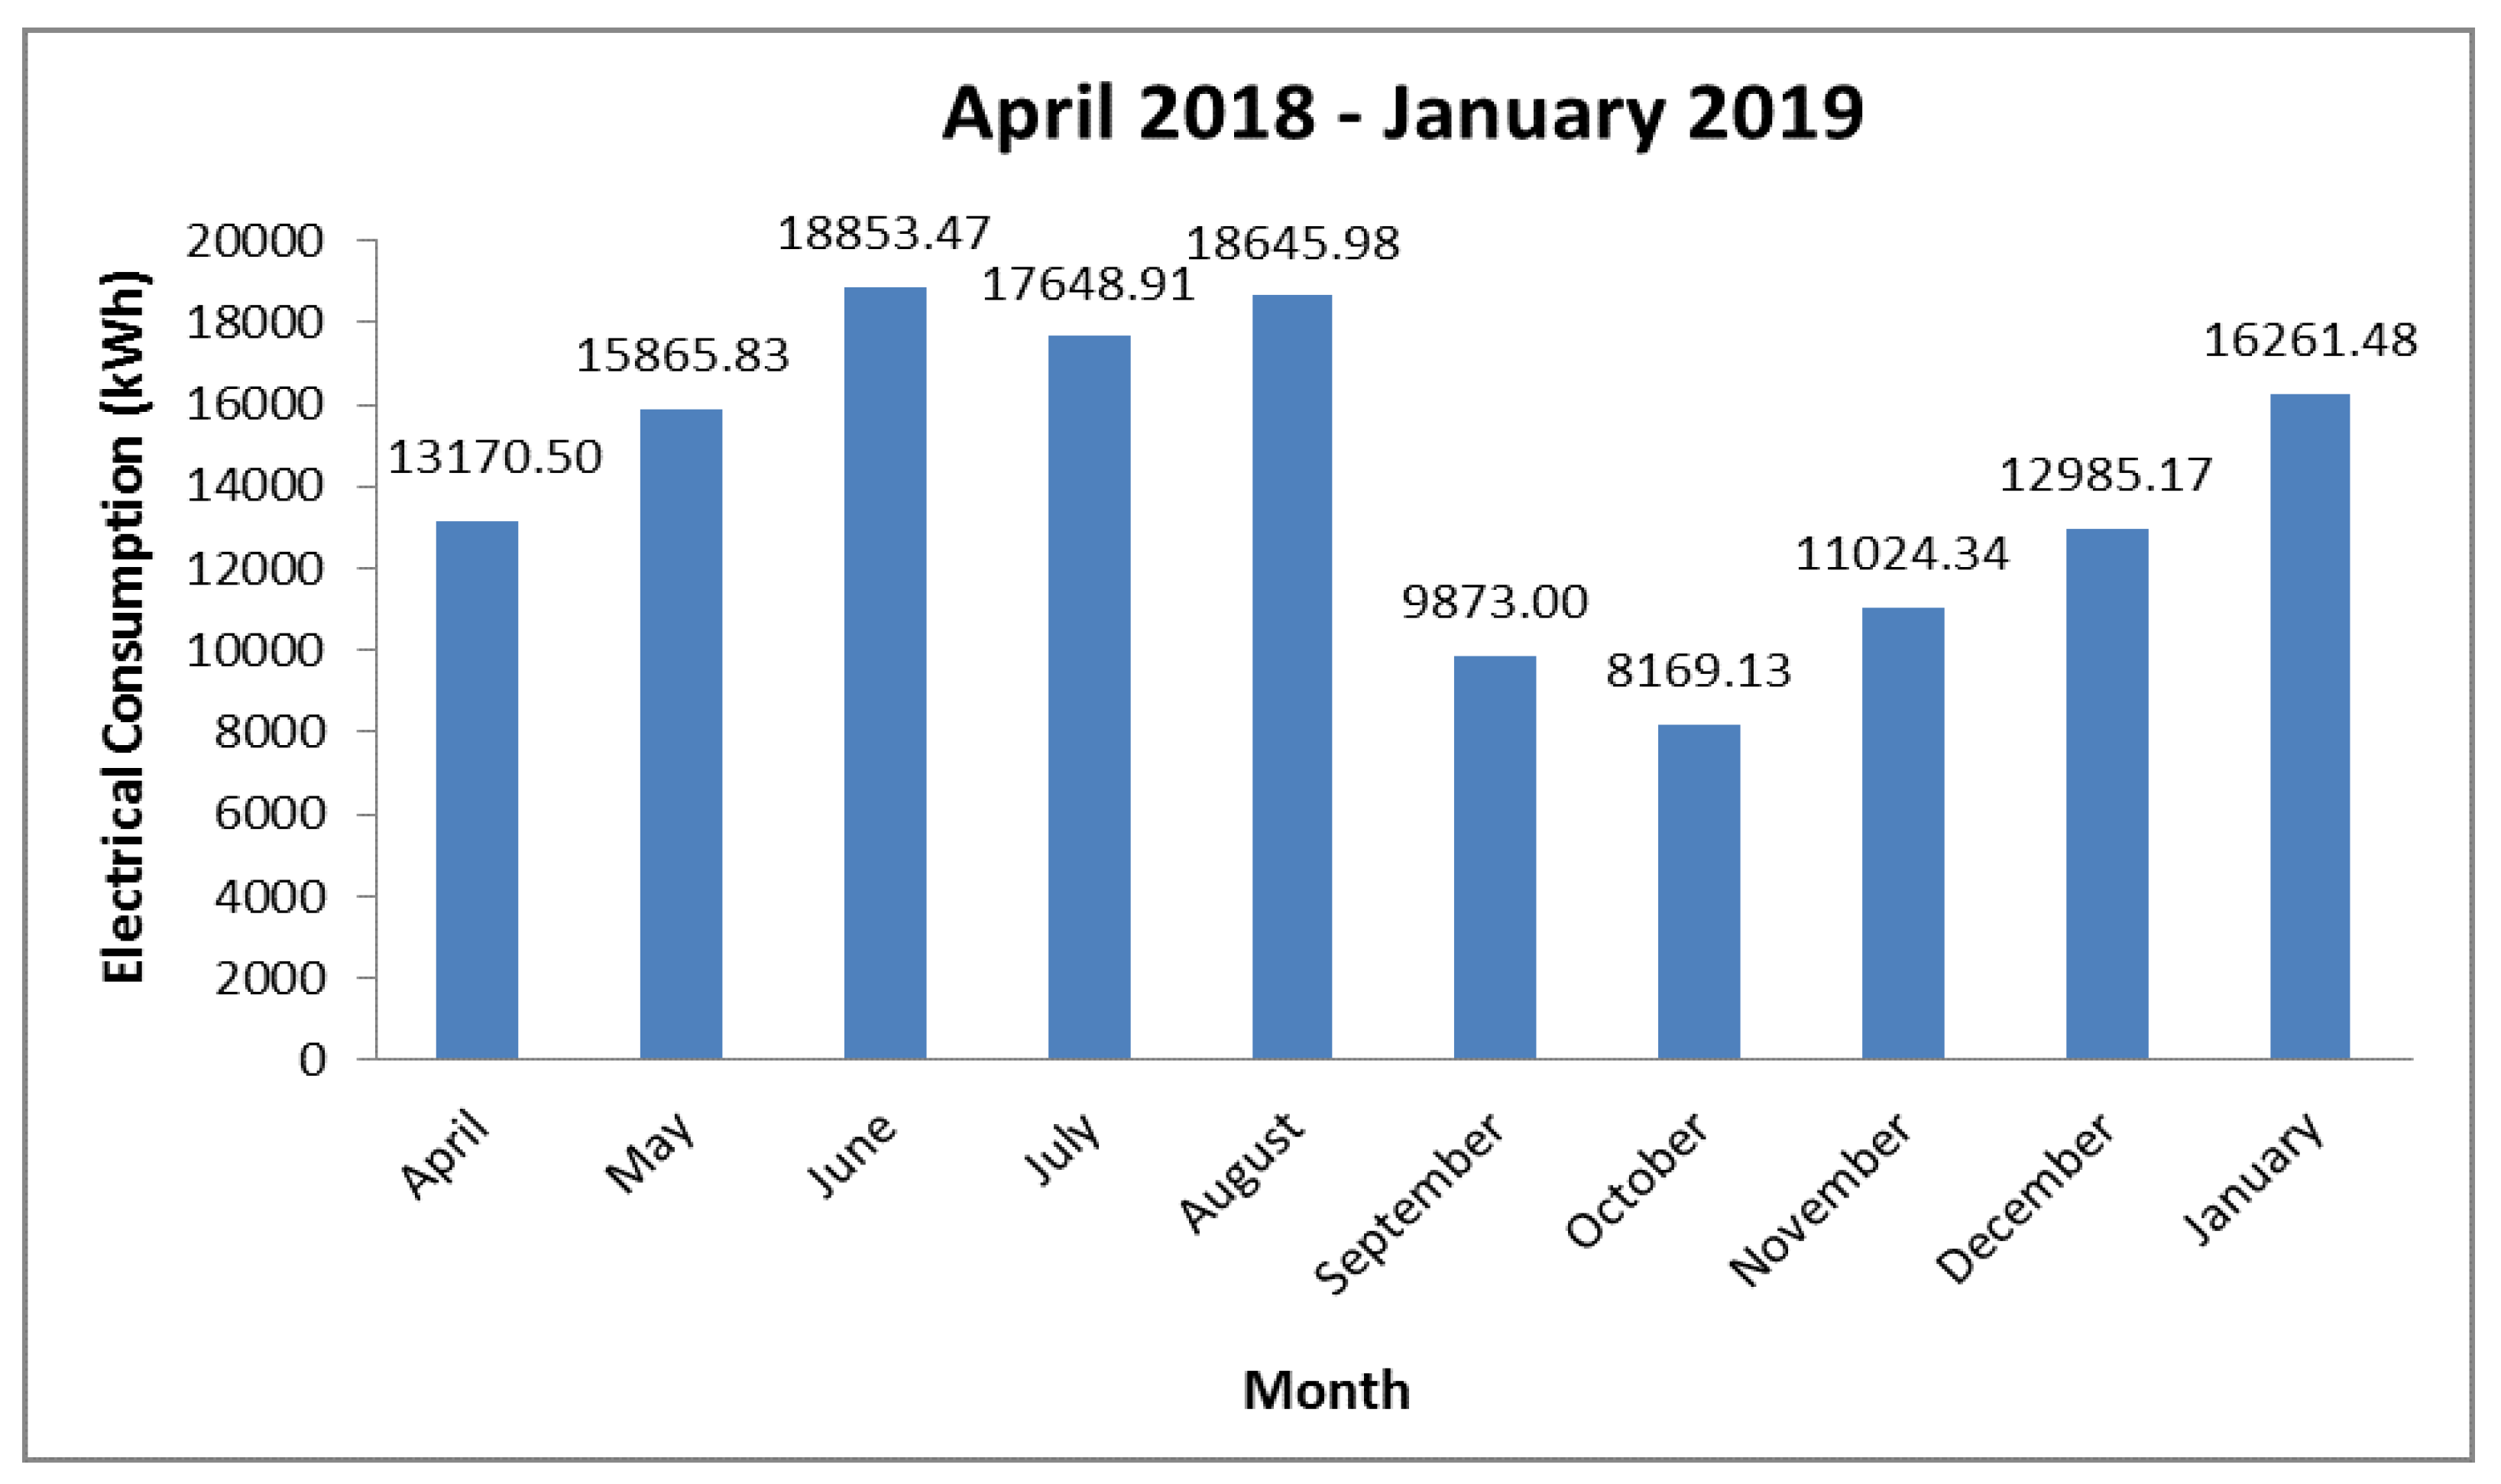
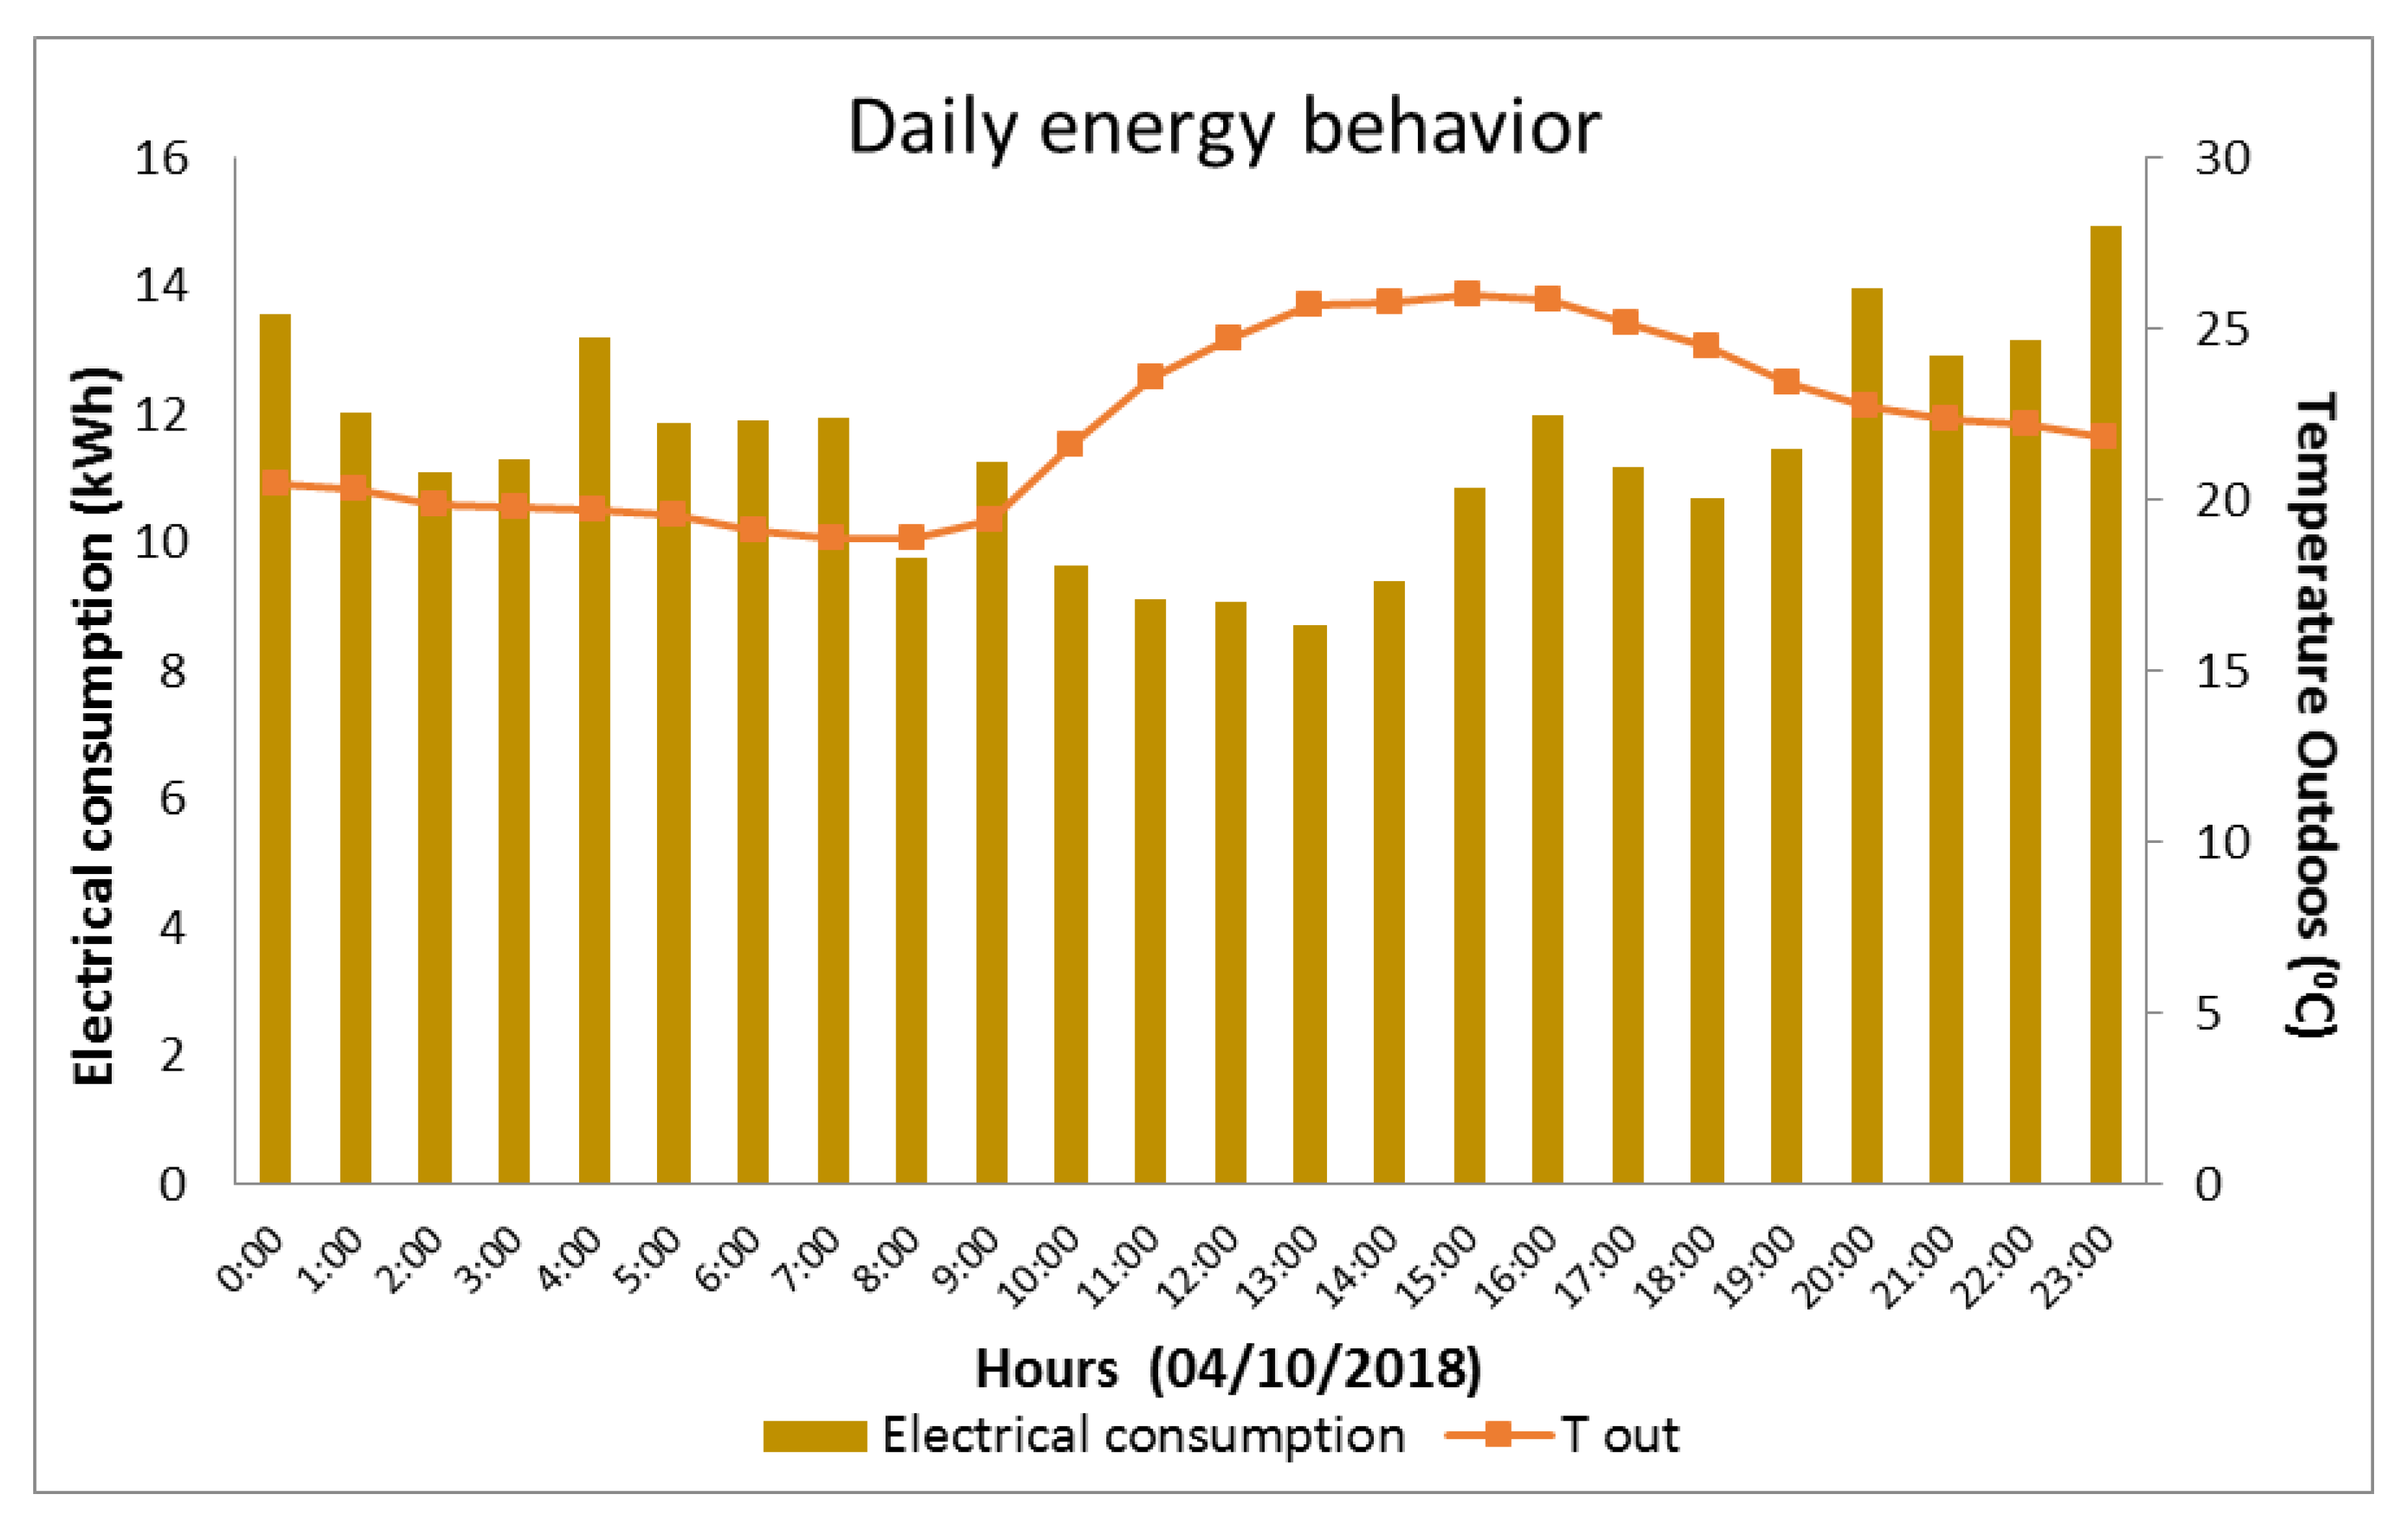
3.2.1. Electrical Consumption

Energy consumption of the B FEPA building depends mainly on the habits of the residents and the ambient meteorological conditions. For the hot days of summer there is only one air conditioning unit, installed in the common space of the ground floor, and some portable fans or air conditioners that inhabitants may use. It should be noted that these results refer only to the electrical consumption, corresponding to all electrical appliances (fridges, cooking stoves, cooking plates, laundry machines, personal appliances), all lighting needs, and some cooling needs (from a single air conditioning unit). From Figure 8, it is clear that during summer, energy consumption was found to be higher due to the typically high temperatures of the Greek summer. However, the same graph demonstrates that June is the month with the highest consumption, reaching 18,853.47 kWh in total. The respective measurements for July and August demonstrated lower levels of consumption. That is because residents (students) tend to leave after the end of the examination period (approximately in the beginning of July), and thus, the personal use of electrical devices is decreased. The consumption during summer remains higher than during the spring months. As expected, June presented the highest consumption levels, as the building has full capacity.
During autumn, local ambient temperature levels are quite moderate, and thus, the electrical consumption is low for September–October (9873 and 8169.13 kWh, respectively). However, the amounts of electrical consumption increase gradually for the following months (winter period) when the outdoor temperature decreases severely. An additional reason for this behaviour is the constant use of portable electrical heaters by the occupants. Even though the data for the cold period (November to March) are relatively limited, it is worth mentioning that December demonstrated lower consumption levels (12,985.17 kWh) than July (17,648.91 kWh). This result (as in July) is also affected by the absence of a large amount of tenants, due to Christmas holidays the last two week of the month.
Generally, autonomous HVAC systems seem to play a key role in the electrical consumption of the examined building. Characteristically, during July and August, even though the inhabitants are mainly away from the dormitory, the consumption levels are significantly high. Tenants that remain in the building during this period constantly use portable fans or air conditioning units, increasing the total amount of electricity. On the contrary, during October and November, when there is no need for cooling but the building has maximum occupancy, the electrical consumption levels appear to be significantly lower. It is clear that not only a redesign of the cooling/heating system is essential but also a reinforcement of the thermal insulation, as the building is prone to thermal losses.

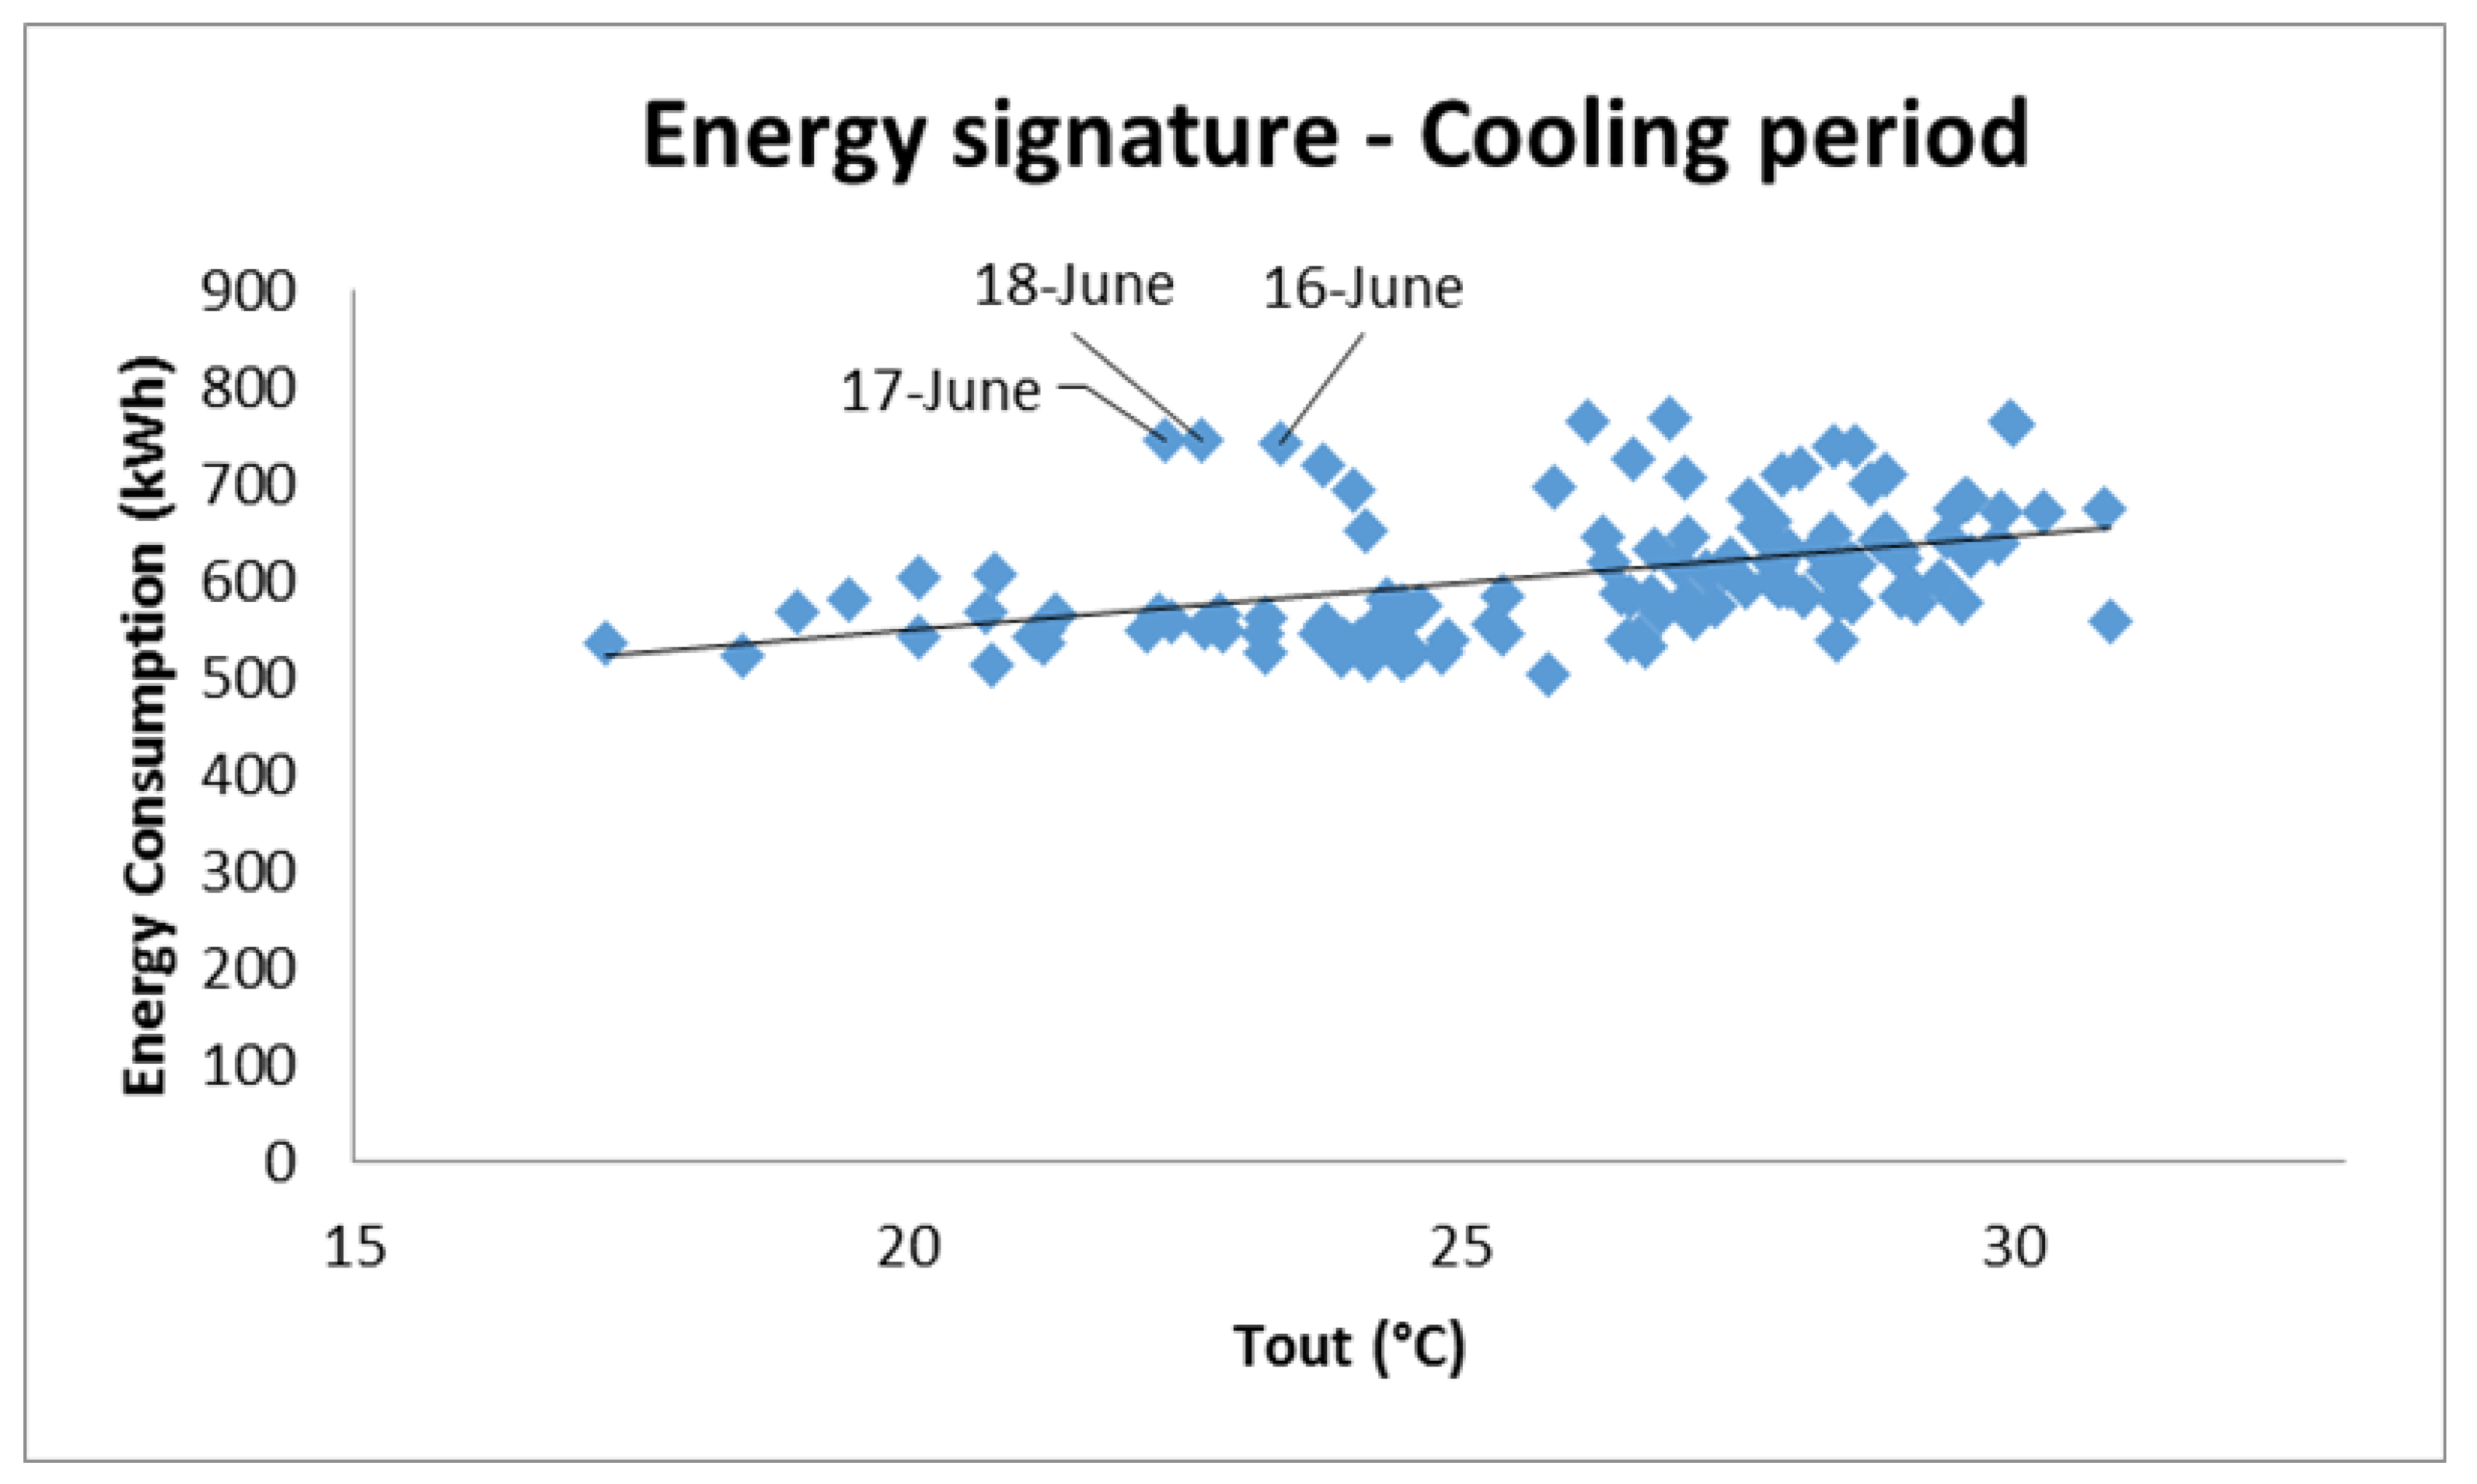
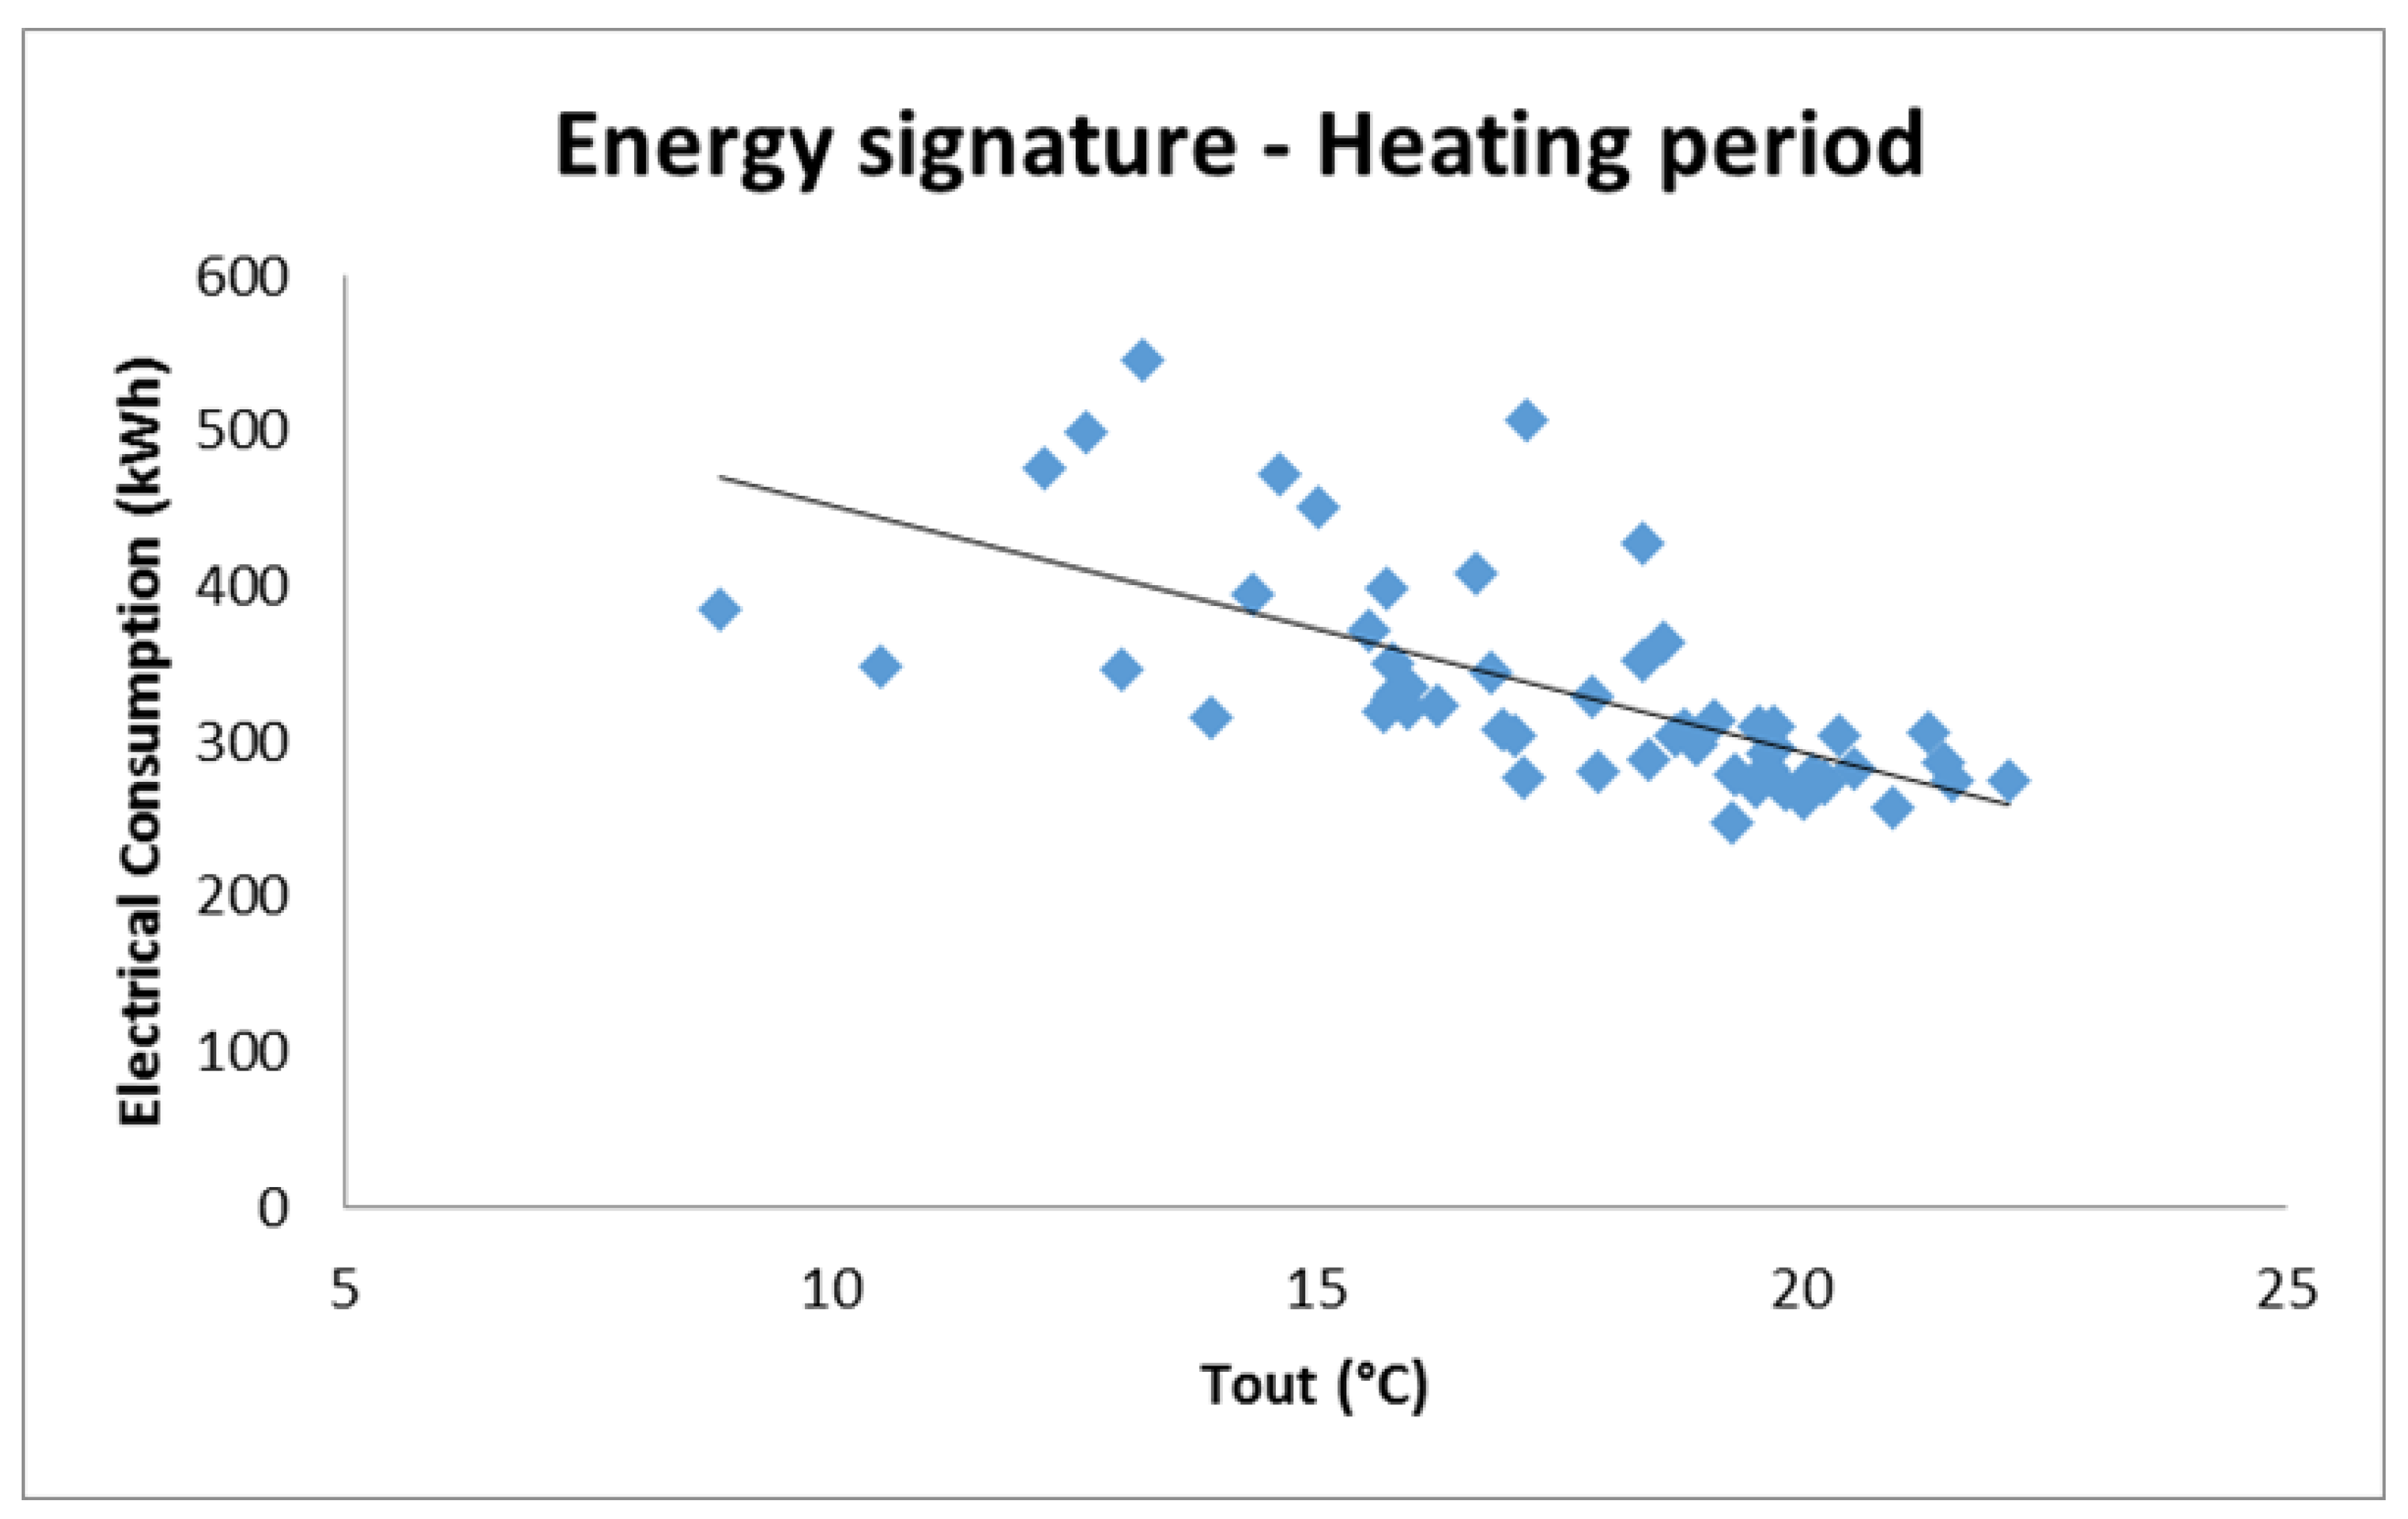
3.2.2. Energy Signature

Energy behaviour of old buildings is usually correlated with external climatic conditions [63]. For the case of B FEPA, Figure 9 illustrates different levels of electrical consumption along with the respective outdoor temperature levels in order to investigate possible patterns. A higher energy demand during early morning and late evening hours is depicted. For that reason, a thorough investigation of the energy signature of the building (for the specific experimental period is considered mandated). The term “energy signature”, also called thermal performance line, is considered the best fit correlating energy consumption with external climatic conditions [64,65,66]. The approach of obtaining different energy signatures (heating, DHW, electrical) is a system identification approach, also known as inverse modelling [67]. Measured energy consumption and weather data are used simultaneously in order to perform the regression (most commonly least squares method).
In order to calculate the energy signature for the B FEPA building, the total electrical consumption and the average outdoor temperature for all experimental periods were examined. The energy signature is separated into two time periods—the cooling period (from April to September) and heating period (from October to January). The results show that when the outdoor temperature is low during winter, the energy consumption is increased. The coefficient of determination (R2) is equal to 0.4436 and the correlation coefficient (R) is found to be 0.6660. It is clear that 44.36% of the variability of electrical consumption is explained by the changes of ambient temperature. On the contrary, during the cooling period, when the temperature increases, the electrical consumption is relatively influenced. Characteristically, R2 and R are 0.1902 and 0.4361, while the slope was found to be lower compared to the heating season. More specifically, in Figure 10, one may observe that approximately above 25 °C, the dependency of electrical consumption from the ambient temperature increases. However, it is important to note a deviation from this pattern for three specific days of June, when the dormitory festival was organized, and thus, plenty of people were in the building and large amounts of electric power was consumed because of numerous activities (parties, film projections, etc.). The days that this behaviour was observed are the following:
  • June 16 E = 743.60 kWh, Tout = 23.38 °C
  • June 17 E = 746.16 kWh, Tout = 22.33 °C
  • June 18 E = 745.85 kWh, Tout = 22.67 °C
Figure 11 illustrates the results for the heating period. The electrical consumption increases as outdoor temperature decreases. The same figure also shows that there are very few cases that diverge. The same results were obtained in a research study by Arregi et al., which refers to the energy signature of a university building in the United Kingdom. The authors highlighted that the pre-retrofitted building followed a seasonal pattern with energy consumption strongly correlated with the respective external temperature and that occupancy and usage patterns of the building also influenced the results. In conclusion, the two figures demonstrated a significant correlation between electrical consumption and the outdoor temperature, especially during the cold period [68]. This is an indicator that the indoor environment of the building is relatively vulnerable to outdoor conditions, mainly due to insufficient thermal insulation. It has to be noted that electrical consumption also demonstrated a strong correlation with indoor air temperature, but relatively weak correlations with the rest of the variables (RH, CO2, and TVOC).

4. Conclusions

In this study, the energy performance along with the IEQ conditions of a dormitory within the campus of the University of Athens have been analyzed. The dormitory in question was selected as the pilot case of the Pro-GET-onE (Horizon 2020 G.A. n. 723747) project, in which a deep retrofit is planned to take place in late 2019. In fact, through Pro-GET-onE H2020, a 3D building information model through BIM modelling is being developed and will be available and presented within the European community at a later stage of the project.
A series of field measurements took place in order to demonstrate the thermal and energy profile of the building’s current state, along with the IEQ performance during different monitoring periods. The needs on which the renovation actions should focus on, which is the main goal of this paper, are highlighted.
The most significant conclusions drawn from the experimental campaign are the following:
  • Thermal conditions within the whole building cannot be considered comfortable for tenants, as high percentages of temperature measurements were found to surpass the proposed limits. This phenomenon is enhanced during summer months, with high ambient temperatures. Installation of a central air conditioning unit or an alternative cooling system is considered mandatory.
  • The third floor is strongly influenced by the ambient climate conditions, especially during warm months, when solar radiation causes internal overheating. This depicts problematic thermal insulation of the roof, which needs to be addressed.
  • The investigation of the IEQ regime did not demonstrate high concentrations of air pollutants. Low occupancy numbers, along with adequate natural ventilation of the common use areas, were found to maintain CO2 and TVOC at decreased levels, within all experimental points. However, similar measurements should be carried out after the refurbishment in order to validate this result.
  • Energy metering showed that the examined building is generally vulnerable to thermal loses. This is because electrical consumption was found to be significantly correlated with ambient climatic conditions. It is noticeably increased during extreme outdoor temperature levels. This is an additional result that demonstrates that redesign of the cooling and heating system, as well as reinforcement of the building’s thermal insulation, are the key role actions that need to be assessed for the energy retrofitting of this building.

Author Contributions

All authors equally contributed to the paper.

Funding

This project has received funding from the European Union’s Horizon 2020 Innovation action under grant agreement No. 723747 (Pro-GET-onE).

Acknowledgments

The authors wish to acknowledge the Technical Service department of the National and Kapodistrian University of Athens for their contribution to the technical specifications of the student housing. Furthermore, the authors would like to acknowledge SAVES2 project, a H2020 project under the grant agreement no. 754203, for the acquisition of the electrical data for the B FEPA student housing, and also the company Ether Applications Ltd. for the installation of the electrical meters. Lastly, Pro-GET-onE (Horizon 2020 G.A. n. 723747) and the National Observatory of Athens Institute of Environmental Research are highly appreciated.

Conflicts of Interest

The authors declare no conflict of interest.

References

  1. Balaras, C.A.; Gaglia, A.G.; Georgopoulou, E.; Mirasgedis, S.; Sarafidis, Y.; Lalas, D. European residential buildings and empirical assessment of the Hellenic building stock, energy consumption, emissions and potential energy savings. Build. Environ. 2007, 42, 1298–1314. [Google Scholar] [CrossRef]
  2. EU. On the Energy Performance of Buildings. In Directive 2002/91/EC of the European Parliament and of the Council; Official Journal of the European Communities: Brussels, Belgium, 2002. [Google Scholar]
  3. YPEKA. EK407/B/9.4.2010, “Regulation on Energy Performance in the Building Sector—KENAK”; YPEKA: Athens, Greece, 2010. [Google Scholar]
  4. Baranova, D.; Sovetnikov, D.; Borodinecs, A. The extensive analysis of building energy performance across the Baltic Sea region. Sci. Technol. Built Environ. 2018, 24, 982–993. [Google Scholar] [CrossRef]
  5. Zhaoa, D.; McCoyb, A.; Duc, J. An empirical study on the energy consumption in residential buildings after adopting green building standards. Procedia Eng. 2016, 145, 766–773. [Google Scholar] [CrossRef]
  6. Huang, Y. Energy saving technology measures of green building. Adv. Mater. Res. 2012, 347–353, 4114–4117. [Google Scholar] [CrossRef]
  7. Huang, Z. Discussion on energy saving technology and energy saving way of green building. Int. Conf. Intell. Transp. 2015, 1, 313–315. [Google Scholar]
  8. Santamouris, M.; Sfakianaki, A.; Pavlou, K. On the efficiency of night ventilation techniques applied to residential buildings. Energy Build. 2010, 42, 1309–1313. [Google Scholar] [CrossRef]
  9. Santamouris, M. Cooling the buildings: Past, present, and future. Energy Build. 2016, 128, 617–638. [Google Scholar] [CrossRef]
  10. Vatin, N.; Nemova, D.; Kazimirova, A.; Gureev, K. Increase of energy efficiency of the building of kindergarten. Adv. Mater. Res. 2014, 953–954, 1537–1544. [Google Scholar] [CrossRef]
  11. Naumov, A.; Tabunshchikov, D.; Kapko, M.; Brodach, M. Research of the Microclimate formed by the Local DCV. Energy Build. 2015, 90, 1–5. [Google Scholar] [CrossRef]
  12. Deng, Y.; Feng, Z.; Fang, J.; Cao, S.J. Impact of ventilation rates on indoor thermal comfort and energy efficiency of ground-source heat pump system. Sustain. Cities Soc. 2018, 37, 154–163. [Google Scholar] [CrossRef]
  13. Szodrai, F.; Kalmár, F. Simulation of Temperature Distribution on the Face Skin in Case of Advanced Personalized Ventilation System. Energies 2019, 12, 1185. [Google Scholar] [CrossRef]
  14. Zalejska-Jonsson, A.; Wilhelmsson, M. Impact of perceived indoor environment quality on overall satisfaction in Swedish dwellings. Build. Environ. 2013, 63, 134–144. [Google Scholar] [CrossRef]
  15. Thomsen, K.E.; Rose, J.; Christen Mørck, O.; Jensen, S.Ø.; Østergaard, I.; Knudsen, H.N.; Bergsøe, N.C. Energy consumption and indoor climate in a residential building before and after comprehensive energy retrofitting. Energy Build. 2016, 123, 8–16. [Google Scholar] [CrossRef]
  16. Kalmár, F. Interrelation between glazing and summer operative temperatures in buildings. Int. Rev. Appl. Sci. Eng. 2016, 7, 51–60. [Google Scholar] [CrossRef]
  17. Kalmár, F. Summer operative temperatures in free running existing buildings with high glazed ratio of the facades. J. Build. Eng. 2016, 6, 236–242. [Google Scholar] [CrossRef] [Green Version]
  18. Zemitis, J.; Borodinecs, A.; Frolova, M. Measurements of moisture production caused by various sources. Energy Build. 2016, 127, 884–891. [Google Scholar] [CrossRef]
  19. Prasauskas, T.; Martuzevicius, D.; Kalamees, T.; Kuusk, K.; Leivo, V.; Haverinen-Shaughnessy, U. Effects of Energy Retrofits on Indoor Air Quality in Three Northern European Countries. Energy Procedia 2016, 96, 253–259. [Google Scholar] [CrossRef] [Green Version]
  20. Crump, D.; Dengel, A.; Swainson, M. Indoor Air Quality in Highly Energy Efficient Homes—A Review; Report n° NF18; NHBC Foundation: Milton Keynes, UK, 2009; Available online: http://www.zerocarbonhub.org/sites/default/files/resources/reports/Indoor_Air_Quality_in_Highly_Energy_Efficient_Homes_A_Review_NF18.pdf (accessed on 22 April 2019).
  21. Melikov, A.K. Advanced air distribution. ASHRAE J. 2011, 53, 73–78. [Google Scholar]
  22. Huang, Y.; Wang, Y.; Liu, L.; Nielsen, P.V.; Jensen, R.L.; Yang, X. Performance of constant exhaust ventilation for removal of transient high-temperature contaminated airflows and ventilation-performance comparison between two local exhaust hoods. Energy Build. 2017, 154, 207–216. [Google Scholar] [CrossRef]
  23. Gao, R.; Wang, C.; Li, A.; Yu, S.; Deng, B. A novel targeted personalized ventilation system based on the shooting concept. Build. Environ. 2018, 135, 269–279. [Google Scholar] [CrossRef]
  24. Xu, C.; Nielsen, P.V.; Liu, L.; Jensen, R.L.; Gong, G. Impacts of airflow interactions with thermal boundary layer on performance of personalized ventilation. Build. Environ. 2018, 135, 31–41. [Google Scholar] [CrossRef]
  25. Xu, C.; Liu, L. Personalized ventilation: One possible solution for airborne infection control in highly occupied space? Indoor Built Environ. 2018, 27, 873–876. [Google Scholar] [CrossRef]
  26. Chludzińska, M. The effect of front pattern perforation shape on thermal sensations of occupants in personalized ventilation systems. Build. Environ. 2019, 151, 140–147. [Google Scholar] [CrossRef]
  27. Yu, Z.; Fung, B.C.M.; Haghighat, F.; Yoshino, H.; Morofsky, E. A systematic procedure to study the influence of occupant behavior on building energy consumption. Energy Build. 2011, 43, 1409–1417. [Google Scholar] [CrossRef] [Green Version]
  28. Ouyang, J.; Hokao, K. Energy-saving potential by improving occupants’ behavior in urban residential sector in Hangzhou City, China. Energy Build. 2009, 41, 711–720. [Google Scholar] [CrossRef]
  29. Brown, T.; Dassonville, C.; Derbez, M.; Ramalho, O.; Kirchner, S.; Crump, D.; Mandin, C. Relationships between socioeconomic and lifestyle factors and indoor air quality in French dwellings. Environ. Res. 2015, 140, 385–396. [Google Scholar] [CrossRef]
  30. Hiscock, R.; Bauld, L.; Amos, A.; Fidler, J.A.; Munafò, M. Socioeconomic status and smoking: A review. Ann. N. Y. Acad. Sci. 2012, 1248, 107–123. [Google Scholar] [CrossRef]
  31. Klepeis, N.E.; Bellettiere, J.; Hughes, S.C.; Nguyen, B.; Berardi, V.; Liles, S.; Obayashi, S.; Hofstetter, C.R.; Blumberg, E.; Hovell, M.F. Fine particles in homes of predominantly low-income families with children and smokers: Key physical and behavioral determinants to inform indoor-air-quality interventions. PLoS ONE 2017, 12, e0177718. [Google Scholar] [CrossRef]
  32. Calì, D.; Osterhage, T.; Streblow, R.; Müller, D. Energy performance gap in refurbished German dwellings: Lesson learned from a field test. Energy Build. 2016, 127, 1146–1158. [Google Scholar] [CrossRef]
  33. Shinohara, N.; Tokumura, M.; Kazama, M.; Yonemoto, Y.; Yoshioka, M.; Kagi, N.; Hasegawa, K.; Yoshino, H.; Yanagi, U. Indoor air quality and thermal comfort in temporary houses occupied after the Great East Japan Earthquake. Indoor Air 2014, 24, 425–437. [Google Scholar] [CrossRef]
  34. Makonese, T.; Bradnum, C.M. Design and performance evaluation of wood-burning cookstoves for low-income households in South Africa. J. Energy S. Afr. 2018, 29, 1–12. [Google Scholar] [CrossRef] [Green Version]
  35. Franchi, M.; Carrer, P.; Kotzias, D.; Rameckers, E.; Seppänen, O.; Van Bronswijk, J.; Viegi, G.; Gilder, J.; Valovirta, E. Working towards healthy air in dwellings in Europe. Allergy 2006, 61, 864–868. [Google Scholar] [CrossRef] [PubMed]
  36. Steinemann, A.; Wargocki, P.; Rismanchi, B. Ten questions concerning green buildings and indoor air quality. Build. Environ. 2017, 112, 351–358. [Google Scholar] [CrossRef] [Green Version]
  37. Collignan, B.; Le Ponner, E.; Mandin, C. Relationships between indoor radon concentrations, thermal retrofit and dwelling characteristics. J. Environ. Radioact. 2016, 165, 124–130. [Google Scholar] [CrossRef] [PubMed]
  38. Coombs, K.C.; Chew, G.L.; Schaffer, C.; Ryan, P.H.; Brokamp, C.; Grinshpun, S.A.; Adamkiewicz, G.; Chillrud, S.; Hedman, C.; Colton, M.; et al. Indoor air quality in green-renovated vs. non-green low-income homes of children living in a temperate region of US (Ohio). Sci. Total Environ. 2016, 554–555, 178–185. [Google Scholar] [CrossRef] [PubMed]
  39. Hamilton, I.; Milner, J.; Chalabi, Z.; Das, P.; Jones, B.; Shrubsole, C.; Davies, M.; Wilkinson, P. Health effects of home energy efficiency interventions in England: A modelling study. Br. Med. J. Open 2015, 5, e007298. [Google Scholar] [CrossRef] [PubMed]
  40. Frey, S.E.; Destaillats, H.; Cohn, S.; Ahrentzen, S.; Fraser, M.P. Characterization of indoor air quality and resident health in an Arizona senior housing apartment building. J. Air Waste Manag. Assoc. 2014, 64, 1251–1259. [Google Scholar] [CrossRef] [PubMed] [Green Version]
  41. Noris, F.; Adamkiewicz, G.; Delp, W.W.; Hotchi, T.; Russell, M.; Singer, B.C.; Spears, M.; Vermeer, K.; Fisk, W.J. Indoor environmental quality benefits of apartment energy retrofits. Build. Environ. 2013, 68, 170–178. [Google Scholar] [CrossRef] [Green Version]
  42. Broderick, Á.; Byrne, M.; Armstrong, S.; Sheahan, J.; Coggins, A.M. A pre and post evaluation of indoor air quality, ventilation, and thermal comfort in retrofitted co-operative social housing. Build. Environ. 2017, 122, 126–133. [Google Scholar] [CrossRef]
  43. Hamburg, A.; Kalamees, T. The Influence of Energy Renovation on the Change of Indoor Temperature and Energy Use. Energies 2018, 11, 3179. [Google Scholar] [CrossRef]
  44. Cascone, S.; Sciuto, G. Recovery and reuse of abandoned buildings for student housing: A case study in Catania, Italy. Front. Archit. Res. 2018, 7, 510–520. [Google Scholar] [CrossRef]
  45. Furundzic, A.K.; Kosoric, V.; Golic, K. Potential for reduction of CO2 emissions by integration of solar water heating systems on student dormitories through building refurbishment. Sustain. Cities Soc. 2012, 2, 50–62. [Google Scholar] [CrossRef]
  46. Mostafavi, N.; Farzinmoghadam, M.; Hoque, S. Envelope retrofit analysis using eQUEST, IESVE Revit Plug-in and Green Building Studio: A university dormitory case study. Int. J. Sustain. Energy 2015, 34, 594–613. [Google Scholar] [CrossRef]
  47. Tabatabaee, S.; Weil, B.; Aksamija, A. Negative life-cycle emissions growth rate through retrofit of existing institutional buildings. In Proceedings of the ARCC Conference, Chigaco, IL, USA, 6–9 April 2015; pp. 212–221. [Google Scholar]
  48. Karp, A.; McCauley, M.; Byrne, J.; Byrne, J. The value of adding ambient energy feedback to conservation tips and goal-setting in a dormitory. Int. J. Sustain. High Educ. 2016, 17, 471–488. [Google Scholar] [CrossRef]
  49. Ning, H.R.; Wang, Z.J.; Zhang, X.X.; Ji, Y.C. Adaptive thermal comfort in university dormitories in the severe cold area of China. Build. Environ. 2016, 99, 161–169. [Google Scholar] [CrossRef]
  50. Assimakopoulos, M.N.; De Masi, R.F.; Papadaki, D.; Ruggiero, S.; Vanoli, G.P. Energy audit and performance optimization of a residential university building in heating dominated climates of Italian backcountry. TEMA Technol. Eng. Mater. Archit. [S.L.] 2018, 4, 19–33. [Google Scholar]
  51. Petidis, I.; Aryblia, M.; Daras, T.; Tsoutsos, T. Energy saving and thermal comfort interventions based on occupants’ needs: A students’ residence building case. Energy Build. 2018, 174, 347–364. [Google Scholar] [CrossRef]
  52. Ferrante, A.; Mochi, G.; Predari, G.; Badini, L.; Fotopoulou, A.; Gulli, R.; Semprini, G. A European Project for Safer and Energy Efficient Buildings: Pro-GET-onE (Proactive Synergy of inteGrated Efficient Technologies on Buildings’ Envelopes). Sustainability 2018, 10, 812. [Google Scholar] [CrossRef]
  53. ANSI/ASHRAE Guideline 14-2002. Measurement of Energy and Demand Savings; American Society of Heating, Refrigeration and Air Conditioning Engineers, Inc.: Atlanta, GA, USA, 2002. [Google Scholar]
  54. Landis+Gyr E65C, Industrial & Commercial Meter. Available online: https://www.landisgyr.eu/product/landisgyr-e650/ (accessed on 12 April 2019).
  55. Smart System for Energy Monitoring and Management, Ether Technological Applications Ltd. Available online: http://www.ether.gr/en (accessed on 18 April 2019).
  56. Lagouvardos, K.; Kotroni, V.; Bezes, A.; Koletsis, I.; Kopania, T.; Lykoudis, S.; Mazarakis, N.; Papagiannaki, K.; Vougioukas, S. The automatic weather stations NOANN network of the National Observatory of Athens: Operation and database. Geosci. Data J. 2017, 4, 1–16. [Google Scholar] [CrossRef]
  57. ANSI/ASHRAE Standard 55-2004. Thermal Environmental Conditions for Human Occupancy; American Society of Heating, Refrigerating and Air-Conditioning Engineers, Inc.: Atlanta, GA, USA, 2004. [Google Scholar]
  58. Pegas, P.; Alves, C.; Evtyugina, M.; Nunes, T.; Cerqueira, M.; Franchi, M.; Pio, C.; Almeida, S.; Freitas, M. Indoor air quality in elementary schools of Lisbon in spring. Environ. Geochem. Health 2011, 33, 455–468. [Google Scholar] [CrossRef]
  59. Shendell, D.G.; Prill, R.; Fisk, W.J.; Apte, M.G.; Blake, D.; Faulkner, D. Associations between classroom CO2 concentrations and student attendance in Washington and Idaho. Indoor Air 2004, 14, 333–341. [Google Scholar] [CrossRef] [PubMed]
  60. Yrieix, C.; Dulaurent, A.; Laffargue, C.; Maupetit, F.; Pacary, T.; Uhde, E. Characterization of VOC and formaldehyde emissions from a wood based panel: Results from an inter-laboratory comparison. Chemosphere 2010, 79, 414–419. [Google Scholar] [CrossRef] [PubMed]
  61. ANSI/ASHRAE Standard 62-2001. Ventilation for Acceptable Indoor Air Quality; American Society of Heating, Refrigerating and Air Conditioning Engineers, Inc.: Atlanta, GA, USA, 2001. [Google Scholar]
  62. Raatikainen, M.; Skön, J.P.; Turunen, M.; Leiviskä, K.; Kolehmainen, M. Evaluating Effects of Indoor Air Quality in School Buildings and Students’ Health: A Study in Ten Schools of Kuopio, Finland. In Proceedings of the 2nd International Conference on Environment, Energy and Biotechnology (PCBEE), Kuala Lumpur, Malaysia, 8–9 June 2013. [Google Scholar]
  63. Zhao, H.; Magoules, F. A review on the prediction of building energy consumption. Renewable and Sustainable. Energy Rev. 2012, 16, 3586–3592. [Google Scholar]
  64. Hammarsten, S. A critical appraisal of energy-signature models. Appl. Energy 1987, 26, 97–110. [Google Scholar] [CrossRef]
  65. Westergren, K.E.; Högberg, H.; Norlén, U. Monitoring energy consumption in single-family houses. Energy Build. 1999, 29, 247–257. [Google Scholar] [CrossRef]
  66. Belussi, L.; Danza, L. Method for the prediction of malfunctions of buildings through real energy consumption analysis: Holistic and multi-disciplinary approach of energy signature. Energy Build. 2012, 55, 715–720. [Google Scholar] [CrossRef]
  67. Fumo, N.; Biswas, M.A.R. Regression analysis for prediction of residential energy consumption. Renew. Sustain. Energy Rev. 2015, 47, 332–343. [Google Scholar] [CrossRef]
  68. Arregi, B.; Garay, R. Regression analysis of the energy consumption of tertiary buildings. Energy Procedia 2017, 122, 9–14. [Google Scholar] [CrossRef] [Green Version]
Figure 1. Arial view of the location (a) and (b) the façade of the building
Energies 12 02210 g001
Figure 2. Experimental equipment for measurements of (a) IEQ and (b) electrical consumption within the building of B FEPA.
Energies 12 02210 g002
Figure 3. Monthly average T (°C) levels within the B FEPA building along with the respective limits.
Energies 12 02210 g003
Figure 4. Monthly average RH (%) levels within the B FEPA building along with the respective limits.
Energies 12 02210 g004
Figure 5. Daily behaviour of T (°C) levels within the B FEPA building along with the respective limits for a selected day of interest (May 7, 2018).
Energies 12 02210 g005
Figure 6. Boxplots of CO2 within each floor, for all experimental periods (April 2018–March 2019), along with the respective limit of exposure.
Energies 12 02210 g006
Figure 7. Boxplots of TVOC within each floor, for all experimental periods (April 2018–March 2019), along with the respective limit of exposure.
Energies 12 02210 g007
Figure 8. Monthly electrical consumption of B FEPA from April 2018 to January 2019.
Energies 12 02210 g008
Figure 9. Hourly electrical consumption along with ambient temperature levels.
Energies 12 02210 g009
Figure 10. Energy signature of the B FEPA building for the cooling period (April–October 2018).
Energies 12 02210 g010
Figure 11. Energy signature of the Β FEPA building for the heating period (November 2018–January 2019).
Energies 12 02210 g011
Table 1. Main geometrical characteristics of each block.
LocationArea ElevationElevationNumber of BedroomsPlanimetric Dimensions
Basement742 m22.60 m056.59 × 13.36 m2
Ground-floor725 m22.40 m3656.59 × 15.37 m2
First floor725 m22.40 m3656.59 × 15.37 m2
Second floor725 m22.40 m3656.59 × 15.37 m2
Third floor725 m22.40 m3656.59 × 15.37 m2
Table 2. Mean values and standard deviations of temperature (°C) and relative humidity (%) for each floor, for all experimental periods (April 2018–March 2019).
Experimental Site
MonthParameterGround Floor1st Floor2nd Floor3rd FloorOutdoors
AprilT (°C)24.69 ± 1.0722.00 ± 1.9923.01 ± 1.9124.94 ± 2.0921.68
RH (%)37.12 ± 4.8440.79 ± 6.3438.86 ± 5.7334.92 ± 4.5851.22
MayT (°C)25.58 ± 1.3823.85 ± 2.2924.64 ± 1.3926.12 ± 1.4023.13
RH (%)46.48 ± 7.2550.74 ± 11.3547.18 ± 7.8443.54 ± 7.0360.73
JuneT (°C)26.97 ± 1.1627.16 ± 1.7627.05 ± 1.9428.83 ± 1.5725.99
RH (%)43.30 ± 8.5644.64 ± 9.9144.91 ± 11.2341.07 ± 8.8757.25
JulyT (°C)27.86 ± 0.8229.03 ± 1.8129.46 ± 1.5832.11 ± 1.3628.67
RH (%)44.6 ± 5.5747.42 ± 8.6146.28 ± 8.0939.07 ± 6.5558.13
AugustT (°C)27.93 ± 0.7028.91 ± 1.3528.93 ± 1.2231.47 ± 0.9228.14
RH (%)40.02 ± 5.0742.30 ± 7.5541.73 ± 7.4436.41 ± 6.3253.59
SeptemberT (°C)26.54 ± 1.3526.94 ± 2.2526.13 ± 2.6228.72 ± 2.5924.85
RH (%)41.69 ± 6.7644.56 ± 9.0545.70 ± 9.6239.39 ± 0.9056.16
OctoberT (°C)23.7 ± 0.7222.00 ± 1.4621.79 ± 0.8523.43 ± 0.8919.60
RH (%)50.96 ± 7.4855.00 ± 9.1056.82 ± 8.7750.97 ± 8.4468.37
NovemberT (°C)22.87 ± 1.6019.66 ± 2.1221.14 ± 1.5319.49 ± 1.9215.90
RH (%)46.46 ± 6.3653.31 ± 8.3651.51 ± 6.9553.79 ± 7.8570.97
DecemberT (°C)22.57 ± 1.0518.10 ± 3.4619.79 ± 1.8918.81 ± 1.8610.89
RH (%)37.86 ± 4.3844.80 ± 8.2340.68 ± 6.0843.87 ± 3.3271.39
JanuaryT (°C)21.36 ± 1.9020.22 ± 3.3919.43 ± 2.2419.49 ± 1.479.66
RH (%)37.90 ± 5.4238.85 ± 8.5342.19 ± 6.9144.58 ± 6.2972.49
FebruaryT (°C)22.11 ± 1.5121.64 ± 2.1920.07 ± 1.6219.08 ± 2.0410.12
RH (%)37.04 ± 4.2736.38 ± 5.0041.67 ± 5.9541.97 ± 3.7471.03
MarchT (°C)24.30 ± 1.2523.13 ± 2.0322.33 ± 1.8322.14 ± 1.5213.51
RH (%)36.14 ± 3.1336.51 ± 4.9038.55 ± 4.8738.94 ± 4.3366.56
Table 3. Percentages of measured indoor temperature values within the recommended limit ranges.
MonthB FEPA Building (%)Ground Floor (%)1st Floor
(%)
2nd Floor
(%)
3rd Floor
(%)
April53.5787.1533.1545.7848.19
May53.6853.1847.5370.2243.79
June18.6317.7824.0328.753.97
July2.190.695.772.280.00
August1.080.542.021.750.00
September24.7635.6925.8125.8611.68
October47.4284.6229.653.6071.83
November44.5655.6240.6949.2232.69
December35.6456.4527.3849.099.64
January39.5149.0637.3738.133.53
February51.1162.6560.4252.3829.00
March43.3215.7134.2960.0063.3
Total34.6243.2630.6835.5928.97
Table 4. Descriptive statistics for CO2 in each floor, for all experimental periods (April 2018–March 2019).
StatisticsGround Floor
(ppm)
1st Floor (ppm)2nd Floor (ppm)3rd Floor (ppm)
Mean474442452461
Standard Deviation28264648
Coefficient of Variation5.91%5.88%10.18%10.41%
Minimum414401405395
Maximum799688698763
Percentiles25454425422433
50 (median)470434434445
75489450463468
Table 5. Descriptive statistics for TVOC in each floor, for all experimental periods (April 2018–March 2019).
StatisticsGround Floor
(ppm)
1st Floor (ppm)2nd Floor (ppm)3rd Floor (ppm)
Mean5.38<12.791.47
Standard Deviation2.31<13.171.66
Coefficient of Variation42.94%92.47%113.62%112.93%
Minimum1.54<1<1<1
Maximum22.8522.0128.2213.38
Percentiles253.72<1<1<1
50 (median)5.08<1<1<1
756.59<13.99<1

