Article

Integrating Two-Stage Phase Change Material Thermal Storage for Cascaded Waste Heat Recovery of Diesel-Engine-Powered Distributed Generation Systems: A Case Study

1
State Key Laboratory of Multi-Phase Complex Systems, Institute of Process Engineering, Chinese Academy of Sciences, Beijing 100190, China
2
School of Chemical Engineering, University of Birmingham, Edgbaston, Birmingham B15 2TT, UK
3
School of Engineering, University of Warwick, Coventry CV4 7AL, UK
*
Author to whom correspondence should be addressed.
Energies 2019, 12(11), 2121; https://doi.org/10.3390/en12112121
Submission received: 12 April 2019 / Revised: 28 May 2019 / Accepted: 29 May 2019 / Published: 3 June 2019
(This article belongs to the Section D: Energy Storage and Application)

Abstract

:
Thermal energy storage using the latent heat of phase change materials (PCMs) is a promising technique to solve the time mismatch between the availability and usage of flue gas heat in distributed generation systems (DGSs). A diesel-engine-powered DGS integrated with two-stage tube-type PCM modules for exhaust gas heat recovery was developed and studied. Energy and exergy analysis for the PCM storage unit was carried out to verify the effectiveness of the PCM modules for heat recovery and to highlight the merits of the cascaded configuration through a practical engineering case. Furthermore, the performance of the DGS was evaluated to study the contribution of PCM storage to improving system efficiency. The results showed that 56.4% energy and 48.3% exergy of the input flue gas were stored by the two-stage storage unit. Additional integration of the low-temperature PCM module to the high-temperature module improved the average storage efficiency from 33.6% to 62.3% for energy and 33.1% to 50.8% for exergy. By utilizing the stored energy for heating water, the thermal efficiency of the diesel engine was increased from the original 35.8% to 41.9%, while the exergy efficiency was improved from 29.5% to 29.7%.

1. Introduction

Distributed generation systems (DGSs) with an internal combustion engine as the prime mover are recognized as an effective way to utilize fuel energy and reduce greenhouse gas emissions [1,2]. In addition to electricity generation, the exhaust gas heat from the engine can be recovered by various techniques such as the Rankine cycle [3,4,5], heat exchangers [6,7,8], thermoelectric generators [9,10], and so forth. However, the availability and usage of waste heat are often unsynchronized in time, and such a mismatch will reduce the overall efficiency of heat recovery and fuel utilization. The key to solving the problem is to detach the time of heat generation and consumption by integrating an energy buffer between supply and demand, that is, introducing thermal storage to DGSs [11].
Using the latent heat of phase change materials (PCMs) is a proven efficient thermal energy storage method [12]. Compared with sensible energy storage, the latent scenario has high storage density with relatively stable energy storage/release temperatures. Hence, many studies have been conducted using PCM storage for temperature regulation of buildings [13,14], solar energy recycling [15,16], and thermal management of electric vehicles [17] and electronic chips [18]. To improve the performance of a latent thermal storage system, cascaded storage arranged in series according to the melting temperatures of PCMs has been further studied. A numerical investigation of a molten-salt packed-bed PCM system was carried out and indicated that the multi-PCM unit achieved a considerably higher heat transfer rate than the single configuration by maintaining the temperature difference between the heat transfer fluid (HTF) and PCM [19]. The same conclusion was obtained and proved by an experimental study where a two-stage PCM tank with hydroquinone and d-mannitol was tested [20]. An increase by a factor of 4 was achieved in the average heat transfer rate by the implementation of multiple PCM configurations. Solomon and Oztekin [21] and Shamsi et al. [22] observed better thermal performance in the cascade system over that of a single-PCM case by simulation analysis. Compared with the single-PCM system equipped with encapsulated NaNO3, more energy could be stored and released by the cascaded system by integrating NaNO2 and ZnCl2 storage units, respectively. Yuan et al. [23] established an experimental cascaded system equipped with K2CO3, Li2CO3, and Na2CO3. The operation result verified that the overall heat storage and release quantities of the cascaded system were higher than those of the noncascaded system by 39.51% and 35.74% at most. For the optimal use of the multi-PCM storage system, Aldoss and Rahman [24] investigated the effect of the stage number of the PCM unit on system performance. The results indicated that although the performance of the storage system improved as the number of stages increased, using more than three stages did not add a significant improvement. Xu et al. [25] and Xu and Zhao [26] further simulated and discussed the influence of the inlet temperature of HTF and the number of heat transfer units (NTUs) on storage system efficiency. With an increase in inlet HTF temperature and NTU, improvements in both energy and exergy efficiencies of the storage system could be achieved.
Considering the advantages of cascaded PCM storage, integration of multi-PCM modules to manage the exhaust gas heat in DGSs is beneficial to maintain the balance between the user demand and system output, and it ultimately optimizes the usage of fossil fuels. In order to fill the gap between practical demonstrations and theoretical attempts regarding this concept, in the present work, a DGS integrating two-stage PCM thermal storage was developed in a manufacturing plant in China. A tube-type structure characterized by good heat transfer performance, in consideration of both the compactness factor and thermal resistance, was adopted by the PCM modules [27,28]. The waste heat recovery of the flue gas from a diesel engine was implemented according to a typical production scheme of the plant. The energy and exergy analysis of the storage unit was carried out to demonstrate the merits of the cascaded PCM configuration. In addition, an overall efficiency investigation for the DGS was conducted to emphasize the contribution of latent heat storage to improving system performance.

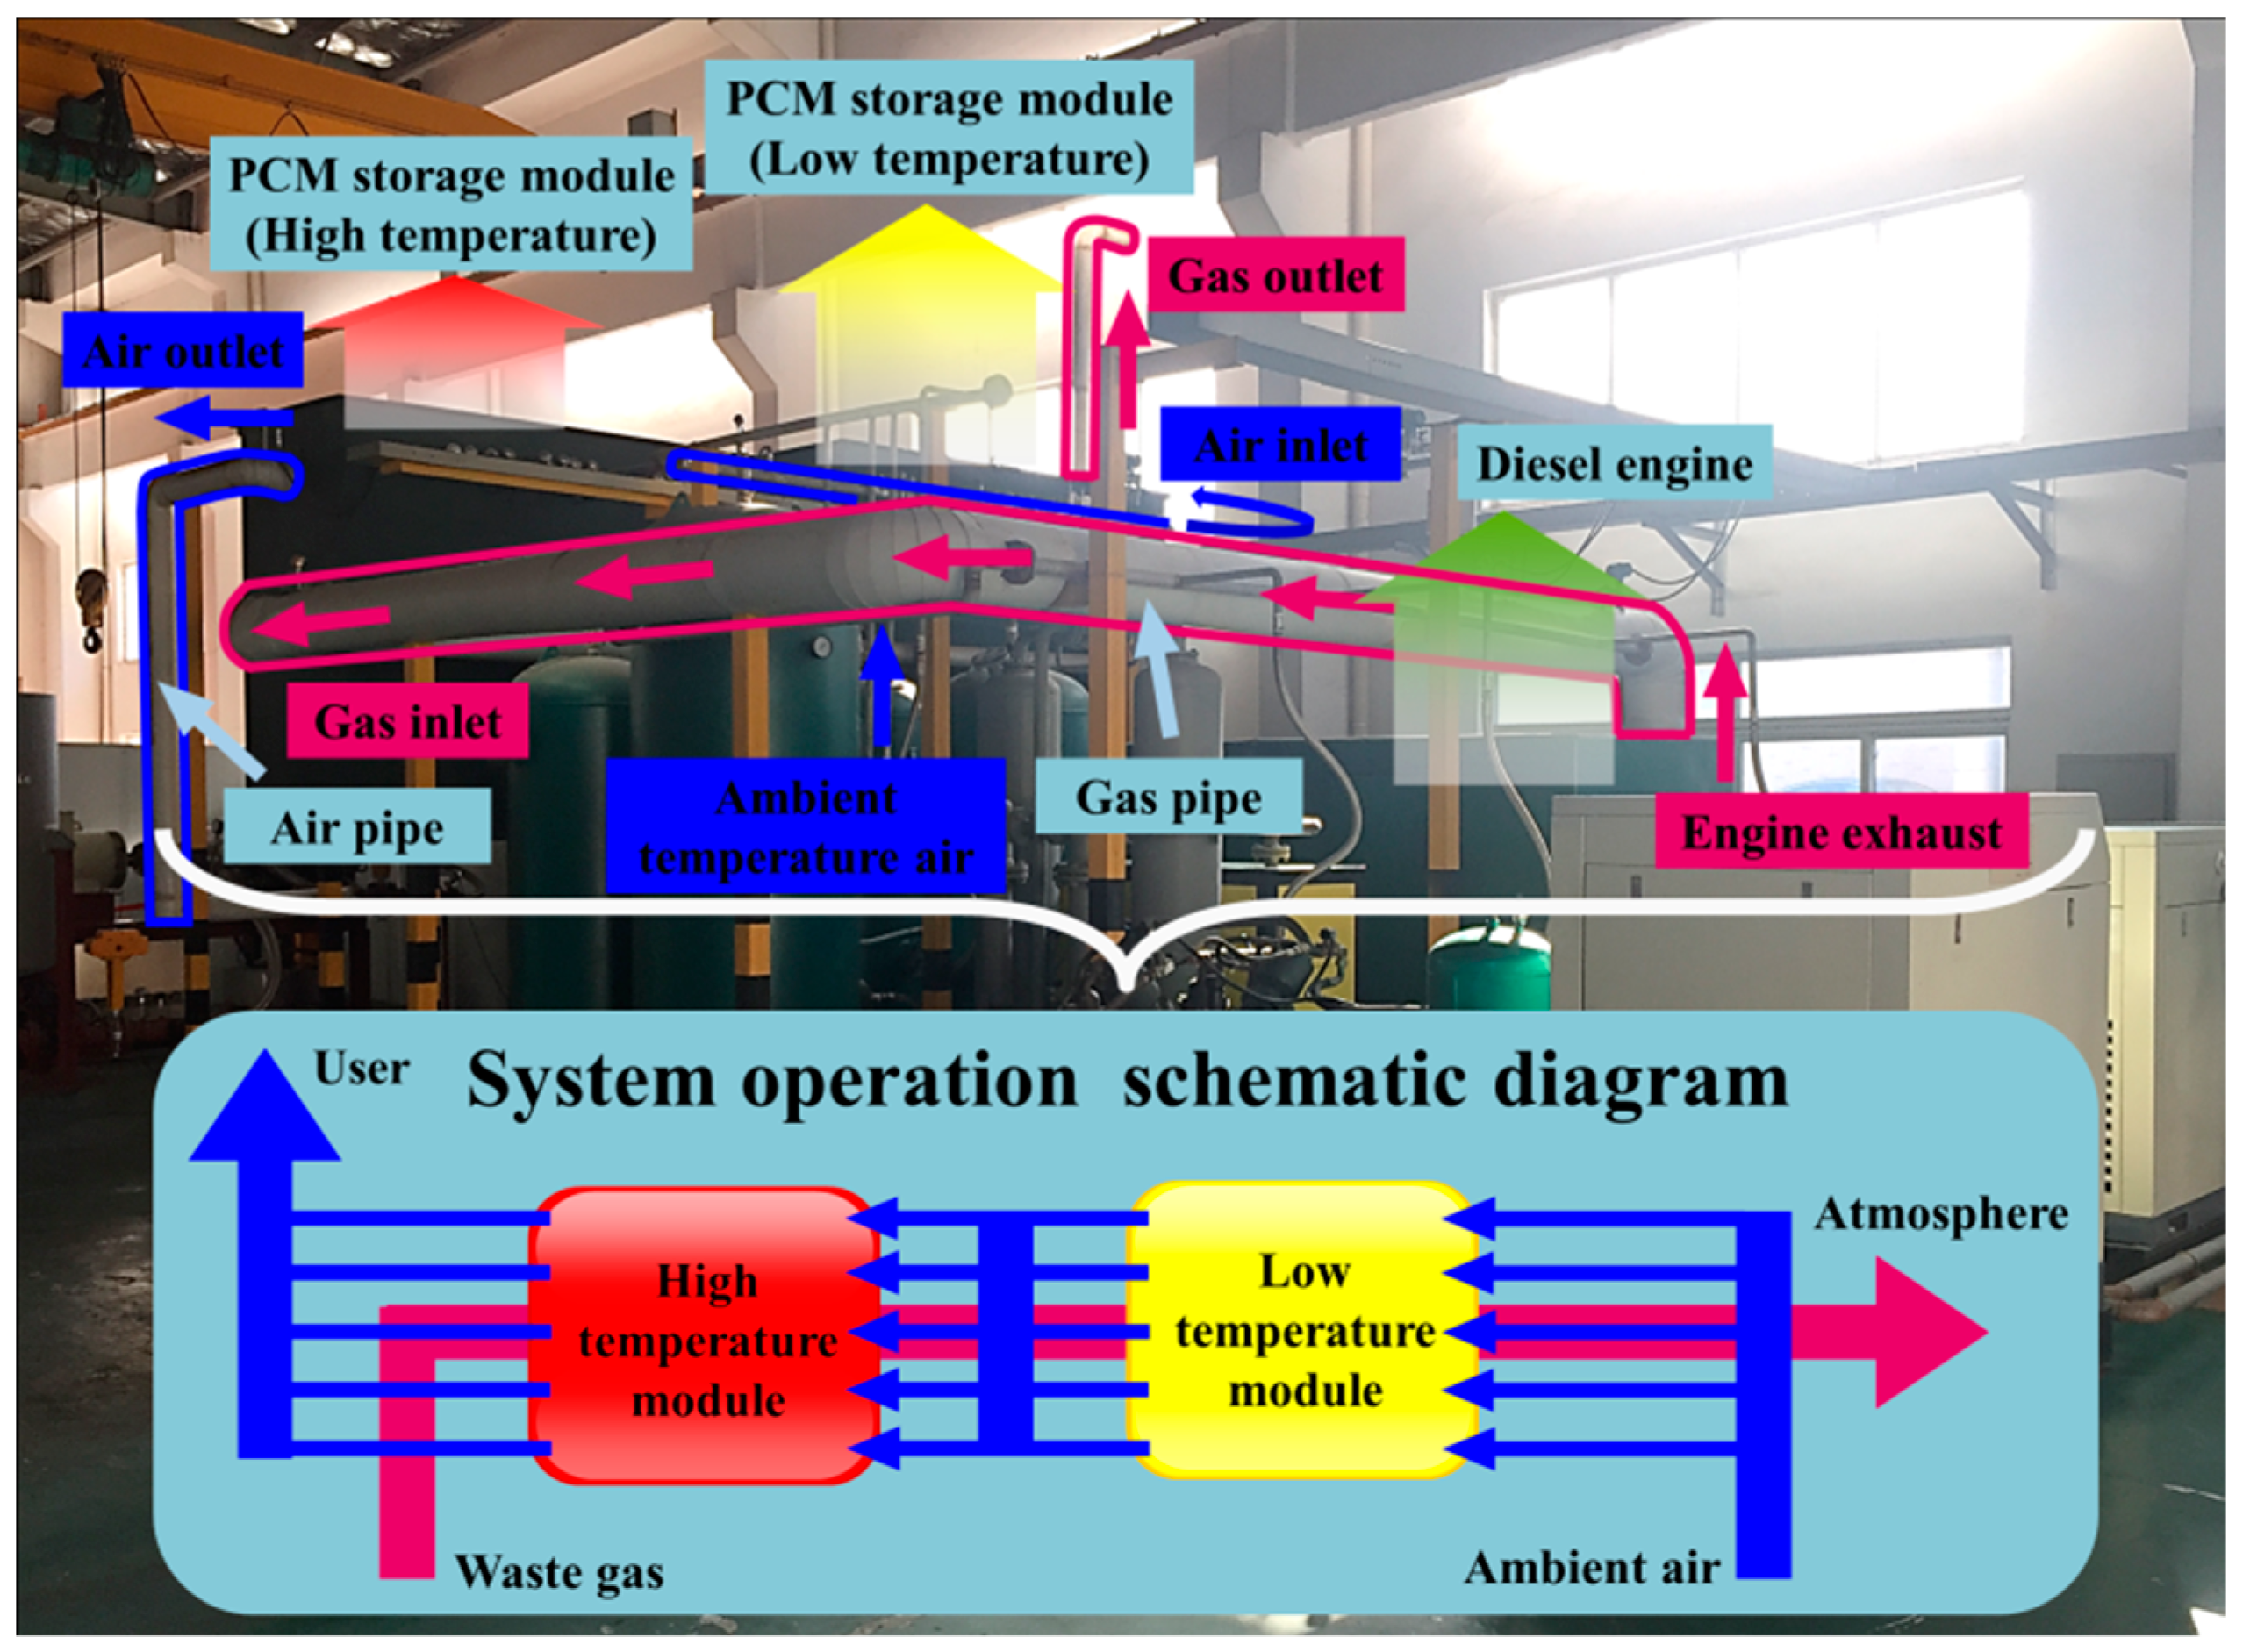
2. Demonstration Study

As shown in Figure 1, the demonstration system located in a manufacturing plant in Southern China was mainly composed of a diesel engine and a two-stage PCM storage module. Referring to the daily production scheme of the plant shown in Figure 2, by the end of the preparation process, the diesel engine started to run at a stable load from the warm-up state to drive the production line. After 5.5 h, the production ended and the generator ceased serving. The heat demand from the workers for washing and cleaning emerged about 0.5 h later and lasted 3 h. Referring to Figure 1, during the charging process, the flue gas exhausted by the engine entered the high-temperature storage module (HTM) and the low-temperature storage module (LTM) in sequence induced by the draft fan installed at the gas outlet of the LTM. Cascaded heat storage was performed according to the temperature gradient. During the discharging process, by the blower located at the air inlet of the LTM, ambient-temperature air flowed into the opposite direction and absorbed the heat stored in the two modules to supply thermal energy for heating water. The fan and blower operating under the rated power could ensure the smooth circulation of the HTF, and the corresponding consumed power and the influence of pressure drop caused by the flow resistance on the system efficiency evaluation were neglected in the current case study.

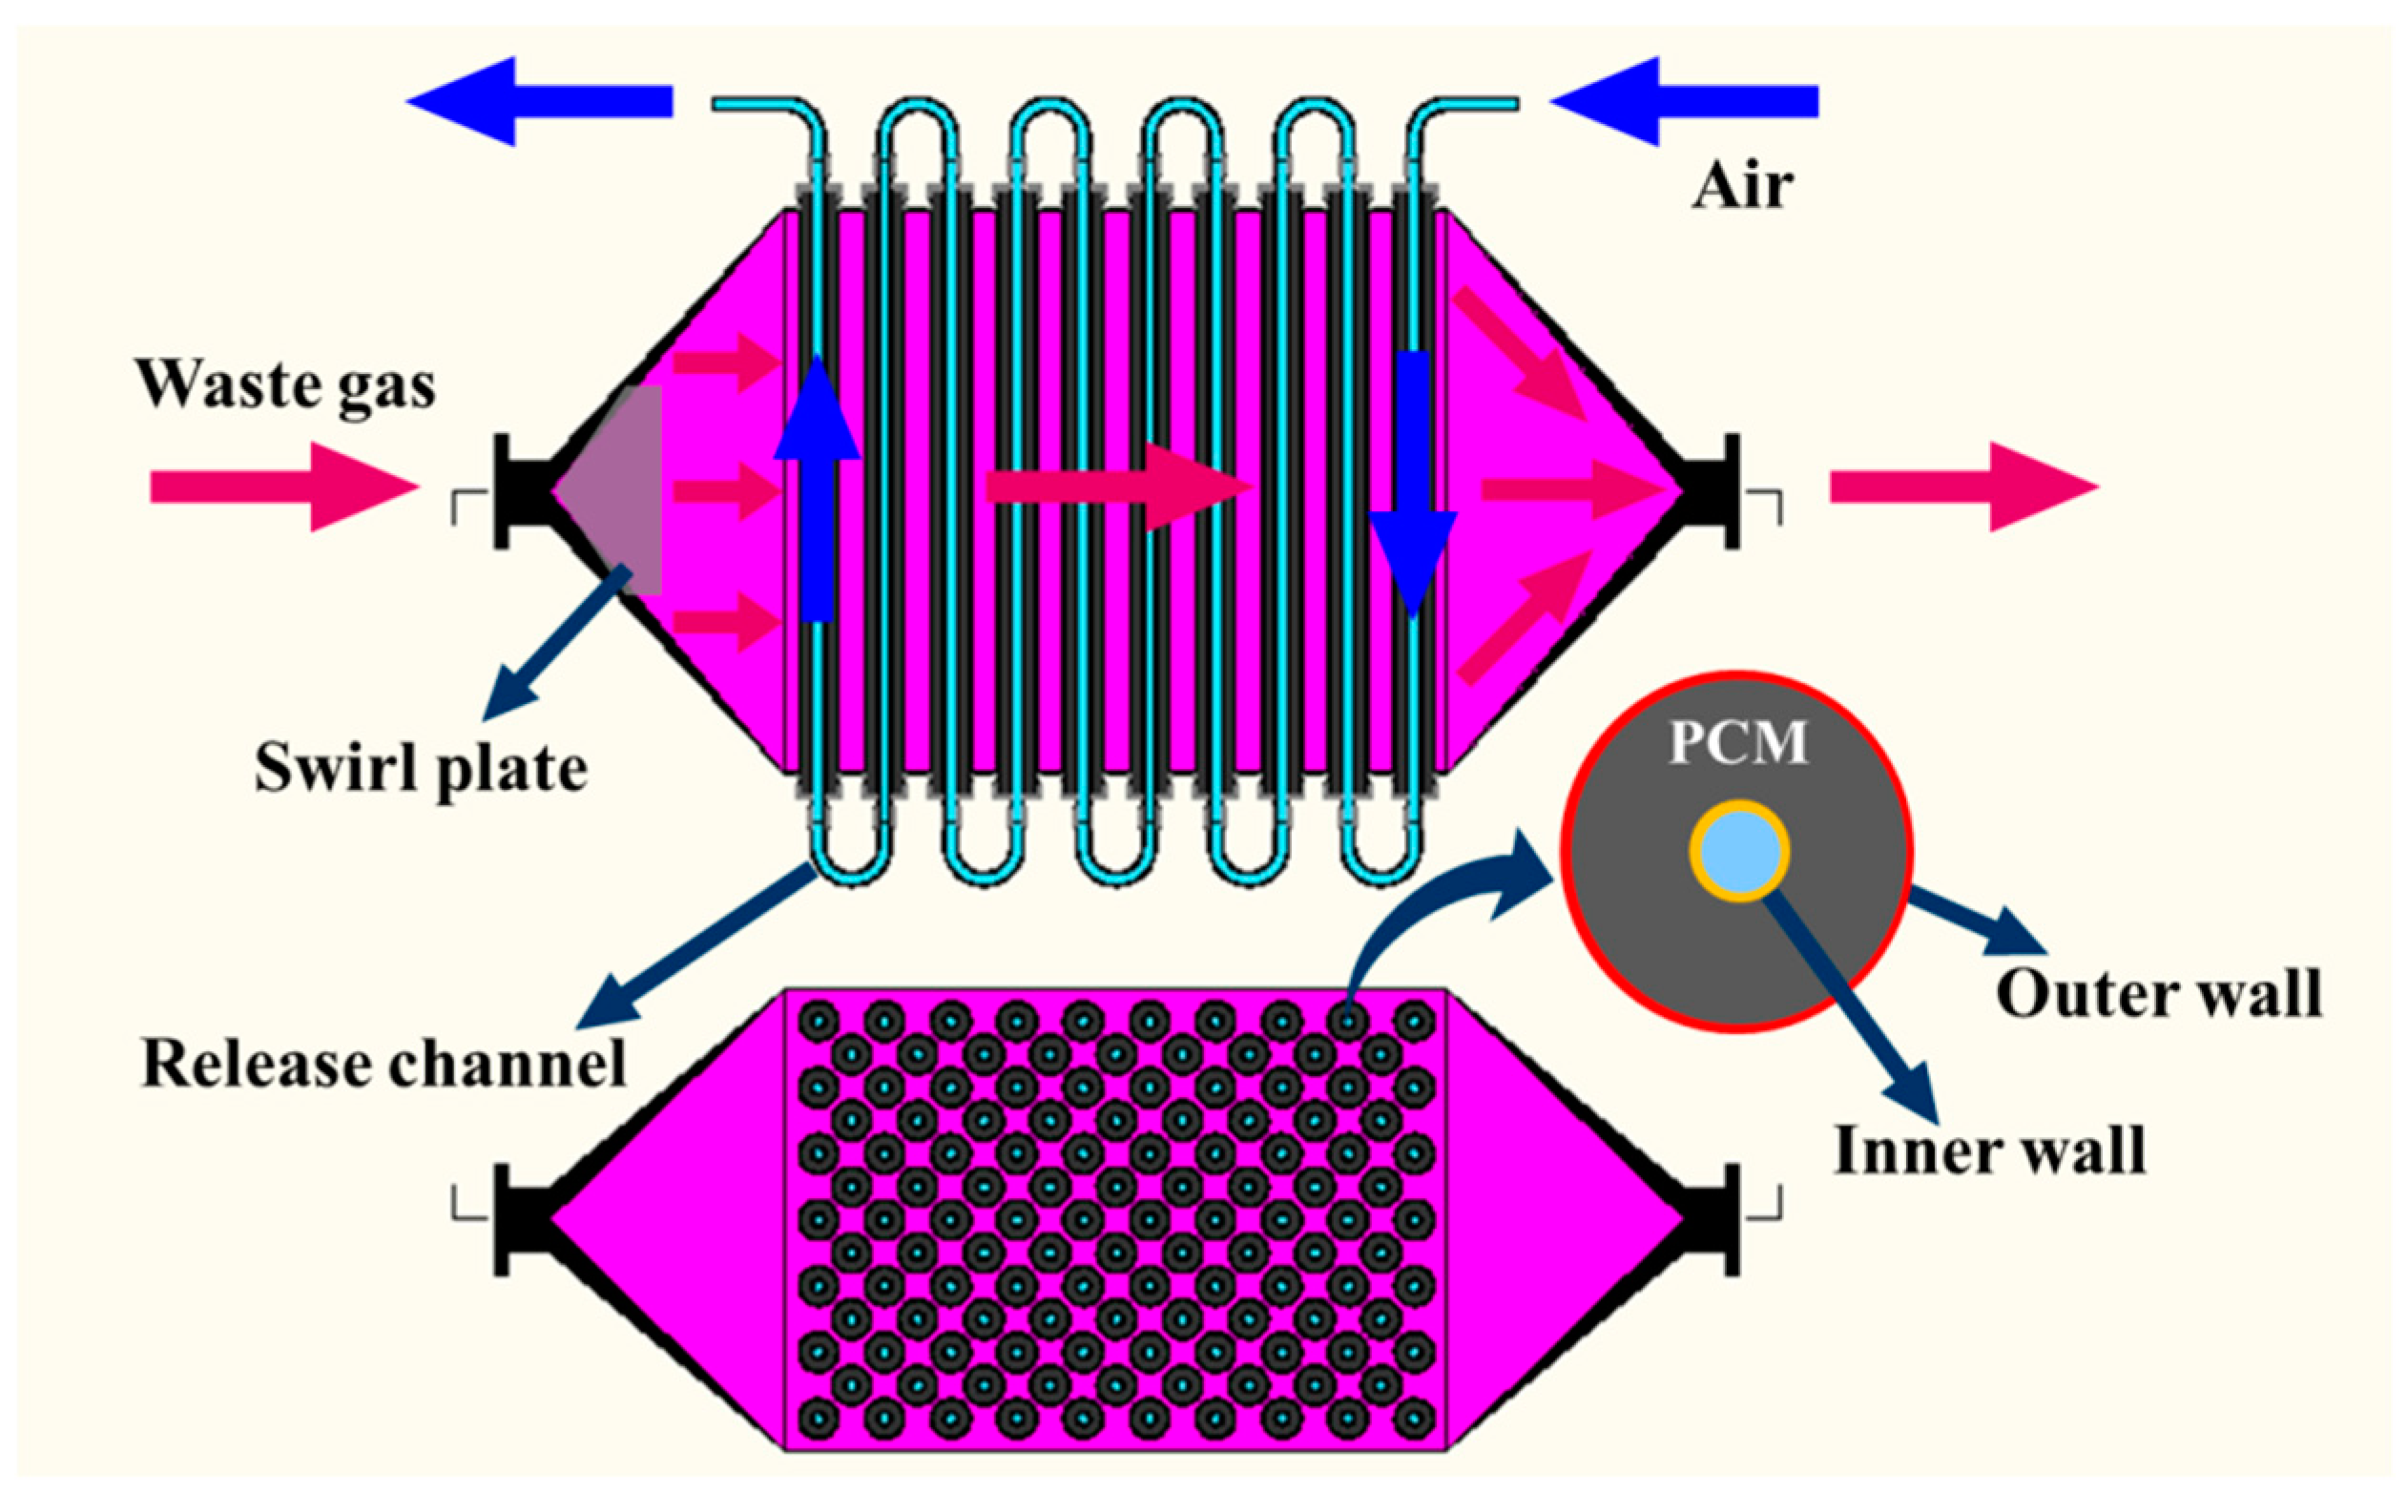
2.1. System Components

(1) Power generation unit: a diesel generator (maximum power output = 200 kW) consumed fuel to generate electrical power with stable voltage and frequency. Table 1 shows the temperature and flow rate of the discharged gas, as well as the fuel consumption of the diesel engine measured at steady state under various loads. About 12–27% of the thermal energy from the fuel combustion was exhausted by the flue gas when the load changed from 16 to 192 kW. Recovering this part of abandoned energy is essential to improve the efficiency of the diesel engine. According to the calculation results using Equation (1) shown in Figure 3, the operation efficiency of the diesel engine improved as the load increased and could maintain a relatively high value when the load was close to the rated condition. In this case study, the power output of the engine was set as 176 kW for driving the production process composed of 11 loads, where each load was 16 kW.
η diesel ther = P diesel / ϕ V fuel ρ fuel L H V = η diesel elec ϕ
where η diesel ther and η diesel elec denote the thermal and electric efficiency of the diesel engine, respectively; Pdiesel and Vfuel denote the power output and fuel flow consumption of the engine; ρfuel = 8.5 × 10² kg m−3 and LHV = 43.4 × 10³ kJ kg−1 denote the density and lower heating value of fuel, respectively; and φ = 85% is the efficiency of the generator.
The exergy input of the fuel (diesel oil) to the DGS can be approximately obtained by [29,30]
E x fuel = 1.0338 V fuel ρ fuel L H V
and the exergy efficiency of the diesel engine can be calculated by
η diesel exergy = P diesel E x fuel .
(2) Cascaded PCM storage unit: transferring gas heat to a tube-type PCM exchanger via convection is an effective approach applied in latent storage systems [27,28,31,32,33]. Good transfer performance can be achieved considering both the compactness factor and the thermal resistance in this configuration. Referring to Figure 4, a dual-channel module based on the structure of the double tube exchanger was designed to separate the channels of charging and discharging in order to obtain a clean HTF for residential usage. Composite PCMs were synthesized using carbonate and nitrate and equipped in the space between the inner and outer wall of the tubes to form HTM and LTM, respectively. The main physical properties of the PCMs are shown in Table 2. A swirl plate was installed at the waste gas inlet of the module to produce a uniform flow for heat transfer. When the flue gas entered the module, the convection heat transfer was dominant between the gas and outer wall of the steel tubes, which were arranged in a staggered manner. Then, the heat was transmitted to the PCMs by conduction. The release channel was located in the center of the tube and the stored thermal energy could be discharged by the heat transfer between the ambient air and the inner wall of the tubes. The released thermal energy was used to heat water to 315 K by the air–water heat exchanger, the efficiency of which could reach 98.5%. The pipes for the HTF transmission and the outer casings of the modules were insulated to reduce heat loss to the surroundings.
Based on the standard size of the seamless tube and the produced PCM shape, the PCM tube, the outer and inner diameters of which were Φ88 × 4 and Φ30 × 3, respectively, was manufactured to form the storage modules. The mass of PCMs and steel used in an individual tube was 7.46 and 12.34 kg for HTM and 10.37 and 15.43 kg for LTM. The heat stored in the steel cannot be ignored when evaluating the performance of the storage unit. Therefore, the PCMs and steel tubes were considered as the main storage component of the module in the current study. Referring to Table 1, the stable temperature of the exhaust flue gas at a load of 176 kW reached 883 K. Assuming that the average difference between the inlet and outlet gas temperatures of the module in the storage process was 250 K after the stabilization process (approx. 1 h), the number of tubes in the module could be estimated by the following equation when the heat transfer efficiency γ was set as 60%:
N = m gas c gas | 1 2 ( T gas in + T gas out ) Δ T gas γ m pcm ( c pcm Δ T mod + H pcm ψ ) + m tube c tube Δ T mod N r
where mgas and cgas denote the mass and specific heat capacity of the flue gas, respectively; T gas in and T gas out denote the inlet and outlet gas temperature of the module, respectively; ΔTgas denotes the temperature difference of the gas which was assumed as 250 K; mpcm and mtube denote the mass of the PCMs and steel tube, respectively; cpcm and ctube denote the specific heat capacity of the PCMs and steel tube, respectively; ΔTmod denotes the temperature increase of the module, which was set as 300 and 100 K for the HTM and LTM, respectively; ψ = 70% denotes the usage rate of the latent heat; and Nr = 1.1 denotes the redundant factor. Details of the storage modules are listed in Table 3.
A data acquisition platform based on the National Instrument (NI) hardware was designed for the storage modules and the arrangement of the measurement points are shown in Figure 5. For each module, nine K-type thermocouples, namely, Front (A–C), Middle (A–C), and Back (A–C) were placed in the axial geometric center of the tubes for monitoring the temperature variation of the PCMs. The additional three points, Passage (A–C), were placed in the vertical center plane of the module chamber to study the profile of the flue gas temperature.

2.2. Methodology

Based on energy conservation, the following equation could be obtained for the assumed period of time during the heat charging and discharging processes:
{ charging : Q gas in Q gas out = Q mod sto + Q gas sto + Q loss discharging : Q air out Q air in = Q mod rel + Q gas rel Q loss
where Q gas in denotes the input gas heat to the module; Q gas out denotes the gas heat flowing out of the module; Q mod sto and Q gas sto denote the thermal energy stored by the PCM tubes and the gas inside the module, respectively; Q air out denotes the air heat flowing out of the module; Q air in denotes the input air heat to the module; Q mod rel and Q gas rel denote the thermal energy released by the PCM tubes and the gas inside the module, respectively; and Qloss denotes the heat dissipated into the surroundings. Among these, the energy stored or released by the modules and HTF for a certain duration could be obtained simply according to their initial and end temperature data by avoiding the consideration of the complex heat transfer process and heat loss assessment in the system-level apparatus. Similarly, for the energy quality analysis, although there was exergy deterioration caused by the temperature difference, the evaluation of the total exergy possessed by the modules and the available exergy for the user could be carried out using the measured temperature status. The modeling approach has been recognized as an appropriate method to conduct total energy and exergy analysis for a latent storage system [34,35].

2.2.1. Charging Process

Referring to Figure 6, the following aspects should be considered for the initial stage of the charging process when the temperature of the module is close to the ambient temperature:
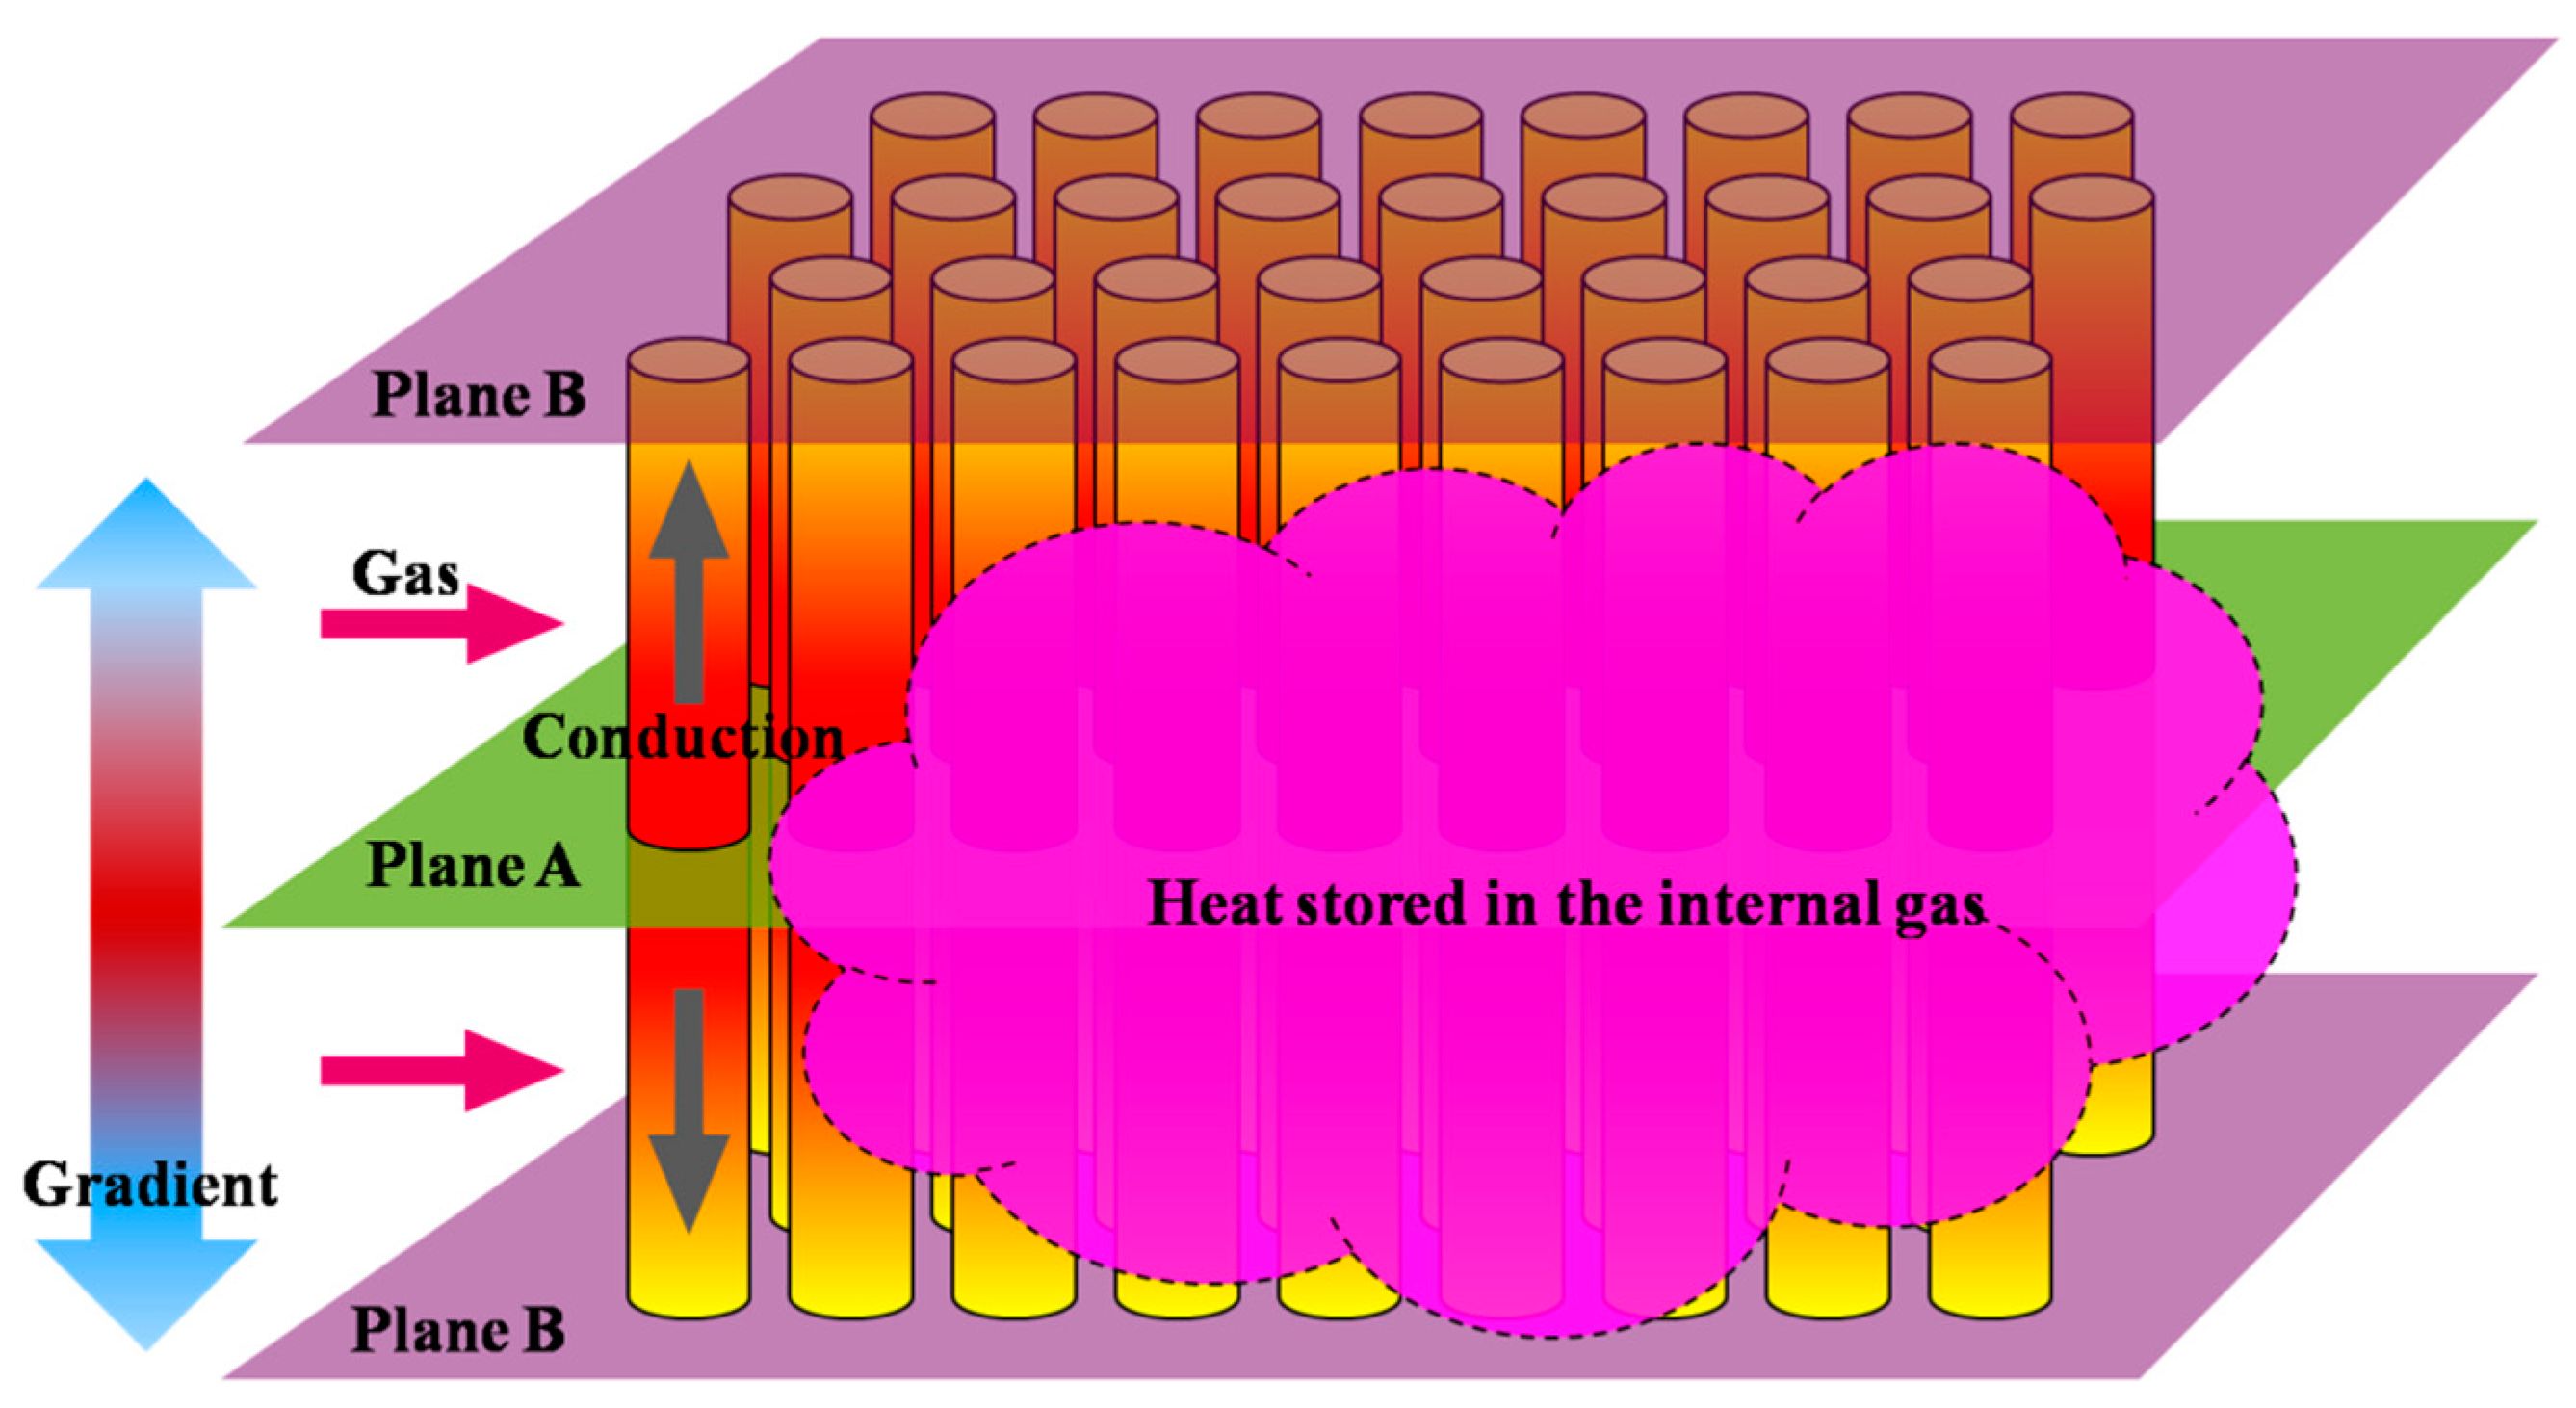
  • Part of the input heat will be transferred to the internal gas in the module because of the relatively small thermal resistance compared with the convective resistance between the HTF and tubes.
  • Due to the temperature gradient of the inlet gas in the axial direction, there are differences in the thermal energy flow passing through the radial planes (i.e., Planes A and B).
  • The resistance of heat conduction inside the tube exists and the temperature uniformity of the tube takes time to reach.
Therefore, it is not suitable to evaluate the overall heat storage state of the tubes by the PCM temperature at the axial center of the tube due to the uneven temperature distribution in this direction.
Considering the relatively low temperature of the module in the initial storage process, the heat that dissipated into the surroundings from the module was assumed to be zero under the function of the outer casing insulation, and the following equation is given to characterize the thermal storage status:
Q mod sto = j = 1 X ( Q gas in - j Q gas out - j Q gas sto - j )
where X denotes the total number of measurement period j during charging, and Q gas sto can be evaluated using the HTF temperature at the measurement points (average temperature of Passages A–C).
When the temperature distribution in the tube reached a uniform state (the temperatures of the PCMs and steel were considered to be equal in each tube), the total energy and exergy stored in an individual tube could be calculated by Equations (7) and (8):
Q sto i = { ( m pcm i c pcm s + m tube i c tube ) ( T pcm T pcm 0 ) | T pcm < T s pc start _ m pcm i c pcm s ( T s pc start T pcm 0 ) + m tube i c tube ( T pcm T pcm 0 ) + + m pcm i H pcm ( ( T pcm T s pc start ) / ( T s pc end T s pc start ) ) | T s pc start T pcm T s pc end _ m pcm i c pcm s ( T s pc start T pcm 0 ) + m tube i c tube ( T pcm T pcm 0 ) + + m pcm i H pcm + m pcm i c pcm l ( T pcm T s pc end ) | T pcm > T s pc end _
E x sto i = { ( m pcm i c pcm s + m tube i c tube ) [ ( T pcm T pcm 0 ) T 0 ln ( T pcm / T pcm 0 ) ] | T pcm < T s pc start _ m pcm i c pcm s [ ( T s pc start T pcm 0 ) T 0 ln ( T s pc start / T pcm 0 ) ] + + m tube i c tube [ ( T pcm T pcm 0 ) T 0 ln ( T pcm / T pcm 0 ) ] + + m pcm i H pcm ( ( T pcm T s pc start ) / ( T s pc end T s pc start ) ) ( 1 T 0 / T pc ) | T s pc start T pcm T s pc end _ m pcm i c pcm s [ ( T s pc start T pcm 0 ) T 0 ln ( T s pc start / T pcm 0 ) ] + + m tube i c tube [ ( T pcm T pcm 0 ) T 0 ln ( T pcm / T pcm 0 ) ] + + m pcm i H pcm ( 1 T 0 / T pc ) + + m pcm i c pcm l [ ( T pcm T s pc end ) T 0 ln ( T pcm / T s pc end ) ] | T pcm > T s pc end _
where Tpcm and T pcm 0 denote the current and initial temperature of the PCM, respectively; T0 denotes the ambient temperature taken as 293 K; T s pc start and T s pc end denote the start and end temperatures of the solid–liquid phase change, respectively; and Hpcm and Tpc denote the phase change enthalpy and phase change temperature of the PCM, respectively. The energy and exergy stored by the whole module can be represented by
{ Q mod sto = i = 1 N Q sto i E x mod sto = i = 1 N E x sto i .
To simplify the evaluation of the quantity and quality of the thermal energy stored in the module, it was assumed that the uniform temperature inside the tube could be achieved when the Q mod sto calculated by Equations (6) and (9) were equal.
On the other hand, the input energy and exergy possessed by the HTF to the storage unit is given by Equation (10):
{ Q gas in = j = 1 X ρ gas V gas t j c gas ( T gas in - j T 0 ) E x gas in = j = 1 X ρ gas V gas t j c gas [ ( T gas in - j T 0 ) T 0 ln ( T gas in - j / T 0 ) ]
where ρgas denotes the density of the flue gas, and Vgas and T gas in denote the flow rate and temperature of gas input to the module in the charging process, respectively. The energy and exergy efficiency of the storage process can be defined by
{ η Q sto = Q mod sto / Q gas in η E x sto = E x mod sto / E x gas in
where, for example, the energy storage efficiency η Q sto is the ratio between the total heat stored by the module and the input gas heat.

2.2.2. Discharging Process

Assuming that the heat release is carried out with a uniform temperature distribution in each tube (initial temperature of PCMs T pcm 0 > T l pc start ), the total energy and exergy discharged from an individual tube can be represented by the following Equations (12) and (13):
Q rel i = { ( m pcm i c pcm l + m tube i c tube ) ( T pcm 0 T pcm ) | T pcm > T l pc start _ m pcm i c pcm l ( T pcm 0 T l pc start ) + m tube i c tube ( T pcm 0 T pcm ) + + m pcm i H pcm ( ( T l pc start T pcm ) / ( T l pc start T l pc end ) ) | T l pc end T pcm T l pc start _ m pcm i c pcm l ( T pcm 0 T l pc start ) + m tube i c tube ( T pcm 0 T pcm ) + + m pcm i H pcm + m pcm i c pcm s ( T l pc end T pcm ) | T pcm < T l pc end _
E x rel i = { ( m pcm i c pcm l + m tube i c tube ) [ ( T pcm 0 T pcm ) T 0 ln ( T pcm 0 / T pcm ) ] | T pcm > T l pc start _ m pcm i c pcm l [ ( T pcm 0 T l pc start ) T 0 ln ( T pcm 0 / T l pc start ) ] + + m tube i c tube [ ( T pcm 0 T pcm ) T 0 ln ( T pcm 0 / T pcm ) ] + + m pcm i H pcm ( ( T l pc start T pcm ) / ( T l pc start T l pc end ) ) ( 1 T 0 / T pc ) | T l pc end T pcm T l pc start _ m pcm i c pcm l [ ( T pcm 0 T l pc start ) T 0 ln ( T pcm 0 / T l pc start ) ] + + m tube i c tube [ ( T pcm 0 T pcm ) T 0 ln ( T pcm 0 / T pcm ) ] + + m pcm i H pcm ( 1 T 0 / T pc ) + + m pcm i c pcm s [ ( T l pc end T pcm ) T 0 ln ( T l pc end / T pcm ) ] | T pcm < T l pc end _
where T l pc start and T l pc end denote the start and end temperature of liquid–solid phase change, respectively.
The energy and exergy of the HTF absorbed from the module are given by Equation (14)
{ Q air rel = k = 1 Y ρ air V air t k c air ( T air out - k T air in ) E x air rel = k = 1 Y ρ air V air t k c air [ ( T air out - k T air in ) T 0 ln ( T air out - k / T air in ) ]
where Y denotes the total number of measurement period k during discharging; ρair and cair denote the density and specific heat of the air; and Vair and T air in denote the flow rate and temperature of air input to the LTM in the discharging process. Then, the energy and exergy efficiency of the release process is defined by the following equation:
{ η Q rel = Q air rel / Q mod sto η E x rel = E x air rel / E x mod sto
where, for example, the energy release efficiency η Q rel is the ratio between the total heat absorbed by the air from the module and the total heat stored in the module during the charging process.
It is worth noting that the transient model of the thermal storage system should be based on the energy conservation law, so that could refer to the relationship between heat rate, enthalpy rate of flue gas, and rate of the enthalpy change of the module material and PCM material. The proposed approach may be treated as a kind simplification of this transient model.

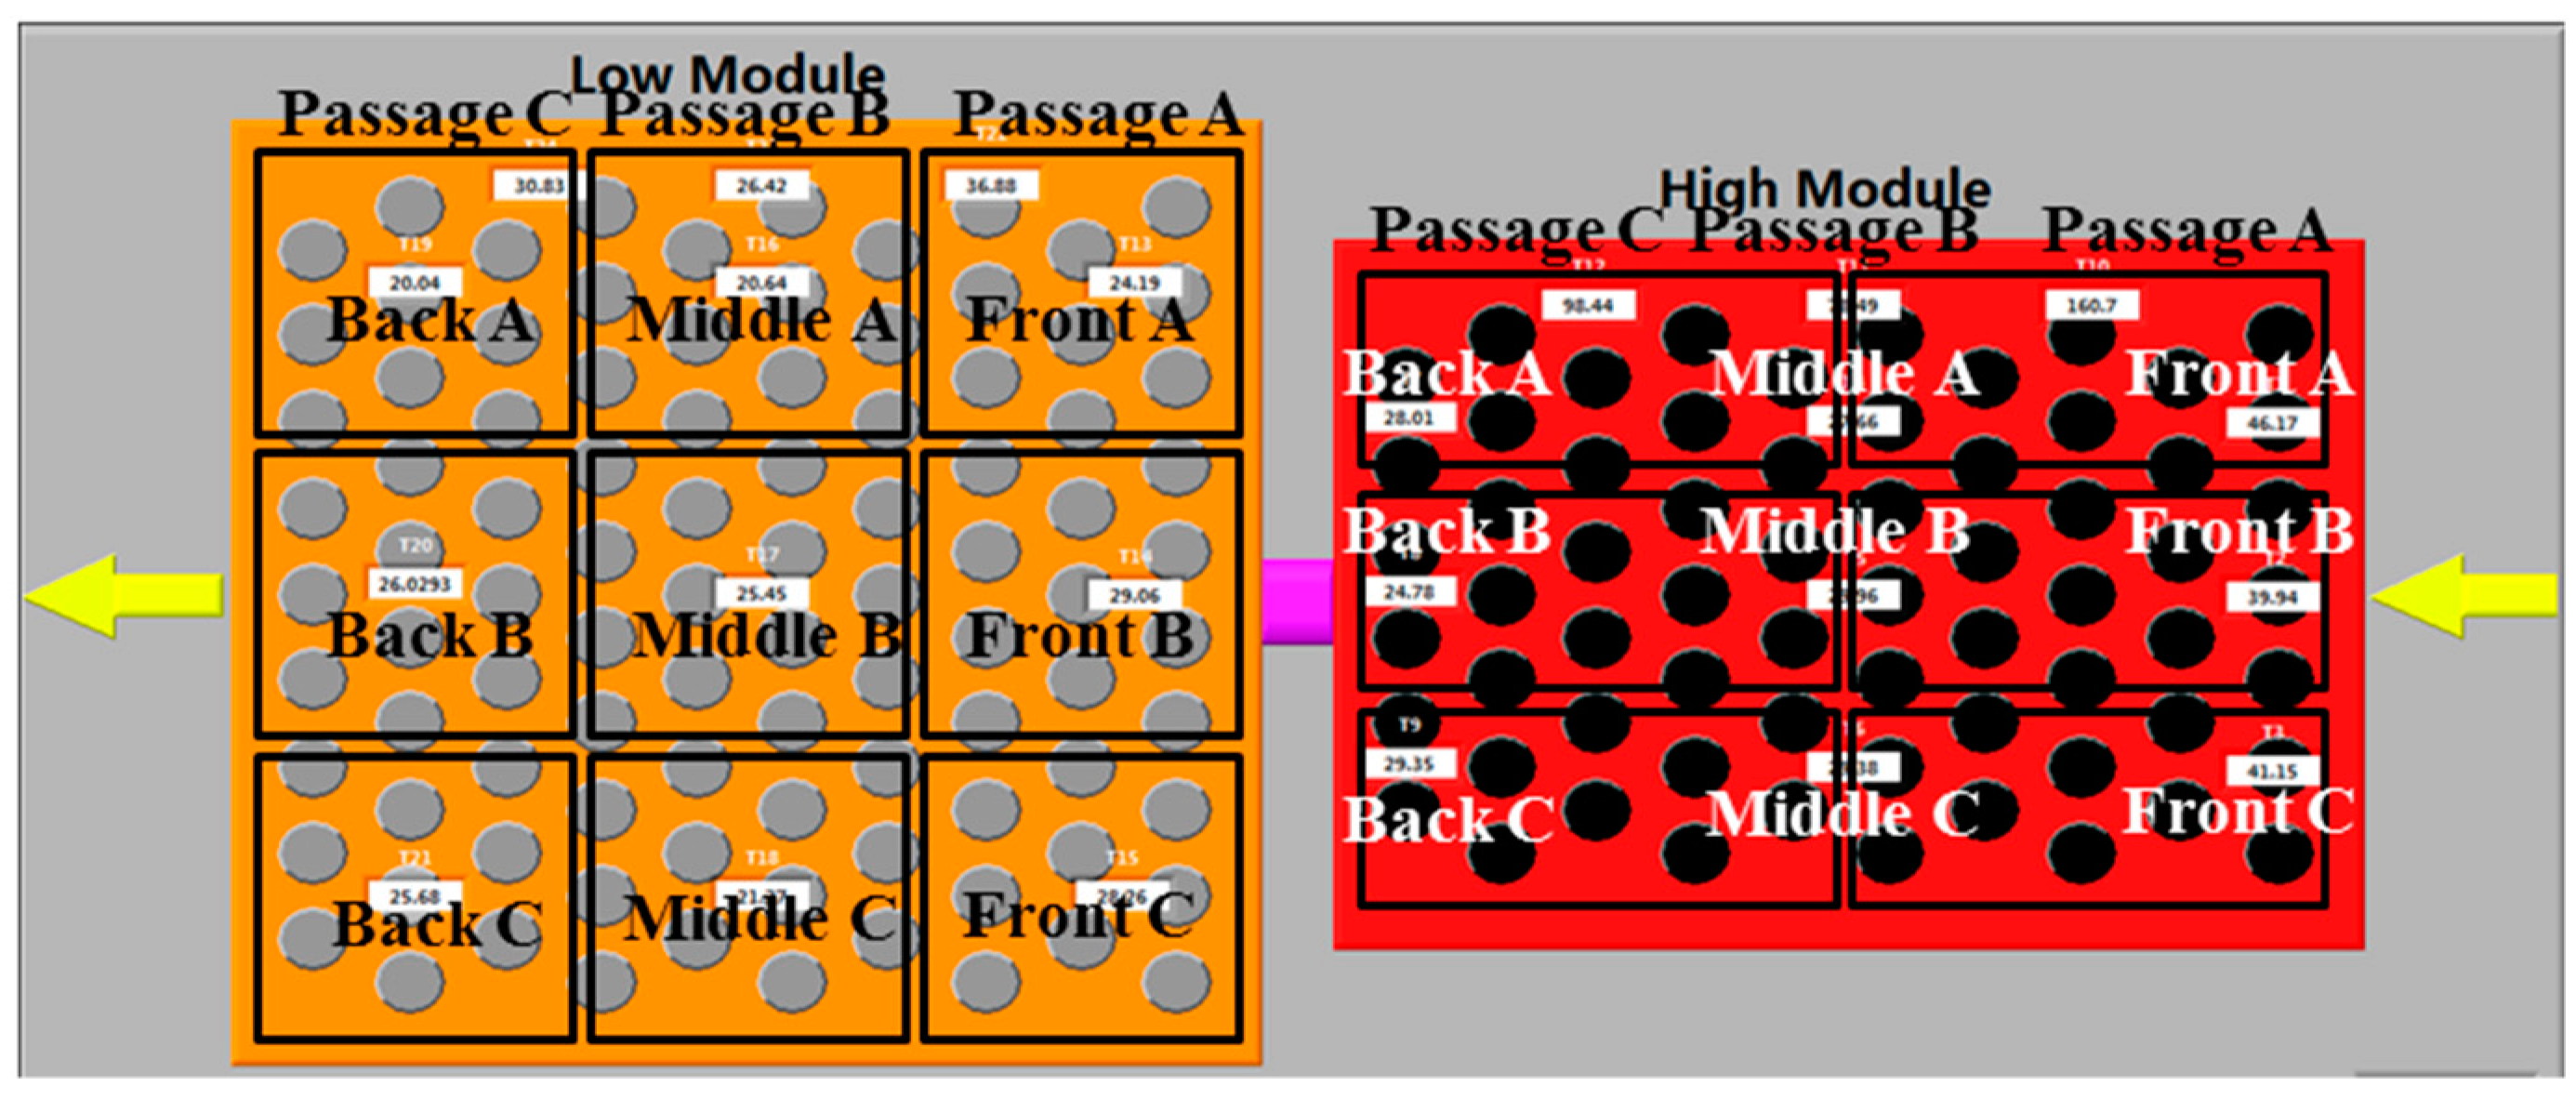
3. Results and Discussion

Experimental investigations were performed according to the DGS operation scheme shown in Figure 2. The temperature profiles of the PCMs and HTF over time during the charging and discharging processes were mainly studied after calibrating. Then, the energy and exergy analysis for the cascaded storage unit was implemented and the efficiency evaluation of the DGS was carried out. The main factors that affected the experimental results were the possible errors in the measurement of PCM temperature (U1), HTF temperature (U2), flow rate (U3), the mass of PCMs (U4), and phase change enthalpy (U5). As shown in Table 4, the standard uncertainties presented in the measurements were determined according to the verification report of the sensors and measuring devices.

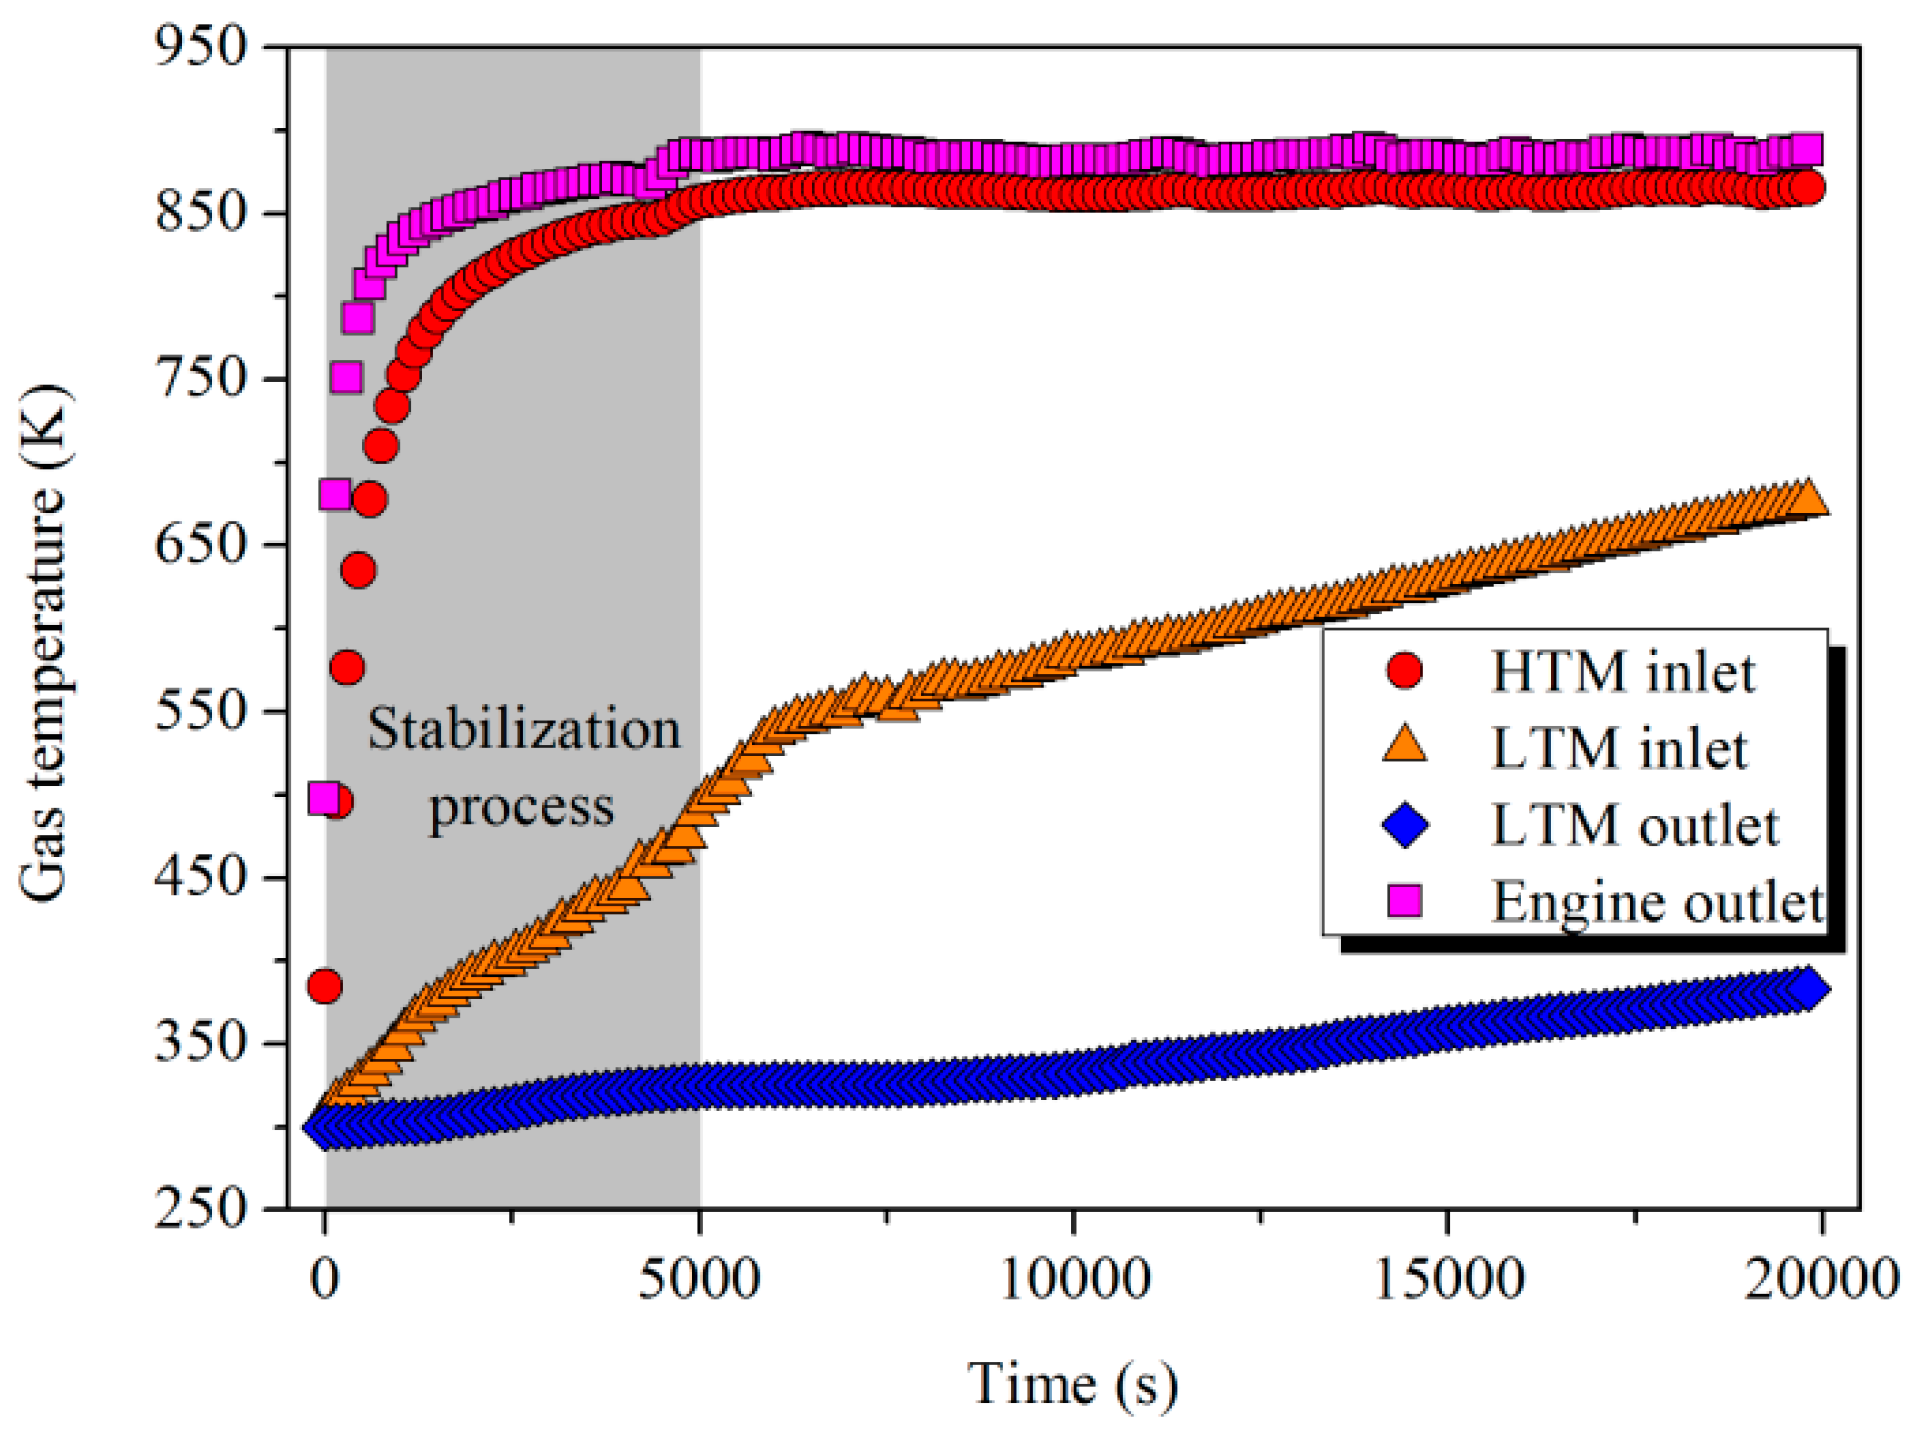
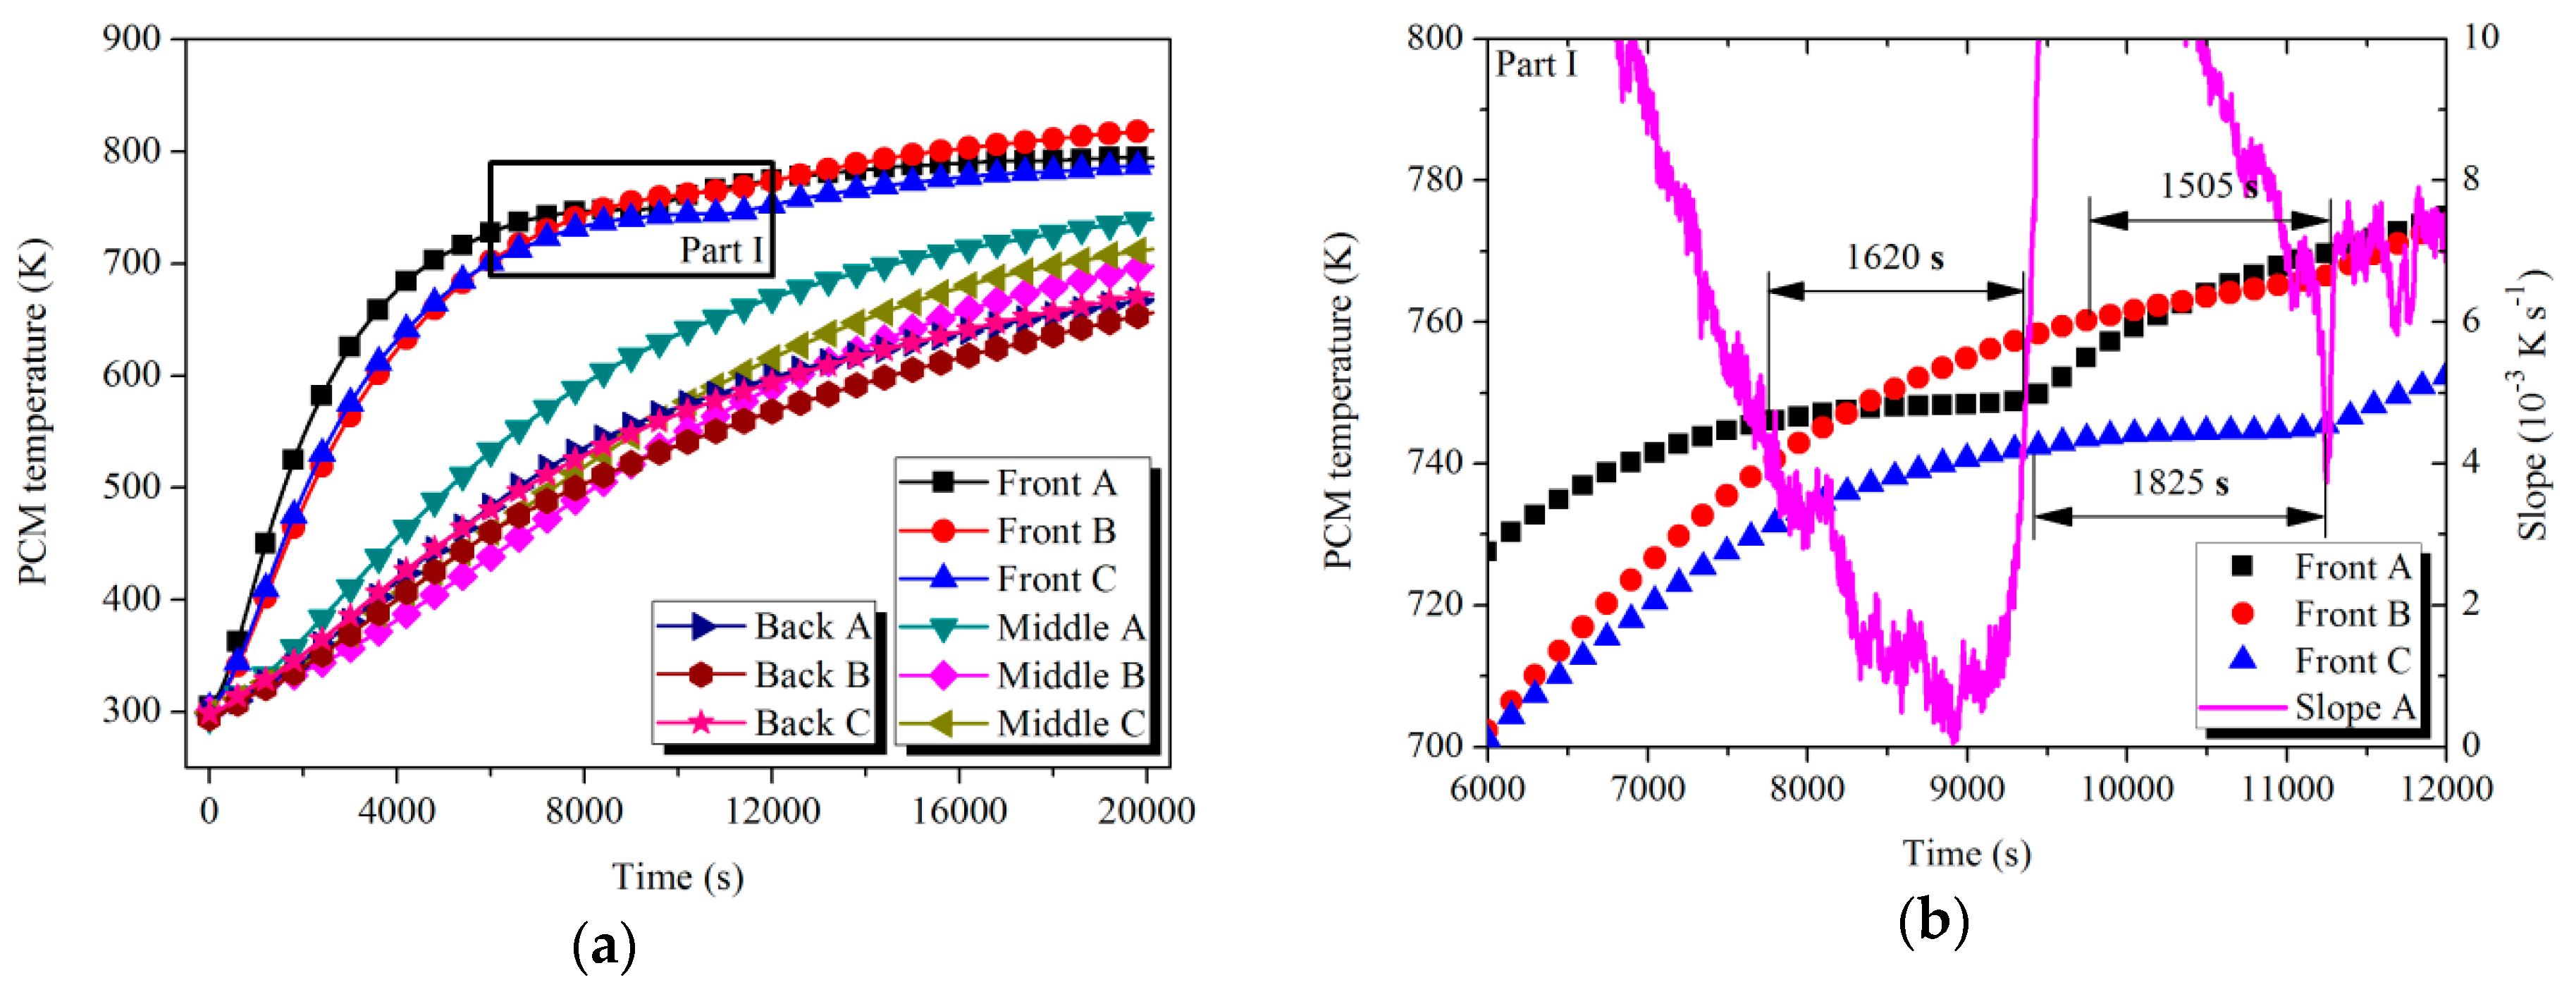
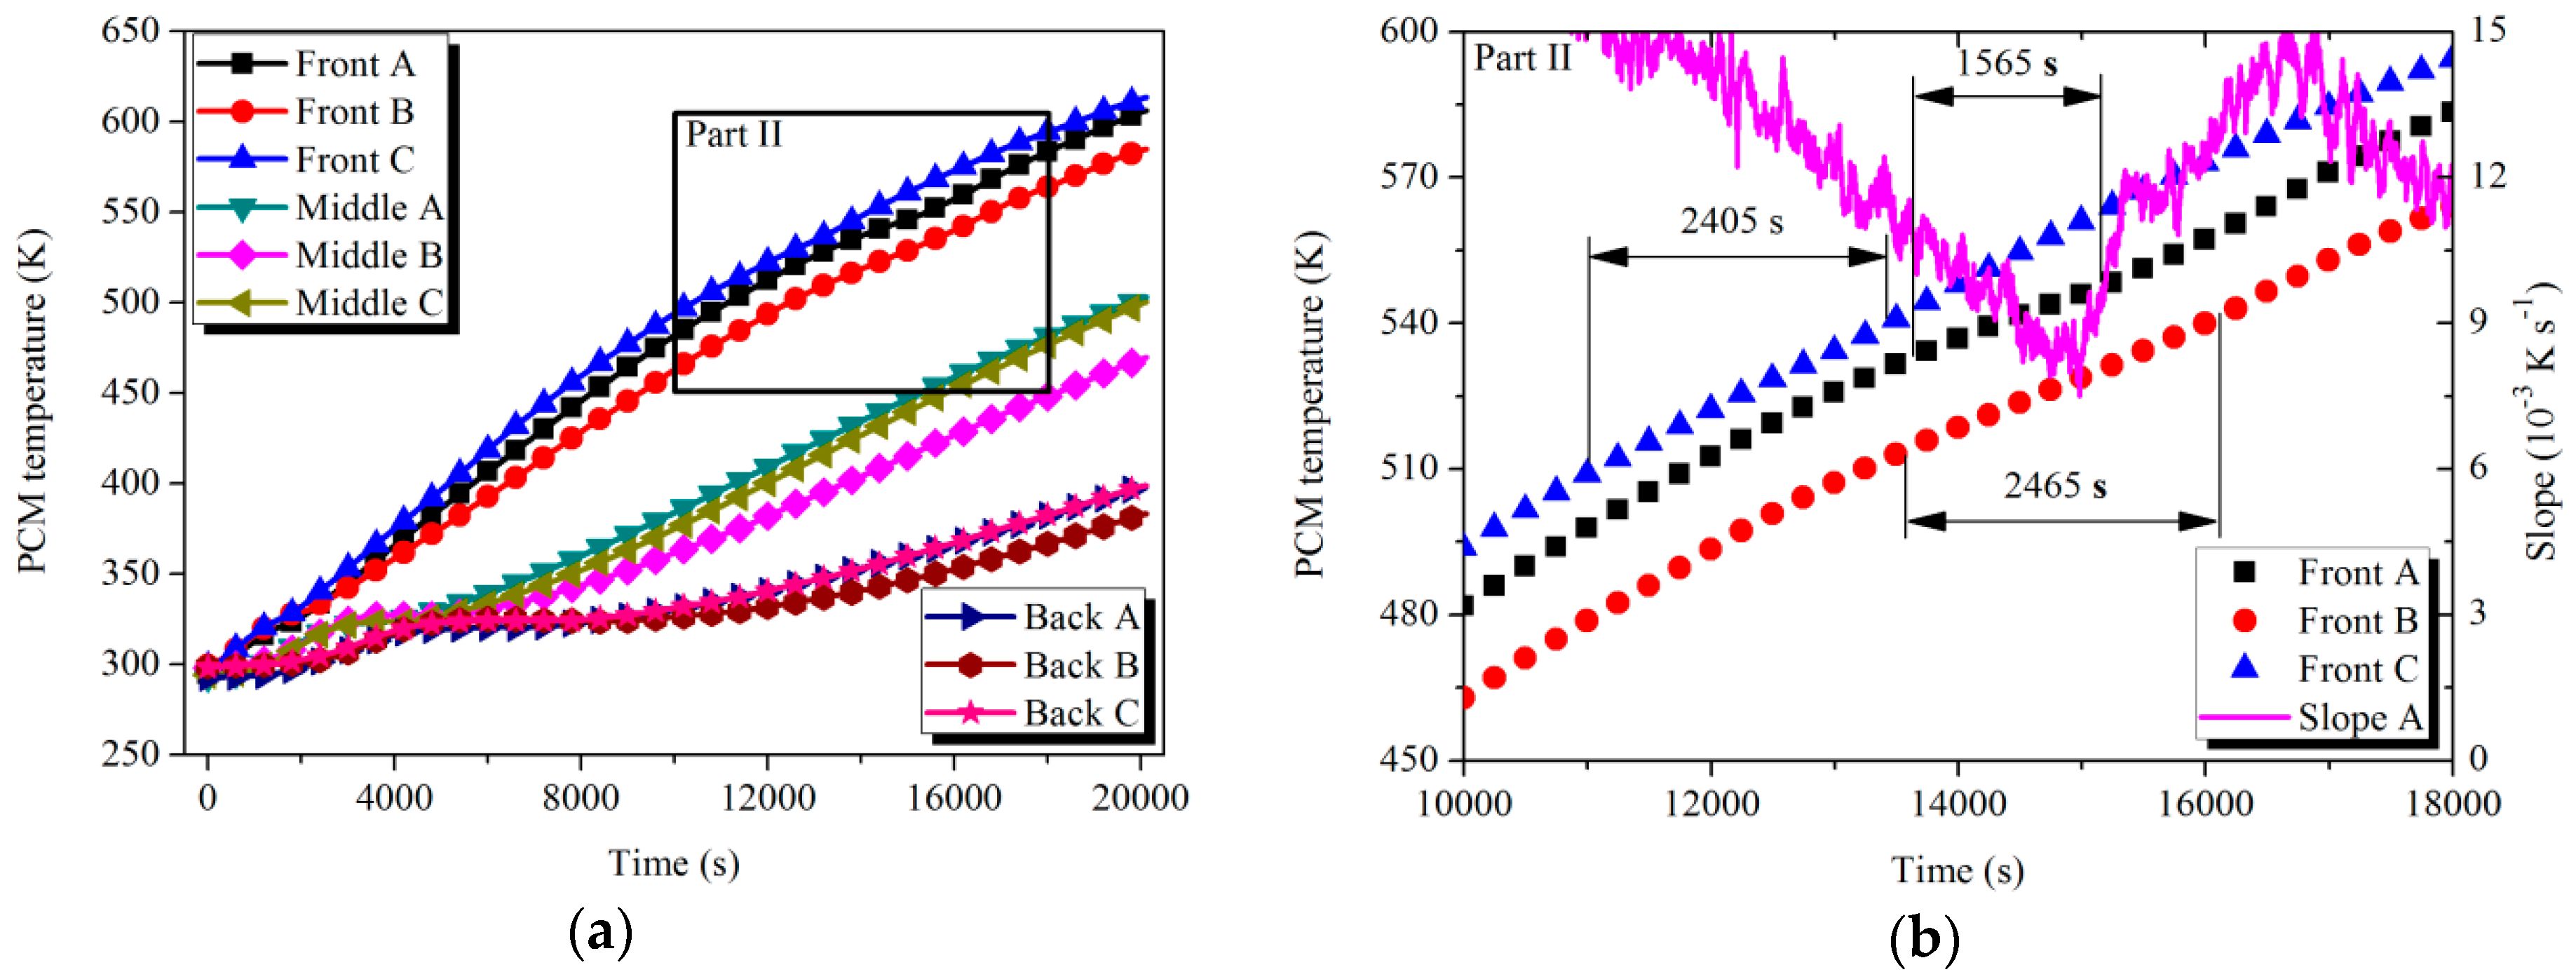
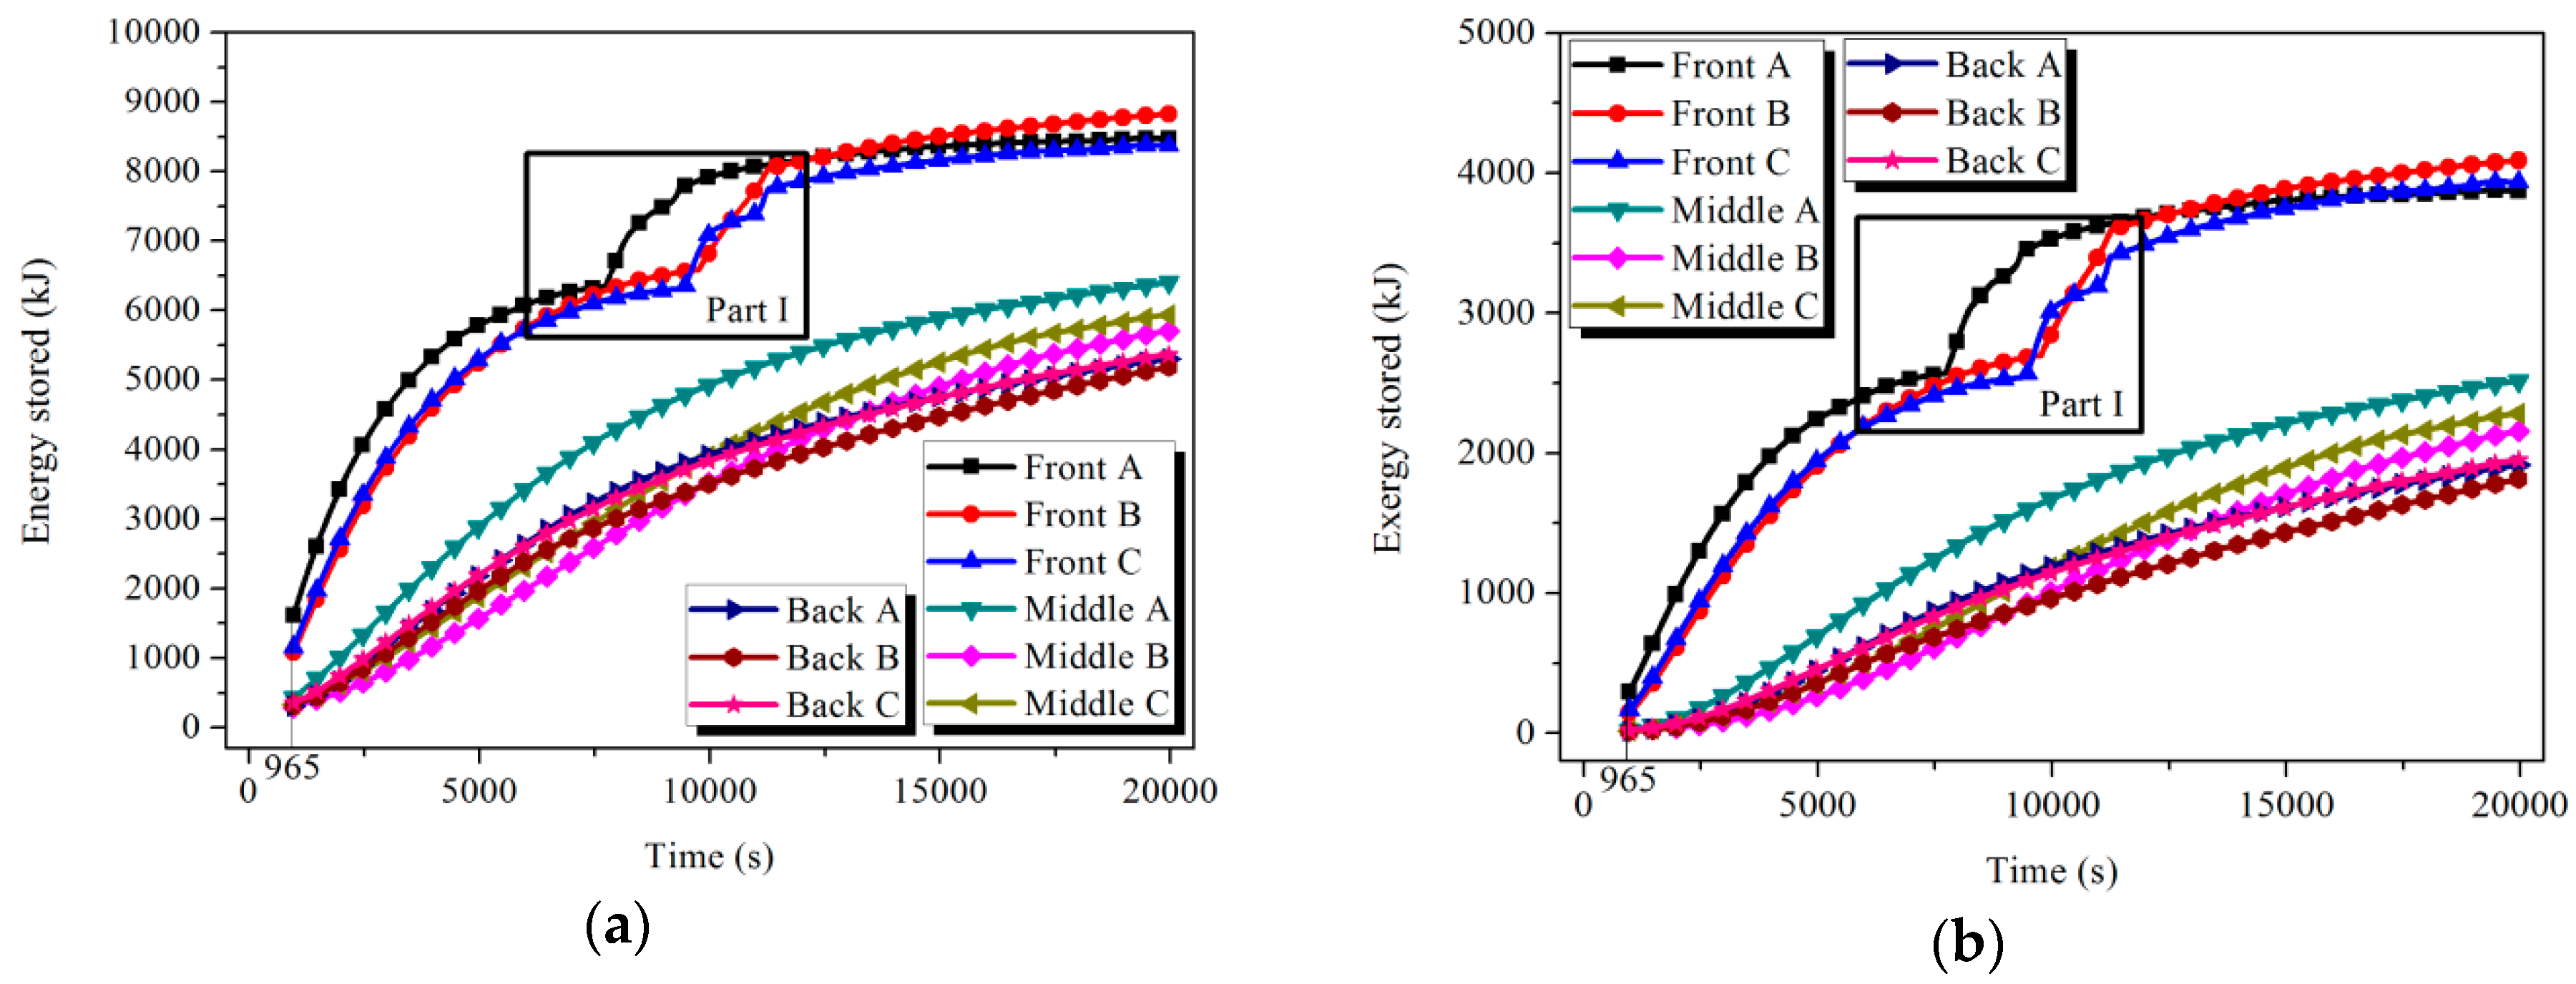
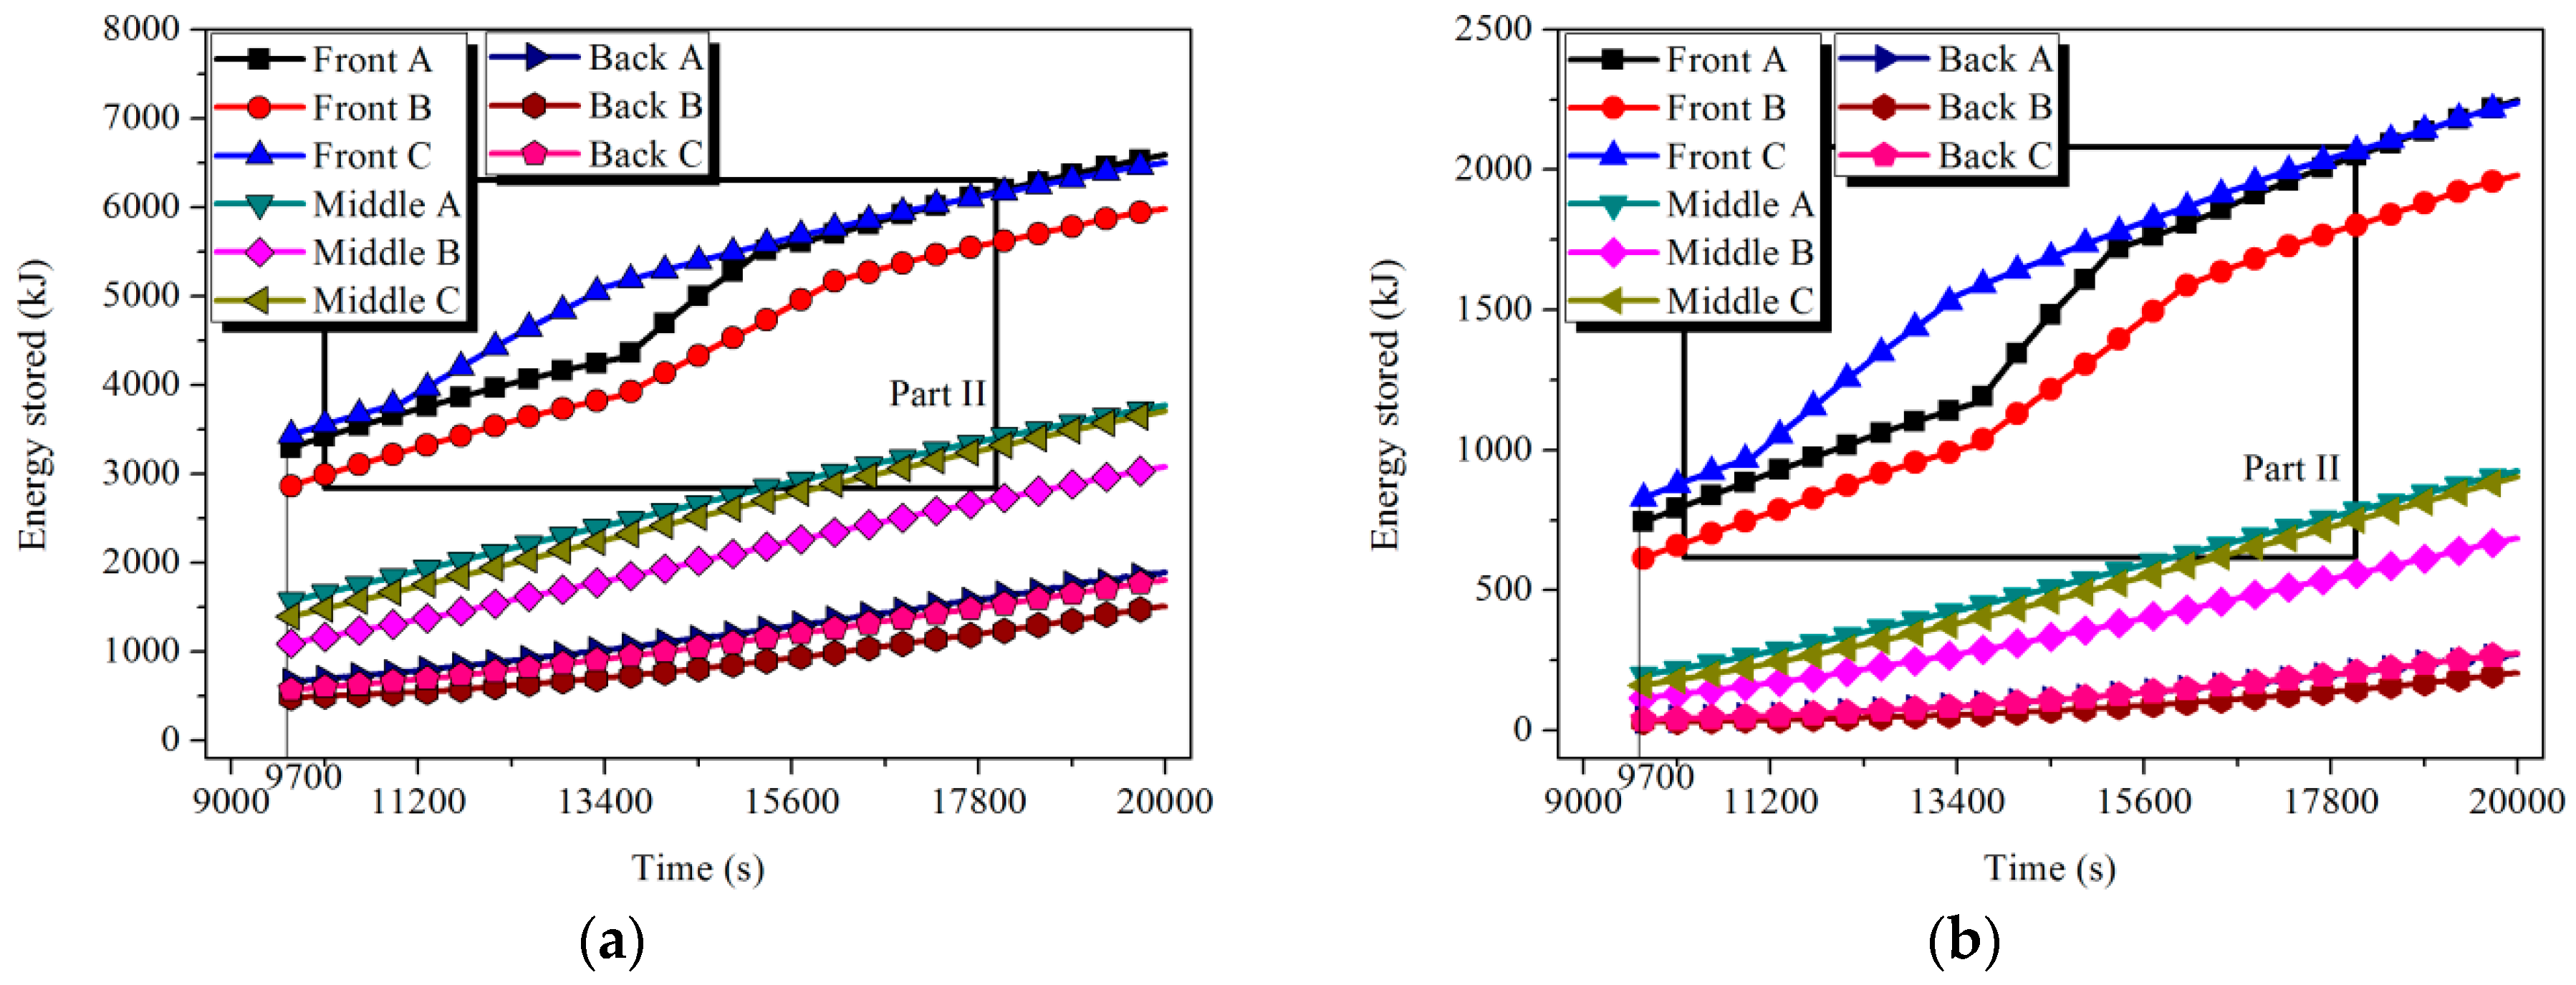
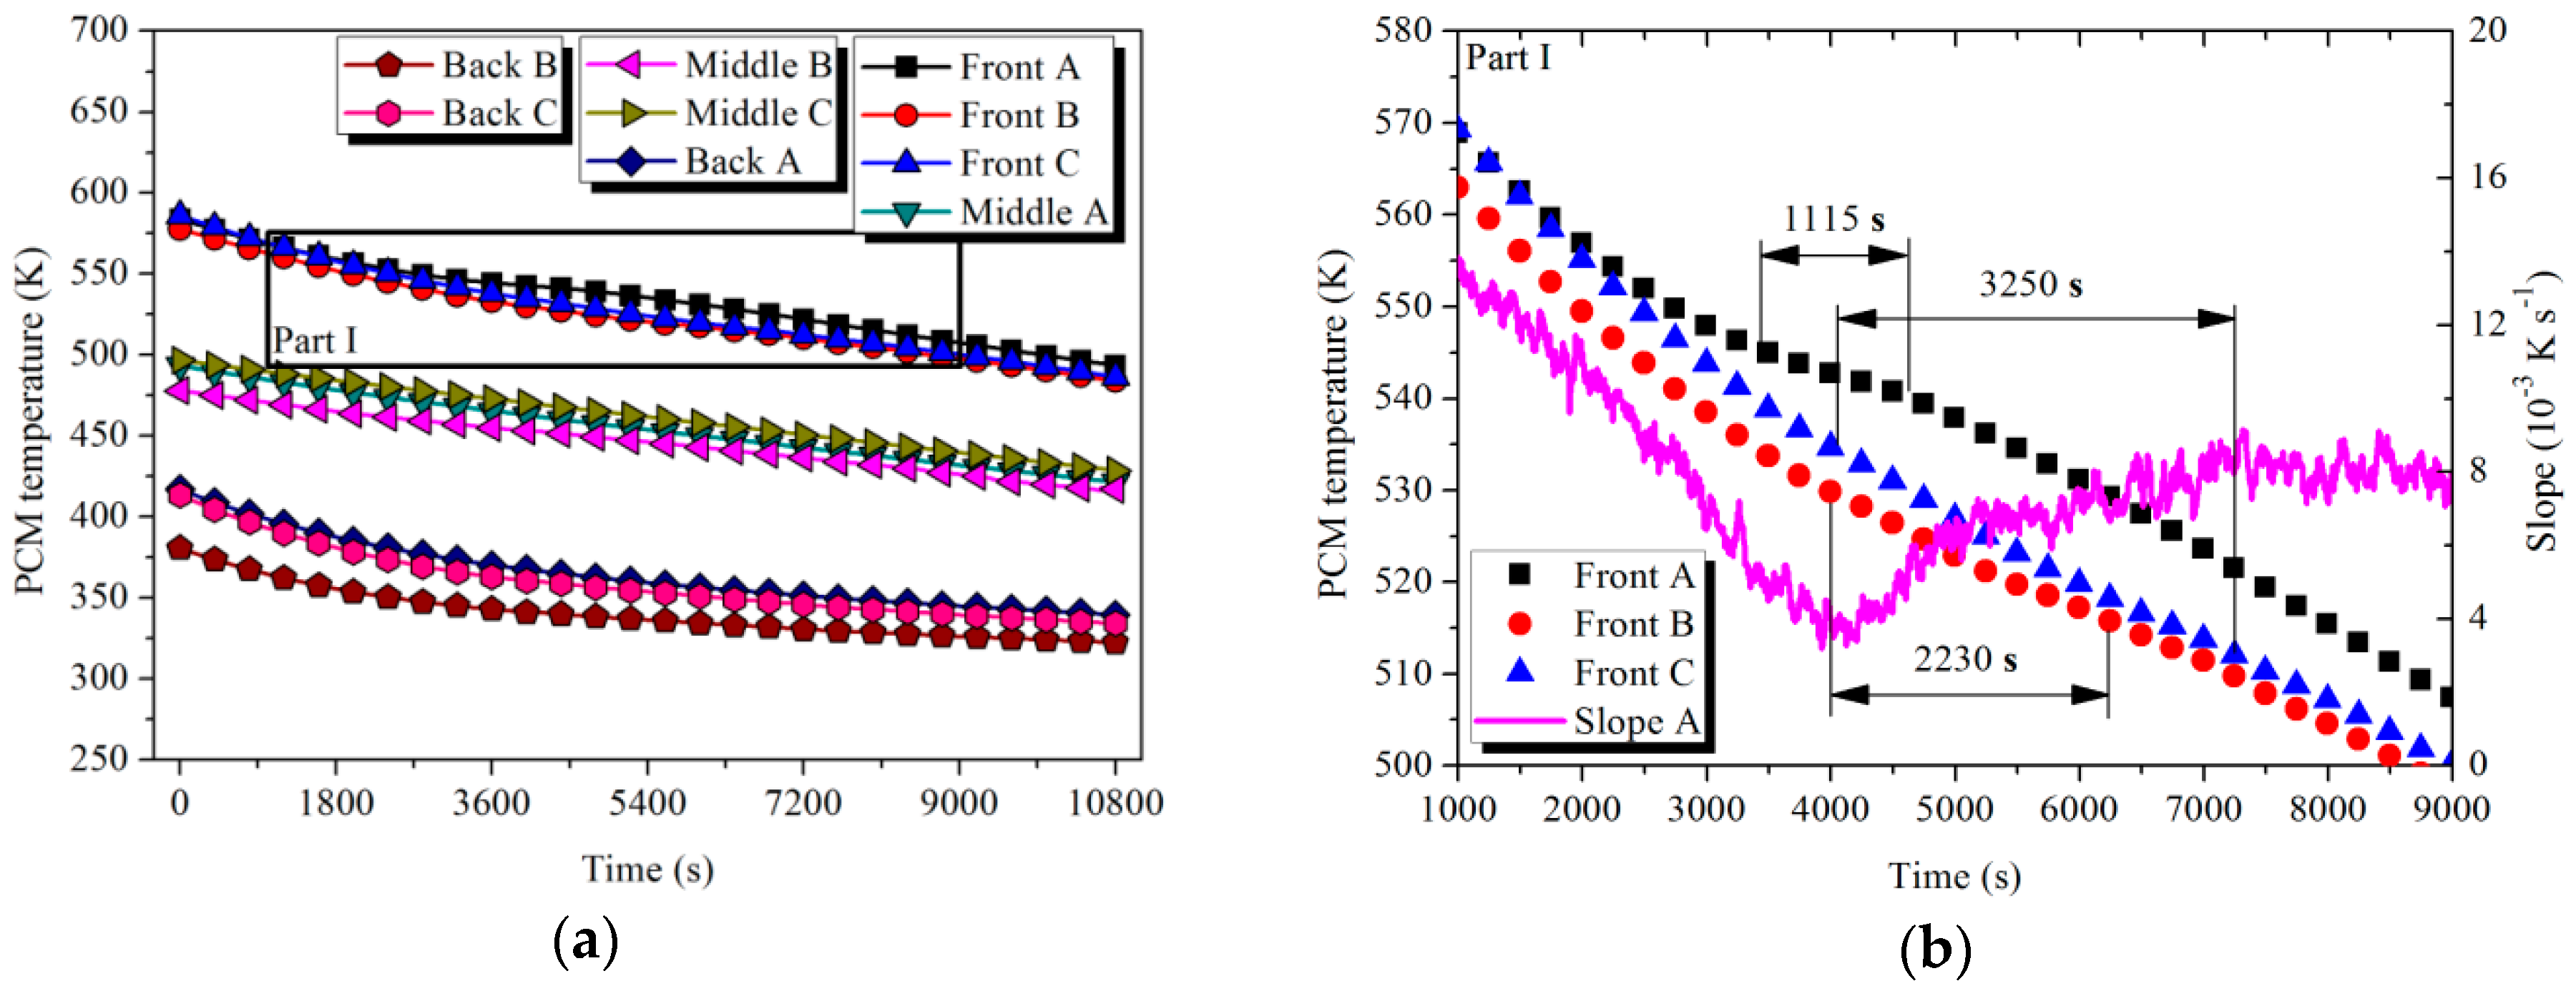
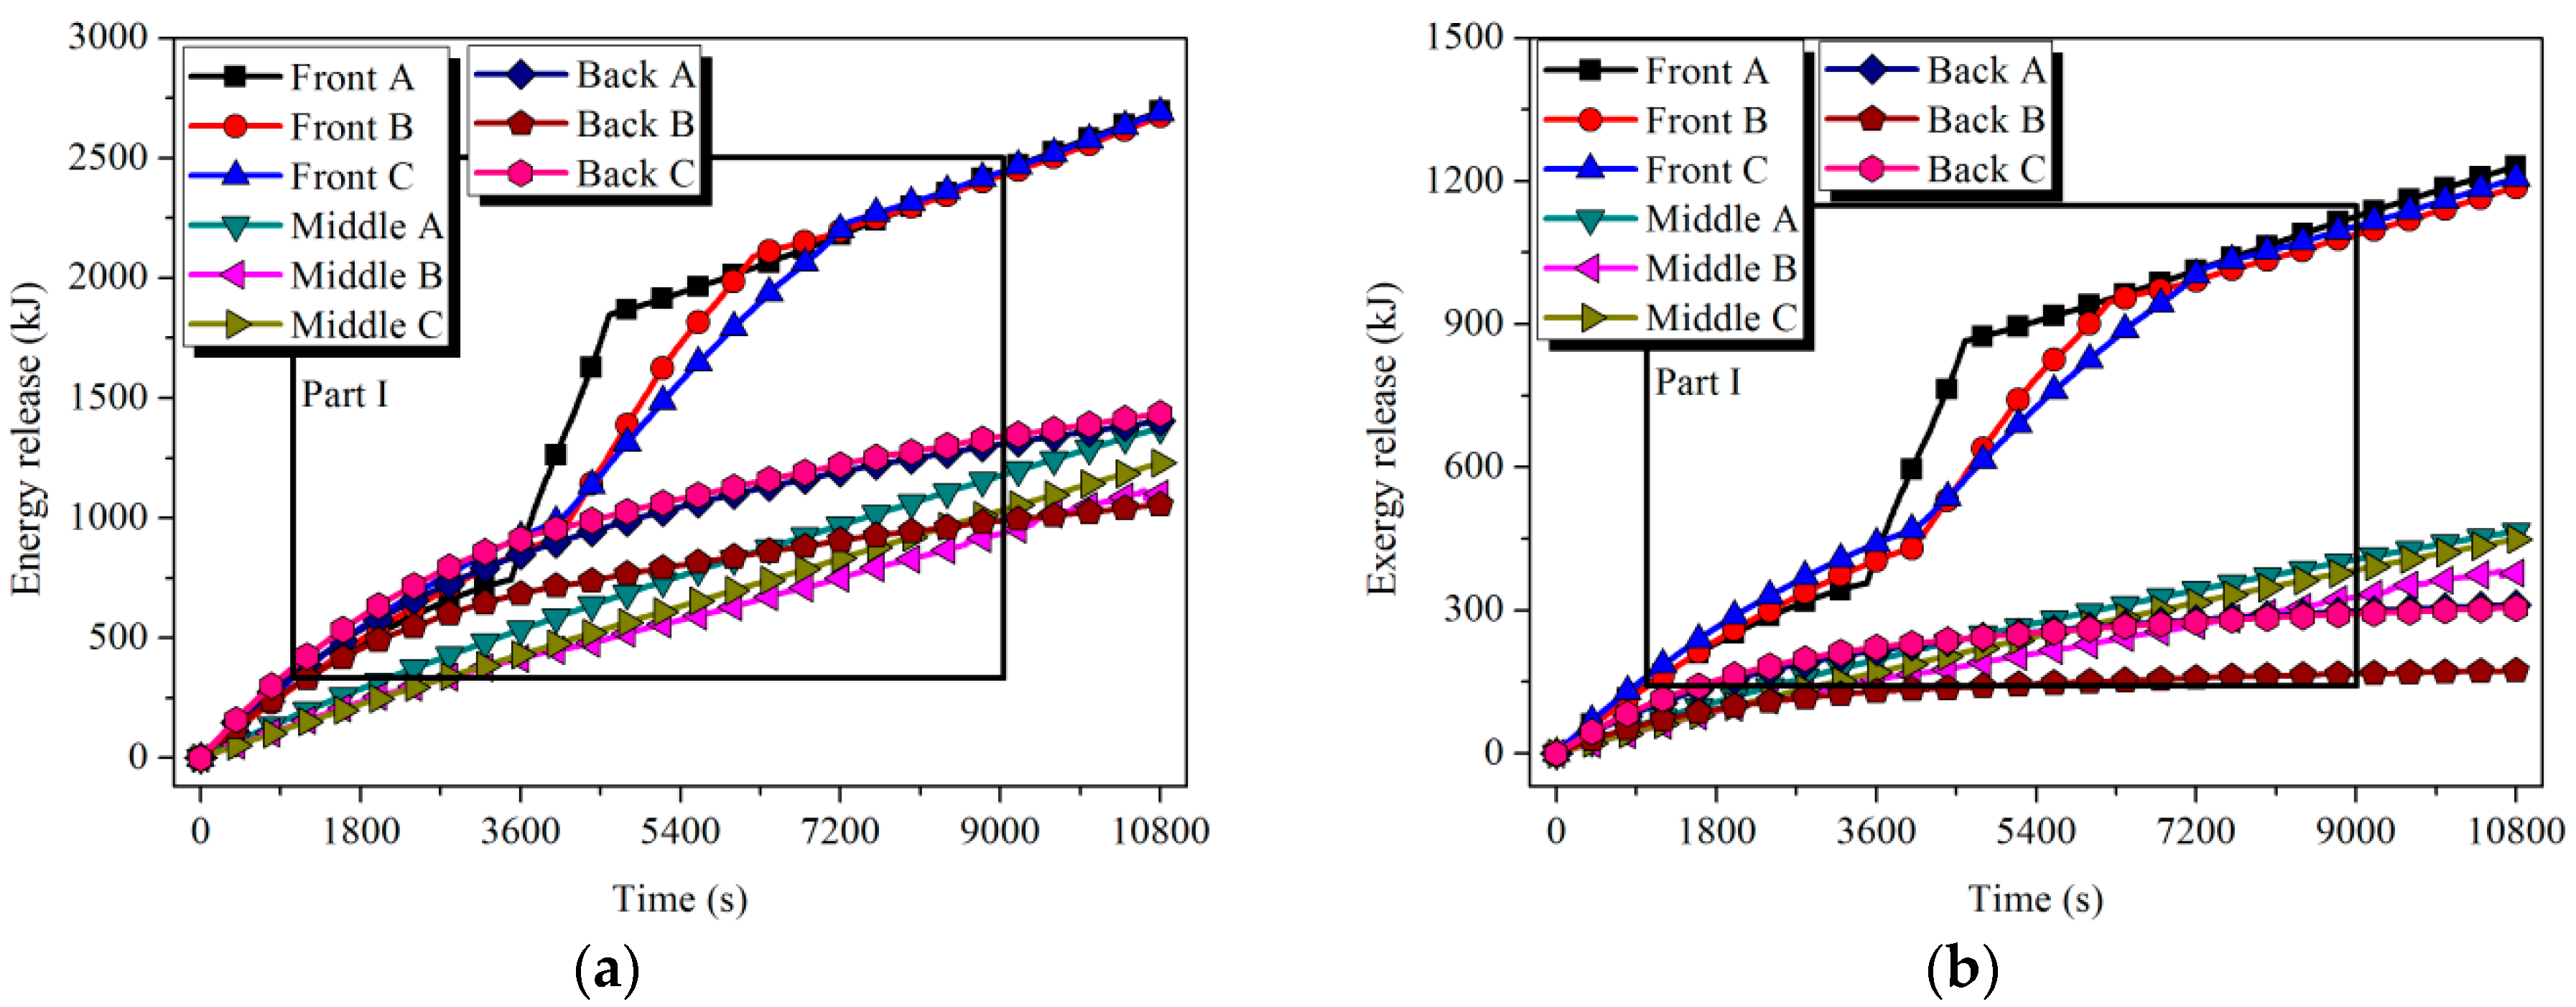
3.1. Charging Process

As shown in Figure 7, compared with the instantaneous change of power output to the steady state, the temperature of the flue gas at the engine outlet experienced a stabilization process (0–5000 s). After that, the gas temperature difference between the engine outlet and HTM inlet remained at approximately 30 K due to the heat loss during the gas transmission. On the other hand, the outlet gas temperature of HTM and LTM increased gradually with the charging procedure.
The temperature curves of the PCMs with respect to time at the measurement points are shown in Figure 8 and Figure 9. Referring to Parts I and II, a decrease in the curve slope existed in the latent process because a large portion of heat was absorbed by the solid–liquid phase change. After a fluctuation within a range in the melting process, the curve slope rapidly rose due to the absence of the phase change enthalpy in the liquid state. The slope value at the end point of fluctuation was used to represent the start and end slope of melting to approximately define the time length of the latent process for each tube:
Δ t = t ( slp s pc end ) t ( slp s pc start )
where Δt denotes the time length of the latent process, and slp s pc end and slp s pc start denote the end and start slope of the PCM temperature curve in the melting process, respectively. The value of the slope at time t was defined using the following equation:
slp ( t ) = | T pcm ( t ) T pcm ( t θ ) θ | ,   t θ
where θ denotes the calculation period, which was set as 50 s in this study.
For the HTM, after 7740 s of the heat storage process, the PCMs in the Front tubes (A–C) started to melt in succession. Taking the case of Front tube A as an example, the slope of the temperature curve dropped from the initial value of 4 × 10⁻³ K s−1 to the minimum value of 0 K s−1 in the latent process. The melting processes of the tubes happened in different temperature ranges and their durations were also distinguished. The causes of the situation could be explained as follows: The uneven manufacturing level of the PCMs in engineering amplification led to the differences in density and uniformity of the materials. On the other hand, various arrangements of the tubes induced differences in the thermal energy flow passing through the tubes. For the case of LTM, the Front tubes (A–C) were processing material fusion in the period from 11,000 to 16,095 s. Similar to the HTM scenario, various temperatures and durations of the latent process were exhibited among the tubes. However, due to the relatively low phase change enthalpy, the ratio of the slope reduction in the latent curve was not as obvious as that in HTM case. For example, the slope of the Front A curve at the start point of the latent process reached 1.0 × 10⁻² K s−1 and decreased to the minimum of 7.5 × 10⁻³ K s−1 during the melting process. The ratio of the slope reduction was 25% compared with 100% of that in the case of HTM. Apart from the six tubes mentioned above, the other measured tubes were processing the sensible storage stage.
Based on Equations (6) and (9), the uniform temperature distribution in each tube could be achieved when t = 965 s for HTM and t = 9700 s for LTM, respectively. The energy and exergy stored in the nine tubes of each module could be calculated by Equations (7) and (8), and the results are shown in Figure 10 and Figure 11. During the melting processes shown in Parts I and II, the storage capacity of the tube improved significantly. For the Front tube A in the HTM, 17% and 22.6% of the total stored energy and exergy, respectively, in the charging process were achieved during the latent process, which only occupied 8.2% of the charging time.
To simplify the evaluation of the storage status of the modules, referring to Figure 5, the HTM and LTM were divided into six and nine parts, respectively. The overall condition of the modules was described using the energy and exergy stored in the measured tubes, which were
Q ( E x ) HTM sto = 21 × ( Q ( E x ) FrontA sto + Q ( E x ) MiddleA sto ) / 2 + 21 × ( Q ( E x ) FrontB sto + Q ( E x ) MiddleB sto ) / 2 + 21 × ( Q ( E x ) FrontC sto + Q ( E x ) MiddleC sto ) / 2 + 20 × ( Q ( E x ) MiddleA sto + Q ( E x ) BackA sto ) / 2 + 21 × ( Q ( E x ) MiddleB sto + Q ( E x ) BackB sto ) / 2 + 20 × ( Q ( E x ) MiddleC sto + Q ( E x ) BackC sto ) / 2
Q ( E x ) LTM sto = 24 × Q ( E x ) FrontA sto + 25 × Q ( E x ) FrontB sto + 24 × Q ( E x ) BackC sto + 24 × Q ( E x ) MiddleA sto + 25 × Q ( E x ) MiddleB sto + 24 × Q ( E x ) MiddleC sto + 24 × Q ( E x ) BackA sto + 25 × Q ( E x ) BackB sto + 24 × Q ( E x ) BackC sto
After 19,800 s (5.5 h), the energy stored in the HTM and LTM was 802.5 and 840.5 MJ and the exergy was 325.9 and 233.6 MJ, respectively. About 56.4% energy and 48.4% exergy of the input flue gas could be stored. It is worth noting that more energy but less exergy was stored in the LTM than in the HTM due to the quality difference of thermal energy. The storage efficiency calculated by Equation (11) is shown in Figure 12. The results indicated that, compared with the single HTM scenario, two-stage cascade thermal storage could effectively increase the storage efficiency. During the time period from 11,000 to 19,800 s when the melting process occurred in both modules, the average energy storage efficiency increased from 33.6% to 62.3%, and the average exergy efficiency also rose from 33.1% to 50.8%.

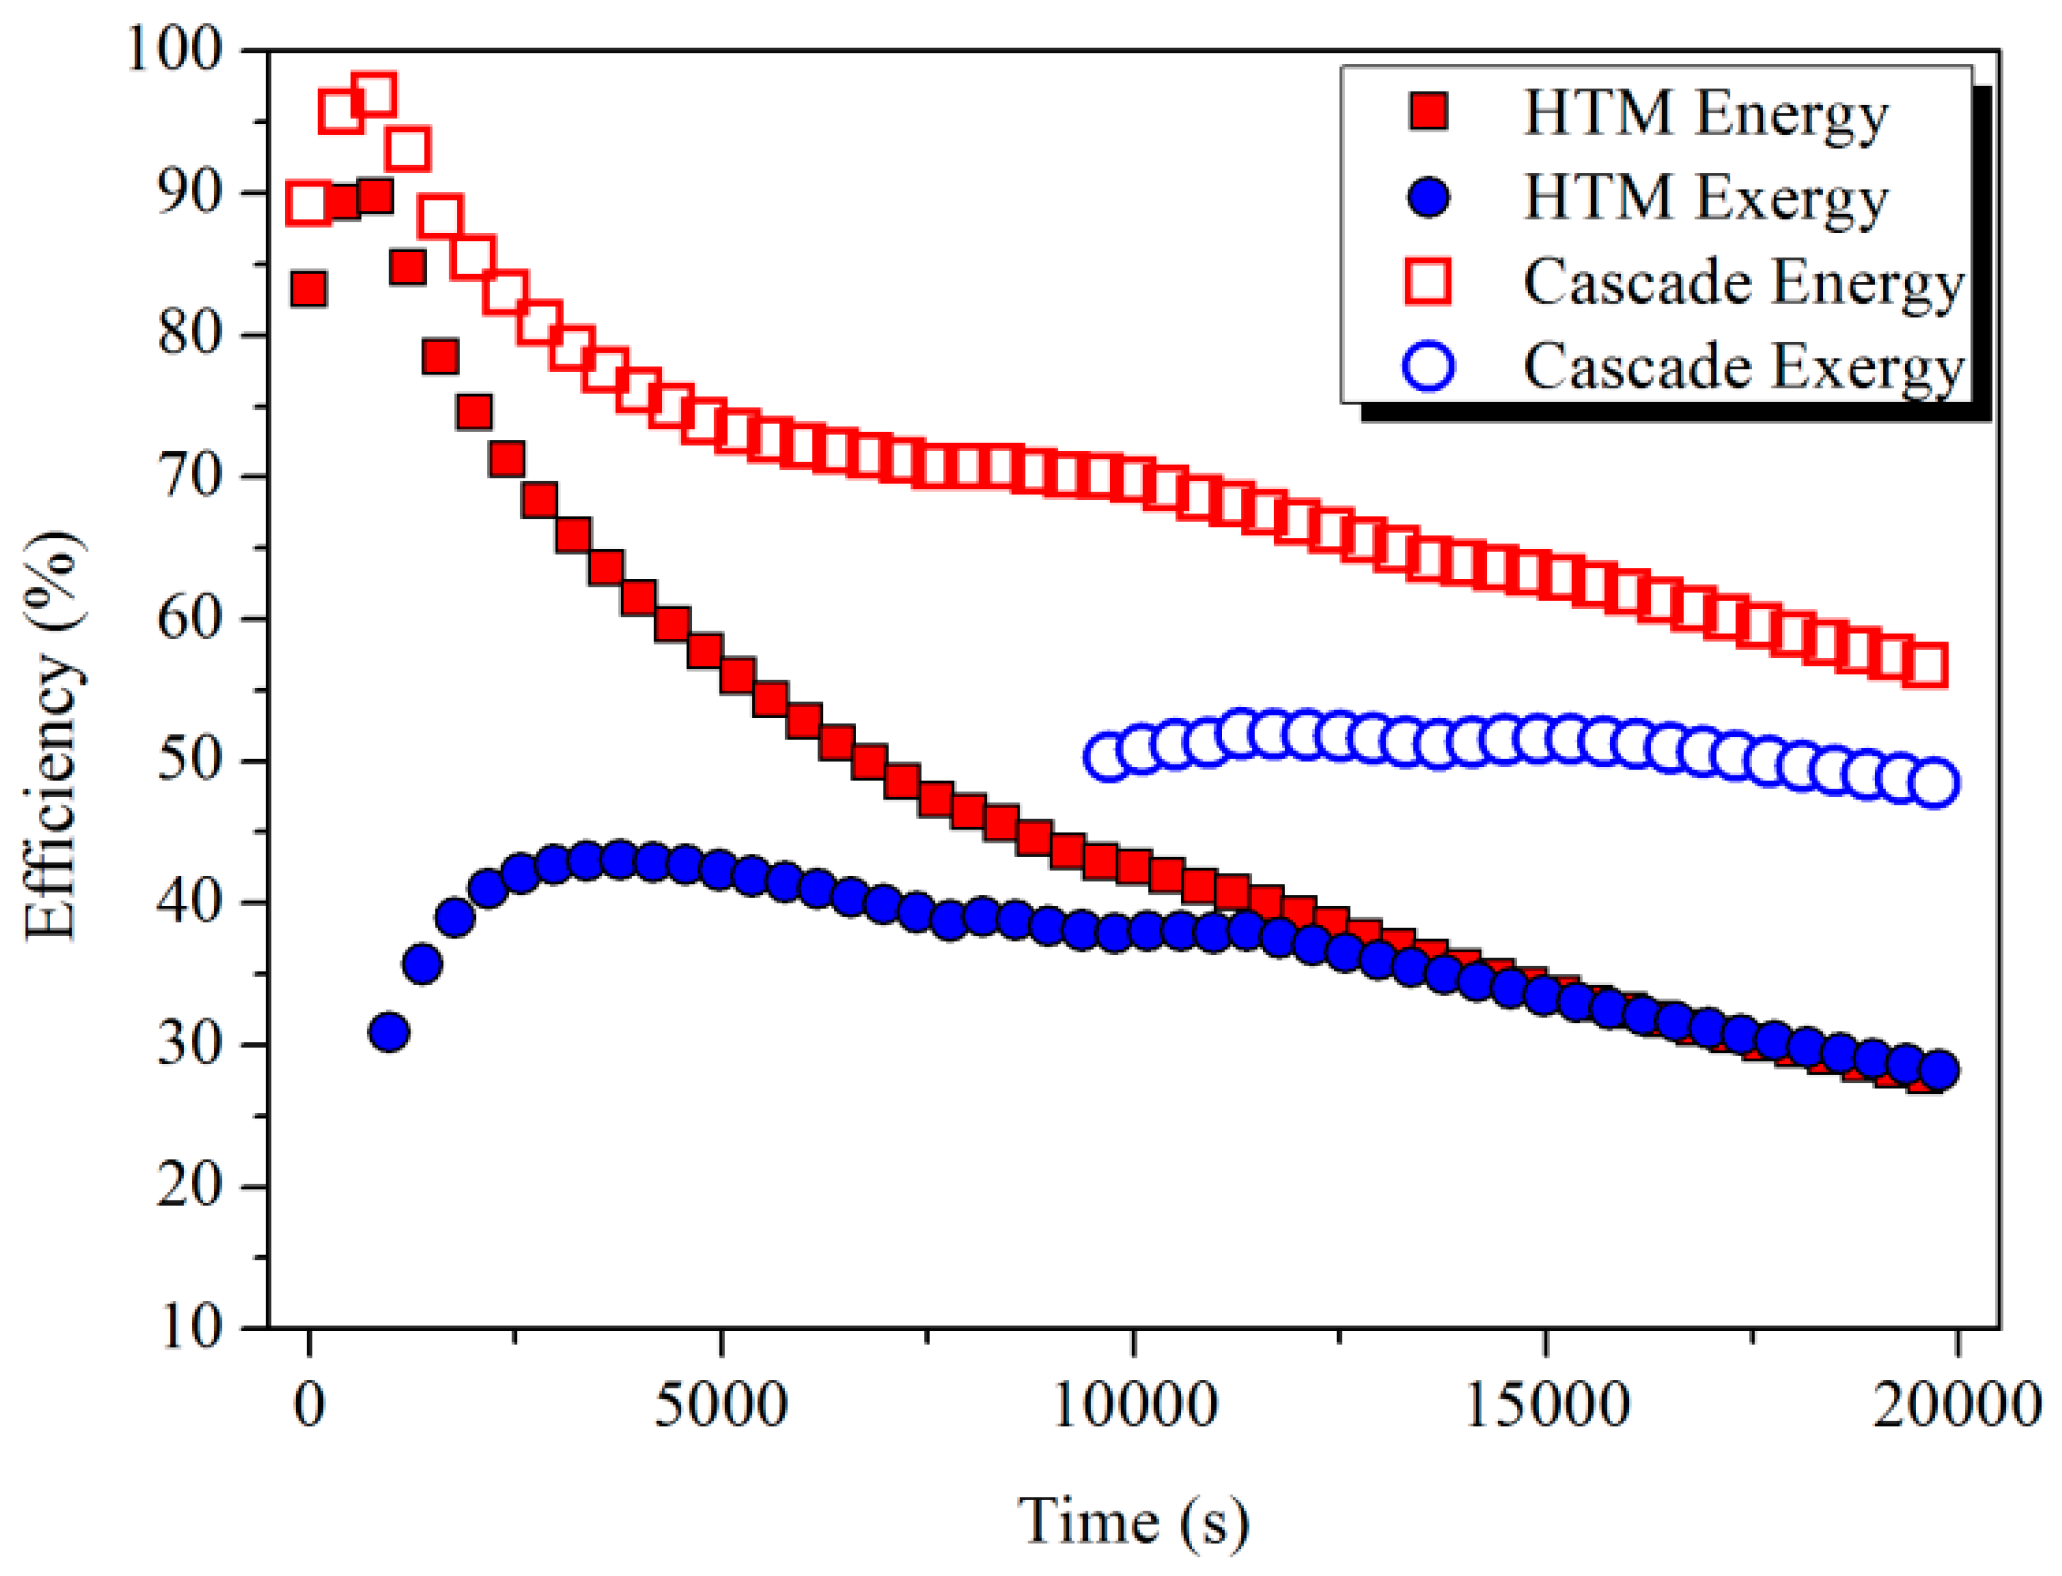
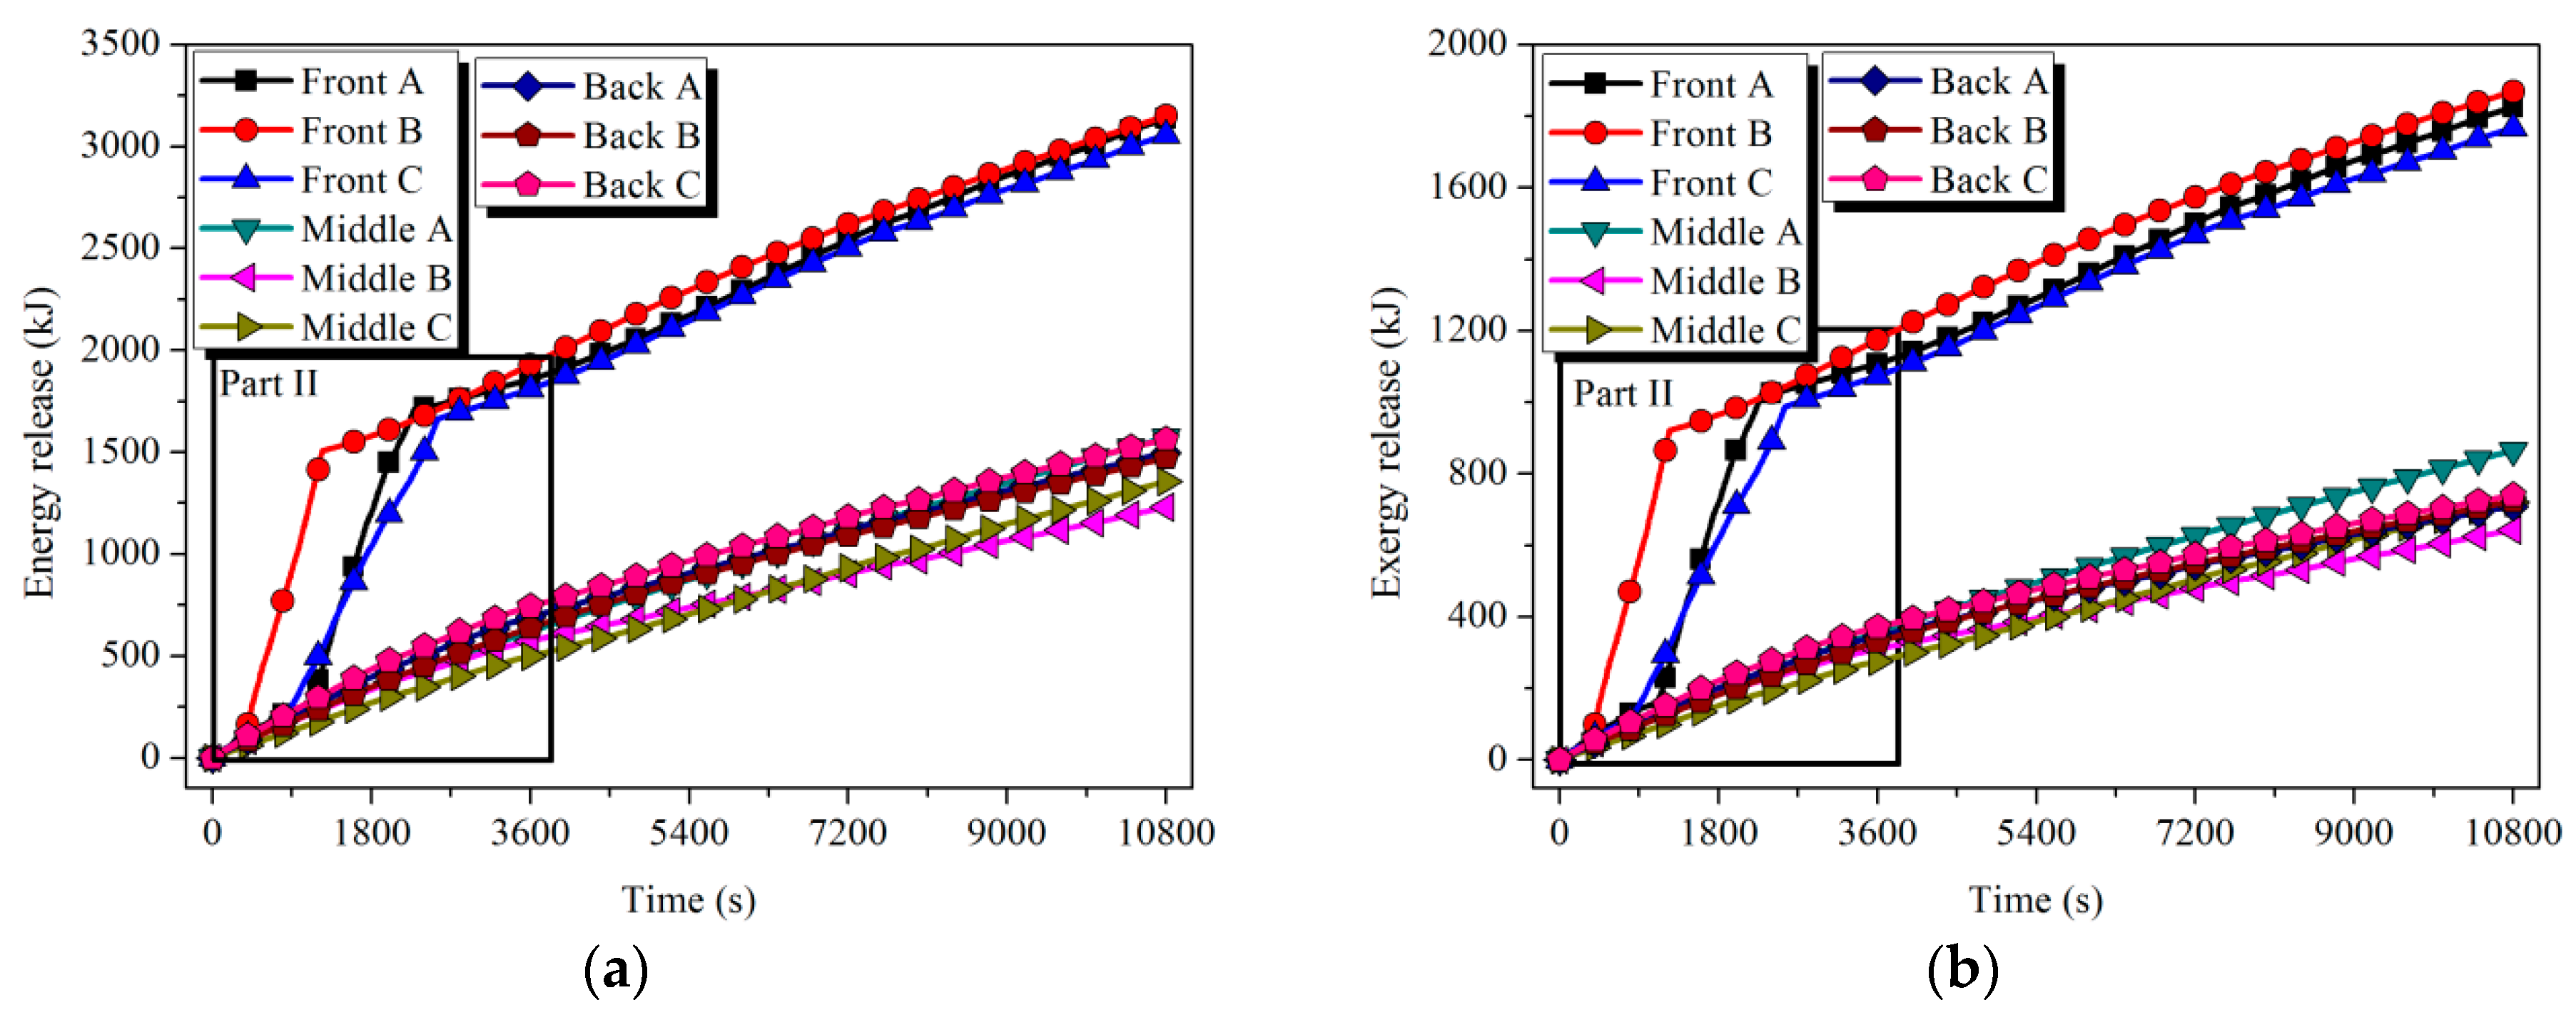
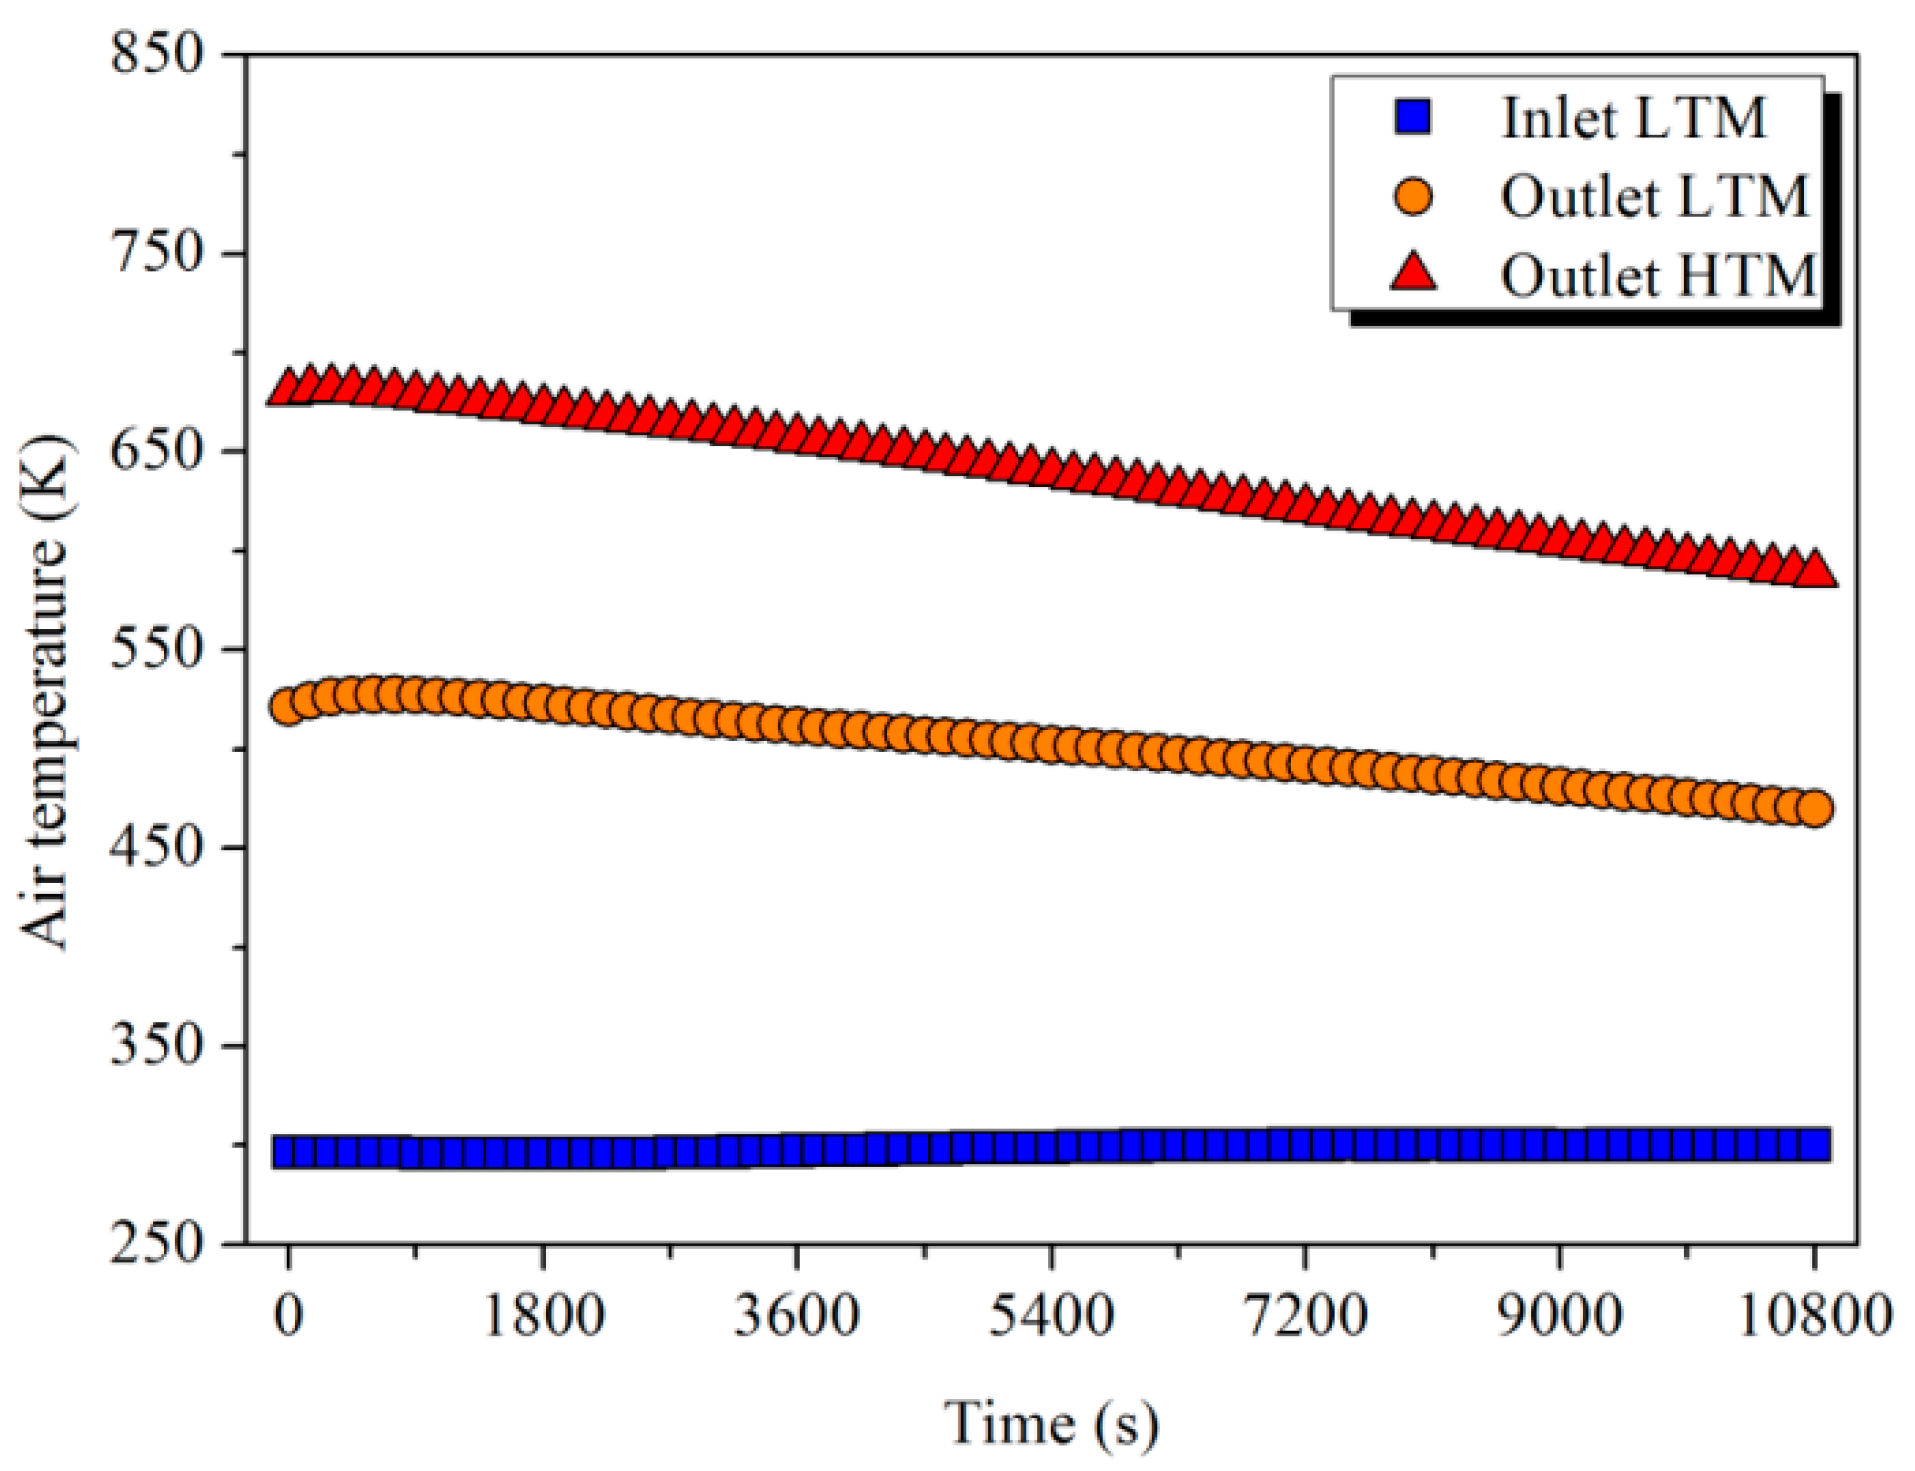
3.2. Discharging Process

After 0.5 h of self-heat preservation and blower flow adjustment, ambient-temperature air entered the LTM and HTM in sequence to absorb the stored heat at a flow rate of 480 Nm3 h−1. Similar to the charging process, the value of the curve slope at the start of the rapid increase after solidification was adopted to define the time length of the liquid–solid phase change process:
Δ t = t ( slp l pc end ) t ( slp l pc start )
where slp l pc end and slp l pc start denote the end and start slope of liquid–solid phase change, respectively. Referring to Part I in Figure 13 and Part II in Figure 14, the Front tubes in LTM and HTM started to experience solidification at 3495 and 350 s, respectively. Similar to the storage scenario, differences in the temperature range and duration of the latent process were observed. Additionally, the average temperature of the solidification was mostly noticed to be lower than that in the melting process. The main reason for this phenomenon can be concluded to be the supercooling of the PCMs, which is consistent with the results discussed in the literature [36,37,38].
The energy and exergy released by the tubes were calculated according to Equations (12) and (13). Referring to Figure 15 and Figure 16, the release capacity of the tubes was enhanced during the solidification process. Still considering the case of Front tube A in HTM, in 11.2% of the discharging time, about 46.3% of the energy and 47.4% of the exergy stored in the tube were discharged.
As shown in Figure 17, the ambient air was heated up to an average temperature of 500 and 640 K in sequence after absorbing the heat in the LTM and HTM. The energy and exergy absorbed by the air determined by Equation (14) are shown in Figure 18. After a 3 h release process, 413.6 and 295.4 MJ of energy and 97.5 and 128.4 MJ of exergy were released from LTM and HTM, respectively. Although LTM output more energy, the HTM could supply more exergy to the user because of the higher-temperature-level heat it had stored. The release efficiency of the storage unit defined by Equation (15) was calculated and is shown in Table 5.
The thermal energy absorbed by the water can be calculated by the following equation:
Q water = Q air rel η user = m water c water ( T water T 0 )
where ηuser = 98.5% denotes the efficiency of the air–water heat exchanger, and mwater and cwater = 4.2 kJ kg−1 K−1 denote the mass and specific heat capacity of the water, respectively. About 7.6 tons of ambient water can be heated up to Twater = 315 K to meet the cleaning and washing demand. In this case, the exergy increment of the water is
E x water = m water c water [ ( T water T 0 ) T 0 ln ( T water / T 0 ) ] = 25   MJ .
Based on Equations (1) and (3), the thermal and exergy efficiency of the diesel engine in a daily working period can be determined as follows:
η diesel ther = P diesel / φ × t diesel + Q water V fuel ρ fuel L H V t diesel = 41.9 % η diesel exergy = P diesel × t diesel + E x water 1.0338 × V fuel ρ fuel L H V t diesel = 29.7 %

4. Conclusions

A demonstration DGS integrated with two-stage tube-type PCM modules for diesel engine flue gas heat recovery was developed and investigated in the current study. According to the daily production scheme of the DGS, 5.5 h of heat charging and 3 h of heat discharging were conducted. The temperature profiles of the PCMs and HTF over time were studied in detail to evaluate the energy and exergy performance of the cascaded storage unit. Furthermore, the efficiency improvement of the DGS through the recovery and management of the flue gas heat using cascaded PCM storage was investigated.
The following conclusions can be drawn based on the demonstration results:
(1) In 5.5 h of the heat charging process, about 56.4% of the energy and 48.4% of the exergy of the input flue gas can be stored by the two-stage modules. Compared with the single HTM unit, additional integration of the LTM can increase the average storage efficiency from 33.6% to 62.3% for energy and 33.1% to 50.8% for exergy.
(2) In 3 h of the heat discharging process, about 49.2% of the energy and 41.8% of the exergy stored in LTM and 36.8% of the energy and 39.4% of the exergy stored in HTM were released from the storage unit. The ambient air can be heated up to the average temperature of 500 and 640 K in sequence by absorbing the heat in the LTM and HTM.
(3) By storing and shifting the flue gas heat using cascaded PCM storage, about 7.6 tons of ambient water can be heated up to 315 K to meet the cleaning and washing load of the workers. In this case, 25 MJ of additional exergy can be obtained from the DGS daily operation. The thermal efficiency of the diesel engine can be increased from the original 35.8% to 41.9%, and the exergy efficiency can also be improved from 29.5% to 29.7%. It should be noted that, in the current application study, the high-quality heat released from the storage unit was used to provide civil-use hot water, which led to the low degree of exergy improvement for the DGS. High exergy efficiency of the diesel engine could be achieved when the stored energy was used to generate power using techniques such as the steam turbine, air expander, and so forth.
This paper presented a practical application case to demonstrate that cascaded PCM thermal storage could provide an effective solution against the time mismatch between thermal energy availability and demand as well as improve the working efficiency of the DGS. The outcome of this investigation could provide theoretical support and guidance for the engineering application of cascaded PCM storage for DGSs.

Author Contributions

Investigation, P.W., S.W. and H.Y.; writing—original draft preparation, D.L.; writing—review and editing, D.L.; supervision, Y.D., Y.H., J.W.

Funding

The authors would like to acknowledge the support of the Major State Basic Research Development Program of China (“973” Program) Projects (Grant No. 2015CB251300), the National Natural Science Foundation of China (Grant No. 21808225), and the Clean Energy and Demonstration Strategic Priority Research Program of the Chinese Academy of Sciences (Grant No. XDA21070302).

Conflicts of Interest

The authors declare no conflict of interests.

Nomenclature

cspecific heat capacity (kJ kg−1 K−1)
dinner diameter (m)
Douter diameter (m)
Exexergy
Hheight (m)
Hphase change enthalpy (kJ kg−1)
jjth measurement period during charging
kkth measurement period during discharging
Llength (m)
LHVlower heating value (kJ kg−1)
mmass (kg)
Nnumber of tubes
Nrredundant factor
Ppower (kW)
Qheat (KJ)
ssecond
slpslope (K s−1)
STcenter distance between the adjacent tubes in the vertical gas flow direction (m)
SL center distance between the adjacent tubes in the parallel gas flow direction (m)
t time (s)
Ttemperature (K)
T0 ambient temperature (K)
Uuncertainty (°C, %)
Vflow rate (Nm3 h−1)
Wwidth (m)
Xtotal number of measurement periods during charging
Ytotal number of measurement periods during discharging
Greek symbols
γheat transfer efficiency (%)
Δttime length of the latent process (s)
ΔTtemperature difference (K)
ηefficiency (%)
θslope calculation period (s)
λthermal conductivity (w m−1 K−1)
ρdensity (kg m−3)
φgenerator efficiency (%)
ψusage rate of the latent heat (%)
Superscripts
elecelectricity
endend
exergyexergy
iith tube
inin
lliquid
maxmaximum
relrelease
ssolid
startstart
stostorage
therthermal
outout
Subscripts
airair
dieseldiesel
fuelfuel
gasgas
lpcliquid–solid phase change
lossloss
modmodule
pcphase change
pcmphase change material
spcsolid–liquid phase change
tubetube
useruser
waterwater
Abbreviations
DGSdistributed generation system
HTFheat transfer fluid
HTMhigh-temperature module
LTMlow-temperature module
PCMphase change material

References

  1. Abusoglu, A.; Kanoglu, M. First and second law analysis of diesel engine powered cogeneration systems. Energy Convers. Manag. 2008, 49, 2026–2031. [Google Scholar] [CrossRef]
  2. Xuan, W.; Ming, J.; Wei, F.; Gequn, S.; Hua, T.; Youcai, L. Cascade energy optimization for waste heat recovery in distributed energy systems. Appl. Energy 2018, 230, 679–695. [Google Scholar]
  3. Wenzhi, G.; Junmeng, Z.; Guanghua, L.; Qiang, B.; Liming, F. Performance evaluation and experiment system for waste heat recovery of diesel engine. Energy 2013, 55, 226–235. [Google Scholar] [CrossRef]
  4. Yu, G.; Shu, G.; Tian, H.; Huo, Y.; Zhu, W. Experimental investigations on a cascaded steam-/organic-Rankinecycle (RC/ORC) system for waste heat recovery (WHR) from diesel engine. Energy Convers. Manag. 2016, 129, 43–51. [Google Scholar] [CrossRef]
  5. Mito, M.T.; Teamah, M.A.; El-Maghlany, W.M.; Shehata, A.I. Utilizing the scavenge air cooling in improving the performance of marine diesel engine waste heat recovery systems. Energy 2018, 142, 264–276. [Google Scholar] [CrossRef]
  6. Hatami, M.; Ganji, D.D.; Gorji-Bandpy, M. A review of different heat exchangers designs for increasing the diesel exhaust waste heat recovery. Renew. Sustain. Energy Rev. 2014, 37, 168–181. [Google Scholar] [CrossRef]
  7. José Manuel, L.; Héctor, C.; Dolz, V.; Moratal, A.; José, B.-A.; Soukeur, Z. Potential of exhaust heat recovery for intake charge heating in a diesel engine transient operation at cold conditions. Appl. Therm. Eng. 2016, 105, 501–508. [Google Scholar] [Green Version]
  8. Thakar, R.; Bhosle, S.; Lahane, S. Design of heat exchanger for waste heat recovery from exhaust gas of diesel engine. Procedia Manuf. 2018, 20, 372–376. [Google Scholar] [CrossRef]
  9. Riffat, S.B.; Ma, X. Thermoelectrics: A review of present and potential applications. Appl. Therm. Eng. 2003, 23, 913–935. [Google Scholar] [CrossRef]
  10. Champier, D. Thermoelectric generators: A review of applications. Renew. Sustain. Energy Rev. 2017, 140, 167–181. [Google Scholar] [CrossRef]
  11. Pandiyarajan, V.; Chinna Pandian, M.; Malan, E.; Velraj, R.; Seeniraj, R.V. Experimental investigation on heat recovery from diesel engine exhaust using finned shell and tube heat exchanger and thermal storage system. Appl. Energy 2011, 88, 77–87. [Google Scholar] [CrossRef]
  12. Mohamed, S.A.; Al-Sulaiman, F.A.; Ibrahim, N.I.; Zahir, M.H.; Al-Ahmed, A.; Saidura, R.; Yılbaş, B.S.; Sahin, A.Z. A review on current status and challenges of inorganic phase change materials for thermal energy storage systems. Renew. Sustain. Energy Rev. 2017, 70, 1027–1089. [Google Scholar] [CrossRef]
  13. Stathopoulos, N.; El Mankibi, M.; Issoglio, R.; Michel, P.; Haghighat, F. Air–PCM heat exchanger for peak load management: Experimental and simulation. Sol. Energy 2016, 132, 453–466. [Google Scholar] [CrossRef]
  14. Tyagi, V.V.; Pandey, A.K.; Buddhi, D.; Kothari, R. Thermal performance assessment of encapsulated PCM based thermal management system to reduce peak energy demand in buildings. Energy Build. 2016, 117, 44–52. [Google Scholar] [CrossRef]
  15. Alva, G.; Liu, L.; Huang, X.; Fang, G. Thermal energy storage materials and systems for solar energy applications. Renew. Sustain. Energy Rev. 2017, 68, 693–706. [Google Scholar] [CrossRef]
  16. Li, D.; Zheng, Y.; Liu, C.; Wu, G. Numerical analysis on thermal performance of roof contained PCM of a single residential building. Energy Convers. Manag. 2015, 100, 147–156. [Google Scholar] [CrossRef]
  17. Yan, J.; Wang, Q.; Li, K.; Sun, J. Numerical study on the thermal performance of a composite board in battery thermal management system. Appl. Therm. Eng. 2016, 106, 131–140. [Google Scholar] [CrossRef]
  18. Alshaer, W.G.; Nada, S.A.; Rady, M.A.; Barrio, E.P.D.; Sommier, A. Thermal management of electronic devices using carbon foam and PCM/nano-composite. Int. J. Therm. Sci. 2015, 89, 79–86. [Google Scholar] [CrossRef]
  19. Elfeky, K.E.; Ahmed, N.; Wang, Q. Numerical comparison between single PCM and multi-stage PCM based high temperature thermal energy storage for CSP tower plants. Appl. Therm. Eng. 2018, 139, 609–622. [Google Scholar] [CrossRef]
  20. Peiró, G.; Gasia, J.; Miró, L.; Prieto, C.; Cabeza, L.F. Experimental evaluation at pilot plant scale of multiple PCMs (cascaded) vs. single PCM configuration for thermal energy storage. Renew. Energy 2015, 83, 729–736. [Google Scholar] [CrossRef] [Green Version]
  21. Solomon, L.; Oztekin, A. Exergy analysis of cascaded encapsulated phase change material—High-temperature thermal energy storage systems. J. Energy Storage 2016, 8, 12–26. [Google Scholar] [CrossRef]
  22. Shamsi, H.; Boroushaki, M.; Geraei, H. Performance evaluation and optimization of encapsulated cascade PCM thermal storage. J. Energy Storage 2017, 11, 64–75. [Google Scholar] [CrossRef]
  23. Yuan, F.; Li, M.J.; Ma, Z.; Jin, B.; Liu, Z. Experimental study on thermal performance of high-temperature molten salt cascaded latent heat thermal energy storage system. Int. J. Heat Mass Transf. 2018, 118, 997–1011. [Google Scholar] [CrossRef]
  24. Aldoss, T.K.; Rahman, M.M. Comparison between the single-PCM and multi-PCM thermal energy storage design. Energy Convers. Manag. 2014, 83, 79–87. [Google Scholar] [CrossRef]
  25. Xu, Y.; He, Y.L.; Li, Y.Q.; Song, H.J. Exergy analysis and optimization of charging–discharging processes of latent heat thermal energy storage system with three phase change materials. Sol. Energy 2016, 123, 206–216. [Google Scholar] [CrossRef]
  26. Xu, H.J.; Zhao, C.Y. Thermal performance of cascaded thermal storage with phase-change materials (PCMs). Part I: Steady cases. Int. J. Heat Mass Transf. 2017, 106, 932–944. [Google Scholar] [CrossRef]
  27. Meng, Z.; Zhang, P. Experimental and numerical investigation of a tube-in-tank latent thermal energy storage unit using composite PCM. Appl. Energy 2017, 190, 524–539. [Google Scholar] [CrossRef]
  28. Atal, A.; Wang, Y.; Harsha, M.; Sengupta, S. Effect of porosity of conducting matrix on a phase change energy storage device. Int. J. Heat Mass Transf. 2016, 93, 9–16. [Google Scholar] [CrossRef]
  29. Primus, R.J.; Flynn, P.F. The Assessment of Losses in Diesel Engines Using Second Law Analysis; COMODIA, JSME: Tokyo, Japan, 1985. [Google Scholar]
  30. Al-Najem, N.M.; Diab, J.M. Energy-exergy analysis of a diesel engine. Heat Recovery Syst. CHP 1992, 12, 525–529. [Google Scholar] [CrossRef]
  31. Zhang, P.; Ma, F.; Xiao, X. Thermal energy storage and retrieval characteristics of a molten-salt latent heat thermal energy storage system. Appl. Energy 2016, 173, 255–271. [Google Scholar] [CrossRef]
  32. Almsater, S.; Alemu, A.; Saman, W.; Bruno, F. Development and experimental validation of a CFD model for PCM in a vertical triplex tube heat exchanger. Appl. Therm. Eng. 2017, 116, 344–354. [Google Scholar] [CrossRef]
  33. Youssef, W.; Ge, Y.T.; Tassou, S.A. CFD modelling development and experimental validation of a phase change material (PCM) heat exchanger with spiral-wired tubes. Energy Convers. Manag. 2018, 157, 498–510. [Google Scholar] [CrossRef]
  34. Jegadheeswaran, S.; Pohekar, S.D.; Kousksou, T. Exergy based performance evaluation of latent heat thermal storage system: A review. Renew. Sustain. Energy Rev. 2010, 14, 2580–2595. [Google Scholar] [CrossRef]
  35. Macphee, D.; Dincer, I. Thermodynamic analysis of freezing and melting processes in a bed of spherical PCM capsules. J. Sol. Energy Eng. 2009, 131, 031017-11. [Google Scholar] [CrossRef]
  36. Song, Z.; Deng, Y.; Li, J.; Nian, H. Expanded graphite for thermal conductivity and reliability enhancement and supercooling decrease of MgCl2⋅6H2O phase change material. Mater. Res. Bull. 2018, 102, 203–208. [Google Scholar] [CrossRef]
  37. Safari, A.; Saidur, R.; Sulaiman, F.A.; Xu, Y.; Dong, J. A review on supercooling of Phase Change Materials in thermal energy storage systems. Renew. Sustain. Energy Rev. 2017, 70, 905–919. [Google Scholar] [CrossRef]
  38. Zondag, H.A.; de Boer, R.; Smeding, S.F.; van der Kamp, J. Performance analysis of industrial PCM heat storage lab prototype. J. Energy Storage 2018, 18, 402–413. [Google Scholar] [CrossRef]
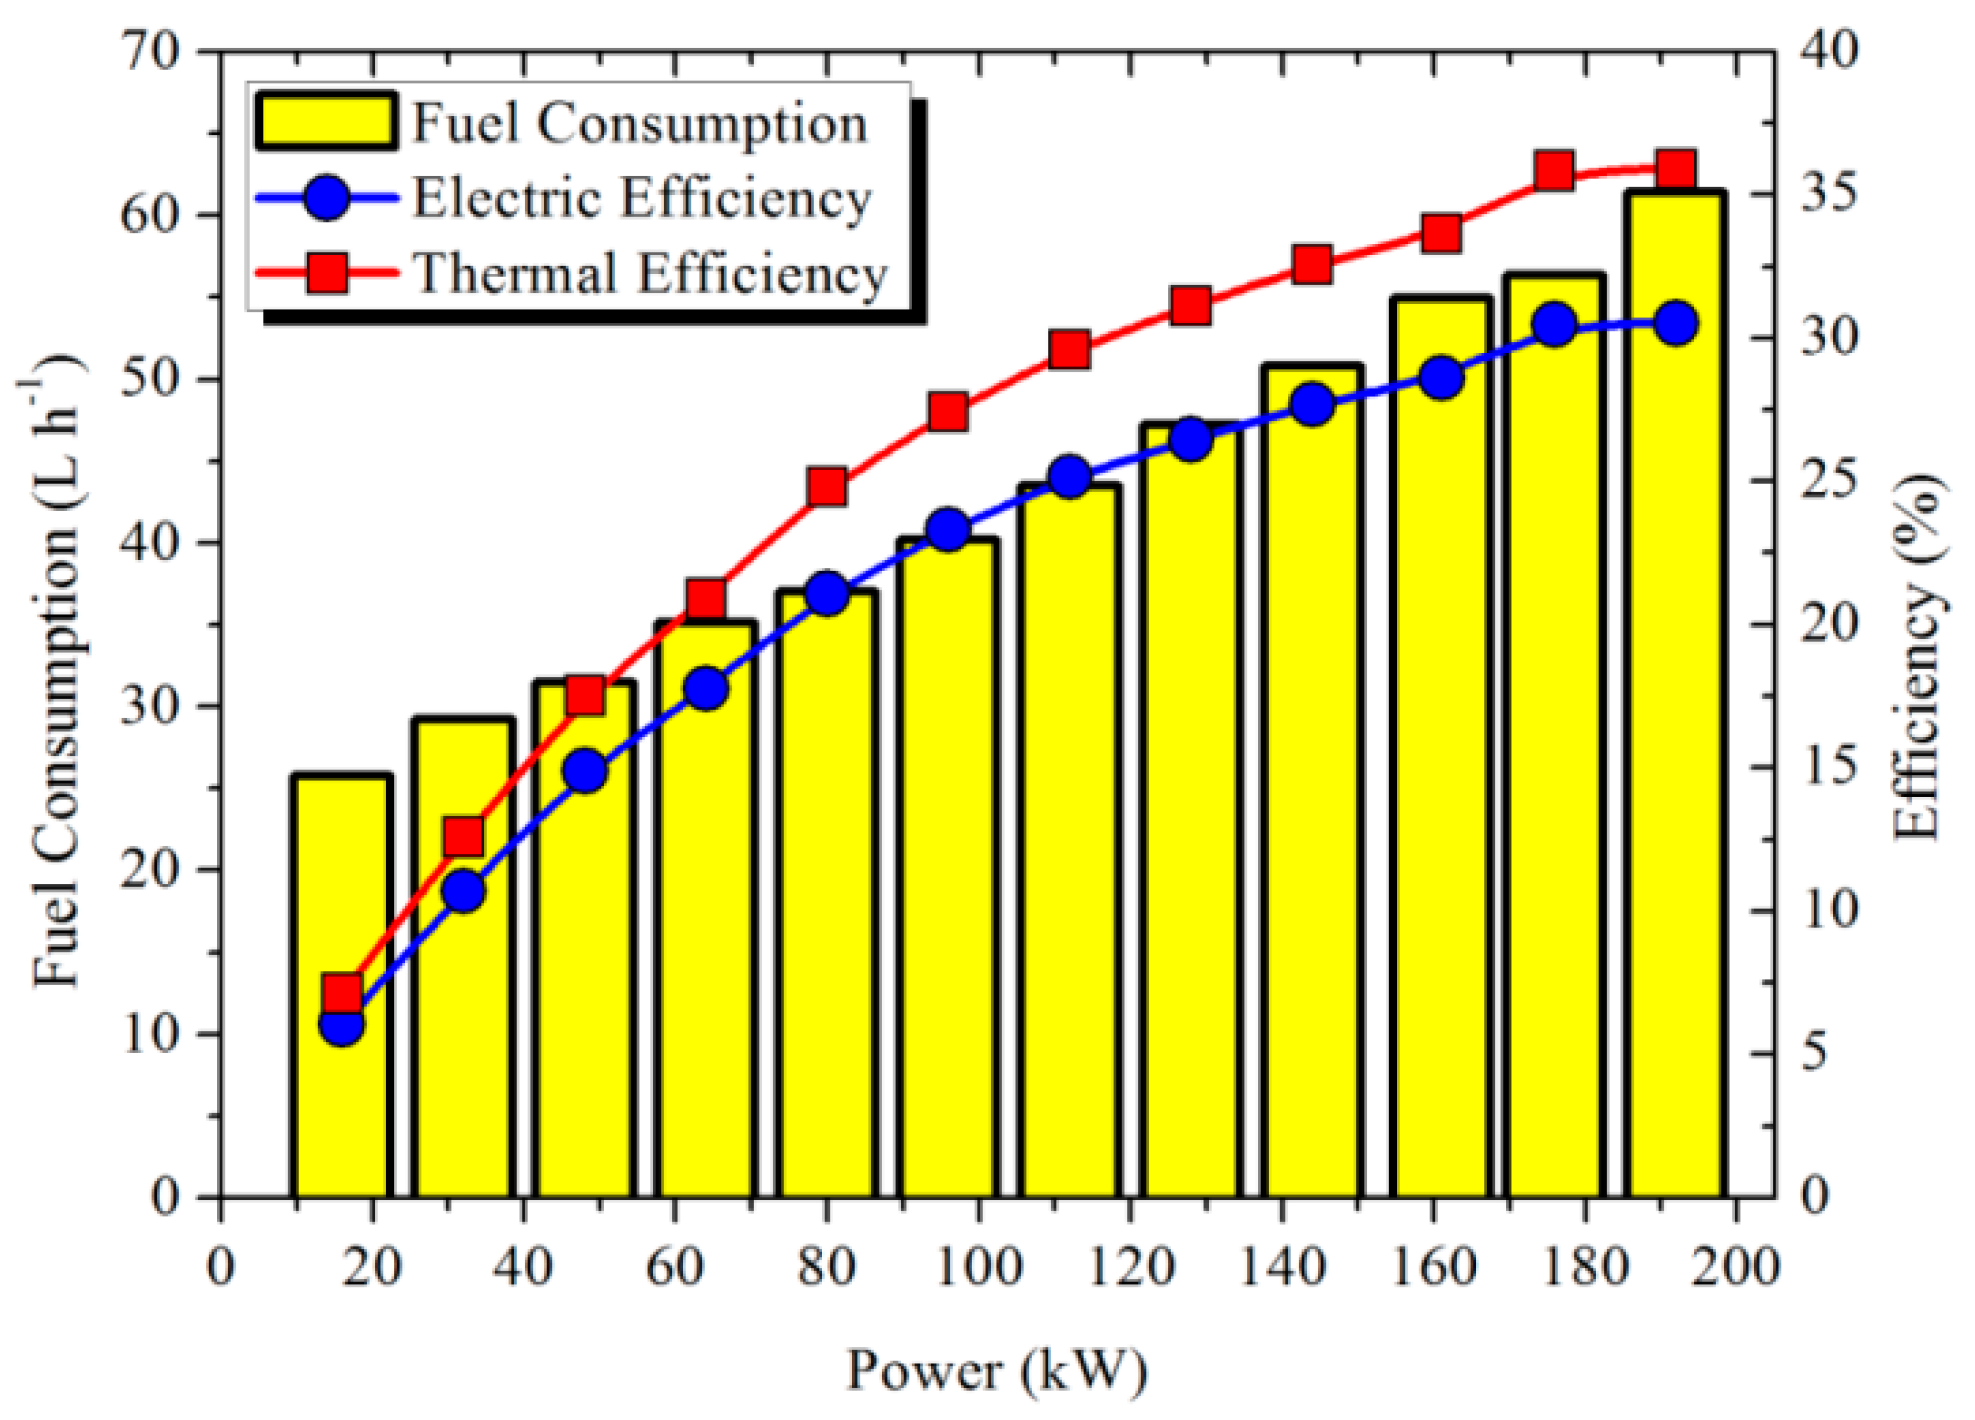
Figure 1. Demonstration system of cascaded phase change material (PCM) thermal storage for diesel engine flue gas heat recovery.
Energies 12 02121 g001
Figure 2. Gantt chart for the distributed generation system (DGS) operation.
Energies 12 02121 g002
Figure 3. Operation efficiency of the diesel engine.
Energies 12 02121 g003
Figure 4. Schematic diagram of the PCM thermal storage module.
Energies 12 02121 g004
Figure 5. Diagram of measurement point arrangement for thermal storage modules.
Energies 12 02121 g005
Figure 6. Initial heat charging process of the PCM thermal module.
Energies 12 02121 g006
Figure 7. Temperature variation of the flue gas in the charging process.
Energies 12 02121 g007
Figure 8. Temperature variation of PCMs with time in HTM during the charging process: (a) PCM temperature; (b) Part I.
Energies 12 02121 g008
Figure 9. Temperature variation of PCMs with time in LTM during the charging process: (a) PCM temperature; (b) Part II.
Energies 12 02121 g009
Figure 10. Energy and exergy stored in the tubes of HTM: (a) energy and (b) exergy.
Energies 12 02121 g010
Figure 11. Energy and exergy stored in the tubes of LTM: (a) energy and (b) exergy.
Energies 12 02121 g011
Figure 12. Comparison of the energy and exergy storage efficiencies between single-stage and two-stage storage.
Energies 12 02121 g012
Figure 13. Temperature variation of PCMs with time in LTM during the discharging process: (a) PCM temperature; (b) Part I.
Energies 12 02121 g013
Figure 14. Temperature variation of PCMs with time in HTM during the discharging process: (a) PCM temperature; (b) Part II.
Energies 12 02121 g014
Figure 15. Energy and exergy stored in the tubes of LTM: (a) energy and (b) exergy.
Energies 12 02121 g015
Figure 16. Energy and exergy stored in the tubes of HTM: (a) energy and (b) exergy.
Energies 12 02121 g016
Figure 17. Variation of the air temperature in the release process.
Energies 12 02121 g017
Figure 18. Energy and exergy released from the PCM storage modules.
Energies 12 02121 g018
Table 1. Experimental parameters of diesel engine operation.
Electric Load (kW)Gas Temperature (K)Gas Flow Rate (Nm3 h−1)Fuel Consumption (10−3 Nm3 h−1)
19292558261.40
17688358056.39
16084156254.94
14479655250.78
12876152447.23
11272550337.02
9668148040.19
8064047437.02
6459345235.15
4855844131.46
3251742929.21
1647541225.78
Table 2. Physical properties of the PCMs (tested in the lab).
ParametersCarbonate PCMsNitrate PCMs
Tpc (K)760560
λ (W m−1 K−1)42.5
c pcm s (kJ kg−1 K−1)1.11.0
c pcm l (kJ kg−1 K−1)1.21.1
Hpcm (kJ kg−1)190103
Table 3. Parameters of thermal storage modules.
(a) High-temperature module (HTM: Carbonate PCMs)
ParametersValueParametersValue
T pcm max (K)870 T gas max (K)930
m pcm i (kg)7.46 m tube i (kg)12.34
ctube (kJ kg−1 K−1)0.5Dtube (×10−3 m)Φ88 × 4
dtube (×10−3 m)Φ30 × 3Ltube (×10−3 m)1200
ST (×10−3 m)140SL (×10−3 m)70
L × W × H (×10−3 m)1400 × 980 × 1200N124
(b) Low-temperature module (LTM: Nitrate PCMs)
ParametersValueParametersValue
T pcm max (K)660 T gas max (K)660
m pcm i (kg)10.37 m tube i (kg)15.43
ctube (kJ kg−1 K−1)0.5Dtube (×10−3 m)Φ88 × 4
dtube (×10−3 m)Φ30 × 3Ltube (×10−3 m)1500
ST (×10−3 m)140SL (×10−3 m)70
L × W × H (×10−3 m)1680 × 1400 × 1500N219
Table 4. Standard uncertainties for the components.
U1 (°C)U2 (°C)U3 (%)U4 (%)U5 (%)
0.510.50.80.9
Table 5. Efficiency of the release process.
LTMHTMSystem
η Q rel = 49.2% η Ex rel = 36.8% η Q rel = 43.2%
η Ex rel = 41.8% η Ex rel = 39.4% η Ex rel = 40.4%

