1. Introduction
Direct current (DC)–DC converters, which are used, e.g., in switch mode power supplies and semiconductor devices, also contain magnetic elements used to store electrical energy [
1]. In recent years, more and more papers focused on modeling power losses in magnetic elements and on examining the influence of power losses in these elements on the characteristics of electronic equipment [
1,
2,
3,
4,
5,
6,
7,
8,
9,
10,
11,
12].
The aspiration to minimize the sizes of power supplies and to increase the frequency of the control signal causes an increase in power loss density in ferromagnetic cores and, consequently, limits the watt-hour efficiency of DC–DCconverters [
2,
8,
9,
10,
12]. Losses in magnetic material can be caused, e.g., by hysteresis of the magnetizing curve or by eddy currents [
13]. Values of power loss components depend on many factors, e.g., the type of magnetic material used, the amplitude and frequency of the waveforms of magnetic flux density, and their shape [
5,
13,
14,
15,
16,
17,
18,
19,
20].
In previous studies [
13,
16,
17,
18,
19], the methods for computing power losses in magnetic materials based on modifications of the Steinmetz model, defined as improved Steinmetz equation (ISE) or modified Steinmetz equation (MSE), were presented. In these models, the shape of the waveform of the excitation signal is taken into account; however, the influence of temperature on the properties of magnetic materials and on the parameters of the considered model is not taken into account. Yet, in the presented research results, among others, ferrite materials such as N87 were used, whose properties strongly depend on temperature. In addition, as stated in the cited papers, these models are valid only for a low value of frequency up to 20 kHz.
In turn, in Reference [
15], a new model called I2SE was proposed. This model is an extended version of the ISE model. In this model, five additional parameters related to the relaxation process are added. However, the mentioned model also does not take into account the influence of temperature on the properties of magnetic materials and their power loss. Additionally, the presented description does not allow its implementation in the SPICE software. In Reference [
5], three models of a ferromagnetic core were proposed. The first was a linear model, the second was a non-linear isothermal model that uses the classic Jiles–Atherton model to describe the magnetization curve, and the third was an electrothermal model of the ferromagnetic core. The electrothermal model took into account influence of temperature on core properties, but unfortunately contained a formal error, which did not allow computing power losses based on the magnetization curve obtained from this model.
Reference [
12] presented a method of modeling power losses in the core of the inductor, which is a component of the boost converter. The results of computations using the various models described, among others [
13,
16,
17,
19], were compared to the results obtained using the authors’ model given in Reference [
3], which took into account the influence of temperature, frequency, and the shape of magnetic flux density on the properties of magnetic materials and power losses in the ferromagnetic core of an inductor.
In References [
2,
14,
21,
22], much emphasis was given to the analysis of the influence of losses in semiconductor devices on the characteristics of DC–DC converters. Yet, losses in the cores of magnetic elements were omitted in these analyses. The problem of the influence of models of power losses in ferromagnetic cores on the characteristics of buck and boost converters was also considered in References [
13,
20]. In the cited papers, it was shown that the use of classical models described References [
14,
23] can cause significant underestimation of power losses in the core. The observed changes in the values of power losses can increase three-fold. In addition, most of the presented models are based on a linear approximation of the real characteristics of inductors or transformers. Such an approach may cause overstated or understated watt-hour efficiency of electronic circuits [
19,
24,
25].
On the other hand, in Reference [
26], the average electrothermal model of an inductor was described; it took into account the dependence of power losses in ferromagnetic materials on frequency and temperature. The investigations were carried out for the boost converter. Reference [
27] presented the results of computations for the boost converter using the electrothermal model of an inductor and hybrid models of diodes and transistors.
The aim of this paper was to analyze the influence of power losses in the inductor core on the characteristics of selected DC–DC converters. Investigations are performed for buck and boost converters including inductors with cores made of different ferromagnetic materials. The authors’ model of losses in the ferromagnetic core is used in computations performed with the use of the Excel software. The dependences of power losses in the inductor core and watt-hour efficiency of the considered DC–DC converters on load resistance, input voltage, and switching frequency are computed. The influence of selection of the material used to make the inductor core on the properties of the considered converters is discussed.
In
Section 2, the Steinmetz, the natural Steinmetz, and the authors’ models of power losses occurring in magnetic materials are described.
Section 3 presents the investigated converters, while
Section 4 outlines the results of computations obtained using the chosen models.
2. Model of Power Losses in the Core of an Inductor
In the literature, many papers focusing on power losses per unit of volume (
PV) in magnetic materials proposed power loss models of the inductor core. Unfortunately, some models did not have the analytical dependence describing losses in the ferromagnetic core. This makes it impossible to implement these models in an easy way using computer programs. Many models were described in References [
12,
20]; however, they concerned models of power losses in magnetic materials which took into account the triangular shape of amplitude of magnetic flux density in the core. The Steinmetz model [
23] was also considered in these papers as the first model of power losses in magnetic materials, shown below.
where
k,
α, and
β are material parameters,
Bm is the amplitude of magnetic flux density, and f is the frequency.
The results given in Reference [
20] showed that differences between values of power dissipated in the inductor core computed with the use of the models described in References [
13,
23] and the catalog data reached as high as 60%. In contrast, the results of computations performed with the use of the core model described in Reference [
3] adequately fit the catalog data. In practice, this means that the use of classical models to describe power losses in the core, given in References [
13,
23] makes it impossible to obtain correctly computed values of power losses. Differences between the values obtained with the authors’ model given in Reference [
3] and the considered literature models are largest at high values of temperature, frequency of the control signal, and input voltage [
20]. In turn, the results given in Reference [
12] showed that, in order to compute power losses of the inductor core included in the boost converter, it is essential to take into account the shape of the waveform of magnetic flux density and the influence of temperature and frequency on the properties of magnetic materials. Omitting the influence of the mentioned factors could cause overestimation of power losses in the core of an inductor, exceeding even 75% [
12].
In addition, the use of the classical Steinmetz model [
23] to compute power losses in magnetic materials is justified in the range of low frequency not exceeding 25 kHz [
12]. For frequency values higher than 25 kHz, power losses in the magnetic material per unit volume increase by up to 15% [
3,
12].
In Reference [
28], it was shown that the total power losses in the toroidal core of a transformer are the sum of hysteresis losses and eddy current losses. The eddy current losses are computed on the basis of Equation (2).
where
σF is the conductivity of the material,
Bm is the amplitude of sinusoidal magnetic flux density at frequency
f, and dd is the thickness of the sheet.
Reference [
29] presented the procedure for formulating a general model of power losses frequently appearing in previous models; however, the drawback of this model was the fact that it is dedicated to laminated sheets and was verified only for frequencies up to 2 kHz.
In Reference [
30], the results of investigations on how to compute power losses in soft magnetic materials as a result of the movement of single Bloch walls during magnetization of magnetic material were presented. The well-defined domain structures of the equation with limited accuracy were additionally formulated. The conclusions presented in the cited paper allowed determining trends of power losses in different ferromagnetic materials [
3].
For example, Reference [
13] showed a method of modeling power losses in magnetic materials, called the natural Steinmetz extension (NSE). This method can be used for sinusoidal and triangular waveforms of magnetic flux density. In the cited paper, it was shown that the coefficients
α,
β, and
kw of the proposed model significantly depend on frequency and temperature. Yet, no analytical dependence describing such influence was given.
In Reference [
3], dependences describing power losses in magnetic materials which took into account the influence of temperature and frequency of B(t) on the power losses and on the parameter
β were proposed. The formula describing power loss density has the following form [
3]:
where
αp is the temperature coefficient of losses in ferromagnetic material,
TR is the core temperature,
Tm is the temperature at which the material has the smallest loss, and parameter
Pv0 is described by Equation (4) [
3].
where
a,
a1,
a2,
f0,
f1,
f2, and
f3 are material parameters.
In turn, parameter
β is described by Equation (5) [
3].
where
αT is a material parameter.
For the triangular waveform of magnetic flux density, power losses in magnetic material can be computed from the dependence shown in Equation (6) [
3].
where
d denotes the duty factor of the triangular waveform.
In
Table 1, model parameter values for the core model from Reference [
3] for selected magnetic materials are shown. The investigations were carried out for inductors containing cores made of powdered iron (RTP), ferrite material (RTF), and nanocrystaline material (RTN).
The method of estimating the parameter values of the authors’ model given in Reference [
3] was described in detail in Reference [
31], while material parameters (
α) of the Steinmetz model described in Reference [
23] had the same values as for the model parameters presented in Reference [
3], and parameters
k and
β were computed using the transformed Equation (1) with the catalog data of power losses per unit volume (
Pv) in magnetic material at a specific value of frequency (
f) and amplitude of magnetic flux density (
Bm).
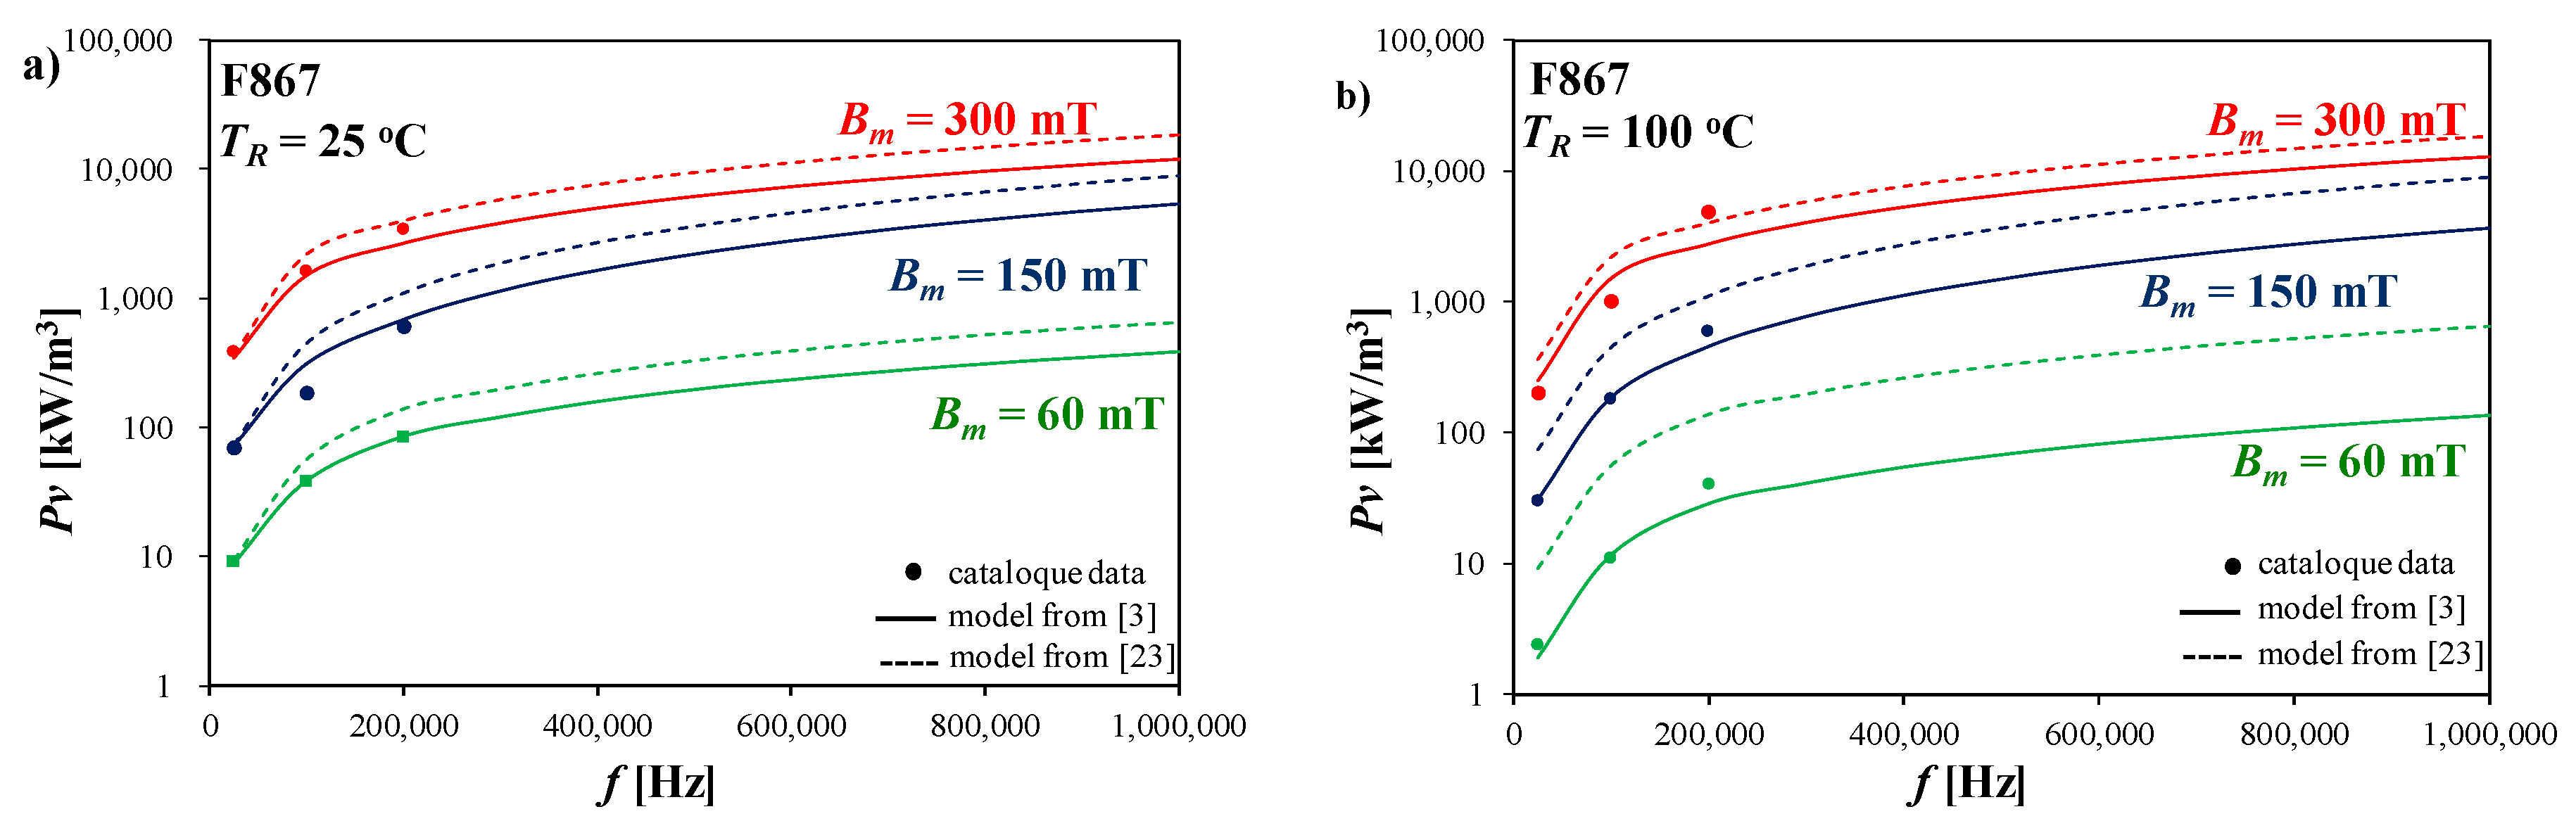
Figure 1 shows the dependence of power loss density in ferrite material (RTF) for two core temperatures equal to 25 °C (a) and 100 °C (b) in a wide range of frequency changes. In
Figure 1,
Figure 2 and
Figure 3, points denote the catalog data [
32], the solid lines denote the results of computations obtained using the model from Reference [
3] described by Equations (3)–(5), and the dashed lines denote the results of computations using the model from Reference [
23] described by Equation (1).
As can be seen in
Figure 1, with an increase in frequency, power losses in the magnetic material increase at a different value of amplitude of magnetic flux density. It is also worth noting that good agreement between the catalog data and computations made with the use of the model given in Reference [
3] was obtained for both considered values of temperature.
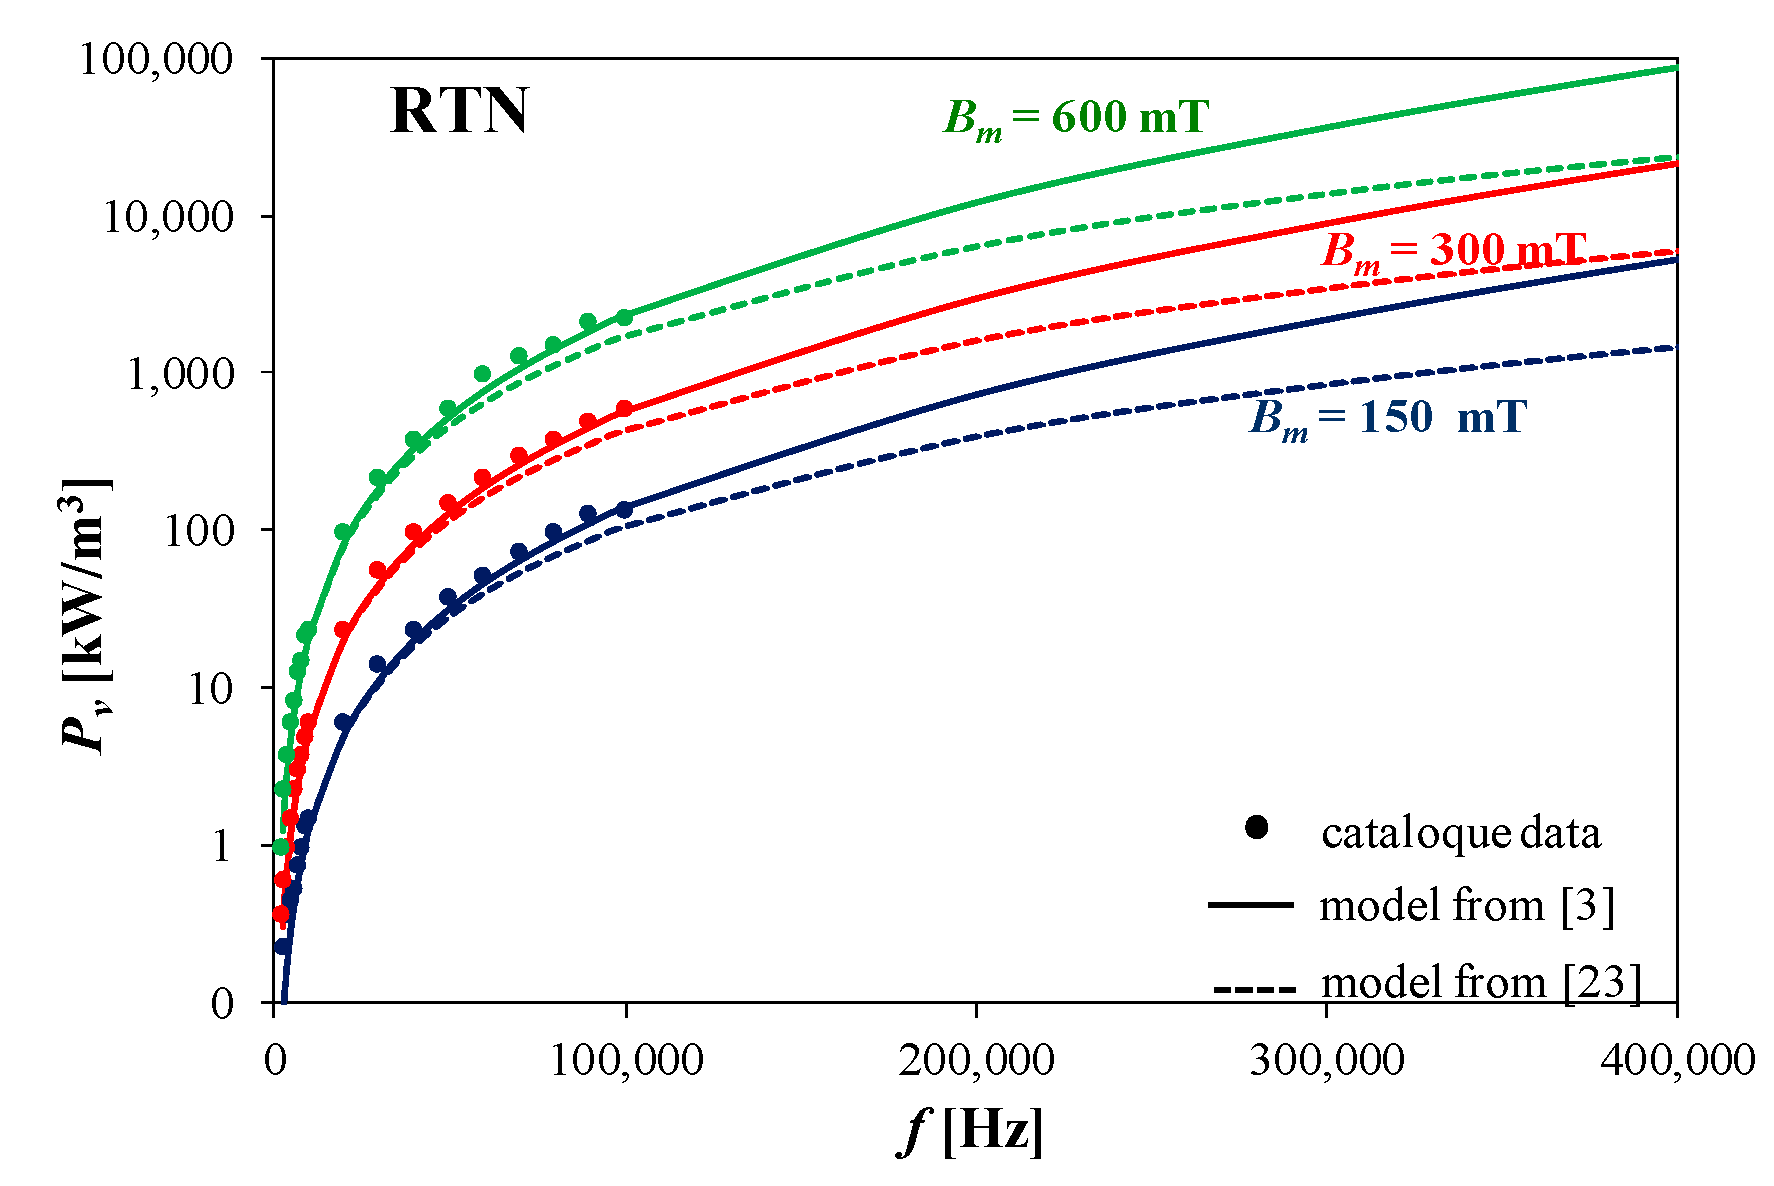
Figure 2 shows the dependence of power loss density in nanocrystalline material (RTN) on the frequency at three values of amplitude of magnetic flux density equal to 150, 300, and 600 mT. As can be seen, power losses in the nanocrystalline material increase with an increase in frequency. Also, good agreement between the catalog data [
33] and the results of computations performed with the use of the model from Reference [
3] was obtained.
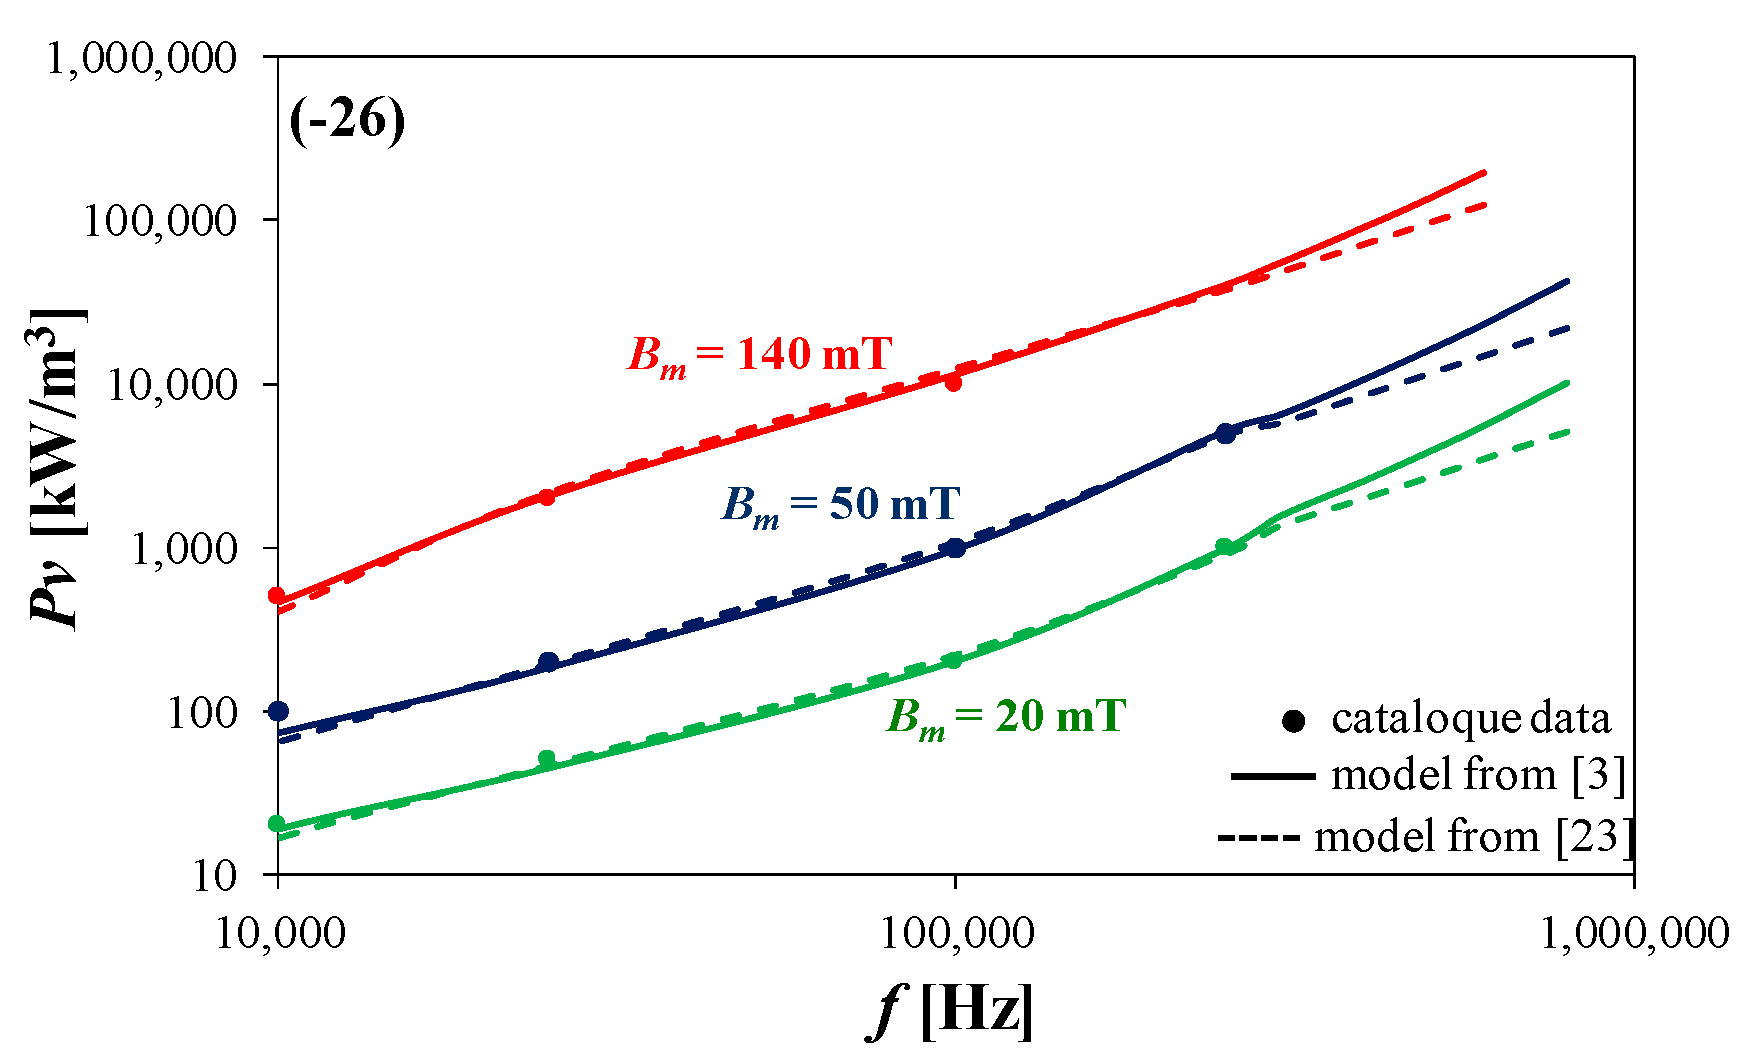
Figure 3 presents the dependence of power losses per unit volume (
Pv) in the core made of powdered iron (RTP) material on the frequency. As can be seen, as for cores made of the other considered materials (RTN, RTF), power losses per unit of volume increase with an increase in frequency, also leading to good agreement between the catalog data and the results of computations performed with the use of the model from Reference [
3].
The results presented in
Figure 1,
Figure 2 and
Figure 3 show that the authors’ model ensures good agreement between the computed and catalog dependences of power losses on frequency, amplitude of magnetic flux density, and temperature. In turn, the Steinmetz model gives the value of these losses even several times higher. Differences between the results of computations made using both the considered models are particularly high for the ferrite core (F867). For the core made of powdered iron (−26), the results obtained with both the models are practically identical. For the nanocrystalline core (RTN), the computed values of power loss using the Steinmetz model are lower than the values of power loss using the authors’ model and the catalog data in the range of high frequency.
In order to compute power losses in the inductor core, it is necessary to multiply losses expressed with Equations (1), (3), and (6) by the equivalent volume of the core (Ve).
As mentioned earlier, omission of the dependence of power losses in the magnetic material on the frequency, temperature, and the shape of magnetic flux density can cause a significant overstatement of power losses in the inductor core. As shown in Reference [
20], a significant effect on power losses in magnetic materials results from the shape of the magnetic flux density B(t) waveform. The data provided by the manufacturers usually refer to the case when the waveform of magnetic flux density B(t) is sinusoidal. The ferromagnetic core, being a component of such magnetic elements as an inductor, is generally used in systems in which the waveform of magnetic flux density is triangular. Therefore, in order to determine the influence of power losses on the characteristics of the buck and boost converter, computations were carried out taking into account the triangular waveform of magnetic flux density, and power losses in the inductor core were computed from the dependence in Equation (6). As can be seen from the dependence in Equation (6), power losses in the core of an inductor operating in a DC–DC converter depend on the frequency, amplitude of magnetic flux density, and duty factor of the signal controlling the transistor.
3. Investigated Converters
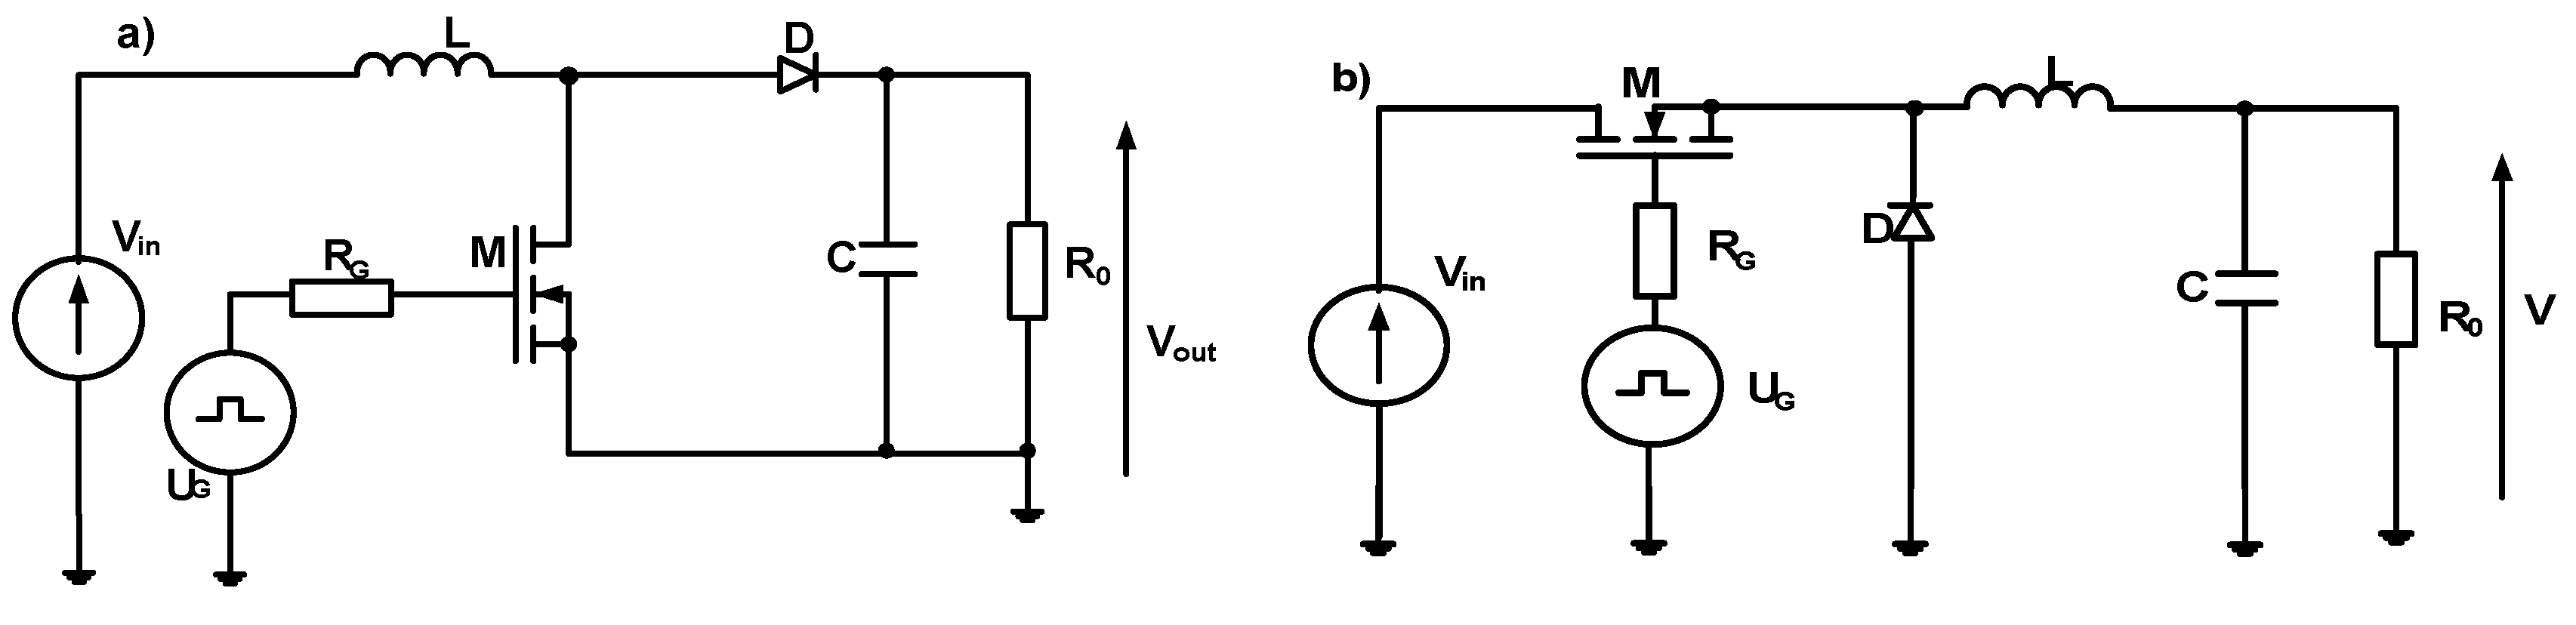
In order to investigate the influence of power losses in the inductor core on the properties of selected DC–DC converters, computations were performed for the boost converter and the buck converters, whose electrical diagrams are shown in
Figure 4.
In the tested converters, the diode and the transistor are modeled as ideal switches. In this case, power losses are dissipated in inductor
L only. In order to compute such losses in magnetic materials, the value of amplitude of magnetic flux density should be computed using the following formula [
12,
22]:
where
SFe denotes the cross-section area of the core,
z is the number of turns, and Δ
IL is the peak-to-peak value of inductor current. In the boost converter, the value of Δ
IL is computed with the following formula [
12,
22]:
where
Vin is the value of input voltage of the boost converter.
In turn, the peak-to-peak value of inductor current Δ
IL for the buck converter is computed with the following formula [
12,
22]:
As resulting from Equation (7), the value of amplitude of magnetic flux density is a function of the number of turns, inductance, cross-section area of the core, input voltage of the converter, the duty cycle, and the period of switching. It is important that the converter operation mode does not influence the formula describing power losses of the inductor core.
For the boost converter operating in continuous conducting mode (CCM), the value of the output voltage depends only on input voltage and the control signal duty cycle, and it is described as follows:
On the other hand, for the boost converter operating in discontinuous conducting mode (DCM), the converter output voltage is described as follows [
21]:
The boost converter operates in CCM mode if the following formula is fulfilled:
In turn, output voltage of the buck converter operating in CCM mode for a given input voltage (
Vin) and duty cycle of the control signal (
d) is described in Equation (13) [
22].
Output voltage of the buck converter operating in DCM mode is given in Equation (14) [
22],
and depends on inductance of inductor
L, output current
I0, and the period of the control signal
T.
The buck converter operates in DCM mode when the following dependence is fulfilled:
4. Results of Computations
In order to verify the influence of power losses in the inductor core on selected DC–DC converters, computations using the model presented in Reference [
3] and described by Equations (3)–(6) were performed with the Excel software. The accuracy of the calculations is limited by the accuracy of the used models of power losses in the inductor core and by the model DC–DC converter characteristics.
As a further consideration, the model of inductor core losses from Reference [
3] was chosen because, as can be seen in
Figure 1,
Figure 2 and
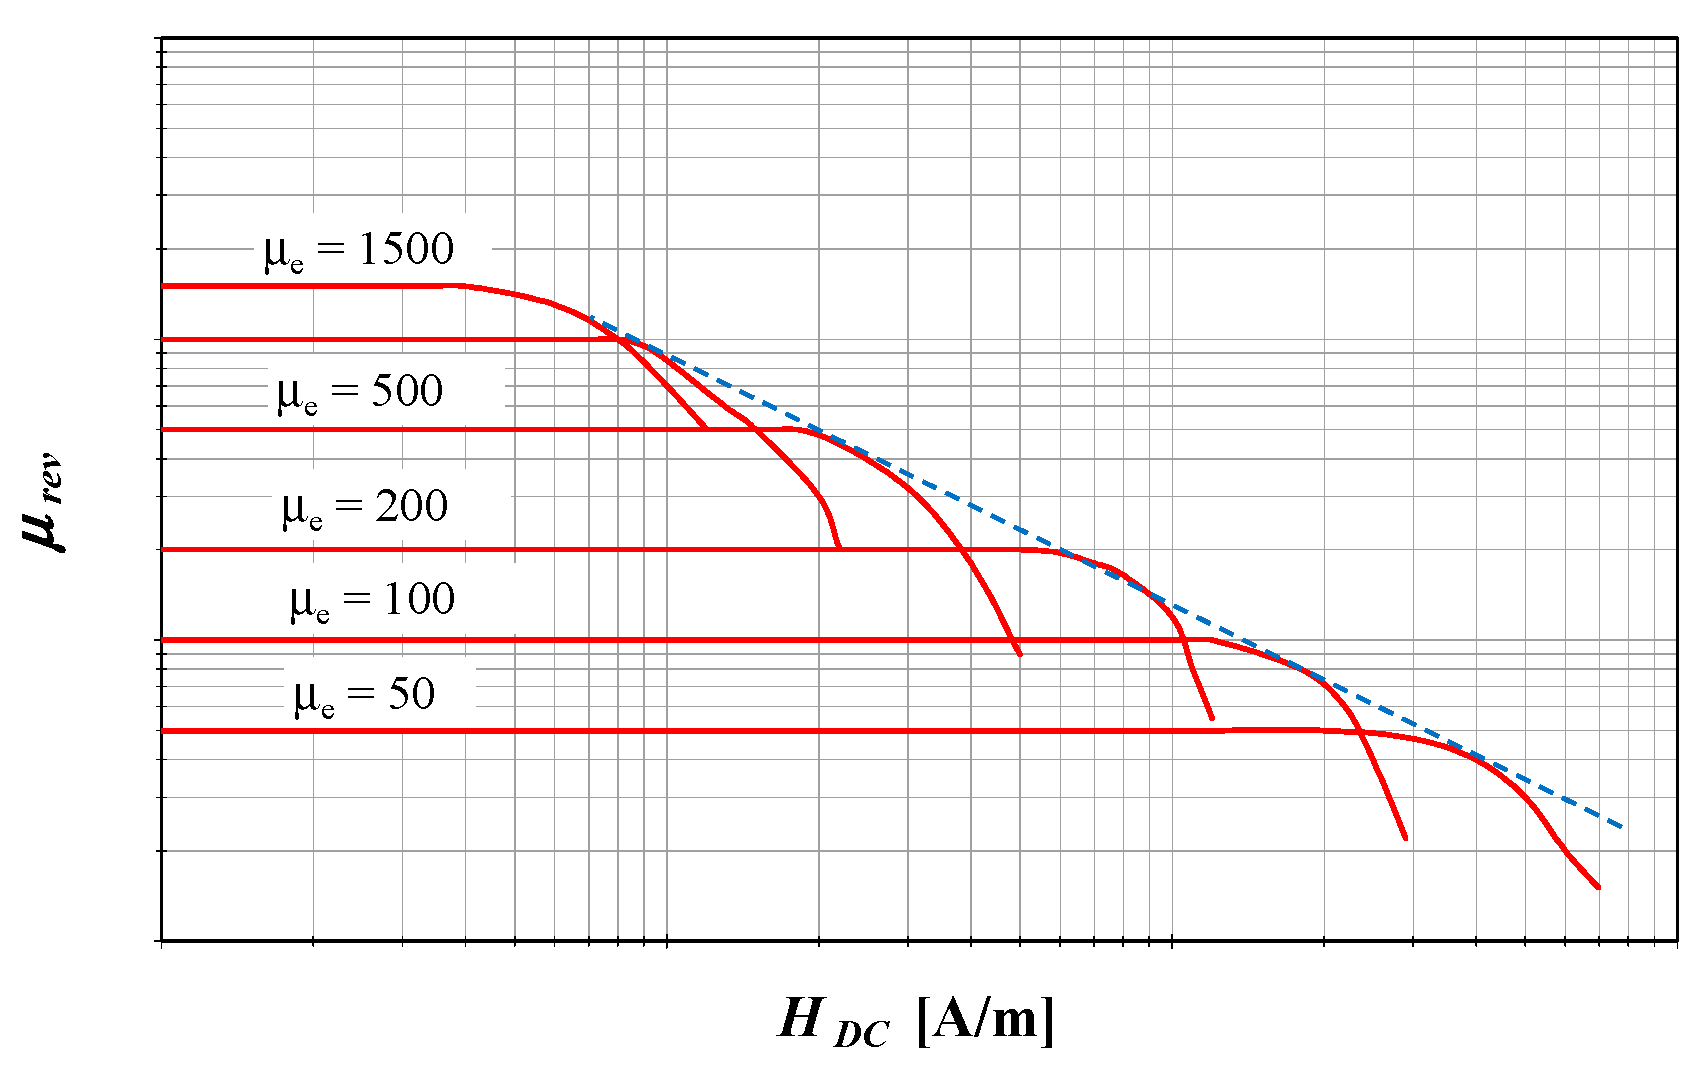
Figure 3, it correctly models the losses in magnetic materials. In addition, the selected model takes into account the triangular waveform of magnetic flux density. In the considerations, it is assumed that inductance of the inductor is constant for all the considered materials as a result of the air gap occurring in the core in a given range of changes of the magnetic field, as shown in
Figure 5 [
34]. Investigations were carried out for ring cores made of ferrite (RTF), powdered iron (RTP), and nanocrystalline material (RTN) [
31,
32,
33,
35]. In order to emphasize the influence of power losses on the characteristics of the considered circuits, inductor cores of large size were chosen for testing. The company Ferryster [
35] offers toroidal cores with the outside diameter of the considered cores equal to 102 mm, the internal diameter equal to 57.3 mm, and the height equal to 33 mm. In the computations, each of the considered cores had identical size, and, due to differences in the length of the air gap, each inductor had the same inductance (
L = 100 µH), while 27 winding turns and a cross-section area (
SFe) of 737.55 mm
2 were adopted.
In order to compute the value of magnetic flux density, the dependence in Equation (7) was used assuming inductance L as constant. The peak-to-peak current value ΔIL was computed using the dependence in Equation (8) for the boost converter and the dependence in Equation (9) for the buck converter.
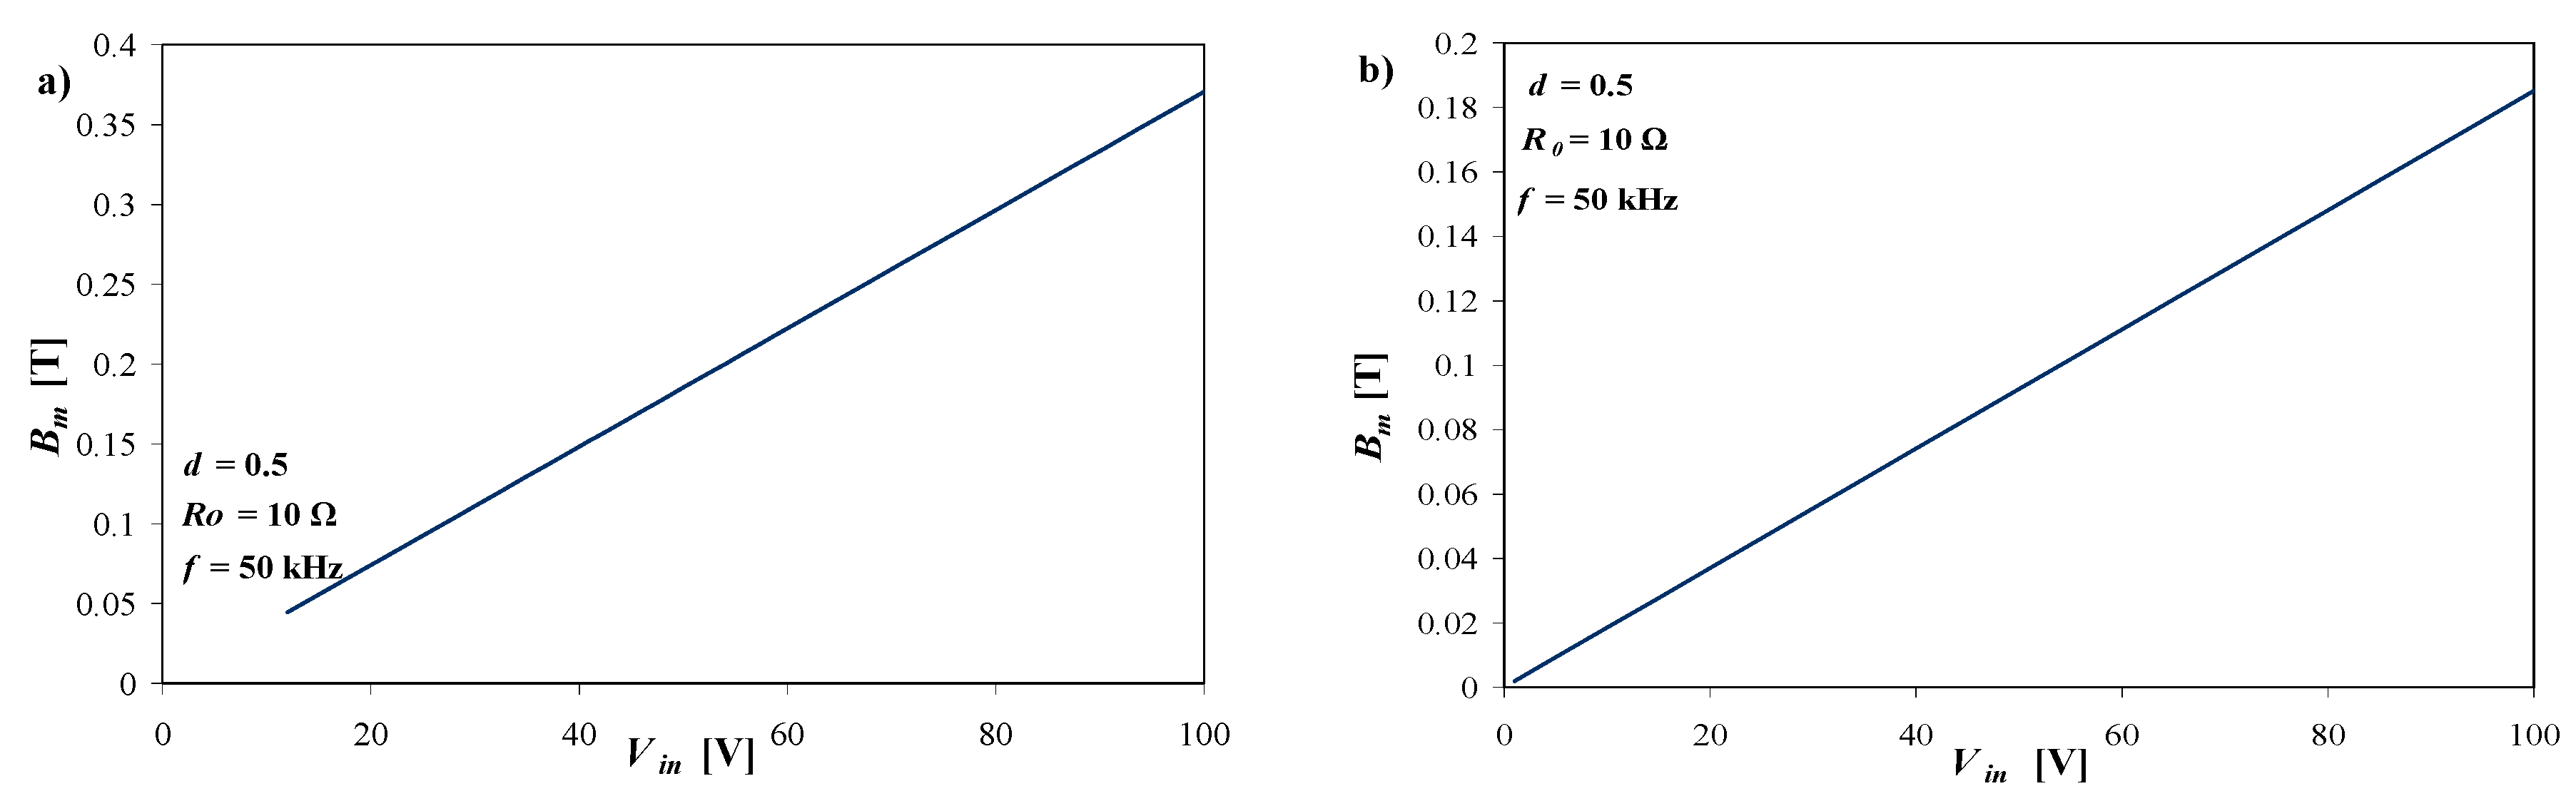
Figure 6 presents the dependence of the amplitude of magnetic flux density on the input voltage of the boost converter (
Figure 6a) and the buck converter (
Figure 6b). In order to compute the value of amplitude of magnetic flux density, Equation (7) was used. All the presented characteristics in this section were determined on the assumption that the duty cycle was equal to 0.5.
As shown in
Figure 6, the dependence of amplitude of magnetic flux increases linearly with an increase in input voltage, obtaining values up to 350 mT for the boost converter and 180 mT for the buck converter at an input voltage equal to 100 V.
Later in this section, ferromagnetic cores used in the inductor contained in the considered converters are denoted with as follows: powder iron core (−26, RTP), nanoctrystalline core (M070, RTN), and ferrite core (F867, RTF).
Figure 7,
Figure 8 and
Figure 9 present the influence of input voltage
Vin, control signal frequency, and load resistance of the boost converter on power losses in the inductor core and the watt-hour efficiency of the converter for three considered materials used to build the inductor core (i.e., RTP, RTF, and RTN). Values of watt-hour efficiency were computed as follows:
where
PR denotes power losses in the inductor core computed using Equations (4)–(6).
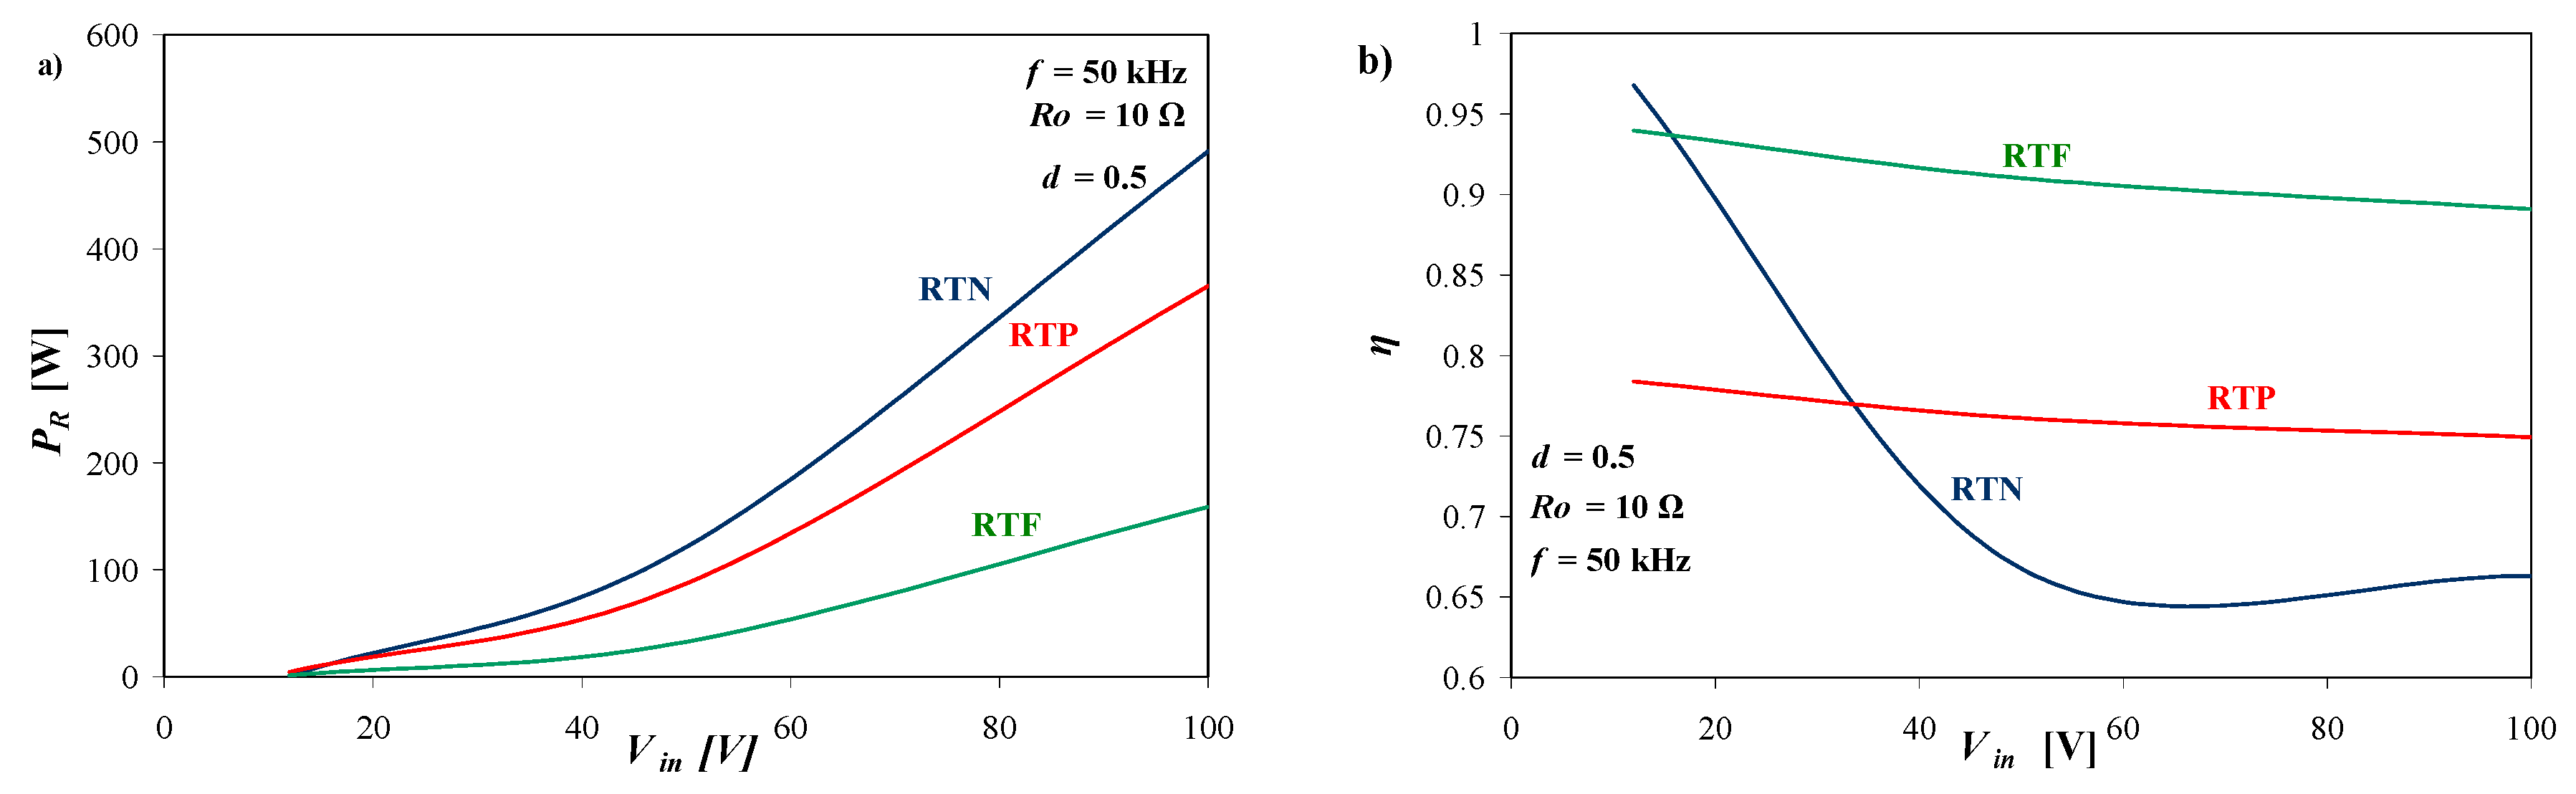
Figure 7 presents the influence of input voltage on power losses in the inductor core and the watt-hour efficiency of the boost converter.
Dependences of power losses in the inductor core and the watt-hour efficiency as a function of input voltage of the considered converters presented in
Figure 7 and
Figure 8, and in
Figure 10 and
Figure 11 were computed using Equations (6) and (16), respectively.
In order to compute watt-hour efficiency, it is necessary to compute power losses in the inductor core using Equation (6); the resistance R0 value was deemed constant and equal to 10 Ω. At this value of resistance R0, converters are in CCM mode. By changing the value of input voltage Vin, the output voltage Vout of the boost converter can be computed from the dependence in Equation (10) or from Equation (13) for the buck converter. Computations were performed at a constant value of the control signal duty cycle d = 0.5.
In turn, in order to compute the dependence of the watt-hour efficiency on load resistance in a wide range of R0 changes, Equation (16) was used, and a change in the operation mode of the converter from CCM to DCM was taken into account. Limit values of resistance Ro, corresponding to transition between the range of CCM and DCM, were computed by means of the inequalities in Equations (12) and (15). Output voltage values were computed using the dependences in Equations (11) and (14) for CCM and DCM, respectively. The value of power losses (PR) was computed using Equation (6).
As shown in the figures, an increase in input voltage of the boost converter causes an increase in power losses in the inductor core for all the considered materials. However, the highest value of these power losses was obtained for the inductor containing the core made of nanocrystaline material (about 500 W at Vin = 100 V), while the lowest value of these power losses was obtained for the ferrite core (120 W at Vin = 100 V).
In turn, watt-hour efficiency was highest for the inductor containing the core made of ferrite material in the whole considered range of input voltage (η ≥ 0.9), and the lowest value of watt-hour efficiency was obtained for the inductor containing the nanocrystalline core. It is worth noting that, for the range of input voltage from 10 to 40 V, the watt-hour efficiency of the converter containing an inductor with the nanocrystalline core decreased from 0.9 to 0.65.
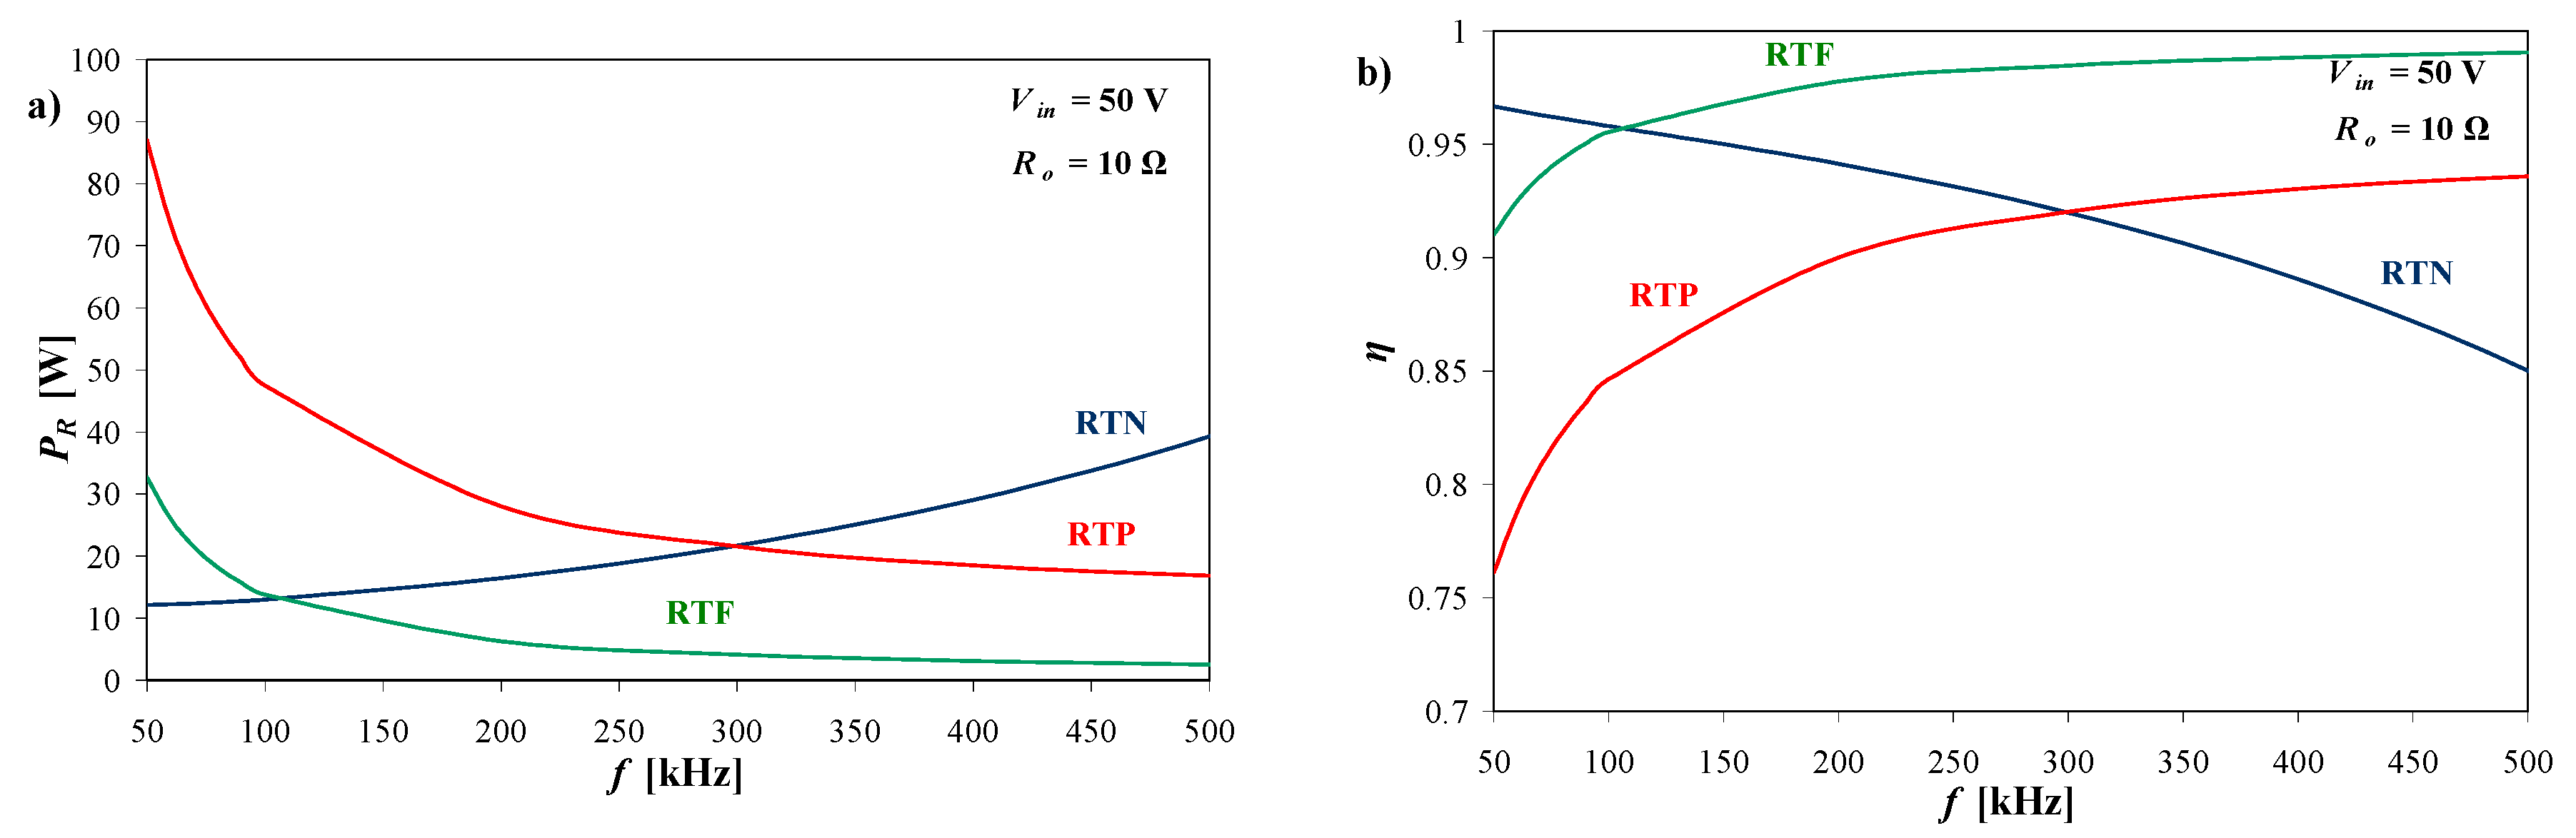
Figure 8 presents the influence of the control signal frequency on power losses in the inductor core and the watt-hour efficiency of the boost converter.
The dependence of power losses in the inductor core made of ferrite (RTF) and powdered iron (RTP) decreased with an increase in frequency. In the considered range of frequency for the RTP core, power losses decreased from 86 W to 16 W, whereas, for the RTF core, they decreased from 32 W to 3 W. In turn, for the core made of nanocrystalline material, the considered dependence was a monotonically increasing function, and power losses increased from 12 W to 39 W. The highest power losses in the core were observed at f = 50 kHz (87 W for RTP), whereas, at frequency f = 500 kHz, this power was equal to 41 W for RTN. In turn, the watt-hour efficiency of the boost converter was an increasing function of frequency for the inductor containing RTF or RTP cores, whereas this efficiency was a decreasing function of frequency for the inductor containing the RTN core. The highest watt-hour efficiency equal to 0.98 was obtained for the converter containing an inductor with the RTF core at frequency f > 250 kHz, whereas, for this converter containing the inductor with the RTP core, the highest value of watt-hour efficiency was equal to 0.92. In turn, the watt-hour efficiency of the boost converter with the inductor including the RTN core decreased in the considered range of frequency from 0.97 to 0.84.
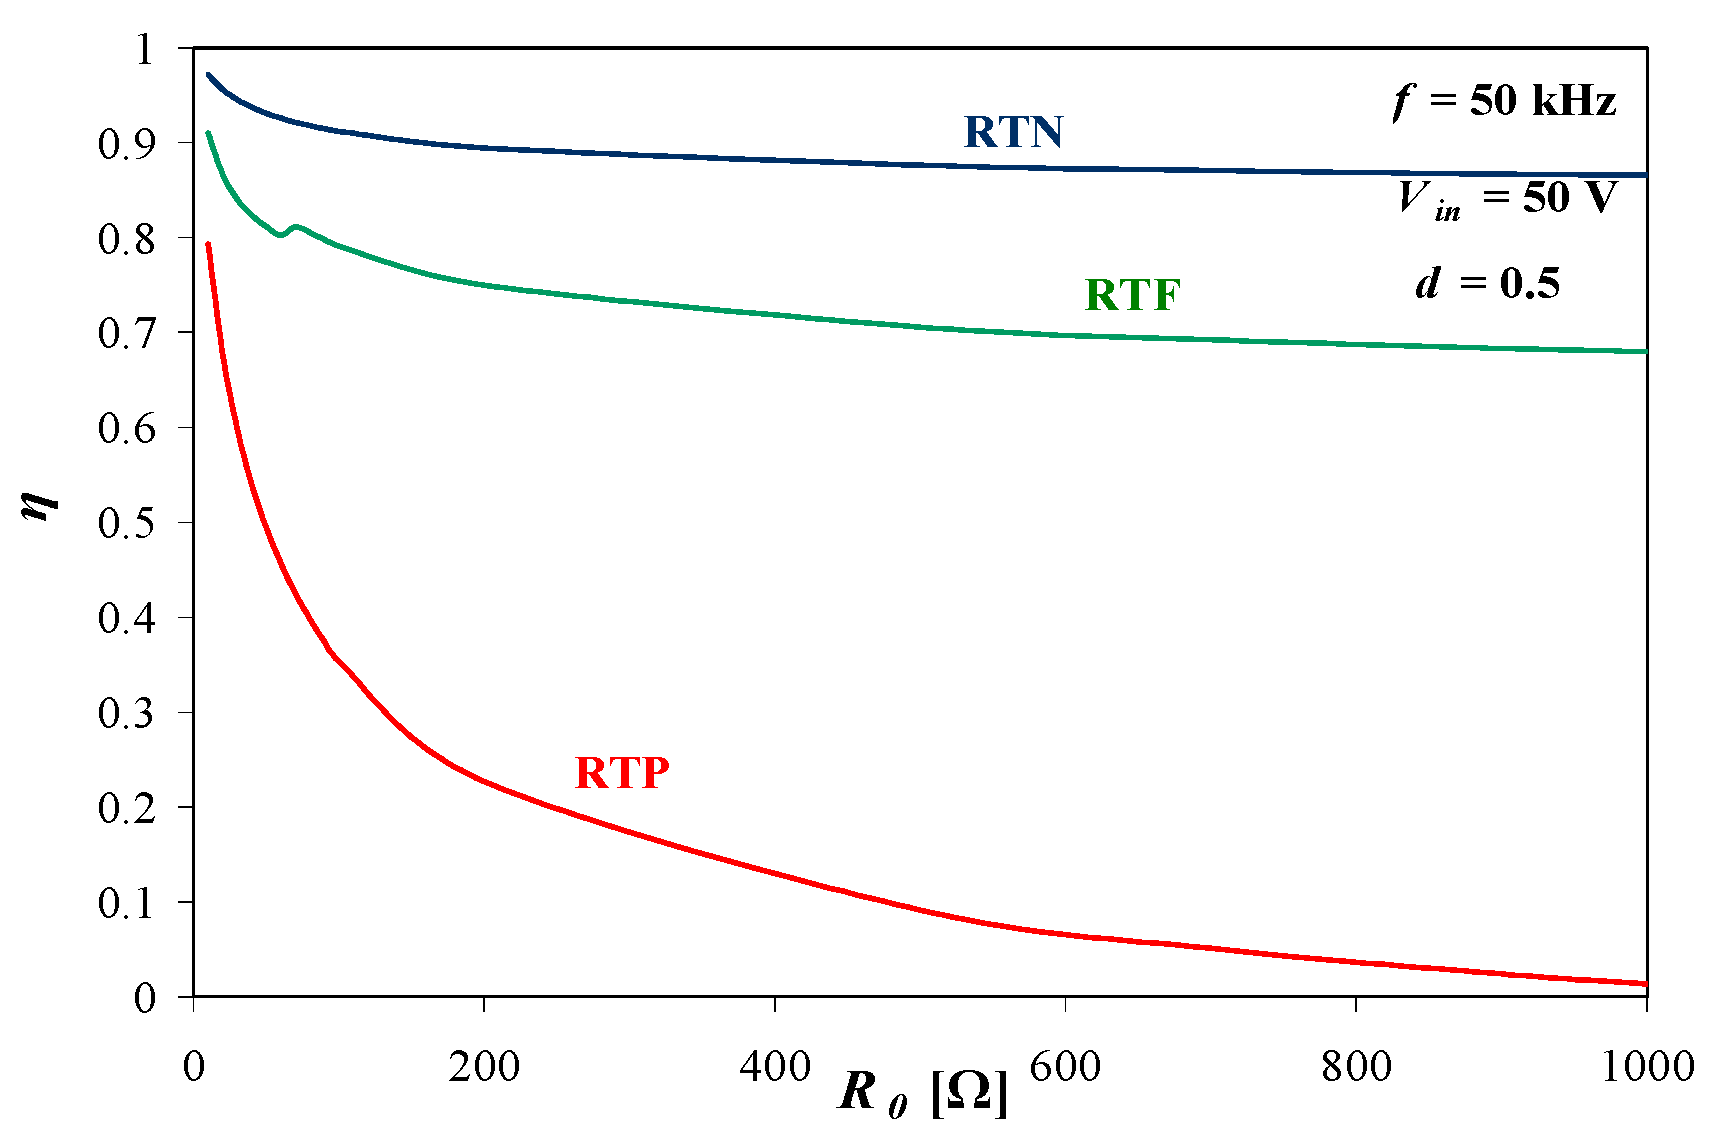
Figure 9 presents the influence of load resistance on the watt-hour efficiency of the boost converter. Due to the constant value of amplitude of magnetic flux density and frequency, values of power losses for the boost converter in the load resistance function were constant and amounted to 73 W for the RTP core, 24 W for the RTF core, and 10 W for the RTN core. Therefore, only the dependence of watt-hour efficiency as a function of load resistance is presented.
The watt-hour efficiency was a decreasing function of load resistance for all the considered materials. While load resistance increased, watt hour efficiency decreased from 0.98 to 0.89 for the RTN core, from 0.91 to 0.73 for the RTF core, and from 0.79 to 0.03 for the RTP core. As shown in the figures, the lowest value of watt-hour efficiency equal to 0.03 was obtained for the RTP core.
Figure 10,
Figure 11 and
Figure 12 present the influence of input voltage
Vin, the control signal frequency f, and load resistance
R0 of the buck converter on power losses in the inductor core and the watt-hour efficiency of the buck converter for the three considered materials used to build the inductor core (i.e., RTP, RTF, and RTN).
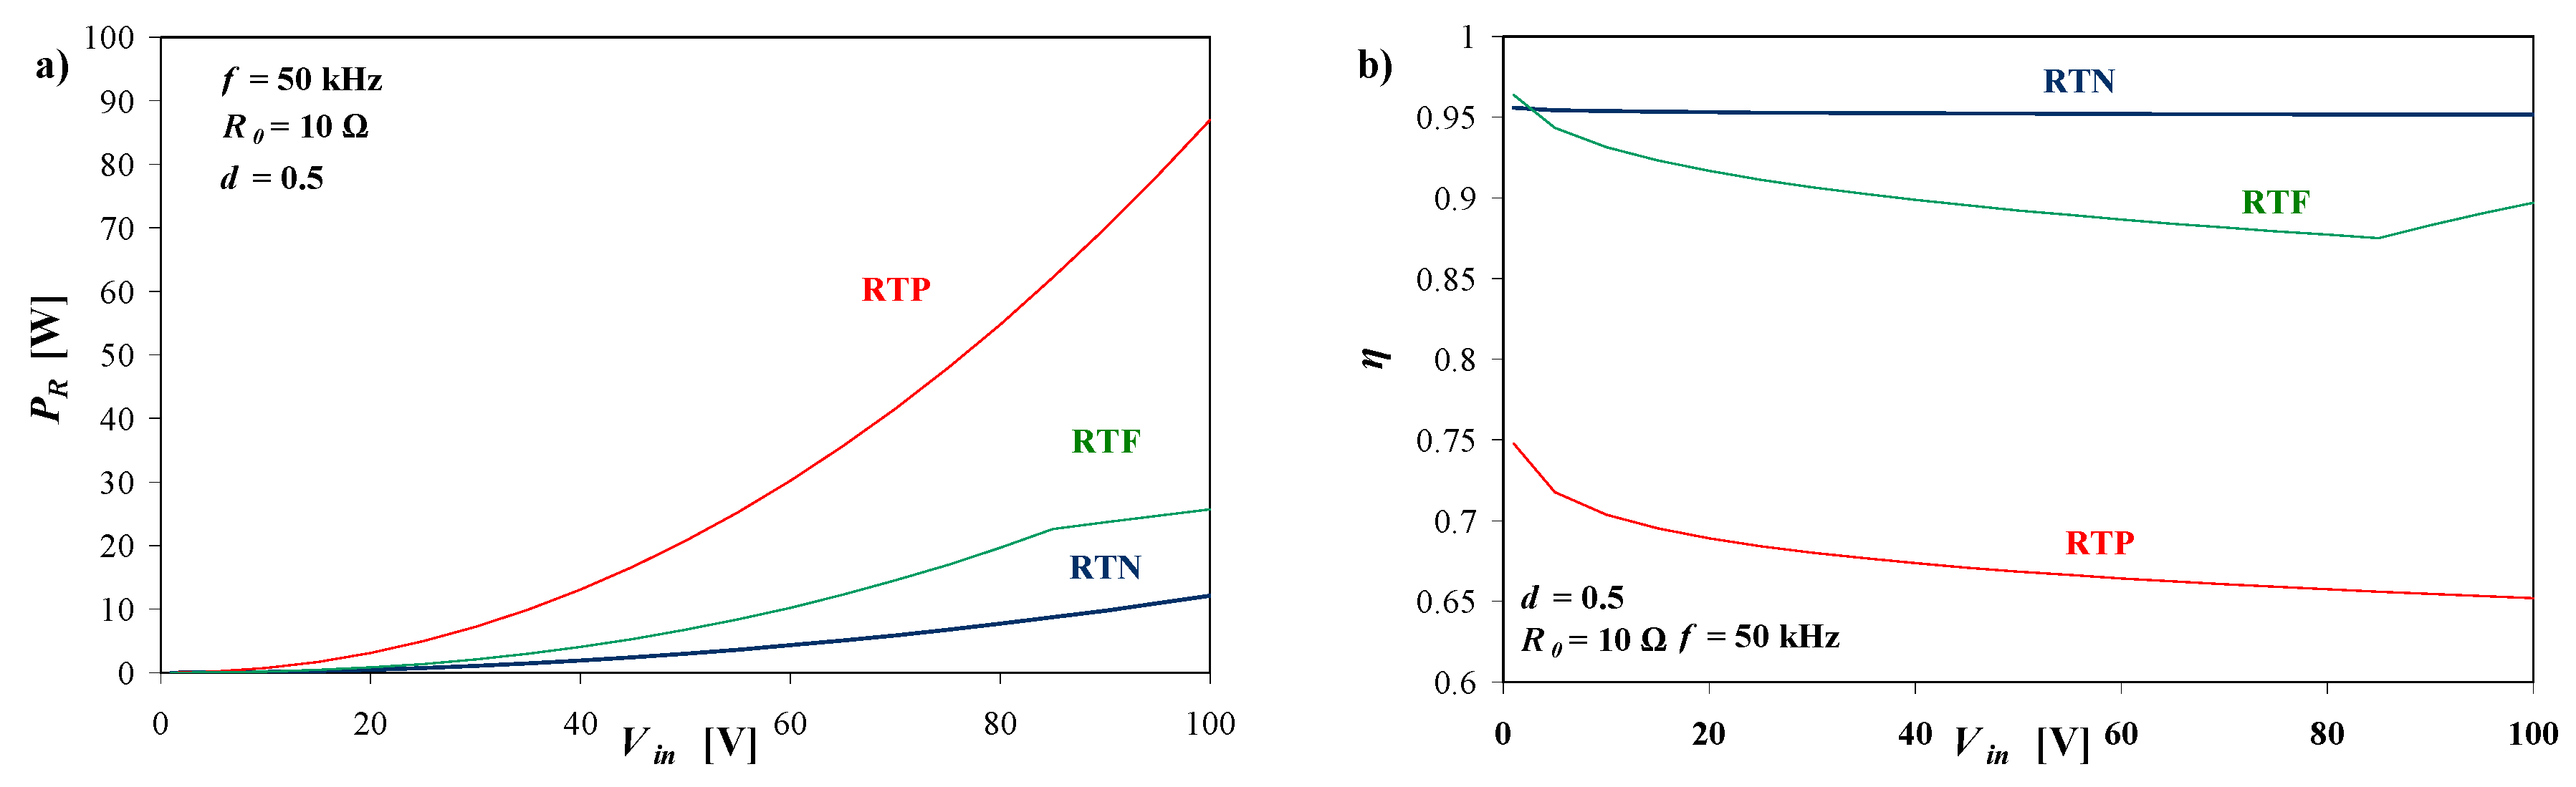
As shown in
Figure 10, an increase in input voltage of the buck converter caused an increase in power losses in the inductor core for all the considered materials. However, the highest value of power losses in the inductor core was obtained for the inductor containing the RTP core (up to 87 W at
Vin = 100 V), while the lowest value of power losses in the inductor core was obtained for the RTN core (about 10 W at
Vin = 100V). For the inductor core, the value of power obtained for the RTF core was equal to 24 W at
Vin = 100 V.
In turn, the watt-hour efficiency for the inductor containing the RTN core in the whole considered range of input voltage had the same value equal to 0.95. The lowest value of watt-hour efficiency was observed for the inductor containing the RTP core. For this core, PR decreased from 0.75 to about 0.65 only. The dependence η(Vin) for the RTF core possessed the minimum equal to 0.88 at Vin = 83 V, whereas the highest value was equal to 0.97 at Vin tending to 0.
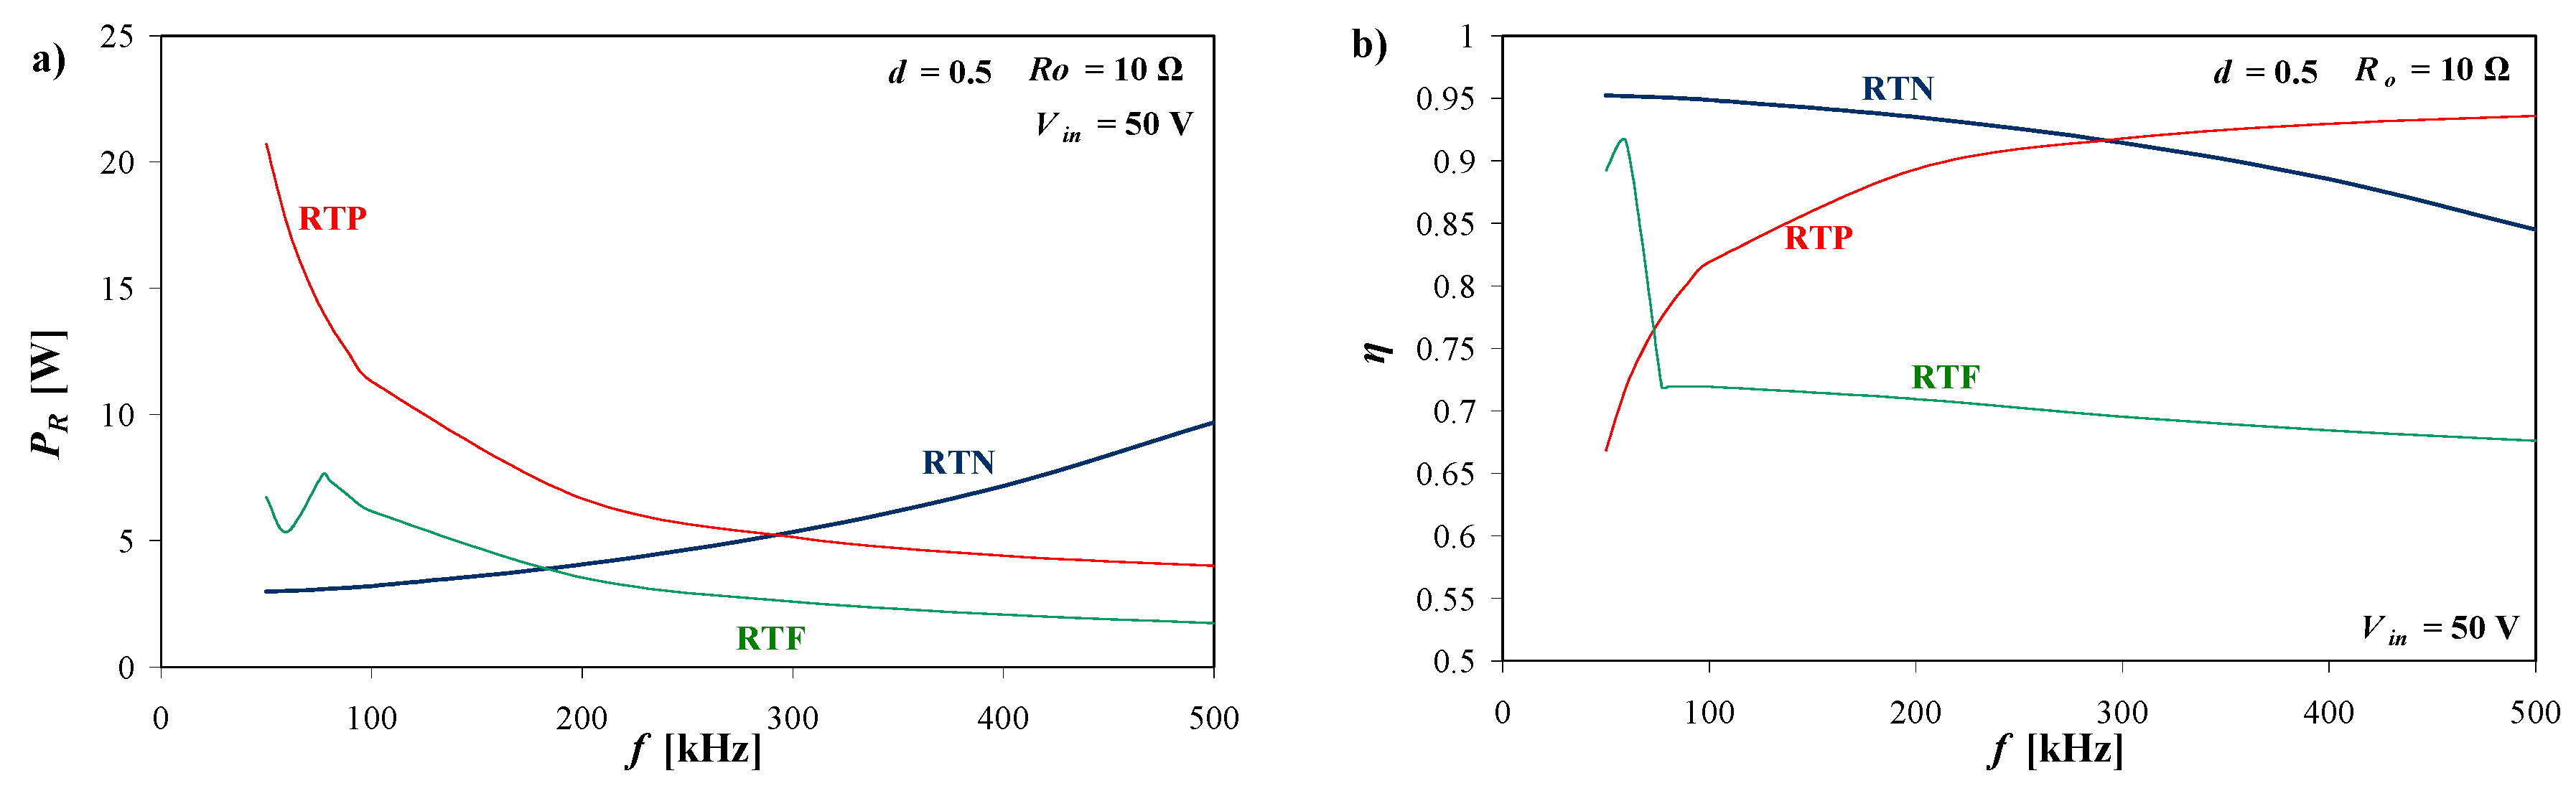
Figure 11 presents the influence of the control signal frequency on power losses in the inductor core and the watt-hour efficiency of the buck converter.
Dependences of power losses and watt-hour efficiency had similar character as the dependences describing these parameters for the boost converter. The highest power losses in the core were obtained at f = 50 kHz for the RTP core, where losses were equal to about 20 W. These losses decreased with an increase in frequency to about 4 W at f = 500 kHz. In the considered frequency range, power losses decreased from 7 W to 2 W for the RTF core, whereas they increased from 3 W to 11 W for the RTN core.
In turn, the highest value of watt-hour efficiency was observed for the converter containing the inductor with the RTP core at f = 500 kHz. For the buck converter with the inductor including the RTP core, the watt-hour efficiency increased from 0.67 at f = 50 kHz to 0.94 at f = 500 kHz. In turn, this efficiency decreased from 0.95 to 0.84 for the inductor with the RTN core, and from 0.92 to 0.68 for the inductor with the RTF core.
Figure 12 presents the influence of load resistance on power losses in the inductor core (
Figure 12a) and the watt-hour efficiency (
Figure 12b) of the buck converter.
As shown in
Figure 12, power losses in the core for
R0 < 20 Ω were constant. Above this value of load resistance, power losses decreased monotonically in the whole range of the considered load resistance changes. The highest values were obtained for the inductor containing the RTP core (decreasing from 20.7 W to 4.5 W), while intermediate values were obtained for the RTF core (decreasing from 6.5 W to 1.5 W), and the lowest values were obtained for the RTN core (decreasing from 3 W to 0.8 W).
On the other hand, the dependence of watt-hour efficiency had the local minimum equal to 0.33 for the RTP core, 0.78 for the RTF core, and 0.9 for the RTN core at a load resistance equal to 20 Ω. Above this value of load resistance, the watt-hour efficiency of the buck converter increased with an increase of load resistance. The highest value of watt-hour efficiency was obtained for the converter containing the inductor with the RTN core. The curves presented in
Figure 12 had the characteristics of spline functions due to the fact that, for
R0 = 20 Ω, the considered converter operated in the critical mode, for
R0 < 20 Ω, it was characterized by the continuous conducting mode (CCM), and, for
R0 > 20 Ω, it operated in the discontinuous conducting mode (DCM).


