1. Introduction
The phenomenon of surface discharge is widespread in the field of electrical engineering and has been studied by many scholars [
1,
2,
3,
4,
5,
6,
7]. For oil-paper insulation, though oil is relatively more vulnerable than paper [
8], the interface of oil-solid is considered as even an electrical weaker point than oil [
9,
10]. Surface discharge has caused a number of failures in operating transformers [
11]. There are many kinds of interfaces in HV transformers, such as the spacer between the winding layers, winding screen, insulating cylinder, and pressboard barriers between phases. When the local electrical field is intensified by degradations like moisture, dielectric degradation, or winding deformation, discharge may happen along the paper interface. In the beginning, the discharge along the oil-paper interface is in the form of partial discharge (PD). Sustained PD induces unrecoverable tracking and carbonization on the pressboard [
1,
2]. This kind of dielectric degradation will cause flashover along the surfaces, winding short-circuit, and even bushing burst. Because of this, the surface discharge in oil-paper insulation has been studied from different aspects [
1,
2,
9,
10,
11,
12,
13].
In [
2], it was discovered that the white mark can easily be initiated and developed on the pressboard when the liquid is natural oil or synthetic oil, whereas the white mark will not emerge on pressboard when there is not enough moisture in the mineral oil immersed pressboard. The presence of the pressboard (PB) surface contributes to discharges at smaller phase angles and promotes negative discharges more than positive discharges [
12]. The promotion function is attributed to the memory effect of the solid surface for hetero space charges and the residual low density channel left by previous discharges [
13]. The effect of aging and composite AC-DC voltage on surface discharge was researched in [
9,
11]. In addition to these aspects, pressure is an important factor to influence the discharge in the oil-paper system because it affects the bubble in the insulation system, and the bubble is a critical factor to influence discharge in oil.
When negative air pressure is imposed, gas will be evacuated from the pressboard and oil. The little bubbles that exist in oil will suddenly disappear when higher pressure is applied. The air pressure at the high altitude area (e.g., Lhasa 0.066 MPa) is much lower than standard atmospheric pressure (about 0.1 MPa). The surface discharge characteristics of oil-paper insulation in high altitude areas must be different from other places. On the other hand, the top oil-level of high voltage transformers may be higher than 10 m, which will bring an additional hydrostatic pressure. Take the ±1100 kV converter transformers (made by Siemens) used in the Changji-Guquan HVDC project in China as an example: the distance from the center of their expansion tank to the bottom of the oil tank is 12.648 m. According to the liquid pressure formula P = ρgh (P is the hydrostatic pressure. ρ is the density of the liquid. g is the acceleration of gravity. h is the height of the oil level.), this will generate an additional hydrostatic pressure of 0.11 MPa at the bottom of the transformer. Hence, it’ is necessary to figure out the influence of hydrostatic pressure on the discharge along the oil-paper interface.
To the best of our knowledge, the discharge property of oil-paper insulation under the variable pressure condition has not been reported yet except some previous works relating the pressure effect on pure oil gap reported in [
14,
15,
16,
17,
18,
19]. These papers illustrated that small bubbles in mineral oil brought in the pressure factor in the oil insulation. Besides, the adding of solid insulation affects the formation of conductive bubble bridges in oil and induces the discharge along the interface. In comparison, research about hydrostatic pressure’s influence on short time creeping discharge morphology along phenoplast resin, glass, polycarbonate, polyethylene, and polypropylene immersed in mineral oil was reported in [
20]. However, the smooth surfaces of these materials cannot be invaded by oil and gas, and the test lasting for only several microseconds cannot reflect the cumulated damage of discharge on the solid material. Therefore, the influence of pressure on oil-paper insulation under long-term operation is a new frontier that needs to be studied.
This paper aims to investigate the surface discharge characteristics of the oil-pressboard interface under different hydrostatic pressures. With the help of a commercial PD detector, a high-speed image recorder (HSR), the impact of hydrostatic pressure on the PD along the oil-paper insulation was studied. PD parameters under normal operating condition, final flashover, and trace left on pressboard (white mark) were recorded. Bubbles’ deformation and their influence on the discharges were analyzed in detail. The results were very useful for the manufacture and operation of the high voltage oil-filled apparatus.
2. Sample Preparation and Experiment Setup
In this study, the commonly-used PB of 1 mm in thickness and the KARAMAY 25# transformer oil were adopted in the experiments. Before experiment, transformer oil was treated with vacuum degasification, moisture elimination, and purification by an oil purifier, as shown in
Figure 1a. These procedures ensured the moisture content in oil below 10 μL/L and the concentration of dissolved gases in oil below 2%. The new PBs were put in an open drying oven with a temperature of 105 °C for 48 h firstly and then dried below 5 mbar at 85 °C in the vacuum cabinet (as shown in
Figure 1b) for 24 h [
8]. Finally, the prepared PBs were impregnated in the processed oil in the vacuum circumstance below 5 mbar at 85 °C for 48 h. According to [
21], the PBs in the oil can be considered as dry ones. The electrical strength of the impregnated pressboards were measured according to the IEC 60243 standard [
22]. The high voltage electrode and grounded electrode were 25 mm and 75 mm in diameter, respectively. The applied voltage was raised at 4 kV/s, as the steps in [
23]. Five samples were measured. The lowest and average breakdown voltages were 56.7 kV and 59.1 kV, respectively.
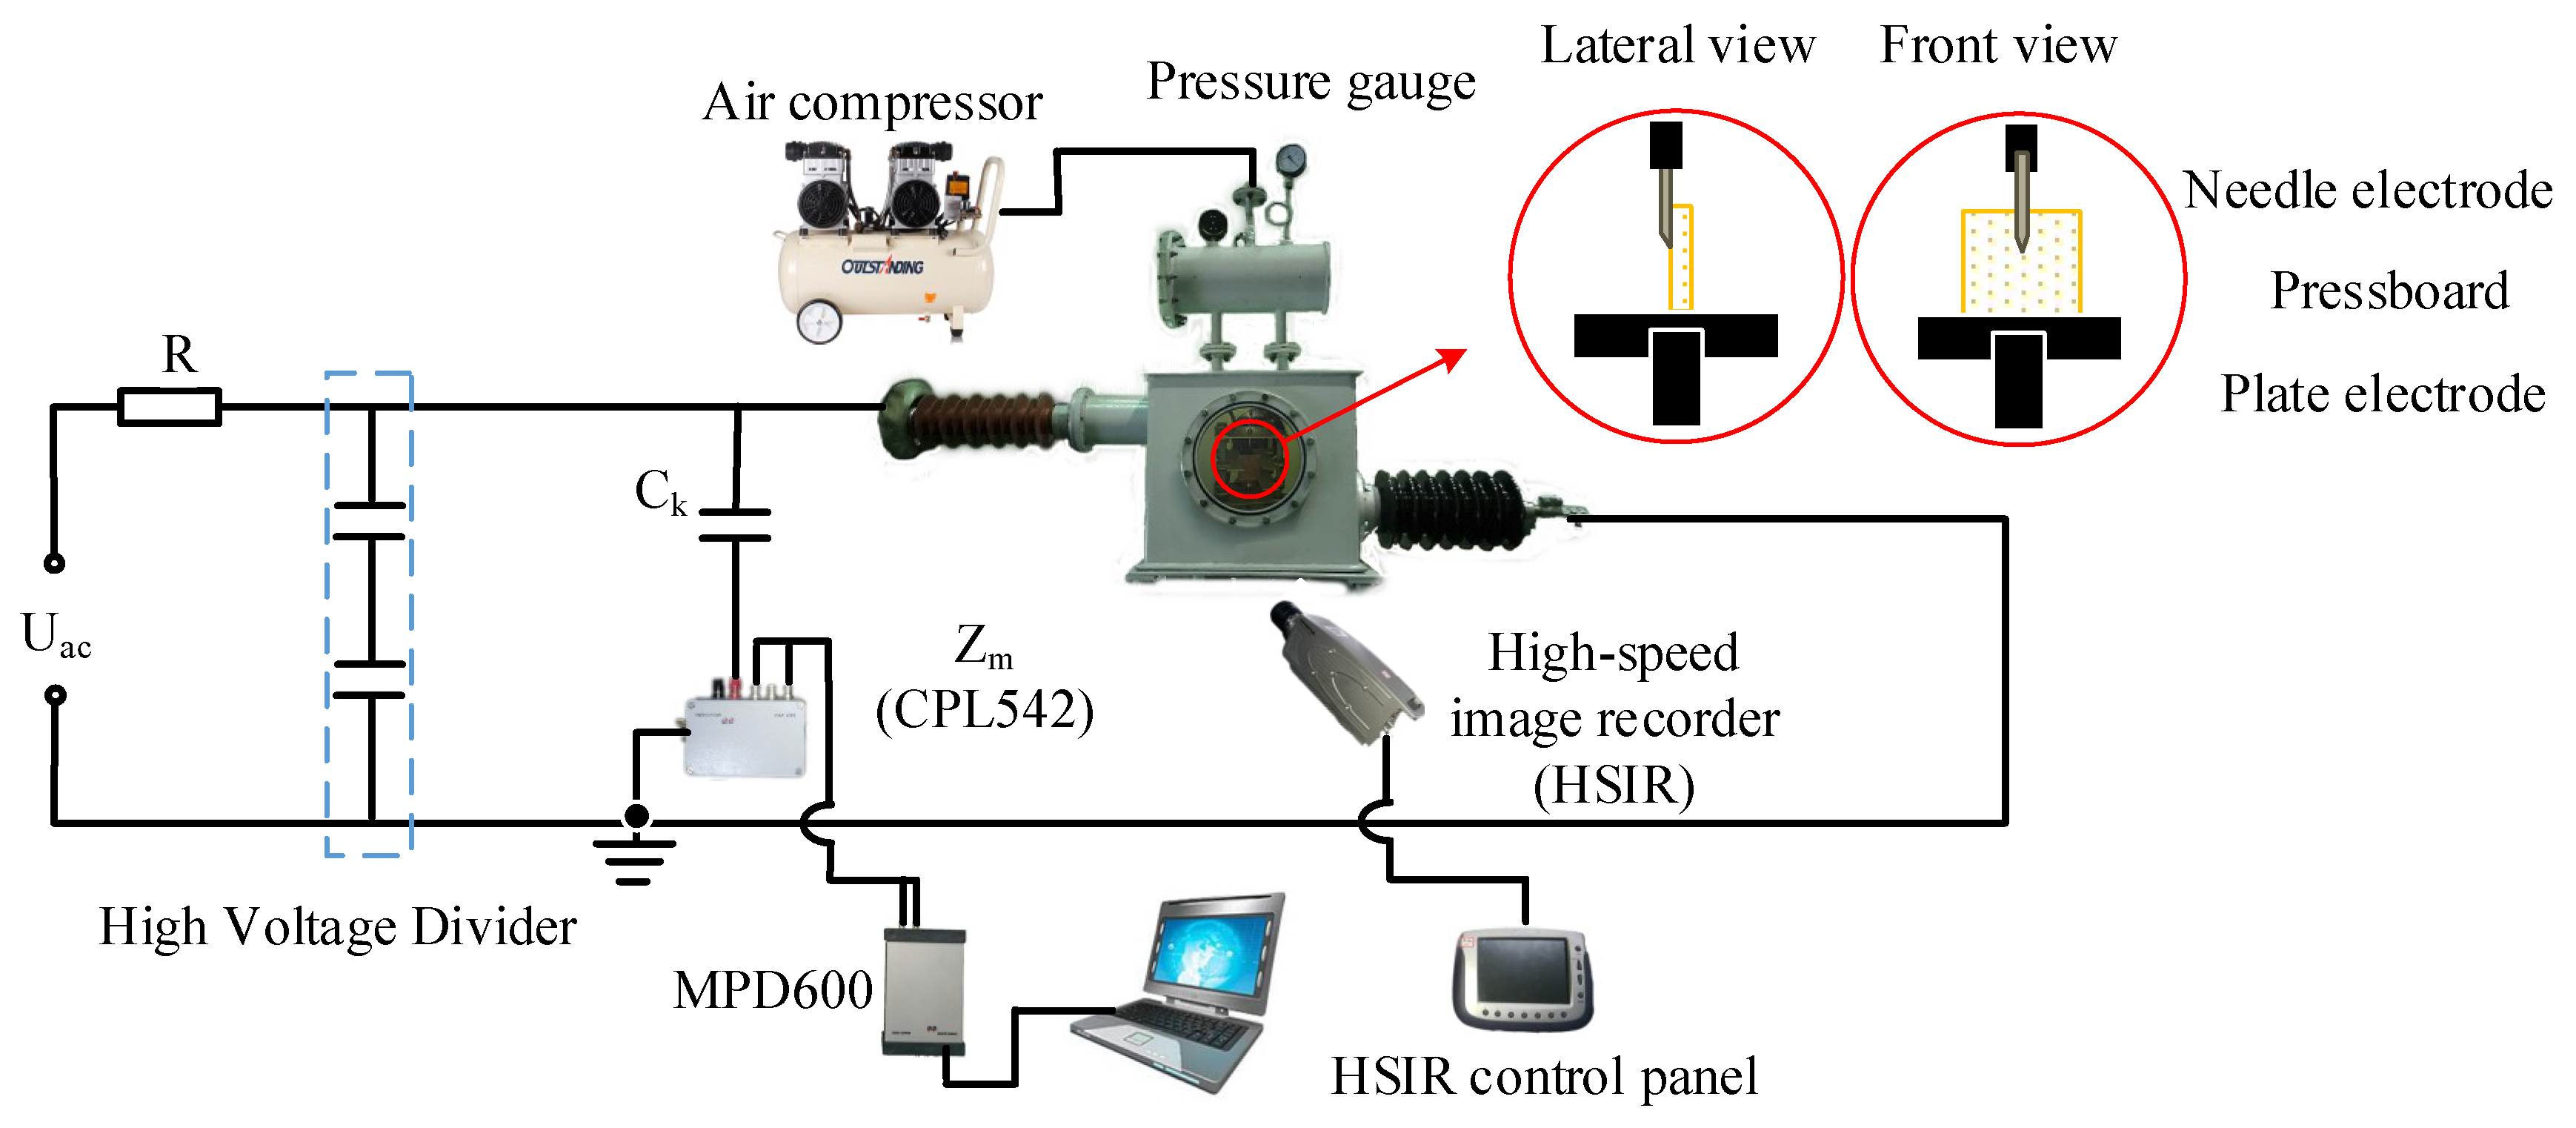
Figure 2 shows the experimental setup. Needle and plate electrodes were firmly fixed by an insulated bracket system in the oil tank. The pressboard was limited in a vertical position on the plate electrode and in close contact with the needle electrode. Electricity was transmitted into the tank through two bushings. To create a locally high electric field and initiate discharges, a medical needle electrode was selected as the power supply electrode, because its tip can ensure close contact with the PB surface [
8]. The tip radius of the needles was about 30 μm from the front view and 10 μm from the lateral view. According to the definition of PD test electrodes in the standard IEC61294 [
24], the gap distance was fixed at 50 mm. Nevertheless, the plane electrode (ground electrode) was selected to better accommodate the PB samples in the vertical direction rather than the sphere electrode specified in IEC61294. The diameter of the plane electrode was 75 mm, and its chamfering was 5 mm. The inside dimension of the tank was 28 × 43 × 42 cm, and it was big enough to install electrode fixed devices, which kept sufficient distances from electrodes to the tank shell. Hydrostatic pressure was applied by an air compressor through the expansion tank over the main tank, as shown in
Figure 2. Air was driven into the expansion tank by the air compressor, and air pressure was displayed by the pressure gauge connecting to the expansion tank. The air valve between the compressor and the expansion tank could be adjusted manually. After closing the valve, the pressure inside the expansion tank would maintain for at least ten hours, which was long enough for the experiment implementation.
In
Figure 2, a resistor (1 MΩ) was connected between the high voltage electrode and a 240-V/100-kV supply transformer. The apparent power of the transformer was 10 kVA. Two capacitors in series represented a voltage divider to measure the voltage applied on the test specimen. A commercial PD detector made by OMICRON (MPD600) was connected in series with a 300-pF coupling capacitor to measure the partial discharge parameters. The high-speed image recorder (HSIR, made by the OLYMPUS Company) was installed to record the optical phenomenon occurring during the tests. Before the test, the background PD noise level of the system was measured by applying high voltage to the test circuit without the pressboard and needle electrode under atmospheric pressure. The maximum amplitude of background PD of the system never exceeded 30 pC when the applied voltage was lower than 30 kV, and its frequency was much less than that on the test sample. This fulfilled the need of the research in this paper, which will be explained in the paragraph before
Section 3.1. The applied AC voltage was raised at the rate of 1 kV/s until the PD peak close to 20 pC. After that, the voltage was increased at 1 kV per time and maintained for 5 min at each voltage. The PD data in the first 2 min were disregarded, as the test system was approaching a stable condition, and the data in the following 3 min were adopted. The data plotted on the following figures were the average value of five measurements.
3. Experimental Results and Analysis
It was found that the aging of insulating materials caused by PD is the result of long-term accumulation discharge rather than short-term strong discharge in most cases [
25]. Therefore, besides considering the maximum PD amplitude, this paper took discharge repetition rate, accumulated PD charge, and PD energy into consideration to analyze the influence of hydrostatic pressure on partial discharge.
In engineering practice, a power transformer is always allowed to run under a PD level below 100 pC. When the PD of a transformer is over 100 pC, its operation will be interrupted to avoid further damage. Thus, this paper mainly focuses on the voltage stages when PD was not over 200 pC under atmospheric pressure (17–25 kV), to study the effect of pressure on the oil-paper interface PD under the normal operating condition. As shown in
Figure 3, all the PD peaks were obviously higher than 100 pC when the applied voltage reached 25 kV under different pressures. Considering the PD peaks recorded under an applied voltage below 17 kV were too small, therefore the PD data between 17 kV and 25 kV are mainly displayed and analyzed in detail in the following.
3.1. Partial Discharge Magnitude and Discharge Repetition Rate under Different Hydrostatic Pressures
The maximum PD amplitude reflects whether there are defects in the insulation system. Average PD magnitude and discharge repetition rate reveal the PD overall level and how often the PD erosion occurs. The insulation condition was mainly judged by the maximum PD amplitude in the engineering application. In the research, average PD magnitude and discharge repetition rate can be also taken into account.
As shown in
Figure 3, the PD peak increased with voltage under each pressure level. As shown in
Table 1, under the voltage of 12 kV, the maximum PD amplitude was decreased from 30.5 pC–3.6 pC when the pressure was increased from 0.1 MPa–0.4 MPa. Higher hydrostatic pressure suppressed PD when the applied voltage was lower than 14 kV. With the voltage growing up further, maximum amplitude under higher hydrostatic pressure grew with a larger slop and exceeded the maximum amplitude under atmospheric pressure (0.1 MPa). Under the voltage of 26 kV, the maximum PD amplitude was increased from 359.3 pC–713.8 pC when the pressure was increased from 0.1 MPa–0.4 MPa. This indicated that additional pressure can cut down the PD peak to a very low value under normal operating conditions, but greatly increased the maximum PD amplitude when the local electric field was overbalanced because of the arising of the defect. It will be much easier to identify fault status because of the increased PD value under additional hydrostatic pressure.
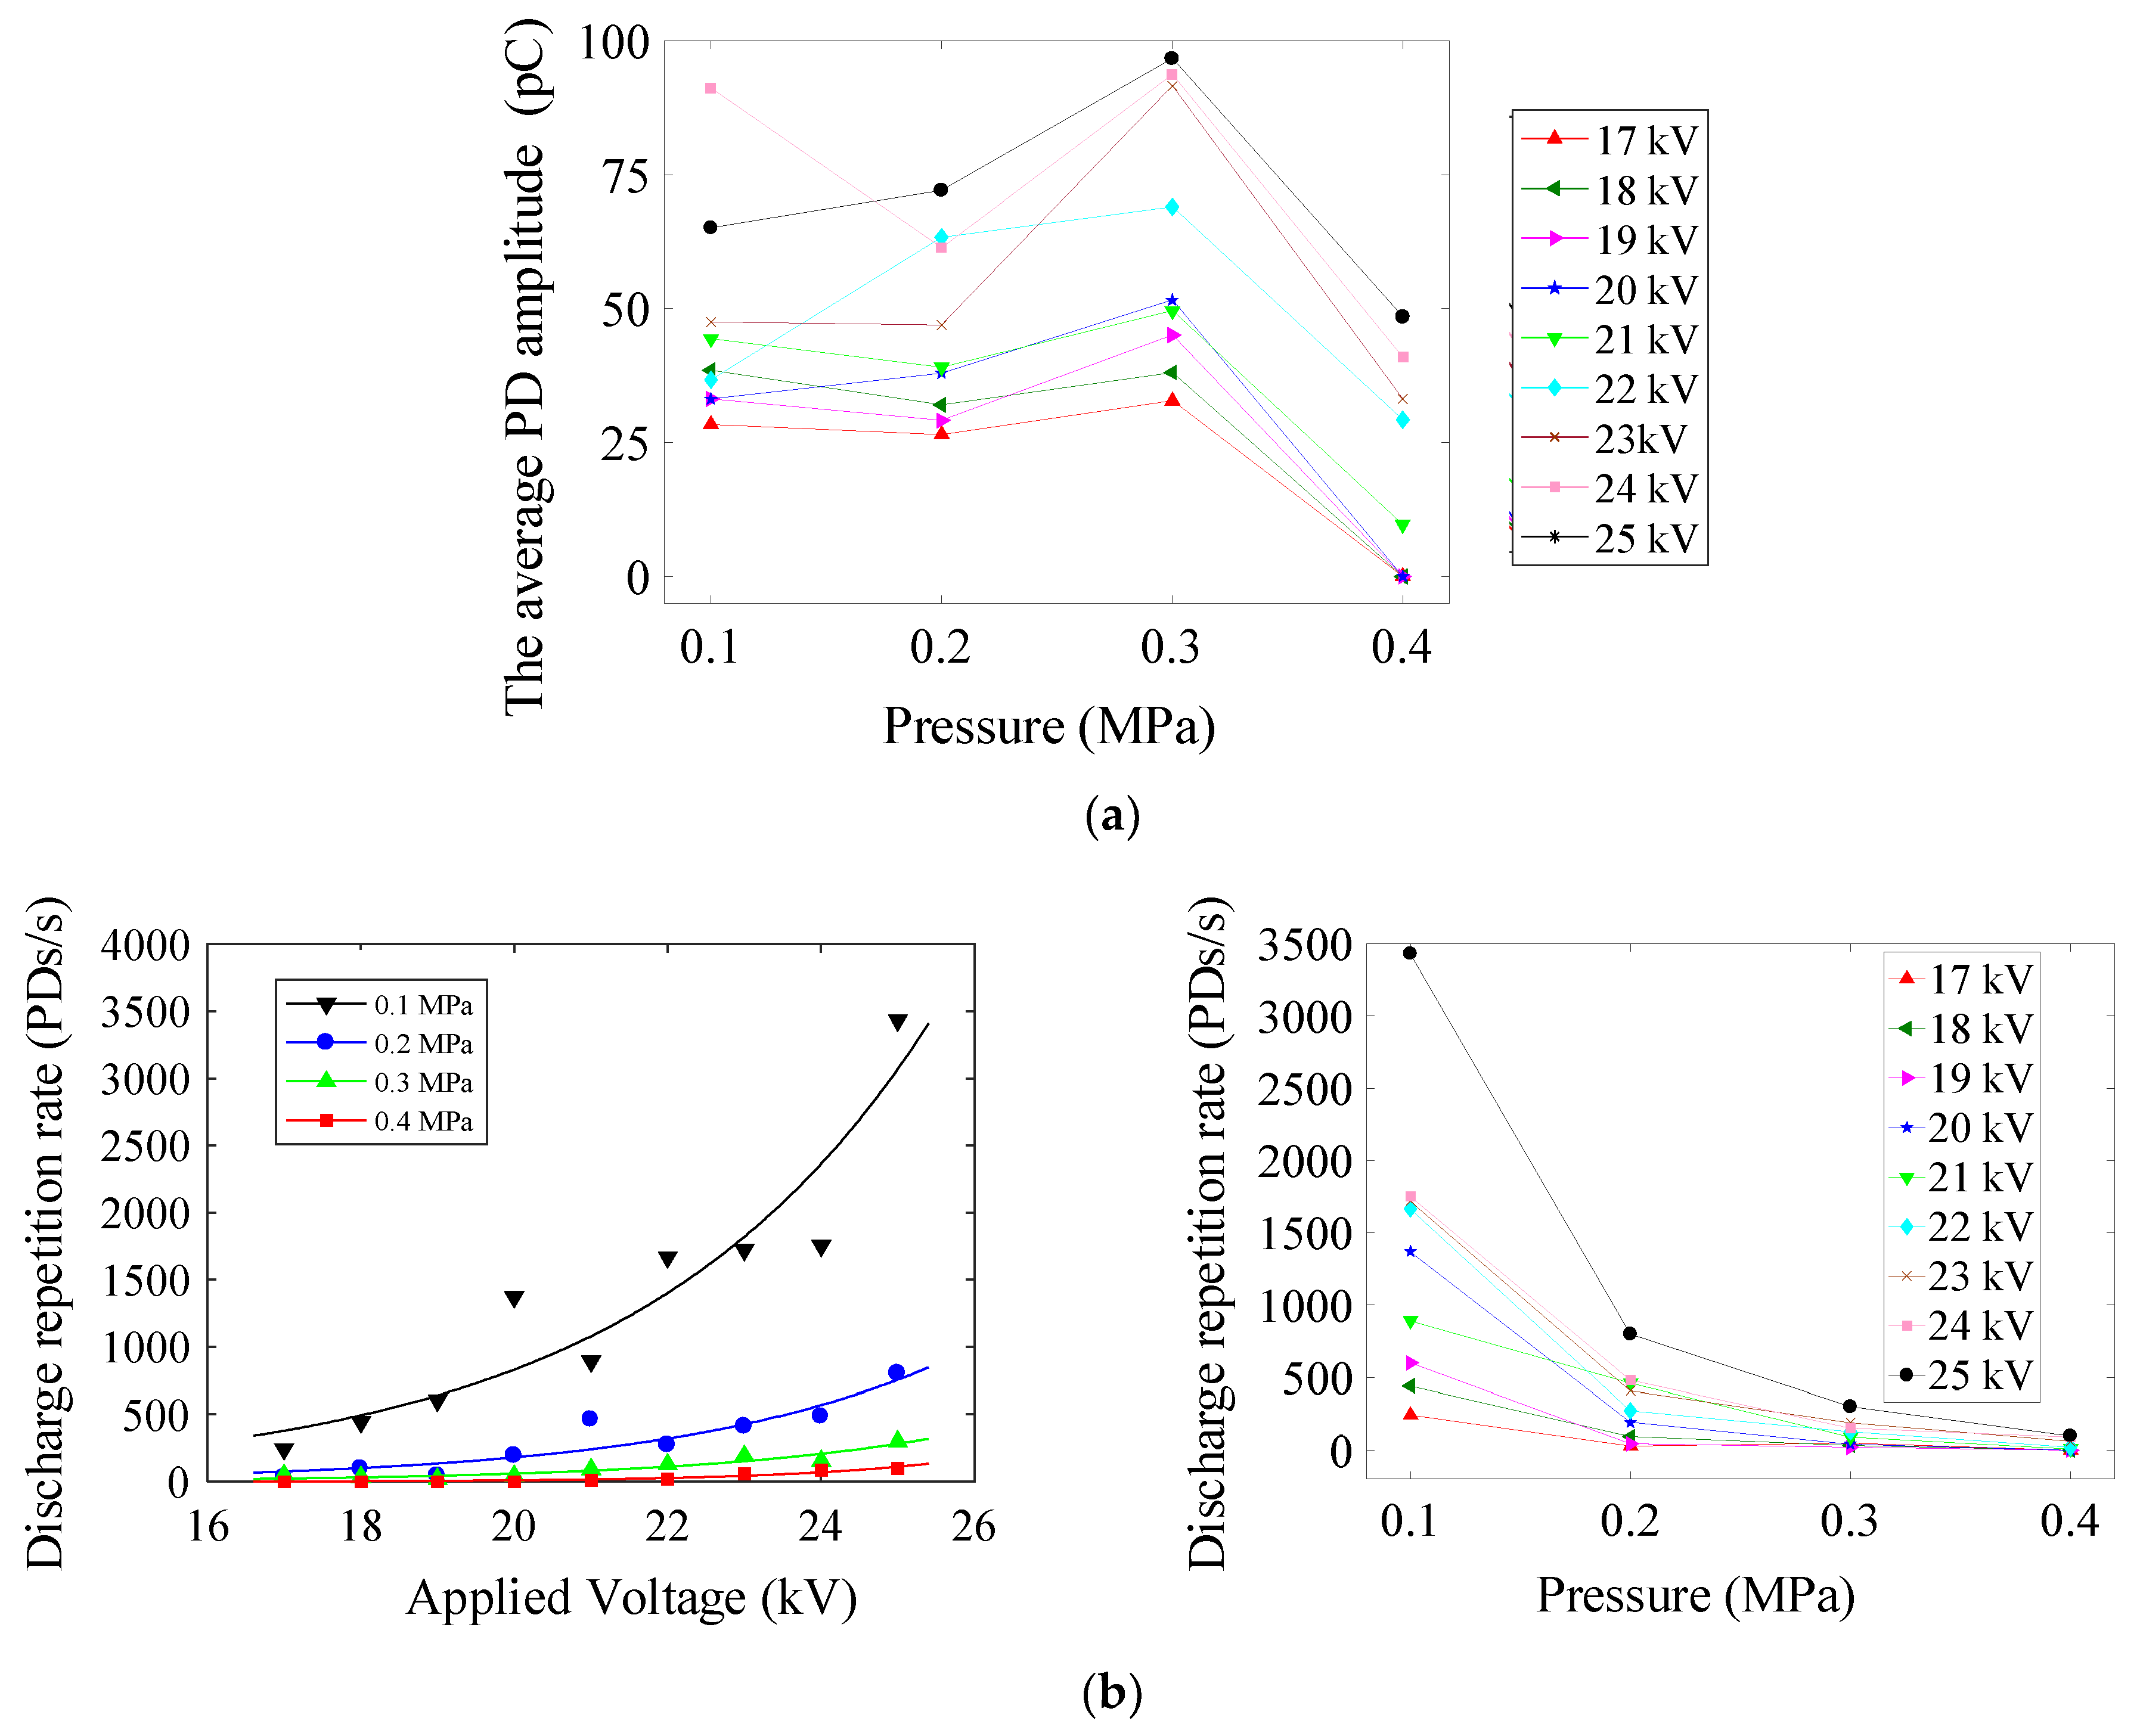
Figure 4a shows that the magnitude of average PD increased with voltage growing up under each pressure; however, the differences among the average PD values of different pressure under each voltage were not significant, especially when the voltage was higher than 21 kV. Meanwhile,
Figure 4b shows that discharge repetition rate dropped sharply when the pressure was increased at each voltage level. For example, when the applied voltage was 17 kV, the discharge repetition rate was changed from 243.2 PDs/s to almost zero, while the hydrostatic pressure was increased from 0.1 MPa–0.4 MPa. When the applied voltage was 25 kV, the discharge repetition rate was decreased from 3432 PDs/s to 100 PDs/s, while the pressure was increased from 0.1 MPa–0.4 MPa.
Through data fitting, the relation between the discharge repetition rate and voltage (expressed in the left graph of
Figure 4b) followed an exponential relationship like below:
where
n (PDs/s) is the PD repetition rate and
v (volt) is the applied voltage. The values of coefficients
a and
b under different pressures are listed in
Table 2.
This is consistent with the results in [
16], where voltage was applied on an open oil gap. Hence, the results that were mentioned above indicated that higher hydrostatic pressure would reduce the total discharge on the oil-paper interface during any specified period.
The above data show that maximum PD amplitude was greatly decreased with hydrostatic pressure rising when the local electric field was relatively small; however, this phenomenon was reversed as the electric field increased. The total discharge value was decreased by higher pressure, because of the greatly reduced discharge repetition rate. When something goes wrong, the distorted electric field under higher pressure will induce much larger maximum PD amplitude, which will help with fault diagnosis. However, whether the decreased total discharge value will lead to a smaller damage to the insulation needs to be discussed in the following.
3.2. The Partial Discharge Current and Partial Discharge Power under Different Hydrostatic Pressures
From the deduction that total discharge will be reduced under higher pressure, it can be predicted that PD current will be cut down as well. According to [
26], the average discharge current
I (A) is defined by the following equation:
where the
Tref (s) is a chosen reference time interval and
q1,
q2, …,
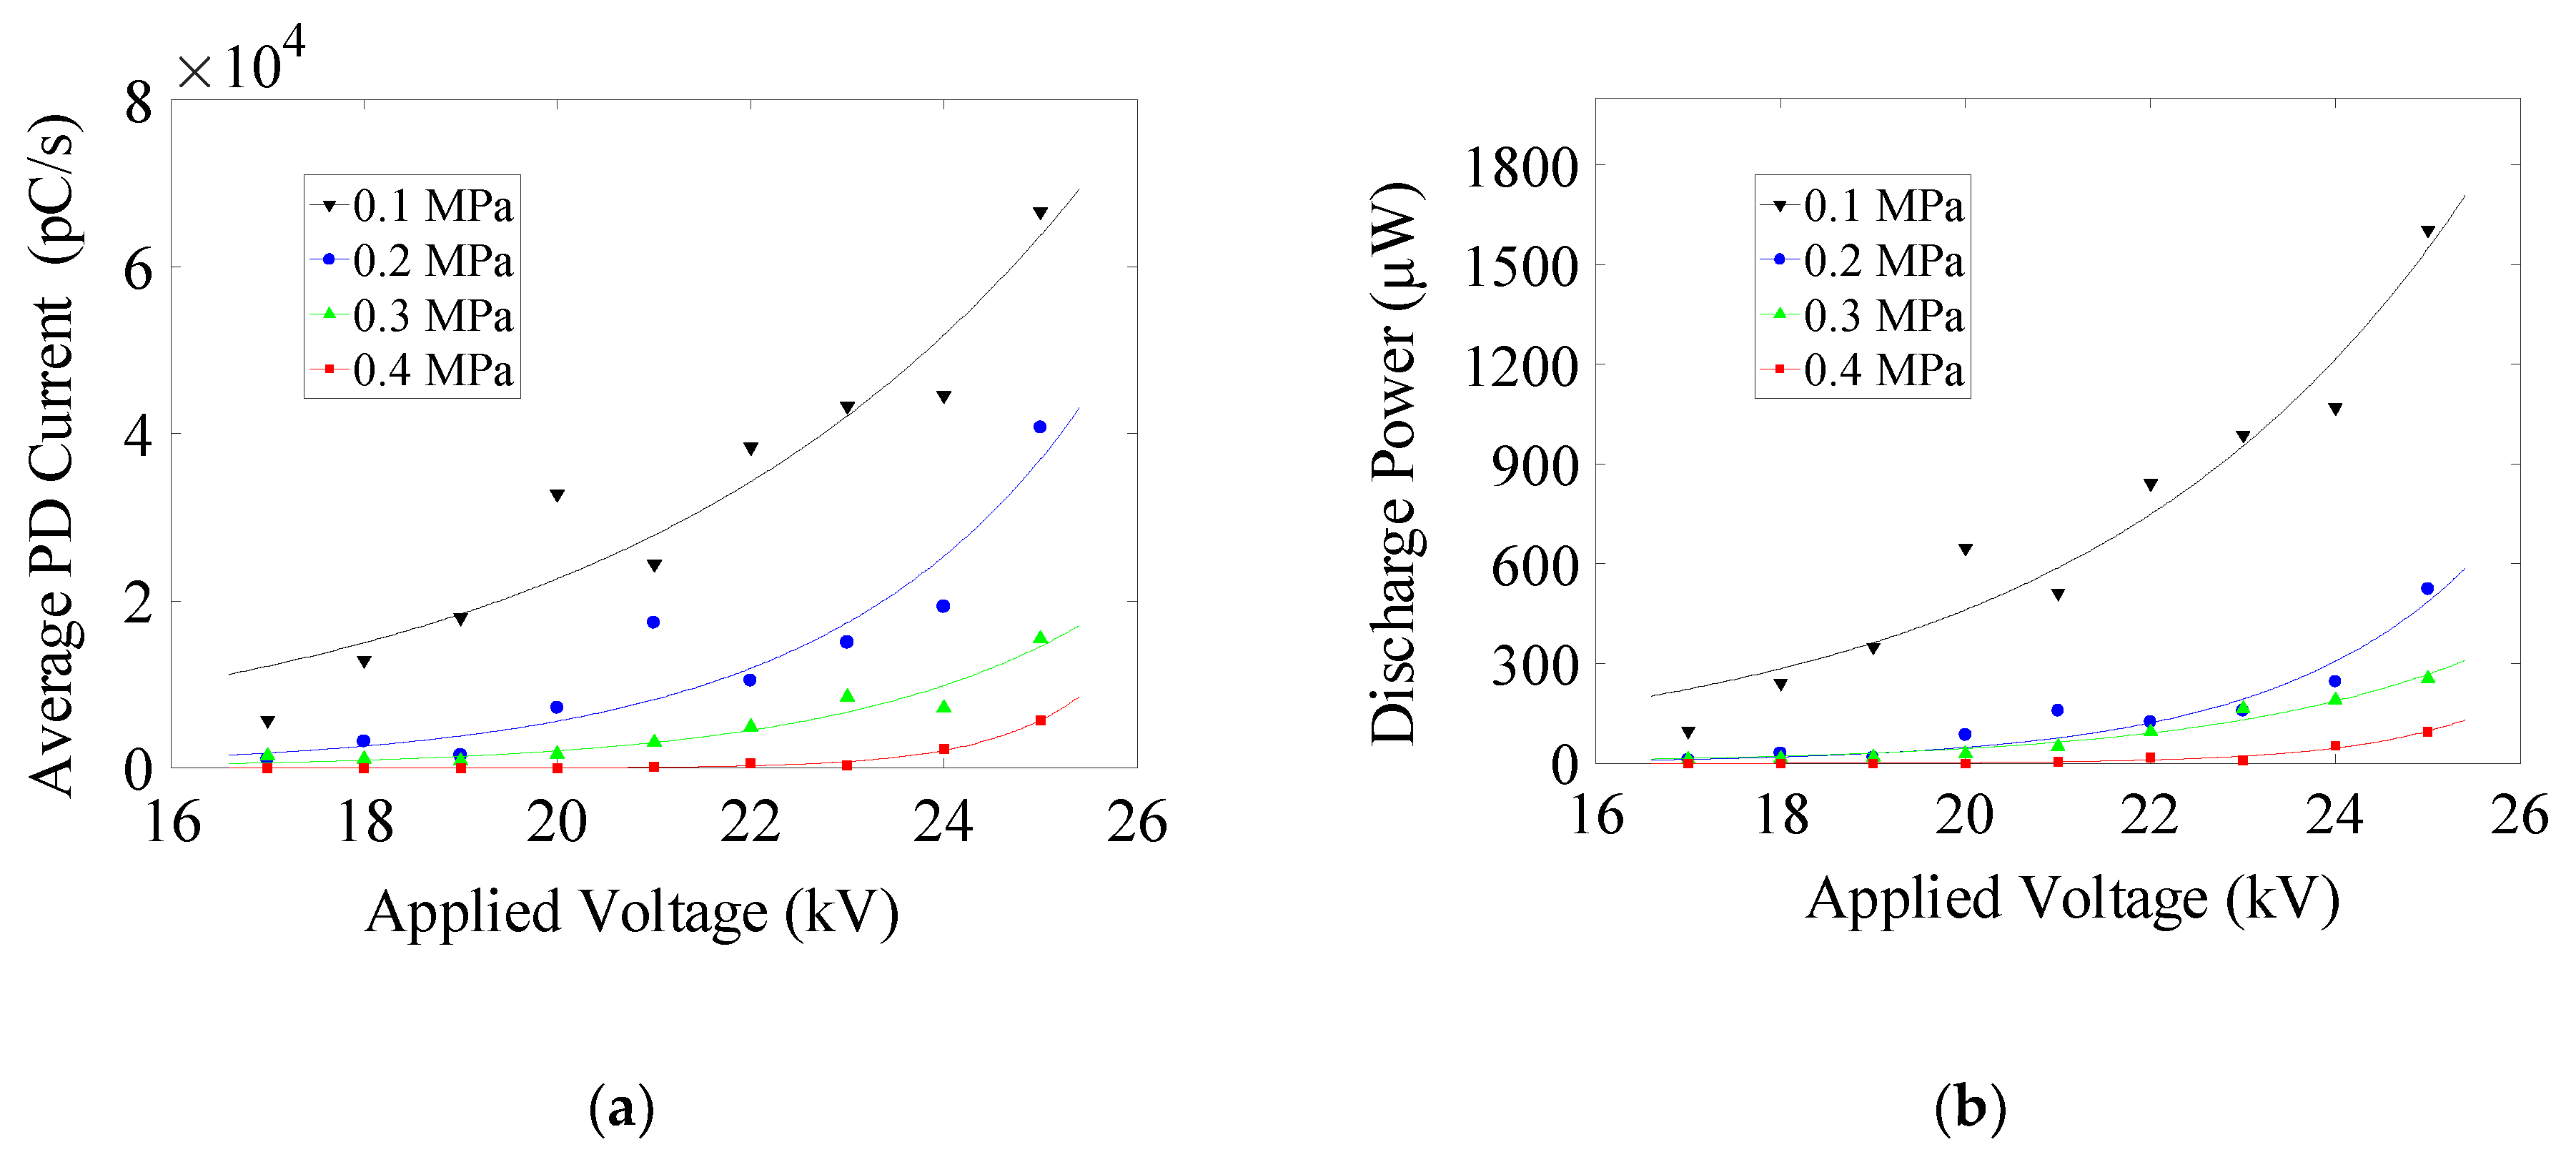
qi (C) are the apparent charge magnitudes higher than the test threshold 20 pC. These average PD currents tested by the PD detector are illustrated in
Figure 5a. Hydrostatic pressure influence on the average PD current was similar to its influence on the discharge repetition rate shown in
Figure 4b, which is consistent with the previous total discharge prediction. Under the same voltage level, larger current may cause larger discharge power. Nevertheless, the instantaneous voltage to produce a discharge was not the same. In [
26], the discharge power
P (W) was defined by the following equation:
where
u1,
u2, …,
ui (V) are instantaneous values of the test voltage at the instants (
ti) when the individual apparent charge magnitudes
qi occur. This discharge power tested by MPD is illustrated in
Figure 5b. It shows that the PD power consumption was cut down by the higher hydrostatic pressures under each voltage level.
Thus, PD damage on oil-paper insulation was reduced by higher hydrostatic pressure, and pressure is an effective way to protect oil-paper insulation.
3.3. Final Flashover Voltage under Different Hydrostatic Pressures
A much higher voltage is needed to cause a puncture over a pure oil gap when higher pressure is applied [
15,
18,
19]. The difference between the PDIVs of the open oil gap and along PB with the same electrode distance was very small [
12]. Supposing the breakdown voltage with and without the pressboard was the same under a specified pressure, it can be deduced that the flashover voltage along the pressboard in the transformer oil increased with hydrostatic pressure.
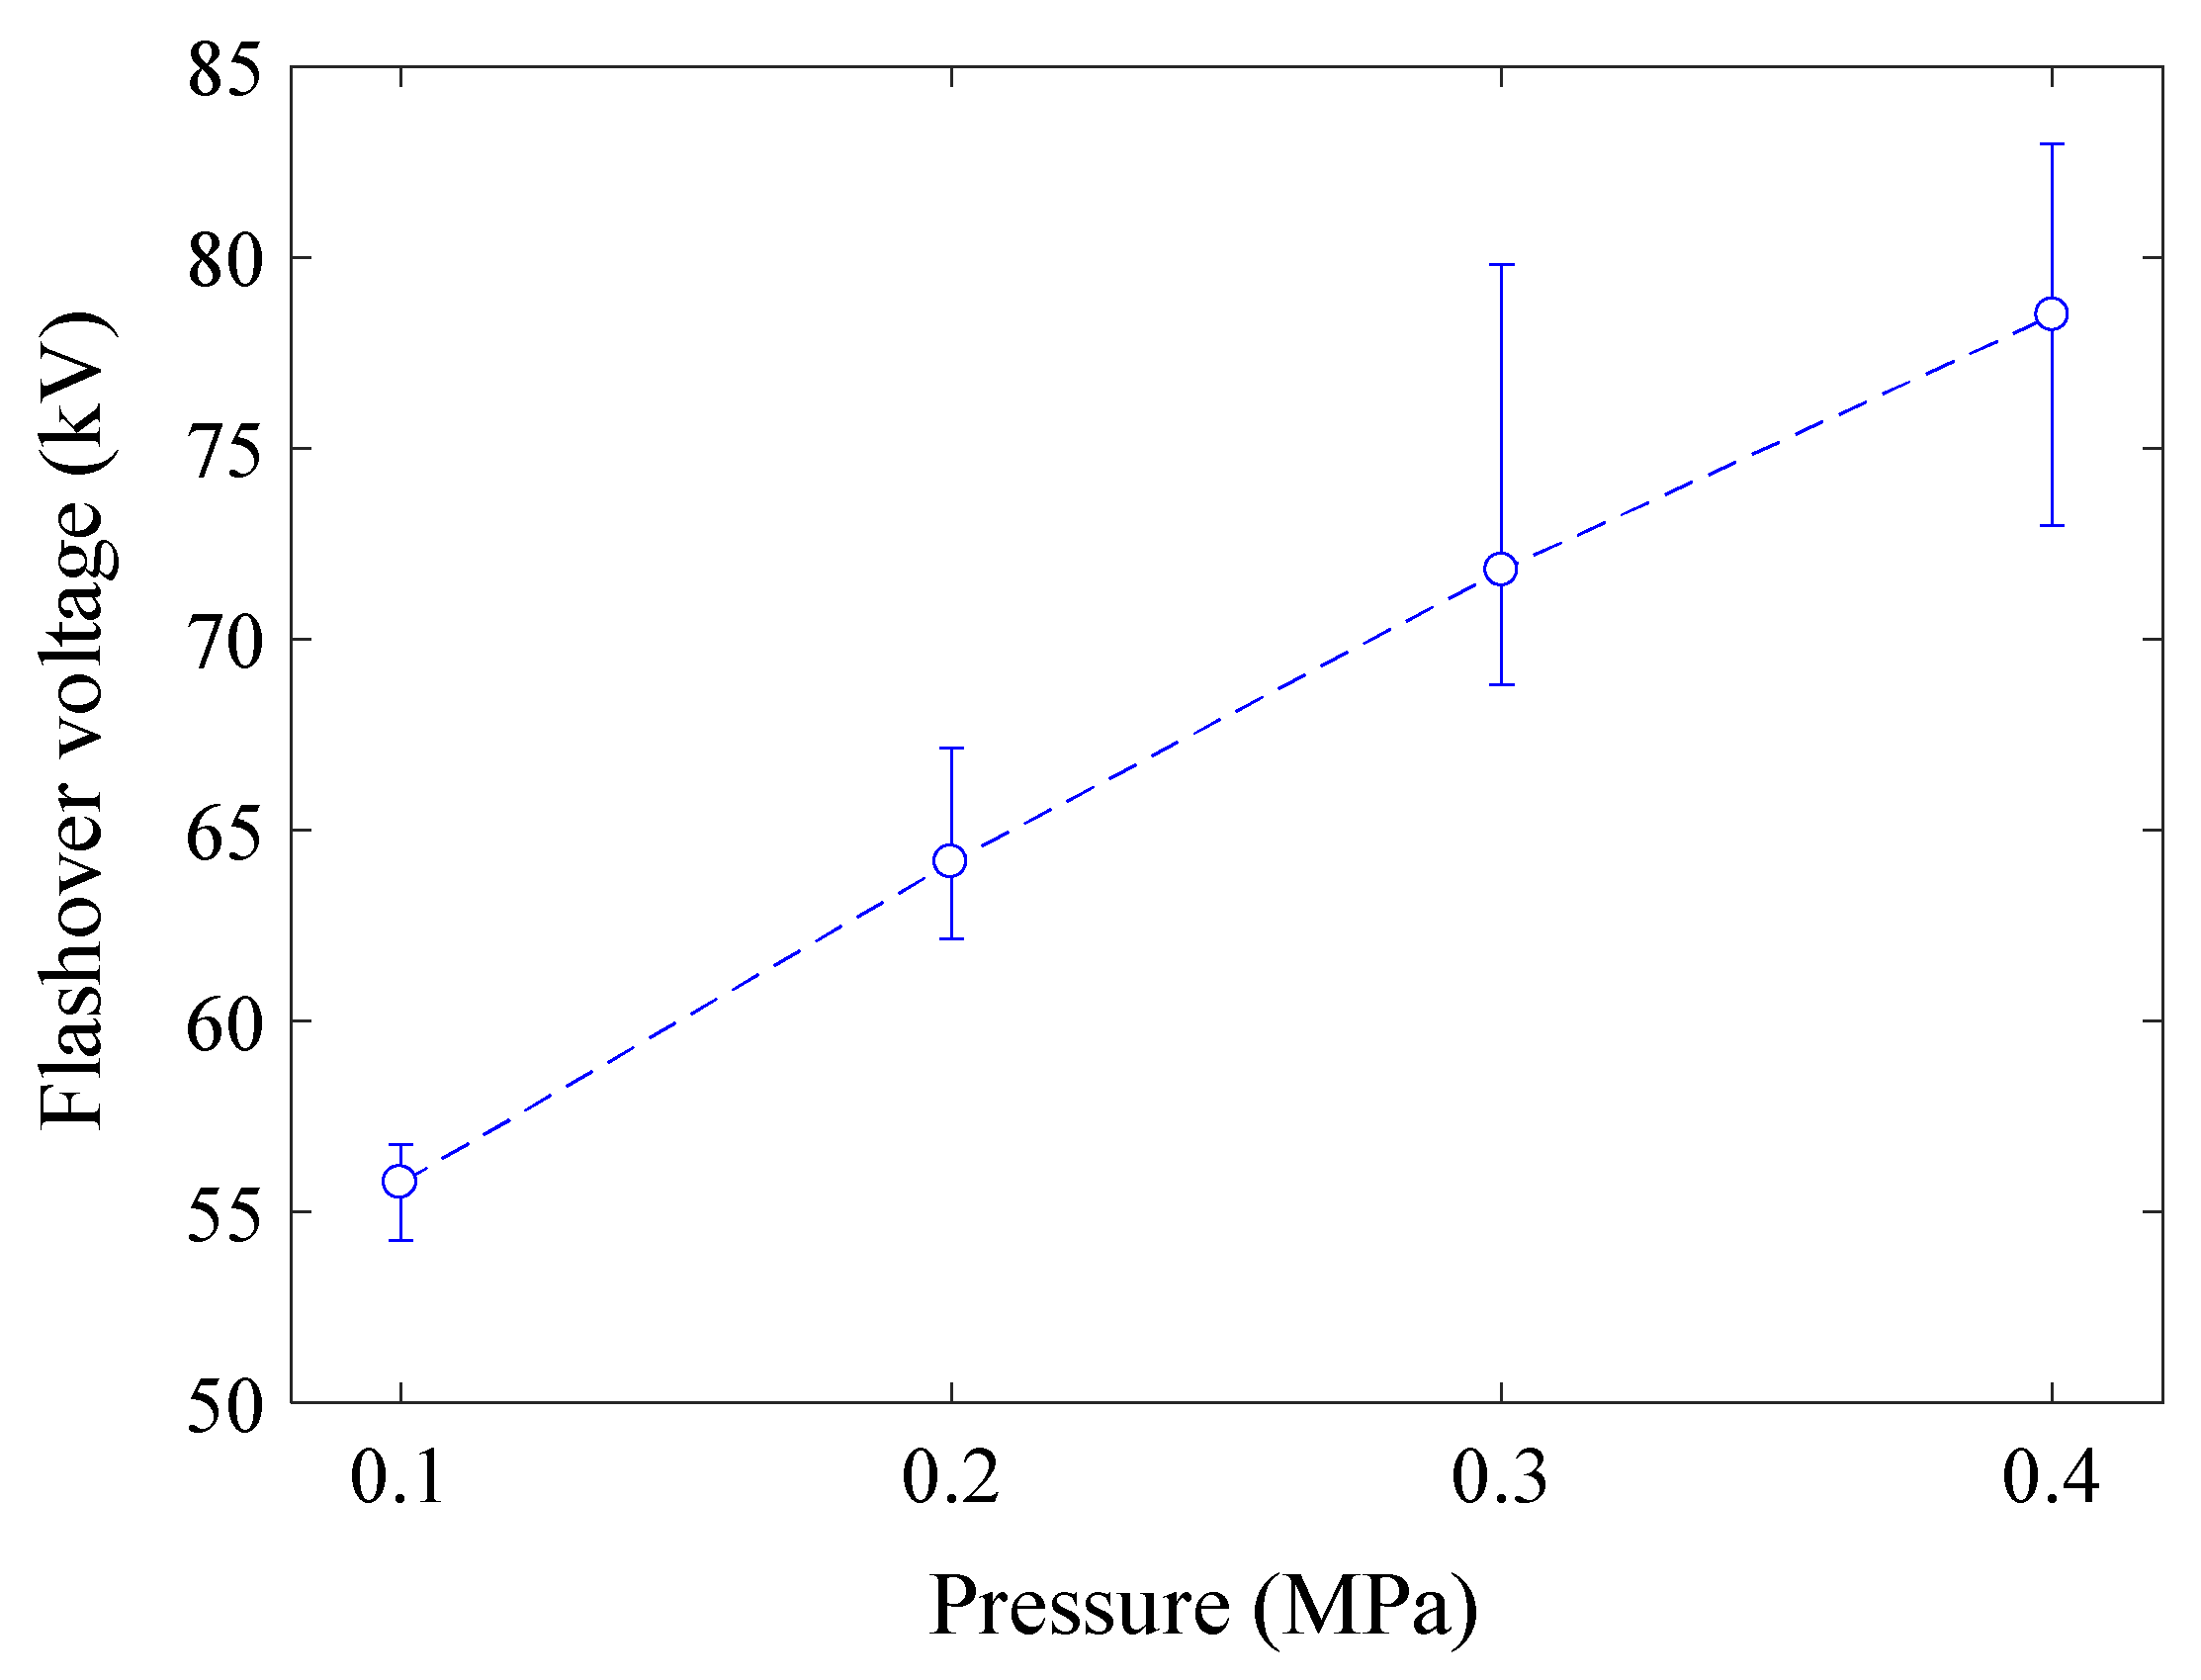
As the applied voltage continued rising, a flashover happened along the oil-paper interface finally. As shown in
Figure 6, the flashover voltage grew up almost linearly with hydrostatic pressure. Because the voltage was applied in the same way that increased 1 kV at a time, then stayed at that level for 5 min, higher breakdown voltage means longer ageing time. This indicates that the oil-paper interface with higher hydrostatic pressure needs higher voltage and a longer time to breakdown. It is another evidence of hydrostatic pressure that can protect the oil-paper insulation.
3.4. Surface Tracking on the Pressboard under Different Hydrostatic Pressure
After flashover happened under atmospheric pressure, there was no mark left on the pressboard, the same as [
2] revealed. In this research, a dendritic white mark emerged and grew along the pressboards when hydrostatic pressure was applied.
Many researches revealed that the white mark on the pressboard was generated by the gas decomposed from mineral oil [
1,
2]. The gas concealed in the pressboard influenced the discharge process from starting PD to final flashover.
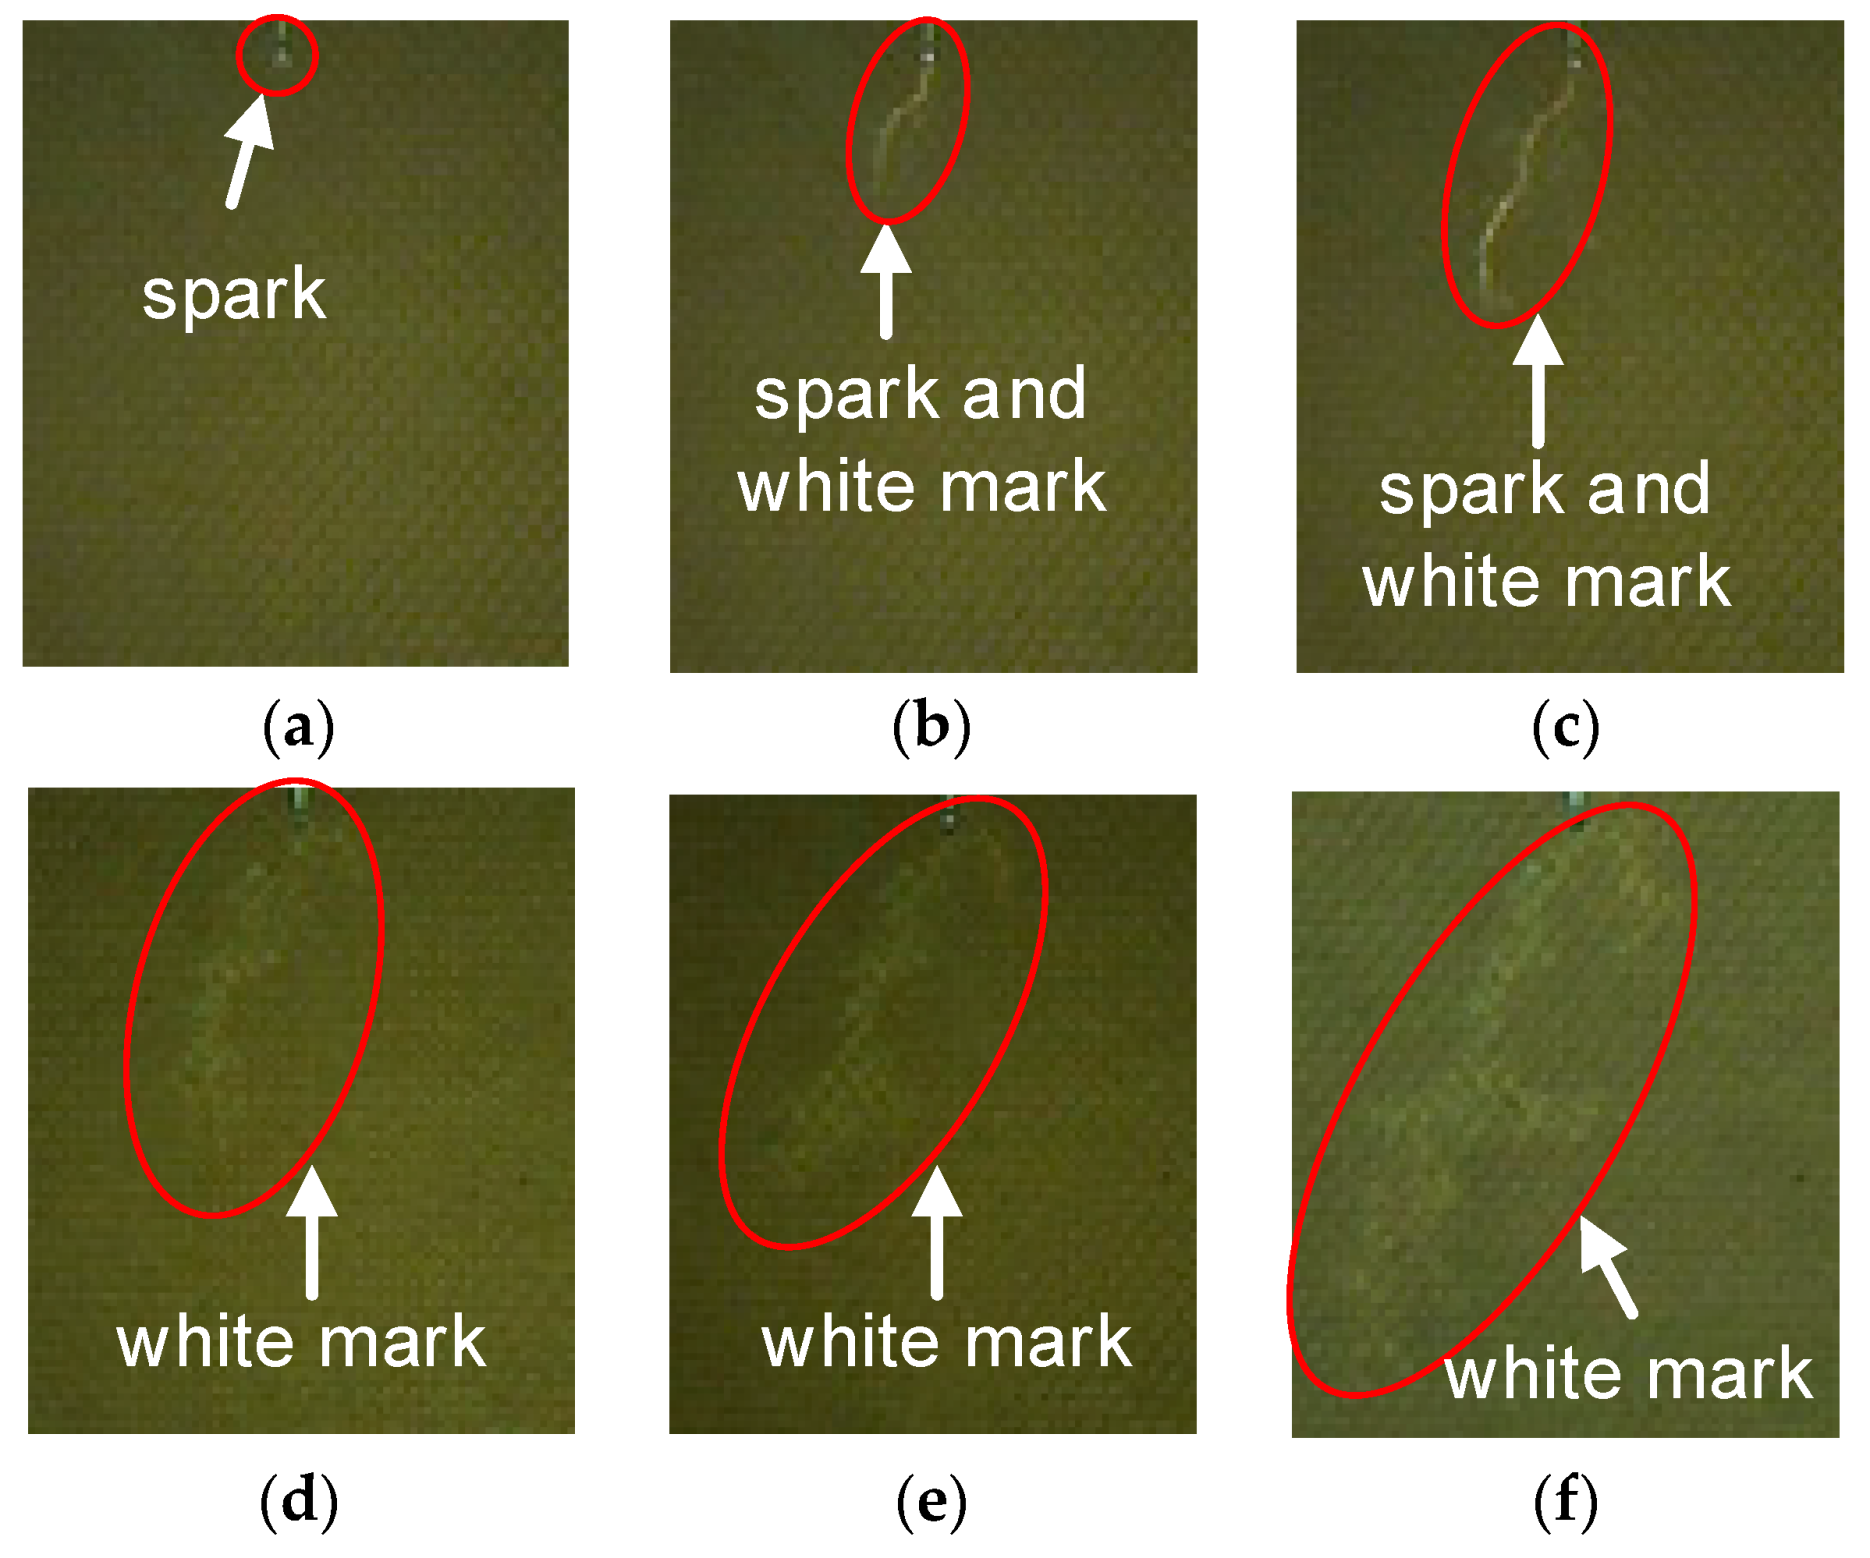
The electric field intensity around the needle tip was the highest. The white mark started from this point and extended in the fan area facing the plate electrode. The white marks extended for minutes till they reached the plates. This process is illustrated in
Figure 7.
Figure 7a–c shows that the white mark grew on the pressboard under bright sparks. Before this, sparks had appeared intermittently along the pressboard for more than ten minutes. The appearance of the white mark was accompanied by fiber carbonizing and oil decomposing above and underneath the PB’s surface. The new bridge formed by gas and carbon inside the pressboard had a lower resistivity than the old one consisting of gas and oil. Hence, the divided voltage and local electric field along the white mark were relatively small. The energy consumed per unit length in the long trail in
Figure 7d–f were relatively smaller and more dispersed than that in
Figure 7a–c. No light appeared at the principal part of the white mark except the tip of its branch. The final flashover followed the white mark path, emitting bright light and generating visible bubble trains, as
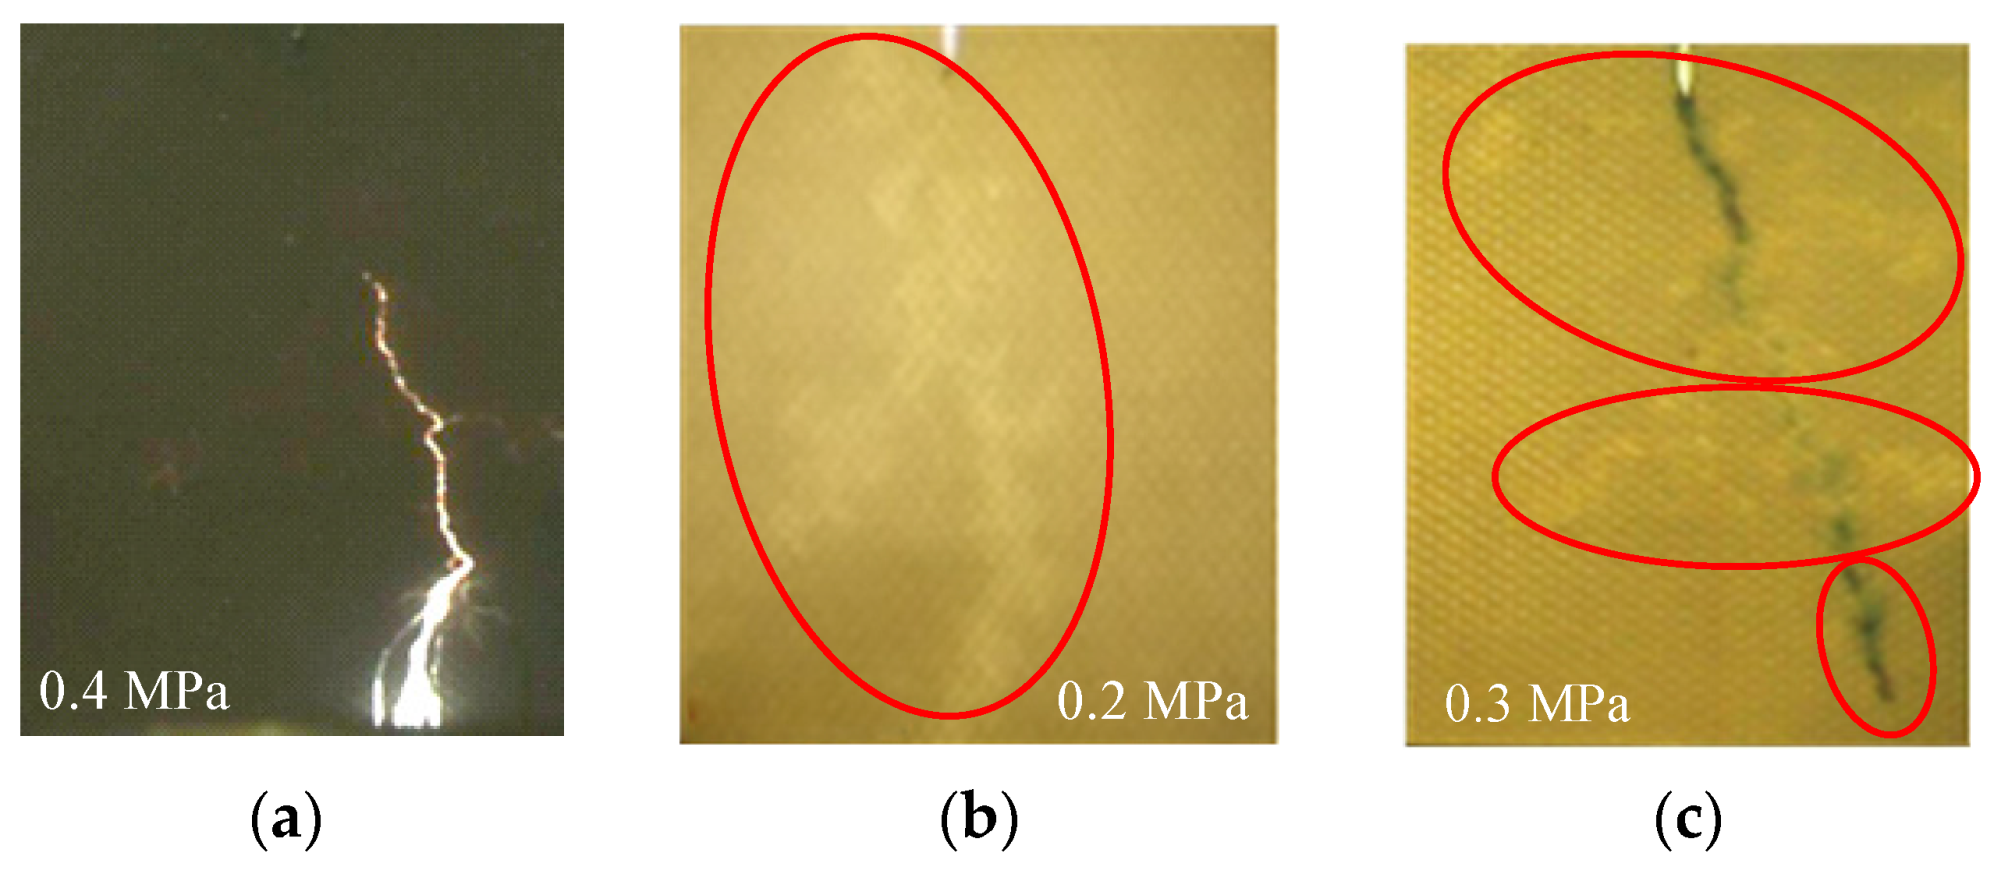
Figure 8a shows.
Figure 8b,c shows two pressboard samples after flashover.
4. Discussion
From the test results above, it can be concluded that the maximum PD amplitude was increased with the pressure rising when the local electrical field was relatively high. However, the discharge repetition rate, PD current, and PD power were greatly decreased under higher pressure. When the hydrostatic pressure was increased to a level higher than the atmospheric pressure, flashover voltage was increased, and the white/black mark emerged on the pressboards.
From [
27], the injected current released energy and generated bubbles in the oil. The volume and lifetime of the bubbles were considerably reduced when the pressure was increased. According to [
15], if the voltage was applied for a time longer than a millisecond, the cavity effects became operative instead of particle effects. The test processes in this paper lasted for several hours. Therefore, little bubbles (cavities) played a key role during the test process. The bubble effect on the discharge and other phenomena are discussed in the following.
4.1. Bubble Adhering to the Pressboard
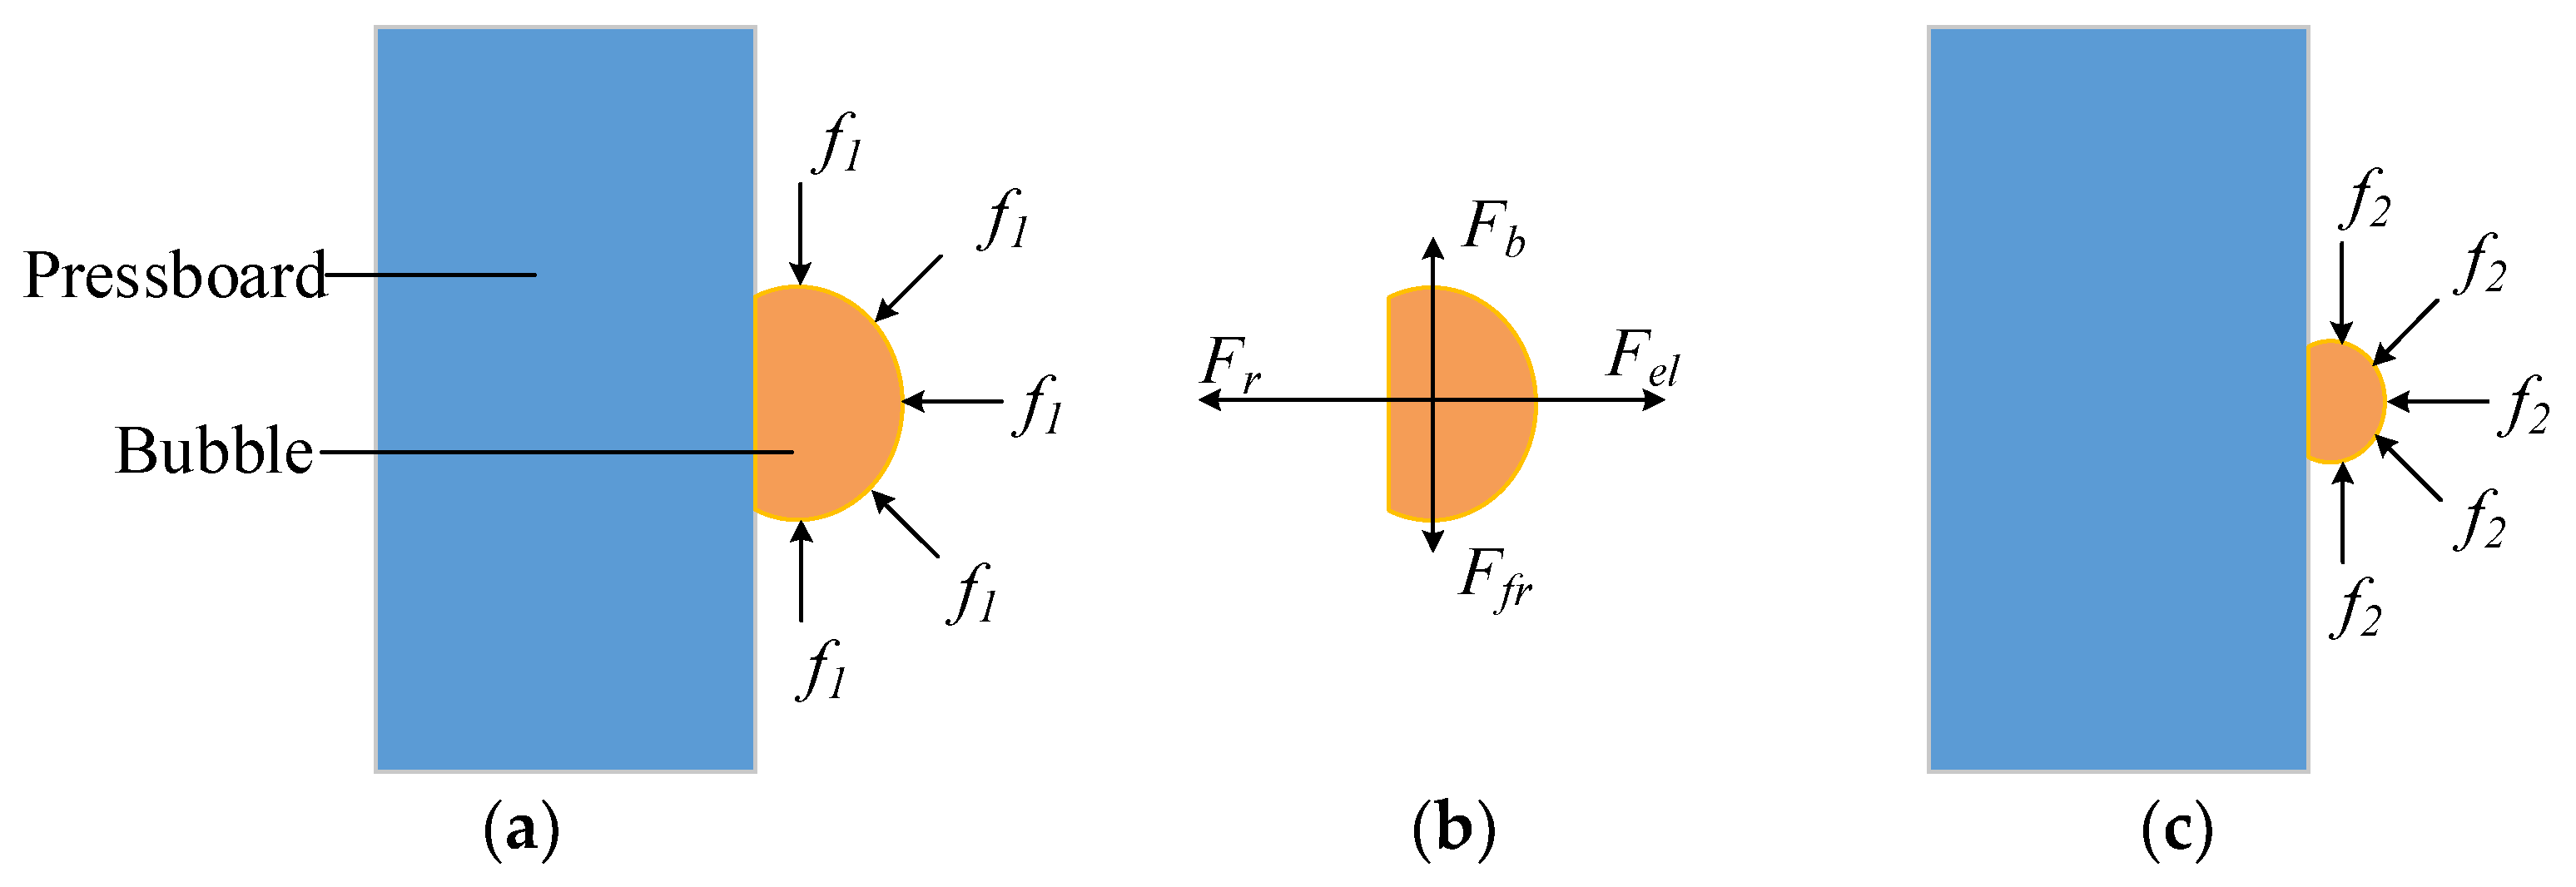
In mineral oil, the density of bubbles along the pressboard surface will be higher than other places because of the adhesive force between gas bubble and pressboard. It can be seen in
Figure 9 that the bubble sticking to the pressboard was under hydrostatic pressure from all directions except the interface with the pressboard. The resultant force of these hydrostatic pressure forces (i.e.,
f) will be a force toward the pressboard (i.e.,
Fr). A frictional force will happen between the pressboard and the bubble (i.e.,
Ffr), and this force will hinder the bubble from floating up. The following analysis is about the stress change of the bubble with the hydrostatic pressure increased. Take the pressure changing from 0.1 MPa to 0.2 MPa as an example.
The Clapeyron equation is expressed as follows:
where
P (Pa) is the hydrostatic pressure,
V (m
3) is the bubble’s volume,
N (mol) is the mole number, and
C (J/mol) is a constant in direct proportion to temperature. The subscript 1 and 2 in the following indicate the variables under 0.1 MPa and 0.2MPa separately.
Coupling Equations (4) and (5), the following equation is obtained.
If
S (m
2) is defined as the contact area between oil and the bubble, then:
Thus, the surface pressure
Fr (N) in
Figure 9 will follow this relation:
Equation (9) shows that the frictional force Ffr (N) will be increased with the hydrostatic pressure. The buoyancy of the bubble Fb (N) was decreased because of compressed volume and unchanged oil mass density. In summary, it will be much easier for bubbles to adhere to the pressboard when hydrostatic pressure is increased.
4.2. Bubble Hiding in the Pressboard
If additional pressure is applied over the oil level through the expansion tank, the visible little bubbles existing in the oil will instantly disappear. There are three reasons for this. Firstly, higher hydrostatic pressure increases the gas solubility factor (Henry’s law); hence, some of the gas in the bubbles will be dissolved in the oil. Secondly, the boiling point of liquid increases with pressure; hence, some elements in the bubbles will be liquefied. Thirdly, the remaining bubbles in the oil-paper system will even become condensed smaller ones because of higher pressure. Smaller bubbles because of higher hydrostatic pressure were observed by optical instruments in [
14,
17].
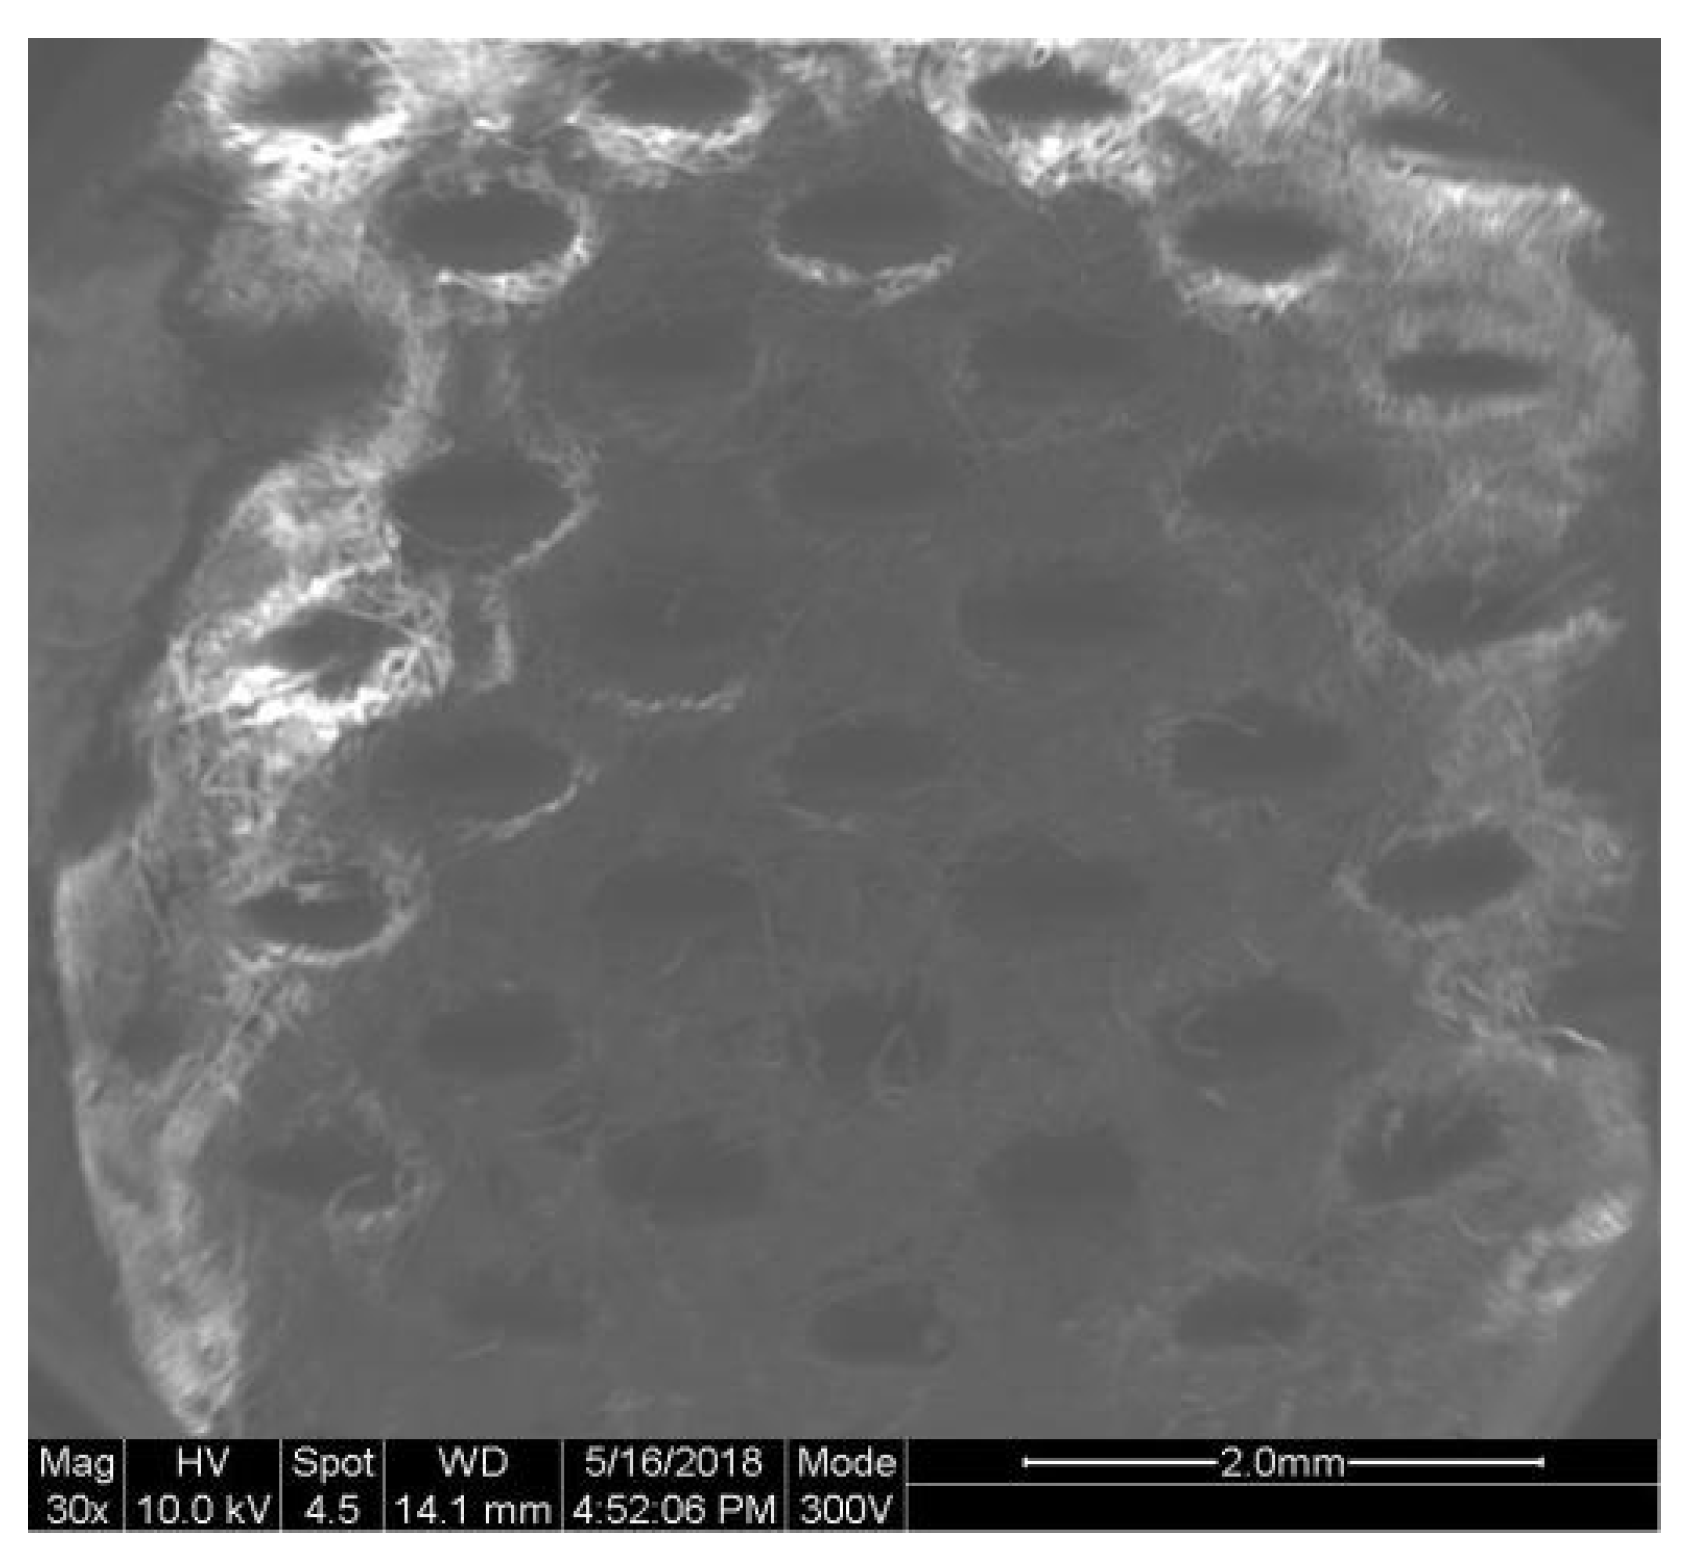
With the help of the scanning electron microscope (SEM), evenly-distributed little holes are observed at the surface of the pressboard in
Figure 10. The tiny bubbles generated by PD under higher pressure will partly be hiding in these cavities.
4.3. Bubble Deformation under Hydrostatic Pressure and Its Effect on Discharge
According to [
15], if the voltage is applied for a time longer than a millisecond, the cavity effects become operative instead of particle effects. A voltage applied for a long time makes it possible for bubbles to migrate into the regions of highest stress. This will result in the formation of a conducting bubble bridge and field distortion between the electrodes. Then, local regions of stress will be in excess of the macroscopic field. As the applied voltage increases, partial discharge happens, and a flashover is generated finally.
In [
1,
2], the presence of PB surface did not change the PDIV compared with the open gap. In this work, the breakdown voltage across the open gap was almost the same as the final flashover voltage along PB under atmospheric pressure. These results verified that the discharge happened through the bubble bridge whether the pressboard existed or not.
Figure 11 shows a schematic of the bubble bridge transformation under pressure and voltage.
Figure 11a,b show the bubble bridges under atmospheric pressure with and without PB, respectively. As additional hydrostatic pressure is applied, most of the gas will be dissolved in the oil, and the rest of the bubbles will be compressed to small ones, as shown in
Figure 11c. After voltage is applied, the discharge will generate new gas bubbles. Some bubbles stick to the pressboard surface and go into the cavities in the pressboard, forming a new bubble bridge, as shown in
Figure 11d.
The higher pressure will make the distance between the gas molecules in the bubbles shorter, which will shorten the collision free stroke of ionization electrons and improve the insulating property of the bubbles [
28]. Because of the better bubble insulating property, higher electric field and higher density of electric charge across the bubbles are needed to generate a discharge. This will produce larger maximum PD amplitudes.
Besides the shortened free stroke and improved insulation property of gas, higher pressure will cut down the volume fraction of gas in oil and improve the homogeneity of this combination insulation because of the increased solubility and condensed volume of gas in oil. It is more difficult to form a local high electric field, and higher voltage is needed to trigger a discharge. According to [
29], the bubble charge period will be lengthened, and then, fewer discharges will happen during a power frequency cycle at the same defect when the pressure is increased. The reduced gas volume fraction decreases the number of weak points in the compound insulation. This further reduces the discharge repetition rate. On the other hand, after one initial pulse, the following oscillations were restrained by higher pressure [
27,
30]. Thus, the discharge repetition rate will go down as shown in
Figure 4b.
Under normal operating condition, the electric field applied on insulation is much lower than permission value (e.g., in this work, the applied voltage was less than 14 kV). Thus, the maximum PD amplitude will be greatly decreased with hydrostatic pressure rising as shown at the beginning of
Figure 3. After long-time operation, the electric field around some local areas will be increased, and the PD value will be increased also (as the region from 14 kV–25 kV shown in
Figure 3,
Figure 4 and
Figure 5). The increased maximum PD amplitude caused by higher hydrostatic pressure will make the sub-health status of the transformer be easily detected, and the decreased PD power will reduce the PD damage on the insulation system.
4.4. Bubble Effect on the White Mark and Flashover Voltage
As shown in
Figure 9 and
Figure 11, some of the generated bubbles were stuck when they were in touch with the pressboard. Bubbles nonadjacent to the pressboard were drifting and floating all the time. Therefore, it will be easier and more stable to establish a bubble bridge along the pressboard than other places in the oil. According to Equations (4)–(9), this effect will be even more significant when the additional hydrostatic pressure is applied. When the bubbles become smaller, the distance from their center to the pressboard is shortened. Thus, a larger proportion of PD energy is dissipated along the pressboard. Besides, the white mark does not emerge until the applied voltage is approaching the flashover voltage, and the time interval from the white mark appearing to flashover is always less than ten minutes if the applied voltage is not turned down.
In [
2,
10], the components of the fault gases in the white mark were detected by dissolved gas analysis (DGA) technology. It showed that the gases in the white mark were similar to those generated by PD in the open gap. In [
10], the white mark generation process was analyzed as follows: Part of the streamer energy decomposed the oil and evaporated the residual moisture inside the pressboard. The oil was propelled into the pressboard by Maxwell’s stress (
Fn = 1/2(1/
ξ2 − 1/
ξ1)
D2,
D is the dielectric flux density), and the gas captured in the pores of the pressboard was partly squeezed out when its expanded size exceeded the surface tension of the pressboard. Ultimately, with the pressure increased, more gas was squeezed into the deeper layer of the pressboard and formed the visible white mark in the surface layer.
From [
31], the velocity of the discharge along the white mark was almost the same as the velocity of discharge in gas, which was much higher than the velocity of discharge along the pressboard without the white mark. Hence, the bubbles almost bridged the electrodes, and gas discharge dominated the flashover process over the white mark. Because of this, the flashover voltage was increased greatly by higher hydrostatic pressure, and the heat generated by PD at this time was increased even more. This can be seen in
Table 3 and
Figure 12. (the discharge power was the average value in three minutes). A much larger volume of oil will be decomposed by the greatly increased PD energy, which was dissipated inside the pressboard, and a much greater mass of new gases will be trapped in the pressboard to form the white mark. The marks shown in
Figure 8b,c verified the above deduction. The carbonization trace under 0.3 MPa was more distinct than that under 0.2 MPa, which is a verification of a larger amount of energy dissipated along the pressboard under higher pressure.
5. Limitations and Future Work
The pressure range of the study was not so wide, and the discharge phenomenon when pressure was under 0.1 MPa was not studied. In the future, the structure of the oil tank will be improved, and discharge phenomenon under a wide range of hydrostatic pressure will be studied. The compound influence of temperature, moisture, and ageing under different pressures will be studied in the future.
6. Conclusions
Experiments were carried out in this paper with a commercial PD detector and a high-speed image recorder to investigate the discharge along the oil-paper interface under AC stress and different hydrostatic pressures. From the test and result analysis, it can be concluded that:
(1) With the voltage increased, the maximum PD amplitude under a higher hydrostatic pressure will rise faster and exceed that value under the atmospheric pressure. Local field distortion will be more clearly revealed by the PD test under higher pressure.
(2) Higher hydrostatic pressure decreases the PD power. Such a phenomenon can be ascribed to the improvement of the insulating property of the bubble in the oil-paper system. The life span of the oil-paper insulation could be prolonged by applying higher hydrostatic pressure.
(3) The flashover voltage exhibited a linear relationship with the hydrostatic pressure.
The changes of the discharge phenomena are ascribed to the change and deformation of the bubbles because of the pressboard and pressure. The increase of hydrostatic pressure is helpful for insulation fault diagnosis. It can also effectively protect the oil-paper interface under a normal operating condition. The more distinct mark left on pressboard because of higher hydrostatic pressure will be helpful for weak point location of oil-paper equipment.


