Article

Experimental Investigation of the Thermal Performance of a Wickless Heat Pipe Operating with Different Fluids: Water, Ethanol, and SES36. Analysis of Influences of Instability Processes at Working Operation Parameters

by
Rafal Andrzejczyk
Gdansk University of Technology, Narutowicza 11/12, 80-233 Gdansk, Poland
Energies 2019, 12(1), 80; https://doi.org/10.3390/en12010080
Submission received: 11 November 2018 / Revised: 15 December 2018 / Accepted: 21 December 2018 / Published: 28 December 2018

Abstract

:
In this study, the influences of different parameters on performance of a wickless heat pipe have been presented. Experiments have been carried out for an input power range from 50 W to 300 W, constant cooling water mass flow rate of 0.01 kg/s, and constant temperature at the inlet to condenser of 10 °C. Three working fluids have been tested: water, ethanol, and SES36 (1,1,1,3,3-Pentafluorobutane) with different filling ratios (0.32, 0.51, 1.0). The wall temperature in different locations (evaporation section, adiabatic section, and condenser section), as well as operating pressure inside two phase closed thermosyphon have been monitored. The wickless heat pipe was made of 0.01 m diameter copper tube, which consists of an evaporator, adiabatic, and condensation sections with the same length (0.4 m). For all working fluids, a dynamic start-up effect caused by heat conduction towards the liquid pool was observed. Only the thermosyphon filled with SES36 was observed to have operation limitation caused by achieving the boiling limit in TPCTs (two-phase closed thermosyphons). The geyser boiling effect has been observed only for thermosyphon filled with ethanol and for a high filling ratio. The performance of the thermosyphon determined the form of the heat transfer resistance of the TPCT and it was found to be dependent of input power and filling ratio, as well as the type of working fluid and AR (aspect ratio). Comparison with other authors would seem to indicate that lower AR results in higher resistance; however, the ratio of condenser section length to inside diameter of pipe is also a very important parameter. Generally, performance of the presented thermosyphon is comparable to other constructions.

1. Introduction

Wickless heat pipe, also known as a two-phase closed thermosyphon (TPCT) is a highly effective heat transfer device capable of transferring a large amount of heat. It is most the simple kind of heat pipe; however, it can only work close to the vertical position. Comparing to conventional heat exchanger, the heat pipe better prevents against potential leaks between heating and cooling sections. This is a great advantage, especially in cooling systems where safety is very important (e.g., nuclear power plant cooling systems). Other advantages of heat pipes are their passive operation, long life (because of non-moving parts), minimum maintenance, and flexible size. These characteristics are the reason of the growing popularity of HPs (heat pipes) in waste heat recovery, HVAC (Heating, Ventilation, Air Conditioning) systems, and electronic, energetic cooling systems. HPs are also very popular in solar collectors and heat pump systems. Due to these benefits, many authors have been interested in the possibility to enhance a TPCT’s thermal performance. Ong and Lim [1] have investigated the thermal performances of three water-filled thermosyphons exposed to evaporator wall temperatures between 30–150 °C. They have found that the performance of a TPCT is based on heat transferred, which varies linearly with mean or bulk temperature difference and is dependent upon the fill ratio (FR) and inclination angle. The best performance has been found for a thermosyphon with a fill ratio equal to 1.0 operating in a vertical position. Authors have also emphasized in their study that TPCT performance is larger for a configuration with larger AR. Ong et al. [2] have studied the thermal performance of a thermosyphon filled with R410A subjected to a low power input (40 W to 100 W) and evaporator wall temperatures between 25 °C and 50 °C. The thermosyphon worked with two fill ratios, 0.50 and 1.00, and at different inclination angles from 30° to 90°. In that paper, investigators concluded that thermosyphon performance (determined from the heat transfer resistance) does not depend on the fill ratio or inclination angle. Jouhara and Robinson [3] have studied the performance of thermosyphons charged with water, as well as dielectric heat transfer liquids FC-84, FC-77, and FC-3283. It has been indicated that the thermal performance of the water-charged thermosyphon has better results than thermosyphons filled with other three working fluids. The first device outperformed in terms of both the effective thermal resistance and maximum heat transport capabilities. Ong [4] has studied the performance of wickless heat pipes filled with R134a and R410A at low temperatures. As an operating element, a copper tube has been used with outside/inside diameters 38 mm/32 mm. The evaporator, adiabatic, and condensation sections have had various lengths 405 mm, 327 mm, and 110 mm, respectively. The experiment was conducted with different input powers (100 W–500 W) and with different FRs (0.5 and 0.7). It has been noted that the kind of fluid has no significant effect on performance of a TPCT. The author also emphasised that heat transfer coefficients are independent of evaporation and condensation sections from FR and inclination. Jafari et al. [5] focused their study on experimental analysis and numerical simulations of TPCTs. The article concerned searching for optimal operation conditions for a thermosyphon. For this reason, both experimental and numerical analyses have been made. Copper pipe was used as a testing element with a diameter of 35 mm and total length 500 mm. The experiments were performed in the range of power 30 W–700 W and FRs from 0.163 to 1.35. By comparing experimental data with a 2-D mathematical model, a good agreement has been obtained. It has been observed that there was a dryout effect for small FR (0.16) and a geyser boiling effect for larger FR (0.35 and 1.35). Heris et al. [6], in their experiments, have studied the influence of the oxidized carbon nanotubes (CNT) added to water nanofluids on the performance of a two-phase closed thermosyphon. It should be noted that the experiments have also been carried out for pure water as a working fluid. It has been confirmed that nanofluids added to water could significantly increase the TPCT performance. Eidan et al. [7] have experimentally and numerically worked on wickless heat-pipe-dedicated applications in HVAC systems. They have investigated a thermosyphon filled with different working fluids (water, methanol, ethanol, acetone, butanol, and R134a) and with different FRs (0.4, 0.5, 0.6, 0.7, and 1.0). The testing element was made from a 0.016 m diameter copper tube, which consisted of a 0.15 m evaporator, and 0.1 m adiabatic and 0.15 m condenser sections. Aghel et al. [8] have investigated the performance of a TPCT equipped with a novel construction of condenser section. Experiments have been performed for distilled water as a working fluid with an FR equal to 0.75 and for various power inputs from 71 W to 960 W. It has been confirmed that a new type of condenser section in a TPCT could enhance the performance from 10% to 17% compared to the unmodified version of a thermosyphon. W. Wits and G. Riele [9] have worked on a cooling strategy for advanced electronic applications using heat pipe technology. The authors’ idea was based on using an array of relatively long heat pipes, whereby heat was disposed to a long section of the pipes. Experiments has been performed for 1 m length pipes with diameter 12 mm. The evaporation section consisted of three separated section with the same length (0.25 m). The tests were carried out for different power input and inclination angles (0°, 30°, 60°, and 90°). As it was expected, the best performance was obtained for a vertical configuration. It was emphasized that the thermal module predicted experimental results relatively well, especially for higher input powers. Ong and Hamlaoui [10] have studied the thermal performance of a wickless heat pipe using water and R134a as working fluids. In their experiments, they used a 0.78 m length copper tube with outer and inner diameters of 28.2 mm and 25.5 mm, respectively. The evaporator, and adiabatic and condenser sections were 300 mm, 180 mm, and 300 mm in length, respectively. Tests have been performed for different FRs (0.6, 0.7, and 0.8 for water, and 0.4, 0.5, and 0.8 for R134a). The evaporator was heated using a water bath and cooling water was used to remove heat from the condenser section. It has been observed that the performance of the thermosyphon increased with higher operating temperature differences, mass flow rates in the condensation section, and FR. Alammar et al. [11] have investigated the influences of the geyser boiling phenomenon on the thermal performance of a TPCT. The study was conducted for different water FRs (0.25, 0.65, and 1.0), various inclination angles (90°, 60°, 30°, and 10°), and a large heat range (20 W–400 W). Authors noticed that the geyser boiling effect significantly influenced thermosyphon performance. They concluded that the heat transfer limit of the thermosyphon could be noticeably increased by the occurrence of the geyser boiling. The presented results also showed that the temperature distributes uniformly along the thermosyphon wall after the geyser effect occurrence.
A literature review has shown that many studies concerned the thermal performance of TPCTs, where an additional comparison is presented in Table 1. However, it should be emphasized that not many studies have concerned the influences of the geyser boiling effect on the performance of TPCTs. It should also be emphasized that the occurrence of this effect could significantly change all TPCT working parameters. What is more, only a few literature studies have reported a variation of TPCT working parameters as a time function and for different filling ratios. This data is crucial for properly defined stable working conditions of a gravity heat pipe. Finally, it is very important for the thermal performance calculations of TPCTs.
Figure 1 presents the geometrical range and flow range covered in the present work compared to other experimental investigations. This analysis has been made to better explain the main similarities and differences between the presented study and other works from the literature. In this work, the author has focused on the thermal performance of a wickless heat pipe working in a vertical position and operating with different fluids: water, ethanol, and SES36. The literature review clearly shows that many studies from the literature have partly covered the same flow regime as in the present paper. However, most of the studies have been made for different fluids and geometries.
A majority of the experimental data was collected only for water as a working fluid. The next challenge of the presented paper is to show the possibility of using a wickless heat pipe filled with water, ethanol, and SES36 in industry systems [12]. Presently there is a lack of experimental data for SES36 as a working fluid in a wickless heat pipe in published elaborations. The SES36 azeotropic mixture is a potential working fluid for ORC (Organic Rankine Cycle), HVAC, and waste heat recovery installations. At this moment, this fluid among others is used as a foaming agent for the production of polyurethane insulation. The application potential of SES36 has significant interest because of the thermophysical properties of this fluid. Physical parameters of SES36 are substantially different in comparison to other substances that have been commonly tested in thermosyphons (see Table 2). Comparing to water and ethanol SES36, this fluid has excellent dielectric parameters. Therefore, this fluid could be used directly to cool the electronic systems. This fluid also gives the possibility of utilizing energy in a relatively low temperature (low normal boiling point temperature). In many reports, SES36 has been shown as a potential fluid for ORC systems. It also has a low freezing point and no toxicity. Due to that fact, it could also be used in HVAC installations [13].
As has already been mentioned, the big advantage of wickless heat pipes is their large thermal conductivity and minimal maintenance [15]. This is the key reason for the popularity of wickless heat pipes in heat transfer systems [16]. It should be noted that there are a few limitations regarding heat transport in heat pipes [17]. However, most of studies have not investigated phase change processes that could limit the thermal characteristics of TPCTs. In the author’s opinion, there is still a need to experimentally and theoretically study of the influence of this effect on the performance and operating limits of wickless heat pipes [18].
The primary objective of the present study is to provide a comprehensive experimental database for the thermal performance of a two-phase closed thermosyphon operating with different working fluids and for different operating parameters. The gathered database will allow for:
(1)
Obtaining temperature profiles of the axial wall temperature distribution;
(2)
Recognizing the effects of geyser boiling and boiling limit on the performance of the thermosyphon;
(3)
Recognizing the effects of the fill ratio and power input on the thermal performance of TPCTs;
(4)
Recognizing the effect of geometrical parameters on the thermal resistance of TPCTs;
(5)
Checking the ability of several literature correlations to predict experimental heat transfer coefficients.

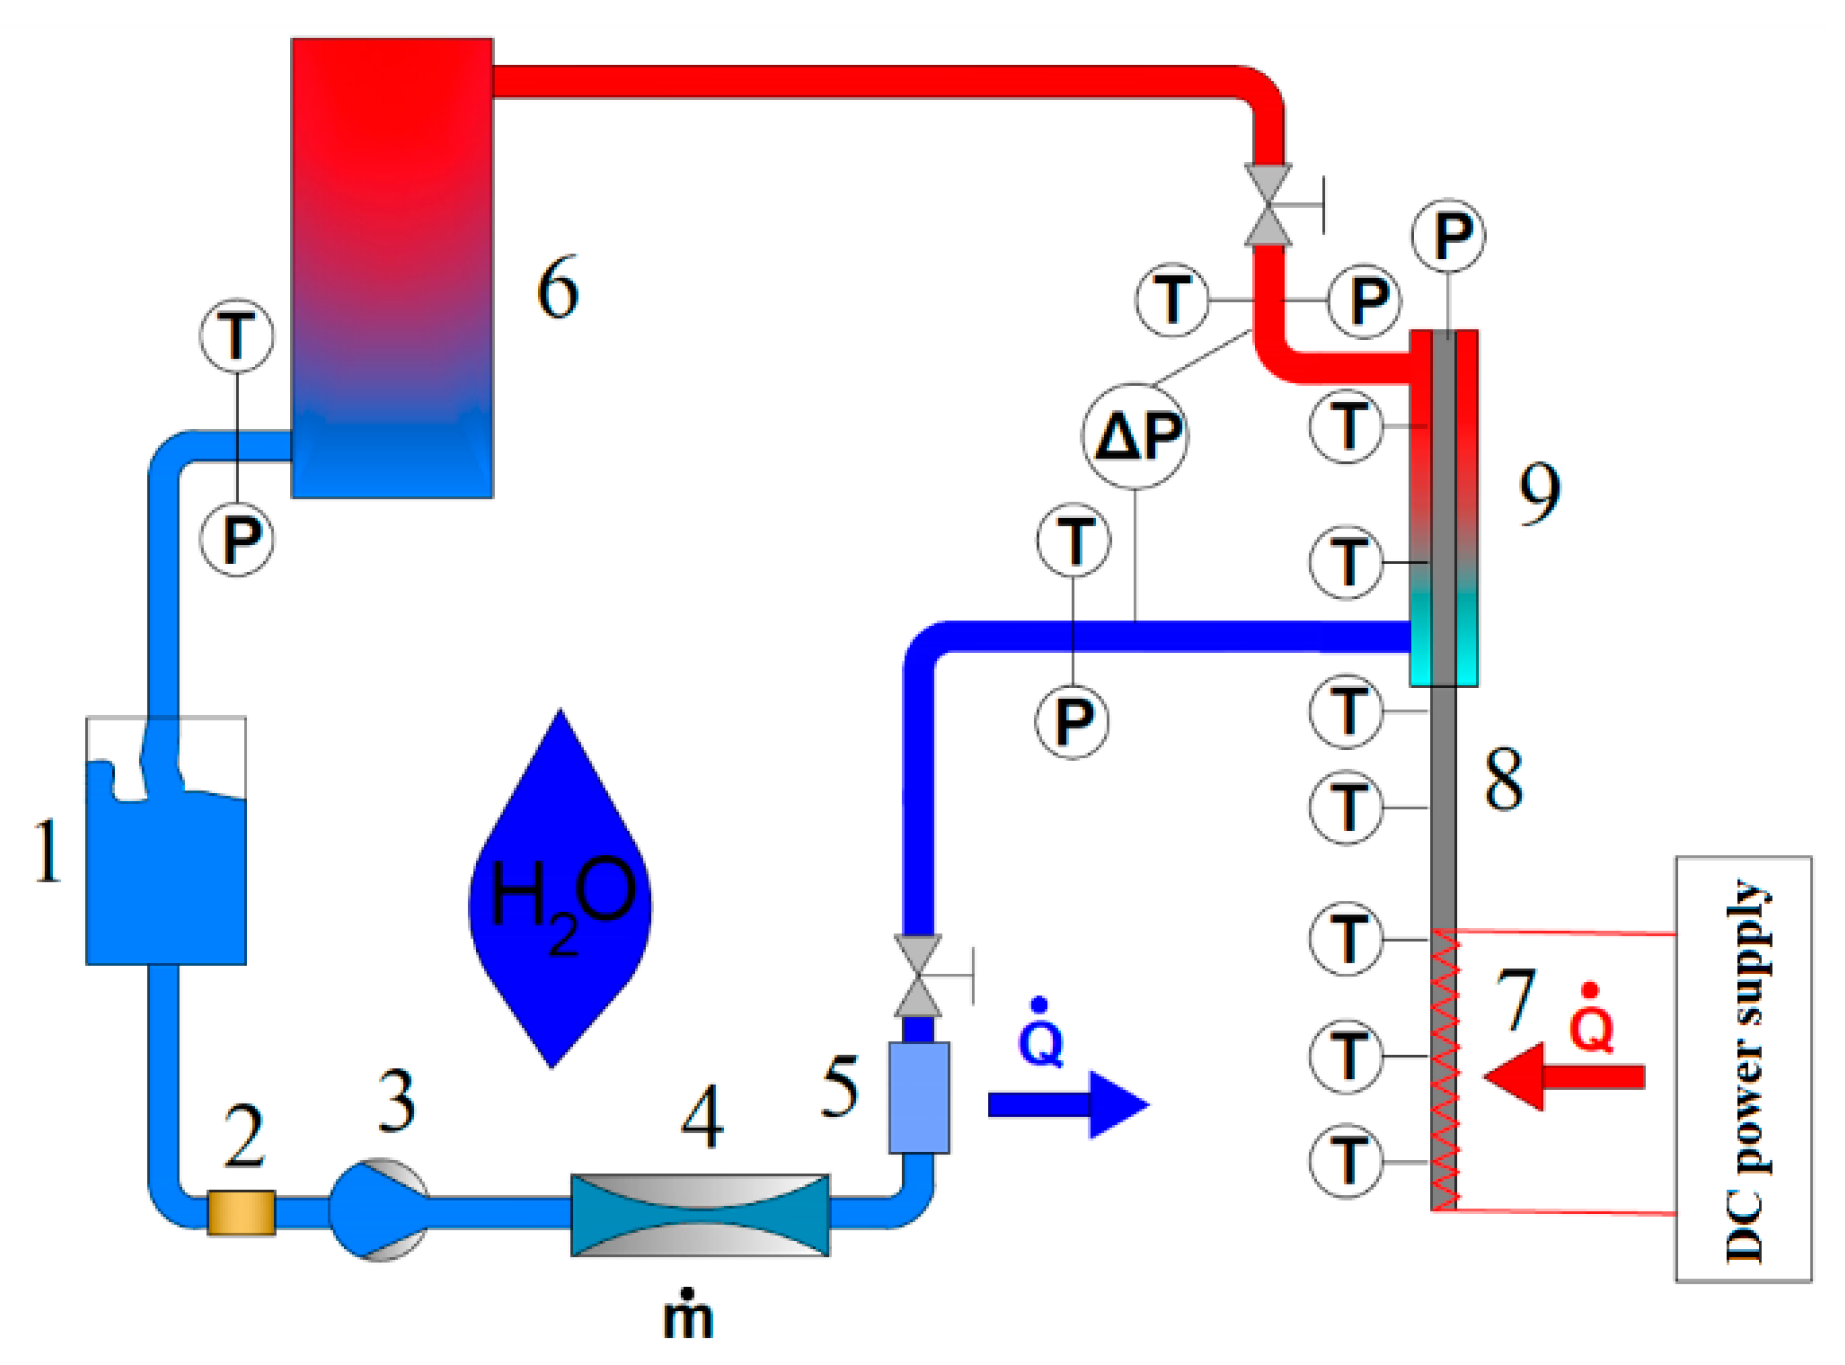
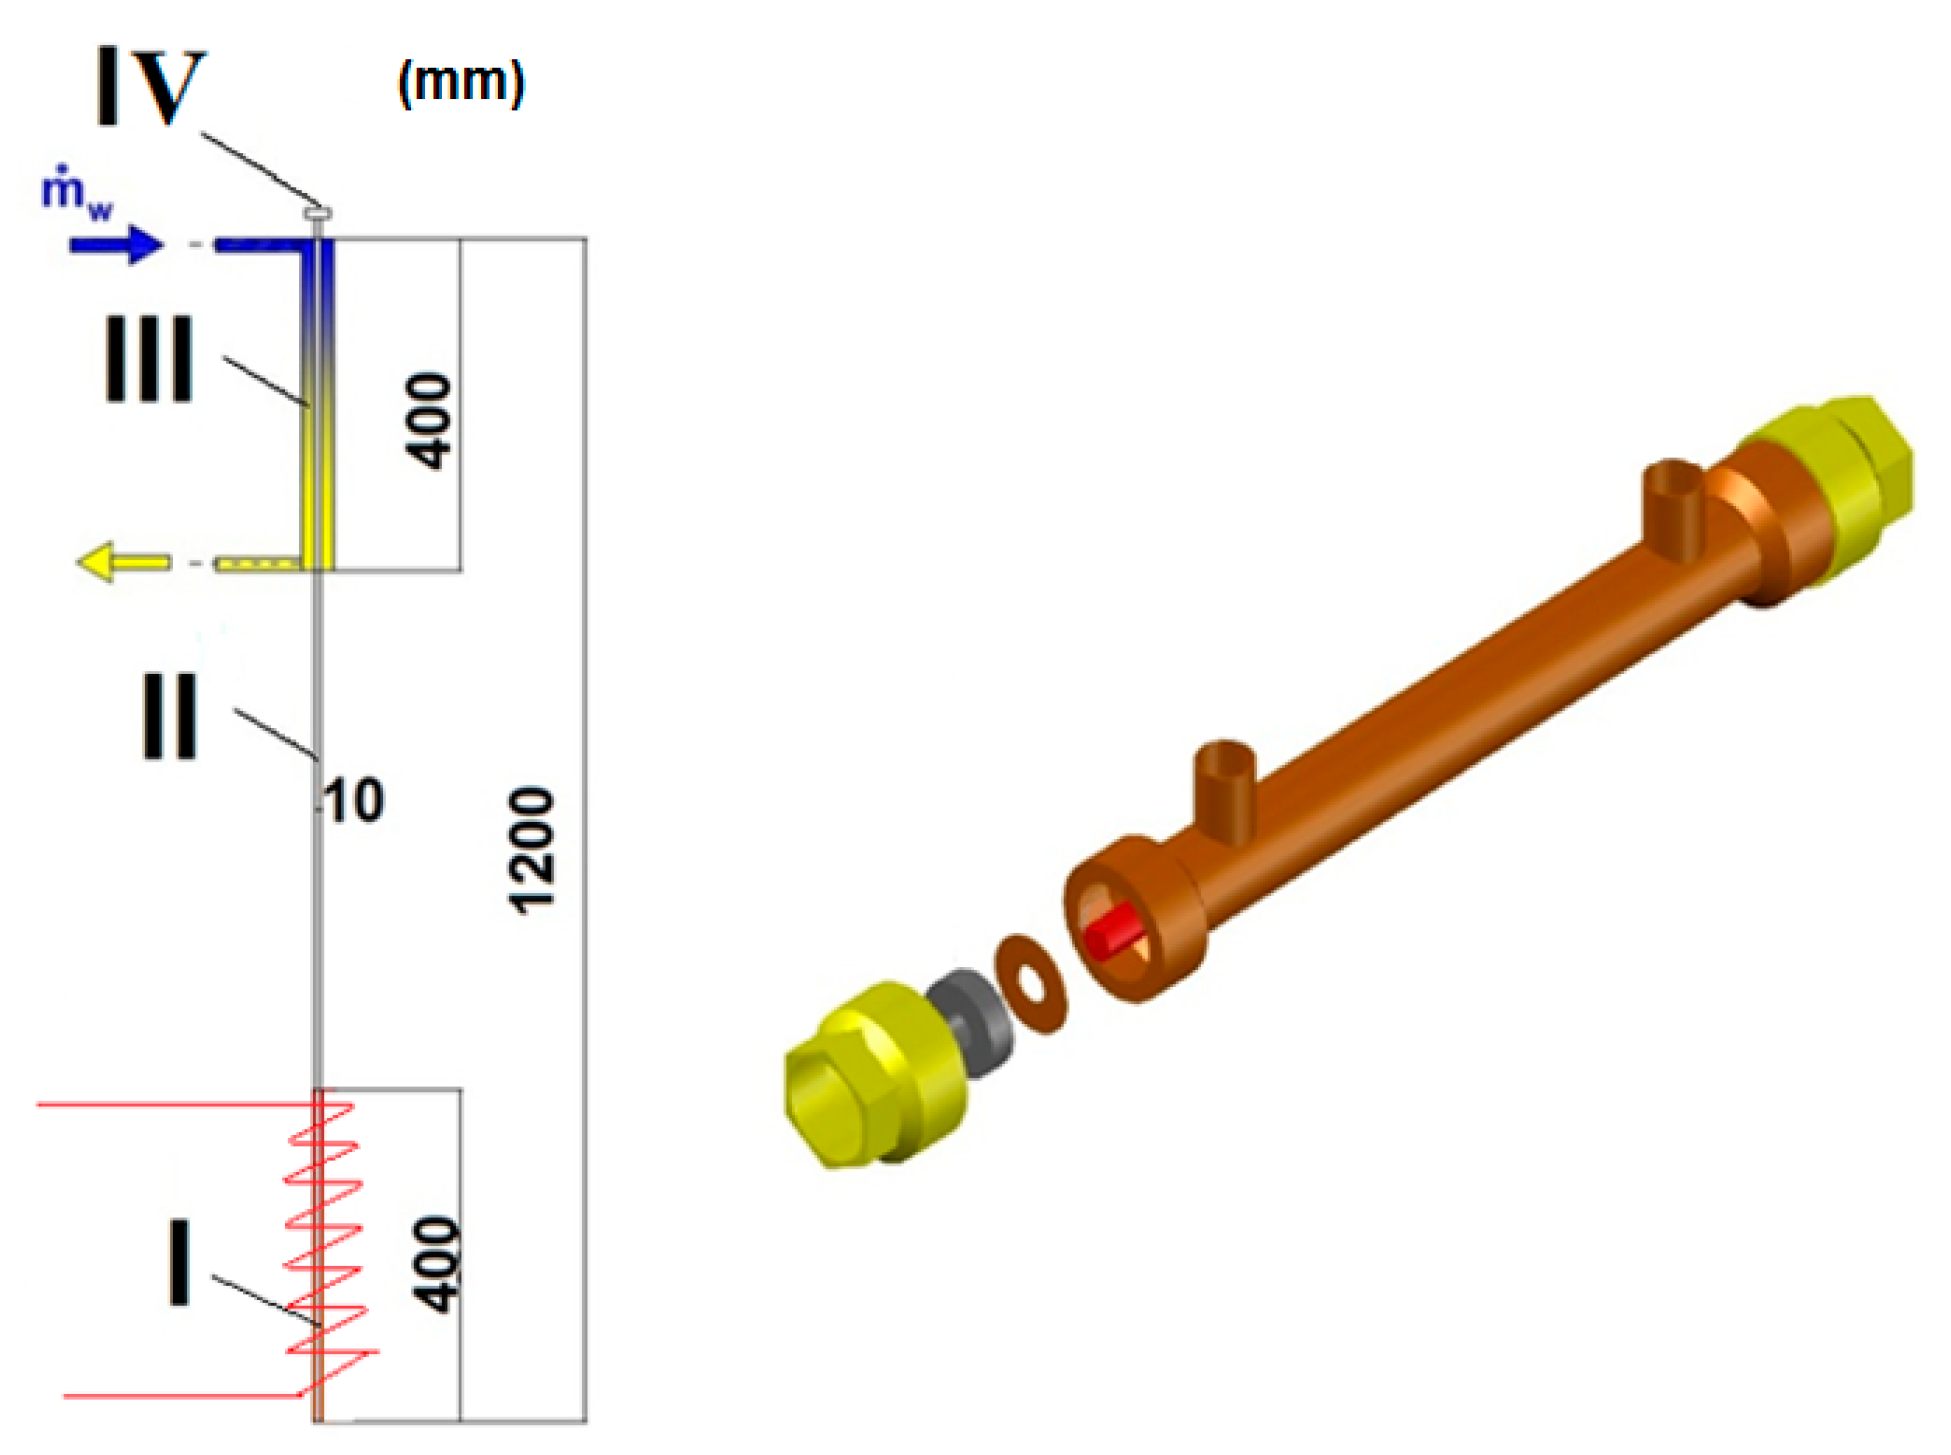
2. Experimental Setup

Experimental work has been used to find an improved version of the test section, which has been characterized in previous works [19,20]. The test rig consisted of a closed loop made of stainless steel. The facility was intended to work with any non-chemically aggressive working fluids. In the test rig, circulation was forced using a magnetic gear pump, capable of providing a mass flow rate from 1 g/s to 5 g/s, and an overpressure of up to 8 bars. This type of pump was chosen to provide the circulation of fluid in the test section and to avoid flow pulsations. Adjustment of the mass flow rate was realized using an independent inverter. The mass flux, and inlet and outlet temperatures of the cooling water were measured. The unit was also equipped with an additional heat exchanger in the main tank. This was used to provide additional heating or cooling of the medium depending on the needs. Temperature, mass flow, and system pressure were recorded using a data logger connected to a computer. The data are display using LabView 8.0 National Instruments (Austin, TX, USA) [21]. The flow rate was measured using a Coriolis mass flow meter (Endress Hauser Promass). The advantage of this device is the simultaneous measurement of mass and density of the pumped liquid. The pressure drop measurement was carried out at the cold-water circuit using the piezoelectric smart differential pressure transmitter. Microprocessor control enabled temperature and hysteresis compensation, and it also allowed for an extended linear temporal stability. The measuring range of the transmitter was 5 kPa to 500 kPa, and the measuring accuracy was ±0.065%. At the inlet, the absolute pressure transducer was mounted and had a measuring range of 0–4 bar and a precision of ±0.25%. At the outlet, the gauge pressure transducer was installed and had a range of 0–6 bar and an accuracy of ±0.5%. The operating pressure inside of the TPCT was also measured using a gauge pressure transducer with the range of −1 bar to 2.5 bar and an accuracy in full scale ±0.5%. The hydraulic deadweight testers were used to verify the calibration of pressure sensors in order to confirm their class and to check the linearity. Each sensor was calibrated for the entire measurement range. The inlet and outlet temperatures of cold water were measured using two PT100-resistant temperature sensors (1/3 DIN B class of tolerance—it is not a standardized class of accuracy) inserted at the inlet and outlet collectors. Other temperatures in the test sections and wall temperature of thermosyphon were measured using J-type thermocouples with first class accuracy (the type of thermocouple made of iron-constant wires; the working range of this thermocouple is between −40 °C and 750 °C). All temperature sensors were calibrated for the entire measuring range (with the allocation of each sensor to a specific channel on the SCXI-1303—32-channel isothermal terminal block). An Isotech 935-14-61 RTD (resistance temperature detector) sensor was used as a reference thermometer. In combination with the Cropico 3001 micrometer, it offered an accuracy at the level of ±0.1 K. The power was supplied to the evaporation section using electric heater. The heater was made of kanthal electric wire insulated using glass wool. This heater has been supplied by a DC power supply. The evaporation section was thermally insulated by rock wool. The rest of the test section was insulated using thermaflex insulation. The scheme of the test rig is shown in Figure 2.
All data points were gathered during steady state conditions. After obtaining constant parameters, temperatures were measured three times, and the average values were used for further analysis. The measured uncertainty parameters are shown in Table 3.
The dimensions of the thermosyphon are presented in Figure 3. Despite the fact that the thermosyphon has been made of copper (λCu = 389 W/mK), it was assumed that the influence of axial flux of the transferred heat was negligibly small.
The heat flux transferred via conduction was neglected based on the above analysis. If the pipe is well isolated and assuming the stable temperature at the ends of the pipe (see Figure 4), the conducted axial heat flux can be calculated from the following equations [22,23]:
Q ˙ a x = λ · T 2 T 1 L · S
S = π · D o 2 4 π · D i 2 4
The calculations were made for a constant cold end of the pipe (T2 = 15 °C) and a variable temperature T1 of the hot end of the pipe (30 °C to 100 °C). It should be noted that the range of temperature differences was assumed as a maximum temperature change between evaporation (hot end) and condensation section (cold end). Calculations results are presented in Figure 5. The maximum calculated heat flux was no larger than 1.0 W. Finally, considering the results of calculation, influences of the axial conduction heat transfer was neglected.

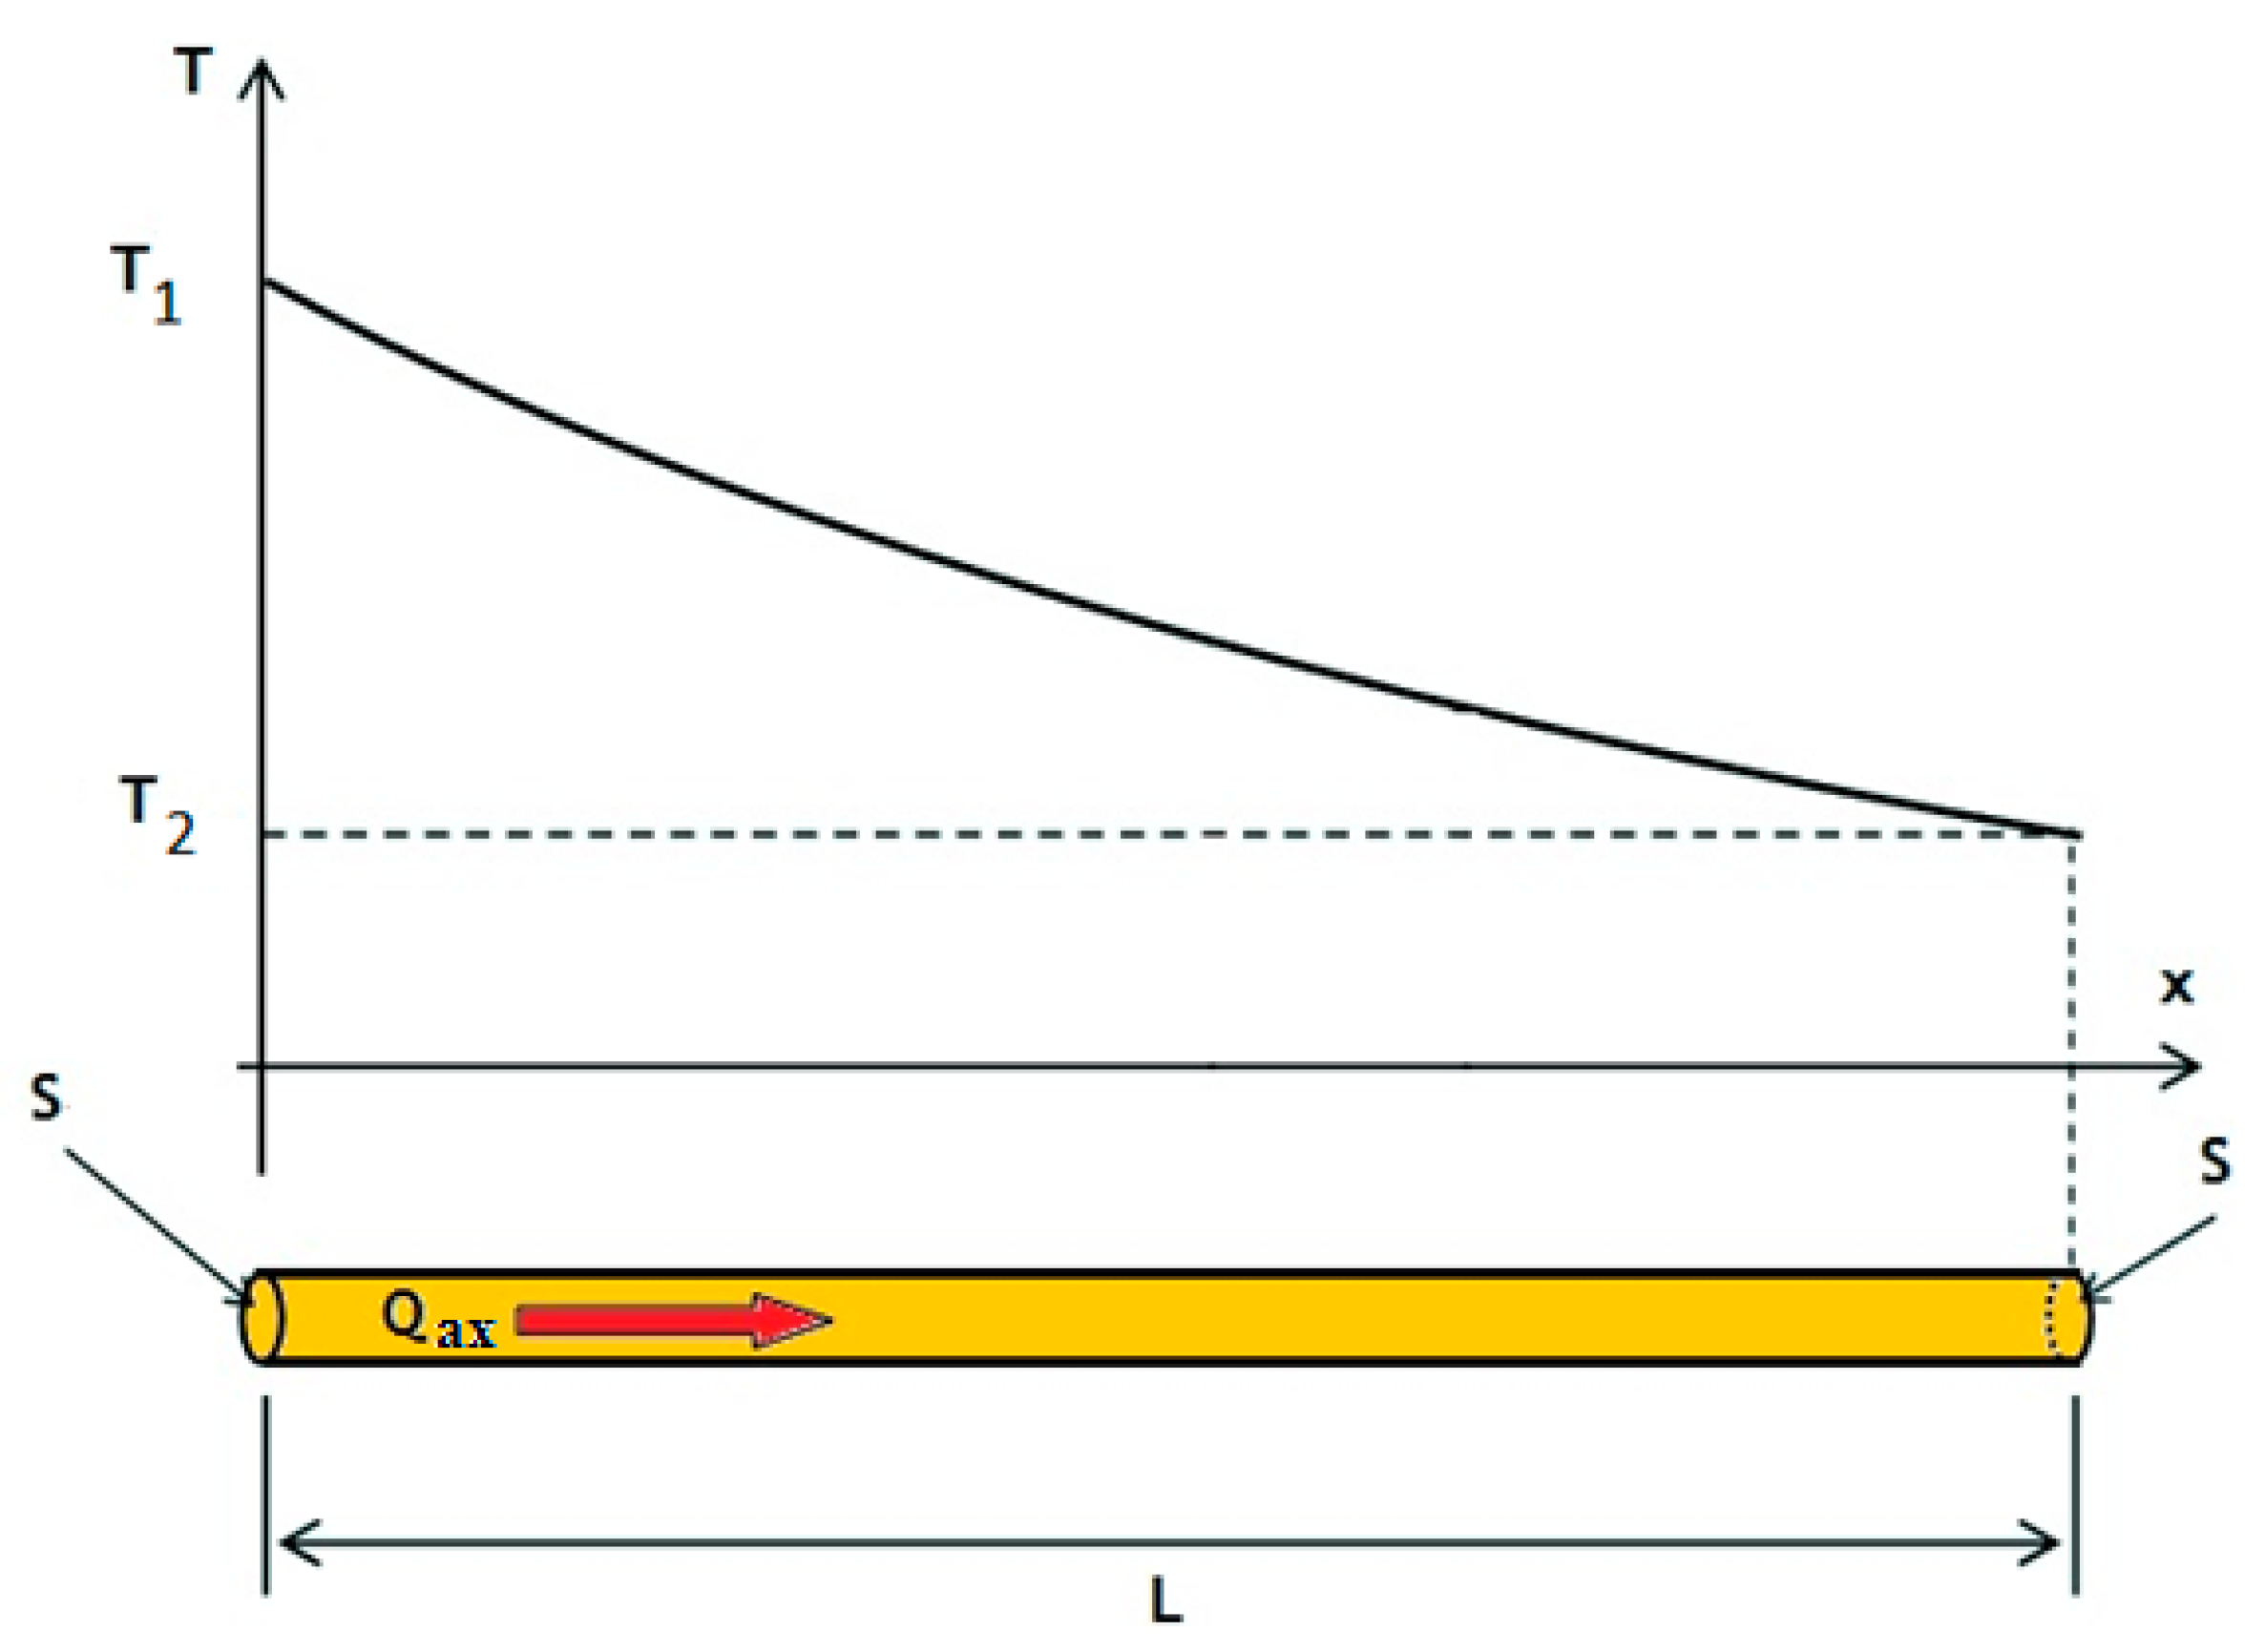
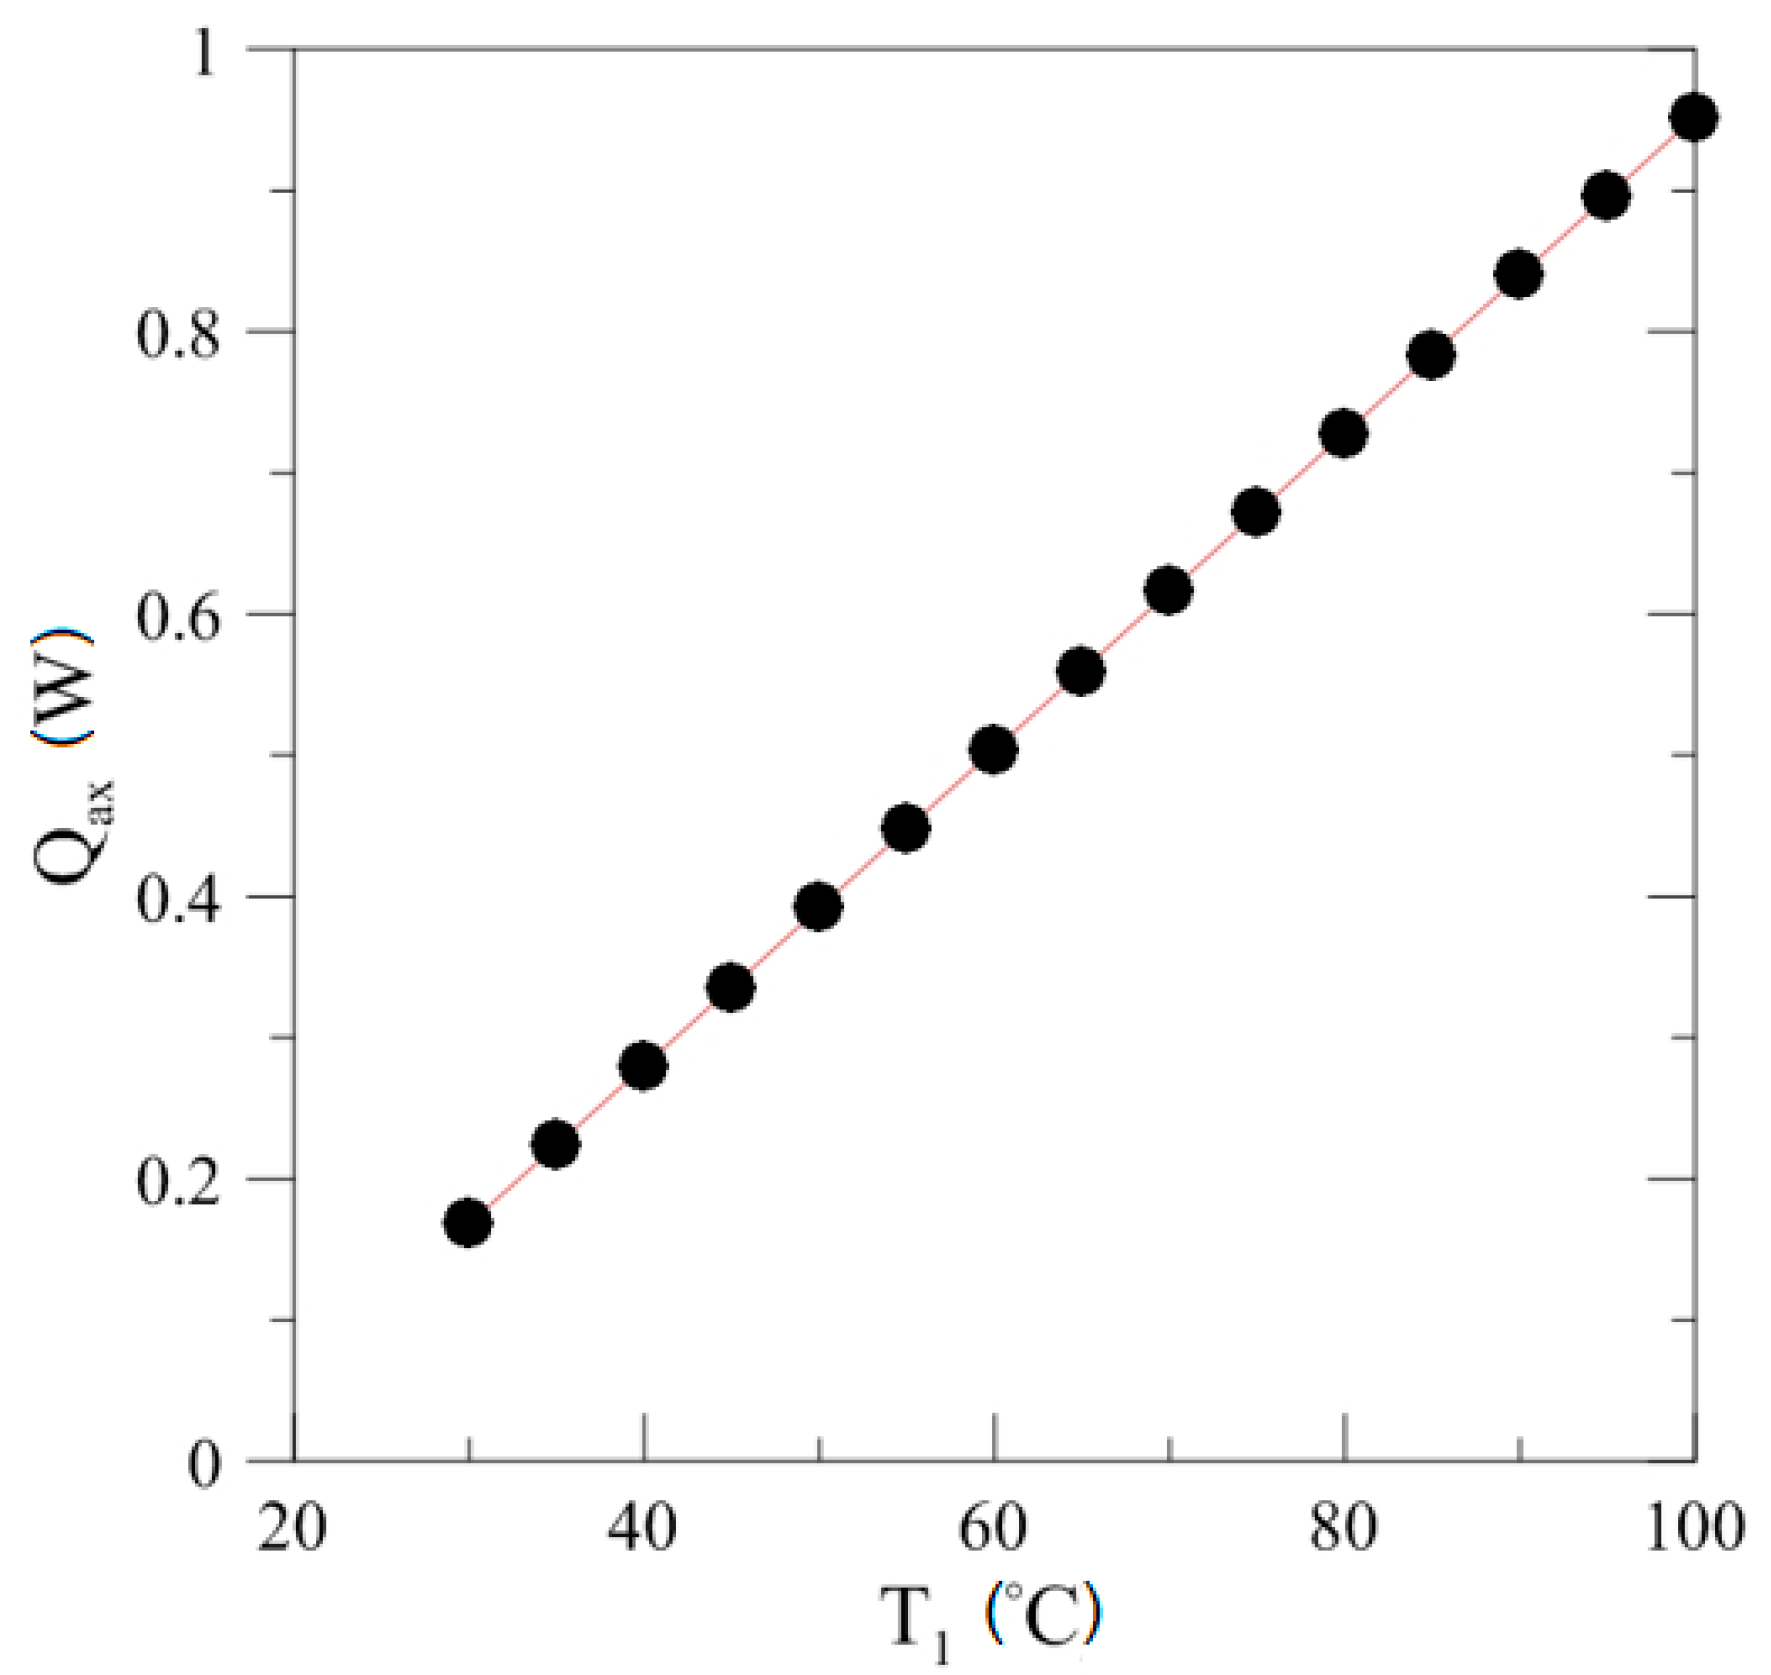
3. Mathematical Model

The heat flux value generated by the electric heater was calculated from Ohm’s law, as given by Equation (3). The heat absorbed by the cold water could be calculated using Equation (4).
Q ˙ e = U · I
Q ˙ w = c p · m ˙ w · ( T w , o u t T w ,   i n )
Because the electric heater was used, a constant heat flux density on heater surface was assumed as given in Equation (5):
q = Q ˙ e A e
The heat transfer coefficient was calculated as a ratio between the heat flux and the temperature difference (between the saturation temperature at the TPCT and wall surface temperature) using Equation (6):
h e v a p _ e x = q T s u r T s a t
The total value of the thermal resistance was calculated using Equation (7):
R = T e v a p T c Q ˙ e
The filling ratio in the installation (which is defined as a ratio of the volume occupied by the medium to the volume of the evaporator) was calculated as follows:
F R = V f V e

4. Experimental Results and Discussion

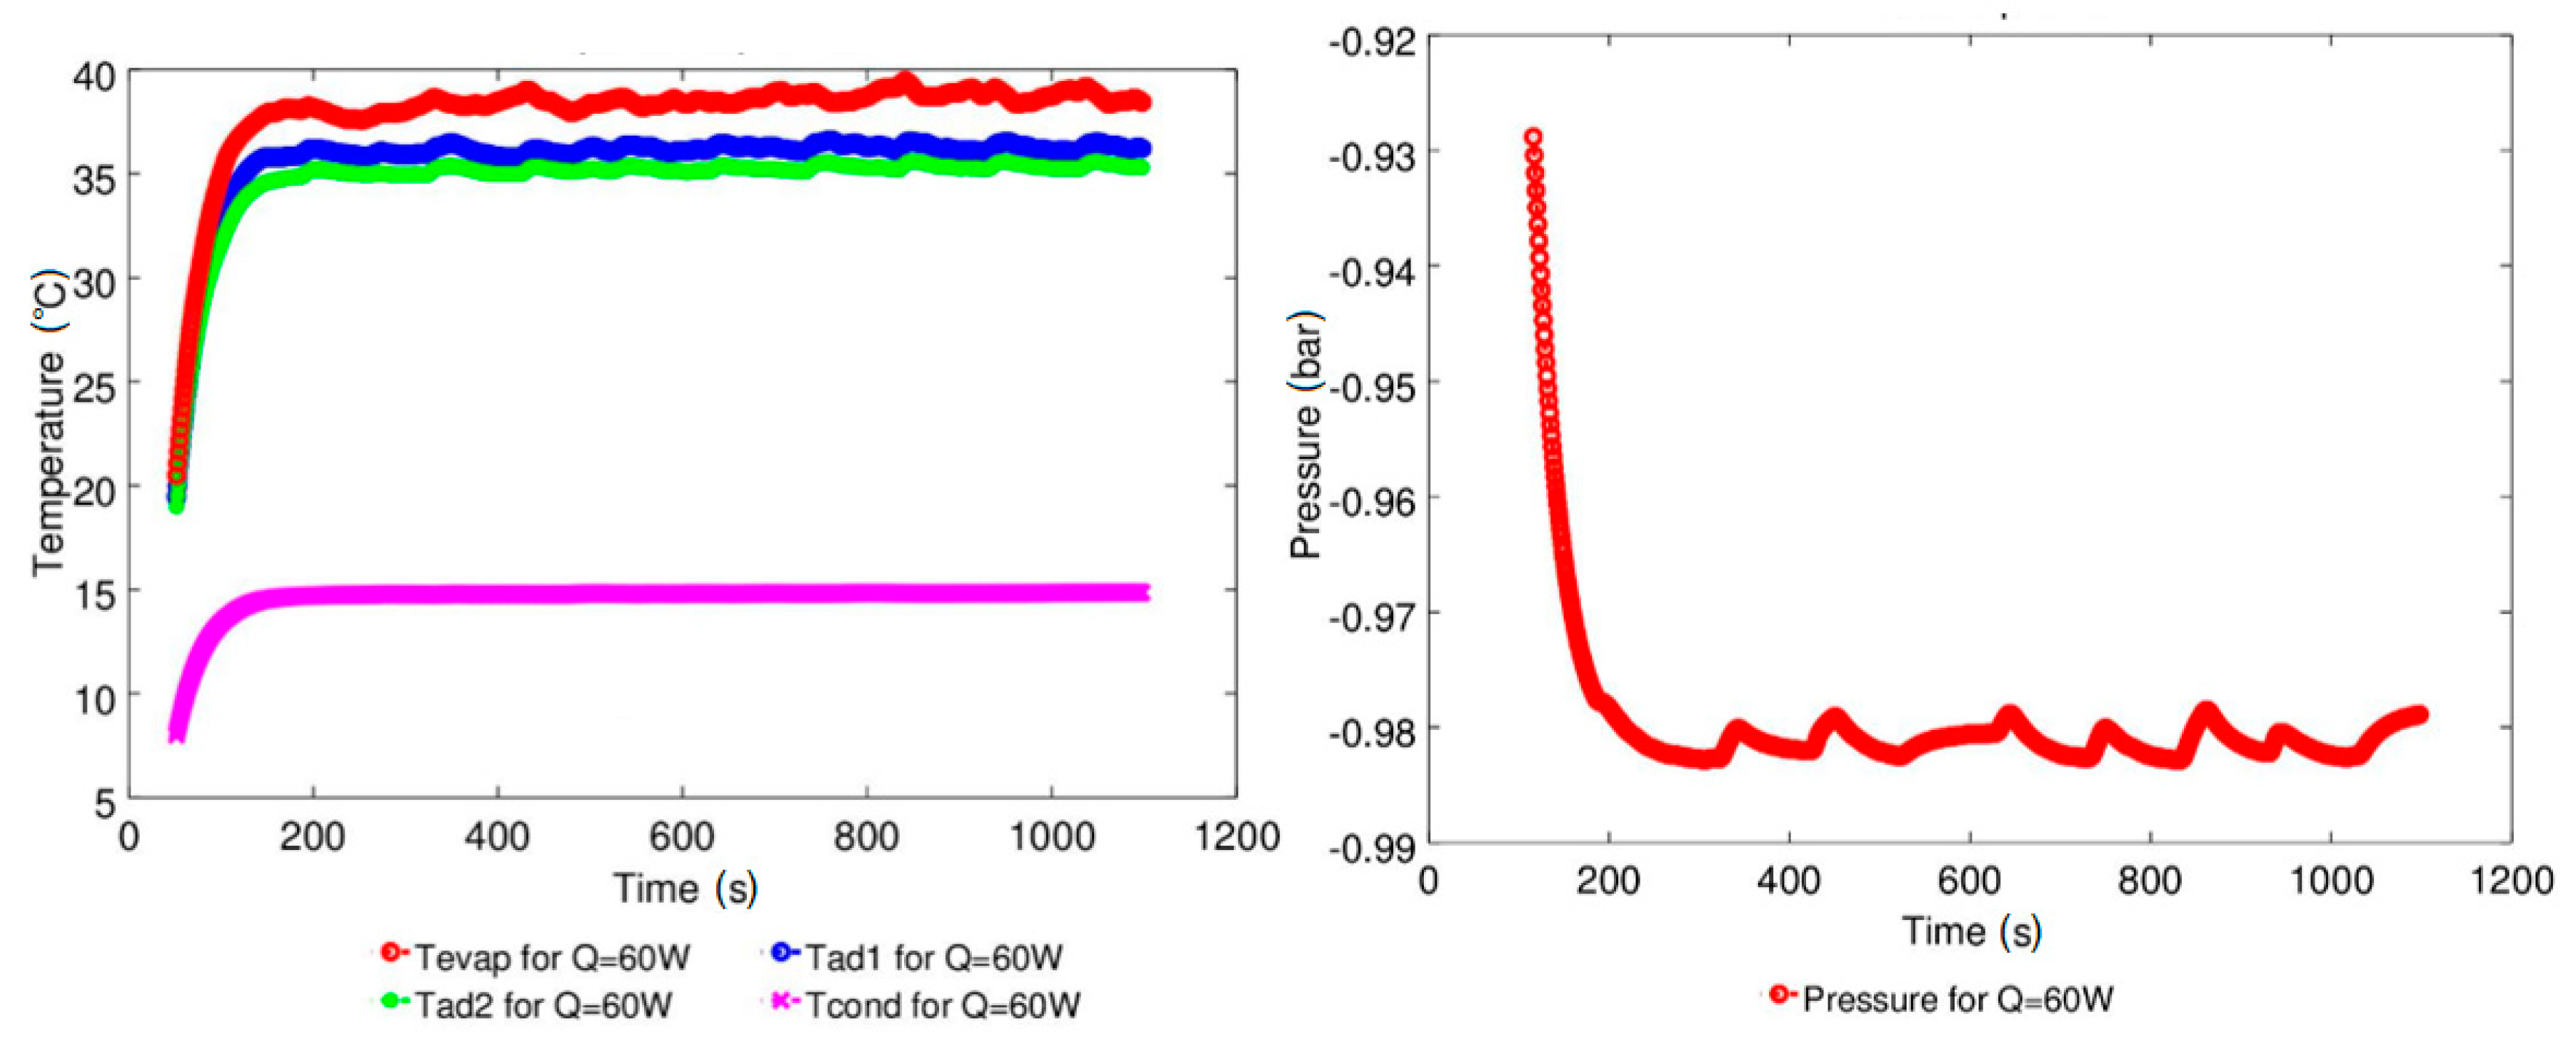
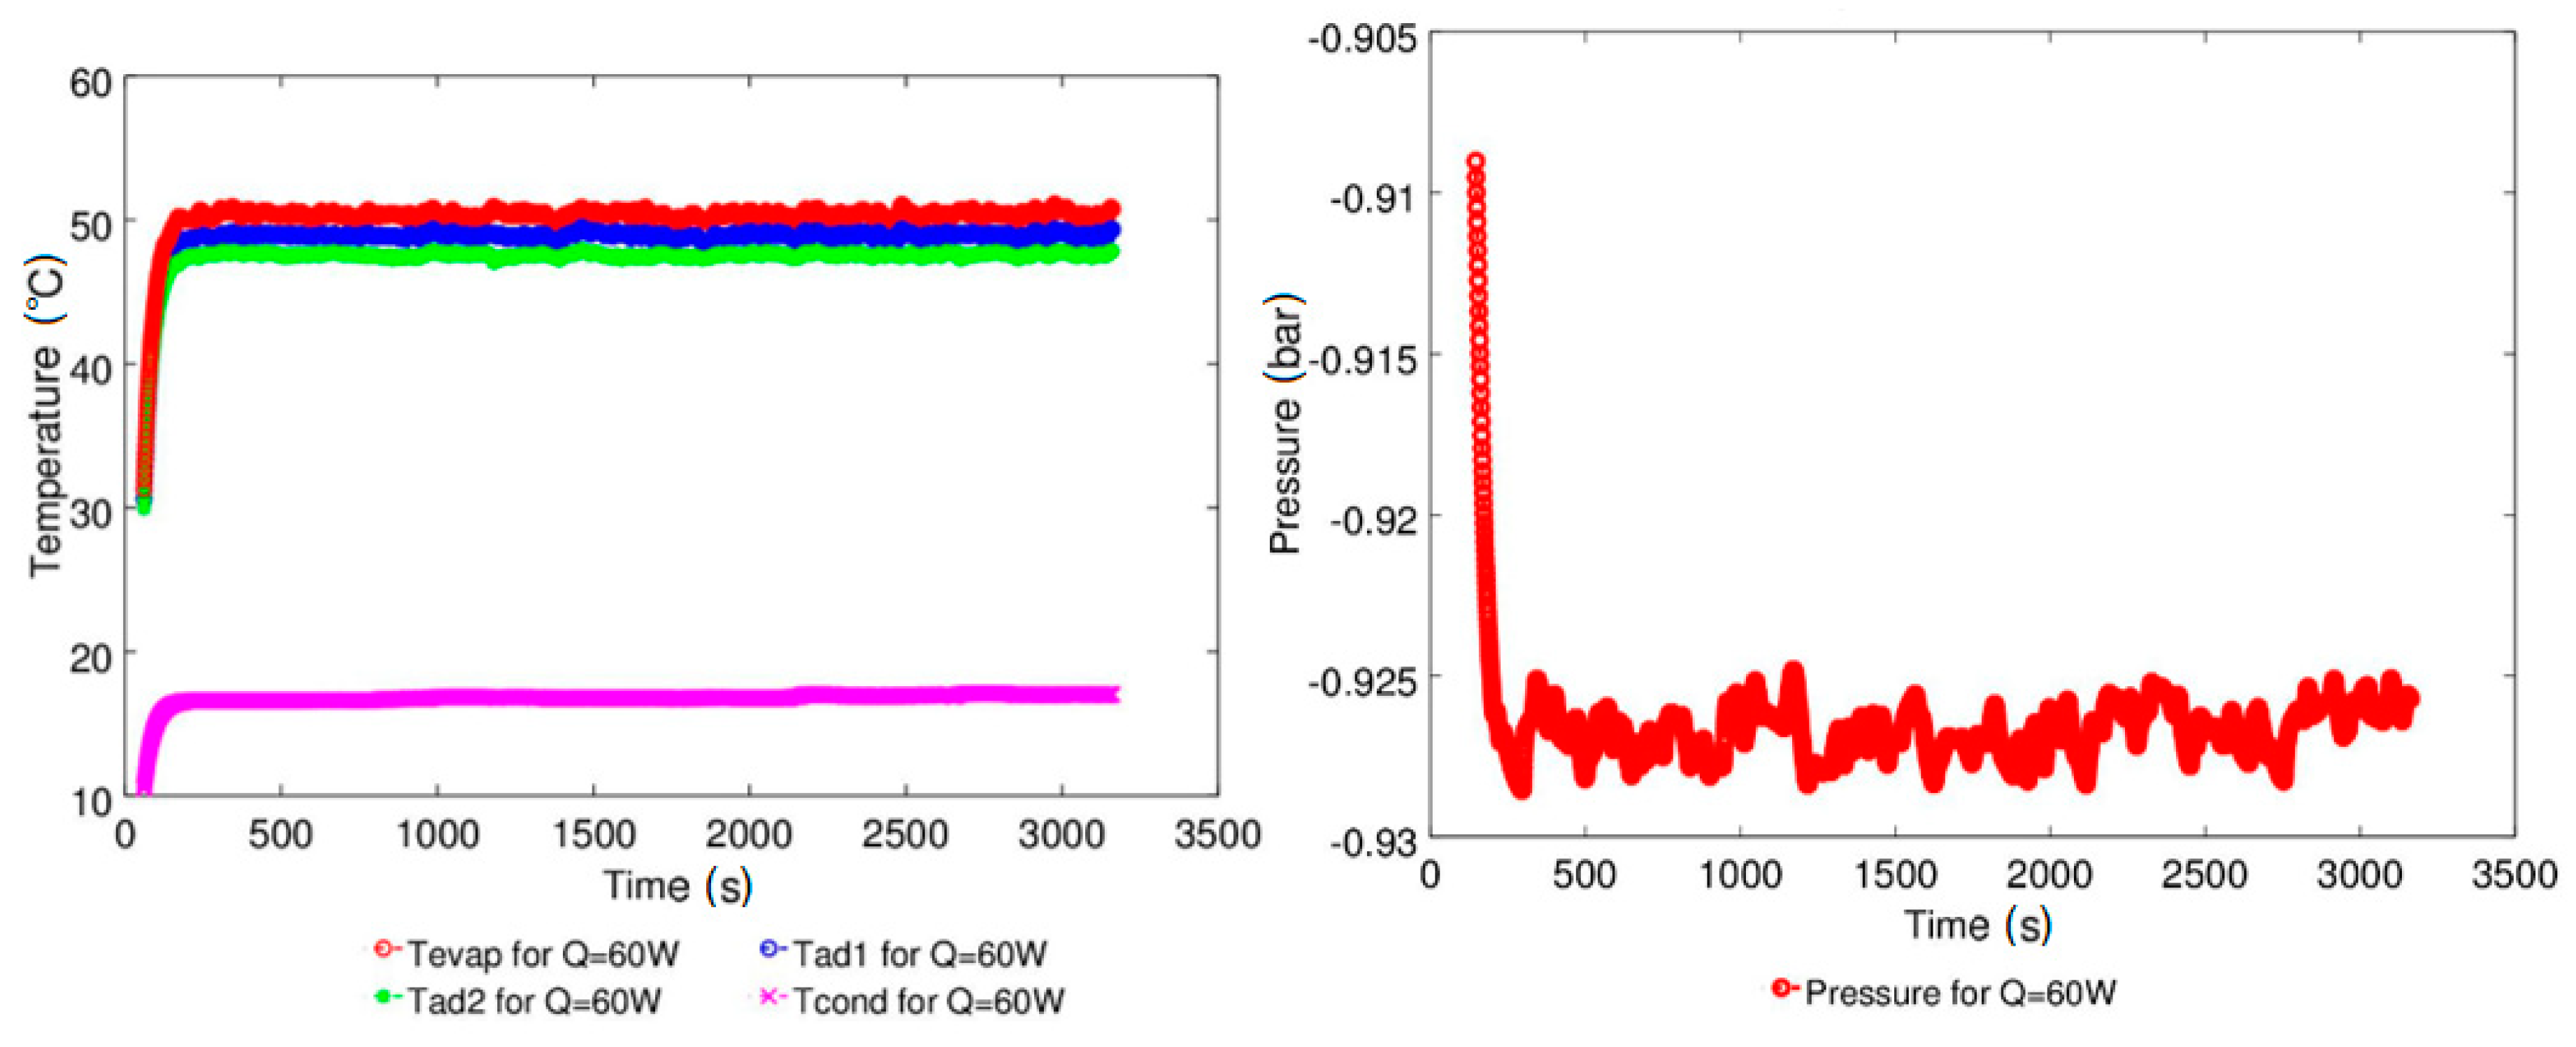
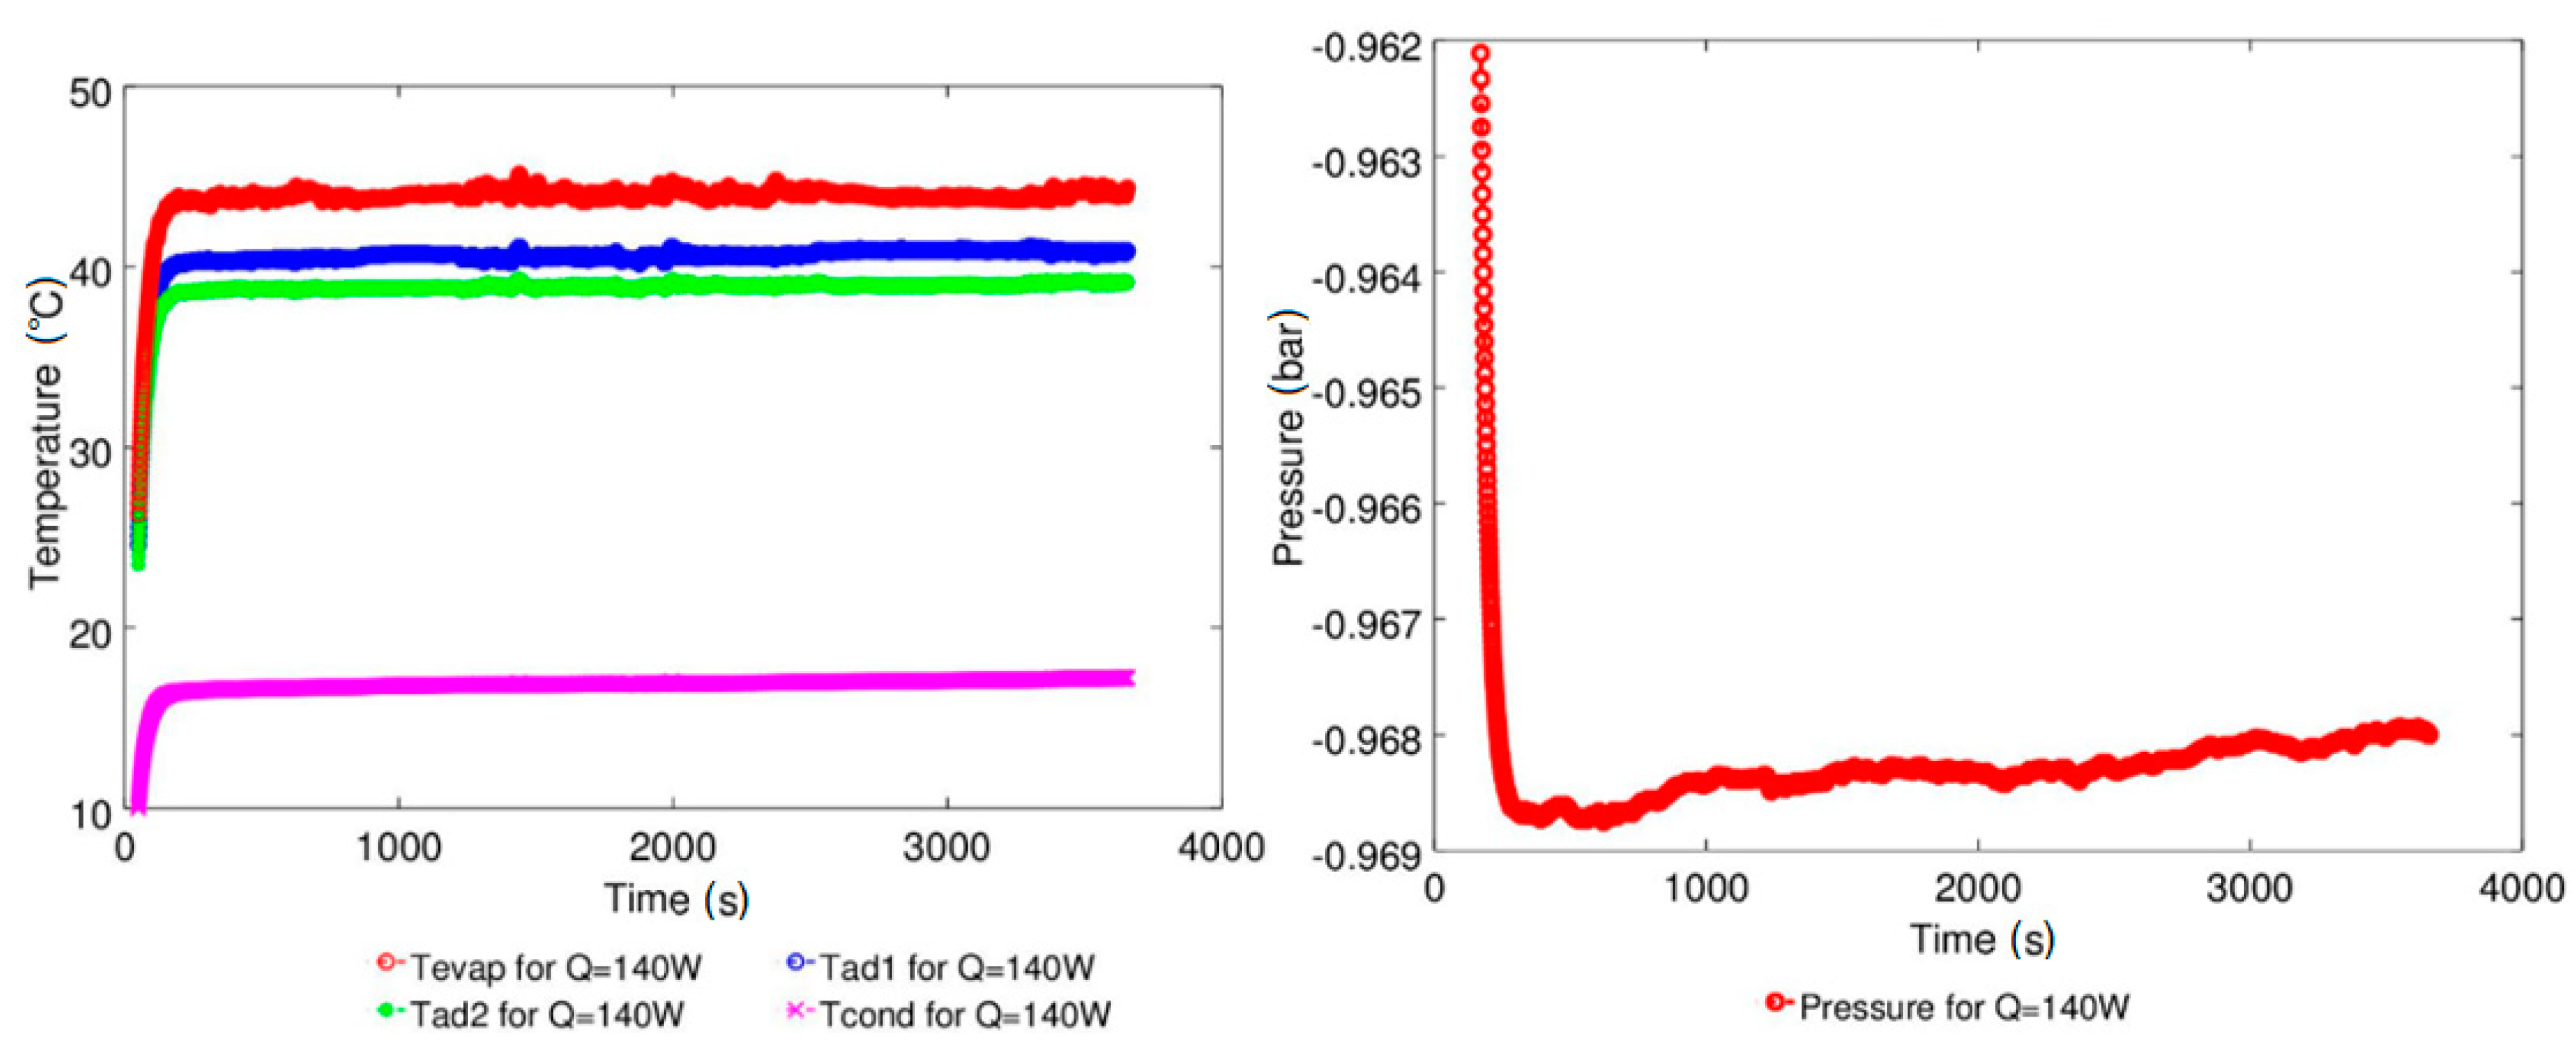
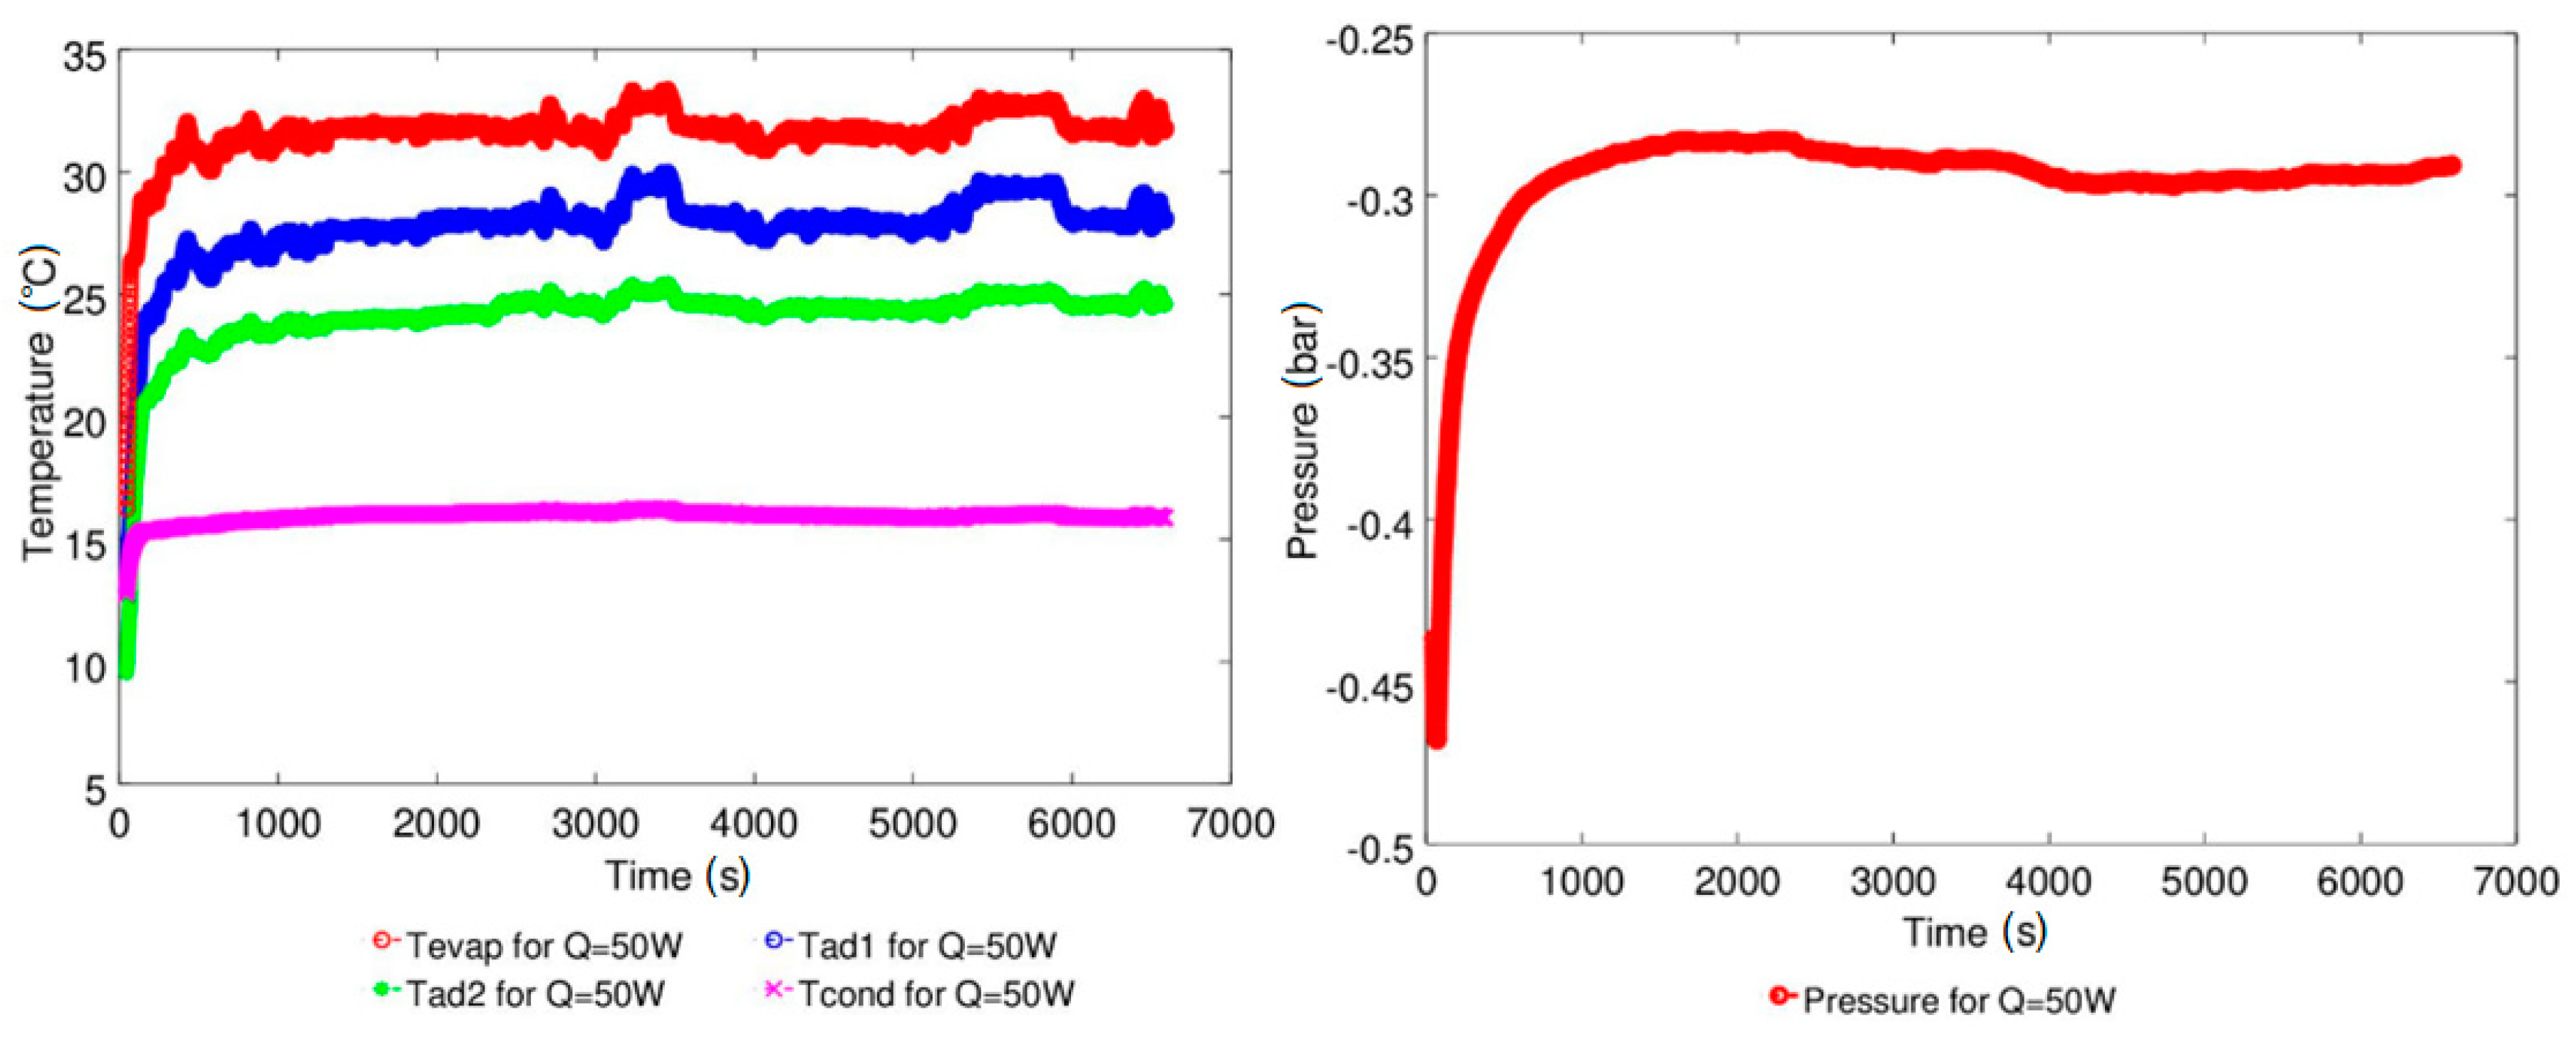
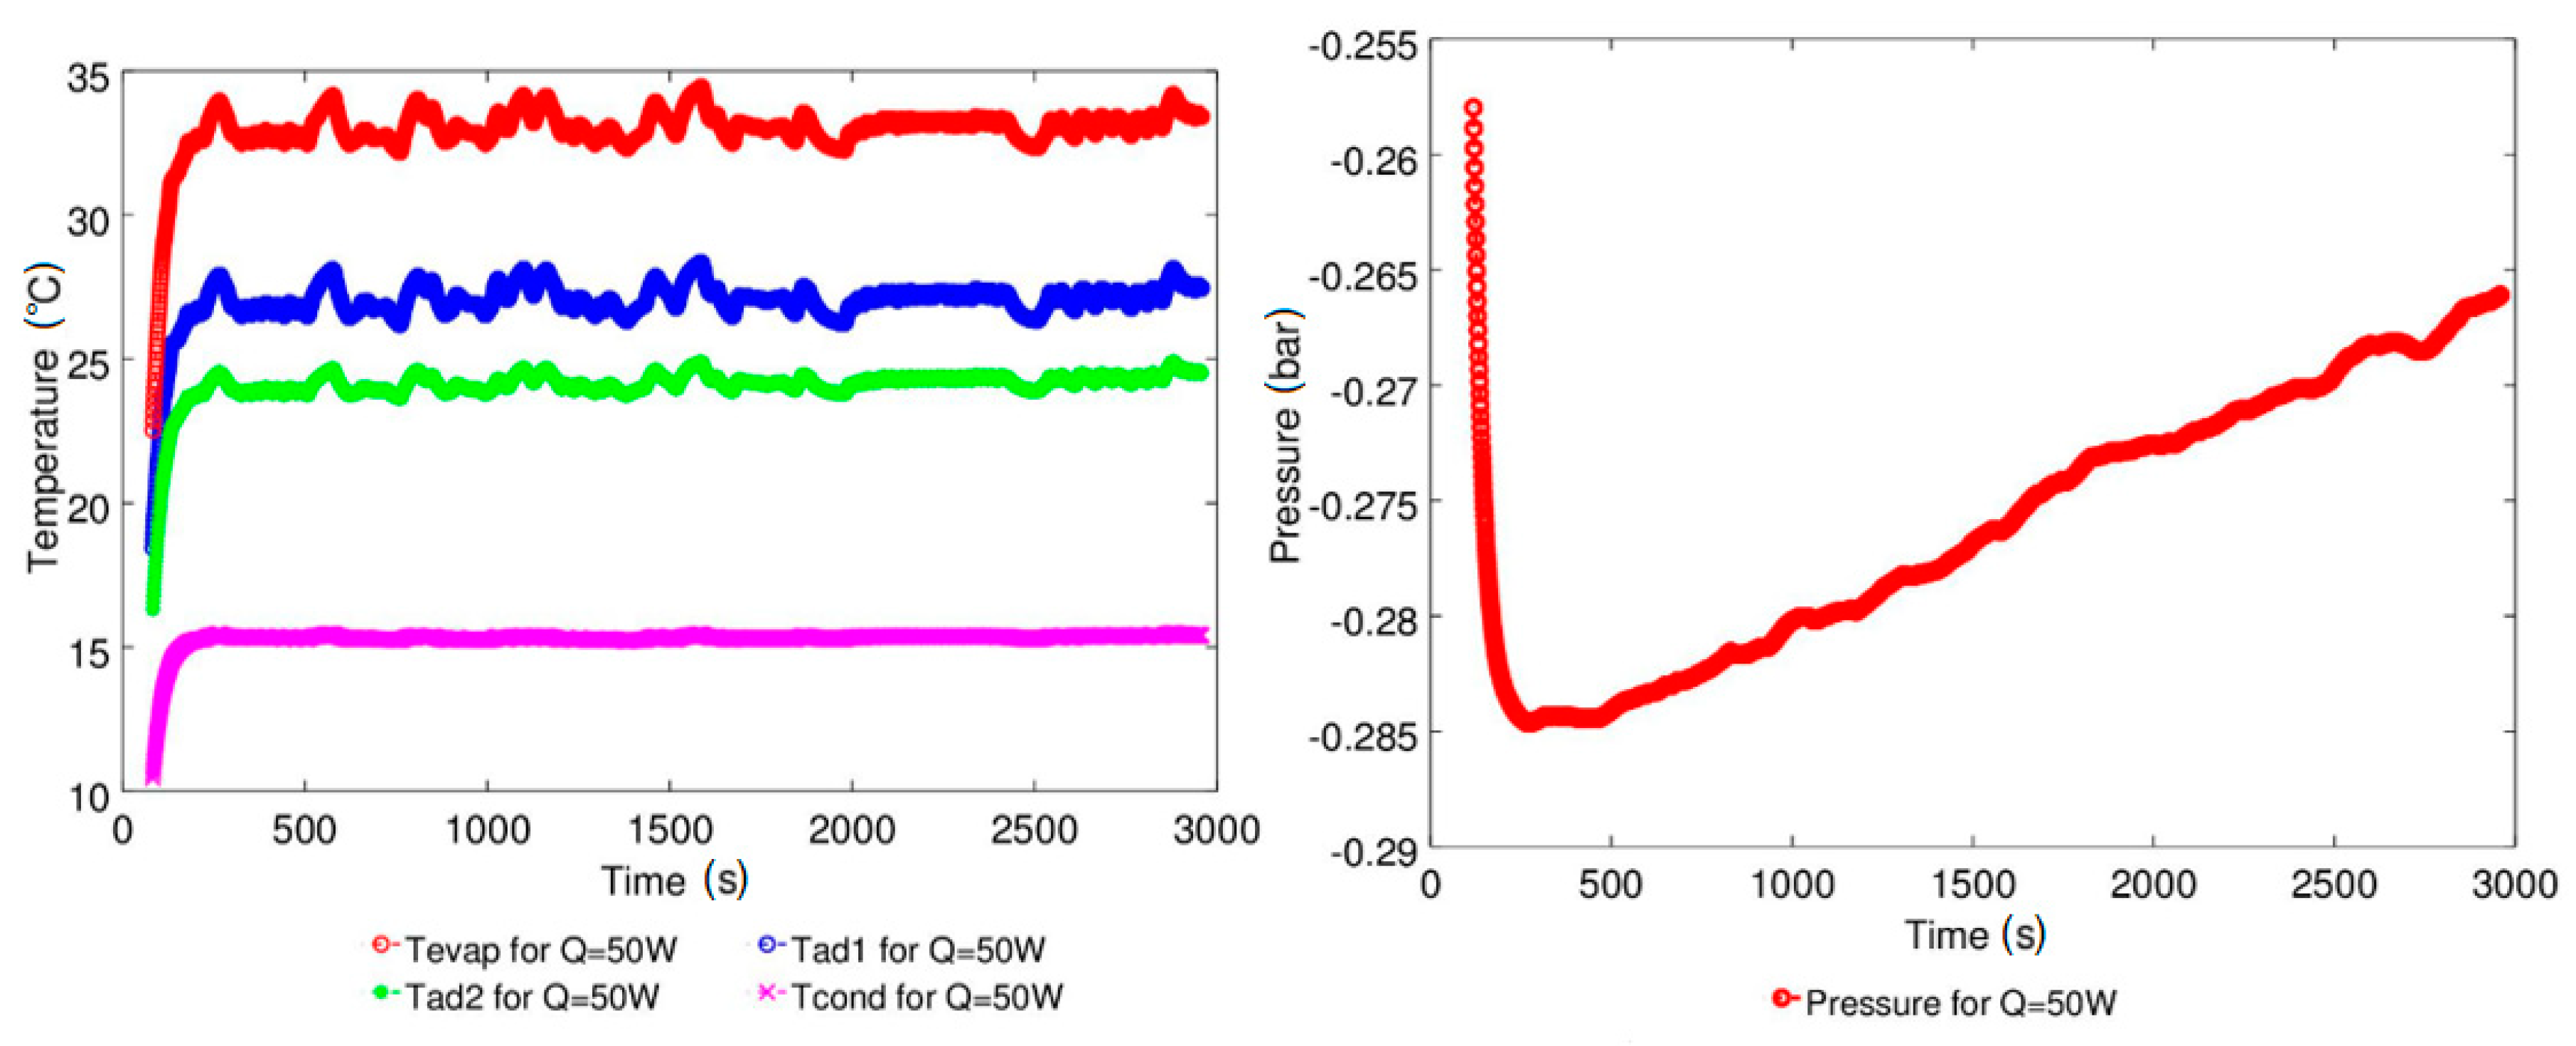
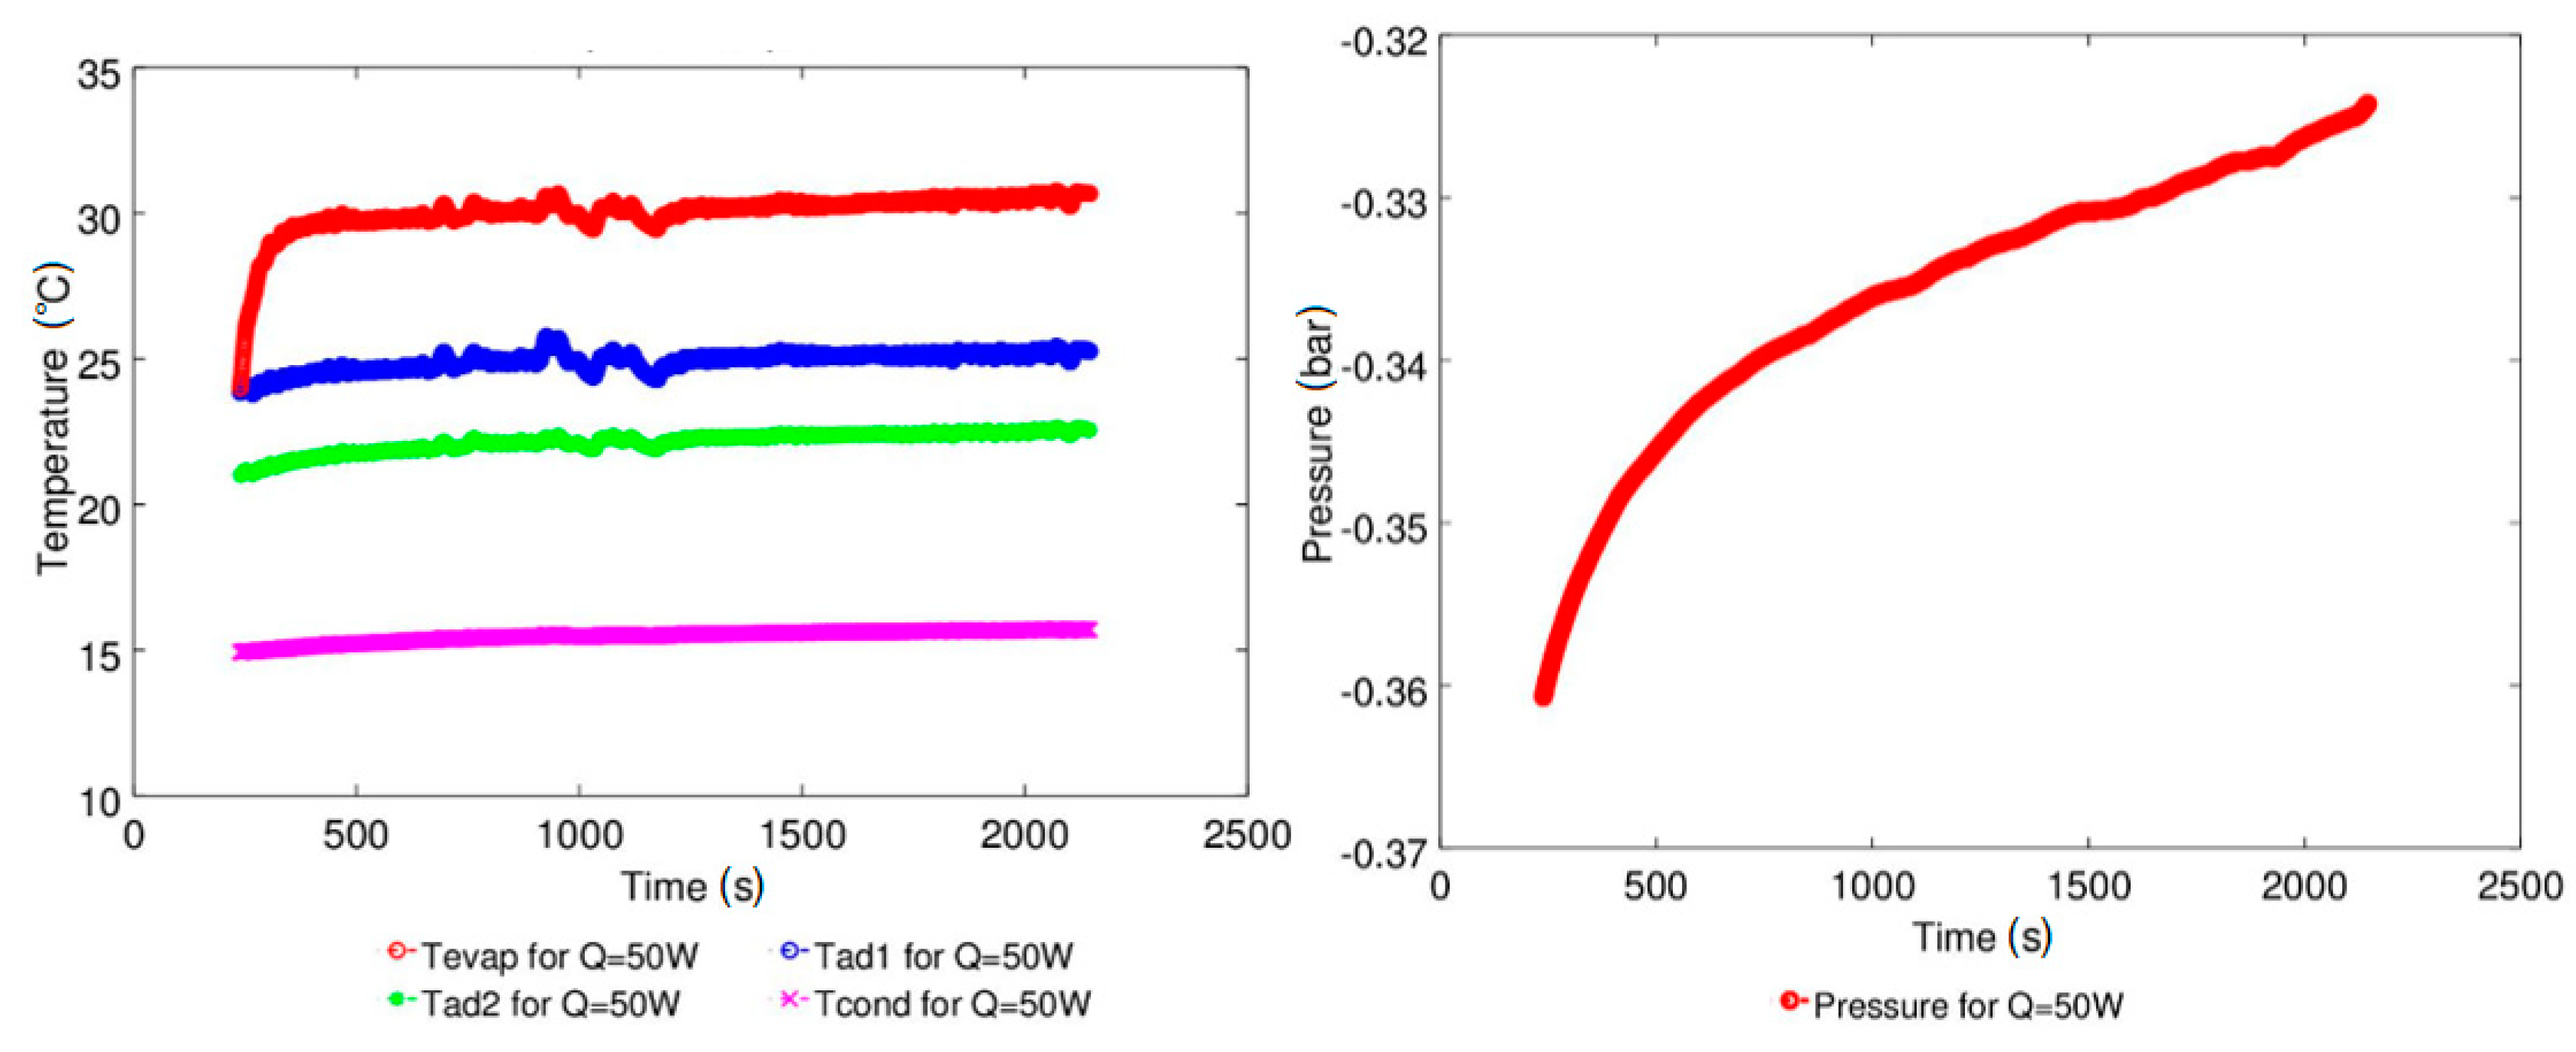
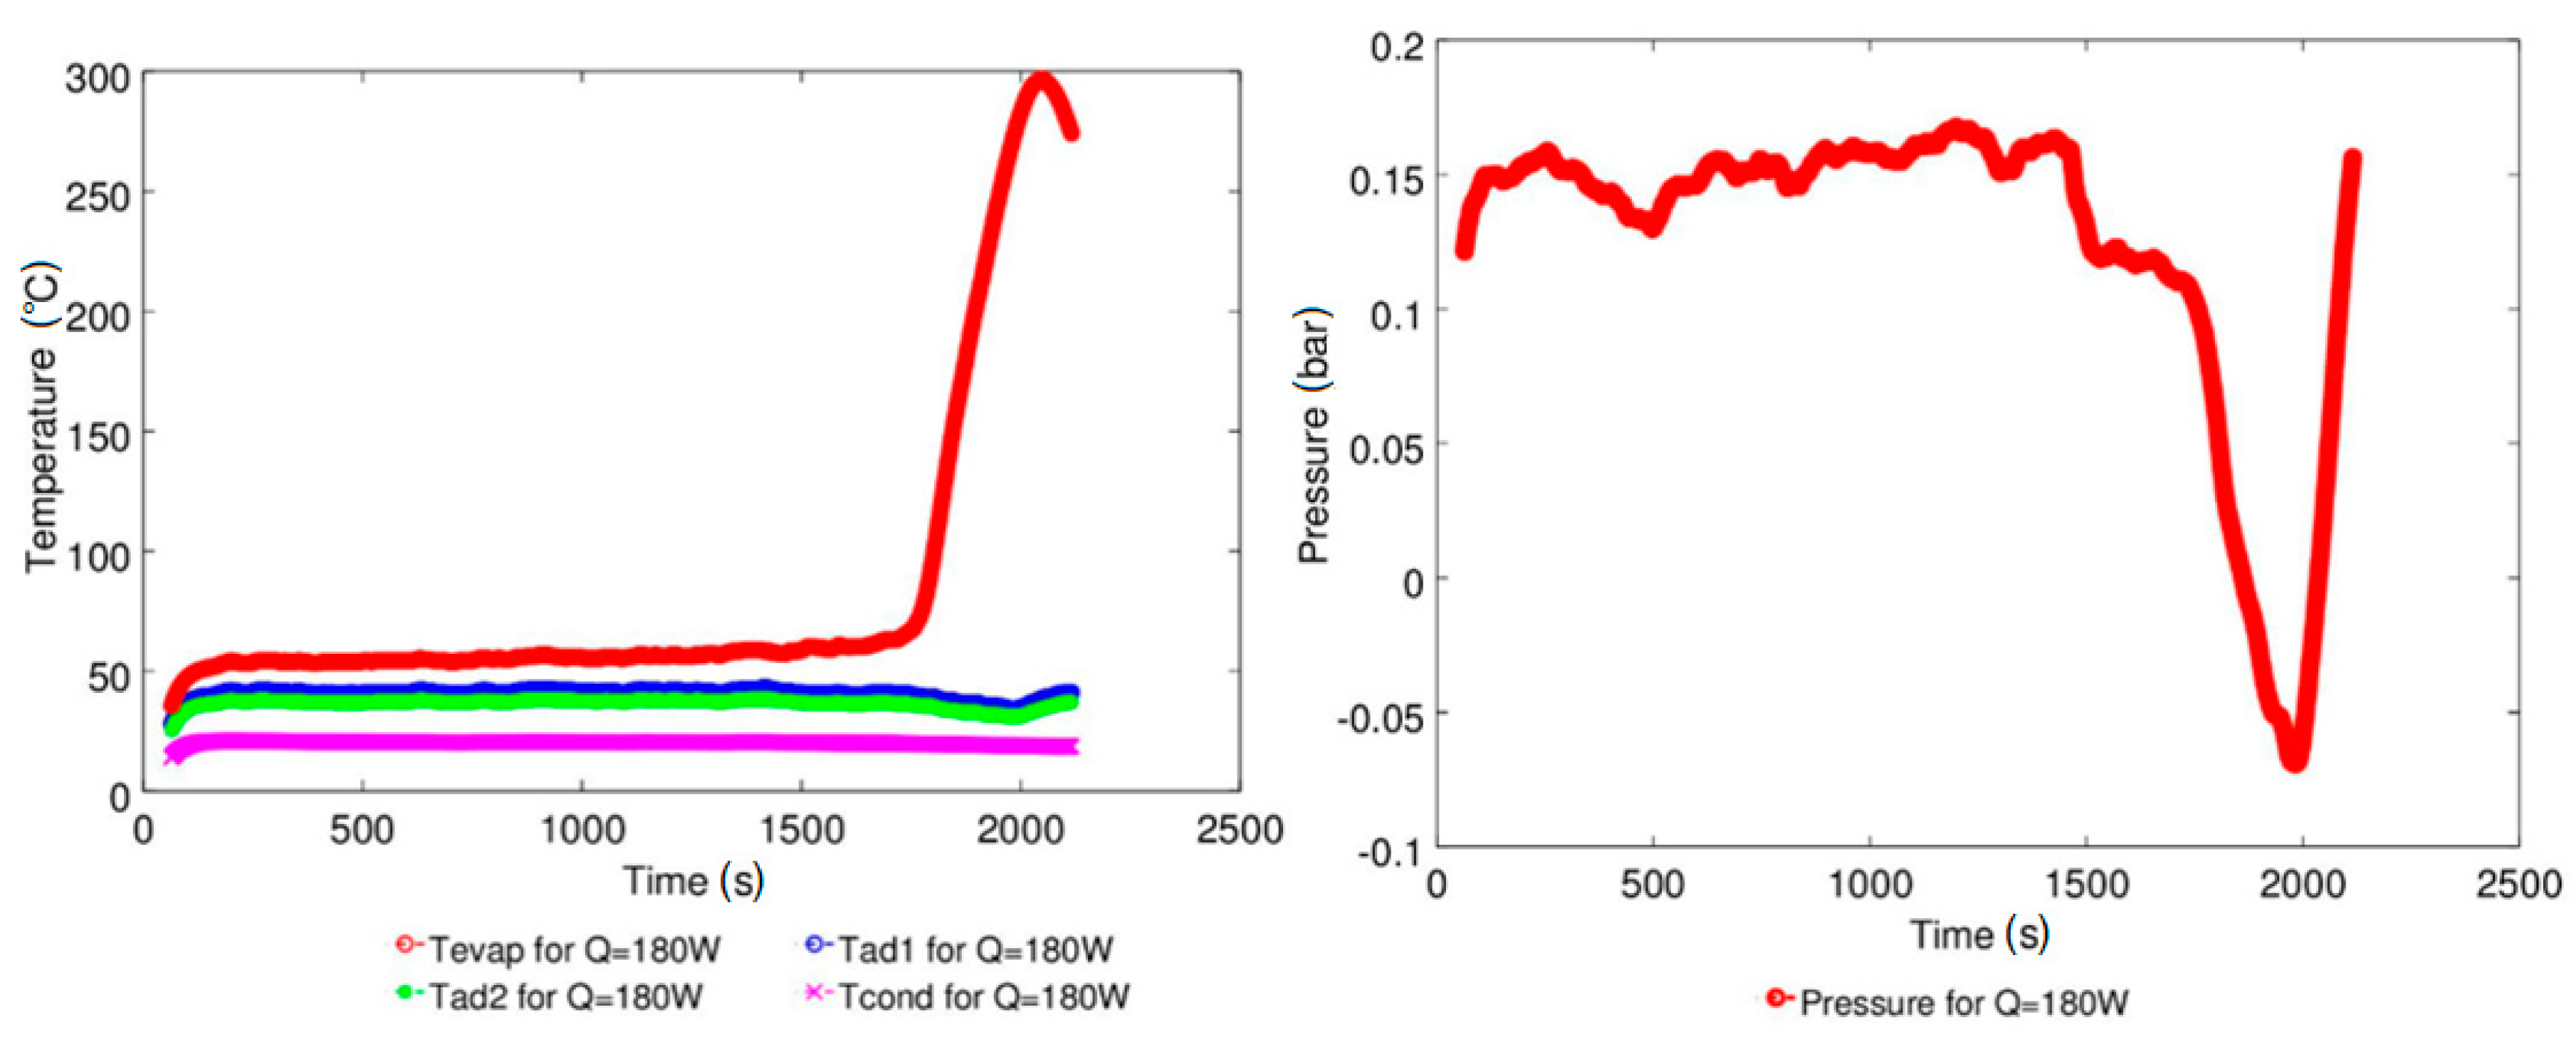
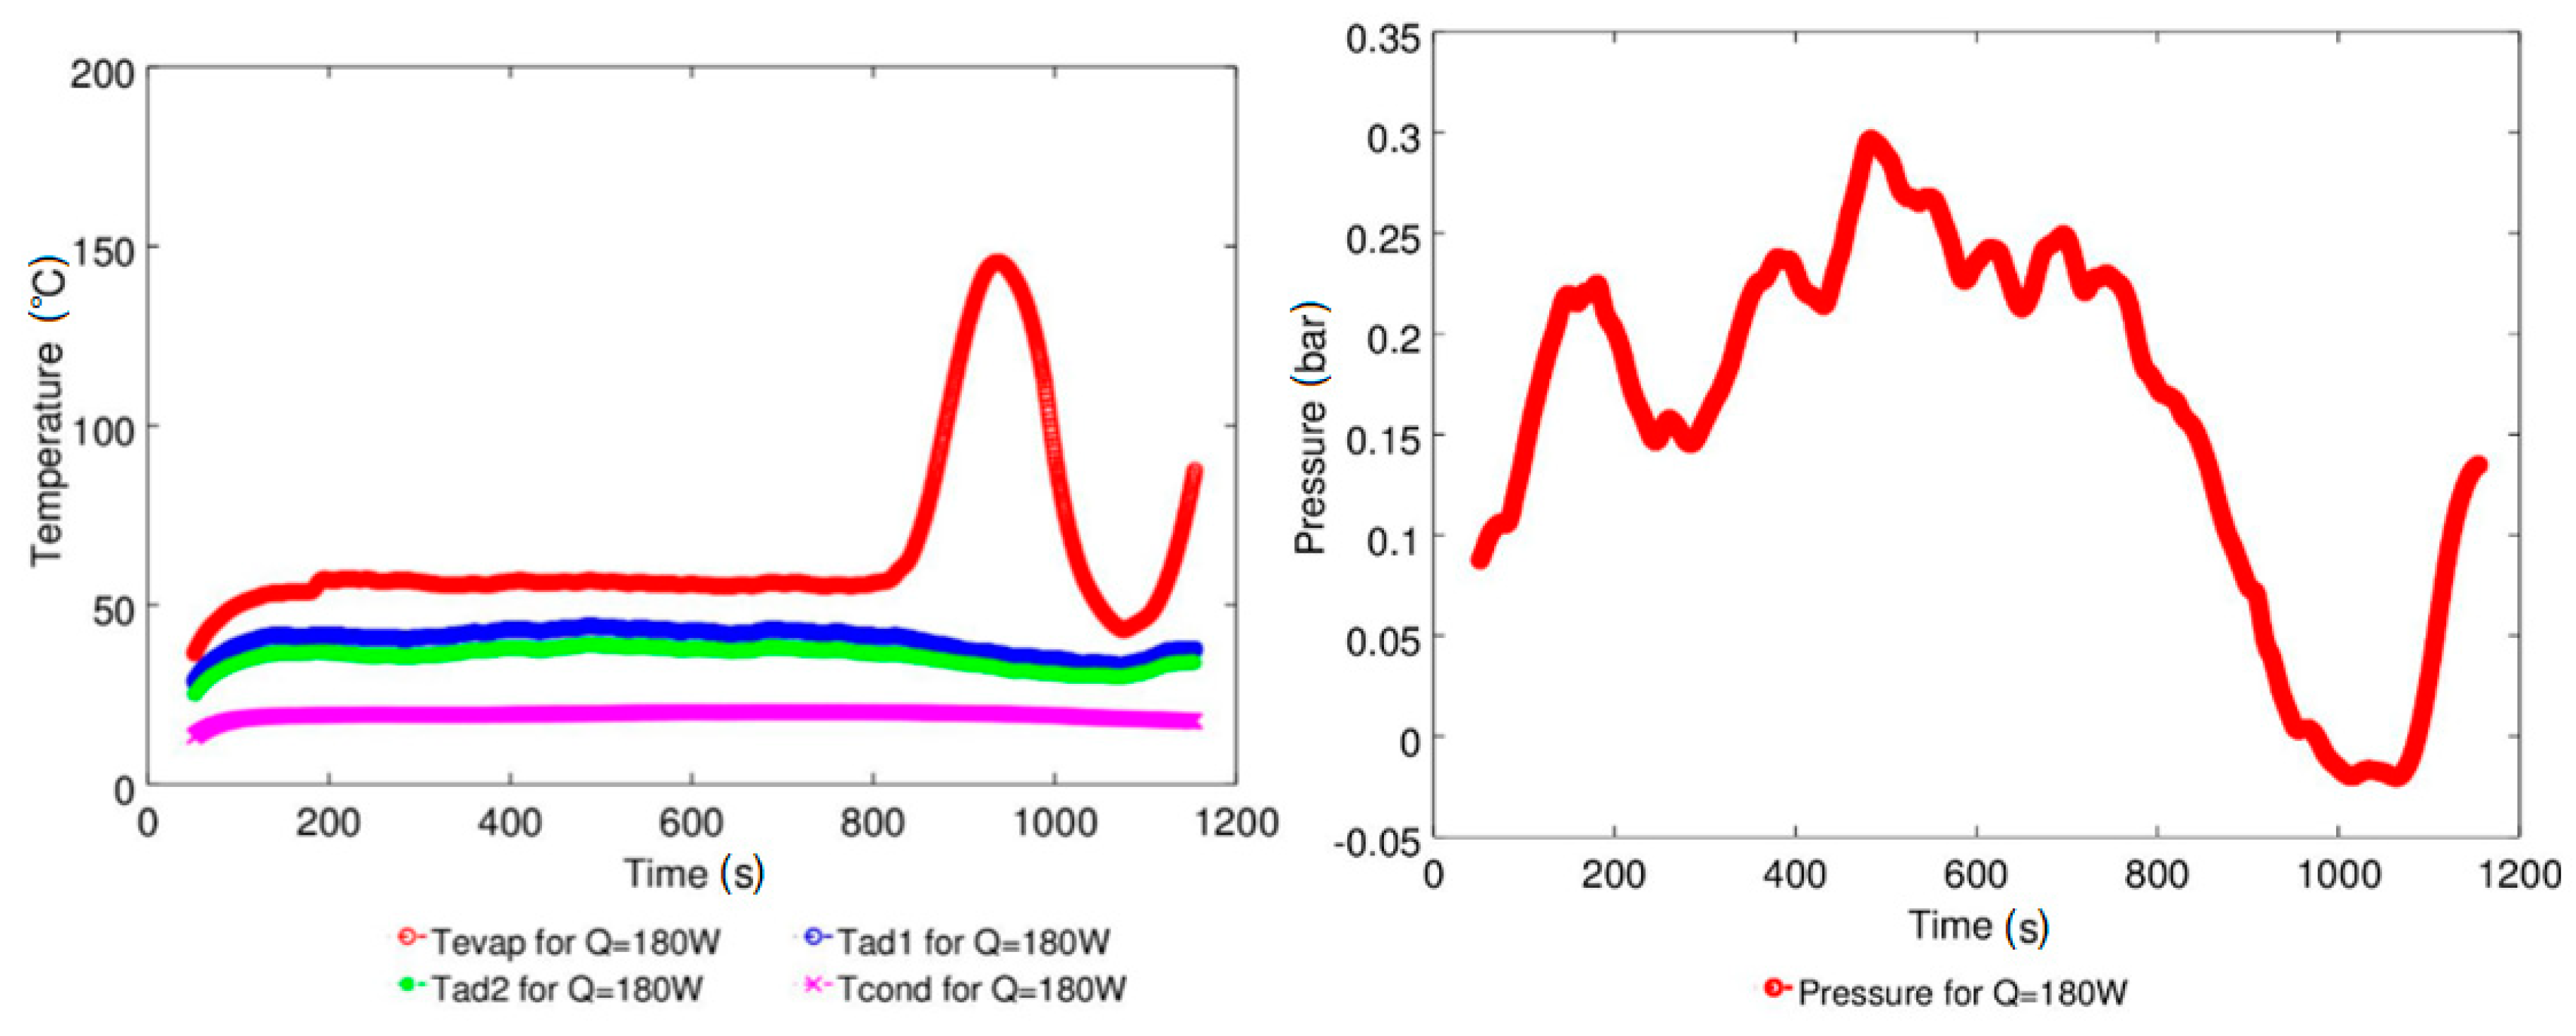
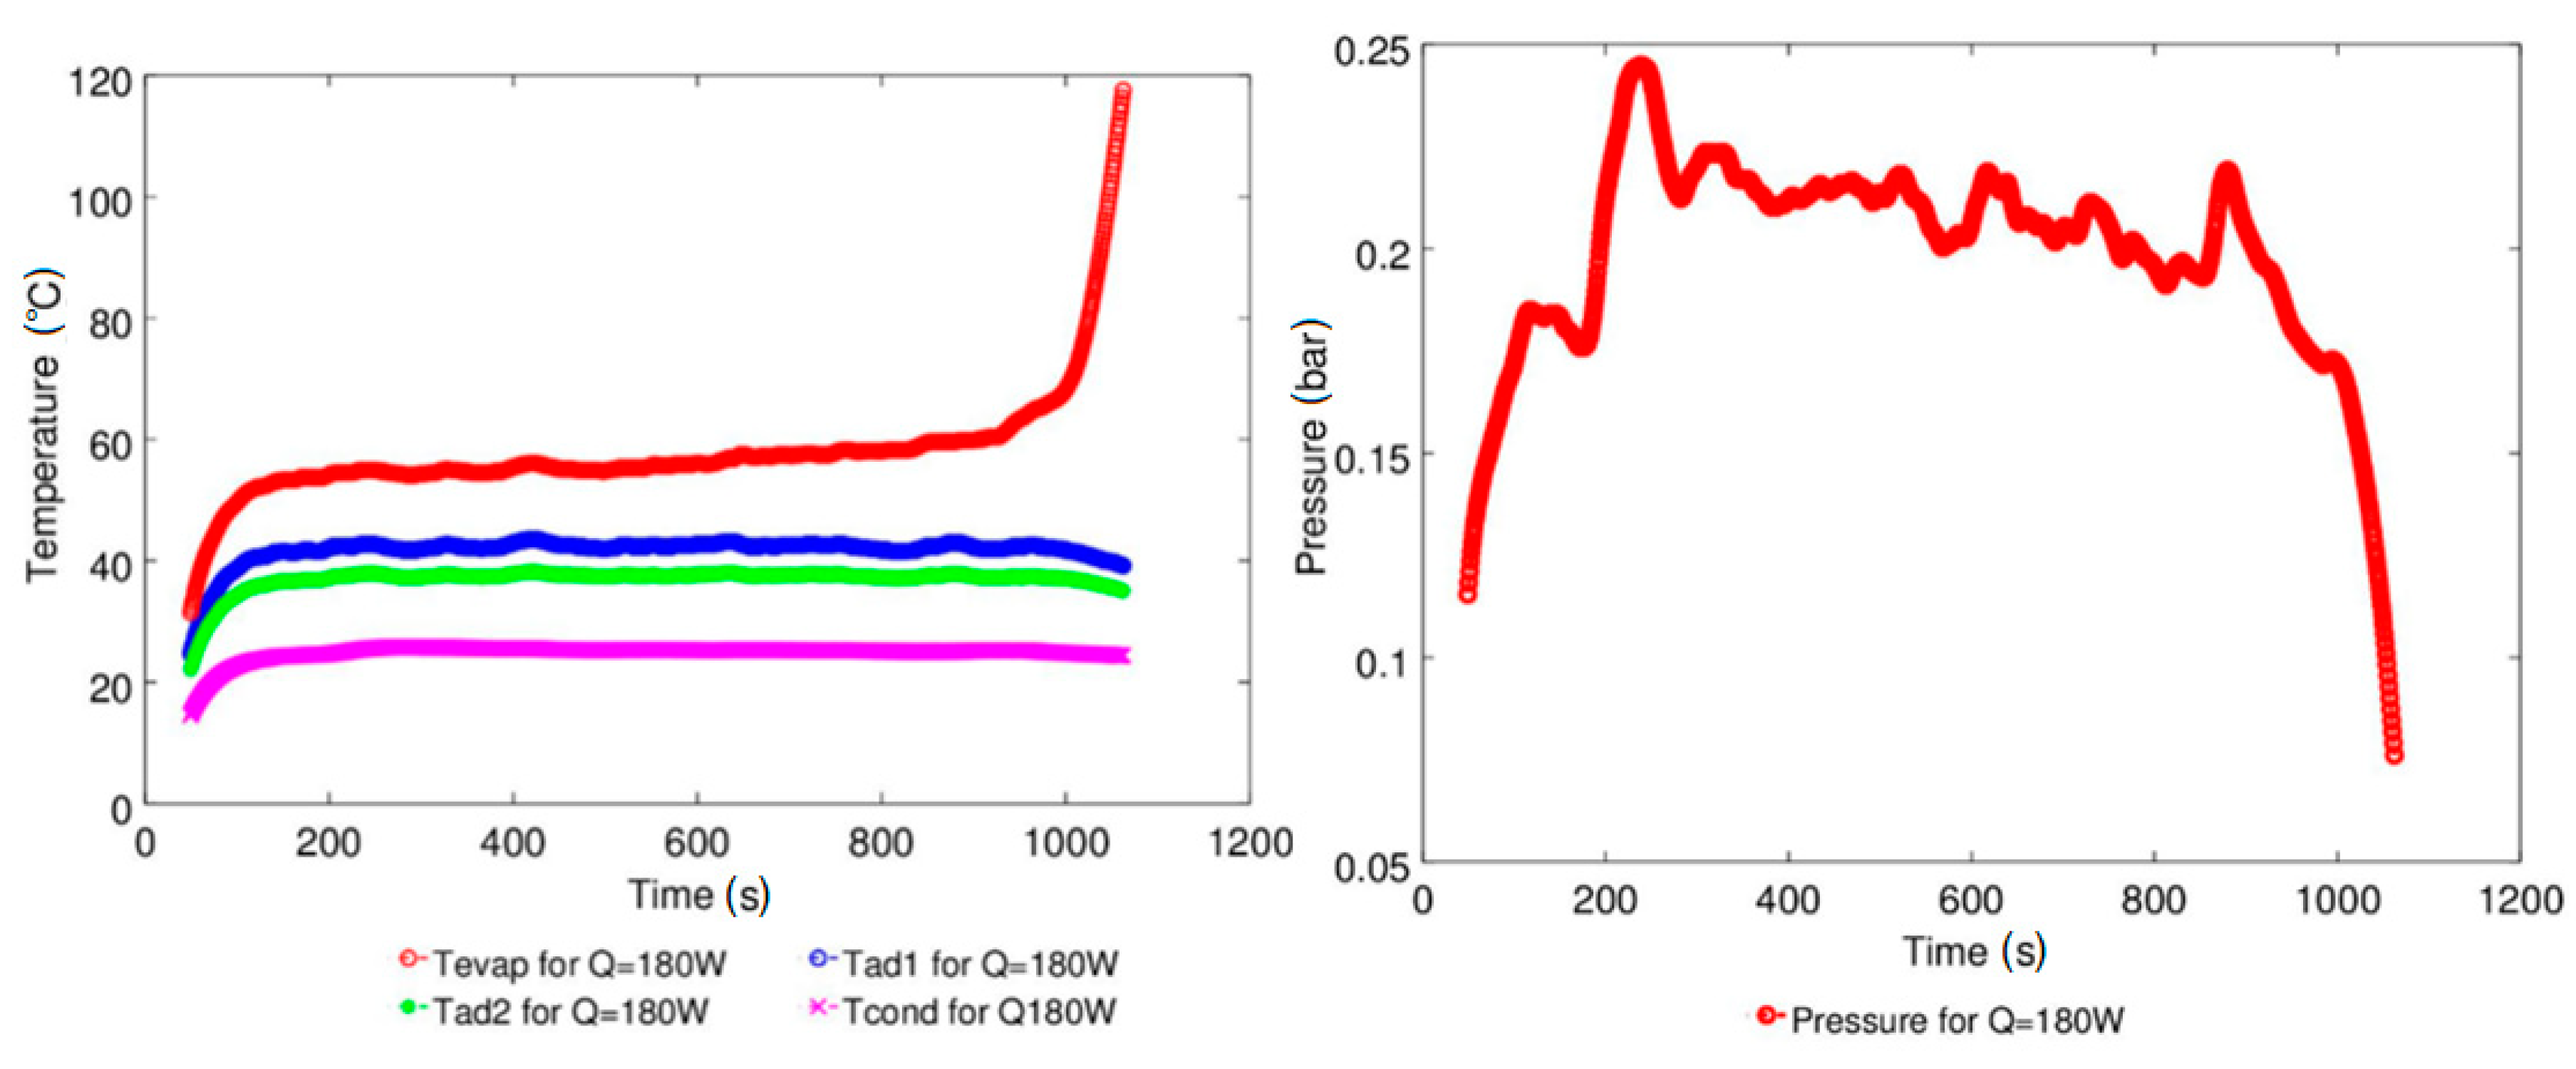
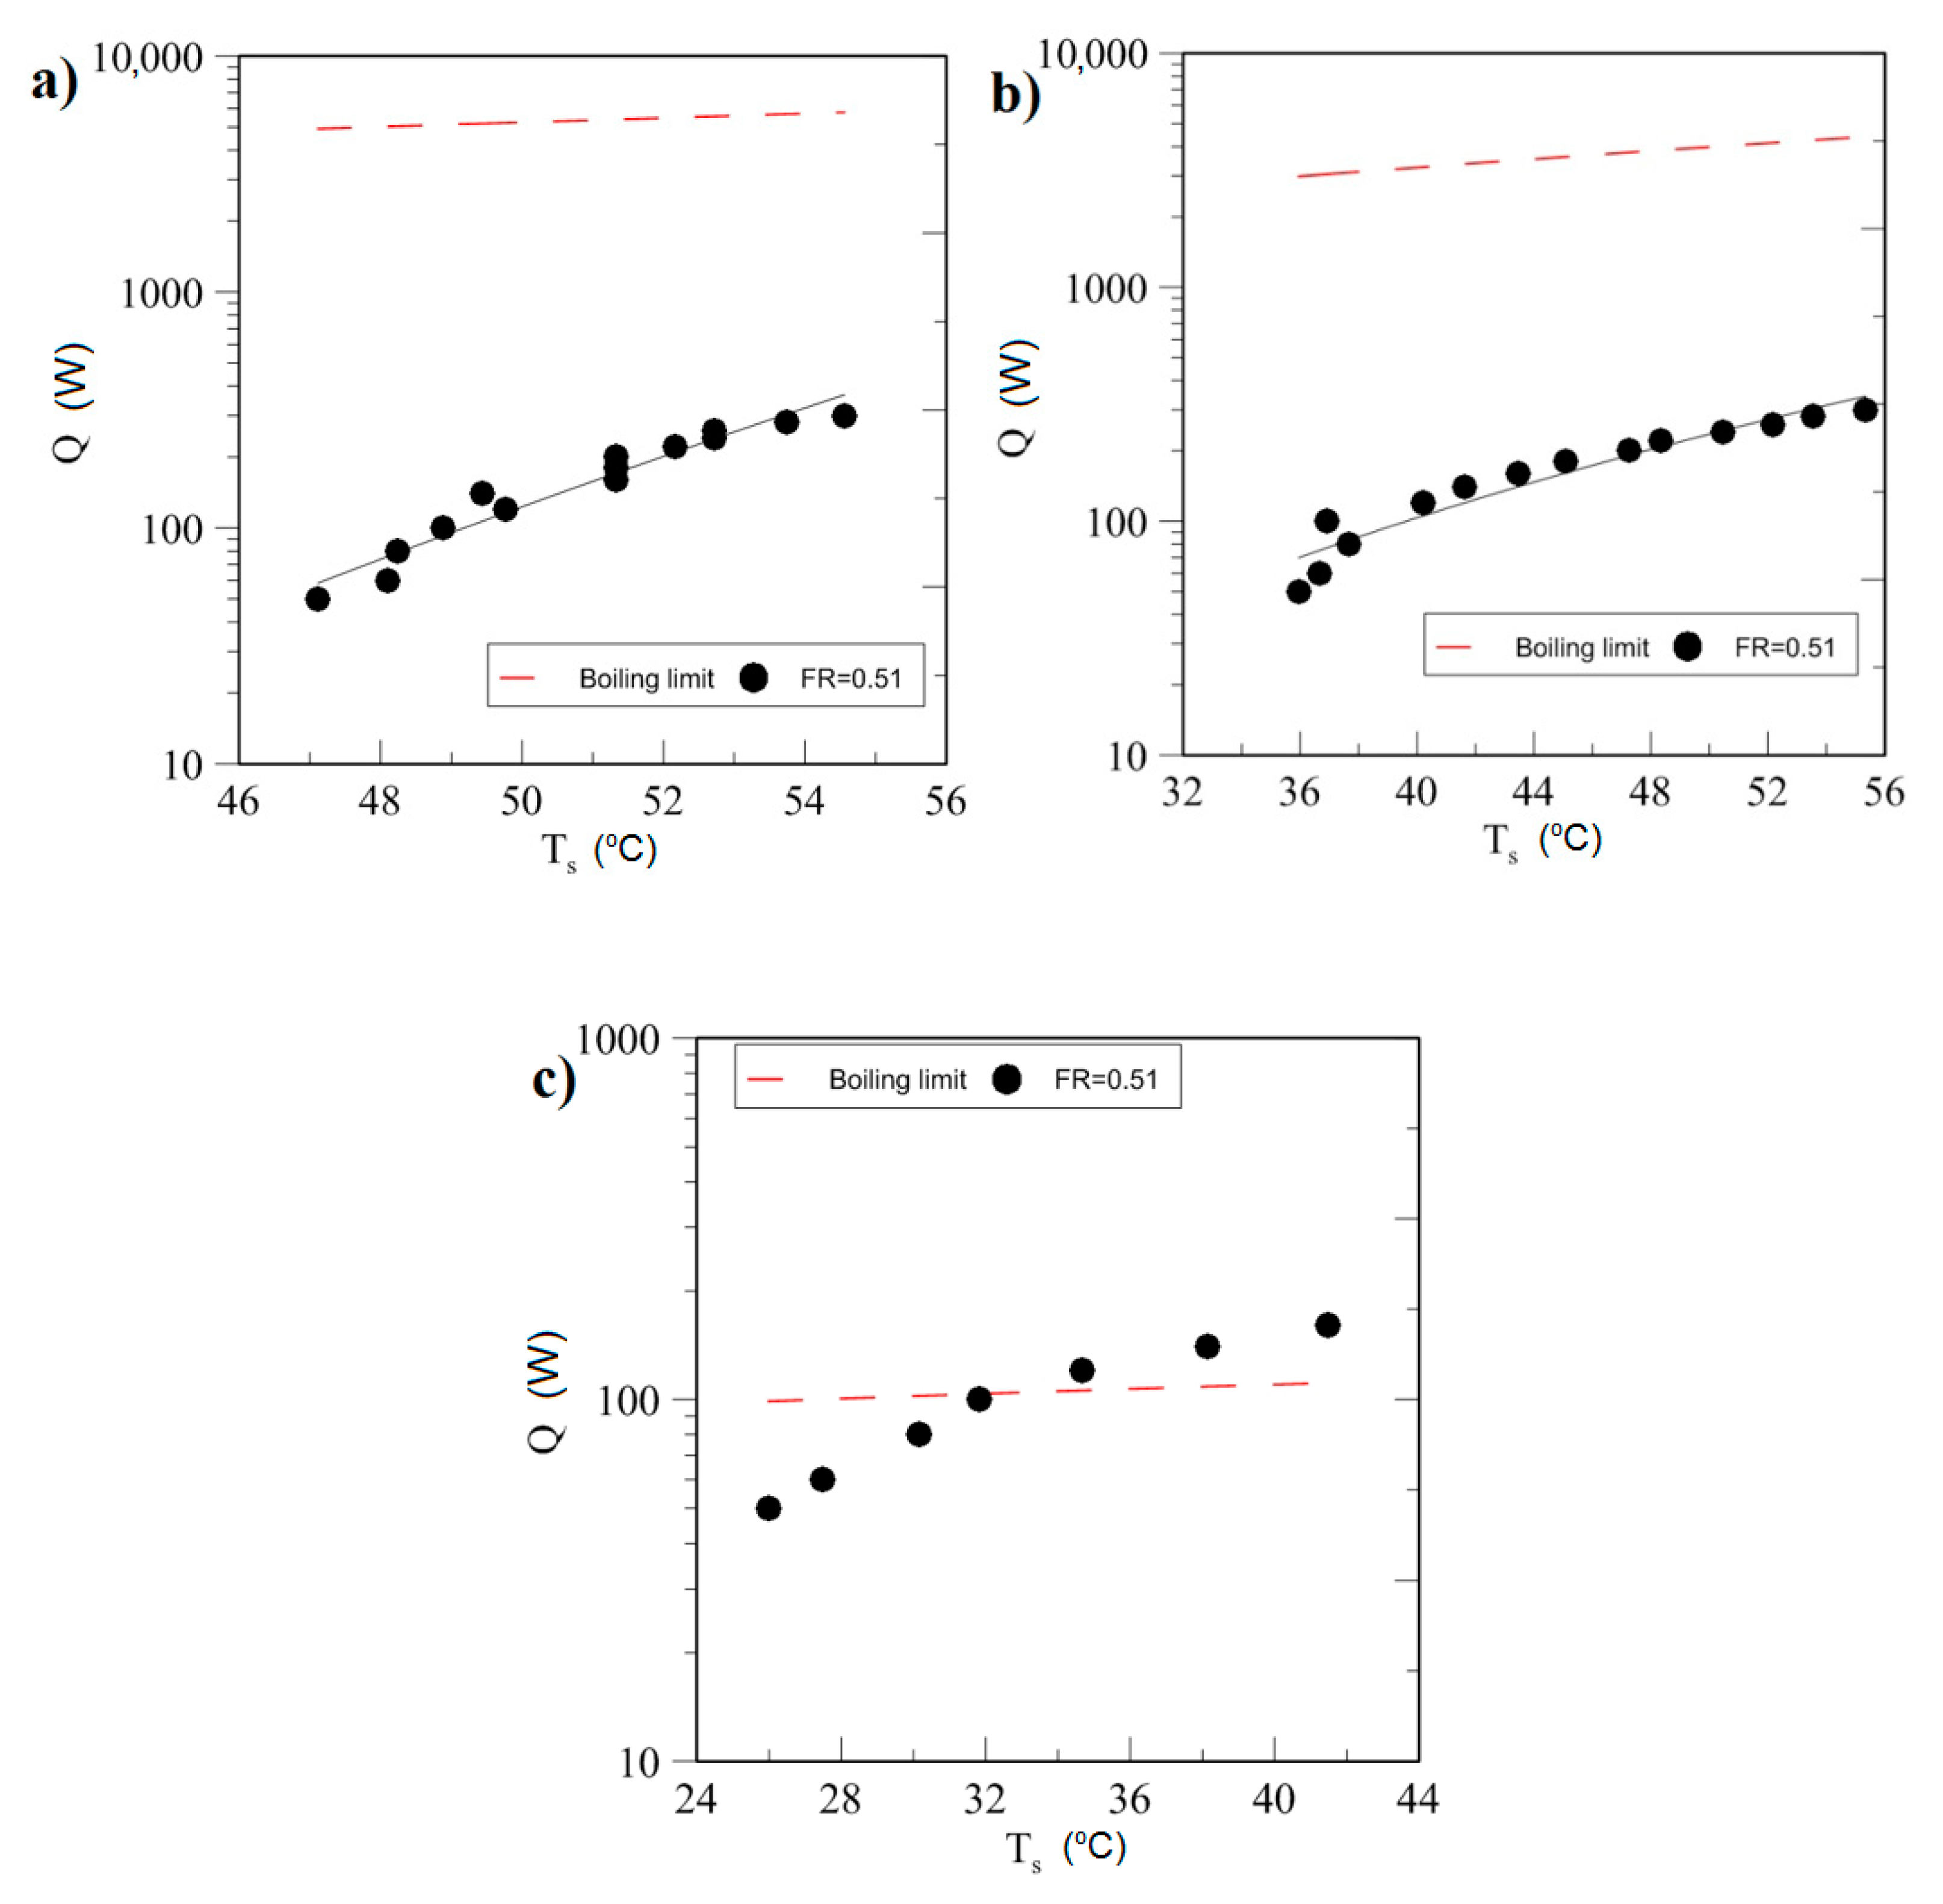
4.1. Effect of Geyser Boiling Influences and Boiling Limit on Operating Parameters

The effect of the combination of different fill ratios, power inputs, and working fluids on the performance of TPCTs has been investigated experimentally. For a thermosyphon filled with water, two fill ratios (0.32 and 0.51) at heat inputs from 50 W to 300 W were considered. In the author’s opinion, it is important to show the variation of surface temperature along the wickless heat pipe as a function of time. This is because it is helpful to analyze influences of oscillation effects in TPTCs. Selected data for water is presented in Figure 6, Figure 7, Figure 8 and Figure 9. Analysis of the data shows that no geyser boiling effect occurred. The average time to reach steady state conditions was normally no longer than 1000 s (≈16.5 min). Also, a typical start-up effect caused by heat conduction towards the liquid pool was observed [24]. At the beginning, TPCT operated in a conduction mode (no two-phase transport occurs). The temperature in the evaporation section increased until reaching the saturation level and then the evaporation process started. The start-up time was normally a function of thermal capacity of working fluid. The experimental results for FRs 0.32 and 0.51 were obtained for typical temperature wickless heat pipe patterns, namely overshoot, zigzag, and stable phenomena [25].
For a TPCT filled with ethanol, three FRs (0.32, 0.51, and 1.0) in the range of heat input from 50 W to 300 W were studied. Selected data for ethanol is presented in Figure 10, Figure 11, Figure 12, Figure 13 and Figure 14. It should be emphasized that the geyser effect was observed for FR equal to 1.0. For that experimental condition, the investigation procedure was repeated twice for different water cooling temperatures (see Figure 13 and Figure 14). The experimental results showed that the thermosyphon was stable for lower cooling water temperatures. It was observed that for larger values of the heat power, the temperature and pressure oscillations decreased and the geyser effect disappeared (compare results in Figure 12 with results in Figure 13). This could be explained by the fact that a larger heat flux at the evaporation section activated more nucleation sites. Furthermore, this caused an increase in the number of growing bubbles in the evaporation section and prevented against the growing of huge bubbles. The geyser effect is a function of temperature and pressure oscillations, as well as combination of working parameters such as heat flux and cooling water temperature. As can be observed in Figure 14, the geyser effect may occur even at a low value of heat flux. Generally, this effect consists of four phases: overheating of the fluid in the evaporation section; rapid growth of big bubbles of vapor; expansion of vapor bubbles together with the liquid phase of fluid, which has been gathered above vapor; and the falling down of the liquid back to the evaporation section. If the fluid is superheated enough, the each subsequent cycle is initiated [26,27,28].
The experimental results for filling ratios 0.32 and 0.51 were obtained for typical wickless heat pipe patterns, namely overshoot, zigzag, and stable phenomena. A start-up effect has been also observed and obtained for typical temperature wickless heat pipe patterns, namely overshoot, zigzag, and stable phenomena. The overshoot could be clearly seen, e.g., in Figure 8. The temperatures in the evaporation section suddenly decreased by approximately 10 °C. It should also be noted that pressure profile changes were also observed. What is more, after the overshoot, a zigzag effect has been also observed. In this work period, the vapor form in the evaporation section arrived at the condenser. This caused a temperature increase in the condensation section. The latent heat was absorbed via cooling water in the condenser and liquid condensate fell to the adiabatic and evaporation sections due to gravity. After that, the temperature in the evaporation and adiabatic sections significantly decreased. This process repeated until reaching stable conditions in the TPCT. No geyser effect was observed for these conditions. The average time to reached steady state conditions was normally no longer than 1000 s (≈16.5 min). However, for the thermosyphon operated with lager amounts of ethanol (FR = 1.0), this period was two times longer (above 2000 s). This could be explained by the greater thermal capacity of this system compared to thermosyphons with a smaller amount of fluid.
For SES36 as a filling fluid, three fill ratios (0.32, 0.51, and 1.0) with a heat input from 50 W to 160 W were studied. Selected data for SES36 is presented in Figure 15, Figure 16, Figure 17, Figure 18, Figure 19 and Figure 20. A geyser boiling effect was observed and there was an operation limit for heat inputs larger than 160 W for all FRs. During operation, the TPCT could encounter various limitations such as the viscous limit, sonic limit, entrainment limit, boiling limit, and capillary limit [9]. As can be seen in Figure 21, boiling limit is encountered in this case. It should be emphasized that the time to reach steady state conditions was significantly larger compared to thermosyphons filled with water and ethanol. The average time to reach steady state conditions was longer than 2000 s (≈33.5 min). What is more, after such a long time, some temperature and pressure oscillations were still being observed.
The maximum heat flux was calculated using Zuber correlations [29]:
Q ˙ m a x = C c r · h f g · { σ · g · ρ v 2 · ( ρ l ρ v ) } 1 4
where Ccr is a constant value dependent on the heater geometry. This value was assumed to be equal to 0.12 according to the relations below:
C c r = 0.12   f o r   L * > 1.2
L * = D · ( g · ρ l ρ v σ ) 1 2

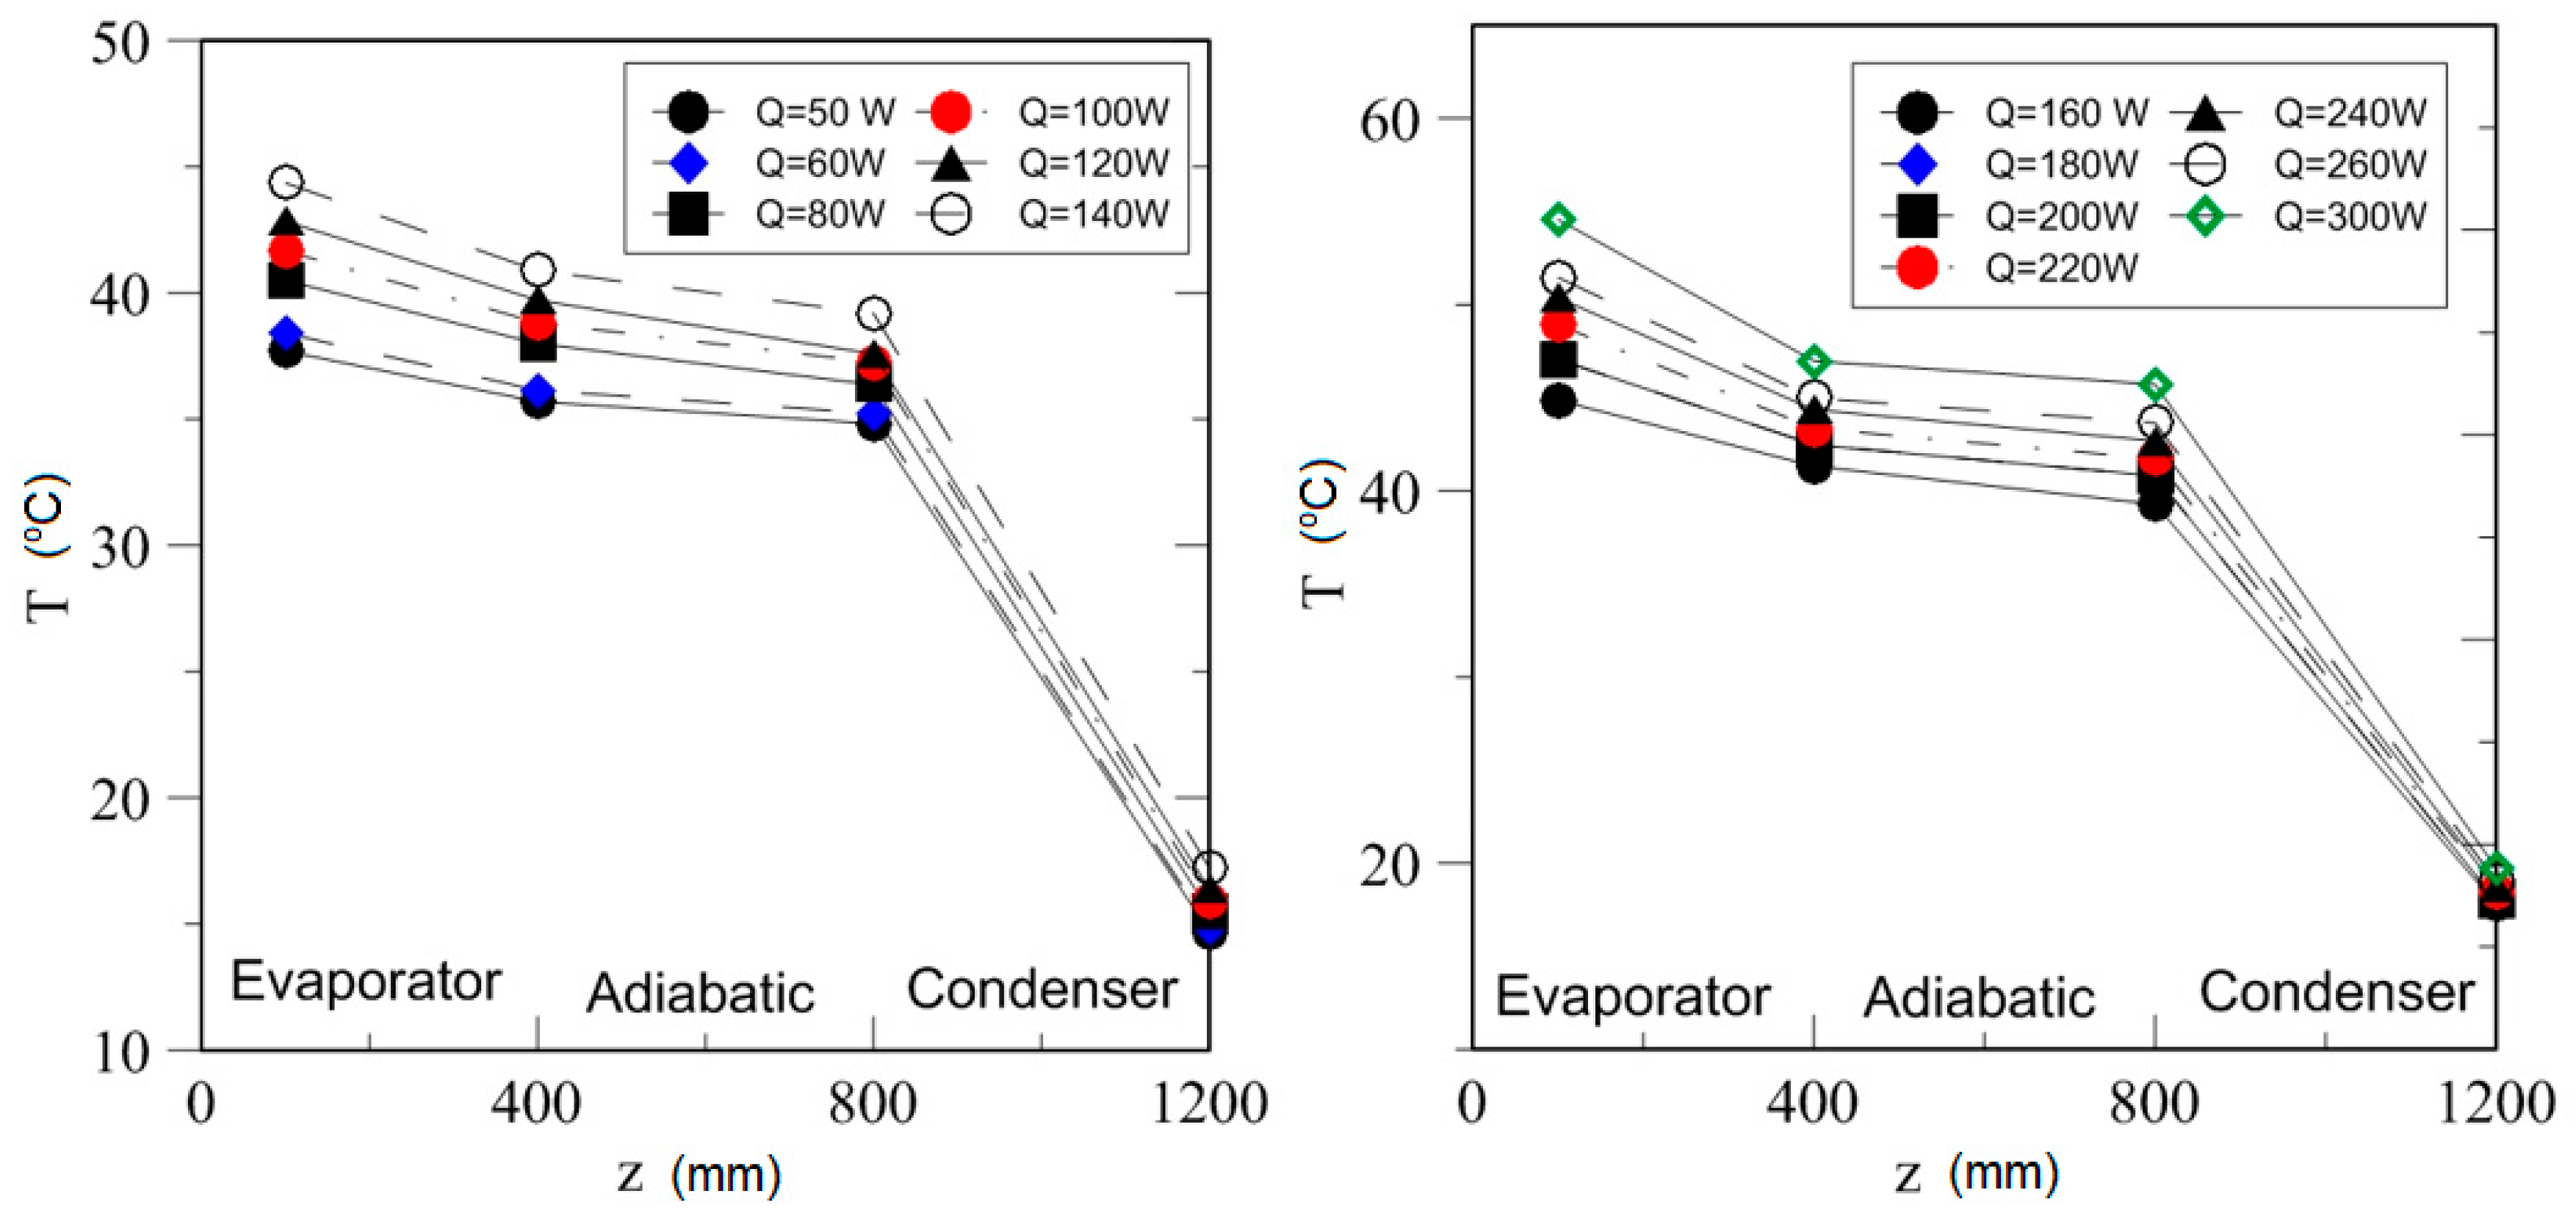
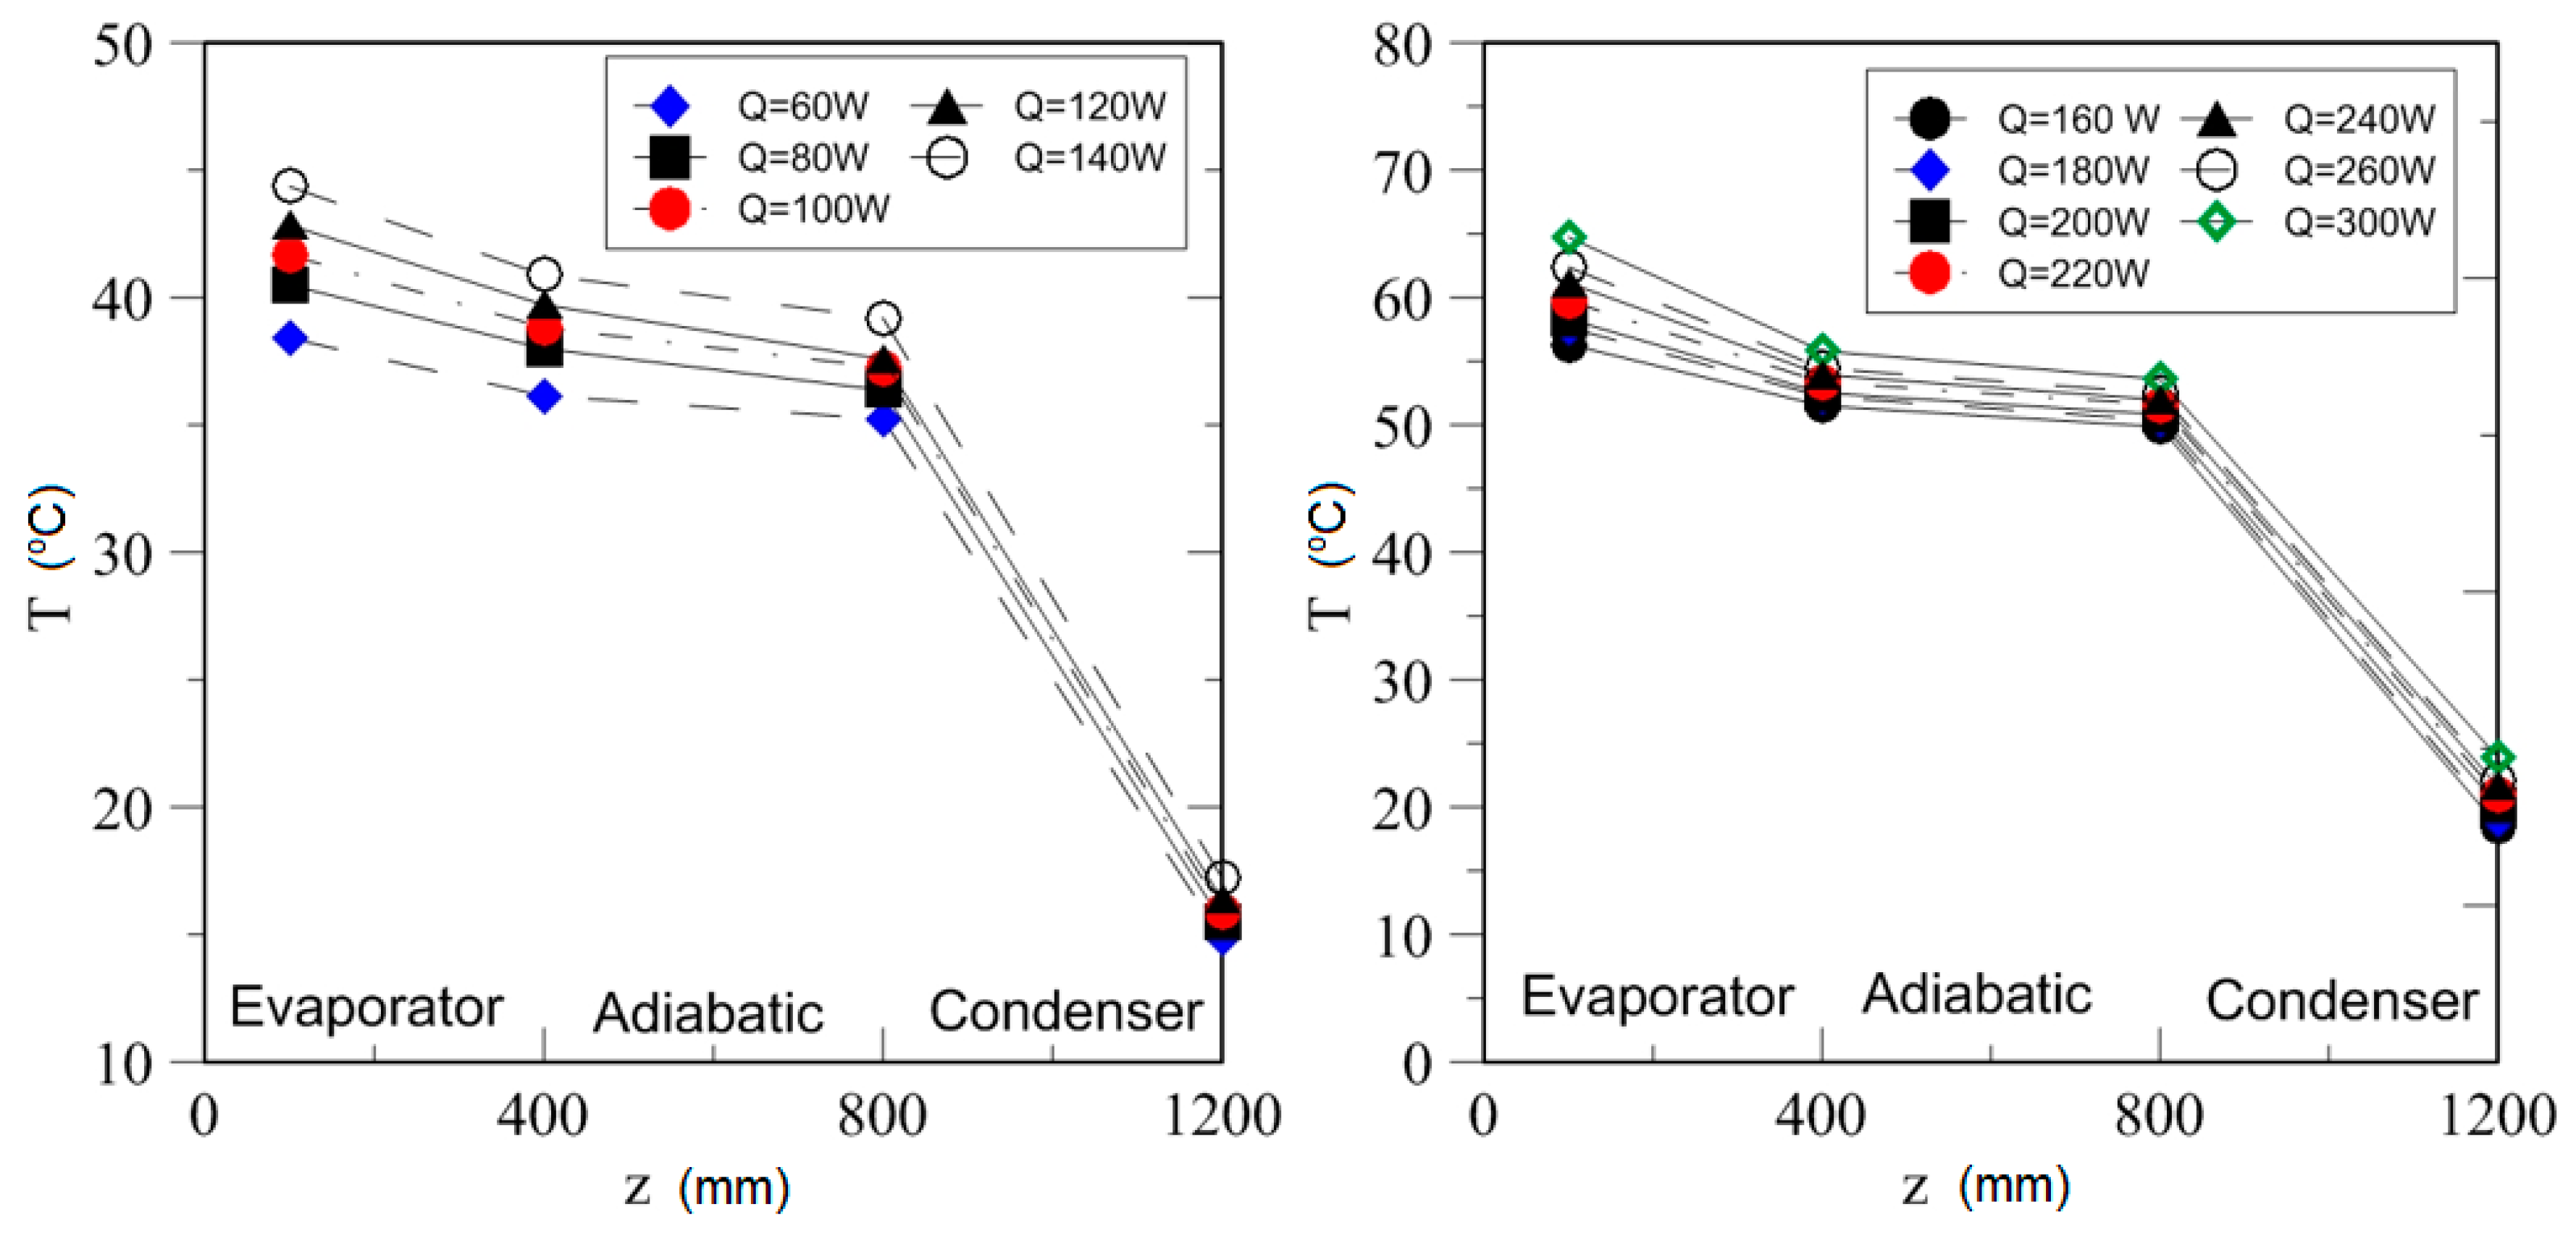
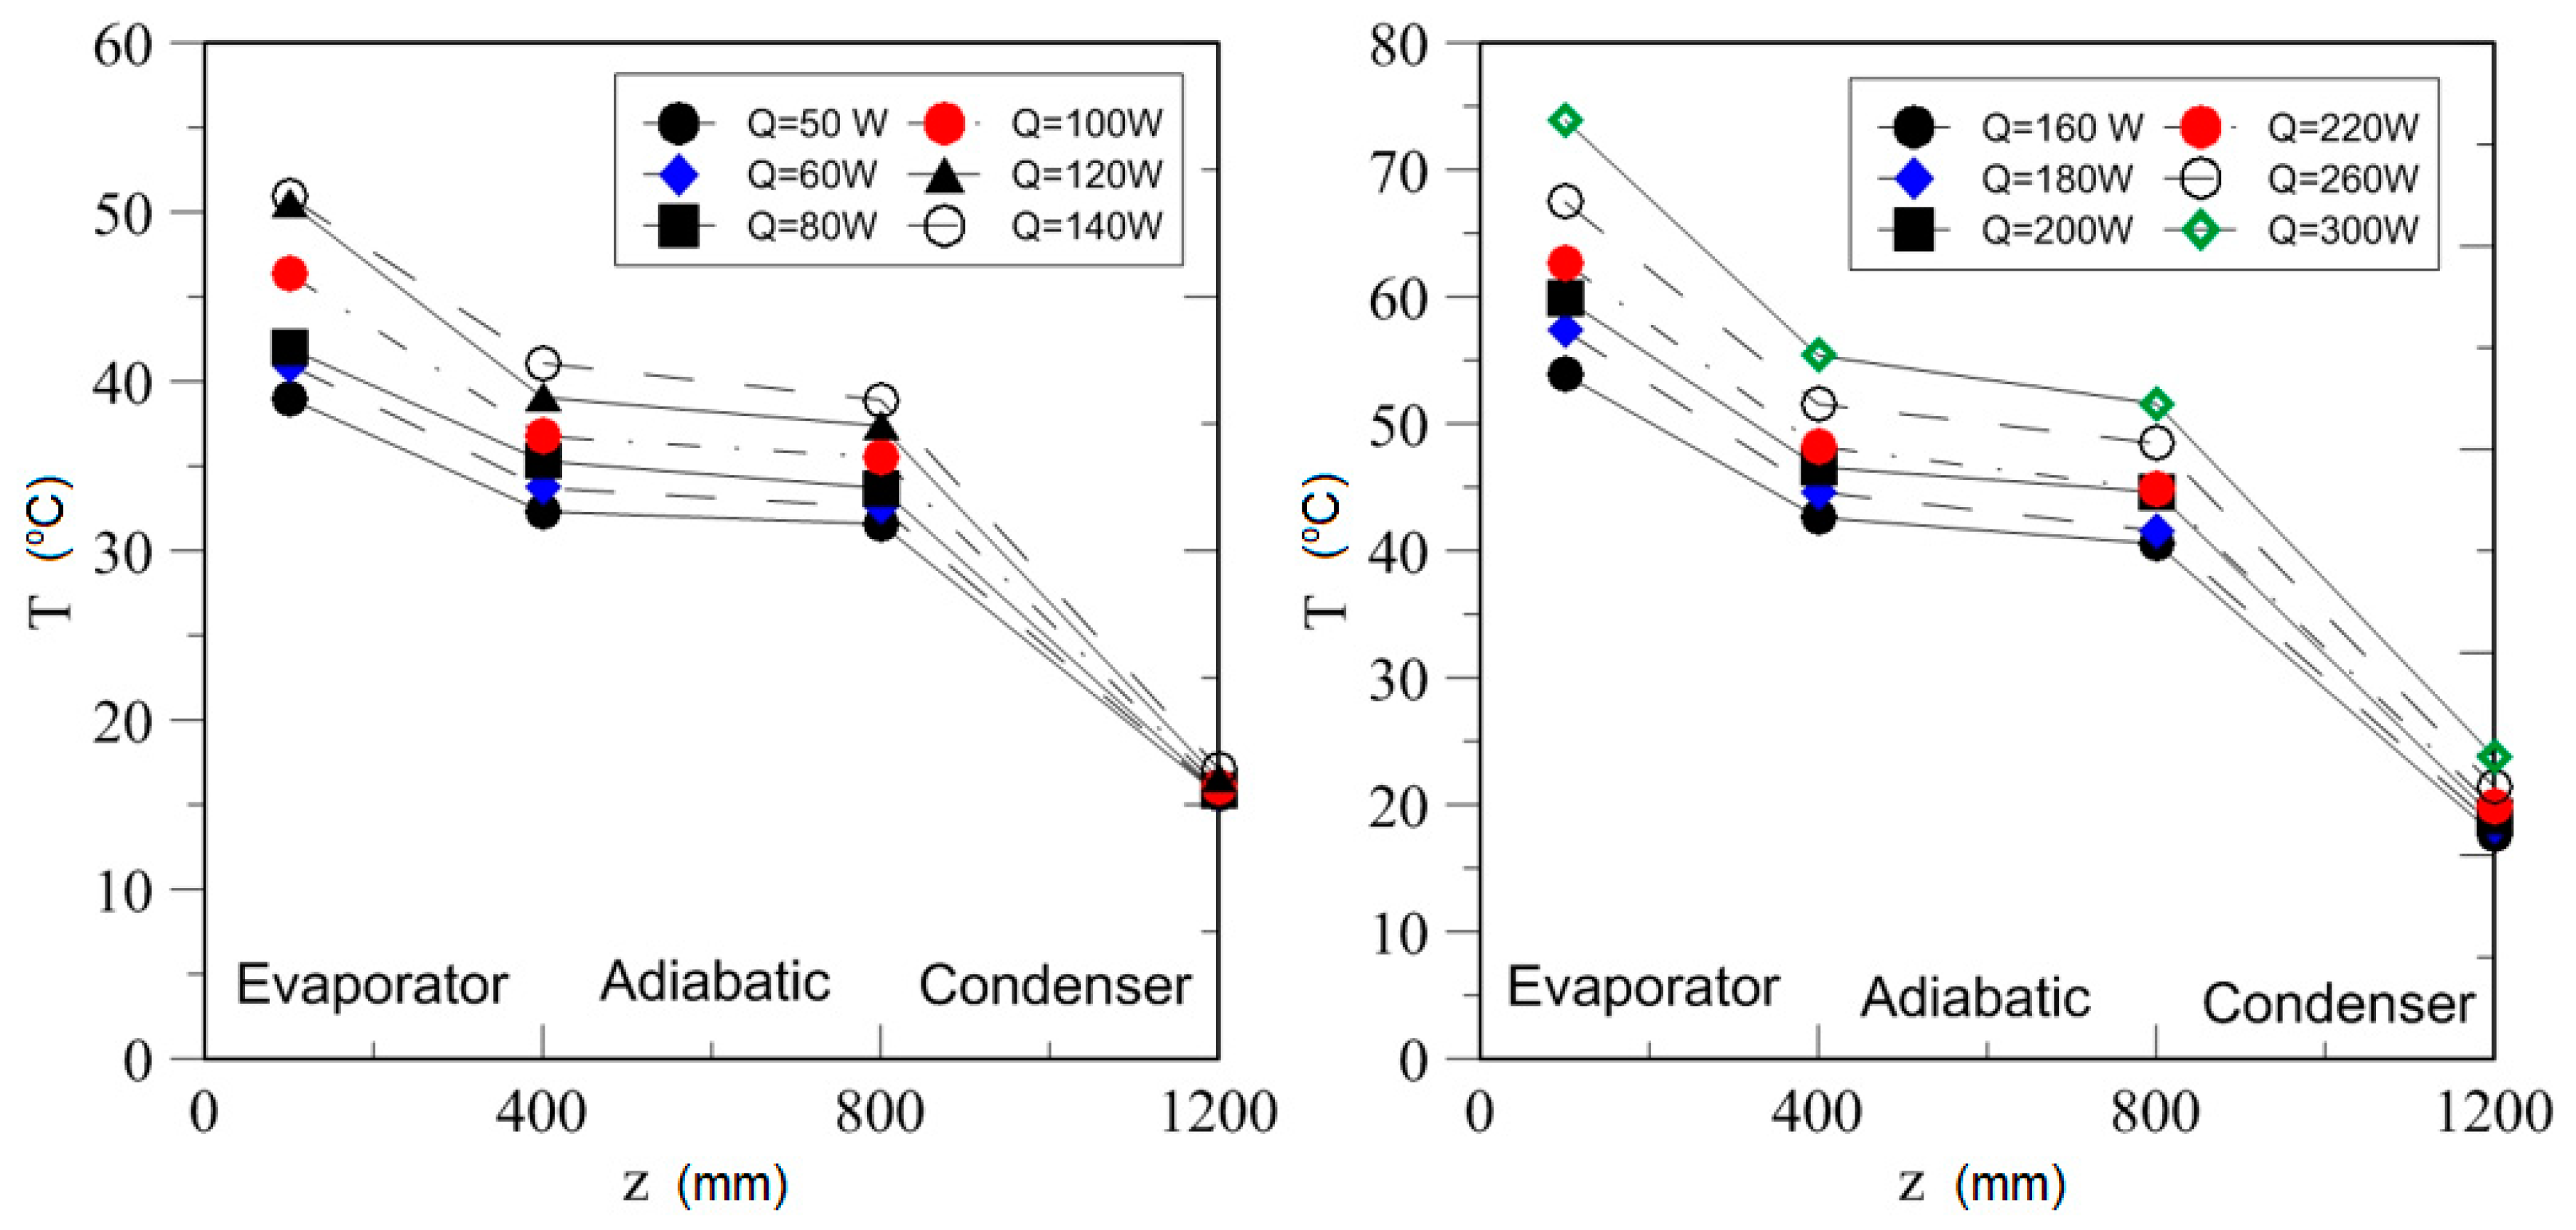
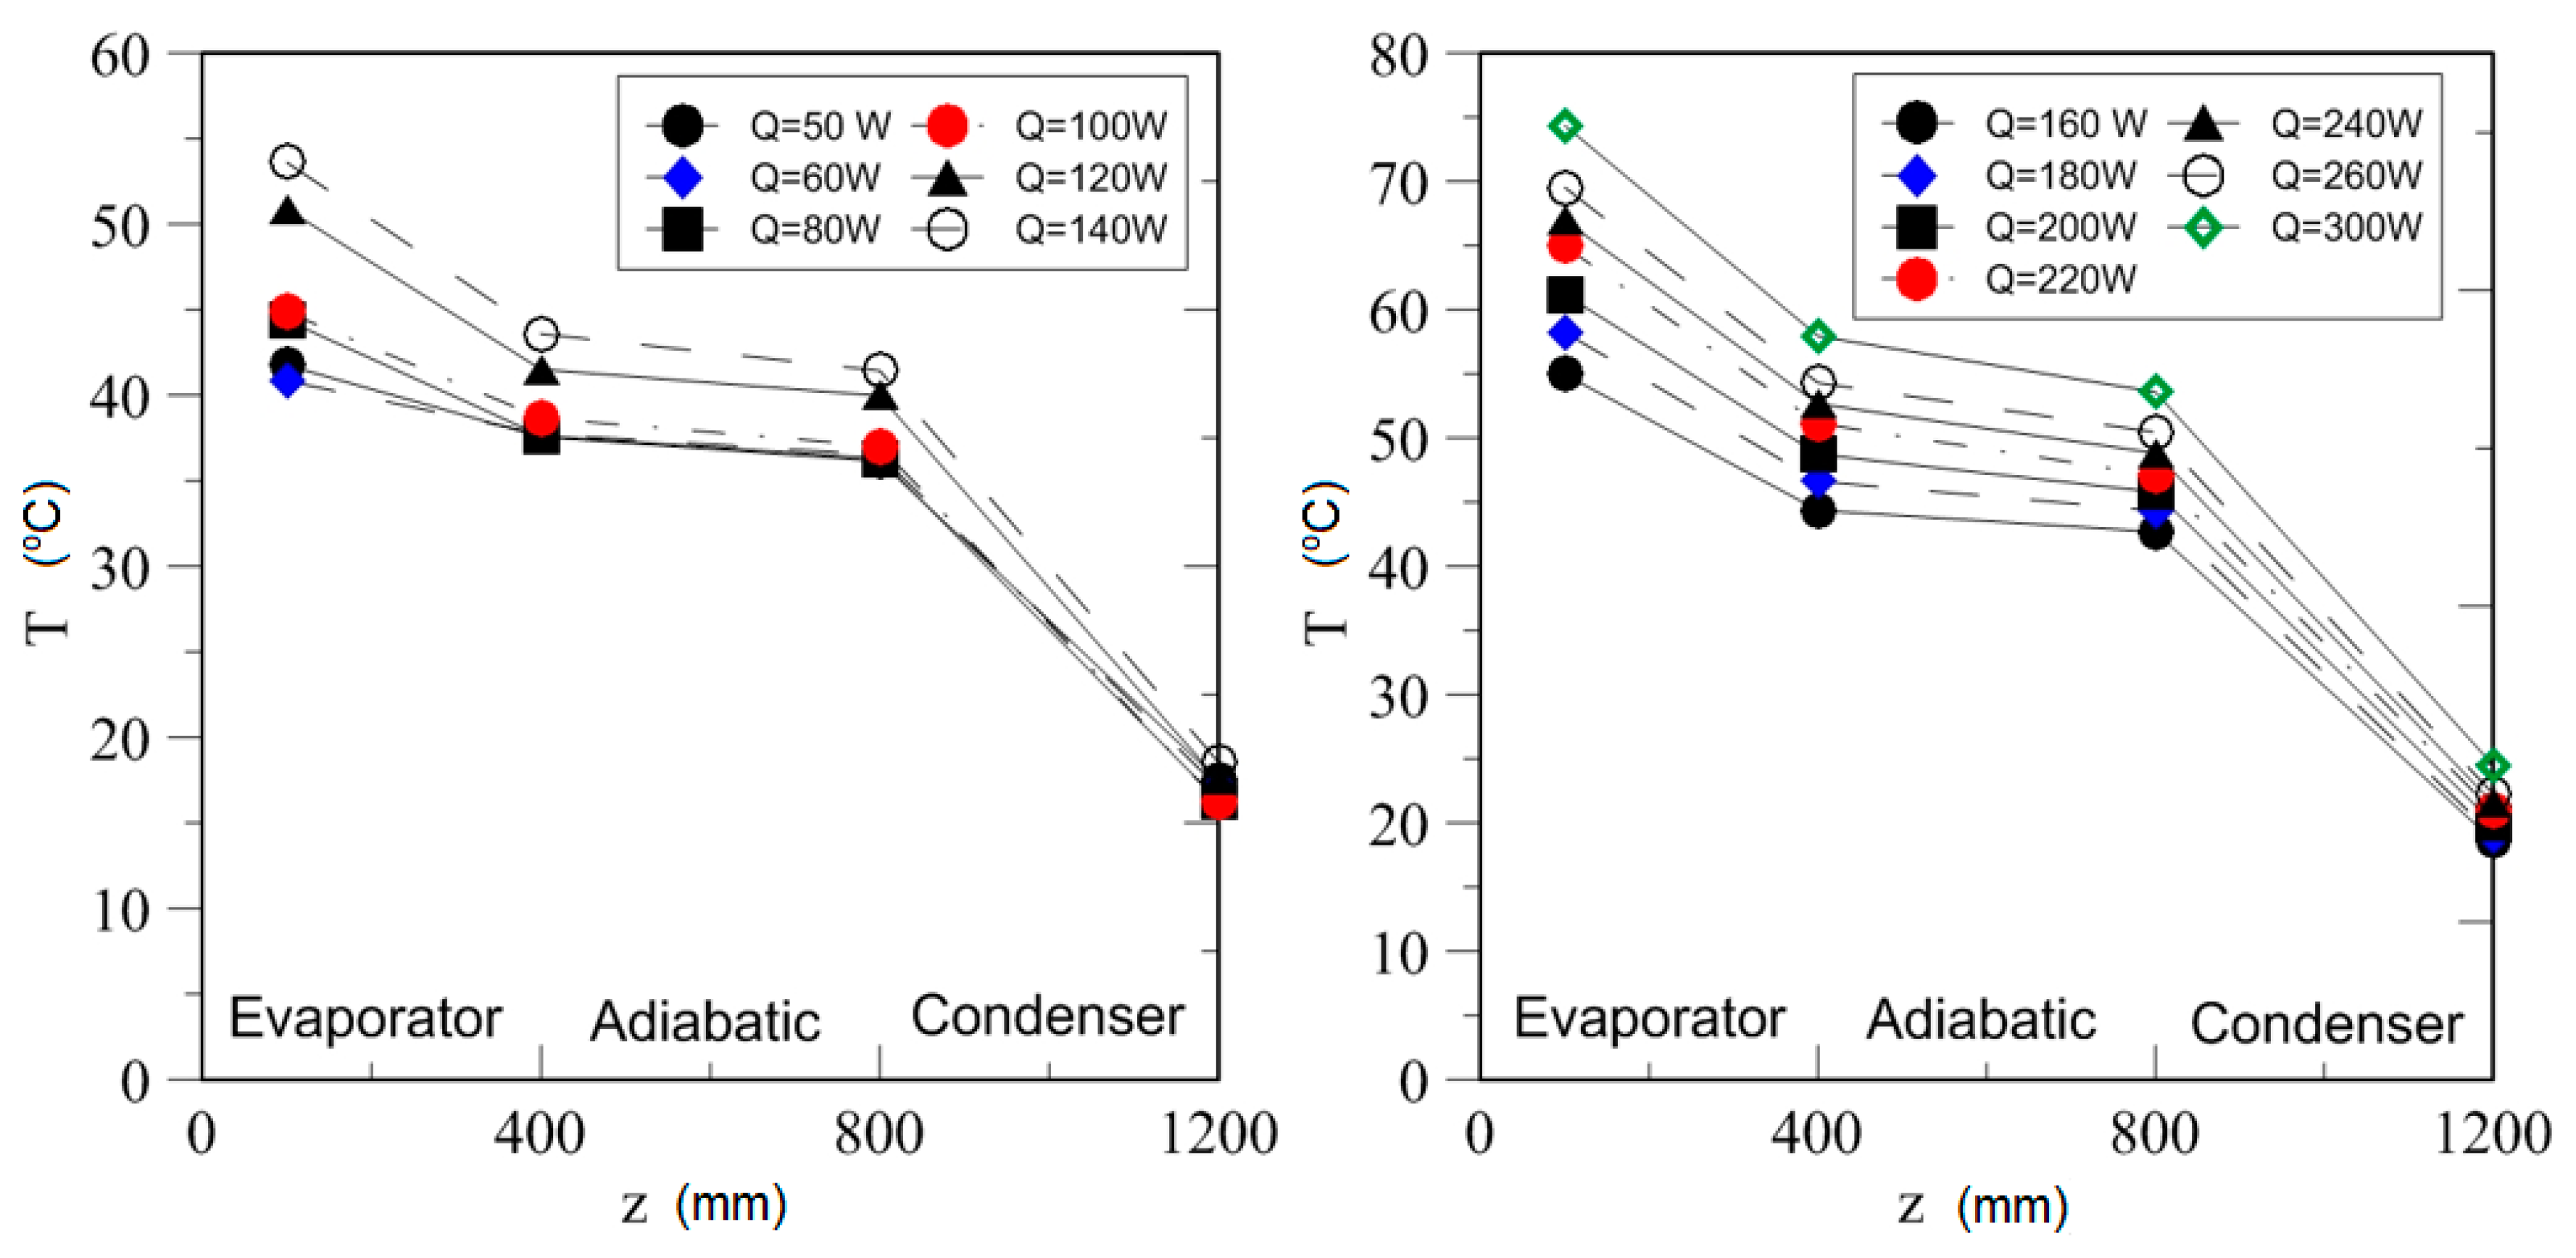
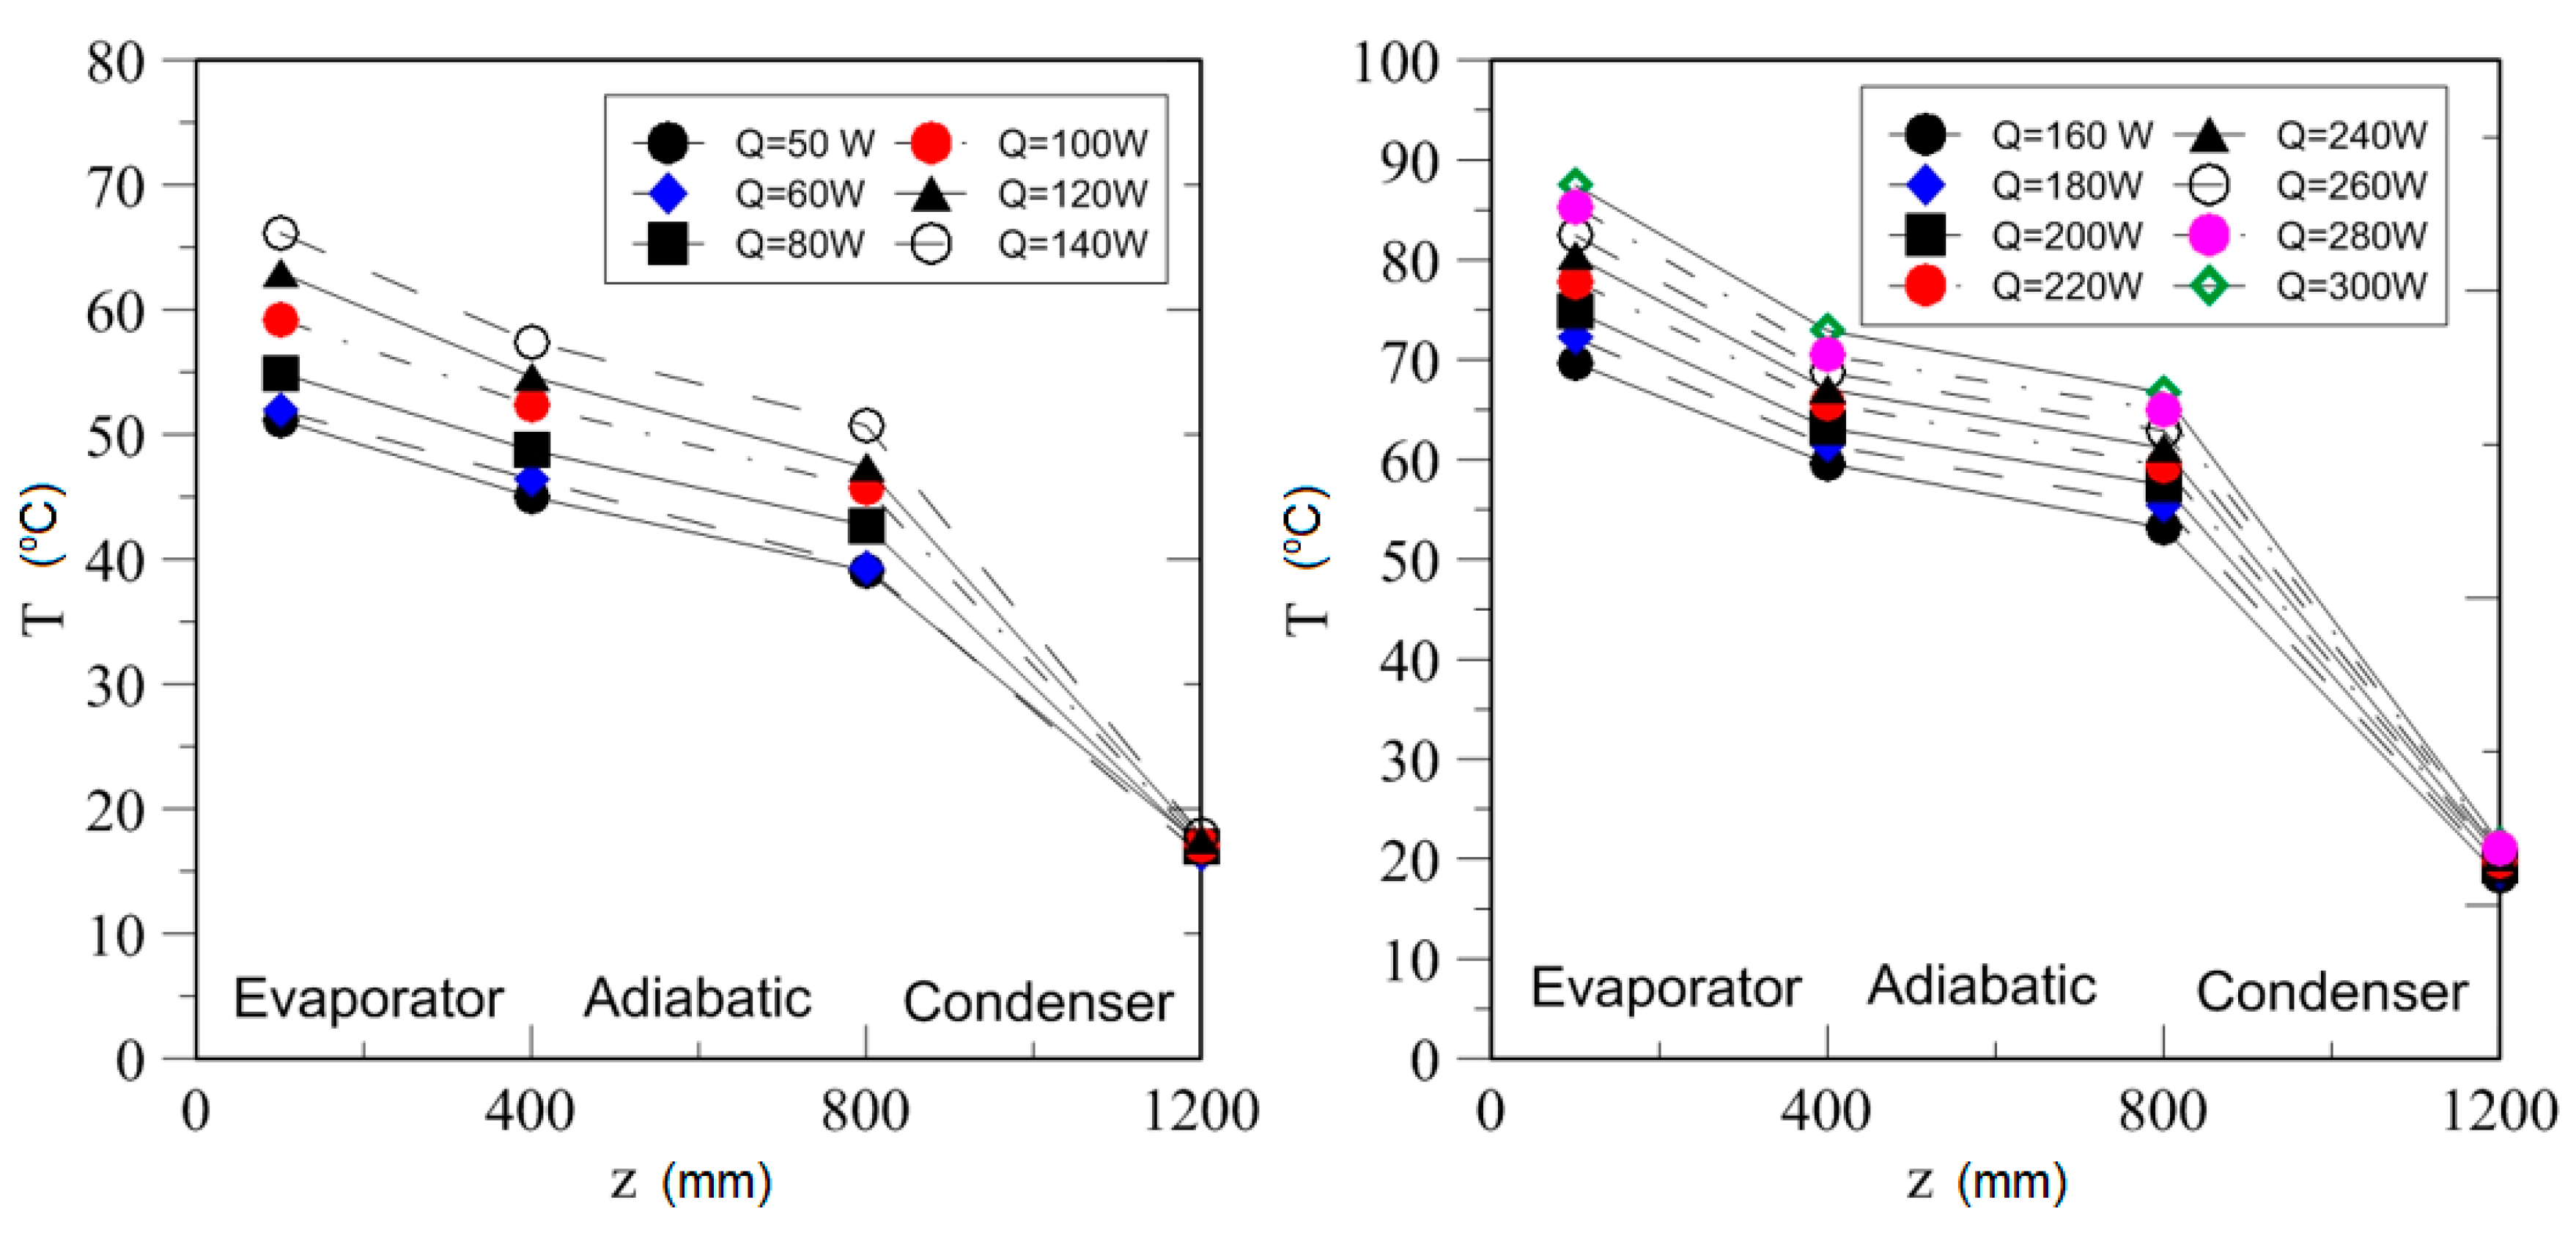
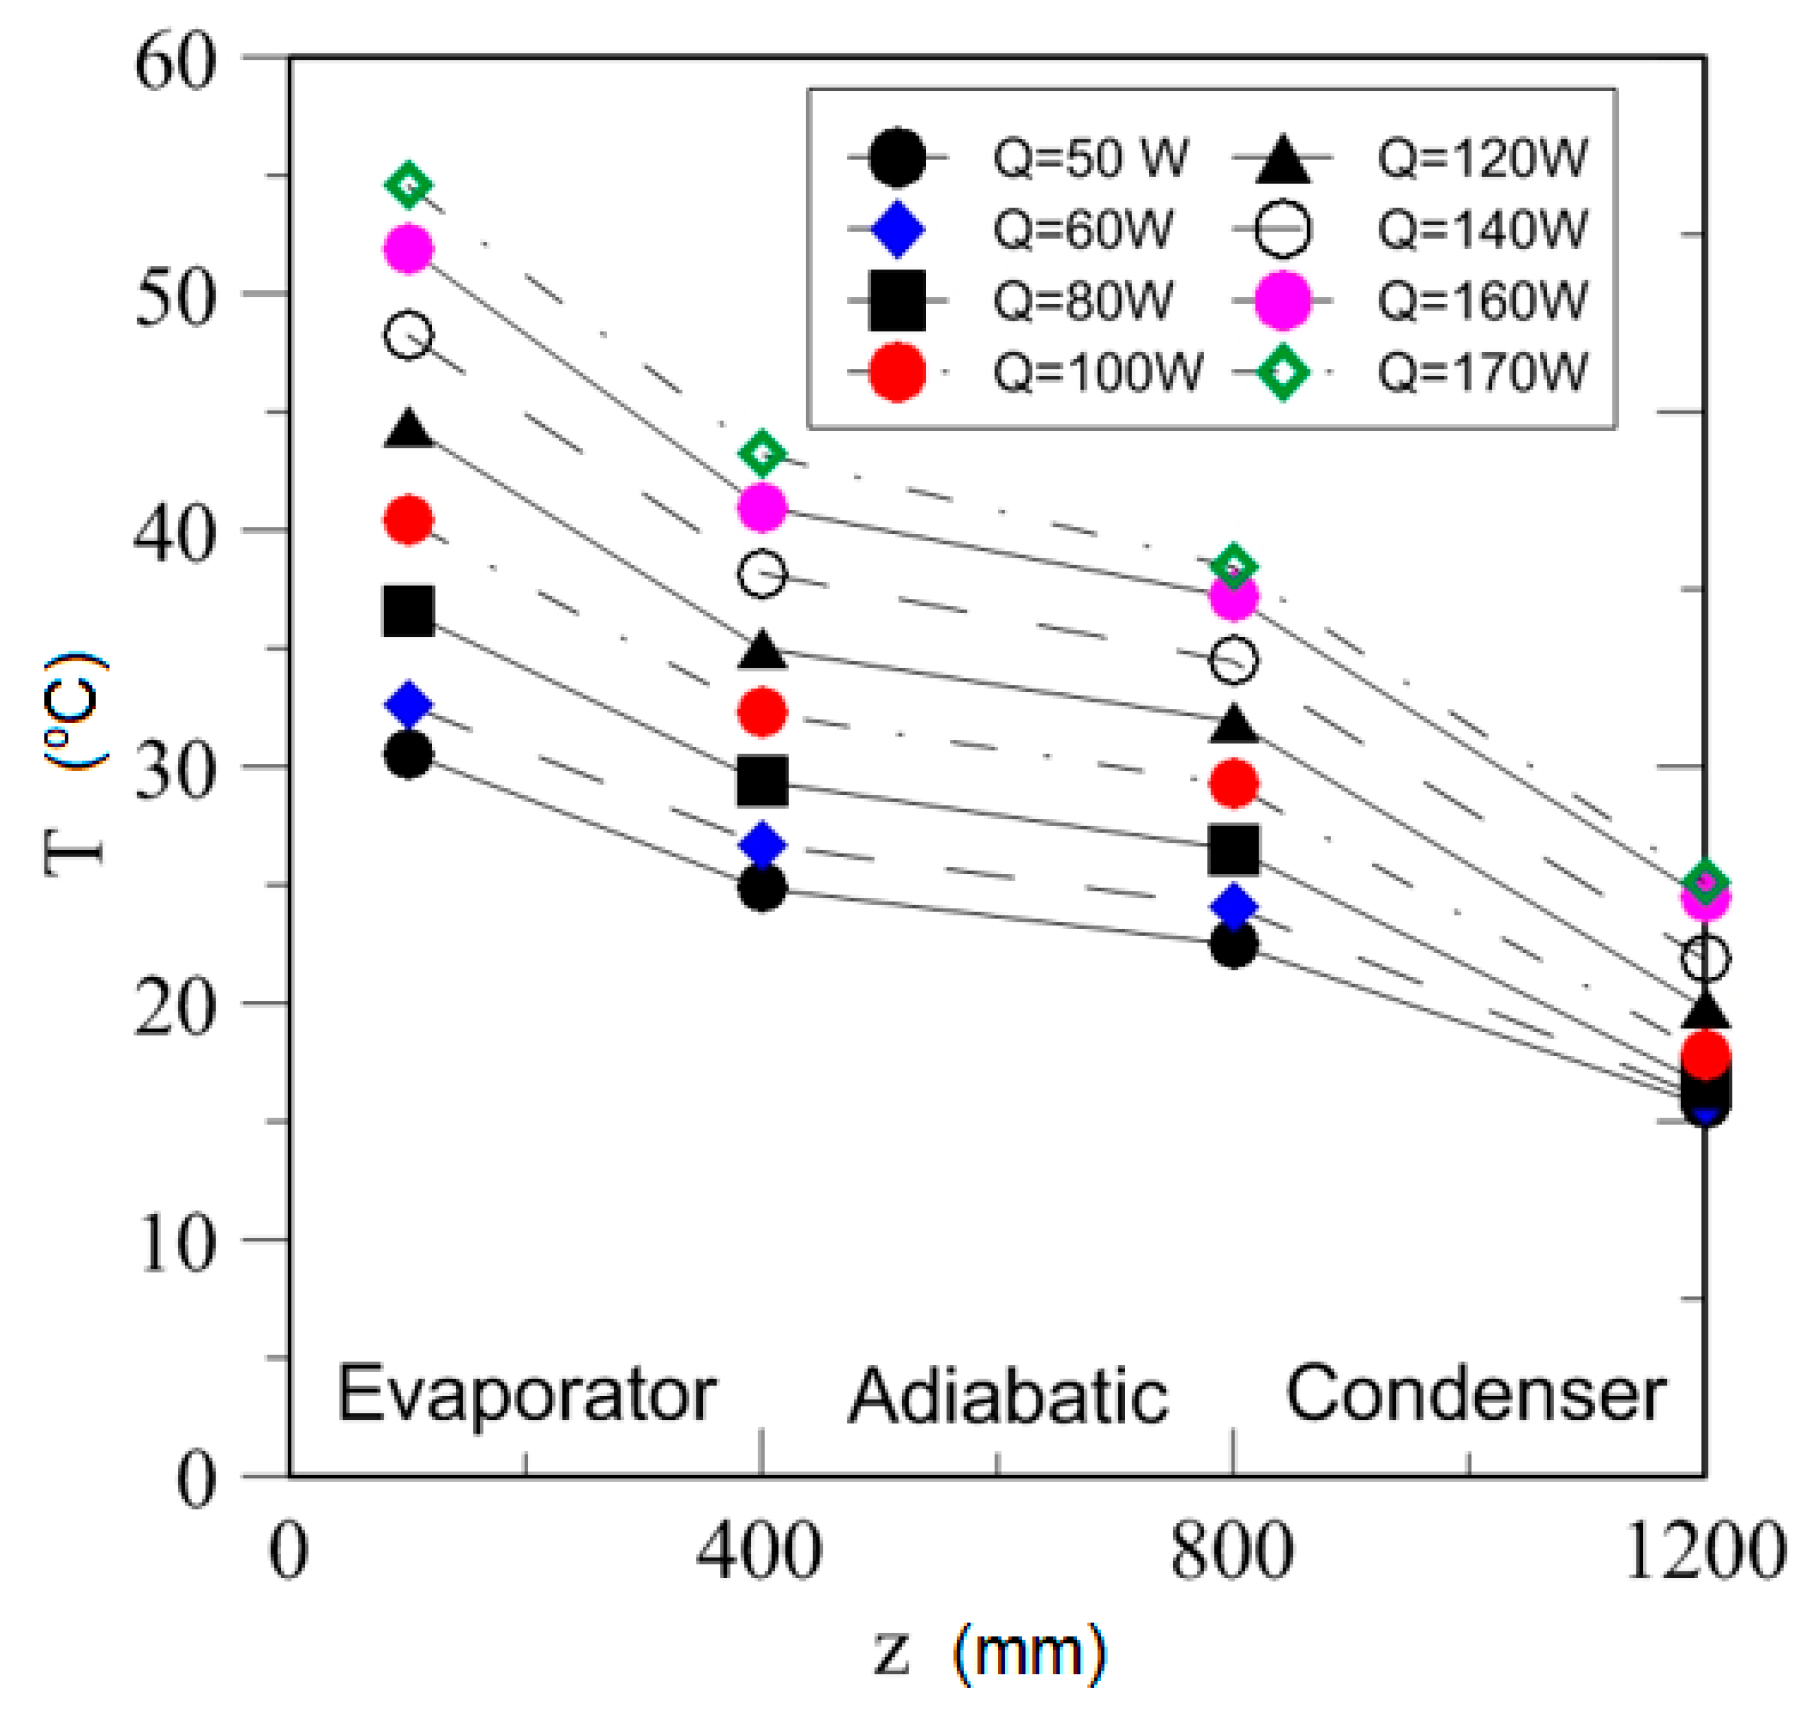
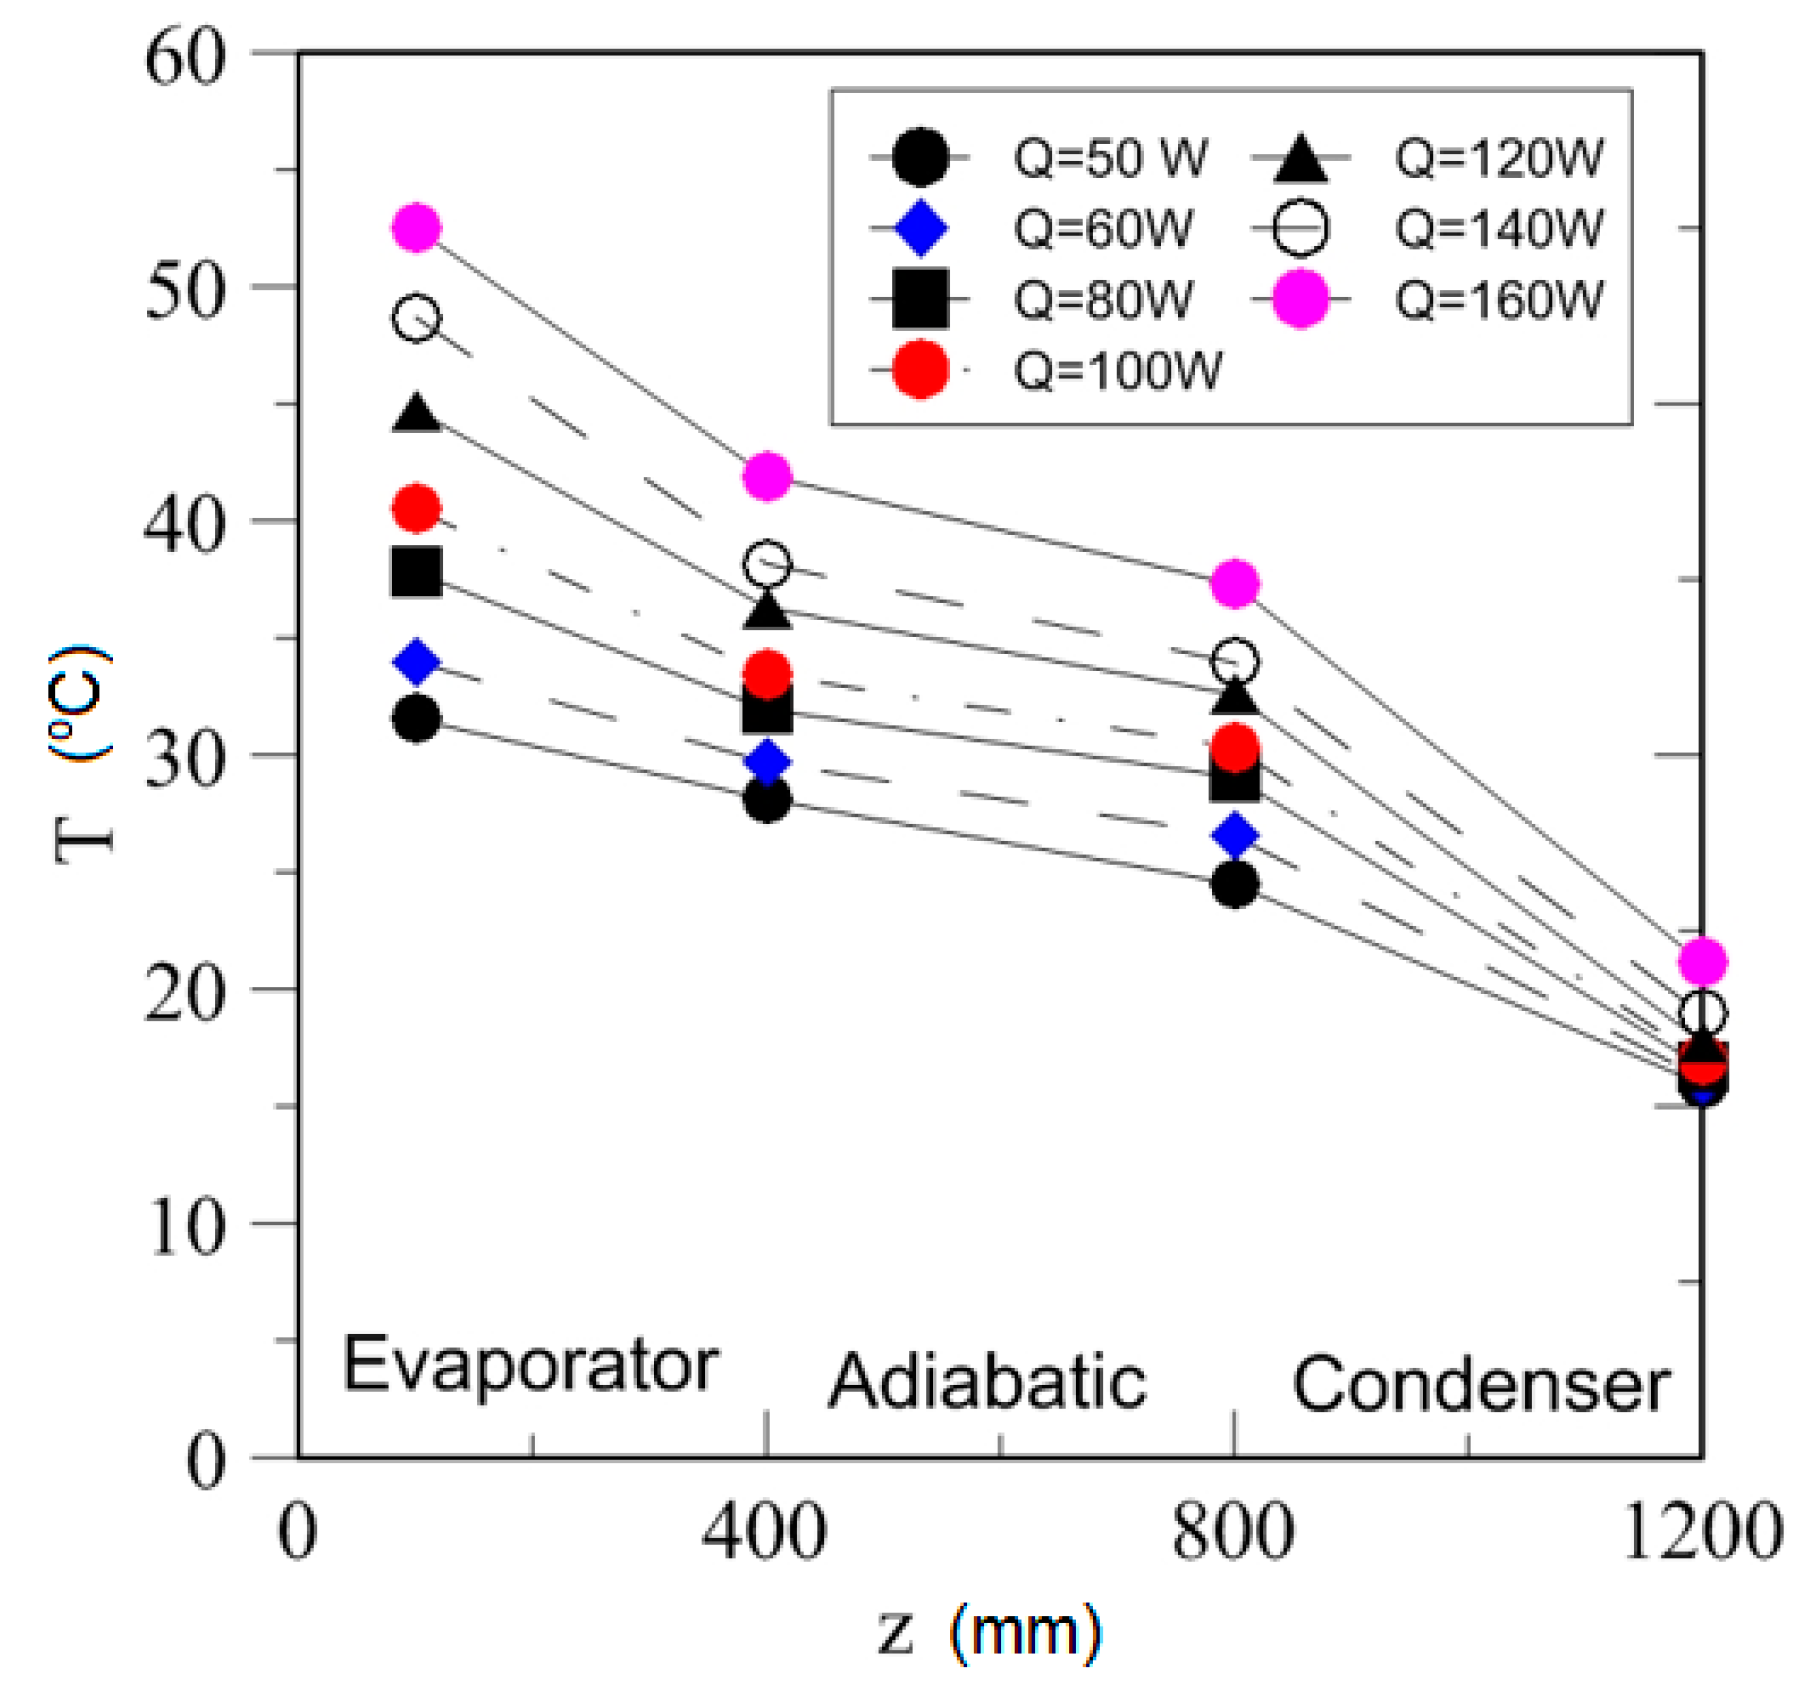
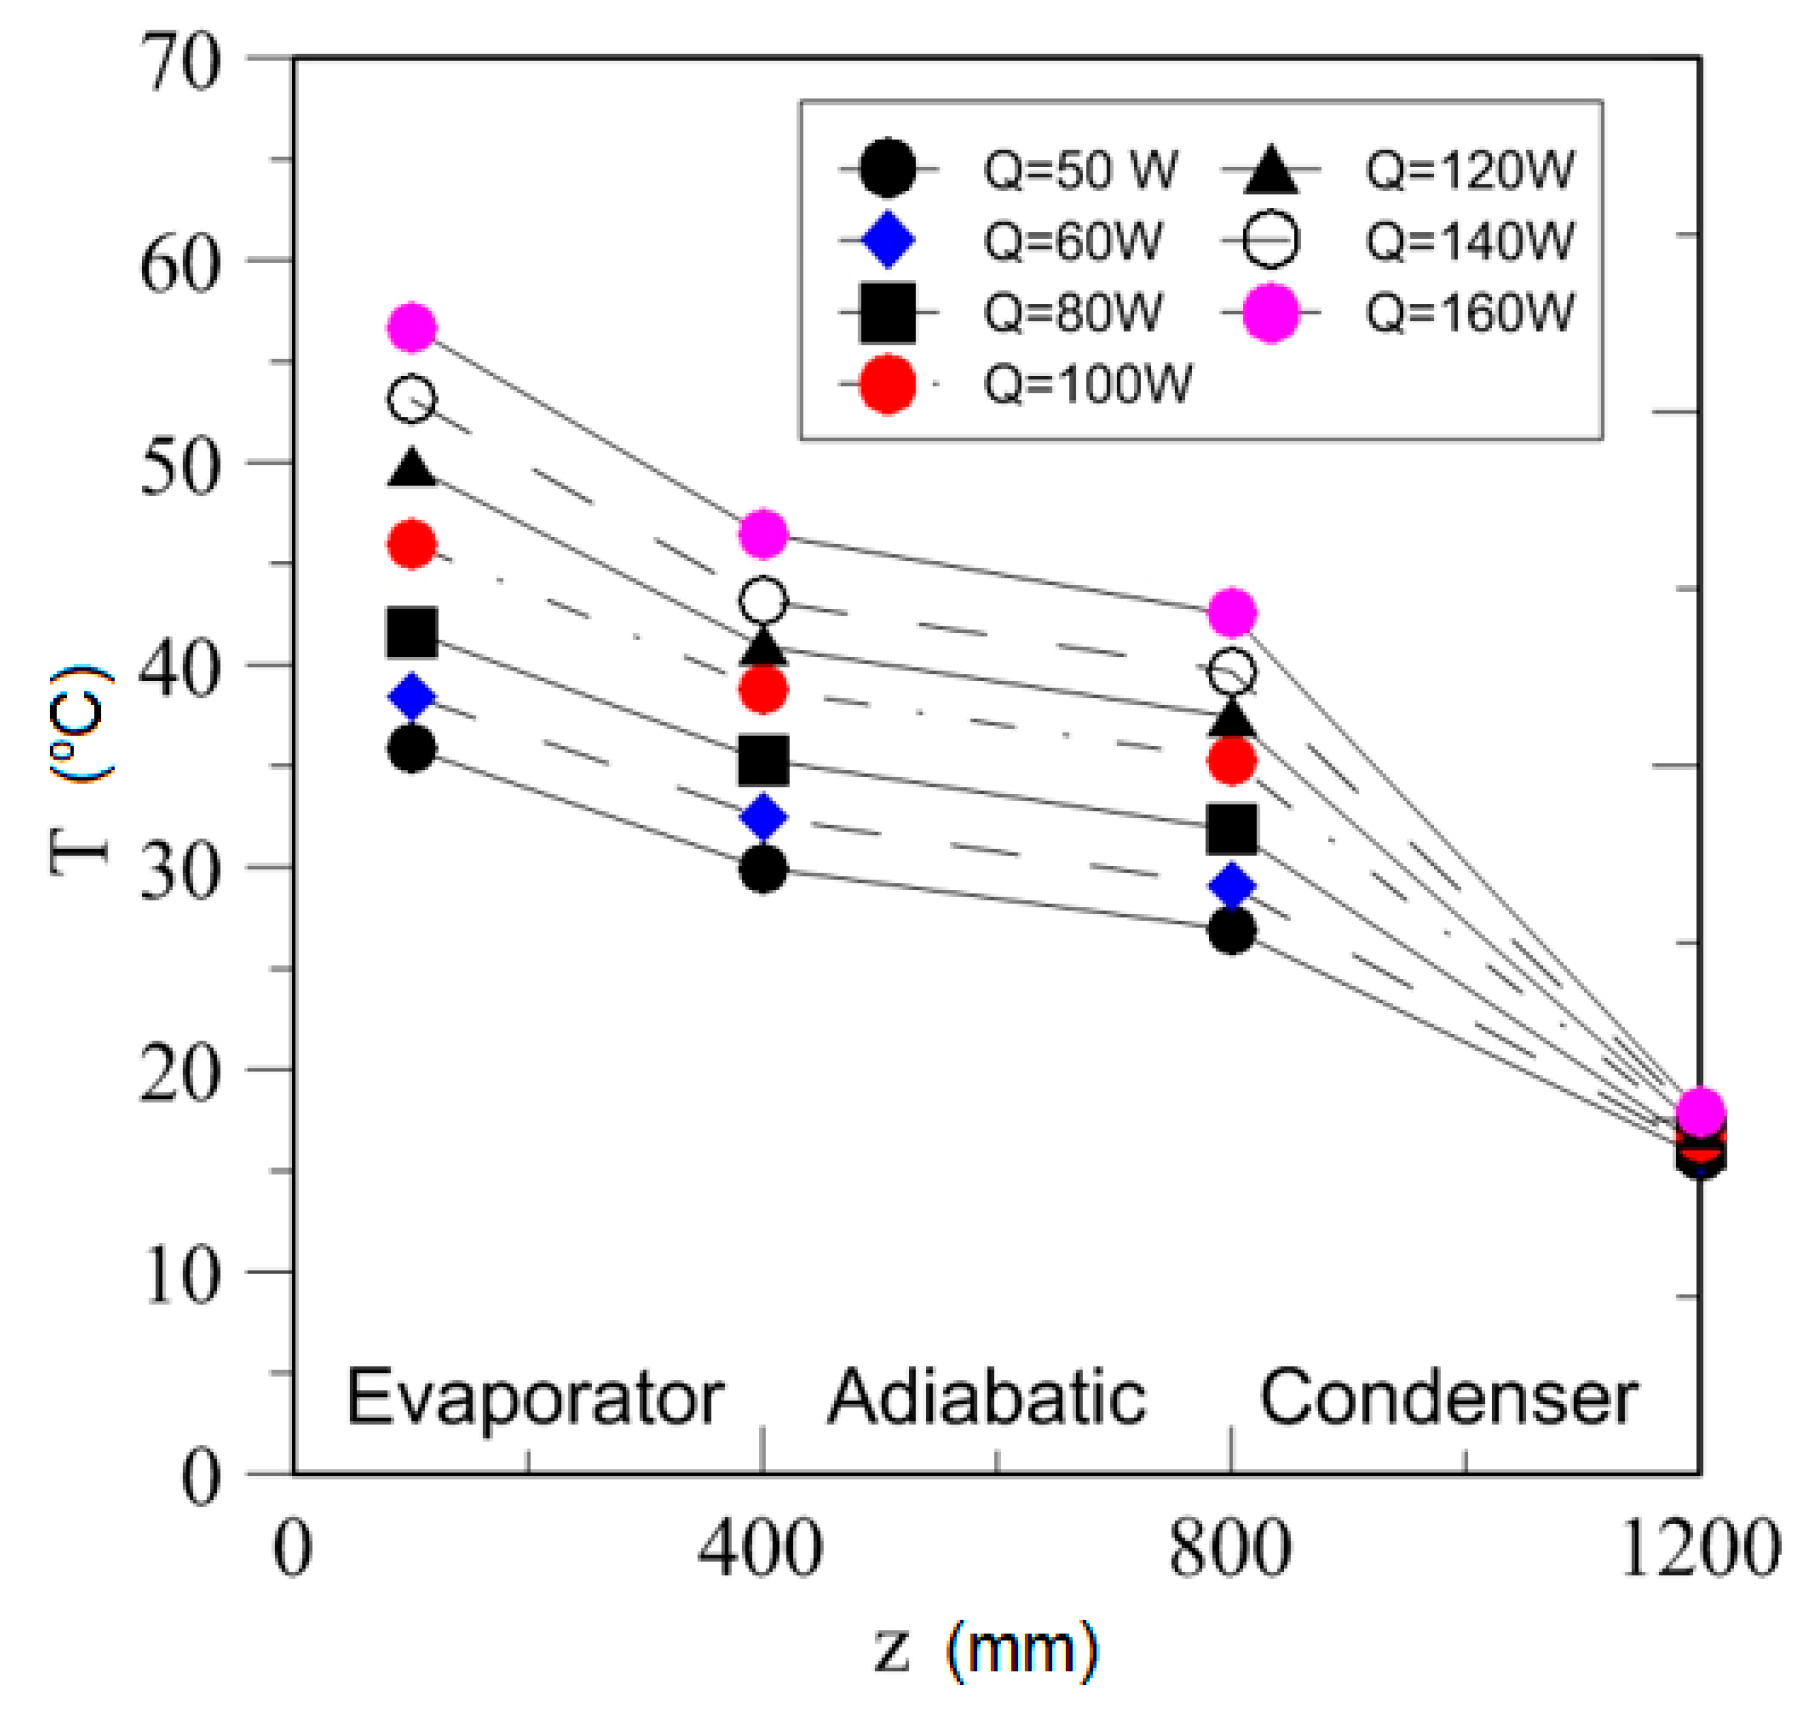
4.2. Effect of Power Input on Axial Temperature Distribution

It is well known from the open literature [30,31] that the precise determination of TPCT performance demands precise temperature profiles along the thermosyphon. This is especially for the evaporator and condenser sections. As can be seen in Figure 22, Figure 23, Figure 24, Figure 25, Figure 26, Figure 27, Figure 28 and Figure 29, in the working fluid temperatures in condenser section was constant and did not depend on the variable heat input. In the case of the thermosyphon filled with water, a small negative slope of temperature between evaporator and adiabatic sections was observed. However, the difference was larger for higher heat inputs. This fact could be explained due to the existence (in this case) of a continuous liquid film that covered the internal wall surface in the evaporator section and also by the character of the heat transfer mechanism in the evaporation section. Heat was transferred by convection, and for low power input, the liquid level in the evaporator was generally high. As the heat input increased, the height of the liquid phase in the evaporator dropped, which resulted in the rise in the active heat transfer area of the evaporation section. A thin liquid film formed in the evaporation section, which enhanced heat transfer [32,33]. For a high heat input, the temperature in the evaporator section was relatively high. If the heat power was too high, it could initiate a transition from nucleation boiling regime to a film boiling regime. This caused the disintegration of the liquid film, which resulted in a rapid decrease of heat transfer in the thermosyphon. This could significantly increase the wall temperature in the evaporation section [34]. It should be emphasized that the negative slope of temperature between the evaporator and adiabatic sections was significantly larger for SES36 and ethanol compared to water. However, for a thermosyphon filled with SES36, a significant increase of evaporator wall temperature was also observed for rising heat power.

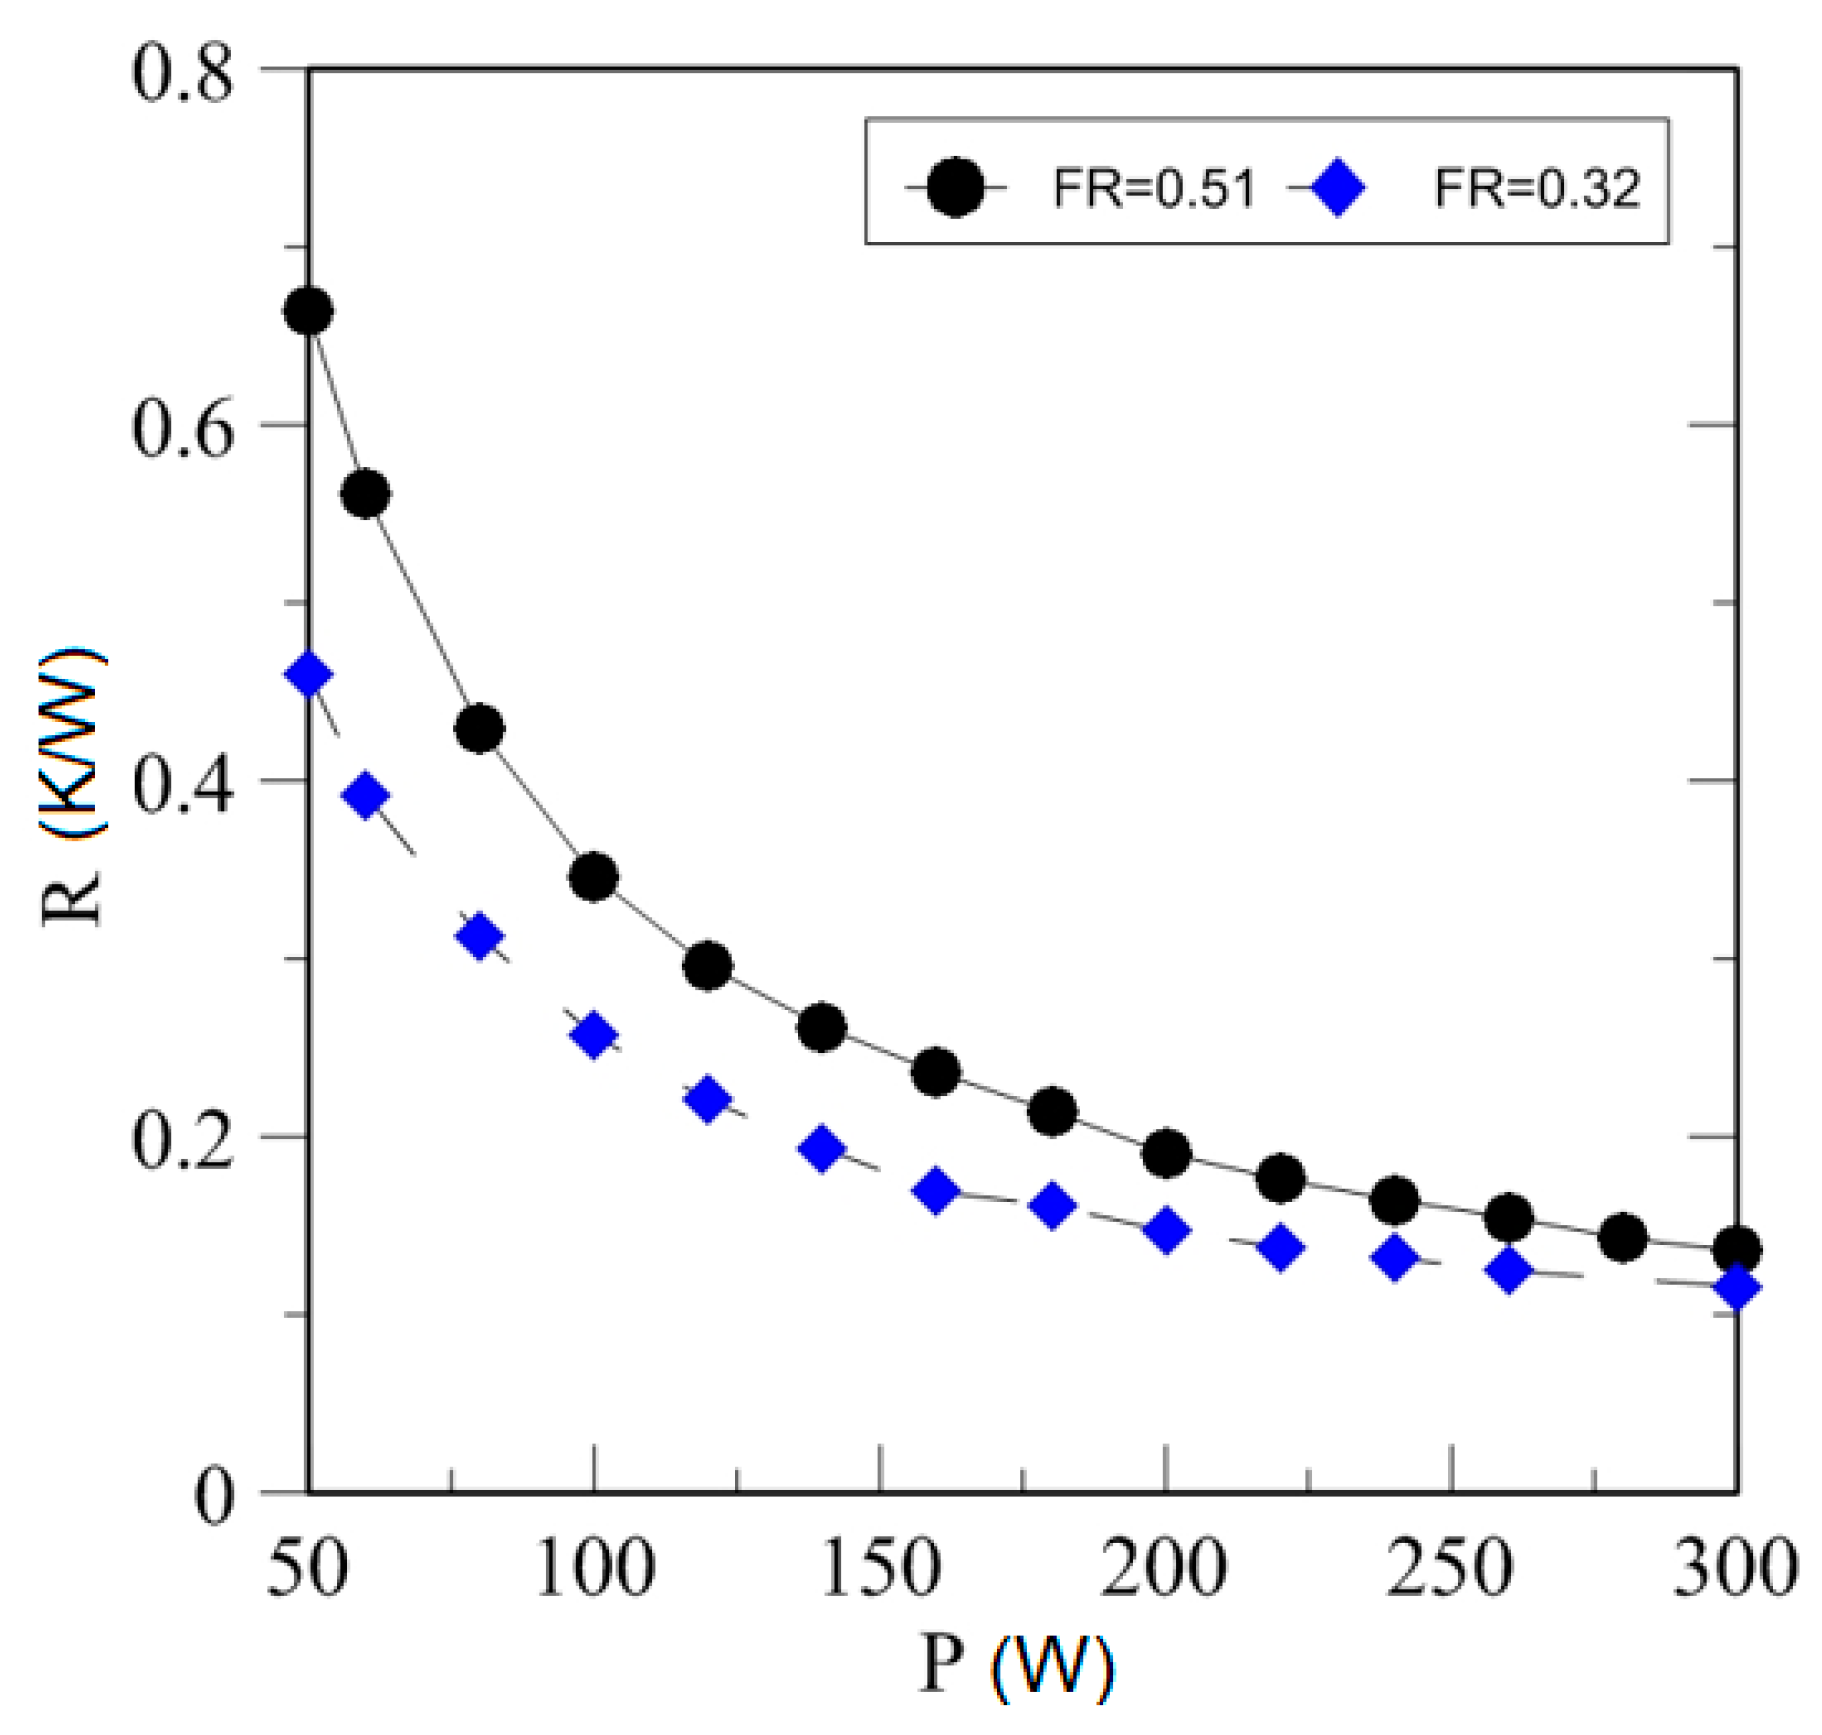
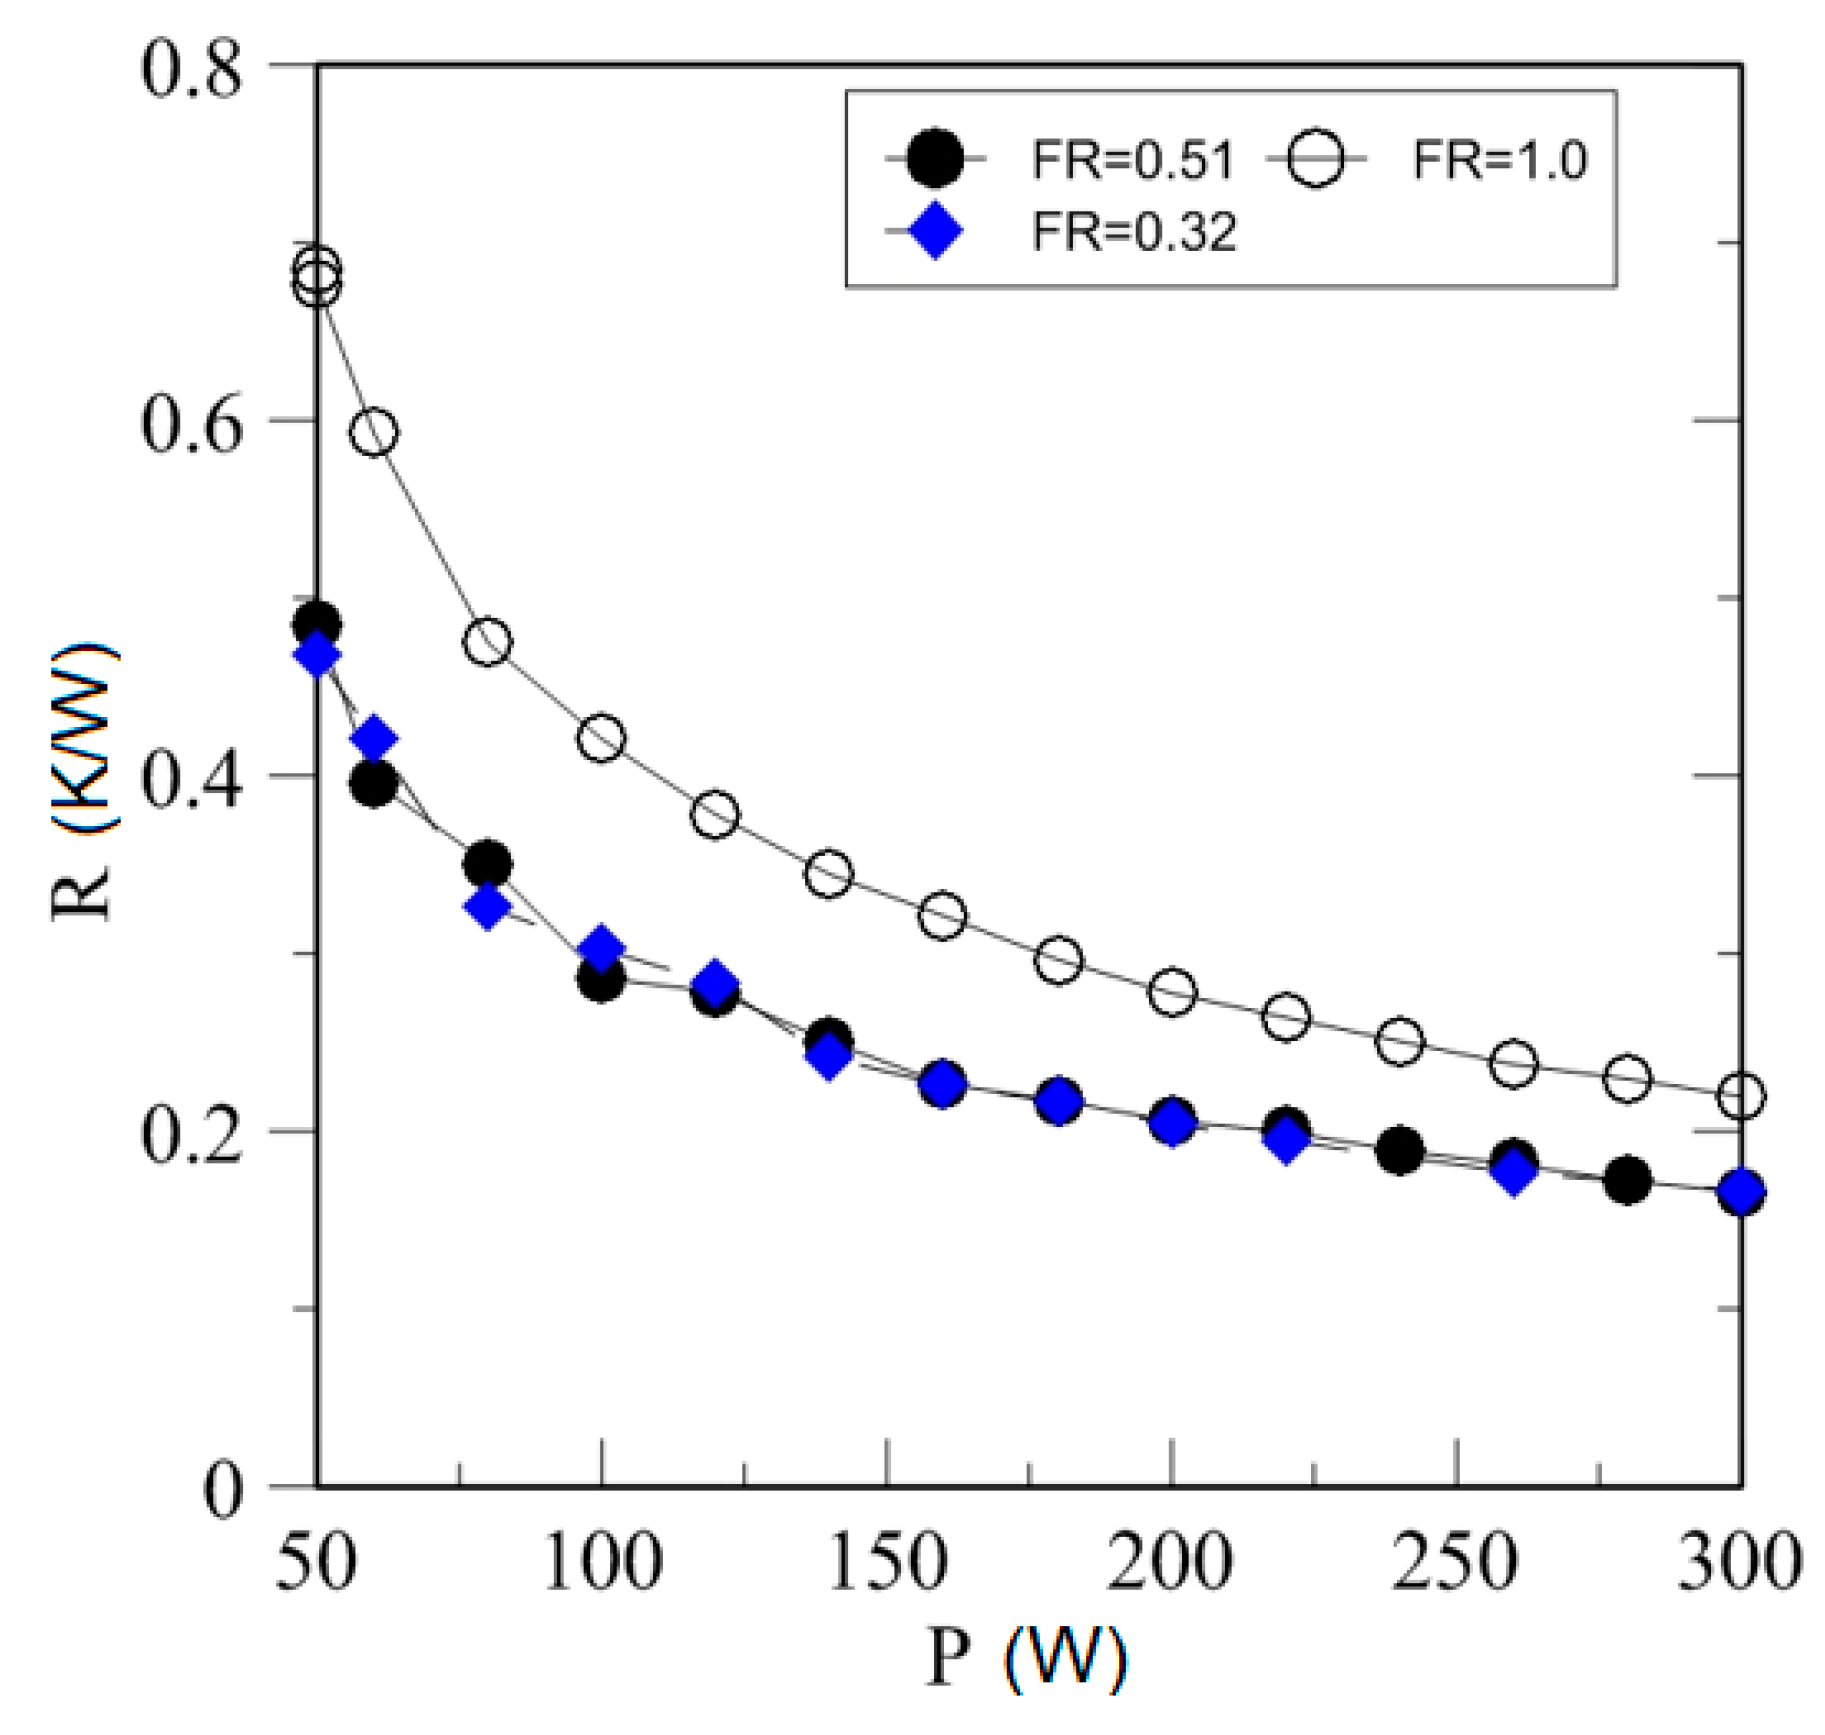
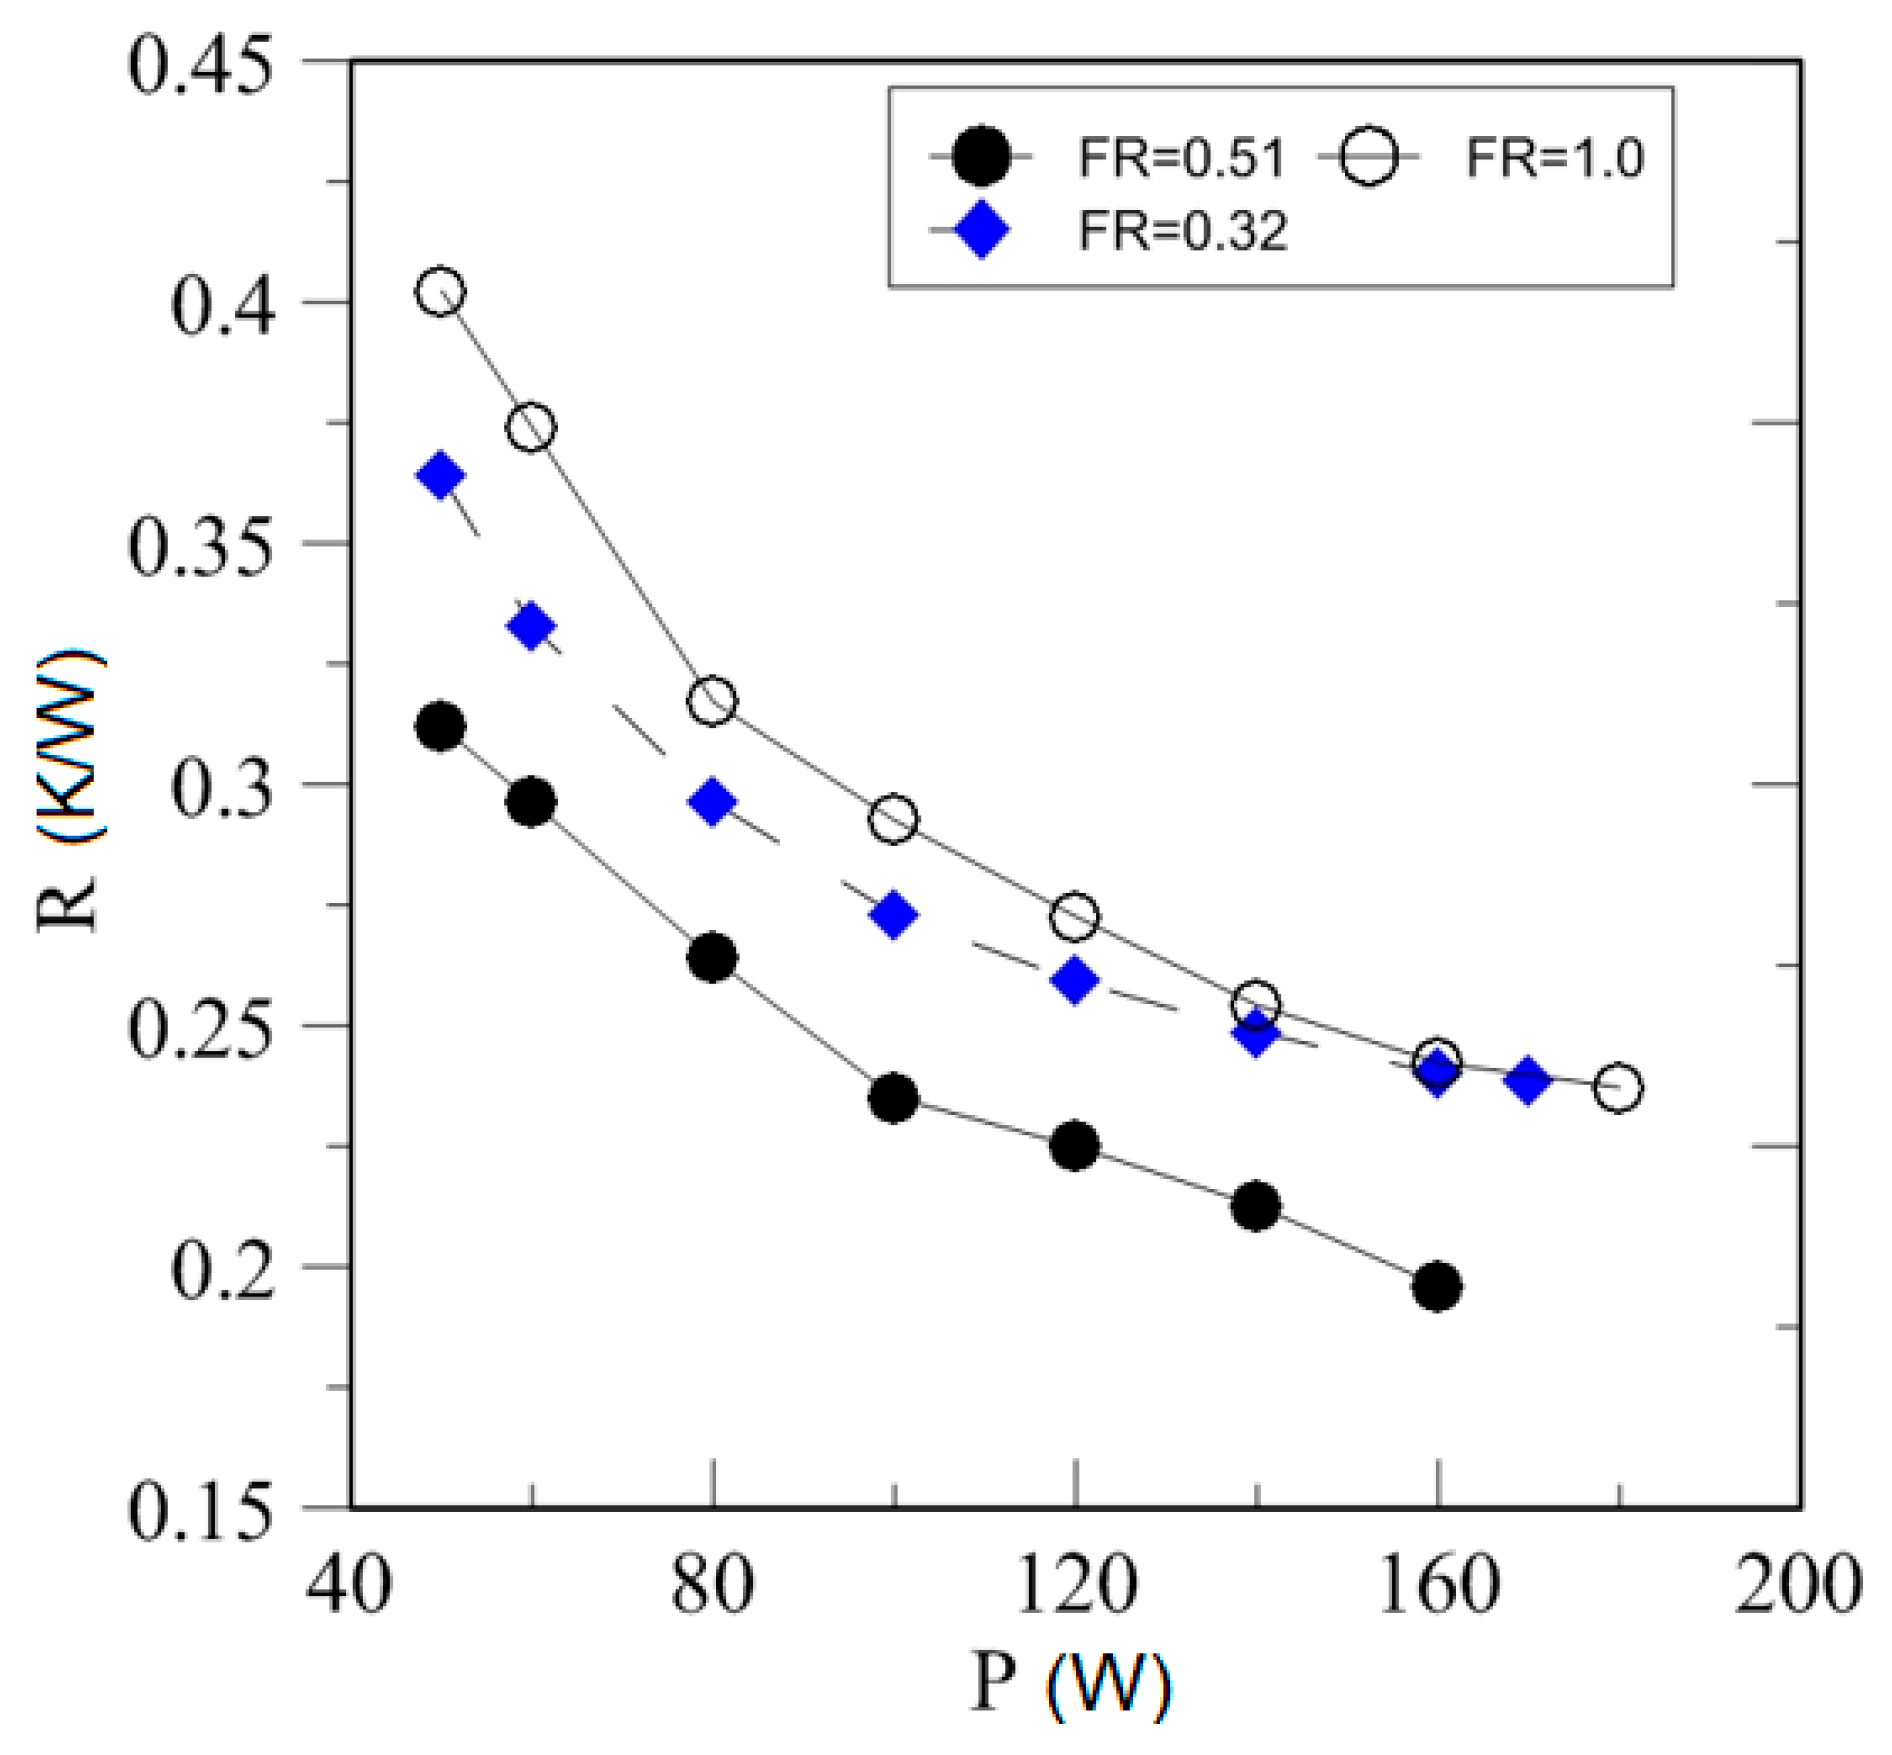
4.3. Effect of Heating Power on Thermal Resistance
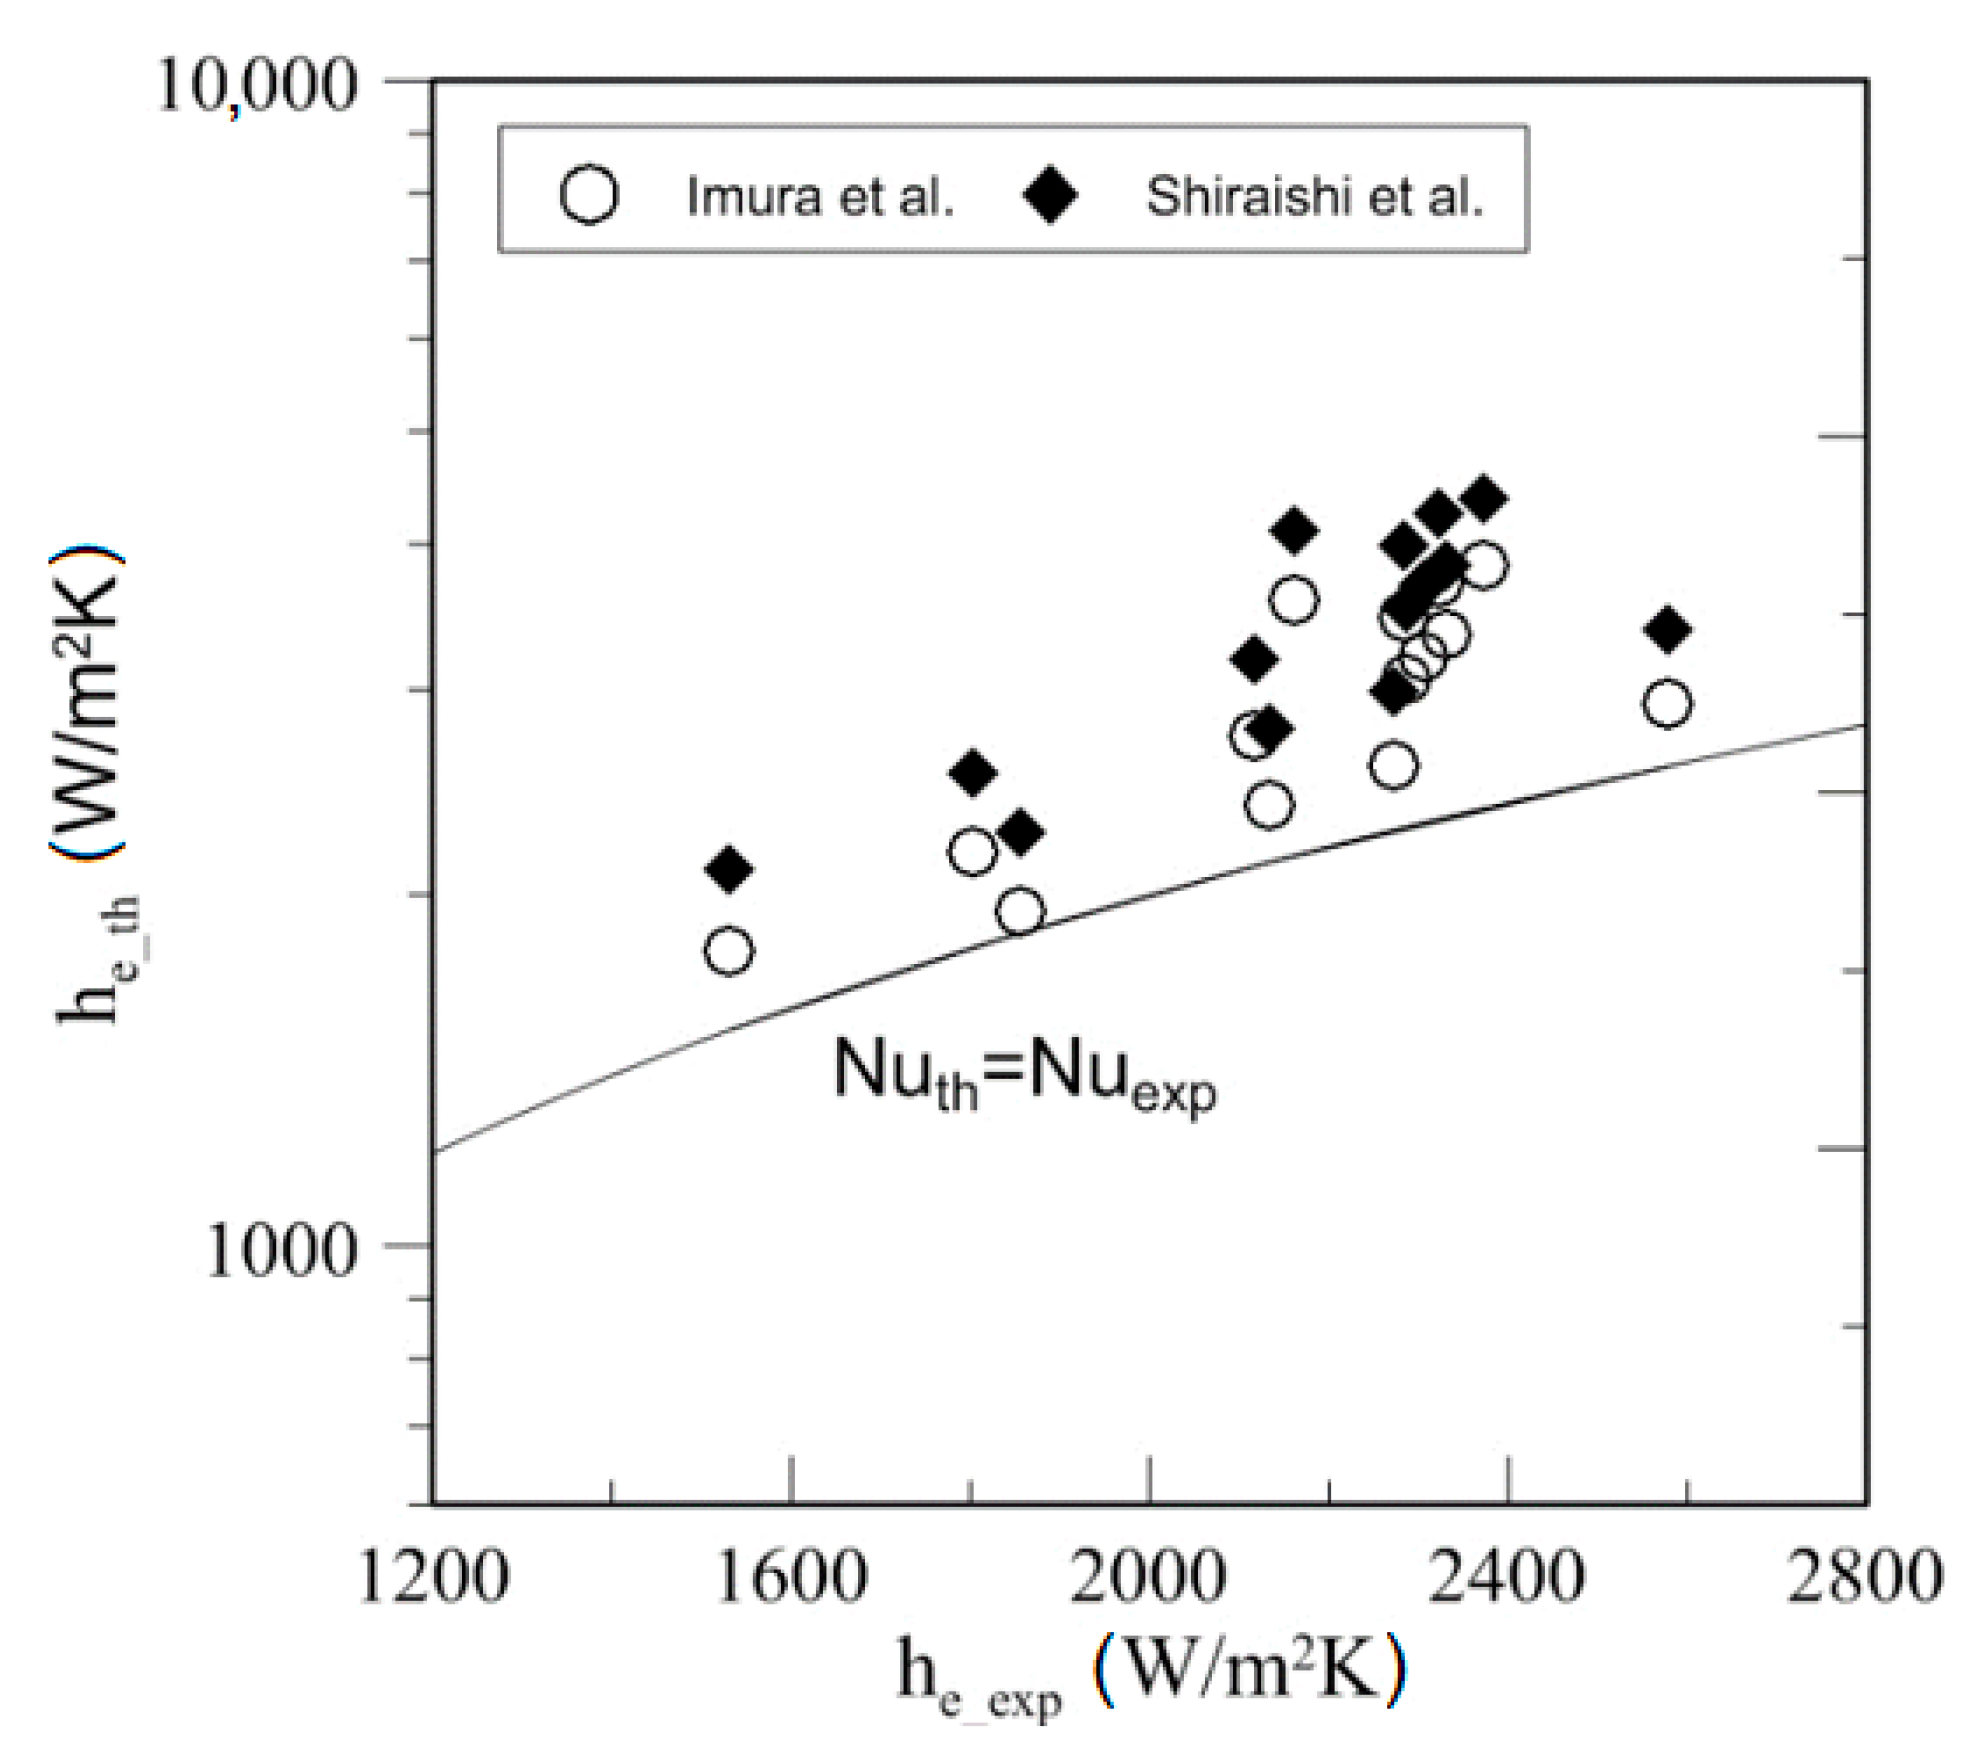
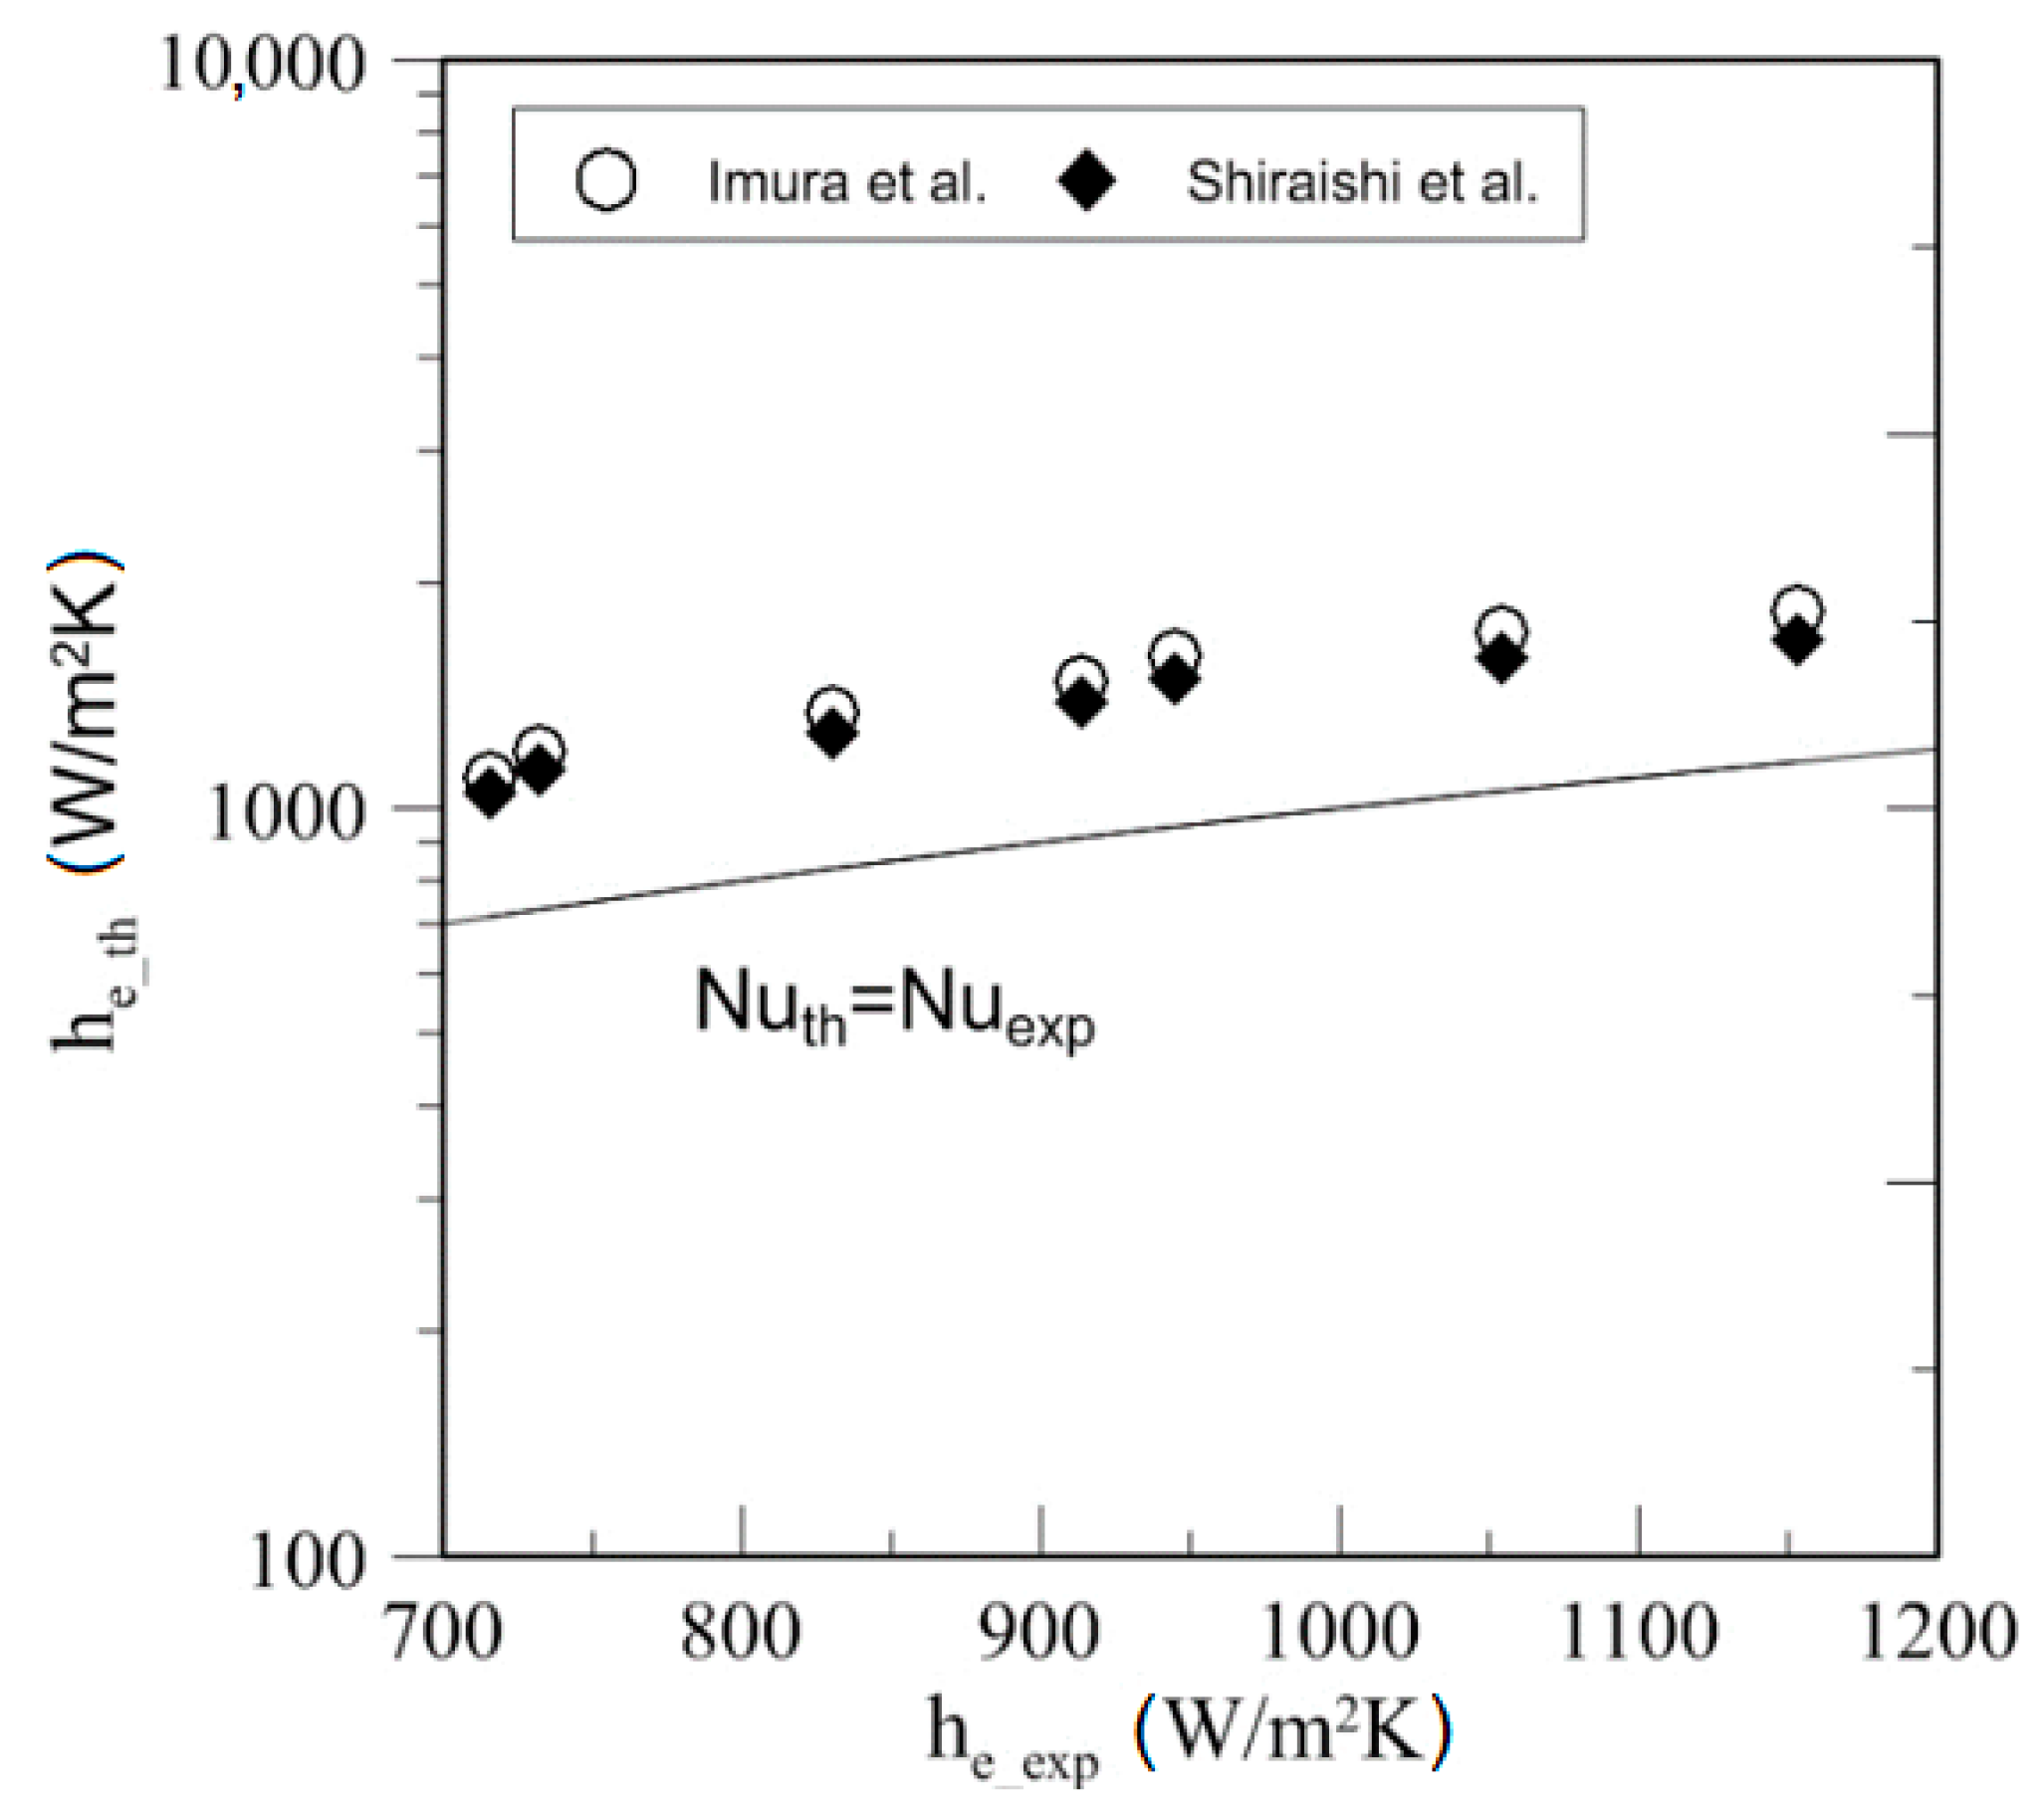
Figure 30, Figure 31 and Figure 32 present thermal resistance plotted as a function of heat power. The influences of FR and power input on thermal resistance are clearly visible. Generally, thermal resistance decreased with power input increases, and thermal resistance increased with the increase of FR. Similar experiments have been conducted by other authors. The obtained experimental results are compared with experimental results from the open literature. As can be observed (Figure 33), performance of the presented thermosyphon is comparable to other constructions, but for small heat power, most of the other investigators have shown better performance of their systems. However, it should be noted that thermal resistance rose exponentially with decreasing power and it would be difficult to decide which system would perform best for larger heat power. Therefore, in the author’s opinion there is still a need to increase the experimental data base to indicate which system would be better for a larger power input.

4.4. Heat Transfer

Experimental heat transfer coefficients were compared with two very well-known correlations from the literature (see Table 4). The result of comparison is shown in Figure 34, Figure 35 and Figure 36 and as statistics in Table 5. Despite the fact that there has been many experimental and theoretical studies conducted that focus on heat transfer in pool boiling and flow boiling, the coherency of theoretical models with experimental data is still usually no better than ±30% [35]. In many literature studies, reported coherency of theoretical models with experimental data has been no better than ±50% [36]. This is because of the complex nature of the boiling process, which is the function of many parameters (heat flux, surface conditions, wetting angle, and saturation pressure) [29,37]. As has been mentioned, in a two-phase closed thermosyphon, the boiling process could also be disturbed by additional instabilities (such as the geyser boiling effect and pressure pulsations). Based on this analysis, it could be stated that both correlations have had relatively good agreement with experimental results obtained for water and ethanol. However, there is still a need to better analyze the pool boiling process in a two-phase thermosyphon. In this analysis, the influences of instability processes of pool boiling in a two-phase closed thermosyphon should be taken into account. However, the correlation was not able to predict results for SES36. This could be explained by the fact that both of the correlations were originally developed based on experimental results for water and ethanol. Generally, Imura and Shiraisi’s correlations have over-predicted experimental results. However, it should be noted that those theoretical models were carried out for nucleation boiling conditions in a thermosyphon. Usually, this mechanism of heat transfer dominates in a thermosyphon. Meanwhile, the obtained experimental results, particularly the analysis of temperature profiles, have confirmed that higher values of heat fluxes could occur during the phenomena of transition boiling and the geyser boiling effect. In the author’s opinion, further work is needed towards the development of better correlations to predict heat transfer coefficients in TPCTs operating within nucleation and transition boiling regimes. The future correlations should also take into account instabilities regarding how the thermosyphon works (e.g., geyser boiling phenomena). A significantly larger amount of experimental data should be used to confirm good agreement with theoretical models, especially with experimental results for new perspective fluids, e.g., SES36.

5. Conclusions

In this article, the influences of different parameters on the performance of TPCTs have been presented. A literature review has shown that a majority of experimental data has been collected only for water as a working fluid. Presented work has provided a gathered database for water, ethanol, and SES36. This author has also analyzed the phase change processes that could limit the thermal characteristics of a TPCT. The results have shown that the geyser boiling effect, as well as the boiling limit, could significantly change the performance of the thermosyphon. It is very important to note that the average time to obtain steady state conditions depended on the kind of fluid and power input. Despite the fact that oscillations of parameters are often encountered for the TPCT work characteristic, the occurrence of geyser boiling could significantly increase this effect. Generally, it has been confirmed that the thermal resistance decreases with power input increases and thermal resistance rises with a rise of FR. The performance of the presented thermosyphon is comparable to other constructions. For a small heat power, most of other investigators have shown better performance of their systems, but because of the fact that thermal resistances rise exponentially with decreasing power, it is difficult to decide which system would have the best performance for larger heat powers.
A comparison of selected experimental data for the heat transfer coefficient with well-known correlations from the literature have not provided a satisfying agreement. Relatively good agreement has been found for experimental data for a thermosyphon filled with water and ethanol. Although, presented models over-predict experimental results, Imura and Shiraisi’s model was not able to predict results for SES36. It should be concluded that there is still a need to improve theoretical models for heat transfer coefficients for TPCTs. In the author’s opinion, future models should be based on a larger experimental database and also take new working fluids into account. Improved models should also take into account the limitations of operation for TPCTs. What is more, attention should be focused on the influences of operation limitations and geyser boiling phenomena under TPCT working parameters.

Funding

This research was partially funded by statuary activity of the faculty of Mechanical Engineering of Gdansk University of Technology, grant number 032466. The APC was funded by statuary activity of the faculty of Mechanical Engineering of Gdansk University of Technology, grant number 032988.

Acknowledgments

I would like to extend my thanks to the technician staff of the Department of Energy and Industry Apparatus of Mechanical Engineering of Gdansk University of Technology for their help in preparation of experimental module and instruments maintenance.

Conflicts of Interest

The author declare no conflict of interest.

Nomenclature

Aheat transfer surface area (m2)
ARaspect ratio (-)
Cpspecific heat (J/kg·K)
Dinside thermosyphon diameter (m)
FRfill ratio (-)
gacceleration due to gravity (m/s2)
hheat transfer coefficient (W/m2·K)
hfgheat of vapor (kJ/kg)
Icurrent (A)
Llength of thermosyphon (m)
MADmean absolute deviation (-)
m ˙ w cold water mass flow (kg/s)
P electric power (W)
P i n operating pressure inside thermosyphon (bar)
P a t m atmospheric pressure (Pa)
P v vapor phase pressure (Pa)
PrlPrandtl number for liquid phase (-)
ΔPpressure drop (Pa)
Q ˙ a x axial conducted heat flux (W)
Q ˙ w heat flux absorbed by cold water (W)
Q ˙ e electric heat flux (W)
qheat flux density (W/m2)
Rthermal resistance (K/W)
Scross-section area of the tube (m2)
Ttemperature (K)
T1temperature of cold end (K)
T2temperature of hot end (K)
Uvoltage (V)
wvelocity (m/s)
Wfluid heat capacity rate (W/K)
V volume (m3)
zaxial coordinate (m)
Greek symbols
ρdensity (kg/m3)
λthermal conductivity (W/m·K)
μdynamic viscosity (Pas)
Subscripts
Atmatmospheric
ad1beginning of adiabatic section
ad2end of adiabatic section
condend of condensation section
ccondenser
cucopper
evapevaporator
expexperimental
ffluid
ininlet
lliquid phase
outoutlet
satsaturation
sursurface
ththeoretical
wwater
vvapor

References

  1. Ong, K.-S.; Lim, C. Performance of water filled thermosyphons between 30–150 °C. Front. Heat Pipes 2015, 6. [Google Scholar] [CrossRef]
  2. Ong, K.S.; Goh, G.; Tshai, K.H.; Chin, W.M. Thermal resistance of a thermosyphon filled with R410A operating at low evaporator temperature. Appl. Therm. Eng. 2016, 106, 1345–1351. [Google Scholar] [CrossRef]
  3. Jouhara, H.; Robinson, A.J. Experimental investigation of small diameter two-phase closed thermosyphons charged with water, FC-84, FC-77 and FC-3283. Appl. Therm. Eng. 2010, 30, 201–211. [Google Scholar] [CrossRef] [Green Version]
  4. Ong, K.S. Effects of Inclination and Fill Ratio on R134a and R410a Thermosyphon. J. Energy Heat Mass Transf. 2011, 33, 143–152. [Google Scholar]
  5. Jafari, D.; Filippeschi, S.; Franco, A.; Di Marco, P. Unsteady experimental and numerical analysis of a two-phase closed thermosyphon at different filling ratios. Exp. Therm. Fluid Sci. 2017, 81, 164–174. [Google Scholar] [CrossRef]
  6. Heris, S.Z.; Fallahi, M.; Shanbedi, M.; Amiri, A. Heat transfer performance of two-phase closed thermosyphon with oxidized CNT/water nanofluids. Heat Mass Transf. 2016, 52, 85–93. [Google Scholar] [CrossRef]
  7. Eidan, A.A.; Najim, S.E.; Jalil, J.M. Experimental and numerical investigation of thermosyphone performance in HVAC system applications. Heat Mass Transf. 2016, 52, 2879–2893. [Google Scholar] [CrossRef]
  8. Aghel, B.; Rahimi, M.; Almasi, S. Heat-transfer enhancement of two-phase closed thermosyphon using a novel cross-flow condenser. Heat Mass Transf. 2017, 53, 765–773. [Google Scholar] [CrossRef]
  9. Wits, W.W.; te Riele, G.J. Modelling and performance of heat pipes with long evaporator sections. Heat Mass Transf. 2017, 53, 3341–3351. [Google Scholar] [CrossRef] [Green Version]
  10. Ong, K.S.; Hamlaoui, A. Experimental Observations of Water-filled and R134a-filled Thermosyphons Operating at Low Temperatures. J. Energy Heat Mass Transf. 2002, 24, 235–254. [Google Scholar]
  11. Alammar, A.A.; Al-Dadah, R.K.; Mahmoud, S.M. Experimental investigation of the influence of the geyser boiling phenomenon on the thermal performance of a two-phase closed thermosyphon. J. Clean. Prod. 2018, 172, 2531–2543. [Google Scholar] [CrossRef]
  12. Tahani, M.; Javan, S.; Biglari, M. A comprehensive study on waste heat recovery from internal combustion engines using organic Rankine cycle. Therm. Sci. 2013, 17, 611–624. [Google Scholar] [CrossRef] [Green Version]
  13. Riva, M.; Flohr, F.; Fröba, A. New fluid for high temperature applications. In International Refrigeration and Air Conditioning Conference; Purdue University: West Lafayette, IN, USA, 2006. [Google Scholar]
  14. Bell, I.H.; Quoilin, S.; Wronski, J.; Lemort, V. Coolprop: An open-source reference-quality thermophysical property library. In Proceedings of the ASME ORC 2nd International Seminar on ORC Power Systems, Rotterdam, The Netherlands, 7–8 October 2013. [Google Scholar]
  15. Zhang, L.; Zhang, Y.-F. Research on energy saving potential for dedicated ventilation systems based on heat recovery technology. Energies 2014, 7, 4261–4280. [Google Scholar] [CrossRef]
  16. Gedik, E.; Yılmaz, M.; Kurt, H. Experimental investigation on the thermal performance of heat recovery system with gravity assisted heat pipe charged with R134a and R410A. Appl. Therm. Eng. 2016, 99, 334–342. [Google Scholar] [CrossRef]
  17. Noie-Baghban, S.H.; Majideian, G.R. Waste heat recovery using heat pipe heat exchanger (HPHE) for surgery rooms in hospitals. Appl. Therm. Eng. 2000, 20, 1271–1282. [Google Scholar] [CrossRef]
  18. Jafari, D.; Franco, A.; Filippeschi, S.; Di Marco, P. Two-phase closed thermosyphons: A review of studies and solar applications. Renew. Sustain. Energy Rev. 2016, 53, 575–593. [Google Scholar] [CrossRef]
  19. Andrzejczyk, R.; Muszynski, T. Thermodynamic and geometrical characteristics of mixed convection heat transfer in the shell and coil tube heat exchanger with baffles. Appl. Therm. Eng. 2017, 121, 115–125. [Google Scholar] [CrossRef]
  20. Andrzejczyk, R.; Muszynski, T. An Experimental investigation on the effect of NEW continuous core-baffle geometry on the mixed convection heat transfer in shell and coil heat exchanger. Appl. Therm. Eng. 2018, 136, 237–251. [Google Scholar] [CrossRef]
  21. Andrzejczyk, R.; Muszynski, T.; Gosz, M. Experimental investigations on heat transfer enhancement in shell coil heat exchanger with variable baffles geometry. Chem. Eng. Process. Process Intensif. 2018, 132, 114–126. [Google Scholar] [CrossRef]
  22. Zhao, D.; Qian, X.; Gu, X.; Jajja, S.A.; Yang, R. Measurement techniques for thermal conductivity and interfacial thermal conductance of bulk and thin film materials. J. Electron. Packag. 2016, 138, 040802. [Google Scholar] [CrossRef]
  23. Jaśkiewicz, P. Pomiar przewodnictwa cieplnego i temperaturowego metali metodą Angströma. Available online: www.if.pw.edu.pl/~labfiz1p/cmsimple2_4/1instrukcje_pdf/38.pdf (accessed on 27 December 2018).
  24. Zhao, Z.; Zhang, Y.; Zhang, Y.; Zhou, Y.; Hu, H. Numerical Study on the Transient Thermal Performance of a Two-Phase Closed Thermosyphon. Energies 2018, 11, 1433. [Google Scholar] [CrossRef]
  25. Wang, D.; Liu, Z.; Shen, J.; Jiang, C.; Chen, B.; Yang, J.; Tu, Z.; Liu, W. Experimental study of the loop heat pipe with a flat disk-shaped evaporator. Exp. Therm. Fluid Sci. 2014, 57, 157–164. [Google Scholar] [CrossRef]
  26. Lin, T.F.; Lin, W.T.; Tsay, Y.L.; Wu, J.C.; Shyu, R.J. Experimental investigation of geyser boiling in an annular two-phase closed thermosyphon. Int. J. Heat Mass Transf. 1995, 38, 295–307. [Google Scholar] [CrossRef]
  27. Casarosa, C.; Latrofa, E.; Shelginski, A. The geyser effect in a two-phase thermosyphon. Int. J. Heat Mass Transf. 1983, 26, 933–941. [Google Scholar] [CrossRef]
  28. Khazaee, I.; Hosseini, R.; Noie, S.H. Experimental investigation of effective parameters and correlation of geyser boiling in a two-phase closed thermosyphon. Appl. Therm. Eng. 2010, 30, 406–412. [Google Scholar] [CrossRef]
  29. Cengel, Y.A. Introduction to Thermodynamics and Heat Transfer; McGraw-Hill: New York, NY, USA, 1997. [Google Scholar]
  30. Khazaee, I. Experimental investigation and comparison of heat transfer coefficient of a two phase closed thermosyphon. Int. J. Energy Environ. 2014, 5, 495–505. [Google Scholar]
  31. Andrzejczyk, R.; Muszyński, T. The performance of H2O, R134a, SES36, ethanol, and HFE7100 two-phase closed thermosyphons for varying operating parameters and geometry. Arch. Thermodyn. 2017, 3, 3–21. [Google Scholar] [CrossRef]
  32. Baojin, Q.; Li, Z.; Hong, X.; Yan, S. Heat transfer characteristics of titanium/water two-phase closed thermosyphon. Energy Convers. Manag. 2009, 50, 2174–2179. [Google Scholar] [CrossRef]
  33. Andrzejczyk, R.; Muszynski, T.; Dorao, C.A. Experimental investigations on adiabatic frictional pressure drops of R134a during flow in 5 mm diameter channel. Exp. Therm. Fluid Sci. 2017, 83. [Google Scholar] [CrossRef]
  34. Shabgard, H.; Xiao, B.; Faghri, A.; Gupta, R.; Weissman, W. Thermal characteristics of a closed thermosyphon under various filling conditions. Int. J. Heat Mass Transf. 2014, 70, 91–102. [Google Scholar] [CrossRef]
  35. Táboas, F.; Valles, M.; Bourouis, M.; Coronas, A. Pool boiling of ammonia/water and its pure components: Comparison of experimental data in the literature with the predictions of standard correlations. Int. J. Refrig. 2007, 30, 778–788. [Google Scholar] [CrossRef]
  36. Mahmoud, M.M.; Karayiannis, T.G. Heat transfer correlation for flow boiling in small to micro tubes. Int. J. Heat Mass Transf. 2013, 66, 553–574. [Google Scholar] [CrossRef]
  37. Kandlikar, S.; Garimella, S.; Li, D.; Colin, S.; King, M.R. Heat Transfer and Fluid Flow in Minichannels and Microchannels; Elsevier: Amsterdam, The Netherlands, 2005. [Google Scholar]
  38. Imura, H.; Sasaguchi, K.; Kozai, H.; Numata, S. Critical heat flux in a closed two-phase thermosyphon. Int. J. Heat Mass Transf. 1983, 26, 1181–1188. [Google Scholar] [CrossRef]
  39. Shiraishi, M.; Kikuchi, K.; Yamanishi, T. Investigation of heat transfer characteristics of a two-phase closed thermosyphon. In Advances in Heat Pipe Technology; Elsevier: Amsterdam, The Netherlands, 1982; pp. 95–104. [Google Scholar]
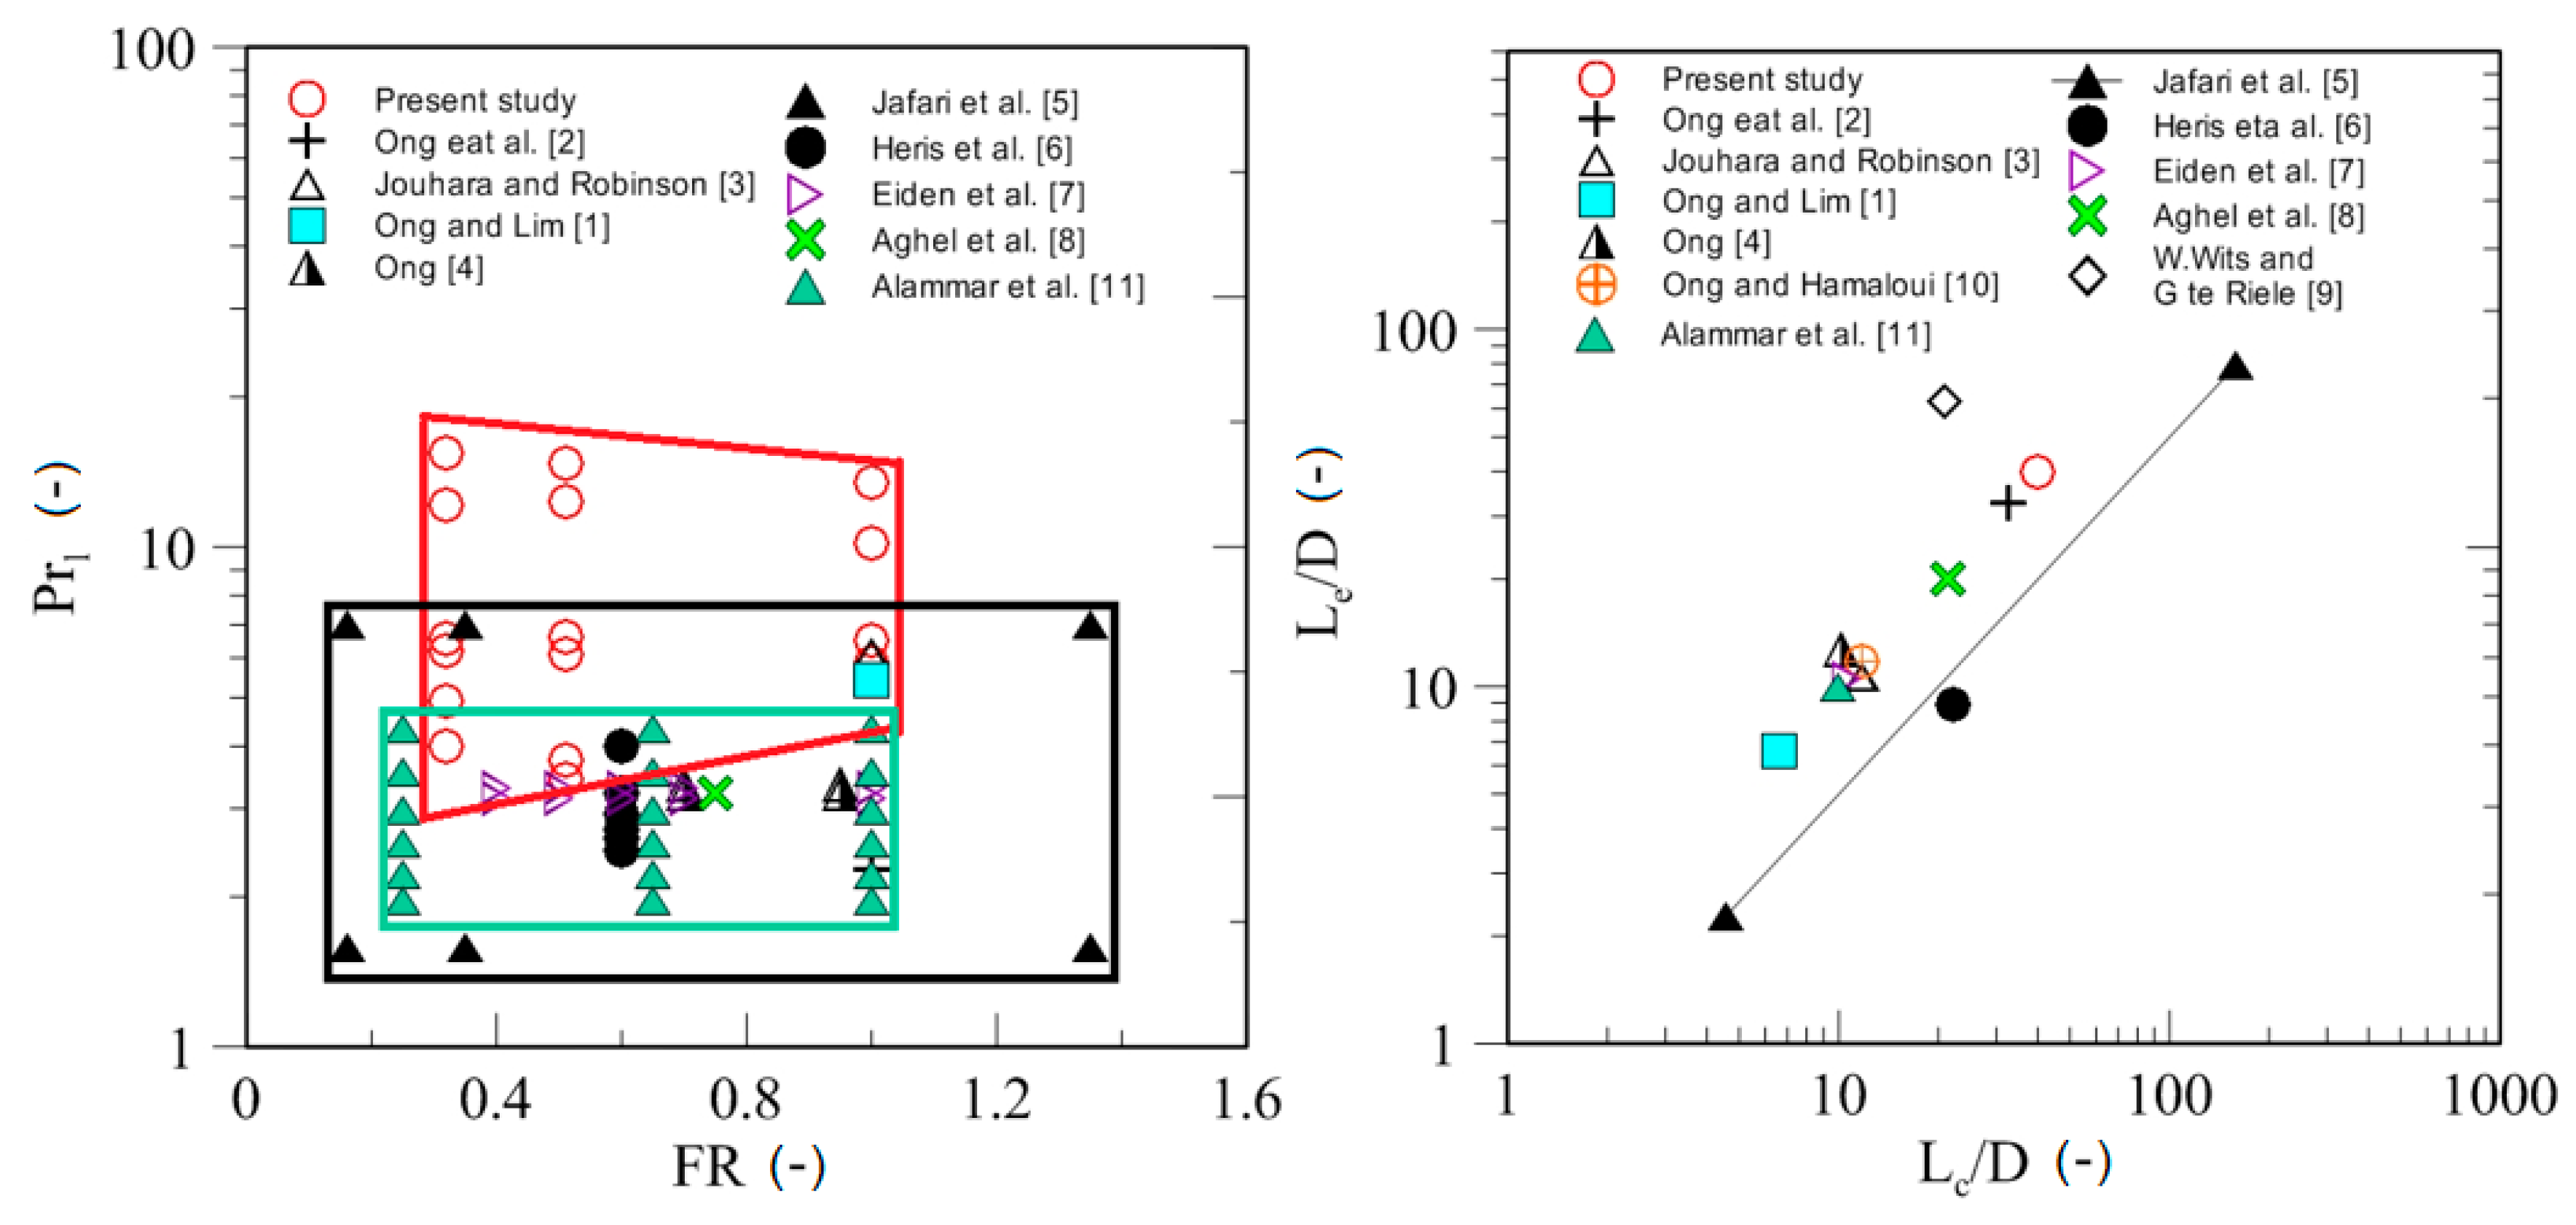
Figure 1. Comparison of the presented work’s results with other experimental studies from the literature: (left) Prandtl number vs. fill ratio, and (right) the dimensionless area ratio in the evaporator Le/D vs. the dimensionless area ratio in the condenser Lc/D.
Energies 12 00080 g001
Figure 2. The schematic diagram of test section: 1—fluid tank, 2—filter, 3—nonpulsation gear pump, 4—Coriollis mass flowmeter, 5—chiller, 6—heat exchanger, 7—evaporation section, 8—adiabatic section, and 9—condensation section.
Energies 12 00080 g002
Figure 3. Obtained construction of wickless heat pipe: (left) geometrical characteristic of thermosyphon (I—evaporator section, II—adiabatic section, III—condenser section, and IV—Schrader valve); (right) construction of the heat exchanger used as a condenser.
Energies 12 00080 g003
Figure 4. Visualization of the temperature axial profile in the pipe for the steady-state heat transfer conditions.
Energies 12 00080 g004
Figure 5. Conducted axial heat flux as a function of the temperature of the hot end of the pipe.
Energies 12 00080 g005
Figure 6. Working parameter variation as a function of time for a TPCT filled with distilled water at a filling ratio of 0.32 and heat load of 60 W: (left) temperature profile; (right) Gauge pressure profile.
Energies 12 00080 g006
Figure 7. Working parameter variation as a function of time for a TPCT filled with distilled water at a filling ratio of 0.51 and heat load of 60 W: (left) temperature profile; (right) Gauge pressure profile.
Energies 12 00080 g007
Figure 8. Working parameter variation as a function of time for a TPCT filled with distilled water at a filling ratio of 0.32 and heat load of 140 W: (left) temperature profile; (right) Gauge pressure profile.
Energies 12 00080 g008
Figure 9. Working parameter variation as a function of time for a TPCT filled with distillate water at a filling ratio of 0.51 and heat load of 140 W: (left) temperature profile; (right) Gauge pressure profile.
Energies 12 00080 g009
Figure 10. Working parameter variation as a function of time for a TPCT filled with ethanol at a filling ratio of 0.32 and heat load of 50 W: (left) temperature profile; (right) Gauge pressure profile.
Energies 12 00080 g010
Figure 11. Working parameter variation as a function of time for a TPCT filled with ethanol at a filling ratio of 0.32: (left) temperature profile for heat input equal to 120 W; (right) temperature profile for heat input equal to 180 W.
Energies 12 00080 g011
Figure 12. Working parameter variation as a function of time for a TPCT filled with ethanol at a filling ratio of 0.51 and heat load of 60 W: (left) temperature profile; (right) Gauge pressure profile.
Energies 12 00080 g012
Figure 13. Working parameter variation as a function of time for a TPCT filled with ethanol at a filling ratio of 1.0 and heat load of 50 W at a water cooling temperature of 15 °C: (left) temperature profile; (right) Gauge pressure profile.
Energies 12 00080 g013
Figure 14. Working parameter variation as a function of time for a TPCT filled with ethanol at a filling ratio of 1.0 and heat load of 50 W at a water cooling temperature of 10 °C: (left) temperature profile; (right) Gauge pressure profile.
Energies 12 00080 g014
Figure 15. Working parameter variation as a function of time for a TPCT filled with SES36 at a filling ratio of 0.51 and heat load of 50 W: (left) temperature profile; (right) Gauge pressure profile.
Energies 12 00080 g015
Figure 16. Working parameter variation as a function of time for a TPCT filled with SES36 at a filling ratio of 1.0 and heat load of 50 W: (left) temperature profile; (right) Gauge pressure profile.
Energies 12 00080 g016
Figure 17. Working parameter variation as a function of time for a TPCT filled with SES36 at a filling ratio of 0.32 and heat load of 50 W: (left) temperature profile; (right) Gauge pressure profile.
Energies 12 00080 g017
Figure 18. Working parameter variation as a function of time for TPCT filled with SES36 at a filling ratio of 0.51 and heat load of 180 W: (left) temperature profile; (right) Gauge pressure profile.
Energies 12 00080 g018
Figure 19. Working parameter variation as a function of time for a TPCT filled with SES36 at a filling ratio of 0.32 and heat load of 180 W: (left) temperature profile; (right) Gauge pressure profile.
Energies 12 00080 g019
Figure 20. Working parameter variation as a function of time for a TPCT filled with SES36 at a filling ratio of 1.0 and heat load of 180 W: (left) temperature profile; (right) Gauge pressure profile.
Energies 12 00080 g020
Figure 21. Boiling limits for a TPCT with a length of 1.2 m, inner diameter of 10 mm, and evaporator, adiabatic, and condenser section lengths equal to 400 mm: (a) water, (b) ethanol, and (c) SES 36.
Energies 12 00080 g021
Figure 22. Temperature axial profiles for various heat power inputs for a TPCT working with water at a filling ratio of 0.32: (left) for heat power inputs 50 W to 140 W; (right) for heat power inputs 160 W to 220 W.
Energies 12 00080 g022
Figure 23. Temperature axial profiles for various heat power inputs for a TPCT working with water at a filling ratio of 0.51: (left) for heat power inputs 60 W to 140 W; (right) for heat power inputs 160 W to 220 W.
Energies 12 00080 g023
Figure 24. Temperature axial profiles for various heat power inputs for a TPCT working with ethanol at a filling ratio of 0.32: (left) for heat power inputs 50 W to 140 W; (right) for heat power inputs 160 W to 300 W.
Energies 12 00080 g024
Figure 25. Temperature axial profiles for various heat power inputs for a TPCT working with ethanol at a filling ratio of 0.51: (left) for heat power inputs 50 W to 140 W; (right) for heat power inputs 160 W to 300 W.
Energies 12 00080 g025
Figure 26. Temperature axial profiles for various heat power inputs for a TPCT working with ethanol at a filling ratio of 1.0: (left) for heat power inputs 50 W to 140 W; (right) for heat power inputs 160 W to 300 W.
Energies 12 00080 g026
Figure 27. Temperature axial profiles for various heat power inputs for a TPCT working with SES36 at a filling ratio of 0.32.
Energies 12 00080 g027
Figure 28. Temperature axial profiles for various heat power inputs for a TPCT working with SES36 at a filling ratio of 0.51.
Energies 12 00080 g028
Figure 29. Temperature axial profiles for various heat power inputs for a TPCT working with SES36 at a filling ratio of 1.0.
Energies 12 00080 g029
Figure 30. Thermal resistance as a function of heating power input for a TPCT working with water at different filling ratios.
Energies 12 00080 g030
Figure 31. Thermal resistance as a function of heating power input for a TPCT working with ethanol at different filling ratios.
Energies 12 00080 g031
Figure 32. Thermal resistance as a function of heating power input for a TPCT working with SES36 at different filling ratios.
Energies 12 00080 g032
Figure 33. Comparison of the obtained thermal resistance with experimental results from the literature.
Energies 12 00080 g033
Figure 34. Predicted and experimentally determined heat transfer coefficient values in the evaporator for a TPCT with water as a working fluid and FR = 0.51.
Energies 12 00080 g034
Figure 35. Predicted and experimentally determined heat transfer coefficient values in the evaporator for a TPCT with ethanol as a working fluid and FR = 0.51.
Energies 12 00080 g035
Figure 36. Predicted and experimentally determined heat transfer coefficient values in the evaporator for a TPCT with SES36 as a working fluid and FR = 0.51.
Energies 12 00080 g036
Table 1. Experimental data regarding a two-phase closed thermosyphon.
StudyD (mm)Le (mm)Lc (mm)Le/D (-)Lc/D (-)Test Fluid, PrlFR (-)
Ong and Lim [1]19.11271276.66.6Prl = 6.6
Water
1.0
Ong et al. [2]9.531031032.632.6R410A
2.26 < Prl < 2.44
1.0
Jouhara and Robinson [3]6647010.611.7Water
Prl = 6.13
1.0
Ong [4]3240532712.710.2R134a
3.23 <Pr < 3.35
0.7
Jafari et al. [5]3579.51592.274.55Water
1.58< Prl < 7
0.16, 0.35, 1.35
Heris et al. [6]181602008.8822.22Water
2.48 < Prl < 4.0
0.6
Eidan et al. [7]14.215015010.5610.56R134a
3.15 < Prl < 3.29
0.4, 0.5, 0.6, 0.7, 1.0
Aghel et al. [8]142803002021.42Water
Prl = 3.23
0.75
W. Wits and G. te Riele [9]1275025062.520.83Water
Prl = 3.50
No data
Ong and Hamlaoui [10]25.530030011.811.8R134a0.95
Alammar et al. [11]20.22002009.99.9Water
4.32 < Prl < 7.48
0.26, 0.65, 1.0
Present study104004004040Water, Ethanol, SES36
3.42 < Prl < 15.46
0.32, 0.51, 1.0
Table 2. Selected properties of tested working fluids [14].
PropertiesUnitWaterEthanolSES36
Flash point-No flammabilityFlammableNo flammability
Toxicity-NoLow ToxicityNo
GWP (global warming potential)-0<254121
ODP (ozone depletion potential)-00None
Freezing point at normal pressure°C0−114.14−40
Boiling point at normal pressure°C99.9878.2436
Critical temperature°C373.94240.75177.6
Critical pressureMPa22.066.1482.85
Table 3. Uncertainties of selected parameters.
ParameterUnitOperating RangeUncertainty
Dimm100.003
Domm120.003
mwkg/s0.01–0.030.3%
Tw°C100.1
Tsur°C10–3000.1
Q ˙ e W10–1000±1%
hW/m2·K600–1200±2.5%
ΔPmbar2–10±0.065%
Pinmbar−9 to 4±0.5%
Table 4. A list of chosen correlations provided for calculations of the evaporation heat transfer coefficient.
CorrelationsReferences
h e = 0.32 ( ρ l 0.65 λ l 0.3 C p l 0.7 g 0.2 ρ v 0.25 h f g 0.4 μ l 0.1 ) ( P v P a t m ) 0.3 q 0.4 Imura et al. [38]
h e = 0.32 ( ρ l 0.65 λ l 0.3 C p l 0.7 g 0.2 ρ v 0.25 h f g 0.4 μ l 0.1 ) ( P v P a t m ) 0.23 q   0.4 Shiraishi et al. [39]
Table 5. Results of the statistical analysis of the prediction of heat transfer coefficient in the evaporation section for different fluids with FR = 0.51.
Kind of FluidSourceMAD (%)% of Data within 50%
WaterImura et al. [38]14.99100
Shiraishi et al. [39]24.28100
EthanolImura et al. [38]14.7275
Shiraishi et al. [39]22.3775
SES36Imura et al. [38]61.2230
Shiraishi et al. [39]50.8930

