Abstract
Many rock engineering accidents have proven that the coalescence of discontinuities in surrounding rock can have a major impact on the security and stable operation of energy infrastructure. To give an insight into the understanding of the crack propagation and coalescence in fissured rock masses, a series of uniaxial compression experiments were conducted on rock-like specimens containing nonpersistent fissures. The digital speckle correlation method (DSCM) and the acoustic emission (AE) monitoring system were adopted to capture the real-time strain field on the specimens’ surfaces and microfracturing events within specimens, respectively. The experimental results indicated that the strength and deformation modulus of specimens were significantly affected by fissure inclination. The damage process showed obvious progressive stain localization failure characteristics. The clear and intuitive full-field strain field development was successfully monitored by the DSCM technique. The real-time strain accumulation, crack initiation, propagation, and coalescence were also analyzed. Each time, the saltation of the strain field was usually accompanied by the fluctuation of the stress curve and obvious AE events. Crack coalescence modes between fissures changed from tension coalescence mode to mixed tension-shear coalescence mode, then to shear coalescence mode with an increase in fissure inclination. Five basic failure modes were identified from the experimental results: Tensile failure across the fissure planes, rotation failure of newly generated blocks, mixed failure mode, shear failure, and splitting failure. An investigation of the fracture processes of rock-like specimens containing nonpersistent fissures using these methods can enhance understanding of the fracture behavior of jointed rocks.
1. Introduction
The stability of surrounding rock is crucial for the security and stable operation of rock engineering, such as underground space development, reservoir engineering, slope projects, and mining engineering. As a common complicated geological mass, many discontinuities with variant scales distributed in the rock mass are a result of geological structure or engineering influence, which causes the mechanical behavior of a rock mass to show as discontinuous, heterogeneous, and strongly anisotropic. When a disturbed load (causing by crustal stress, blasting, or excavation unloading) is applied [1,2], new cracks are readily initiated and propagated, sometimes coalescing with other cracks. The coalescence between fissures will lead to damage or even failure of the rock mass. Many rock mass engineering accidents have derived from the coalescence of discontinuities in surrounding rock [3,4]. Figure 1a shows a pillar failure in an underground mine caused by coalescence along two pre-existing fissures. Figure 1b shows a step failure observed near the headscarp of the Aishihik River Landslide, and Figure 1c shows rock slope stability that is discontinuity-controlled. Therefore, extensive experimental studies have been conducted on brittle rock or rock-like specimens containing pre-existing fissures [5,6,7,8,9] to investigate crack initiation, propagation, and coalescence. The common crack patterns [10] observed in previous investigations of rock and rock-like specimens containing one single pre-existing fissure under uniaxial compression are summarized as follows: (1) Wing cracks initiate from the tips of fissures and propagate toward the direction of maximum compressive stress with increasing load; (2) secondary cracks also initiate from the tips of fissures and propagate coplanarly or nearly coplanarly to the fissure or with an angle similar to the wing cracks but in the opposite direction.
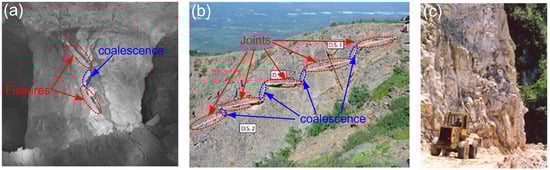
Figure 1.
Jointed rock mass. (a) Two pre-existing fissures in a pillar [10]; (b) step failure on a slope [11]; and (c) multiple closely spaced discontinuities [12].
In addition to the study of crack initiation and propagation of a single fissure, the coalescence behavior of cracks when specimens contain more than one fissure has also been extensively studied, mainly by compression experiments or numerical simulations on specimens with two or three pre-existing fissures [13,14,15,16,17,18,19,20,21]. Previous studies have shown that the coalescence often occurs by the linkage of two fissures through tensile, shear, or mixed tensile-shear cracks, and the patterns of crack coalesce are found to be strongly dependent on the geometry of the fissures.
Although significant improvements have been obtained for the understanding of the crack coalescence pattern of specimens containing few fissures, the fissures contained in engineering rock masses often appear in groups with similar orientation and characteristics. The crack behavior of a specimen containing multiple fissures becomes more complex as the high number of fissures provides more possible coalescences. Sagong and Bobet [22] performed a compression on gypsum specimens with 3 and 16 fissures, and the comparison results showed that the cracking pattern in specimens with multiple fissures was similar to the specimen with two fissures. Prudencio and Van Sint Jan [23] observed three main failure modes in biaxial tests with specimens containing nonpersistent joints and indicated the failure modes and maximum strengths were dependent on joint systems geometry. Based on the experimental results [23], Bahaaddini et al. [24] carried out a numerical simulation to study the effects of joint geometric parameters on the failure mechanism and mechanical properties of rock mass containing nonpersistent joints. Their numerical results showed that the failure mode was controlled by fissures inclination and step angle and the angle between respect fissures and principal stress direction. Chen [25] experimentally investigated the deformation behavior of jointed rock masses for gypsum specimens and claimed that deformation behavior is related to the closing of fissures, the fracture process, and shear rupture along the shear plane. Using PFC3D software (4.0, Itasca Consulting Group, Minnesota, MN, USA), Fan et al. [26] investigated the effect of nonpersistent joints on macromechanical behavior of a jointed rock block and demonstrated that the joint dip angle and joint continuity factor played an important role on strength and the deformability modulus of jointed rock blocks. Gui et al. [27] performed numerical simulations to study the influence of openings on rock mechanical behavior: The effect of size, alignment, orientation, shape, and opening ratio of openings on the mechanical behavior were investigated. Meanwhile, the impact of joint geometry and arrangement on the strength and deformability of jointed rock masses were also symmetrically investigated [28,29,30,31].
Previous work has promoted understanding of the mechanical behavior and crack behaviors of rock masses containing nonpersistent fissures. However, most experimental studies have mainly estimated the fracture process, including the statistical description of cracks from photographs on a macro scale or using strain gauges to measuring small changes in specimen deformation near the crack. The strain field development of the specimens, which is crucial in revealing the mechanism of fracture behavior and the failure process under compression, cannot be easily obtained from traditional monitoring methods. Digital image correlation (DIC) is an optical noncontact deformation measurement technique that can be used to monitor full-field strain evolution on a specimen surface during the deformation process [32]. Compared to the traditional contact measurement technique (such as a displacement extensometer, photoelastic coating, and a strain gauge), it has many advantages: It is convenient and avoids local stress disturbance in direct contact measurements. Additionally, DIC can capture the propagation of a secondary crack, which is difficult to observe by traditional methods because the secondary crack remains closed after initiation [22]. Thus, DIC has been widely used in fields such as materials testing, fracture mechanics, and project monitoring [33,34,35,36]. High-resolution DIC was applied by Carroll et al. [37] to obtain the strain fields of fatigue crack growth in an alloy at the grain level. Zhao et al. [38,39] combined 3D-DIC with numerical simulation to investigate the fracture process of artificial rock-like specimens with an open hole or double flaws under uniaxial compression. Li et al. [40] employed DIC to investigate the influence of pre-existing holes with different geometries on the strength and fracture behavior of specimens containing a hole during a uniaxial compression test. However, despite numerous previous studies using DIC to investigate the fracture processes in rocks, due to the complexity of fissure distribution, research about the use of DIC to detect real-time full-field strain development of specimens containing a set of pre-existing parallel fissures has been rarely reported.
This study adopted the digital speckle correlation method (DSCM) and acoustic emission (AE) techniques to detect the fracture processes of specimens containing a set of parallel fissures with different fissure inclinations. The characteristics of the full-field strain field development, acoustic emission, mechanical characteristics, and crack coalescence patterns during the loading process were analyzed. The structure of this paper is as follows. The preparation of the uniaxial compression experiment on rock-like specimens containing nonpersistent fissures is introduced in Section 2. In Section 3.1, the effect of fissure inclination on specimens’ mechanical behavior and deformation characteristics are investigated. In Section 3.2, the crack coalescence patterns and failure modes of specimens with various fissure inclinations are analyzed and categorized. In Section 3.3, the strain field development and AE event characters under uniaxial loading associated with different failure modes are analyzed to enhance understanding of the basics of the fracture processes. Section 4 summarizes and discusses the characteristics of nonpersistent fissures on AE characteristics and strain field. The main conclusions of this study are presented at the end of the paper.
2. Experimental Testing
2.1. Rock-Like Specimens with Nonpersistent Fissures for the Experiment
It is difficult to investigate the rock fracture process at an engineering scale. Therefore, real rock and rock-like materials are usually adopted in the investigation of rock fracture behavior in a laboratory. Gypsum has proven to be a good rock-like material for rock mechanics experiments and for investigating crack behavior [13,14,22,28]. In our experiments, gypsum was used to simulate rock behavior. The mixture used as the rock-like material in this study was composed of gypsum, aqueous solution with 0.5% antifoaming agent, and silica sand at a weight ratio of 10:6:1. The physics and mechanical properties of the rock-like material and natural sandstone are shown in Table 1. The comparison indicated that the similar material has similar mechanical properties to sandstone, which is suitable in simulating real rock.

Table 1.
Physics and mechanical properties of rock-like material.
The dimensions of the cuboid specimens were 160 × 80 × 50 mm (high × wide × thickness). This study mainly focused on the effects of the fissure inclination on crack behavior, mechanical properties, and failure modes. In the fissured region, the fissure inclination had a range of 0° to 90°, and other joints parameters were fixed. The geometrical parameters and fissures arrangement of the test specimens are shown in Figure 2. Pre-existing fissures were created by inserting 0.6-mm-thick alloy bars into pre-cut slots in the mold (Figure 3c) and pulling them out after the solidification started.
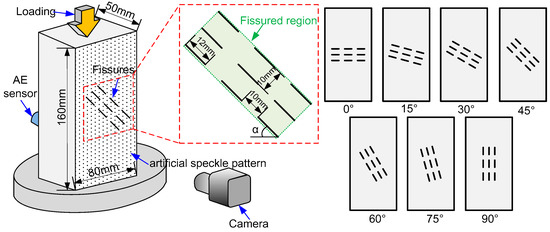
Figure 2.
Geometrical parameters and fissure arrangement of the specimens.
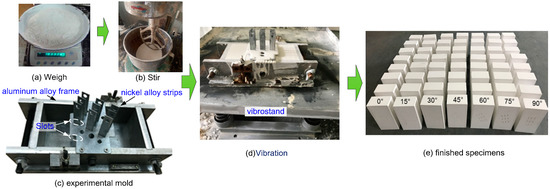
Figure 3.
Preparation of rock-like rock specimens containing a set of pre-existing parallel fissures inclined in various directions. (a) weigh; (b) stir; (c) experimental mold; (d) vibration and (e) finished specimens.
The specimen preparation procedures were carefully controlled to obtain reliable experiment results. The weighed modeling materials were first mixed in a blender (Figure 3a,b). Next, the mixture was poured into a mold and placed on a vibration table (Figure 3d) until there were no obvious signs of bubbles. After the mixture became solidified, the strips were pulled out slowly, and the specimens were removed from the mold. Finally, the specimens were cured a minimum of 20 days before the test at room temperature. At least 3 specimens with the same inclination were prepared to get the stable data. If there was an obvious difference in the results of two identical tests, a third specimen was tested. The finished specimens are shown in Figure 3d.
2.2. Testing System
The uniaxial compressive experiment of the specimens containing nonpersistent fissures was performed at the testing system in the State Key Laboratory for Geomechanics and Deep Underground Engineering, China University of Mining and Technology, as shown in Figure 4. A mechanic servo-controlled loading system (CMT5305, MTS Industrial Systems Company, Shenzhen, China) with a maximum loading capacity of 300 kN was used for the uniaxial compressive experiments, the loading mode was displacement control loading, and the loading rate was 0.06 mm/min, which could ensure a quasistatic loading condition.
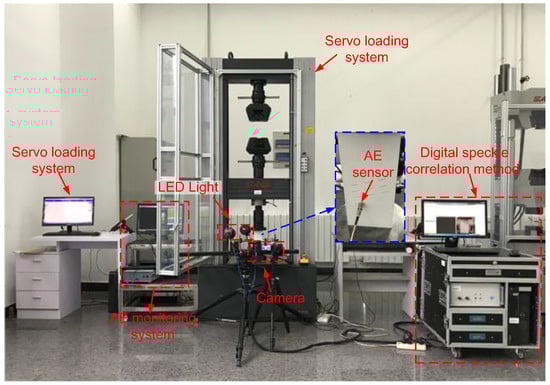
Figure 4.
Testing system for the specimens containing nonpersistent fissures in the uniaxial compressive experiment.
To obtain the real-time fracture evolution process, an optical noncontact deformation measurement system (XTOP 3D Technology Company, Shenzhen, China), “XTDIC”, was adopted to capture the strain field over the course of the loading process. This system was a DSCM consisting of a digital camera and a data processing system. The high-precision digital camera was used to collect the speckle images of the specimens during the experiment. By analyzing the speckle images of specimens before and after surface deformation by image matching, the displacement field was obtained by tracking the movement of geometric points on the specimen surface. To improve the image recognition degree, black paint was randomly sprayed on a clean surface of the gypsum specimen to produce an artificial speckle pattern. Note that the speckle particles were to be randomly distributed and uniform in size. During DSCM application, a region of interest (ROI) was selected and then discretized into small virtual subsets. Image correlation was to match the small square subsets of the underformed image with the position in the deformed surface image, as shown in Figure 5. Point p and q in the reference image with coordinates (x, y) were mapped to point p* and q* in the image after deformation with coordinates (x*, y*), respectively.
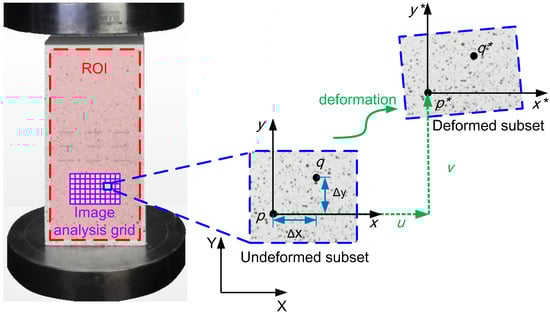
Figure 5.
Basic principles of the digital speckle correlation method.
The relation function between the two coordinates [41] could be performed as
where u, v, , are six deformation parameters; and u and v are the displacement of initial tip position relative to the (x, y) coordinate system.
At the same time, the AE events were monitored by using an AE monitoring system (PCI-Ⅱ, Physical Acoustic Corporation, Princeton, NJ, USA) to identify microfracturing of specimens during uniaxial compression. In this experiment, an acoustic emission probe (Physical Acoustic Corporation, Princeton, NJ, USA) was attached to the back of the specimens, and the frequency of the AE system was set to 3 MHz.
3. Analysis of Experimental Results
3.1. Effect of Fissure Inclinations on Mechanical Behavior
Figure 6 shows the complete axial stress–strain curves for intact specimens and specimens with different fissure inclinations under uniaxial compression. It can be seen that the characteristics of the stress–strain curves varied due to the influence of the fissure inclination, and the mechanical behavior of the specimen with α = 90° was similar to the intact specimen. Based on a characteristic analysis of the curves, except for the specimen with α = 90°, the remaining curves existed a stress fluctuation before peak strength. This was mainly due to microcrack initiation in fissure tips during the loading process: The new crack’s initiation resulted in local stress adjustment and caused the stress–strain curve to fall. However, the effect of this phenomenon on the integral forced status of the specimen was limited. Thus, the stress curve increased again, and then the stress–strain curve fluctuated before peak strength. AE counts began to appear stable after this point. Combined with AE count characteristics and strain field development, this point was identified as the crack initiation point: The stress at this point was considered to be the crack initiation stress point. Crack initiation represents the stress level where microfracturing begins, and it is especially important to reveal the failure mechanism of jointed rock to reduce engineering disasters related to rock fracturing [42,43]. Many methods have been used to determine the crack initiation stress of brittle rocks under uniaxial compression, such as the volumetric strain-based method [44], the crack volumetric strain method [3], and the volumetric stiffness method [45]. In our study, the combination of the DSCM technique and the AE monitoring system successfully identified crack initiation in jointed rock from aspects of AE events, the strain field, and the stress-strain curve. In addition to the specimen of α = 90°, the overall stages of the stress–strain curves during the complete failure process could be divided into the following four stages based on curve sharpness and AE characteristics: namely, the stages of initial compaction, linear elastic deformation, nonlinear deformation, and post-peak failure, as shown in Figure 7.
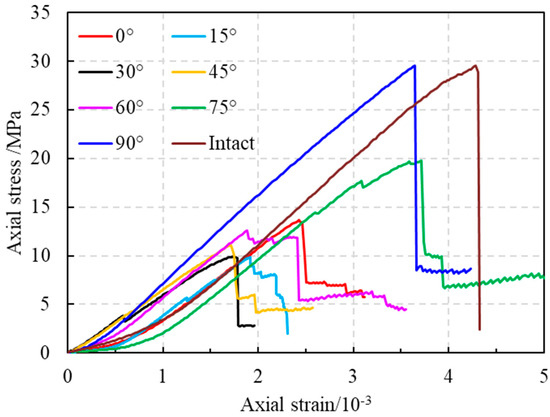
Figure 6.
Stress–strain curves of specimens.
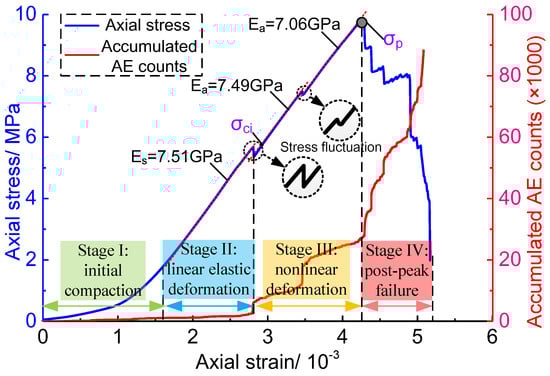
Figure 7.
Characteristics of the stress–strain curve and accumulated acoustic emission (AE) counts of the specimen with α = 15°.
Figure 8 displays the strength variation of specimens containing different inclinations of nonpersistent fissures. It can be seen that the fissure inclinations had a significant effect on the strength behavior of the specimens. The peak strength initially decreased, and then increased as fissure inclination increased in the range from 0° to 90°: 9.05 MPa was the minimum strength at α = 30°, and 28.2 MPa was the maximum strength at α = 90°.
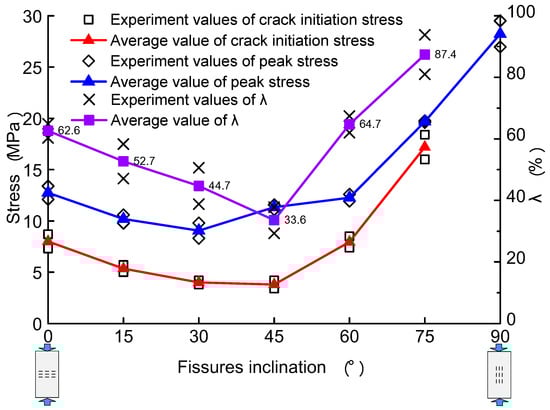
Figure 8.
Influence of the fissure inclination on crack initiation stress and peak stress of the specimens containing nonpersistent fissures.
Figure 8 also shows the change rule of crack initiation stress magnitude with the variety of fissure inclinations. As with the intact specimen, with the specimen with α = 90° split directly at the peak point, the crack initiation phenomenon did not appear before the peak strength, and therefore the crack initiation stress of the specimen with α = 90° was not considered. It can be seen from the curve that the crack initiation stress of the specimens first decreased and then increased as fissure inclinations increased from 0° to 90°. However, unlike the peak strength, the minimum crack initiation stress was 3.8 MPa at α = 45°.
Here, the crack initiation stress coefficient λ is introduced, namely the ratio of crack initiation stress to the peak strength,
where σci is the crack initiation stress (MPa) and σp is the peak strength (MPa).
The trends in Figure 8 show that the crack initiation stress coefficient decreased by increasing the fissure inclinations from 0° to 45°, which indicated that the specimen containing fissures with α = 45° was the easiest for crack initiation. In addition, this crack initiation stress coefficient increased by increasing the fissure inclinations from 45°to 90°. A comparative analysis of the crack initiation stress coefficient showed that there was a certain relationship between peak strength and crack initiation stress, that the higher the crack initiation stress, the higher the peak strength, as shown in Figure 8. This demonstrates that by suppressing the microcrack initiation before peak strength, the bearing capacity of the specimen can be improved, and gives guidance in improving the bearing capacity of jointed surrounding rock during engineering.
The pre-existing fissures also had an impact on the deformational characteristics of the specimens. Figure 9 shows the influence of fissure inclinations on elastic modulus under uniaxial compression. The elastic modulus Es was defined as the slope of the linear segment before the crack initiation in the stress–strain curve. The trend of Es was basically the same as the peak strength, i.e., Es first decreased from 0° to 30° and then increased, with a minimum of 6.7 GPa at 30° and a maximum of 8.0 GPa at 90°. It should be noted that the strain–stress curves of specimens may experience multiple stress fluctuations when entering the nonlinear deformation stage after the crack initiation, as shown in Figure 6. Each stress fluctuation in the stress-strain curve will lead to a stress redistribution within the specimen. The influence of initial microcrack initiation and propagation has limited effects on the overall load-bearing structure of specimens, but will lead to structural damage of the specimen. As seen from Figure 7, the average modulus was slightly less than the previous period.
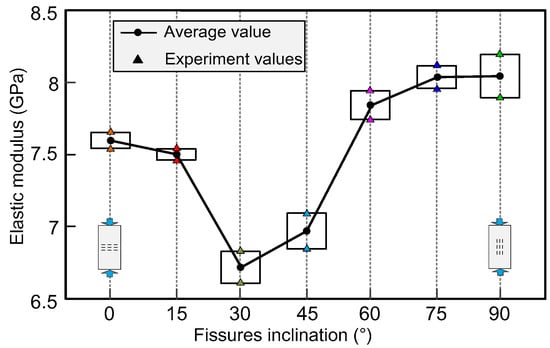
Figure 9.
Effects of the fissure inclinations on the elastic modulus of specimens containing nonpersistent fissures.
3.2. Effect of Fissure Inclinations on Crack Coalescence Patterns and Failure Modes
3.2.1. Crack Coalescence Patterns
For specimens containing more than one fissure, coalescence occurs when two initial fissures are connected through a newly formed crack. In specimens with multiple fissures, the coalescences become more complex. Figure 10 shows a sketch of different crack types that were identified based on their morphology, failure modes, and propagation mechanism in granite specimens containing a single fissure [46] and were used for analyzing the crack coalescence patterns of specimens containing two fissures [47]. Here, these crack patterns could be used as a reference for analyzing the propagation and coalescence pattern of specimens in this experiment.
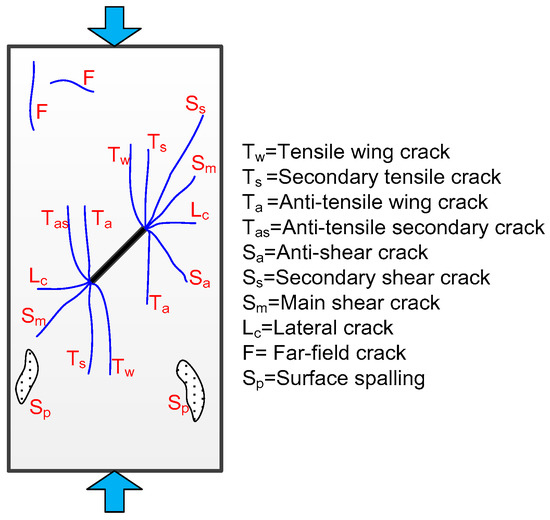
Figure 10.
A sketch of the initiated crack classifications of specimens containing fissures (modified from Yang and Jing [46] and Yang et al. [47]).
Table 2 summarizes the crack coalescence patterns on the back of the rock-like specimens containing nonpersistent fissures under uniaxial compression based on the classification. It could be concluded that the final macrofracture patterns of specimens containing nonpersistent fissures were all a mixture of various crack types, which were much more complicated than those in specimens containing few fissures. Tensile wing crack was always the first crack to initiate in our specimens, and it often initiated from the tips of pre-existing fissures that were near the specimen end, except for specimens with α = 0° and 90°. Note that most of the cracks outside the fissured region were tensile cracks, and the crack types within the fissured region were closely related to fissure inclinations. The main crack coalescence pattern changed from tensile crack to a mixture coalescence, and then to shear crack coalescence with the increase in fissure inclination.
Table 2.
Crack coalescence patterns on the back of the specimens’ backs.
3.2.2. Failure Modes
As mentioned previously, pre-existing fissure inclinations play an important role in the failure behavior of specimens: The failure modes of the specimens are shown in Table 2 Five dominant failure modes could be classified according to crack coalescence modes with the pre-existing fissures and the failure process of specimens, as shown in Figure 11.
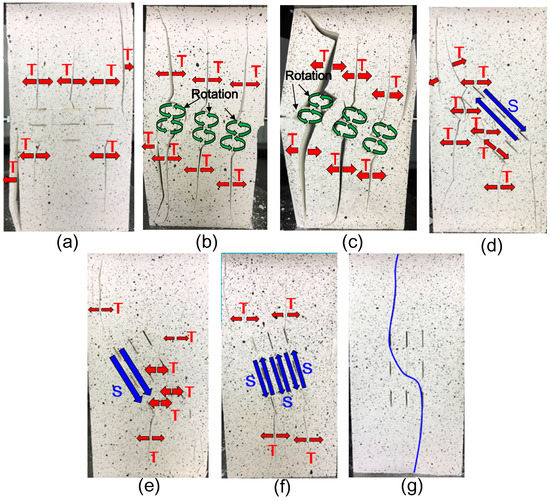
Figure 11.
Five failure modes. (a) Tensile failure across the fissure planes; (b,c) rotation failure of newly generated blocks; (d) mix failure mode; (e,f) shear failure; (g) splitting failure.
- Failure mode I (tensile failure across the fissure planes): This failure mode only appeared in the specimen with α = 0°. Mechanically, the formation of this type of failure mode was due to the production of tensile stresses within the central surface of open-type fissures under loading conditions and subsequent initiation of tensile cracks near the central fissure. With the propagation of wing cracks to the upper and lower end face, macrotensile cracks went through the entire specimen. The increasing tensile crack apertures led to the bending failure of rock near the free surface (Figure 11a). This failure mode was categorized as tensile failure across the fissure planes [28].
- Failure mode II (rotation failure of newly generated blocks): For specimens with α = 15° and 30°, as axial compression stress increased, wing cracks developed from pre-existing fissure tips. The wing cracks of parallel fissures coalesced and cut out a newly generated block that could rotate. The strength of this failure model was controlled by the rotation of the block (Figure 11b,c) and was smaller than the strength of the other failure modes. Note that, although the final crack coalescence in a horizontal rock bridge for specimens with α = 30° was similar to “stepped failure modes”, as reported by Prudencio and Van Sint Jan [23], the final failure of the core bearing structure was still categorized as a rotation failure of newly generated blocks.
- Failure mode III (mix failure mode): When the fissure inclinations approached 45°, the load increased, and tensile wing cracks were propagated to link the parallel fissures tips. Some shear cracks were propagated along the inclined direction to interact with the coplanar fissures (Figure 11d,e). Thus the macro failure pattern was a mixture of shear failure and tension failure, and this failure phenomenon could be classified as a mixed failure.
- Failure mode IV (shear failure): At α = 60° and 75°, the shear crack initiated from the fissure tip and propagated through the intervening rock bridge until it coalesced with the adjacent coplanar crack tip, finally forming a macro shear plane along the fissure plane. This failure mode was classified as shear failure (Figure 11e,f). Even though there was wing crack coalescence in specimens with α = 60° during loading, shear cracks played a key role in the final failure mode.
- Failure mode V (splitting failure): When fissure inclination reached 90°, the specimen finally failed due to splitting failure, as shown in Figure 11g. Note that, although a macro failure plane crossed through pre-existing fissures, the failure process showed that the influence of pre-existing fissures with α = 90° on the failure process could be neglected. Therefore, this failure mode was classified as a splitting failure.
3.3. Fracture Evolution Process
The experimental results proved that the final failure modes could be divided into five patterns. Using 0°, 30°, 60°, 75°, and 90° fissure inclinations, the fracture evolution process was analyzed based on the strain field of specimens combined with curves of stress, AE counts, and accumulated AE counts over time. Note that the black areas of the strain fields were due to the failure of subsets caused by macrocrack or surface spalling on specimen surfaces during crack propagation. For the convenience of comparative analysis, the fissures are marked ①~⑨.
3.3.1. Tensile Failure across the Fissure Planes
The curves of stress and acoustic emission characteristics during the loading period for α = 0° are shown in Figure 12. The strain field of point (a) was used as the reference image to which the subsequent photographs (points b–h) were correlated. The stress curve of the specimen initially showed nonlinear deformation, which usually resulted from the closure of open microcracks. The stress curve was smooth, and acoustic emission characteristics were not obvious. Along with the load increases, the strain concentration zone began to form near the center of the right fissures, as shown in Figure 13b. This was due to loading, which could easily lead to the appearance of tensile stress in the center of open fissures. The strain concentration zone initially only appeared in the right side, possibly due to the slight prominence of the top and bottom of the specimens on the right side, causing stress concentration on the right side during the initial stage.
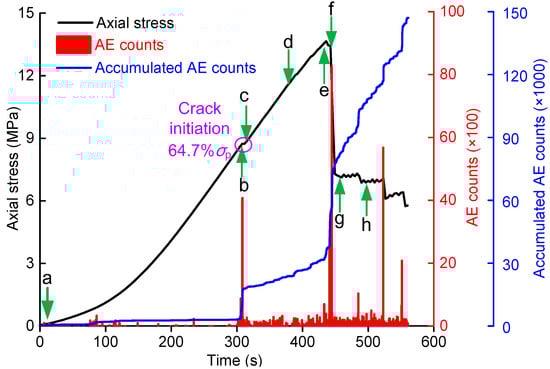
Figure 12.
Characteristics of stress and acoustic emissions during the loading process (α = 0°).
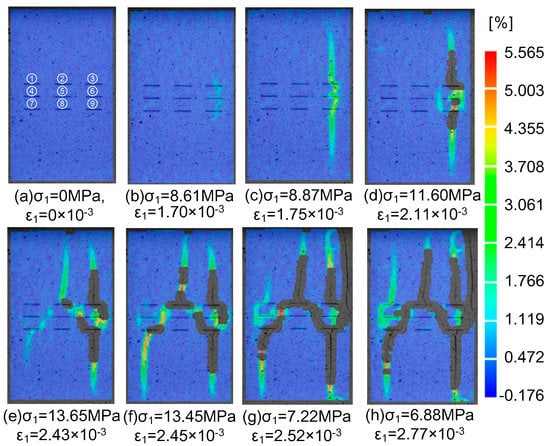
Figure 13.
Evolution of strain fields for the specimen with α = 0° corresponding to points (a–h) in Figure 12.
When the specimen was loaded to 64.7% σp, the stress curve had a little fluctuation, and evident AE events occurred at the same time. It could be observed from the strain field that the strain concentration zone in the right joints coalesced, and that the cracks initiated from the center of the right fissures and propagated to the top and bottom edge of the specimen. The time between points (b) and (c) was approximately 0.3 s, indicating that the new crack growth was rapid. The AE counts started to appear more frequently than before, which meant the crack began to propagate from this point, and therefore this point could be considered to be the crack initiation point.
Then, the load continued to increase, the crack of the right fissures continued to propagate, and the strain concentration zone appeared on the left side of the right fissures, as shown in Figure 13d. When the axial stress reached the peak stress point (e), the crack initiated from the center of fissure ② and propagated toward the top edge of the specimen; the strain concentration zone between fissure ② and fissure ⑨ coalesced, and macrocracks appeared; this led to a slight drop in the stress curve. The strain concentration zone appeared in the center of fissure ⑦ and propagated toward the bottom edge of the specimen, and the strain concentration zone appeared between the right tip of fissure ⑦ and the left tip of fissure ③. At the point (f) just after the peak stress, the stress curve had a large drop and associated with obvious AE counts: It can be seen from the strain field that the crack initiated from the center of fissure ⑦ experienced rapid crack propagation. In the stage of post-peak stress softening, the tension cracks in the upper and lower fissures continued to extend toward the end surface of the specimen; the upper right side of the specimen began to spall; and the specimen gradually lost its bearing capacity, as shown in Figure 13g,h.
3.3.2. Rotation Failure of Newly Generated Blocks
The curves of stress and acoustic emission characteristics during the loading period for α = 30° are shown in Figure 14. Point (a) in the strain field (Figure 15a) is the reference image. As shown in Figure 15b, the strain concentration zone began to form near the fissure tips with the increasing load, but the stress concentration at the fissure tips did not exceed the material strength, and therefore there was no crack initiation. When the load came to 3.8 MPa (38.8% σp), the obvious wing crack (Figure 15c) rapidly initiated along the direction of axial loading from the left fissure tips of fissures ①② and the right tips of fissures ⑧⑨, which caused a drop in the stress curve, and the strain concentration degree of the tips of fissures ③④⑤⑥ grew after the first stress drop. After point (c), with the axial stress continuing to increase, the strain concentration zones at the left tip of fissure ③ and the right tip of fissure ⑦ developed into wing crack and propagated gradually to the edge of the specimen, as shown in Figure 15d–g. When the specimen was loaded to peak stress, the newly separated blocks between adjacent noncollinear fissures were cutting out, with the wing crack between fissures coalesced, and the specimen gradually lost its bearing capacity with the wing crack initiated from the upper and lower fissure tips propagating to the end face, as shown in Figure 15h. The increasing load led to the rotation of newly generated blocks, which finally resulted in the failure of the specimen, as shown in Figure 11c. Due to the failure of the image analysis grid caused by the block rotation, the strain-field developments after the peak strength were difficult to obtain in the final failure.
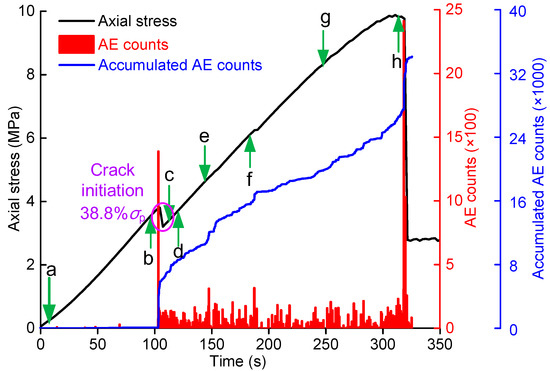
Figure 14.
Characteristics of stress and acoustic emissions during the loading process (α = 30°).
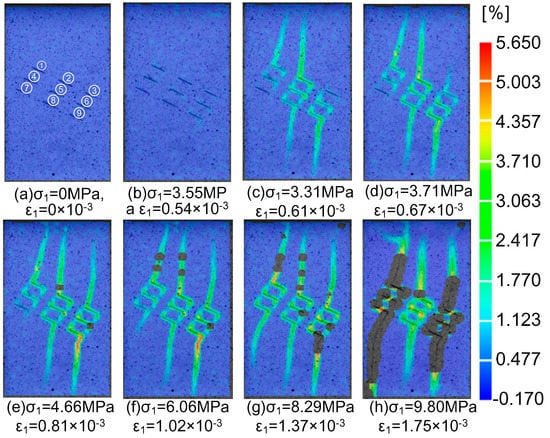
Figure 15.
Evolution of strain fields for the specimen with α = 30° corresponding to points (a–h) in Figure 13.
3.3.3. Mix Failure Mode
Figure 16 shows the characteristics of the stress and acoustic emissions for the specimen containing nonpersistent fissures with α = 45° during the loading process, and the corresponding strain filed at points (a–h) are shown in Figure 17. When the pressure was loaded to point (b) (38.5% σp), the strain concentration zone appeared in the upper tip of fissure ① and the lower tip of fissure ⑨ and propagated along the direction of loading, accompanied by a first stress drop and certain AE counts. As loading increased, the strain localization zone was concentrated at the pre-existing fissure tips. In this period (points b–d), the stress curve was on the rise, accompanied by certain AE counts, which indicated that the microcracks were in stable propagation. When the axial stress was loaded to point (e), a tensile wing crack initiated from the upper tip of fissure ③ and propagated rapidly along the loading direction. When the axial stress was increased into peak stress (point f), new wing cracks appeared at the right tip of fissures ⑧⑨. Meanwhile, tensile cracks [22,48] coalesced between fissures ②⑤ and fissures ④⑦. The crack initiation and propagation resulted in energy release. Subsequent stresses were redistributed in the specimen, immediately leading to a high strain concentration zone in the left tip of fissure ⑦, as shown in Figure 17g. Then, the strain concentration zone of the right tip of fissure ⑦ propagated to a wing crack, and the rock bridge between fissures ①②③ coalesced with a shear crack. The propagation of wing crack and coalescence of shear cracks resulted in integral instability, and the stress curve dropped to 51.0% σp.
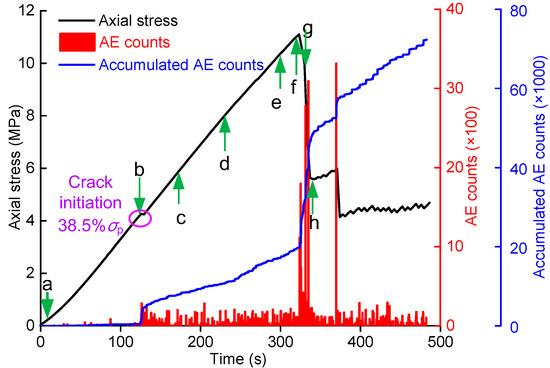
Figure 16.
Characteristics of stress and acoustic emissions during the loading process (α = 45°).
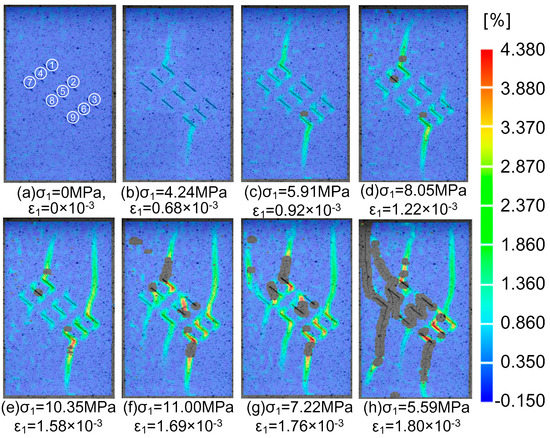
Figure 17.
Evolution of strain fields for the specimen with α = 45° corresponding to points (a–h) in Figure 16.
3.3.4. Shear Failure along the Fissure Plane
The stress and AE count curves of the specimen containing nonpersistent fissures with α = 75° subjected to uniaxial compressive stress are shown in Figure 18, and the corresponding strain fields of mark points (a–h) are shown in Figure 19. Taking point (a) in the initial loading period as a reference point, the small strain concentration only appeared in the fissure tip before the crack initiation, as shown in Figure 19b. When the axial stress was loaded up to point (c) (74.3% σp), a strain localized zone appeared in the upper tip of fissure ① and the lower tip of fissure ⑨ and propagated along the direction of axial loading. At the same time, stress fluctuation occurred with obvious AE counts, which implied that the specimen entered into the crack initiation period. The specimen was loaded to point (e) with increasing axial deformation. At this moment, coalescence of strain concentration zones occurred between the collinear fissures, and the strain concentration along the direction of the fissure inclination became higher, as shown in Figure 19e. As with the prior specimens, there was a strong relationship between the coalescence of the strain concentration zone and the development of the stress–strain curve (i.e., the coalescence of high strain concentration zones always led to a drop in stress, which subsequently decreased the bearing capacity of the specimen). When the specimen was loaded to point (f), which was just before peak strength, shear crack coalescence occurred in the rock bridge along the fissure plane, leading to the initiation of an anti-tensile secondary crack from the lower tip of fissure ③. Afterward, the slip of the shear plane led to the failure of the specimen (Figure 19g,h) and a rapid drop in the stress–strain curve.
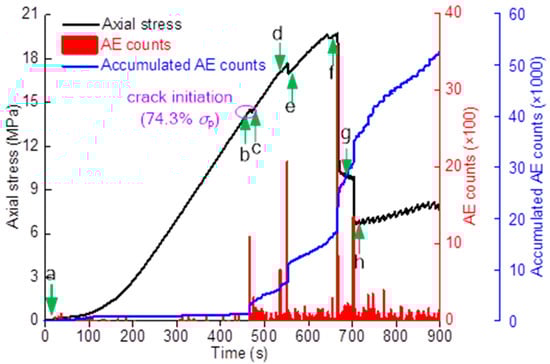
Figure 18.
Characteristics of stress and acoustic emissions during the loading process (α = 75°).
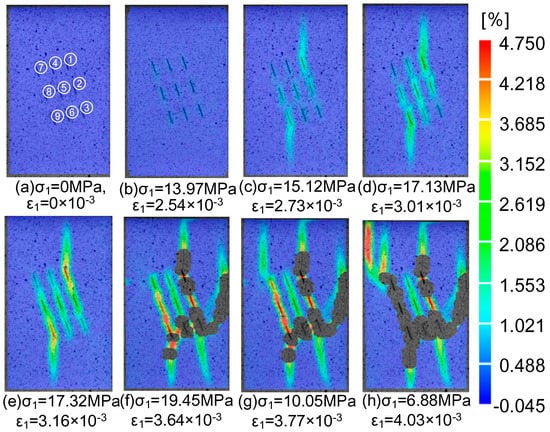
Figure 19.
Evolution of strain fields for the specimen with α = 75° corresponding to points (a–h) in Figure 18.
3.3.5. Splitting Failure
When the fissure inclination approached 90°, the failure process was different from other inclinations. Figure 20 and Figure 21 show the stress and AE count characteristic curves of a specimen containing nonpersistent fissures with α = 90° during the uniaxial compression process and the corresponding strain fields of mark points (a–c), respectively. As seen from the strain field of point (b) (Figure 21b), only small strain concentrations appeared between fissure ② and fissure ③. When the specimen was loaded to peak stress, cracks rapidly propagated from the top end to the bottom end via fissures ③⑤⑦ (Figure 21c). The specimen failed, and the axial supporting capacity dropped, accompanied by a large amount of AE events. The AE events stayed at a very low level before the peak stress, and dense AE events only appeared after reaching peak stress. Compared to other fissure inclinations, the strain concentration of specimen surface was not obvious before reaching peak stress, demonstrating that the pre-existing fissures had little effect on the failure behavior of the jointed rock mass, and the specimen with α = 90° did not experience a crack initiation period similar to other specimens.
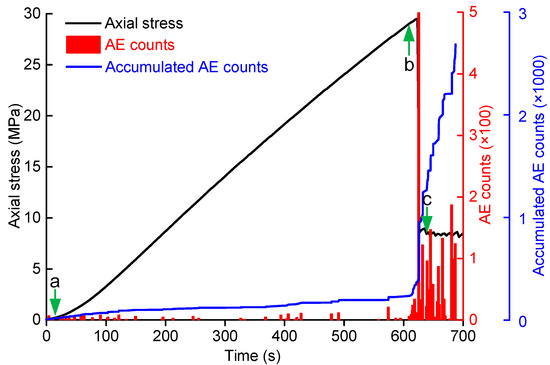
Figure 20.
Characteristics of stress and acoustic emissions during the loading process (α = 90°).
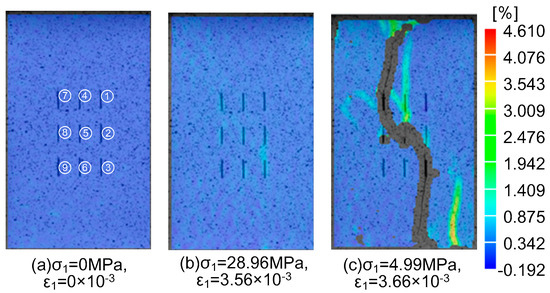
Figure 21.
Evolution of strain fields for the specimen with α = 90° corresponding to points (a–c) in Figure 19.
4. Discussion
4.1. AE Count Characteristics
In Section 3, we investigated the mechanical behavior and fracture process of specimens containing nonpersistent fissures at various fissure inclinations. The failure behavior of specimens is the macroscopic representation of microscopic deformation and fracture, and AE events have proven to be closely associated with the microcracking process of the brittle material under compression [46].
Based on the general characteristics of AE data collected in experiments, the AE activity could be divided into three periods: A quiet period, slow rise period, and active period. A specimen of α = 45° is shown in Figure 22 as an example. In the stage of initial compaction, only the unevenness of the top and bottom of the sample was gradually compacted, and the micropores or microdefects in the sample were closed under the load. Thus there were few AE events. As the load continued to increase, the strain concentration zone started to appear around the fissures, but there was no initiation of a new crack, so the number of AE events remained low. Due to the stress concentration around the fissures, some new microcracks were initiated when the stress exceeded material strength and there was an obvious AE event. Then, when the AE activity entered the slow rise period, the AE event became more active, with the propagation of microcracks under load, and the accumulated AE counts gradually increased as time increased. The transition from the quiet period to the slow rise period of the AE events indicated a progressive accumulation of damage in the specimen. Of note, the accumulated AE counts of specimens may have experienced several steep slopes during this period. As shown in Figure 19 of the specimen with α = 75°, the first steep slope corresponded to the beginning of tension crack initiation from fissures ①⑨; and the second slope was caused by the shear crack coalescence along the direction of fissures ①②③ and ⑦⑧⑨. As the stress continued to load, the AE events became more active, and the accumulation of AE counts increased sharply at the peak stress. The dramatic increase in the accumulated AE events was mainly caused by a large number of local fractures in the specimen and forecasted the development of a macroscopic crack. The appearance of penetrating cracks in the specimen caused serious damage to the bearing structure, and the bearing capacity of the specimen after the peak strength was mainly realized by the resistance of uneven surfaces on penetrating cracks. In this period, cracks continued to propagate, and the accumulated AE counts were much greater than in other periods.
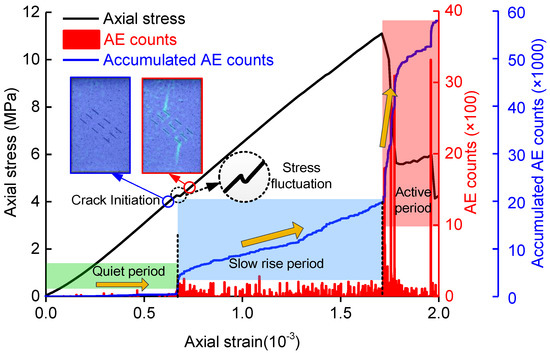
Figure 22.
AE event characteristics during the loading process (α = 45°).
The progressive increase process of AE events also revealed that the failure process of rock-like specimens containing nonpersistent fissures was a cumulative process. Unlike the intact specimens or specimens containing one single fissure, the AE events may have experienced several intense activities before peak stress. This was mainly due to the fact that a greater number of fissures provided additional opportunities for coalescence: Every crack initiation and coalescence resulted in energy release that was accompanied by AE events. However, local stress adjustment had limited effects on the overall load-bearing structure of the specimens. Therefore, the characteristics of AE events of specimens containing nonpersistent fissures was more complex.
4.2. Evolution Process of the Strain Field
In this study, DSCM was proven to be a quick and effective tool to reveal clear and intuitive strain accumulation processes and fracture behaviors of the specimen surface. The process analysis of a strain field showed that fissure inclination affected the characteristics of stress distribution in specimens and thus affected the fracture process. In the early loading period, the specimen was in the uniform compression process, and the strain field was distributed uniformly on the specimen surface. Along with the stress increase, the strain concentration zone gradually appeared around the pre-existing fissures. The strain concentration zone of a specimen appeared first in the fissure tip, except for the specimen of α = 0°, for which it appeared in the center of the fissure.
Initial cracks were primarily propagated from the fissure tips, especially the fissure tips near the ends of the specimen. Although the strain value in the initial strain localization stage was small, the early effect of pre-existing fissures on the overall damage evolution of the specimens could be predicted. With loading increased, the strain concentration zone propagated and coalesced with other strain concentration zones in the rock bridge area. The coalescence of high strain concentration zones will always lead to a stress drop and obvious AE counts. The failure process showed that the main reason for the overall failure was due to the coalescence of new cracks between fissures, resulting in the failure of the core bearing structure, except for specimens with α = 90°, which presented with intact material failure. This was because the pre-existing fissures in this experiment were mainly concentrated in the center of the specimen. After the crack coalescence in the core bearing structure, the cracks experienced rapid coalescence with other cracks and propagation toward the edge of the specimen, which eventually led to the final failure.
Figure 23 gives the horizontal and vertical displacement nephogram of specimens with α = 30°, 60°, and 75° at the specified mark points during the experiment. Overall, the horizontal and vertical displacement had antisymmetric distribution. The horizontal displacement was positive for right displacement and negative for left displacement: As the upper end was the loading end and the lower end was the fixed end, the vertical displacement was mainly focused on the top of the specimens. As seen from the displacement nephogram, there were some dividing lines between the adjacent considerably different displacement zones. These dividing lines reflected the paths of crack initiation, propagation, and coalescence. Note that the dividing lines were mainly concentrated along the fissures, especially in the fissure tips, which also illustrates the significant effect of pre-existing fissures on the fracture evolution process. Compared to conventional studies that have described the fracture process mainly from statistical photographs on a macro scale, this study provided full-field strain analysis during the overall process of failure. This work indicates that monitoring of the failure process of specimens using the DSCM technique is an effective tool to investigate fracturing processes and fracture mechanisms in jointed rock.
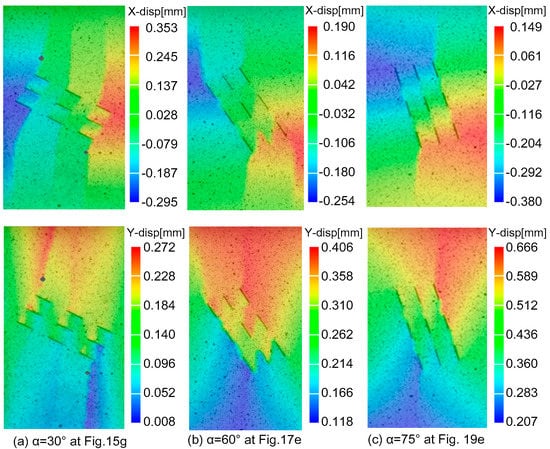
Figure 23.
Horizontal and vertical displacement nephogram of specimens with α = 30°, 60°, and 75° at specified mark points.
5. Conclusions
Research on the mechanical properties and fracture behavior of specimens containing nonpersistent fissures helps in better understanding the failure mechanisms of jointed rock. In this study, rock-like specimens containing nine pre-existing nonpersistent fissures were used to investigate the mechanical properties and failure behavior of jointed rock by a uniaxial compression experiment. The DSCM technique and AE monitoring system were adopted in the experiments to reveal the real-time strain field and AE characteristics during uniaxial loading. The following conclusions can be drawn.
- Fissure inclination has a significant impact on the mechanical behavior and crack coalescence patterns of specimens containing nonpersistent fissures. The peak strength of specimens containing nonpersistent fissures initially decreased and then increased as fissure inclination increased in the range from 0° to 90°, with a minimum at 30°. The crack initiation stress of specimens first decreased and then increased as fissure inclination increased from 0° to 75°. Unlike the peak strength, the minimum crack initiation stress was at α = 45°. The trend of elastic modulus was basically the same as the peak strength, which decreased from 0° to 30° and then increased.
- Crack coalescence between fissures plays an important role in the final failure modes. As fissure inclination increased, crack coalescence modes between fissures changed from tensile coalescence mode to mixed tension-shear coalescence mode, then to shear coalescence mode. Five basic failure modes were classified from the experimental results: ① tensile failure across the fissure planes; ② rotation failure of newly generated blocks; ③ mix failure mode; ④ shear failure; ⑤ splitting failure.
- The clear and intuitive damage evolution and fracturing process of specimens with five failure modes during the experiment were observed using the DSCM. The damage process of specimens containing nonpersistent fissures showed obvious progressive strain localization failure characteristics. In the initial loading stage, the strain concentration zone was concentrated around the pre-existing fissures: Although the strain value was small, the early influence of the pre-existing fissures on the overall damage process of specimens could be predicted. Then, the primary strain concentration zone developed into a high strain localization band, indicating the developmental path of macrocracks. The saltation of strain fields was usually accompanied by a fluctuation of the stress curve and obvious AE events.
Author Contributions
Methodology—writing—original draft preparation, M.C.; conceptualization—writing and review, S.Y.; review and editing, R.P.G.; editing, W.Y. and Q.Z.; Experiment, P.Y. and Y.Z.
Funding
This research was funded by the Independent Innovation Project for Double First-level Construction (China University of Mining and Technology), grant number 2018ZZCX04).
Acknowledgments
The authors would like to express their sincere gratitude to the editor and two anonymous reviewers for their valuable comments, which have greatly improved this paper. The first author also thanks the Chinese Scholarship Council for its financial support.
Conflicts of Interest
The authors declare no conflict of interest.
Nomenclature
| ①,②,③,④,⑤,⑥,⑦,⑧,⑨ | numbers of fissures in the specimen |
| AE | acoustic emission |
| DIC | digital image correlation |
| DSCM | digital speckle correlation method |
| Ea | reloading average modulus |
| Es | elastic modulus, the slope of approximate linear part in the stress–strain curve |
| F | far-field crack |
| Lc | lateral crack |
| ROI | a region of interest |
| Sa | anti-shear crack |
| Sm | main shear crack |
| Sp | surface spalling |
| Ss | secondary shear crack |
| Ta | anti-tensile wing crack |
| Ts | secondary tensile crack |
| Tw | tensile wing crack |
| λ | the ratio of crack initiation stress to the compressive strength |
| σci | the crack initiation stress |
| σp | the peak strength |
References
- Yang, S.Q.; Tian, W.L.; Ranjith, P.G. Experimental Investigation on Deformation Failure Characteristics of Crystalline Marble Under Triaxial Cyclic Loading. Rock Mech. Rock Eng. 2017, 50, 2871–2889. [Google Scholar] [CrossRef]
- Yang, S.Q.; Chen, M.; Fang, G.; Wang, Y.C.; Meng, B.; Li, Y.H.; Jing, H.W. Physical experiment and numerical modelling of tunnel excavation in slanted upper-soft and lower-hard strata. Tunn. Undergr. Space Technol. 2018, 82, 248–264. [Google Scholar] [CrossRef]
- Lajtai, E.Z.; Lajtai, V.N. The evolution of brittle fracture in rocks. J. Geol. Soc. 1974, 130, 1–16. [Google Scholar] [CrossRef]
- Yang, S.Q.; Chen, M.; Jing, H.W.; Chen, K.F.; Meng, B. A case study on large deformation failure mechanism of deep soft rock roadway in Xin’An coal mine, China. Eng. Geol. 2017, 217, 89–101. [Google Scholar] [CrossRef]
- Cotterell, B. Brittle Fracture in Compression. Int. J. Fract. Mech. 1972, 8, 195–208. [Google Scholar] [CrossRef]
- Horii, H.; Nemat-Nasser, S. Compression-induced microcrack growth in brittle solids: Axial splitting and shear failure. J. Geophys. Res. 1985, 90, 3105–3125. [Google Scholar] [CrossRef]
- Wong, R.; Chau, K.; Tang, C.; Lin, P. Analysis of crack coalescence in rock-like materials containing three flaws—Part I: Experimental approach. Int. J. Rock Mech. Min. Sci. 2001, 38, 909–924. [Google Scholar] [CrossRef]
- Lee, H.; Jeon, S. An experimental and numerical study of fracture coalescence in pre-cracked specimens under uniaxial compression. Int. J. Solids Struct. 2011, 48, 979–999. [Google Scholar] [CrossRef]
- Bobet, A. The initiation of secondary cracks in compression. Eng. Fract. Mech. 2000, 66, 187–219. [Google Scholar] [CrossRef]
- Esterhuizen, G.S.; Dolinar, D.R.; Ellenberger, J.L. Pillar strength in underground stone mines in the United States. Int. J. Rock Mech. Min. Sci. 2011, 48, 42–50. [Google Scholar] [CrossRef]
- Brideau, M.-A.; Yan, M.; Stead, D. The role of tectonic damage and brittle rock fracture in the development of large rock slope failures. Geomorphology 2009, 103, 30–49. [Google Scholar] [CrossRef]
- Hearn, G.J. C4 Rock slope stabilization. Geol. Soc. Lond. Eng. Geol. Spec. Publ. 2011, 24, 189–208. [Google Scholar] [CrossRef]
- Bobet, A.; Einstein, H.H. Fracture coalescence in rock-type materials under uniaxial and biaxial compression. Int. J. Rock Mech. Min. Sci. 1998, 35, 26. [Google Scholar] [CrossRef]
- Wong, L.N.Y.; Einstein, H.H. Crack Coalescence in Molded Gypsum and Carrara Marble: Part 1. Macroscopic Observations and Interpretation. Rock Mech. Rock Eng. 2009, 42, 475–511. [Google Scholar] [CrossRef]
- Yang, S.Q.; Liu, X.R.; Jing, H.W. Experimental investigation on fracture coalescence behavior of red sandstone containing two unparallel fissures under uniaxial compression. Int. J. Rock Mech. Min. Sci. 2013, 63, 82–92. [Google Scholar] [CrossRef]
- Yang, S.Q.; Yang, D.S.; Jing, H.W.; Li, Y.H.; Wang, S.Y. An Experimental Study of the Fracture Coalescence Behaviour of Brittle Sandstone Specimens Containing Three Fissures. Rock Mech. Rock Eng. 2012, 45, 563–582. [Google Scholar] [CrossRef]
- Yang, S.Q.; Tian, W.L.; Huang, Y.H. Failure mechanical behavior of pre-holed granite specimens after elevated temperature treatment by particle flow code. Geothermics 2018, 72, 124–137. [Google Scholar] [CrossRef]
- Yang, S.Q.; Huang, Y.H.; Ranjith, P.G. Failure mechanical and acoustic behavior of brine saturated-sandstone containing two pre-existing flaws under different confining pressures. Eng. Fract. Mech. 2018, 193, 108–121. [Google Scholar] [CrossRef]
- Zhou, X.P.; Bian, J.; Qian, Q.H. Numerical simulation of crack growth and coalescence in rock-like materials containing multiple pre-existing flaws. Rock Mech. Rock Eng. 2015, 48, 1097–1114. [Google Scholar] [CrossRef]
- Zhou, X.P.; Zhang, Y.X.; Ha, Q.L.; Zhu, K.S. Micromechanical modeling of the complete stress-strain relationship for crack weakened rock subjected to compressive loading. Rock Mech. Rock Eng. 2008, 41, 747–769. [Google Scholar] [CrossRef]
- Zhou, X.P.; Cheng, H.; Feng, Y.F. An Experimental Study of Crack Coalescence Behaviour in Rock-Like Materials Containing Multiple Flaws Under Uniaxial Compression. Rock Mech. Rock Eng. 2014, 47, 1961–1986. [Google Scholar] [CrossRef]
- Sagong, M.; Bobet, A. Coalescence of multiple flaws in a rock-model material in uniaxial compression. Int. J. Rock Mech. Min. Sci. 2002, 39, 229–241. [Google Scholar] [CrossRef]
- Prudencio, M.; Van Sint Jan, M. Strength and failure modes of rock mass models with non-persistent joints. Int. J. Rock Mech. Min. Sci. 2007, 44, 890–902. [Google Scholar] [CrossRef]
- Bahaaddini, M.; Sharrock, G.; Hebblewhite, B.K. Numerical investigation of the effect of joint geometrical parameters on the mechanical properties of a non-persistent jointed rock mass under uniaxial compression. Comput. Geotech. 2013, 49, 206–225. [Google Scholar] [CrossRef]
- Chen, X.; Liao, Z.; Peng, X. Deformability characteristics of jointed rock masses under uniaxial compression. Int. J. Min. Sci. Technol. 2012, 22, 213–221. [Google Scholar] [CrossRef]
- Fan, X.; Kulatilake, P.H.S.W.; Chen, X. Mechanical behavior of rock-like jointed blocks with multi-non-persistent joints under uniaxial loading: A particle mechanics approach. Eng. Geol. 2015, 190, 17–32. [Google Scholar] [CrossRef]
- Gui, Y.L.; Zhao, Z.Y.; Zhang, C.; Ma, S.Q. Numerical investigation of the opening effect on the mechanical behaviours in rocks under uniaxial loading using hybrid continuum-discrete element method. Comput. Geotech. 2017, 90, 55–72. [Google Scholar] [CrossRef]
- Yang, X.; Kulatilake, P.H.S.W.; Jing, H.; Yang, S. Numerical simulation of a jointed rock block mechanical behavior adjacent to an underground excavation and comparison with physical model test results. Tunn. Undergr. Space Technol. 2015, 50, 129–142. [Google Scholar] [CrossRef]
- Cao, R.H.; Cao, P.; Lin, H.; Pu, C.Z.; Ou, K. Mechanical behavior of brittle rock-like specimens with pre-existing fissures under uniaxial loading: Experimental studies and particle mechanics approach. Rock Mech. Rock Eng. 2016, 49, 763–783. [Google Scholar] [CrossRef]
- Yang, X.X.; Jing, H.W.; Tang, C.A.; Yang, S.Q. Effect of parallel joint interaction on mechanical behavior of jointed rock mass models. Int. J. Rock Mech. Min. Sci. 2017, 92, 40–53. [Google Scholar] [CrossRef]
- Cheng, Y.; Wong, L.N.Y. Microscopic characterization of tensile and shear fracturing in progressive failure in marble. J. Geophys. Res. Solid Earth 2018, 123, 204–225. [Google Scholar] [CrossRef]
- Yates, J.R.; Zanganeh, M.; Tai, Y.H. Quantifying crack tip displacement fields with DIC. Eng. Fract. Mech. 2010, 77, 2063–2076. [Google Scholar] [CrossRef]
- Abanto-Bueno, J.; Lambros, J. Investigation of crack growth in functionally graded materials using digital image correlation. Eng. Fract. Mech. 2002, 69, 1695–1711. [Google Scholar] [CrossRef]
- Hedan, S.; Fauchille, A.-L.; Valle, V.; Cabrera, J.; Cosenza, P. One-year monitoring of desiccation cracks in Tournemire argillite using digital image correlation. Int. J. Rock Mech. Min. Sci. 2014, 68, 22–35. [Google Scholar] [CrossRef]
- Yin, P.F.; Yang, S.Q. Experimental investigation of the strength and failure behavior of layered sandstone under uniaxial compression and Brazilian testing. Acta Geophys. 2018, 66, 585–605. [Google Scholar] [CrossRef]
- Zhou, X.P.; Lian, Y.J.; Wong, L.N.Y.; Berto, F. Understanding the fracture behavior of brittle and ductile multi-flawed rocks by uniaxial loading by digital image correlation. Eng. Fract. Mech. 2018, 199, 438–460. [Google Scholar] [CrossRef]
- Carroll, J.D.; Abuzaid, W.; Lambros, J.; Sehitoglu, H. High resolution digital image correlation measurements of strain accumulation in fatigue crack growth. Int. J. Fatigue 2013, 57, 140–150. [Google Scholar] [CrossRef]
- Zhao, C.; Matsuda, H.; Morita, C.; Shen, M.R. Study on Failure Characteristic of Rock-Like Materials with an Open-Hole Under Uniaxial Compression. Strain 2011, 47, 405–413. [Google Scholar] [CrossRef]
- Zhao, C.; Bao, C.; Tian, J.; Matsuda, H.; Morita, C. Experimental study of coalescence mode of cracks and strength of rock with double flaws based on strain localization. Chin. J. Rock Mech. Eng. 2015, 34, 10. [Google Scholar]
- Li, D.; Zhu, Q.; Zhou, Z.; Li, X.; Ranjith, P.G. Fracture analysis of marble specimens with a hole under uniaxial compression by digital image correlation. Eng. Fract. Mech. 2017, 183, 109–124. [Google Scholar] [CrossRef]
- Bruck, H.; McNeill, S.; Sutton, M.A.; Peters, W. Digital image correlation using Newton-Raphson method of partial differential correction. Exp. Mech. 1989, 29, 261–267. [Google Scholar] [CrossRef]
- Wasantha, P.; Ranjith, P.; Viete, D.; Haque, A.; Bouazza, A. Crack initiation stress for saturated sandstone in triaxial compression. In Proceedings of the 46th US Rock Mechanics/Geomechanics Symposium, Chicago, IL, USA, 24–27 June 2012. [Google Scholar]
- Kong, R.; Feng, X.-T.; Zhang, X.; Yang, C. Study on crack initiation and damage stress in sandstone under true triaxial compression. Int. J. Rock Mech. Min. Sci. 2018, 106, 117–123. [Google Scholar] [CrossRef]
- Brace, W.; Paulding, B., Jr.; Scholz, C. Dilatancy in the fracture of crystalline rocks. J. Geophys. Res. 1966, 71, 3939–3953. [Google Scholar] [CrossRef]
- Eberhardt, E.; Stead, D.; Stimpson, B.; Read, R. Identifying crack initiation and propagation thresholds in brittle rock. Can. Geotech. J. 1998, 35, 222–233. [Google Scholar] [CrossRef]
- Yang, S.Q.; Jing, H.-W. Strength failure and crack coalescence behavior of brittle sandstone samples containing a single fissure under uniaxial compression. Int. J. Fract. 2011, 168, 227–250. [Google Scholar] [CrossRef]
- Yang, S.Q. Crack coalescence behavior of brittle sandstone samples containing two coplanar fissures in the process of deformation failure. Eng. Fract. Mech. 2011, 78, 3059–3081. [Google Scholar] [CrossRef]
- Park, C.H.; Bobet, A. Crack initiation, propagation and coalescence from frictional flaws in uniaxial compression. Eng. Fract. Mech. 2010, 77, 2727–2748. [Google Scholar] [CrossRef]


© 2018 by the authors. Licensee MDPI, Basel, Switzerland. This article is an open access article distributed under the terms and conditions of the Creative Commons Attribution (CC BY) license (http://creativecommons.org/licenses/by/4.0/).