Article

Correlations to Predict Elemental Compositions and Heating Value of Torrefied Biomass

1
Clean Energy and Fuel Lab, School of Engineering and Technology, Central Michigan University, Mount Pleasant, MI 48859, USA
2
Robotics and Haptics Lab, School of Engineering and Technology, Central Michigan University, Mount Pleasant, MI 48859, USA
*
Author to whom correspondence should be addressed.
Energies 2018, 11(9), 2443; https://doi.org/10.3390/en11092443
Submission received: 10 August 2018 / Revised: 30 August 2018 / Accepted: 10 September 2018 / Published: 14 September 2018
(This article belongs to the Special Issue Woody Biomass for Bioenergy Production)

Abstract

:
Measurements reported in the literature on ultimate analysis of various types of torrefied woody biomass, comprising 152 data points, have been compiled and empirical correlations are developed to predict the carbon content, hydrogen content, and heating value of a torrefied wood as a function of solid mass yield. The range of torrefaction temperature, residence time and solid yield of the collected data is 200–300 °C, 5–60 min and 58–97%, respectively. Two correlations are proposed for carbon content with a coefficient of determination ( R 2 ) of 81.52% and 89.86%, two for hydrogen content with R 2 of 79.01% and 88.45%, and one for higher heating value with R 2 of 92.80%. The root mean square error (RMSE) values of the proposed correlations are 0.037, 0.028, 0.059, 0.043 and 0.023, respectively. The predictability of the proposed relations is examined with an additional set of experimental data and compared with the existing correlations in the literature. The new correlations can be used as a useful tool when designing torrefaction plants, furnaces, or gasifiers operating on torrefied wood.

1. Introduction

The energy demand of the world has been increasing consistently due to growing population and rising living standards [1]. As a result, fossil fuel reserves are ending gradually [2,3]. These fuels also cause severe environmental contamination with a high level of greenhouse gas emissions [4,5]. The research on renewable energy and alternative fuels has attracted many scholars worldwide. Woody biomass has been recognized as a promising source of renewable energy due to its availability in most parts of the globe [6]. Major shortcomings of biomass that limit its wider utilization for power generation are low bulk density, high moisture content, low heating value, and high energy requirement for grinding [7].
To improve the fuel properties of biomass, it needs to be pretreated. Torrefaction technology is a thermal treatment that greatly improves the heating value and grindability of biomass [8]. It is a mild pyrolysis where raw biomass loses its moisture content and a fraction of volatiles at a temperature between 200–300 °C in an inert atmosphere. The thermophysical properties of the torrefied biomass such as its elemental compositions and heating value are required for optimum design of a torrefaction plant or the furnace of a boiler which uses torrefied biomass as a fuel. Experimental determination of the elemental compositions through ultimate analysis is costly and requires sensitive equipment [9]. A predictive model that can help estimate the composition and heating value of torrefied solid obtained from different operating conditions is expected to be a useful tool for process modeling purposes. To the best knowledge of the authors, the literature lacks a general correlation for prediction of the C, H and O content of a torrefied biomass.
Some past studies have presented correlations for predicting the elemental compositions and HHV of raw biomass using proximate and ultimate analysis [10,11,12,13]. Parikh et al. [10] considered Volatile Matter (VM) and Fixed Carbon (FC) and proposed the following correlations:
C = 0.637FC + 0.455VM
H = 0.052FC + 0.062VM
O = 0.304FC + 0.476VM
The average absolute errors of Equations (1)–(3) are 3.21%, 4.79%, 3.4% with bias errors of 0.21%, 0.15% and 0.49%, respectively, for predicting C, H and O content of raw biomass. Shen et al. [11] developed the following relations based on fixed carbon, volatile matter and ash content (ASH) of raw biomass to predict the elemental compositions of the same raw biomass.
C = 0.635FC + 0.460VM − 0.095ASH
H = 0.059FC + 0.060VM + 0.010ASH
O = 0.340FC + 0.469VM − 0.023ASH
The average absolute errors of correlations given in Equations (4)–(6) are 3.17%, 4.47% and 3.16%, with average bias errors of 0.19%, 0.34% and 0.19%, respectively. Yin [12] used 44 sets of data and proposed two separate relationships for HHV of raw biomass using proximate analysis and ultimate analysis. Friedl et al. [13] proposed a correlation using 122 samples of plant materials for estimation of the HHV of raw biomass using the elemental composition. A comprehensive review of the models for estimating the heating value of biomass is reported in Ref. [14].
Due to the significant difference between the thermophysical properties of raw and torrefied biomass, the existing correlations in the literature are not suitable for estimating the elemental compositions. It is worth noting that the correlation of Friedl et al. [13] has been successfully applied for prediction of the heating value of torrefied biomass in some studies [15,16]. Nhucchen [17] used the data of proximate analysis of raw and torrefied biomass and proposed correlations for predicting the C, H and O contents of torrefied biomass. Nhucchen et al. [18] developed two correlations for the HHV of torrefied biomass using both proximate analysis and ultimate analysis. The latter correlation is alike that of Friedl et al. [13]. A model for predicting the HHV of torrefied biomass using the kinetics of decomposition with an average absolute error of 7.03% is also reported by Soponpongpipat et al. [19].
Although the proposed relations of Nhucchen et al. [17,18] appear to be useful, they do not eliminate the need for experiment. One would still need to have the measured values of the fixed carbon, volatiles, and ash. This article aims to introduce simple but accurate correlations to estimate the elemental compositions and the heating value of a torrefied biomass without a need to experimentation. The new relations developed using ordinary least squares regression model are described in terms of solid mass yield. The ultimate analyses of various types of wood, torrefied at different experimental conditions, are collected from several past studies. The proposed correlations are validated using an additional set of data. They are also compared with other correlations reported in the literature.

2. Methodology

2.1. Biomass Samples

Data related to 152 measurements were compiled from several sources that included ultimate analysis and HHV of raw and torrefied woody biomass, solid yield ( Y s ), torrefaction temperature, and residence time. The data were categorized into 15 different types of wood with 43 different torrefaction conditions. Table 1 summarizes the categorized data according to the torrefaction temperature and residence time for each type of feedstock. The sources of the collected experimental data are also provided in Table 1. For instance, the torrefaction data for birch were obtained from four different sources [20,21,22,23,24] with a minimum and a maximum torrefaction temperature of 200 °C and 280 °C respectively, and the residence times varying between 10 and 60 min.
Table 2 presents an overview of the compiled data based on the wood type including the number of measurements (n), the minimum (Min), maximum (Max), and mean of experimentally measured Y s , C, H, N contents, and the HHV. Table 2 does not provide the oxygen content since it can be determined by subtracting the sum of C, H and N contents from 100%. The average torrefaction temperature and residence time including all types of wood are 257 °C and 38 min, respectively. The mean of C, N, H and O contents are 53.5%, 0.17%, 5.7% and 40.5% in weight basis, respectively. The average Y s is 78%, and the average HHV is 20.95 MJ/kg. The range of C, H, N, O contents, temperature, residence time, solid yield and HHV are 45.1–64.4%, 3.45–6.99%, 0–0.9%, 20.89–47.3%, 200–300 °C, 5–60 min, 58–97% and 16.6–26.92 MJ/kg, respectively.

2.2. Data Analysis

The observed relationships between the considered dependent and independent variables are highly linear as shown in Figure 1 and Figure 2. Therefore, ordinary least squares regression (OLS), which is a linear regression method, was employed for analyzing the data to model the C and H content, and HHV of torrefied biomass. The assumptions made for the OLS were that the errors in the resulting prediction: (1) have an expected mean value of zero, (2) have the same variance, and (3) are not correlated with each other [45]. The correlations are developed for the HHV, carbon and hydrogen yields by excluding the nitrogen and oxygen contents as the nitrogen is assumed to remain in the solid and the oxygen content can be determined by difference. Three dimensionless parameters C r ,   H r and   HHV r   defined in Equations (7)–(9), are introduced for the regression analysis.
  C r = C × Y s 100 × C o  
  H r = H × Y s 100 × H o  
  HHV r = HHV × Y s 100 × HHV o  
where the subscript “o” refers to the raw biomass.

2.3. Error Estimation

Any empirical correlation is associated with prediction error. The accuracy of regression models in this study is examined by the root-mean-square error (RMSE), bias of the model, and the coefficient of determination ( R 2 ) [46]. They are defined as follows:
  RMSE = i = 1 n ( y i * y ) n 2  
  Bias = 1 n i = 1 n ( y i * y i )  
      R 2 = 1 i = 1 n ( y i * y i ) 2 i = 1 n ( y i * y ¯ ) 2  
where y*, y and y ¯ represent the predicted, measured and average value of the dependent variables, respectively, and n is the number of data points used for the derivation of a particular correlation. The RMSE is considered as the absolute measure of the model’s fit to the data and preferred over the mean absolute error as it places more weight on the larger error terms. On the other hand, the R 2 value is the relative measure of the model’s fit and represents the explained percentage of variability in the response variable as compared to the mean alone. RMSE is used for measuring the accuracy of the model along with the R 2 value when the main objective of the model is prediction. Small RMSE values and high R 2 values (between 0 and 1) imply a good fit for the model. The bias of a model measures the degree of overestimation or underestimation of the prediction as obtained from the model. Positive values of bias error suggest that the predicted values by the model will be greater than the actual values and vice versa [47].

3. Results

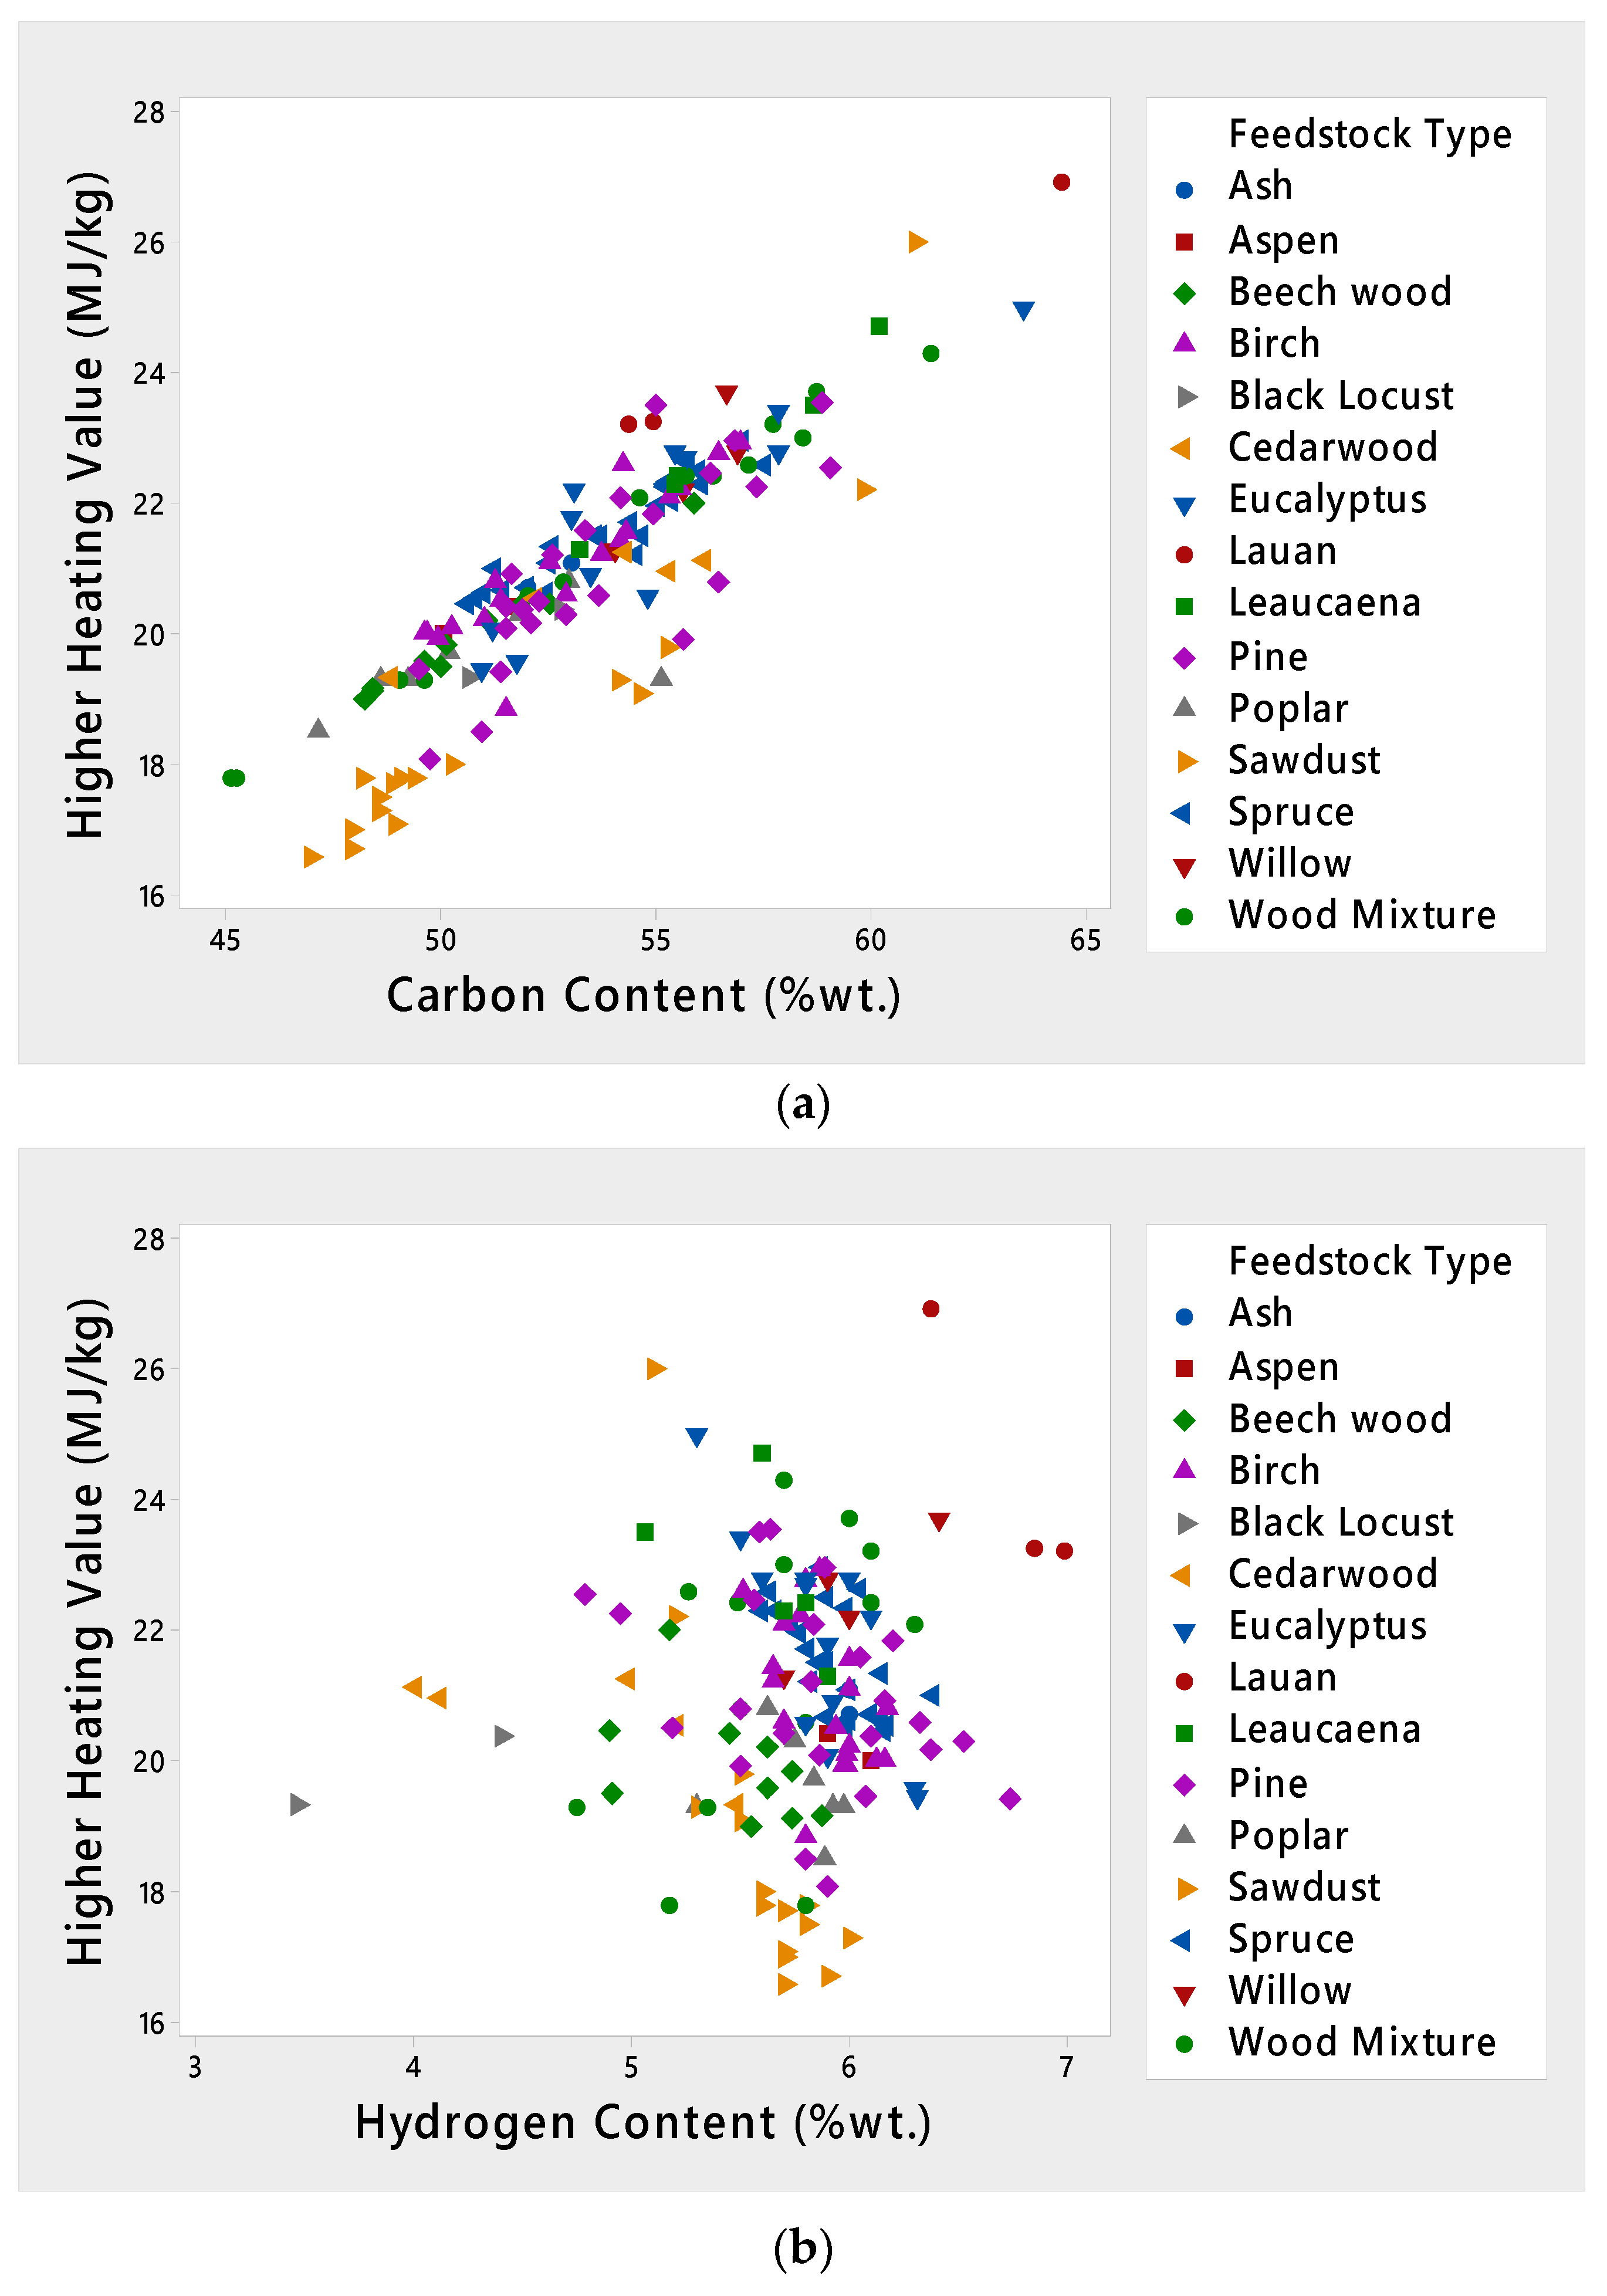
3.1. Elemental Compositions

Before performing a regression analysis, it is required to examine the relationship between the variables. Figure 1 shows how the C, H and N contents of torrefied woody biomass vary with solid yield using scatter plots. From Figure 1a, it is observed that the carbon content decreases linearly with the increase of solid yield for every type of feedstock. Almost every type of wood forms a data cluster. Figure 1b indicates that the hydrogen percentage increases with increasing solid yield. As the amount of nitrogen is very low, its change is not significant. However, Figure 1c shows that the nitrogen content increases with an increase in the solid yield for some of the data of pine, willow and eucalyptus, but it decreases for other types of wood. Figure 2 depicts the HHV of torrefied wood versus the carbon and hydrogen yields. A linear relation between the heating value and the carbon content is evident in Figure 2a for all types of torrefied wood. However, no distinct relation between HHV and hydrogen content can be seen in Figure 2b.

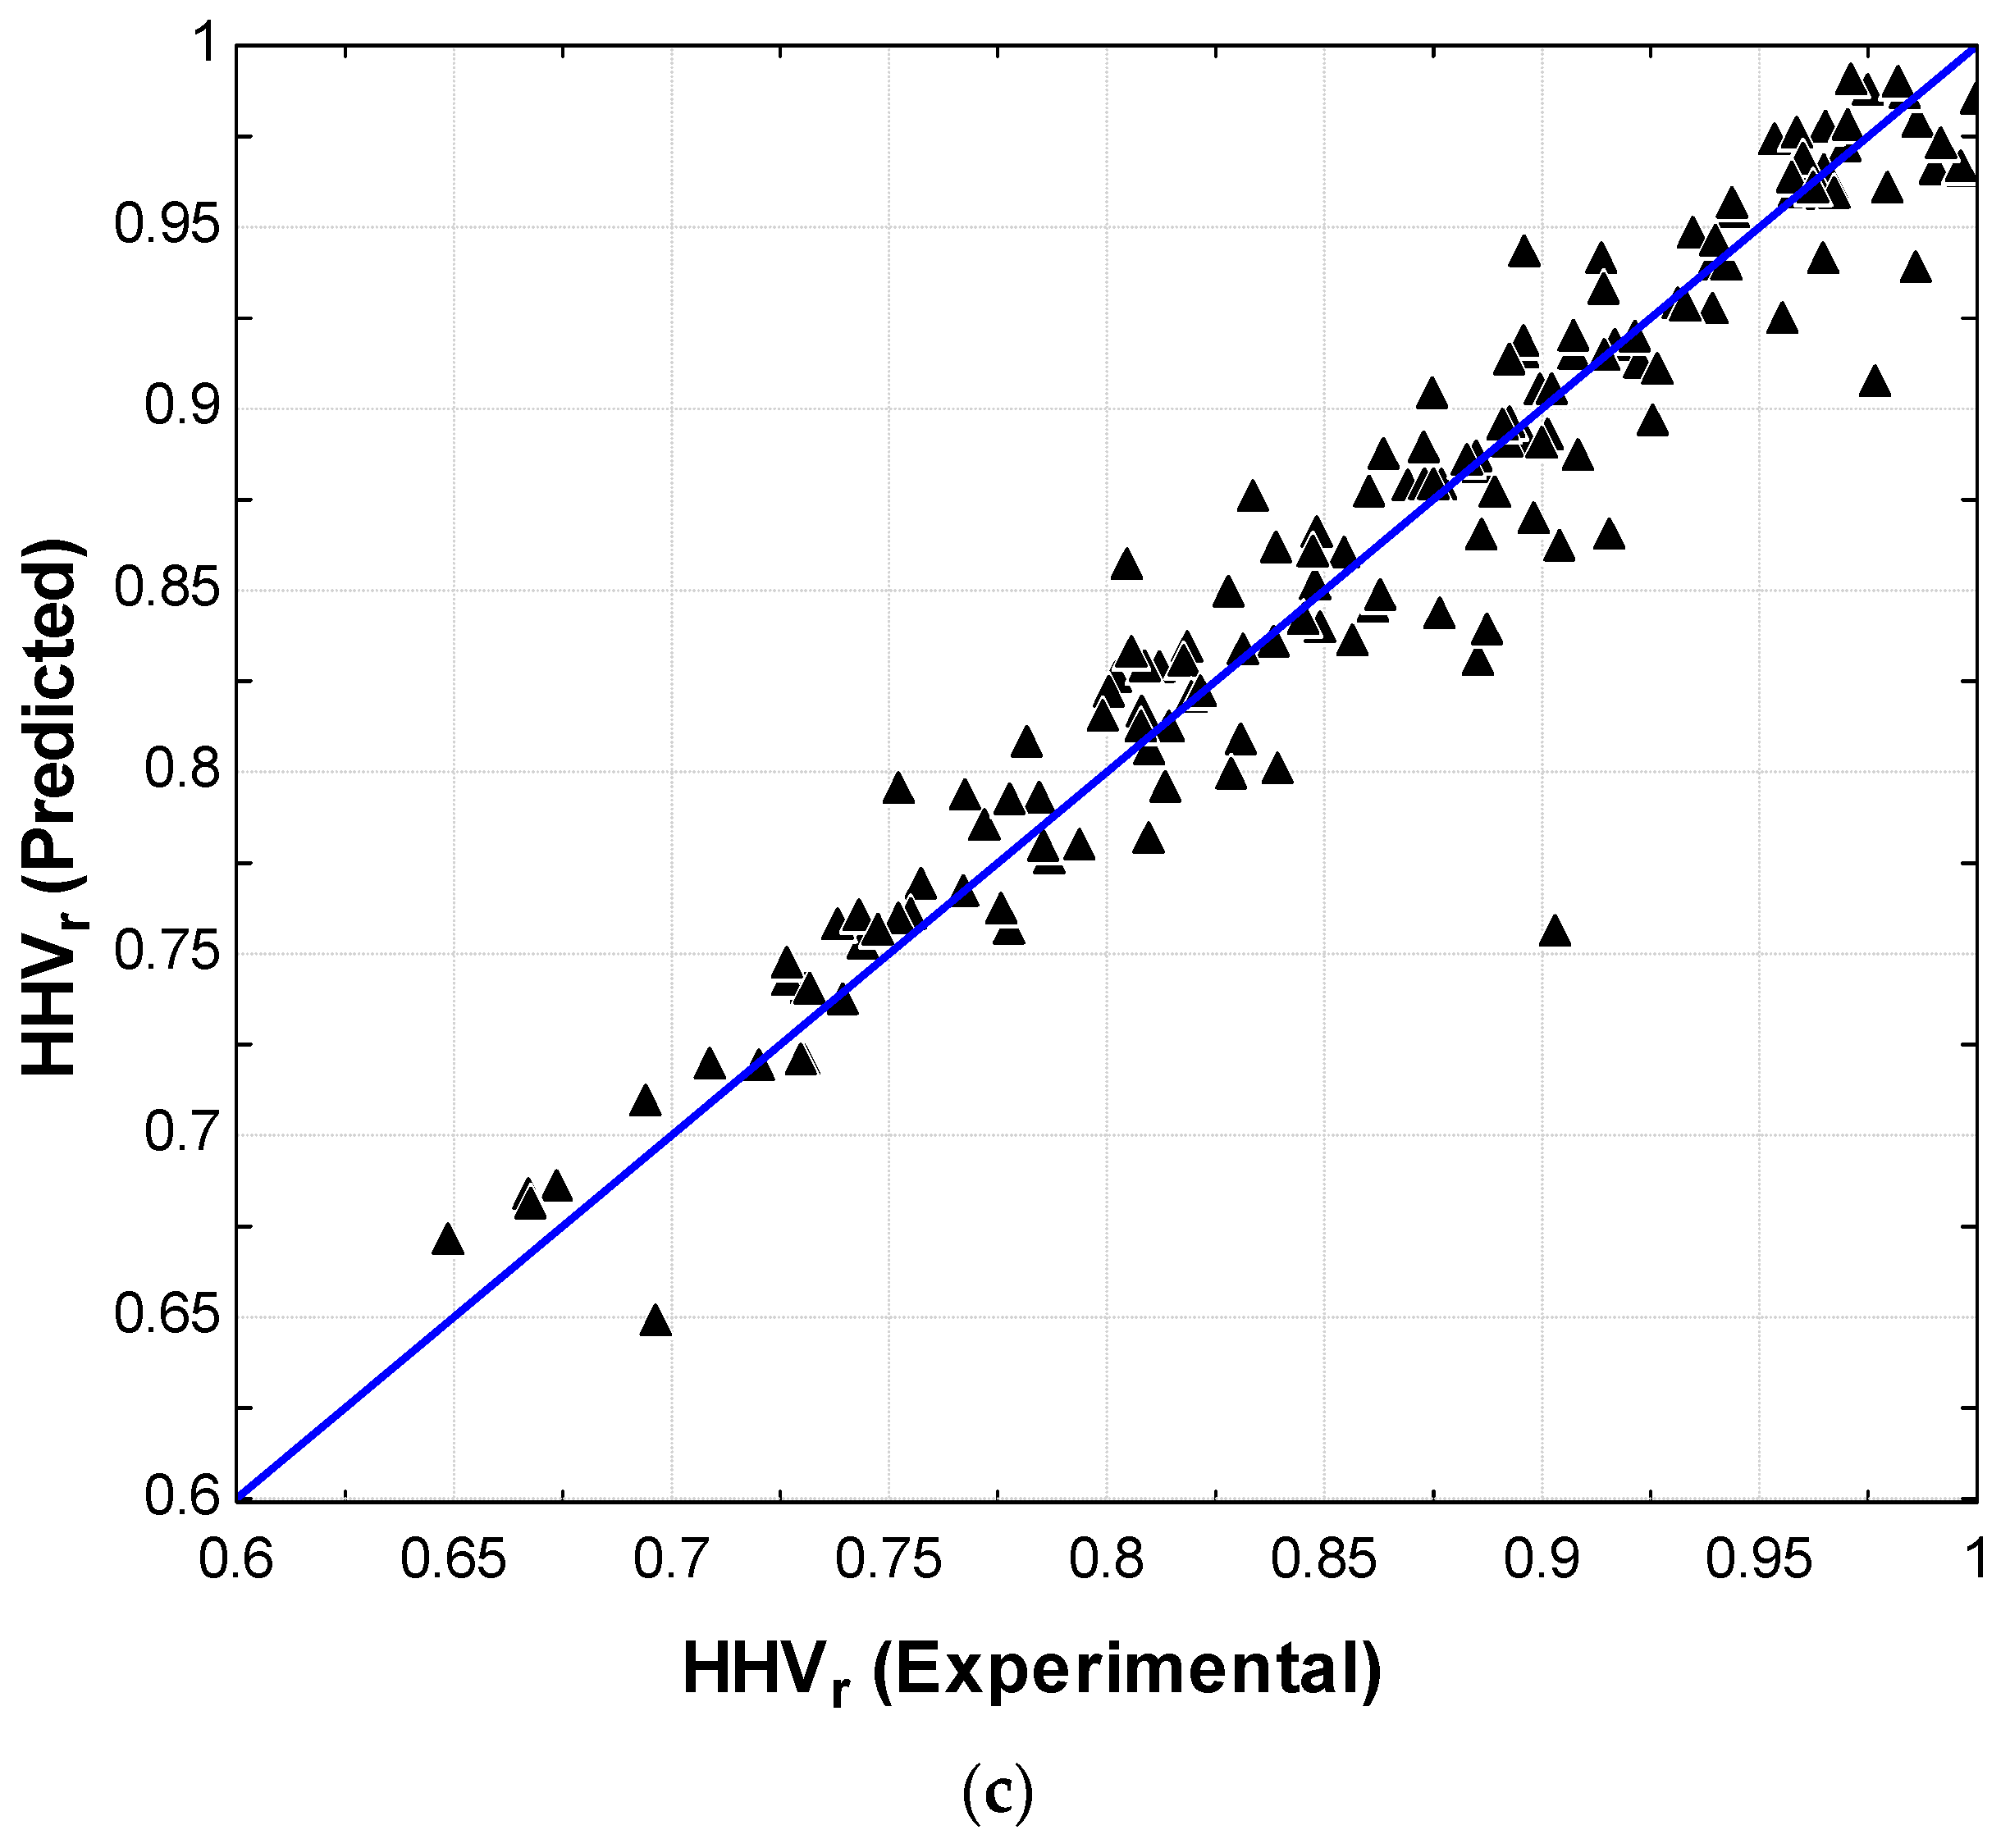
3.2. Modeling of C, H and HHV

As mentioned previously, 152 samples have been used in regression analysis to develop correlations for C and H contents and HHV of torrefied wood. Table 3 provides five different regression equations that are evaluated for three dependent variables and their corresponding prediction measures. For instance, in the case of   C r , the first regression equation that includes only Y s as the independent variable, Equation (13), results in an R 2 of 81.52% and RMSE of 0.037. By including C as a second independent variable, Equation (14), the R 2 value increases to 89.86% and RMSE decreases to 0.028. Similar observations are made for   H r . That is, an R 2 of 79.01% and RMSE of 0.059 are found for the model when   Y s is used as the only independent variable, Equation (15), whereas the second regression model, Equation (16), yields an R 2 value of 88.45% and RMSE of 0.043.
  C r = a 1 + b 1 Y s  
            C r = a 2 + b 2 Y s + a 3 C  
  H r = a 3 + b 3 Y s  
            H r = a 4 + b 4 Y s + a 4 H  
      HHV r = a 5 + b 5 C r  
For prediction of the   HHV r , an R 2 value of 92.80% with an RMSE of 0.023 is obtained by taking C r as the only independent variable. H r is not included as an additional variable because it does not have significance impact on HHV, which is also evident in Figure 2b. The values of the coefficients of Equations (13)–(17) in Table 3 are given in Table 4.
Figure 3 shows the deviation between the experimental and predicted values obtained from the regression models of Equations (14), (16) and (17) for   C r , H r and   HHV r , respectively. The predicted values that are in the close vicinity of the solid lines in Figure 3a–c imply a good accuracy of prediction by the model. The data points in Figure 3a show that they form a cluster at the upper region of the solid line. The maximum points of C r lie between 0.7 and 1. However, data for H r are distributed through the solid line as shown in Figure 3b with 96% of the data being in the range 0.5 to 1. On the other hand, for HHV r in Figure 3c, most of the data points are gathered in the upper region of the solid line like   C r . All the data points of HHV r point lie between 0.65 and 1.
Introducing Equations (7)–(9) into Equations (13)–(17) and using the values of the coefficients given in Table 4, the final form of the correlations for carbon and hydrogen contents and HHV of a torrefied biomass can be represented as:
  C C o = 0.7405 + 28.47 Y s  
  C C o = 0.47289 + 9.8562 × 10 3 Y s 0.01 Y s 0.010633 C o    
  H H o = 1.067 11.45 Y s  
  H H o = 0.55735 + 9.9884 × 10 3 Y s 0.01 Y s 0.086329 H o  
  HHV HHV o = 4.6508 Y s + 0.94497 C C o  
where C, H and Y s are expressed on a dry mass percentage basis.

3.3. Comparison with the Existing Correlations in the Literature and Experimental Data

As discussed previously, the proposed correlations in the literature are based on proximate analysis of raw biomass. The predictability of the correlations developed in this study are compared with those proposed by others. Parikh et al. [10] and Shen et al. [11] developed equations based on proximate analysis to predict elemental composition of raw biomass. Nhucchen [17] used the proximate analysis to predict the C and H percentage of both raw and torrefied biomass. To compare the HHV model, five different correlations from three different sources [12,13,18] are selected. Yin [12] and Friedl et al. [13] correlations are based on the proximate and ultimate analysis, whereas Nhucchen et al. [18] estimates the HHV of torrefied biomass using either proximate or ultimate analysis of torrrefied biomass.
Table 5 compares the proposed correlations for C, H and HHV in the current study to other published correlations. Average biased error (ABE) and root-mean-square error (RMSE) are calculated for all models using additional 12 samples obtained from Refs. [48,49]. Bridgeman et al. [48] torrefied willow and miscanthus at 240 °C and 290 °C with a residence time of 10 and 60 min. Broström et al. [49] reported the ultimate analysis of spruce torrefied at 260, 280 and 310 °C and a residence time of 8, 16.5 and 25 min. Although, miscanthus is a non-woody biomass, it is considered here to examine the applicability of the correlations developed in this study to non-woody biomass.
The first model developed in this study for carbon content, Equation (18), gives an ABE of −2.4% and RMSE of 2.12 whereas the second correlation, Equation (19), yields an ABE of 4% and RMSE of 3.3. The correlations of Parikh et al. [10] and Shen et al. [11] give higher negative values of −12.1% and −11.7% for ABE with RMSE of 7.39 and 7.23, respectively, as their models are originally developed for raw biomass. The correlation proposed by Nhucchen [17] shows an ABE of −6.1% and RMSE of 3.86. In the case of hydrogen, the correlations of this study, Equations (20) and (21), show an ABE of −2.4% and −4.8% with an RMSE of 0.24 and 0.88, respectively. The highest ABE is found for the correlation of Nhucchen [17]. The correlation developed by Prikh et al. [10] gives an ABE of −1.8% and RMSE of 0.26 and that of Shen et al. [11] yields an ABE of −1.4% and RMSE of 0.26.
For HHV, this study shows an ABE of −3.1% and RMSE of 1.02 when Equation (18) is used to determine the carbon content. These figures slightly change to 2.93% and 1.24 if the carbon content is calculated using Equation (19). Yin et al. [12] developed two correlations for HHV of raw biomass. As shown in Table 5, the first one gives an ABE of −8.7% and RMSE of 2.32 whereas the second relation yields an ABE of −3.2% and RMSE of 0.92. Friedl et al. correlation [13] developed using raw biomass data shows an ABE of 1.3% and RMSE of 0.44. The two correlations developed by Nhucchen et al. [18] give ABE of −0.6% and 2.2% with RMSE of 0.78 and 0.55.
Figure 4 compares the predicted values of the carbon content, the hydrogen content, and heating value obtained from Equations (18)–(22) with the measured data reported in Refs. [48,49]. It is evident from Figure 4a that Equations (18) and (19) satisfactorily predict the C content. A maximum error of 7.23% is found for miscanthus when C is predicted by Equation (18). For woody biomass, a maximum error of 8.6% is found for spruce from Equation (19). In the case of H, as shown in Figure 4b, the largest difference between the predicted and measured values found for miscanthus is 12.33% when Equation (21) is used. Also, a reasonable accuracy of prediction is found for HHV in Figure 4c with a maximum error of 8.2%. Overall, the agreement between the predicted and measured values in Figure 4 is acceptable for engineering applications.
It must be noted that as the proposed correlations are obtained using the data of different types of wood, their application to a non-woody biomass is not recommended. Furthermore, the new correlations are developed for a solid yield in the range 58% to 97%. Whether torrefied biomass is used in a combustion or gasification process, one would need to know the composition of the torrefied solid to accurately predict the gaseous products (combustion gases or producer gas). For this, Equations (18)–(22) are expected to be a useful tool for designers and researchers.

4. Conclusions

New correlations are developed using the ultimate analyses of torrefied woody biomass comprising 152 data points and 15 different types of wood, for predicting the carbon content, hydrogen content, and heating value of a torrefied wood. The proposed relations given in Equations (18) through (22) allow estimation of the C and H contents and HHV of a torrefied wood as a function of solid mass yield, composition and heating value of untreated wood. The accuracy of the proposed correlations is examined using additional experimental data related to torrefaction of willow, miscanthus, and spruce. Overall, the agreement between the predicted and measured quantities of the carbon, hydrogen and HHV is satisfactory. The proposed correlations provide a useful tool that can be incorporated in process models of energy systems operating on torrefied wood.

Nomenclature and Subscript

CCarbon content (%wt.)
OOxygen content (%wt.)
HHVHigher heating value (MJ/kg)
VMVolatile matter (%)
Y s Solid mass yield (%)
y * Predicted value
y ¯ Average value
dafDry and ash free
RMSERoot mean square error
HHydrogen content (%wt.)
NNitrogen content (%wt.)
FCFixed carbon (%)
ASHAsh content (%)
nNumber of measurements
yMeasured value
NNumber of data
ABEAverage biased error (%)
oRaw biomass

Author Contributions

Conceptualization, Y.H.; Methodology, Y.H.; Validation, M.H.; Formal Analysis, M.H. and Y.H.; Investigation, M.H. and Y.H.; Data Curation, M.H.; Writing-Original Draft Preparation, M.H.; Writing-Review & Editing, Y.H. and E.K.; Supervision, Y.H. and E.K.

Funding

This research received no external funding.

Acknowledgments

The funding support of Central Michigan University is gratefully acknowledged.

Conflicts of Interest

The authors declare no conflict of interest.

References

  1. Chen, W.; Peng, J.; Bi, X. A state-of-the-art review of biomass torrefation, densification and applications. Renew. Sustain. Energy Rev. 2015, 44, 847–866. [Google Scholar] [CrossRef]
  2. Mohr, S.H.; Wang, J.; Ellem, G.; Ward, J.; Giurco, D. Projection of world fossil fuels by country. Fuel 2015, 141, 120–135. [Google Scholar] [CrossRef]
  3. Shafiee, S.; Topal, E. When will fossil fuel reserves be diminished? Energy Policy 2009, 37, 181–189. [Google Scholar] [CrossRef]
  4. Madanayake, B.N.; Gan, S.; Eastwick, C.; Ng, H.K. Biomass as an energy source in coal co-firing and its feasibility enhancement via pre-treatment techniques. Fuel Process. Technol. 2017, 159, 287–305. [Google Scholar] [CrossRef]
  5. Herbert, G.M.J.; Krishnan, A.U. Quantifying environmental performance of biomass energy. Renew. Sustain. Energy Rev. 2016, 592, 92–308. [Google Scholar]
  6. Van der Stelt, M.J.C.; Gerhauser, H.; Kiel, J.H.A.; Ptasinski, K.J. Biomass upgrading by torrefaction for the production of biofuel: A Riview. Biomass Bioenergy 2011, 35, 3748–3762. [Google Scholar] [CrossRef]
  7. Haseli, Y. Process modeling of a biomass torrefaction plant. Energy Fuels 2018, 32, 5611–5622. [Google Scholar] [CrossRef]
  8. Repellin, V.; Govin, A.; Rolland, M.; Guyonnet, R. Energy requirement for fine grinding of torrefied wood. Biomass Bioenergy 2010, 34, 923–930. [Google Scholar] [CrossRef] [Green Version]
  9. Demirbas, A. Calculation of higher heating values of biomass fuel. Fuel 1997, 76, 431–434. [Google Scholar]
  10. Parikh, J.; Channiwala, S.A.; Ghosal, G.K. A correlation for calculating elemental composition from proximate analysis of biomass materials. Fuel 2007, 86, 1710–1719. [Google Scholar] [CrossRef]
  11. Shen, J.; Zhu, S.; Liu, X.; Zhang, H.; Tan, J. The prediction of elemental composition of biomass based on proximate analysis. Energy Convers. Manag. 2010, 51, 983–987. [Google Scholar] [CrossRef]
  12. Yin, C.Y. Prediction of higher heating values of biomass from proximate. Fuel 2011, 90, 1128–1132. [Google Scholar] [CrossRef]
  13. Friedl, A.; Padouvas, E.; Rotter, H.; Varmuza, K. Prediction of heating values of biomass fuel from elemental composition. Anal. Chim. Acta 2005, 544, 191–198. [Google Scholar] [CrossRef]
  14. Vargas-Morenoa, J.M.; Callejón-Ferrea, A.J.; Pérez-Alonsoa, J.; Velázquez-Martí, B. A review of the mathematical models for predicting the heating value of biomass materials. Renew. Sustain. Energy Rev. 2012, 16, 3065–3083. [Google Scholar] [CrossRef]
  15. Bridgeman, T.G.; Jones, J.M.; Shield, I.; Williams, P.T. Torrefaction of reed canary grass, wheat straw and willow to enhance solid fuel qualities and combustion properties. Fuel 2008, 87, 844–856. [Google Scholar] [CrossRef]
  16. Joshi, Y.; de Vries, H.; Woudstra, T.; de Jong, W. Torrefaction: Unit operation modelling and process simulation. Appl. Therm. Eng. 2015, 74, 83–88. [Google Scholar] [CrossRef]
  17. Nhucchen, D.R. Prediction of carbon, hydrogen, and oxygen compositions of raw and torrefied biomass using proximate analysis. Fuel 2016, 180, 348–356. [Google Scholar] [CrossRef]
  18. Nhuccen, D.R.; Afzal, M.T. HHV Predicting Correlations for Torrefied Biomass Using Proximate and Ultimate Analyses. Bioengineering 2017, 4, 7. [Google Scholar] [CrossRef] [PubMed]
  19. Soponpongpipat, N.; Sittikul, D.; Comsawang, P. Prediction model of higher heating value of torrefied biomass based on the kinetics of biomass decomposition. J. Energy Inst. 2015, 89, 425–435. [Google Scholar] [CrossRef]
  20. Sarvaramini, A.; Assima, G.P.; Larachi, F. Dry torrefaction of biomass-Torrefied products and torrefaction kinetics using the distributed activation energy model. Chem. Eng. J. 2013, 229, 498–507. [Google Scholar] [CrossRef]
  21. Bach, Q.V.; Tran, K.Q.; Skreiberg, O.; Trinh, T.T. Effects of wet torrefaction on pyrolysis of woody biomass fuels. Energy 2015, 88, 443–456. [Google Scholar] [CrossRef]
  22. Pach, M.; Zanzi, R.; Björnbom, E. Torrefied Biomass a Substitute for Wood and Charcoal. In Proceedings of the 6th Asia-Pacific International Symposium on Combustion and Energy Utilization, Kuala Lumpur, Malaysia, 20–22 May 2002. [Google Scholar]
  23. Tapasvi, D.; Khalil, R.; Tran, K.Q. Torrefaction of Norwegian Birch and Spruce: An Experimental Study Using Macro-TGA. Energy Fuels 2012, 26, 5232–5240. [Google Scholar] [CrossRef]
  24. Shoulaifar, T.K.; DeMartini, N. Ash-Forming Matter in Torrefied Birch Wood: Changes in Chemical Association. Energy Fuels 2013, 27, 5684–5690. [Google Scholar] [CrossRef]
  25. Arteaga-Pérez, L.E.; Segura, C. Torrefaction of Pinus radiata and Eucalyptus globulus: A combined experimental and modeling approach to process synthesis. Energy Sustain. Dev. 2015, 29, 13–23. [Google Scholar] [CrossRef]
  26. Phanphanich, M.; Mani, S. Impact of torrefaction on the grindability and fuel characteristics of forest biomass. Bioresour. Technol. 2011, 102, 1246–1253. [Google Scholar] [CrossRef] [PubMed]
  27. Li, M.F.; Chen, L.X. Evaluation of the structure and fuel properties of lignocelluloses through carbon dioxide torrefaction. Energy Convers. Manag. 2016, 119, 463–472. [Google Scholar] [CrossRef]
  28. Carmona, S.R.; Oerez, J.F. Effect of torrefaction temperature on properties of Patula pine. Maderas-Cienc. Tecnol. 2017, 19, 39–50. [Google Scholar] [Green Version]
  29. McNamee, P.; Adams, P.W.R.; McManus, M.C. An assessment of the torrefaction of North American pine and life cycle greenhouse gas emissions. Energy Convers. Manag. 2016, 113, 17–188. [Google Scholar] [CrossRef] [Green Version]
  30. Zheng, Y.; Tao, L.; Yang, X. Effect of the torrefaction Temperature on structural properties and pyrolysis behavior of biomass. BioResource 2017, 12, 3425–3447. [Google Scholar] [CrossRef]
  31. Grigiante, M.; Antolini, D. Mass yield as guide parameter of the torrefaction process. An experimental study of the solid fuel properties referred to two types of biomass. Fuel 2015, 153, 499–509. [Google Scholar] [CrossRef]
  32. Nanou, P.; Carbo, M.C.; Keil, J. Detailed mapping of the mass and energy balance of a continuous biomass torrefaction plant. Biomass Bioenergy 2016, 89, 67–77. [Google Scholar] [CrossRef]
  33. Larsson, S.H.; Rudolfsson, M. Effects of moisture content, torrefaction temperature, and die temperature in pilot scale pelletizing of torrefied Norway spruce. Appl. Energy 2013, 102, 827–832. [Google Scholar] [CrossRef]
  34. Ibrahim, R.H.H.; Dravell, L.I.; Jones, J.M.; Williams, A. Physicochemical characterisation of torrefied biomass. J. Anal. Appl. Pyrolysis 2013, 103, 21–30. [Google Scholar] [CrossRef]
  35. Chen, W.H.; Cheng, W.Y.; Lu, K.M.; Huang, Y.P. An evaluation on improvement of pulverized biomass property for solid fuel through torrefaction. Appl. Energy 2011, 88, 3636–3644. [Google Scholar] [CrossRef]
  36. Arias, B.; Pevida, C.; Fermoso, J.; Plaza, M.G.; Rubiera, F.; Pis, J.J. Influence of torrefaction on the griandability and reactivity of woody biomass. Fuel Process. Technol. 2008, 89, 169–175. [Google Scholar] [CrossRef] [Green Version]
  37. Na, B.; Ahn, B.J.; Lee, J.W. Changes in chemical and physical properties of yellow poplar (Liriodendron tulipifera) during torrefaction. Wood Sci. Technol. 2015, 49, 257–272. [Google Scholar] [CrossRef]
  38. Gucho, E.M.; Shahzad, K.; Bramer, E.A.; Brem, G. Experimental Study on Dry Torrefaction of Beech Wood and Miscanthus. Energies 2015, 8, 3903–3923. [Google Scholar] [CrossRef] [Green Version]
  39. Wannapeera, J.; Worasuwannarak, N. Examinations of chemical properties and pyrolysis behaviors oftorrefied woody biomass prepared at the same torrefactionmass yields. J. Anal. Appl. Pyrolysis 2015, 115, 279–287. [Google Scholar] [CrossRef]
  40. Huang, Y.F.; Sung, H.T.; Chiueh, P.T.; Lo, S.L. Microwave torrefaction of sewage sludge and leucaena. J. Taiwan Inst. Chem. Eng. 2017, 70, 236–243. [Google Scholar] [CrossRef]
  41. Wilk, M.; Magdziarz, A.; Kalemba, I. Characterisation of renewable fuels’ torrefaction process with different instrumental techniques. Energy 2015, 87, 259–269. [Google Scholar] [CrossRef]
  42. Yoo, H.S.; Choi, H.S. A study on torrefaction characteristics of waste sawdust in an auger type pyrolyzer. J. Mater. Cycles Waste Manag. 2016, 18, 460–468. [Google Scholar] [CrossRef]
  43. Mei, Y.; Liu, R.; Yang, Q.; Yang, H.; Shao, J.; Draper, C.; Zhang, S.; Chen, H. Torrefaction of cedarwood in a pilot scale rotary kiln and the influence of industrial flue gas. Bioresour. Technol. 2015, 177, 355–360. [Google Scholar] [CrossRef] [PubMed]
  44. Barta-Rajnai, E.; Jakab, E.; Sebestyen, Z.; May, Z.; Barta, Z.; Wang, L.; Skreiberg, O.; Gronil, M.; Bozi, J.; Czegeny, Z. Comprehensive Compositional Study of Torrefied Wood and Herbaceous Materials by Chemical Analysis and Thermoanalytical Methods. Energy Fuels 2016, 30, 8019–8030. [Google Scholar] [CrossRef] [Green Version]
  45. Montgomery, D.C.; Peck, E.A.; Vining, G.G. Introduction to Linear Regression Analysis, 5th ed.; John Wiley & Sons, Incorporated: New York, NY, USA, 2012. [Google Scholar]
  46. Comrie, A.C. Comparing Neural Networks and Regression Models for Ozone Forecasting. J. Air Waste Manag. Assoc. 1997, 47, 653–663. [Google Scholar] [CrossRef] [Green Version]
  47. Willmott, C.J. Some Comments on the Evaluation of Model Performance. Am. Metrol. Soc. 1982, 63, 1309–1317. [Google Scholar] [CrossRef]
  48. Bridgeman, T.G.; Jones, J.M.; Williams, A.; Waldron, D.J. An investigation of the grindability of two torrefied energy crops. Fuel 2010, 89, 3911–3918. [Google Scholar] [CrossRef] [Green Version]
  49. Brostrom, M.; Nordin, A.; Pommer, L.; Branca, C.; Blasi, C.D. Influence of torrefaction on the devolatilization and oxidation kinetics of wood. J. Anal. Appl. Pyrolysis 2012, 96, 100–109. [Google Scholar] [CrossRef]
Figure 1. Variation of (a) Carbon (% wt.) (b) Hydrogen (% wt.) and (c) Nitrogen (% wt.) with solid yield for different types of torrefied wood.
Energies 11 02443 g001aEnergies 11 02443 g001b
Figure 2. Relationship between HHV with (a) C content and (b) H content of torrefied wood.
Energies 11 02443 g002
Figure 3. Regression model plot for (a) C r (b) H r and (c)   HHV r .
Energies 11 02443 g003aEnergies 11 02443 g003b
Figure 4. Comparison of the predicted and measured values of (a) Carbon content, (b) Hydrogen content and (c) HHV.
Energies 11 02443 g004aEnergies 11 02443 g004b
Table 1. Summary of the experimental conditions of torrefaction (categorized by the feedstock type).
Feedstock
Type
Temperature (°C)Residence Time (min)References
MinimumMaximumMinimumMaximum
Birch2002801060[20,21,22,23,24]
Pine2003001560[22,25,26,27,28,29,30]
Spruce200300560[21,23,31,32,33]
Willow2303003060[32,34,35]
Eucalyptus2402901560[25,34,36]
Poplar2203002050[27,37]
Beech Wood2403001560[38]
Leaucaena240300540[39,40]
Wood Mixture2302903060[34,41]
Lauan2202503060[35]
Sawdust2203001060[42]
Cedarwood2002905050[43]
Black Locust2252506060[44]
Ash2502653943[32]
Aspen2402801560[20]
Table 2. Summary of the collected data (dry and ash free) categorized by the wood type.
WoodParameternMinMaxMeanWoodParameternMinMaxMean
Birch Y s   (%)1958.019776.33Pine Y s   (%)24659580.53
C (% wt.)1949.6156.9252.65C (% wt.)2449.4759.0353.74
N (% wt.)190.060.150.12N (% wt.)240.060.550.17
H (% wt.)195.516.185.88H (% wt.)244.786.745.8
HHV (MJ/kg)1918.8322.9320.97HHV (MJ/kg)2418.0725.3820.96
Spruce Y s   (%)2668.409781.3Eucalyptus Y s   (%)135886.071.64
C (% wt.)2650.657.4953.89C (% wt.)1350.9263.555.37
N (% wt.)260.060.210.1N (% wt.)130.000.20.1
H (% wt.)265.606.395.9H (% wt.)135.36.315.85
HHV (MJ/kg)2620.4622.9721.6HHV (MJ/kg)1319.452521.9
Willow Y s   (%)46368.7666.09Poplar Y s   (%)77395.082.14
C (% wt.)454.056.955.65C (% wt.)747.1255.150.69
N (% wt.)40.000.420.16N (% wt.)70.20.310.24
H (% wt.)45.76.416.02H (% wt.)75.35.985.78
HHV (MJ/kg)421.323.7122.5HHV (MJ/kg)718.520.819.6
Beech Wood Y s   (%)10609176.35Leaucaena Y s   (%)560.079.867.92
C (% wt.)1048.2255.8650.6C (% wt.)553.260.256.59
N (% wt.)100.130.230.16N (% wt.)50.70.90.81
H (% wt.)104.95.885.46H (% wt.)55.065.95.61
HHV (MJ/kg)1019.0122.0019.93HHV (MJ/kg)521.324.722.84
Lauan Y s   (%)359.882.374.73Sawdust Y s   (%)1658.09786.85
C (% wt.)354.3364.457.88C (% wt.)1646.961.051.16
N (% wt.)30.120.170.15N (% wt.)160.020.1.06
H (% wt.)36.376.996.73H (% wt.)165.16.05.61
HHV (MJ/kg)323.226.9224.45HHV (MJ/kg)1616.626.018.61
Wood Mixture Y s   (%)1458.890.573.07Cedar Wood Y s   (%)5698577.9
C (% wt.)1445.161.453.82C (% wt.)548.8256.1353.34
N (% wt.)140.00.210.83N (% wt.)50.480.830.61
H (% wt.)144.756.35.64H (% wt.)54.015.494.76
HHV (MJ/kg)1417.824.321.34HHV (MJ/kg)519.3521.2520.62
Black Locust Y s   (%)27987.083Ash & Aspen Y s   (%)464.586.474.23
C (% wt.)250.5952.7751.68C (% wt.)450.053.051.65
N (% wt.)20.210.230.22N (% wt.)40.020.160.08
H (% wt.)23.454.393.92H (% wt.)45.96.16.0
HHV (MJ/kg)219.3520.3819.86HHV (MJ/kg)420.021.120.55
Table 3. Regression models for predicting the C and H contents and HHV of torrefied wood.
Dependent VariableIndependent Variable(s)RMSEBias R 2   ( % ) Eq. No.
  C r   Y s 0.037   1.4 × 10 19 81.5213
Y s , C0.028   1.5 × 10 19 89.8614
  H r   Y s 0.059   3.2 × 10 21 79.0115
Y s , H0.043   8.4 × 10 20 88.4516
  HHV r   C r 0.023   4.7 × 10 19 92.8017
Table 4. The coefficients of Equations (13)–(17).
Eq. No Eq. No
13 a 1 b 1 14 a 2 b 2 c 2
0.2847 7.405 × 10 3 −0.47289 9.8562 × 10 3 1.0633 × 10 2
15 a 3 b 3 16 a 4 b 4 c 4
−0.1145 1.067 × 10 2 −0.55735 9.9884 × 10 3 8.6329 × 10 2
17 a 5 b 5
4.6508 × 10 2 0.94497
Table 5. Comparison of the newly developed C, H and HHV correlations with others.
CorrelationReferenceABE a (%)RMSE
  C C o = 0.7405 + 28.47 Y s
C C o = 0.47289 + 9.8562 × 10 3 Y s 0.01 Y s 0.010633 C o
Current Study−2.4
4.0
2.12
3.30
C = 0.637 FC + 0.455 VM [10]−12.17.39
C = 0.635 FC + 0.460 VM 0.095 ASH [11]−11.77.23
C = 35.9972 + 0.7698 VM + 1.3269 FC + 0.3250 ASH [17]−6.13.86
  H H o = 1.067 11.45 Y s  
H H o = 0.55735 + 9.9884 × 10 3 Y s 0.01 Y s 0.086329 H o
Current Study−2.4
−4.8
0.24
0.88
H = 0.052 FC + 0.062 VM [10]−1.80.26
H = 0.059 FC + 0.060 VM + 0.010 ASH [11]−1.40.26
H = 55.3678 0.4830 VM 0.5319 FC 0.5600 ASH [17]11.90.82
  HHV HHV o = 4.6508 Y s + 0.94497 C C o Current Study−3.1 b1.02
2.93 c1.24
HHV = 0.1905 VM + 0.2521 FC [12]
[12]
−8.72.32
HHV = 0.2949 C + 0.8250 H −3.20.92
HHV = 3.55 C 2 232 C 2230 H + 51.2 CH + 131 N + 20600 [13]1.30.44
HHV = 0.1846 VM + 0.3525 FC [18]
[18]
−0.60.78
HHV = 32.7934 + 0.0053 C 2 0.5321 C 2.8769 H + 0.0608 CH 0.2401 N 2.20.55
a A B E = 1 n i = 1 n ( y i * y i ) / y i , b carbon content calculated using Equation (18), c carbon content calculated using Equation (19).

