Concept Paper

Fuel-Optimal Thrust-Allocation Algorithm Using Penalty Optimization Programing for Dynamic-Positioning-Controlled Offshore Platforms

1
Daewoo Shipbuilding and Marine Engineering Co., LTD., 125, Namdaemun-ro, Jung-gu, Seoul 04521, Korea
2
Ocean Engineering, Texas A&M University, College Station, TX 77843, USA
*
Author to whom correspondence should be addressed.
Energies 2018, 11(8), 2128; https://doi.org/10.3390/en11082128
Submission received: 12 July 2018 / Revised: 8 August 2018 / Accepted: 9 August 2018 / Published: 15 August 2018

Abstract

:
This research, a new thrust-allocation algorithm based on penalty programming is developed to minimize the fuel consumption of offshore vessels/platforms with dynamic positioning system. The role of thrust allocation is to produce thruster commands satisfying required forces and moments for position-keeping, while fulfilling mechanical constraints of the control system. The developed thrust-allocation algorithm is mathematically formulated as an optimization problem for the given objects and constraints of a dynamic positioning system. Penalty programming can solve the optimization problems that have nonlinear object functions and constraints. The developed penalty-programming thrust-allocation method is implemented in the fully-coupled vessel–riser–mooring time-domain simulation code with dynamic positioning control. Its position-keeping and fuel-saving performance is evaluated by comparing with other conventional methods, such as pseudo-inverse, quadratic-programming, and genetic-algorithm methods. In this regard, the fully-coupled time-domain simulation method is applied to a turret-moored dynamic positioning assisted FPSO (floating production storage offloading). The optimal performance of the penalty programming in minimizing fuel consumption in both 100-year and 1-year storm conditions is demonstrated compared to pseudo-inverse and quadratic-programming methods.

1. Introduction

The dynamic positioning system (DPS) is the unit that automatically keeps the position of offshore platforms by controlling actuators to encounter environmental forces. Currently, dynamic positioning systems are installed on many vessels that are used in offshore operations, such as drilling, production, and exploration. They directly manage operational safety by keeping positions and preventing unexpected drift. Dynamic positioning systems involve safety related units, such as sensors, power management system, generator, and control actuators. DP units are usually the heaviest fuel consumer and second most expensive unit in the offshore-platform CAPEX (capital expenditure) [1]. According to the offshore-industry statistics, the fuel consumption occupies 62% of the total expenditure and dynamic positioning system consumes the largest amount of fuel, which results in the largest gas pollution, equal to 48%, among various offshore operations [2]. Thus, for the reduction of offshore platform’s fuel consumption and gas emission, the development of an efficient DP system and control is crucial. Even 5% fuel consumption improvement in a dynamic positioning system can save about 9 million dollars in 20 years, including carbon dioxide handling cost. This economic merit can be increased in the future because environmental regulations for gas emission are continuously becoming tightened up.
Thrust-allocation research for minimal total thrust have been conducted actively since 1960 [3]. In Johansen [3], the state-of-the-art thrust-allocation methods were reviewed and summarized. In this article, linear and nonlinear, constrained and unconstrained quadratic programming and other optimization applications to marine industry, were explained. Generally, DP vessels have over-actuated control systems that have more actuators than the required number of degrees of freedom. Therefore, thrust allocation can be solved by using optimization algorithms. The pseudo-inverse method has been widely used in the industrial application (e.g., Johansen [3]; Ryu [4]) because of its simplicity, which is beneficial for the online computation that requires real time computing, mostly within one second. However, there are disadvantages involved in using the pseudo-inverse method. It cannot give elaborate thruster-allocation values when the required force exceeds physical limitations of thrusters, such as thruster capacity and rate constraints. For dealing with this drawback, the quadratic programming was proposed as an alternative optimization strategy for total-thrust-power minimization. Quadratic programming is the suitable optimization strategy when it has a quadratic object function and linear thruster constraints. The industrial quadratic programing for DP system was modeled, for example, in Johansen [5]. In Wit [6], the pseudo-inverse method and the quadratic-programming method were compared. According to the reference, the quadratic programming gave more elaborate solutions than the pseudo-inverse method under thruster saturation and failure condition. In Rindaroy [7], by using quadratic programming, he solved thrust-allocation problems to minimize fuel consumption and power load.
On the other hand, In Zhao [8], the hybrid method that combines genetic algorithm (e.g., Caponetto et al. [9]) and sequential quadratic programming was employed to solve the thrust-allocation problem for a semisubmersible drilling rig. Regarding the thrust allocation as the process of decision making, the fuzzy control and neural network could be employed (e.g., Saddat [10], Vrkalovic [11], and Malecki [12]). The suggested thrust-allocation method achieved 2% power reduction compared to the pseudo-inverse method. The optimized thrust-allocation command should be done within a second, which is crucial for the real-time industrial DP controller. If thrust-allocation time takes longer than that, the solution is not feasible due to the time lag for the control. In this regard, the genetic algorithm is not directly applicable at this point. In the present study, an alternative optimization scheme called penalty programming is newly applied considering that it can be applied to real-time control and deal with any types of constraints and objective functions.
Most of previous DP-related studies have been limited to the vessel-only case without including mooring lines. Another unique feature of the present paper is the fully-coupled dynamic simulation among hull, mooring, riser, and DP system in time domain. Using the developed fully coupled time-domain simulation program, the accumulated fuel consumption for given platform, environment, and duration can be obtained.
This research formulated the fuel-optimal thrust-allocation algorithm by using penalty programming optimization frame. Also, it was implemented in the thrust-allocation module and coupled time-domain simulation. The developed algorithm was then applied to a turret moored FPSO in storm conditions to demonstrate its efficiency compared to other existing thruster-allocation methods, such as pseudo-inverse and quadratic-programming methods. To draw more general conclusions, several different scenarios were considered.
In the following, the DP mechanism and thrust-allocation problem are explained in Section 2. In Section 3, the formulation of optimization in allocating thrust for minimal fuel consumption is presented. In Section 4, the implementation of the optimization algorithm is described. Then, the coupled time-domain-simulation method is stated in Section 5. Section 6 and Section 7 present the comparisons between the proposed penalty method and existing methods by using the time- domain simulations of DP-assisted FPSO-equipped six azimuth thrusters, which are followed by concluding remarks.

2. Conventional DP-Control Conceptual Diagram

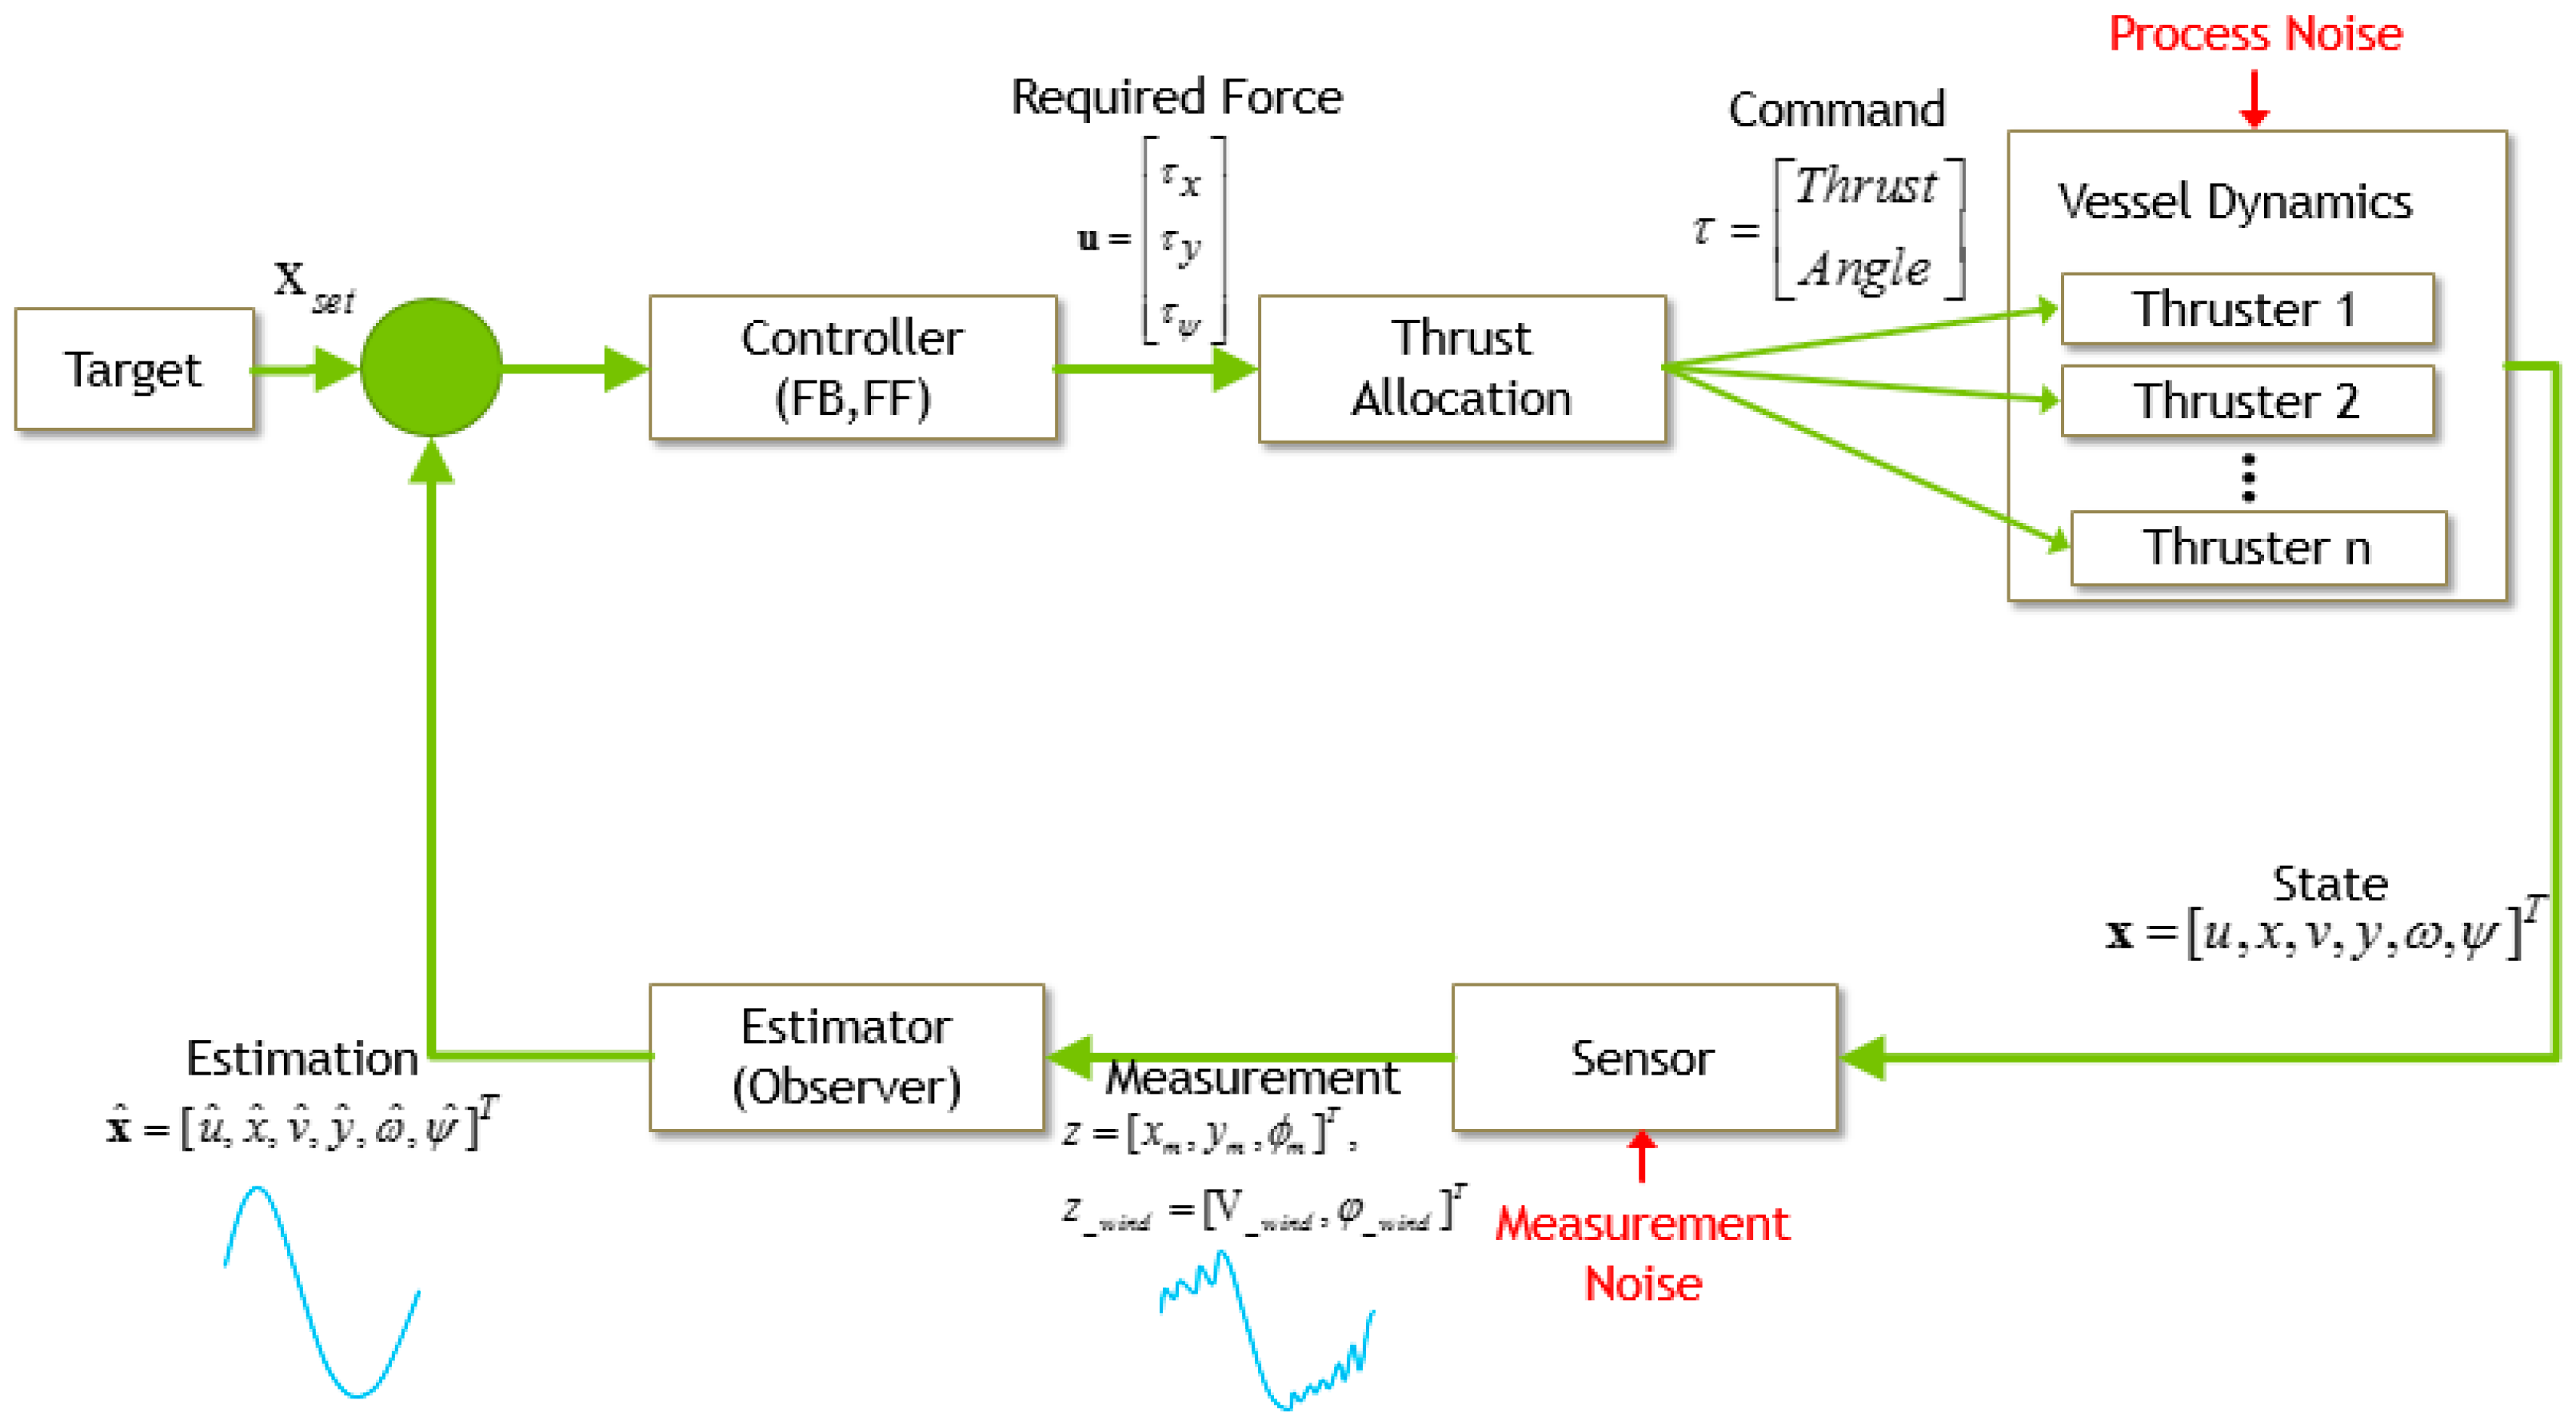
The conventional DP-control algorithm consists of three modules: estimation, control, and thrust allocation. Figure 1 presents the conceptual diagram of a conventional DP algorithm.
Generally, the Kalman filter (or the extended Kalman filter (EKF)) is applied to the estimation module that estimates states from weighted mathematical estimations and sensor measurements. The estimation module produces state estimations that are generally the position, velocity, and acceleration of offshore platform. Also, the estimation module filters out high-frequency motions because they are hard to control and cause the wear-and-tear problems of actuators. The control module of dynamic positioning controller calculates required forces and moments to keep a position counteracting the environmental forces. Conventional DPS adopts the Proportional–Integral–Derivative (PID) controllers that set the relationship between control forces and state errors by applying appropriate gain control to state error. By design, the PID controller sets the gain matrix K as in Equation (1):
u = K e ,
where error matrix e = x ^ x t arg e t , u is thruster-command matrix, x ^ is a state estimation matrix, and x t arg e t is a target state matrix.
The role of thrust allocation is to distribute required forces and moments to control actuators, such as tunnel thrusters, azimuth thrusters, propellers, and rudders. Basically, the control actuator system is an over-actuated system, for which the number of control actuators is larger than the number of degrees of freedom for control. Therefore, the thruster-allocation problem can be modeled as an optimization problem. The thruster-allocation problem can be expressed by Equation (2).
τ = Β u
where B is the thruster configuration matrix, τ is the 3 degrees of freedom control force in horizontal plane, and u is the input control matrix of the actuator.
Typically, the pseudo-inverse method finds a local optimum for minimizing the total thrust input square based on the Lagrange multiplier optimization theory as explained in Johansen [3]. The pseudo-inverse matrix is calculated by the pseudo-inversed thruster configuration matrix, as in Equation (3):
C = B + = B T ( B B T ) 1 ,
where B is the thruster-configuration matrix and C is the pseudo-inverse matrix of the configuration matrix. Then, the thrust matrix u can be solved as in Equation (4).
u = C τ = B T ( B B T ) 1 τ
The pseudo-inverse matrix method has the advantages of simplicity and practicality. If the thruster configuration matrix does not have any singularity, then it can be calculated by the direct simple matrix calculation. Thus, the computational burden of the pseudo-inverse method is light. This is the reason why the pseudo-inverse method has been used widely in industrial DP controllers with real-time control. However, the pseudo-inverse method has two serious disadvantages. The first one is that it cannot produce an elaborate solution when environmental forces are higher than thruster capacity. The second problem is that it cannot consider the constraints of the thruster, so its performance is degraded [3]. The pseudo-inverse method is employed here as a representative conventional DP thrust-allocation method for comparison with the newly-developed thrust-allocation algorithm called penalty method. For compensating the pseudo-inverse method’s disadvantage, the quadratic programming was proposed as an alternative thruster-allocation optimization method by Wit [6] and Rindaroy [7]. Quadratic programming is appropriate when solving the quadratic-form objective and linear-constrained optimization.

3. Optimization Formulation for Thruster Allocation Based on Penalty Programming

The thrust allocation of a dynamic positioning system is the optimization problem which has nonlinear object function and constraints. Rindaroy [7] linearized the constraints of the thrust allocation and applied quadratic programming, which is an adequate optimization method for nonlinear object function and linear constraint. In this study, penalty programming, which is the suitable method for both linear and nonlinear object functions and constraints, is applied to directly solve the optimal thrust allocation. The representative optimization methods were categorized depending on the forms of object functions and constraints [13], as in Table 1.
The procedure of optimization consists of three stages: optimization variable design (object functions and constraints modeling), optimization problem formulation, and numerical approach. It is necessary to design optimization variables so that those variables reflect real-world problems well, which makes the optimization more credible. The optimization formulation is the stage that defines object functions and constraints according to the optimization strategy. The numerical approach is the step that implements the mathematical form into computer program. The following section states which parameters are important in the thruster allocation, and how those can be derived in mathematical forms.

3.1. Object-Function Modeling: Fuel Consumption

This research focuses on the design of thrust-allocation optimization that can achieve the minimal fuel consumption. Therefore, the fuel consumption is to be the most important parameter here. It is then essential to model a relationship between the thrust and fuel consumption because the object function should be parameterized by the design variables. The fuel consumption of the marine diesel engine can be expressed by the power series of thrust. According to Rindaroy [7], the power consumption and thrust have the following relationship:
T = T o r 2 ,   P = P o r 3 , P = | T | 3 2 , F = a 0 + a 1 P + a 2 P 2 = a 0 + a 1 | T | 3 2 + a 2 | T | 3 ,
where: F : f u e l   c o n s u m p t i o n , T : t h r u s t , P : P o w e r , T 0 : m a x i m u m   t h r u s t , P 0 : m a x i m u m   p o w e r a 0 , a 1 , a 2 : c o n s t a n t s   f o r   f u e l   c o n s u m p t i o n r :   r e v o l u t i o n   p e r   m i n u t e .
The fuel consumption and power relation are based on the marine diesel engine. The fuel consumption could be modeled as Equation (6) as a quadratic form. The total thrust of previous time step was used for the modeling of current time step.
F u e l   C o n s u m p t i o n = a 0 + a 1 | T | 3 2 + a 2 | T | 3 = u K u T ,
where u = ( T 1 cos α 1 , T 1 sin α 1 , ... , T n cos α n , T n sin α n ) T and
K = [ ( a 0 ( T 1 , p r e v i o u s cos α 1 ) 2 + a 1 T 1 , p r e v i o u s cos α 1 + a 2 | T 1 , p r e v i o u s cos α 1 | ) .. .. .. .. 0 . ( a 0 ( T 1 , p r e v i o u s sin α 1 ) 2 + a 1 T 1 , p r e v i o u s sin α 1 + a 2 | T 1 , p r e v i o u s sin α 1 | ) . . . . . . . . ( a 0 ( T n , p r e v i o u s cos α n ) 2 + a 1 T n , p r e v i o u s cos α n + a 2 | T n , p r e v i o u s cos α n | ) . 0 .. .. .. .. ( a 0 ( T n , p r e v i o u s sin α n ) 2 + a 1 T n , p r e v i o u s sin α n + a 2 | T n , p r e v i o u s sin α n | ) ]  
where K is an n by n coefficient matrix which presents the fuel consumption in quadratic form, u is thrust input, n is the number of thrusters, and α is the angle of thruster.

3.2. Thruster Mehcanical Constraints

Two physical-constraint groups of thrusters are considered for the fuel-optimal thrust-allocation problem. The first constraint group is the thrust and thruster-angle constraints, as in Equation (7).
( T i cos α i ) 2 + ( T i sin α i ) 2 T i , max 2 ,
where T i is the thrust of i-th thruster (i = 0, …, n), α i is the azimuth angle of i-th thruster, T i , max is the maximum thruster capacity of i-th thruster.
Another constraint group is the thrust-variation rate that can be considered as the movable range of thrust per unit time, as in Equation (8).
( T i cos α i T i , p r e v i o u s cos α i , p r e v i o u s Δ t ) 2 + ( T i sin α i T i , p r e v i o u s sin α i , p r e v i o u s Δ t ) 2 ( T ˙ i , max ) 2 ( α i α i , p r e v i o u s Δ t ) 2 ( α ˙ i , max ) 2 ,
where T i is the current time-step thrust of i-th thruster (i = 0,…,1), α is the current azimuth angle of i-th thruster, T i , p r e v i o u s is the previous time-step’s thrust of i-th thruster (i = 0,…,1), α i , p r e v i o u s is the azimuth angle of previous time-step of i-th thruster, T ˙ i , max is the maximum thrust rate per unit time of i-th thruster, and α ˙ i , max is the maximum thrust rate per unit time of i-th thruster.

3.3. Required Force and Moment Constraints

The required forces and moments can be defined by the multiplication of PD gain and error matrix. The required forces and moments are the equality constraints, which should be satisfied by the thrust-allocation optimization problem. The key function of PD-controller design is to define the gain control. PD-controller design assumes offshore platform as linear time-invariant system. The corresponding system of equations of motions follows the form (e.g., Ryu [4]):
x ˙ = A x + B u ,   y = C x + v ,
where dot (∙) denotes time derivative. Each vector written in bold-type can be described by the following set of definitions: State x = [ u , x , v , y , ω , ψ ] T Control Input u = [ τ x , τ y , τ ϕ ] T Measurement y = [ x , y , ψ ] T Measurement-Noise v = [ v x , v y , v ψ ] T , where A = M 1 [ 0 0 0 0 0 0 1 0 0 0 0 0 0 0 0 0 0 0 0 0 1 0 0 0 0 0 0 0 0 0 0 0 0 0 1 0 ]   B = E = M 1 [ 1 0 0 0 0 0 0 1 0 0 0 0 0 0 1 0 0 0 ]   C = [ 0 1 0 0 0 0 0 0 0 1 0 0 0 0 0 0 0 1 ]   M = [ M 11 0 0 0 0 0 0 1 0 0 0 0 0 0 M 22 0 M 26 0 0 0 0 1 0 0 0 0 M 62 0 M 66 0 0 0 0 0 0 1 ] M 11 = m + a 11 ( 0 ) , M 22 = m + a 22 ( 0 ) , M 26 = m + a 26 ( 0 ) , M 62 = m + a 62 ( 0 ) , M 66 = I + a 66 ( 0 ) , m is the mass of the floating structure, I is the moment of inertia with respect to z-axis, and a i j ( 0 ) are the added masses at zero frequency, and x ^ is the state estimation vector.
For calculating PD gains, the linear quadratic regulator (LQR) theory was applied. The LQR is conventionally used for finding an optimal control gain matrix K that can minimize state error and thruster usage together, as Equation (10):
J = 0 { e ( t ) T Q o e ( t ) + u ( t ) T R o u ( t ) } d t ,
where Q 0 = [ 10 10 0 0 0 10 10 0 0 0 1 ] , R o = [ 1 0 0 0 1 0 0 0 1 ] .
The prior research only analyzed the fuel optimal thrust allocation in the static domain, whereas the time-accumulated fuel consumption, which includes dynamic effects like the present paper, is a more meaningful measure for fuel consumption performance analysis. Moreover, the static-domain approach cannot directly evaluate whether the computational speed of thruster-allocation algorithm is feasible for real-time DP control or not.
The thrust allocation produces thruster commands with required force and moment constraints to keep the position of offshore platform by counteracting against environmental forces. In this research, the target object motion is the motion range in horizontal plane. Therefore, 3DOF force and moment constraints can be formulated, as in Equation (11). In this study, the example FPSO has six azimuth thrusters, so the index “n” becomes six:
X = T 1 cos α 1 + T 2 cos α 2 + ... T n cos α n Y = T 1 sin α 1 + T 2 sin α 2 + ... T n sin α n N = y 1 T 1 cos α 1 + x 1 T 1 sin α 1 y 2 T 2 cos α 2 + x 2 T 2 sin α 2 + ... y n T n cos α n + x n T n sin α n
where, X, Y, N are surge and sway forces, and yaw moment, respectively. T i is the total thrust of i-th thruster, x i , y i are the distances of i-th thrusters from center of gravity.

3.4. Optimization Problem Formulation

The thrust allocation can be formulated as the general form of optimization problem that uses optimization design variables as modeled in the previous section. It has a fuel-consumption object function, mechanical constraints, and required force constraints. It can be formulated as follows:
O b j e c t   F u n c t i o n f ( x , u ) =   u K u T w h e r e ,   u = ( T 1 cos α , T 1 sin α , .. T n cos α , T n sin α ) T I n e q u a l i t y   C o n s t r a i   n t s ( T i cos α i ) 2 + ( T i sin α i ) 2 T i , max 2 ( T i cos α i T i , p r e v i o u s cos α i , p r e v i o u s Δ t ) 2 + ( T i sin α i T i , p r e v i o u s sin α i , p r e v i o u s Δ t ) 2 ( T ˙ max ) 2 ( α i α i , p r e v i o u s Δ t ) 2 ( α ˙ i , max ) 2 E q u a l i t y   C o n s t r a i n   t s X = T 1 cos α 1 + T 2 cos α 2 + ... T n cos α n Y = T 1 sin α 1 + T 2 sin α 2 + ... T n sin α n N = y 1 T 1 cos α 1 + x 1 T 1 sin α 1 y 2 T 2 cos α 2 + x 2 T 2 sin α 2 + ... y n T n cos α n + x n T n sin α n
The penalty programming replaces a constrained optimization problem by the combination of unconstrained problems whose solution ideally converges to that of the original constrained problem. The advantage of the penalty programming is that there is no limitation as to how to construct the object function and constraint. Therefore, this can be used for the fuel-minimal thrust allocation with nonlinearity. The penalty problem can be formulated as Equation (13):
O b j e c t   F u n c t i o n f ( u ) =   u K u T w h e r e   u = ( T 1 cos α , T 1 sin α , .. T n cos α , T n sin α ) T P e n a l t y   F u n c t i o n p ( u ) = max [ 0 , ( T i cos α i ) 2 + ( T i sin α i ) 2 T i , max 2 ] 2 + max [ ( α i α i , p r e v i o u s Δ t ) 2 ( α ˙ i , max ) 2 ] max [ ( T i cos α i T i , p r e v i o u s cos α i , p r e v i o u s Δ t ) 2 + ( T i sin α i T i , p r e v i o u s sin α i , p r e v i o u s Δ t ) 2 ( T ˙ max ) 2 ] 2 + ( τ Β u ) 2
For solving the penalty problem, the penalty programming technique is necessary. At first, the penalty programming is modeled by including the object function and constraints like Equation (14):
q ( c , u ) = f ( u ) + c p ( u )
where f ( u ) is the object function, p ( u ) is the constraints function, c is penalty parameter.
According to the penalty convergence theorem [14], the following is valid:
If f(u), p(u) are continuous functions, then let “u” be the solution of the penalty programming. When penalty parameter “c” increases to infinity, the limit value of “u” exists. Then “u” is the optimum solution of penalty programming.
Therefore, when the penalty parameter “c” goes to infinity, the optimum solution will be found, mathematically. The numerical implementation will be stated in the following section.

4. Numerical Approach: Penalty-Programming Implementation

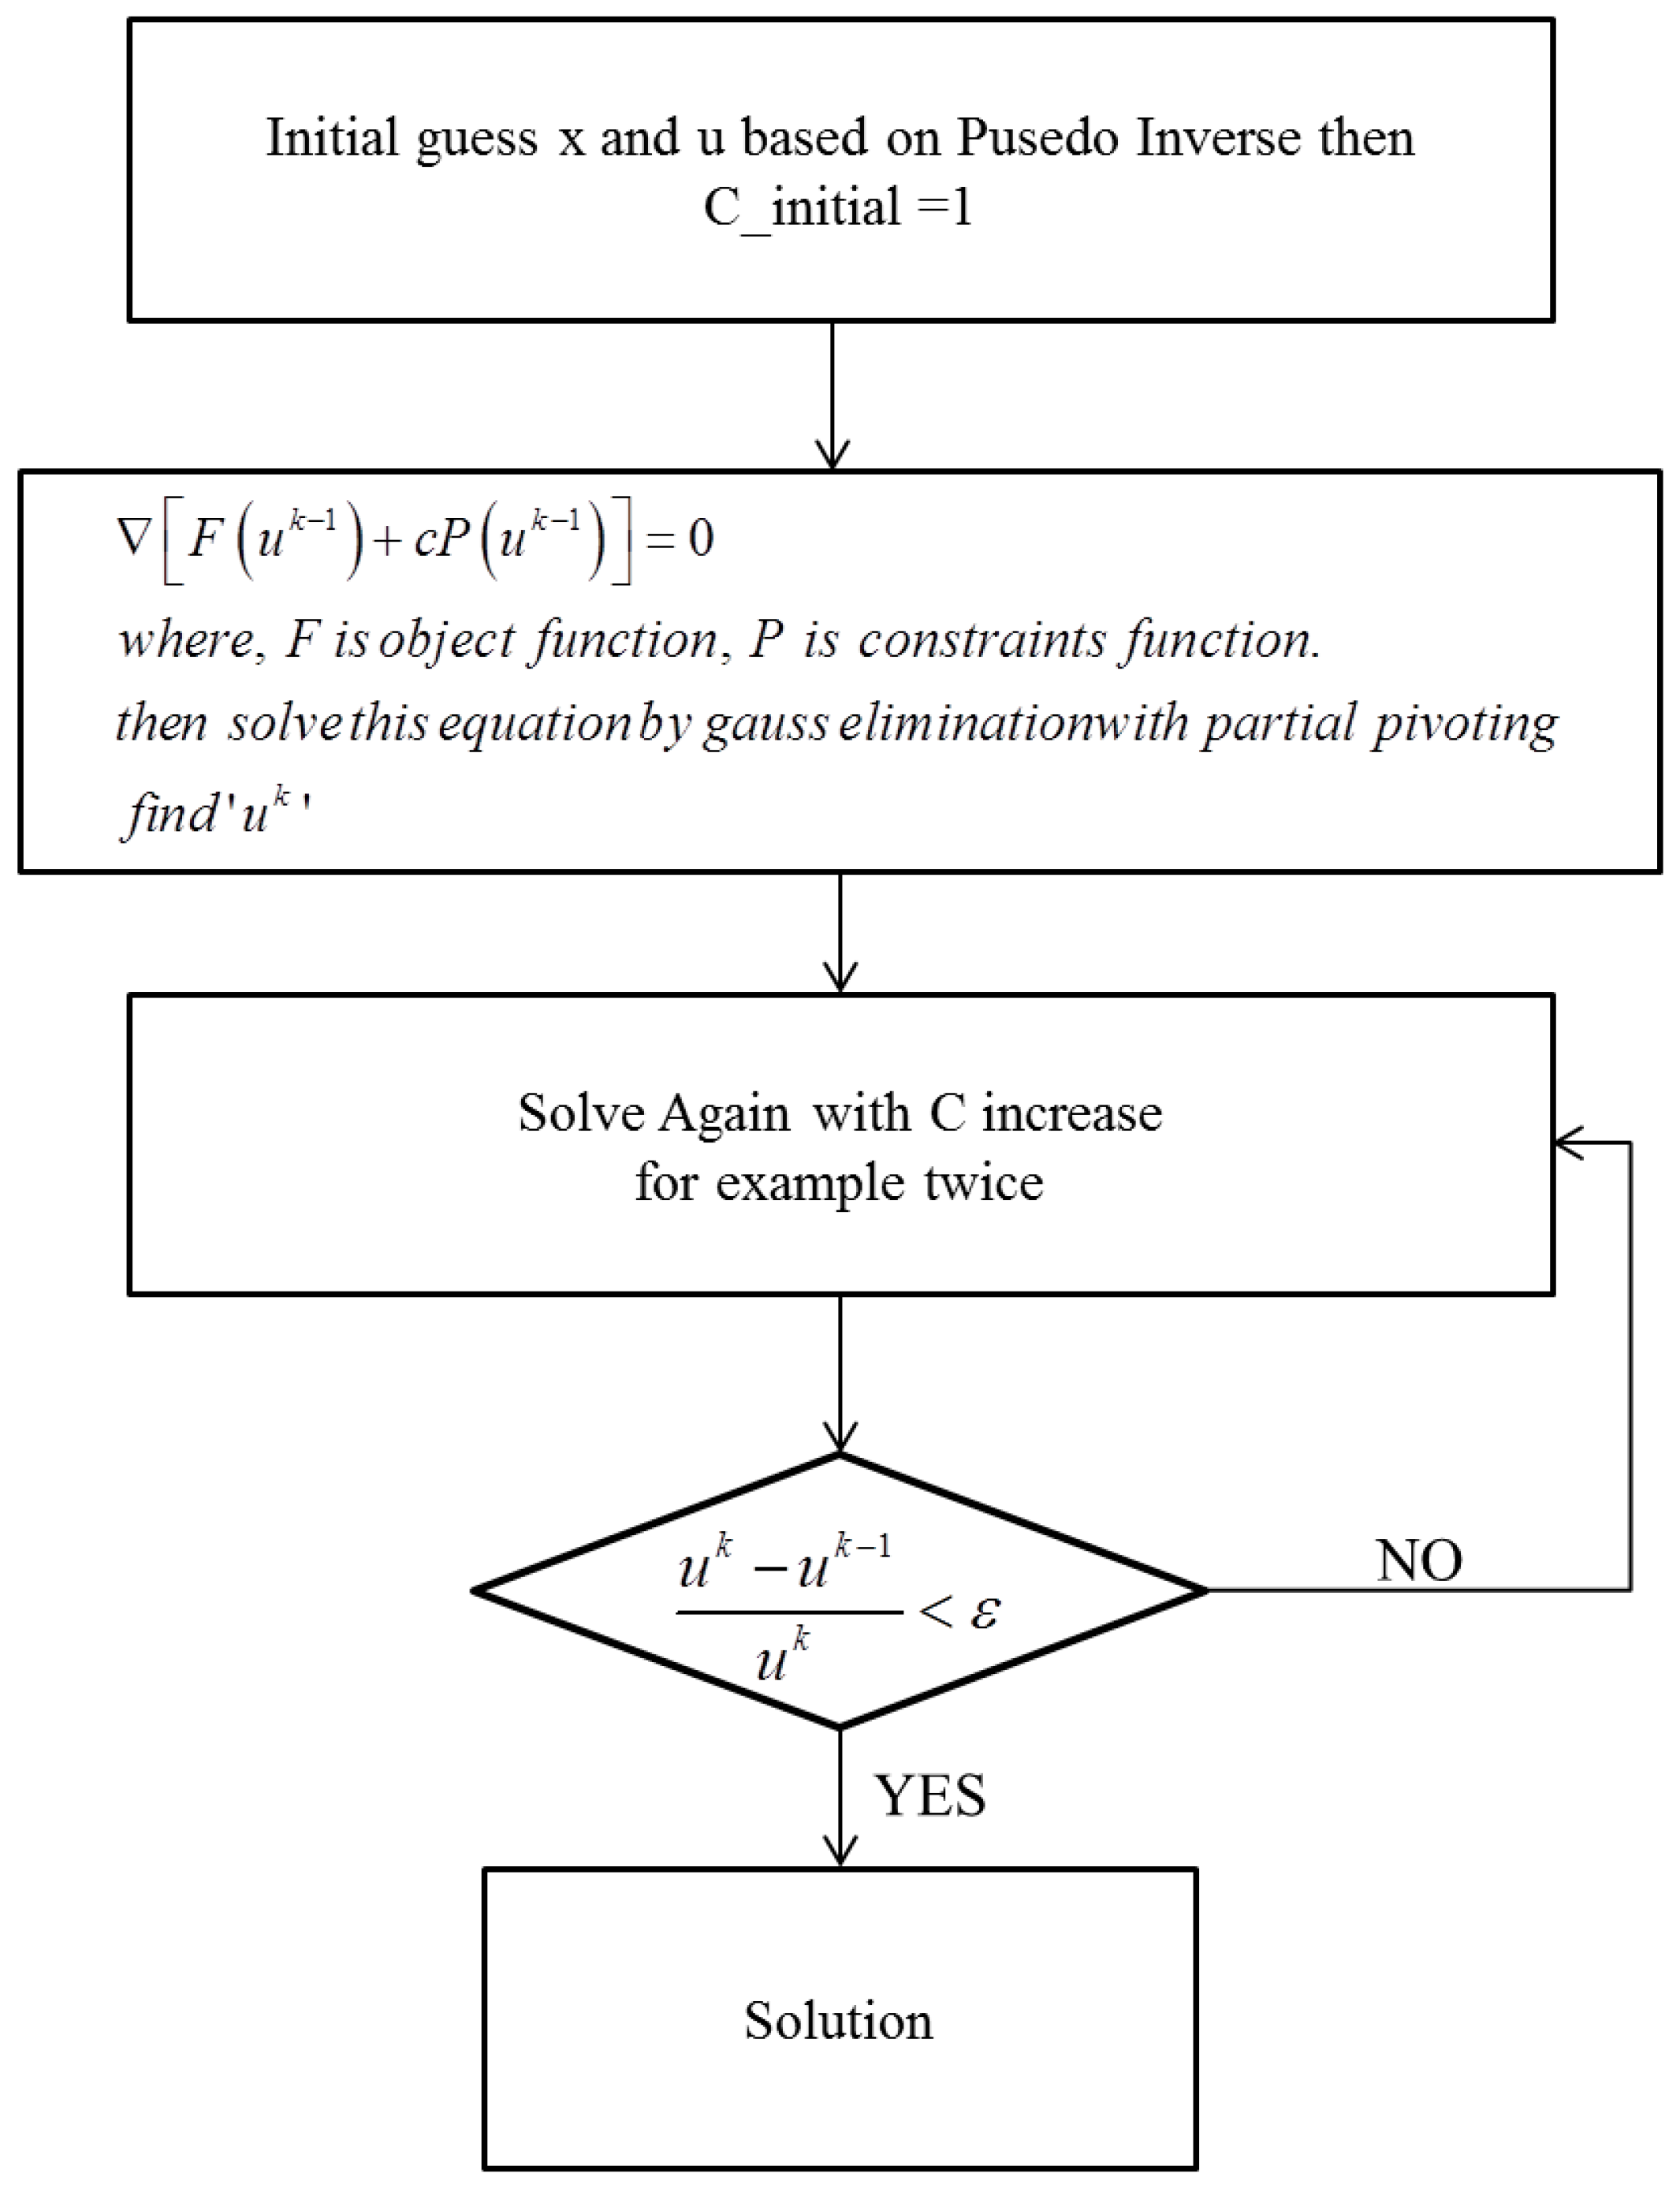
For the numerical implementation of penalty programming, the optimization simulation code was constructed and included in the thrust-allocation module. Figure 2 summarizes the flow chart of the penalty programming. For finding current-step thruster command, at first, the initial values were found by the pseudo-inverse method. Then, the penalty programming initializes the penalty parameter “C” as one. Then, the numerical approach finds the solution of the penalty program by using Gauss elimination with partial pivoting. Then, make C double the previous step’s C. Then, check that the solution is converged. The proposed algorithm converged well, compared to the quadratic programming and genetic algorithm.
For the given system, the solution’s existence and stability are evaluated, which is essential to provide the validity of the penalty programming.

4.1. Solution Existence

If the solution has convex area, then the solution of the penalty programming exists. In the case of a given thrust allocation, the area of thruster commands is convex, which is limited by the constraints. Therefore, the solution of penalty programming exists.

4.2. Solution Stability

Numerically, the probability of solution finding depends on the stability of system. The stability of a system could be defined as the condition number of system matrix. If system matrix is positive definite and the condition number defined as Equation (15) is converged, the system is stable.
Under the system of linear equation which has “n” number of thrusters,
Ax = B,
where
A = [ 1 + 2 c + c l 1 2 c l 1 l 2 c ( 1 + l 1 l 3 ) c l 1 l 4 c ( 1 + l 1 l 2 n 1 ) c l 1 l 2 n c l 2 l 1 1 + 2 c + c l 2 2 c l 2 l 3 c ( 1 + l 2 l 4 ) c l 2 l 2 n 1 c ( 1 + l 2 l 2 n ) c ( 1 + l 3 l 1 ) c l 3 l 2 1 + 2 c + c l 3 2 c l 3 l 4 c ( 1 + l 3 l 2 n 1 ) c l 3 l 2 n c l 4 l 1 c ( 1 + l 4 l 2 ) c l 4 l 3 1 + 2 c + c l 4 2 c l 4 l 2 n 1 c ( 1 + l 4 l 2 n ) c ( 1 + l 2 n 1 l 1 ) c l 2 n 1 l 2 c ( 1 + l 2 n 1 l 3 ) c l 2 n 1 l 4 1 + 2 c + c l 2 n 1 2 c l 2 n 1 l 2 n c l 2 n l 1 c ( 1 + l 2 n l 2 ) c l 2 n l 3 c ( 1 + l 2 n l 4 ) c l 2 n l 2 n 1 1 + 2 c + c l 2 n 2 ] l 1 = y 1 , l 2 = x 1 , l 3 = y 2 , l 4 = x 2 , ... , l 2 n 1 = y n , l 2 n = x n A = I + c B B = [ 2 + l 1 2 l 1 l 2 1 + l 1 l 3 l 1 l 4 1 + l 1 l 2 n 1 l 1 l 2 n l 2 l 1 2 + l 2 2 l 2 l 3 1 + l 2 l 4 l 2 l 2 n 1 1 + l 2 l 2 n 1 + l 3 l 1 l 3 l 2 2 + l 3 2 l 3 l 4 1 + l 3 l 2 n 1 l 3 l 2 n l 4 l 1 1 + l 4 l 2 l 4 l 3 2 + l 4 2 l 4 l 2 n 1 1 + l 4 l 2 n 1 + l 2 n 1 l 1 l 2 n 1 l 2 1 + l 2 n 1 l 3 l 2 n 1 l 4 2 + l 2 n 1 2 l 2 n 1 l 2 n l 2 n l 1 1 + l 2 n l 2 l 2 n l 3 1 + l 2 n l 4 l 2 n l 2 n 1 2 + l 2 n 2 ] t T B   t = i ( 2 + l i 2 ) t i 2 + 2 i < j j i = odd l i l j t i t j + 2 i < j j i = even ( 1 + l i l j ) t i t j = ( i l i 2 t i 2   +   2 i < j l i l j t i t j ) + ( i t i 2   +   2 i < j j i = even t i t j ) + i t i 2 = ( i l i t i ) 2   +   ( i t 2 i 1 ) 2   + ( i t 2 i ) 2 + i t i 2
Then, matrix B is positive definite. The eigenvalues of B matrix are
0 < λ 1 λ 2 ... λ 2 n 1 λ 2 n .
Then, the eigenvalues of matrix A are
0 < 1 + c λ 1 1 + c λ 2 ... 1 + c λ 2 n 1 1 + c λ 2 n .
Then,
C o n d i t i o n   N u m b e r   ( A ) = A A 1
i f   A   i s   s y m m e t r y   m a t r i x   t h e n c o n d ( A ) = | λ max λ min | w h e r e , λ   i s   e i g e n   v a l u e   o f   s y s t e m lim c   c o n d ( A )   =   lim c | λ max λ min | =   lim c   1 + c λ 2 n 1 + c λ 1 = λ 2 n λ 1

5. Time-Domain-Coupled Analysis

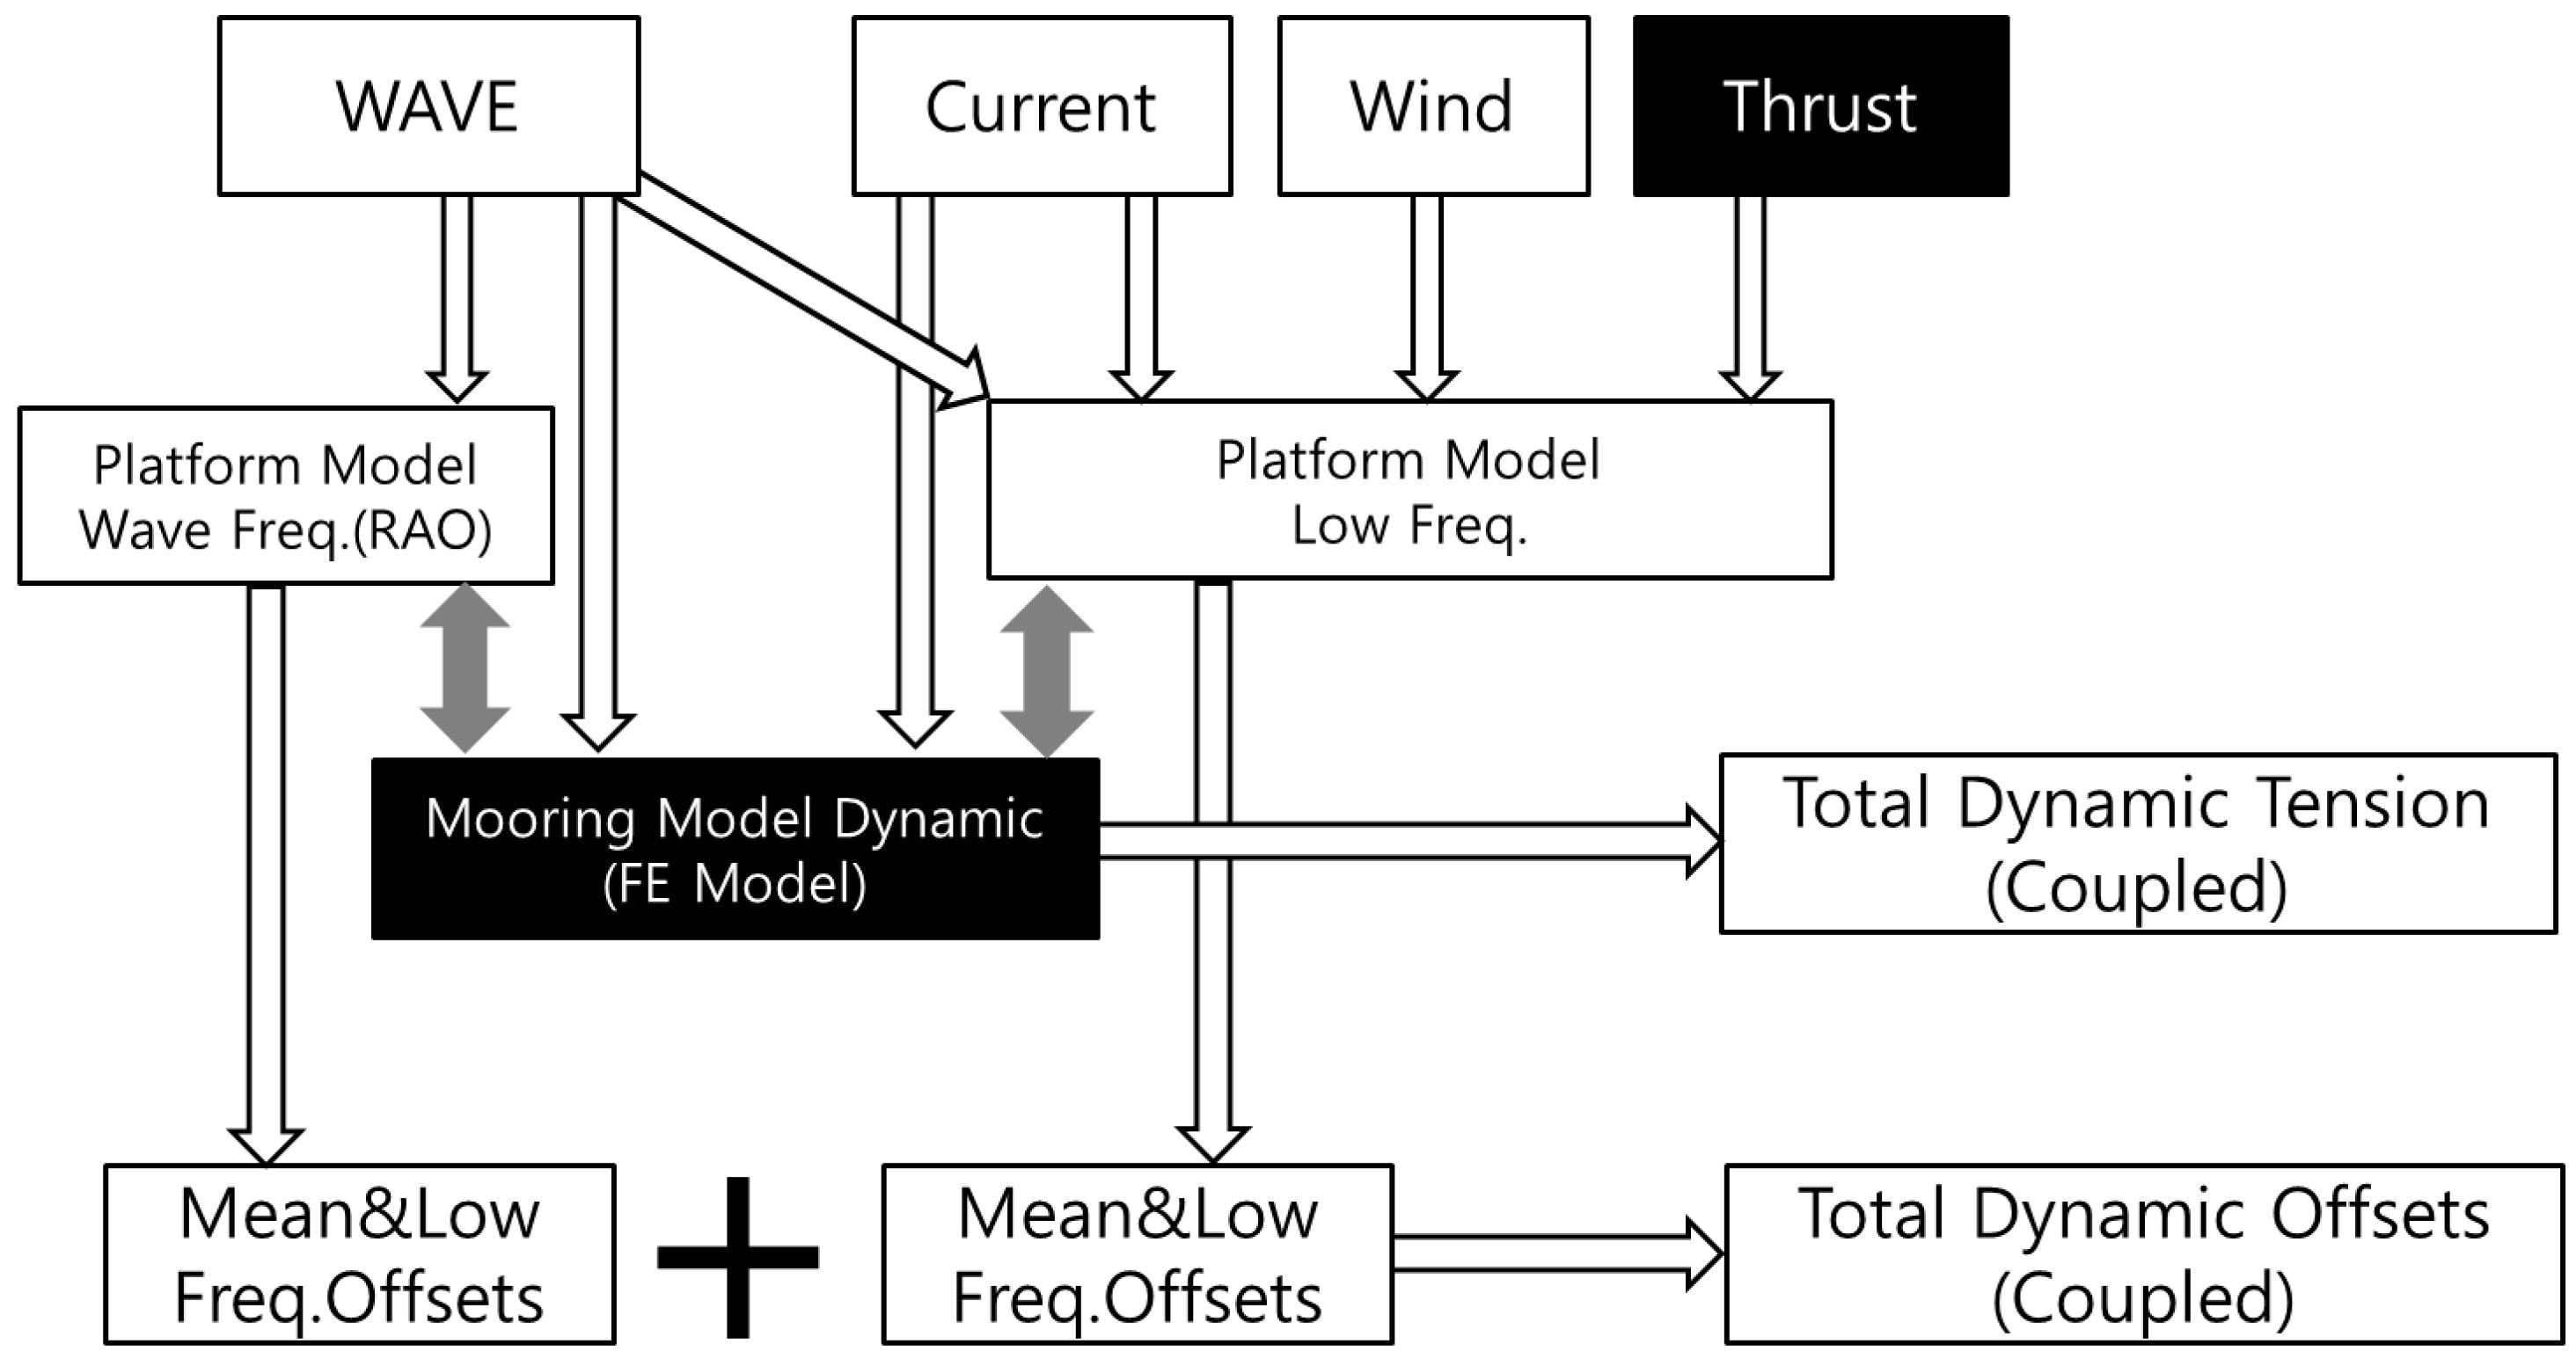
The above DP algorithms are implemented in the vessel–riser–mooring-coupled dynamic simulation program in time domain. Traditionally, a simplified approach is used in calculating vessel motions without coupling with risers and mooring lines.
As water depth increases, the mass/damping of the mooring lines and risers becomes larger, and their dynamic coupling with vessel should be considered for accurate vessel-motion simulations. Ryu [4] addressed the fact that the time domain coupled analysis is the most adequate for the hull–leg interaction because mooring lines and risers can significantly influence hull responses. The flowcharts of the simplified approach and the fully coupled analysis including DP control are compared in Figure 3 and Figure 4 (e.g., Ryu [4]).
Not to have thruster wear and tear, it is better not to counteract the Wave Frequency (WF) motion. Only the slowly varying motions are filtered for the platform control. For this purpose, a Kalman filter was adopted. The time-domain-coupled analysis is physically reasonable for the numerical simulations of thruster-assisted moored platforms, since the required thrust should be calculated in every time step with other external forces.

6. Comparison with Reproduced Quadratic-Programming-Based Thrust Allocation

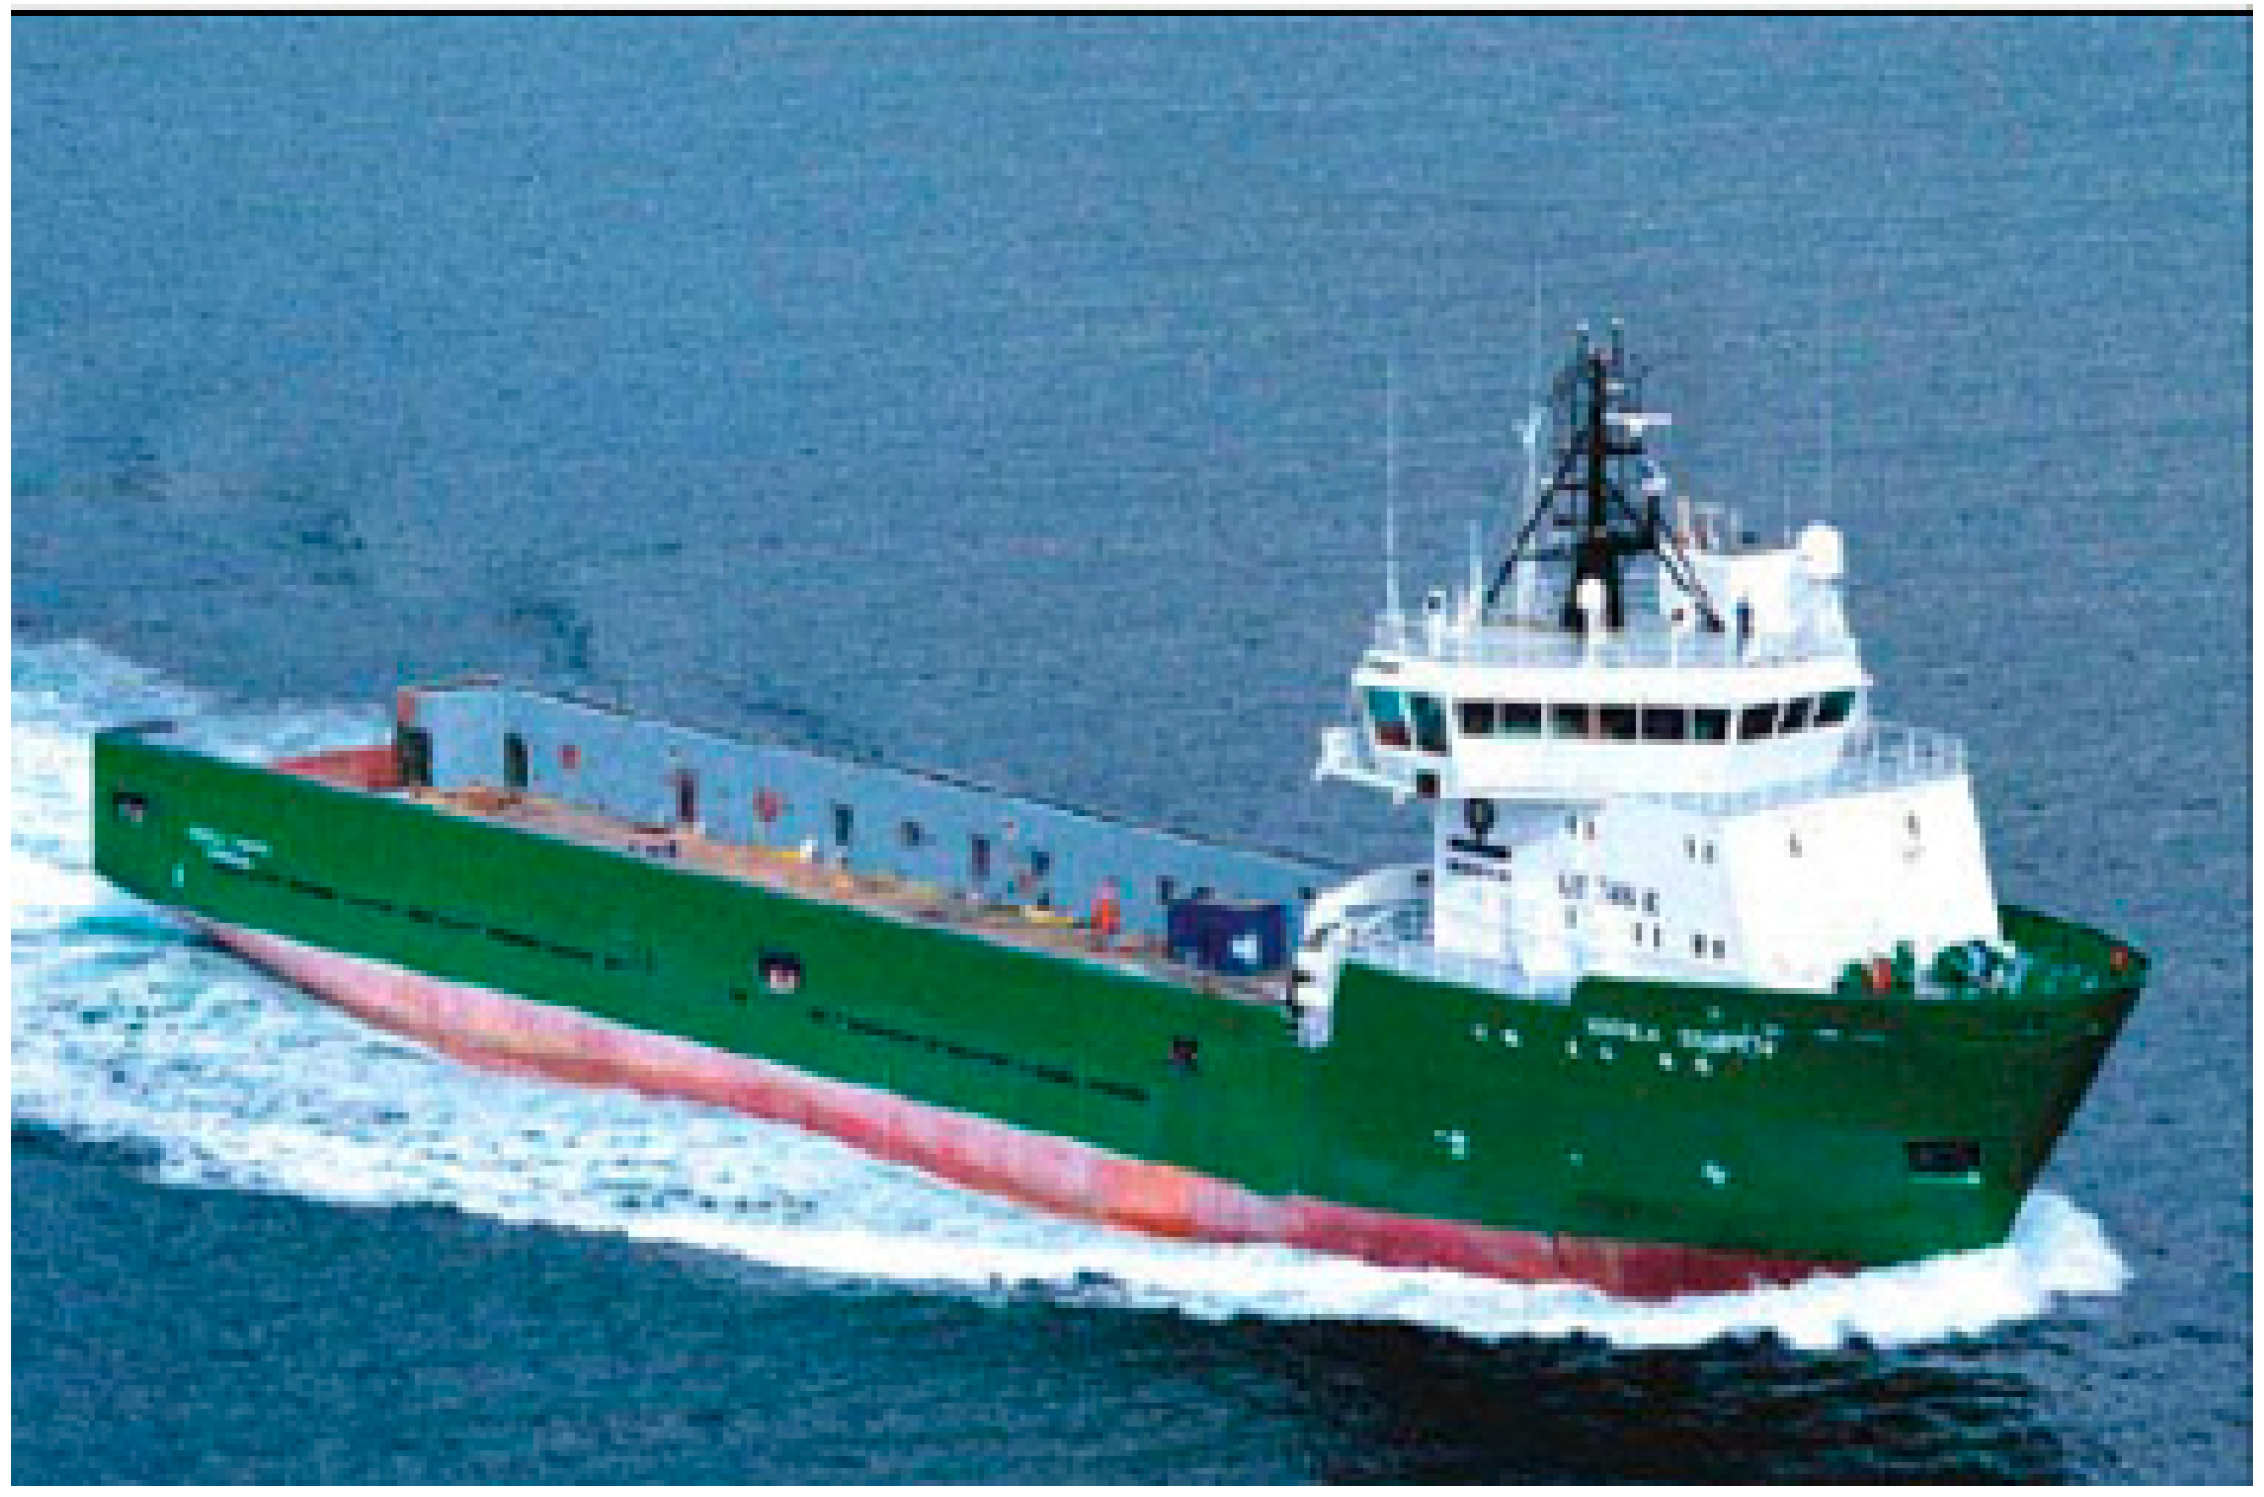
For the validation of the developed thrust-allocation method, reference cases in Rindaroy [7] were simulated using the quadratic-programming method for the cases of power minimization and fuel consumption minimization. Those problems are to distribute required surge and sway forces (Surge Force: 100 KN, Sway Force: 200 KN) to the forward tunnel thruster, the forward azimuth thruster, the aft port azimuth thruster, and the aft starboard azimuth thruster. The offshore support vessel bourbon UT 745E was used for the target vessel. The principal dimension of the bourbon UT745E is presented in Figure 5 and Table 2.
Figure 6 and Figure 7 represent thrust-allocation validation results. Figure 6 shows the bar chart of the reference [7] and the present validation case for the thruster usage (%) according to forward and aft thrusters. The present thrust-allocation results based on the quadratic programing for thruster minimization and fuel optimization agree well with those of Rindaroy [7]. Figure 7 similarly compares the results of fuel consumption depending on different optimization object functions. Consistently, the fuel consumption results of the present validation cases show very close coherence with the reference cases. Analyzing those two figures, although the thruster usage was larger in the fuel-minimization case than the thrust-minimization case, the fuel consumption was smaller in the fuel-optimal case than that of the thrust optimal case. This discrepancy was caused by different object functions. In all cases, the present and Rindaroy’s results [7] have very good agreement, within 1% error. In the following section, three different thrust-allocation methods for minimal fuel consumption, pseudo-inverse, quadratic programming, and penalty methods, will be systematically compared for a turret-moored, DP-assisted FPSO for several different scenarios through dynamic simulations.

7. Results and Discussions

In the previous sections, the procedure for the optimal thrust allocation for the vessels with multiple azimuth thrusters was presented. In this section, as an example of another real-world problem, a DP-assisted FPSO with six azimuth thrusters was selected to prove the superior performance of the proposed thrust allocation. The fully dynamically-coupled time-domain computer simulations were conducted to compare the performance of the newly developed penalty method and conventional thrust-allocation algorithms (quadratic-programming and pseudo-inverse method). The capacity of thrusters and their locations were considered as the constraints. The object function of the thrust-allocation optimization was set to minimize the fuel consumption. 6DOF hull–mooring–riser-coupled dynamic simulations with DP in time domain were conducted to evaluate the fuel consumption by using fuel-optimal thrust-allocation algorithms. Those thrust-allocation algorithms are optimized by the pseudo-inverse method, quadratic programming, and penalty programming. Accordingly, dynamics of ship, environmental forces, and DP control frame are simultaneously implemented in the simulation program.

7.1. Time-Domain Simulation Conditions

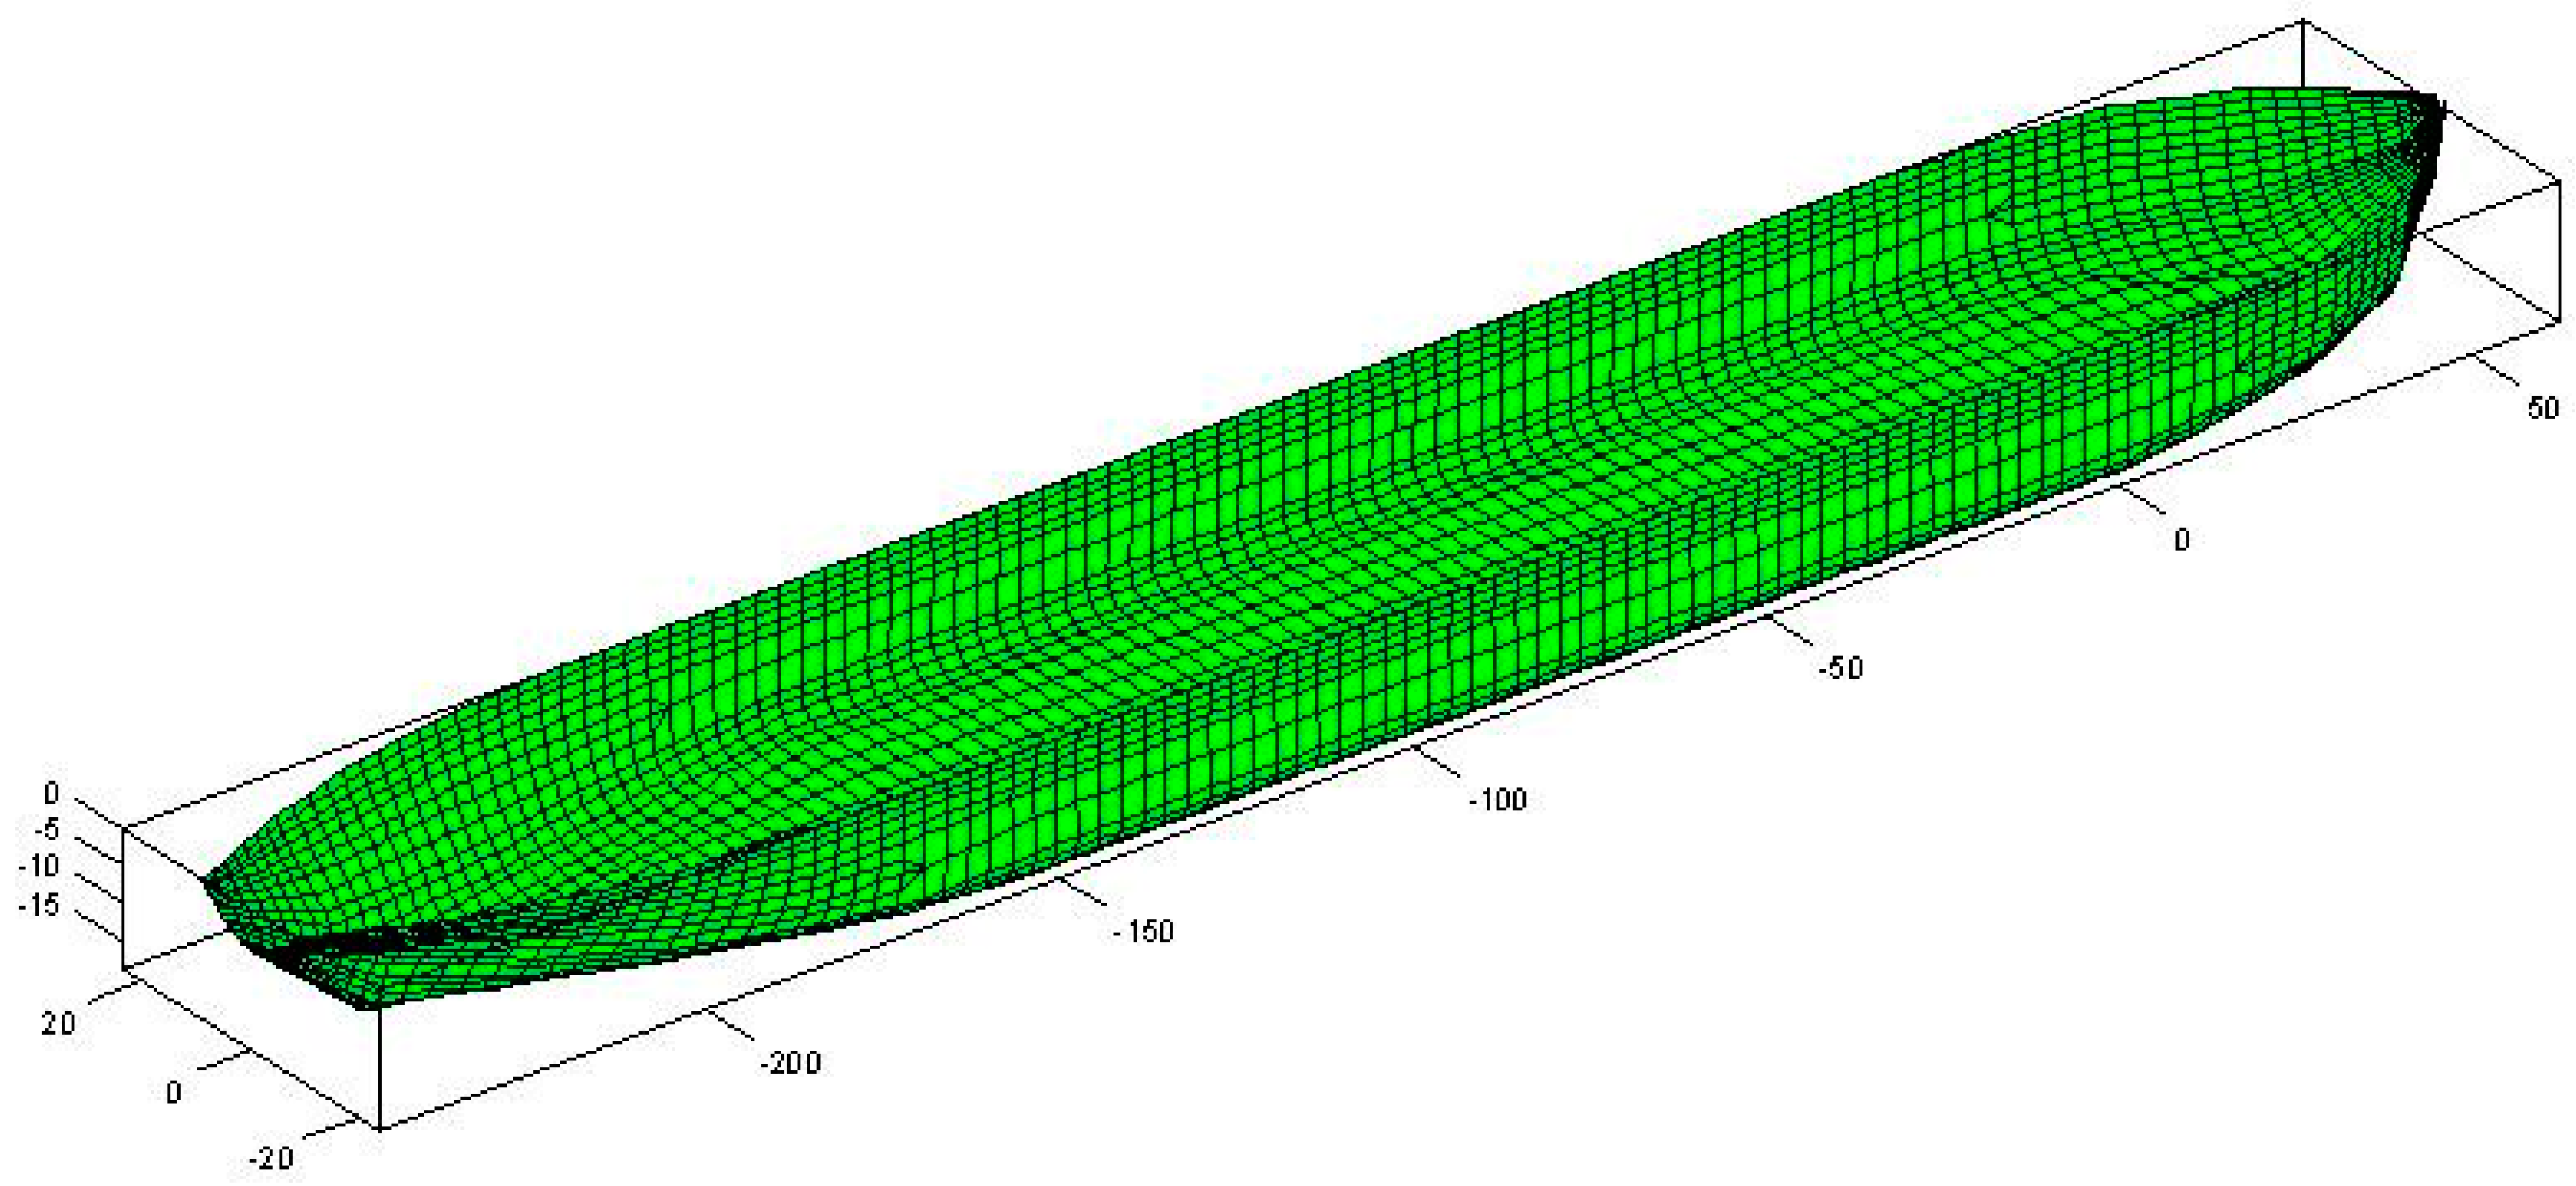
Before applying the newly developed thrust-allocation algorithms to the dynamic positioning control system, the conventional pseudo-inverse method-based thrust allocation and PID controller were modeled and checked with the results of Ryu [4]. Kalman filter and PID controller were implemented in the DP controller. Frequency-domain analysis was performed using WAMIT for hydrodynamic coefficients and wave forces. Subsequently, the time-domain 6DOF motion analysis was performed using CHARM3D (Ryu [4]; Yang [15]; Yang [16]; Bae [17]; Li [18]; Kim et al. [19]). The DP FPSO vessel is a 200,000 ton tanker moored in 1829 m water depth. The bow turret is located 63.55 m from the Fore Perpendicular. The principal dimension of the DP FPSO is presented in Table 3. Figure 8 represent the mesh model for the motion analysis.
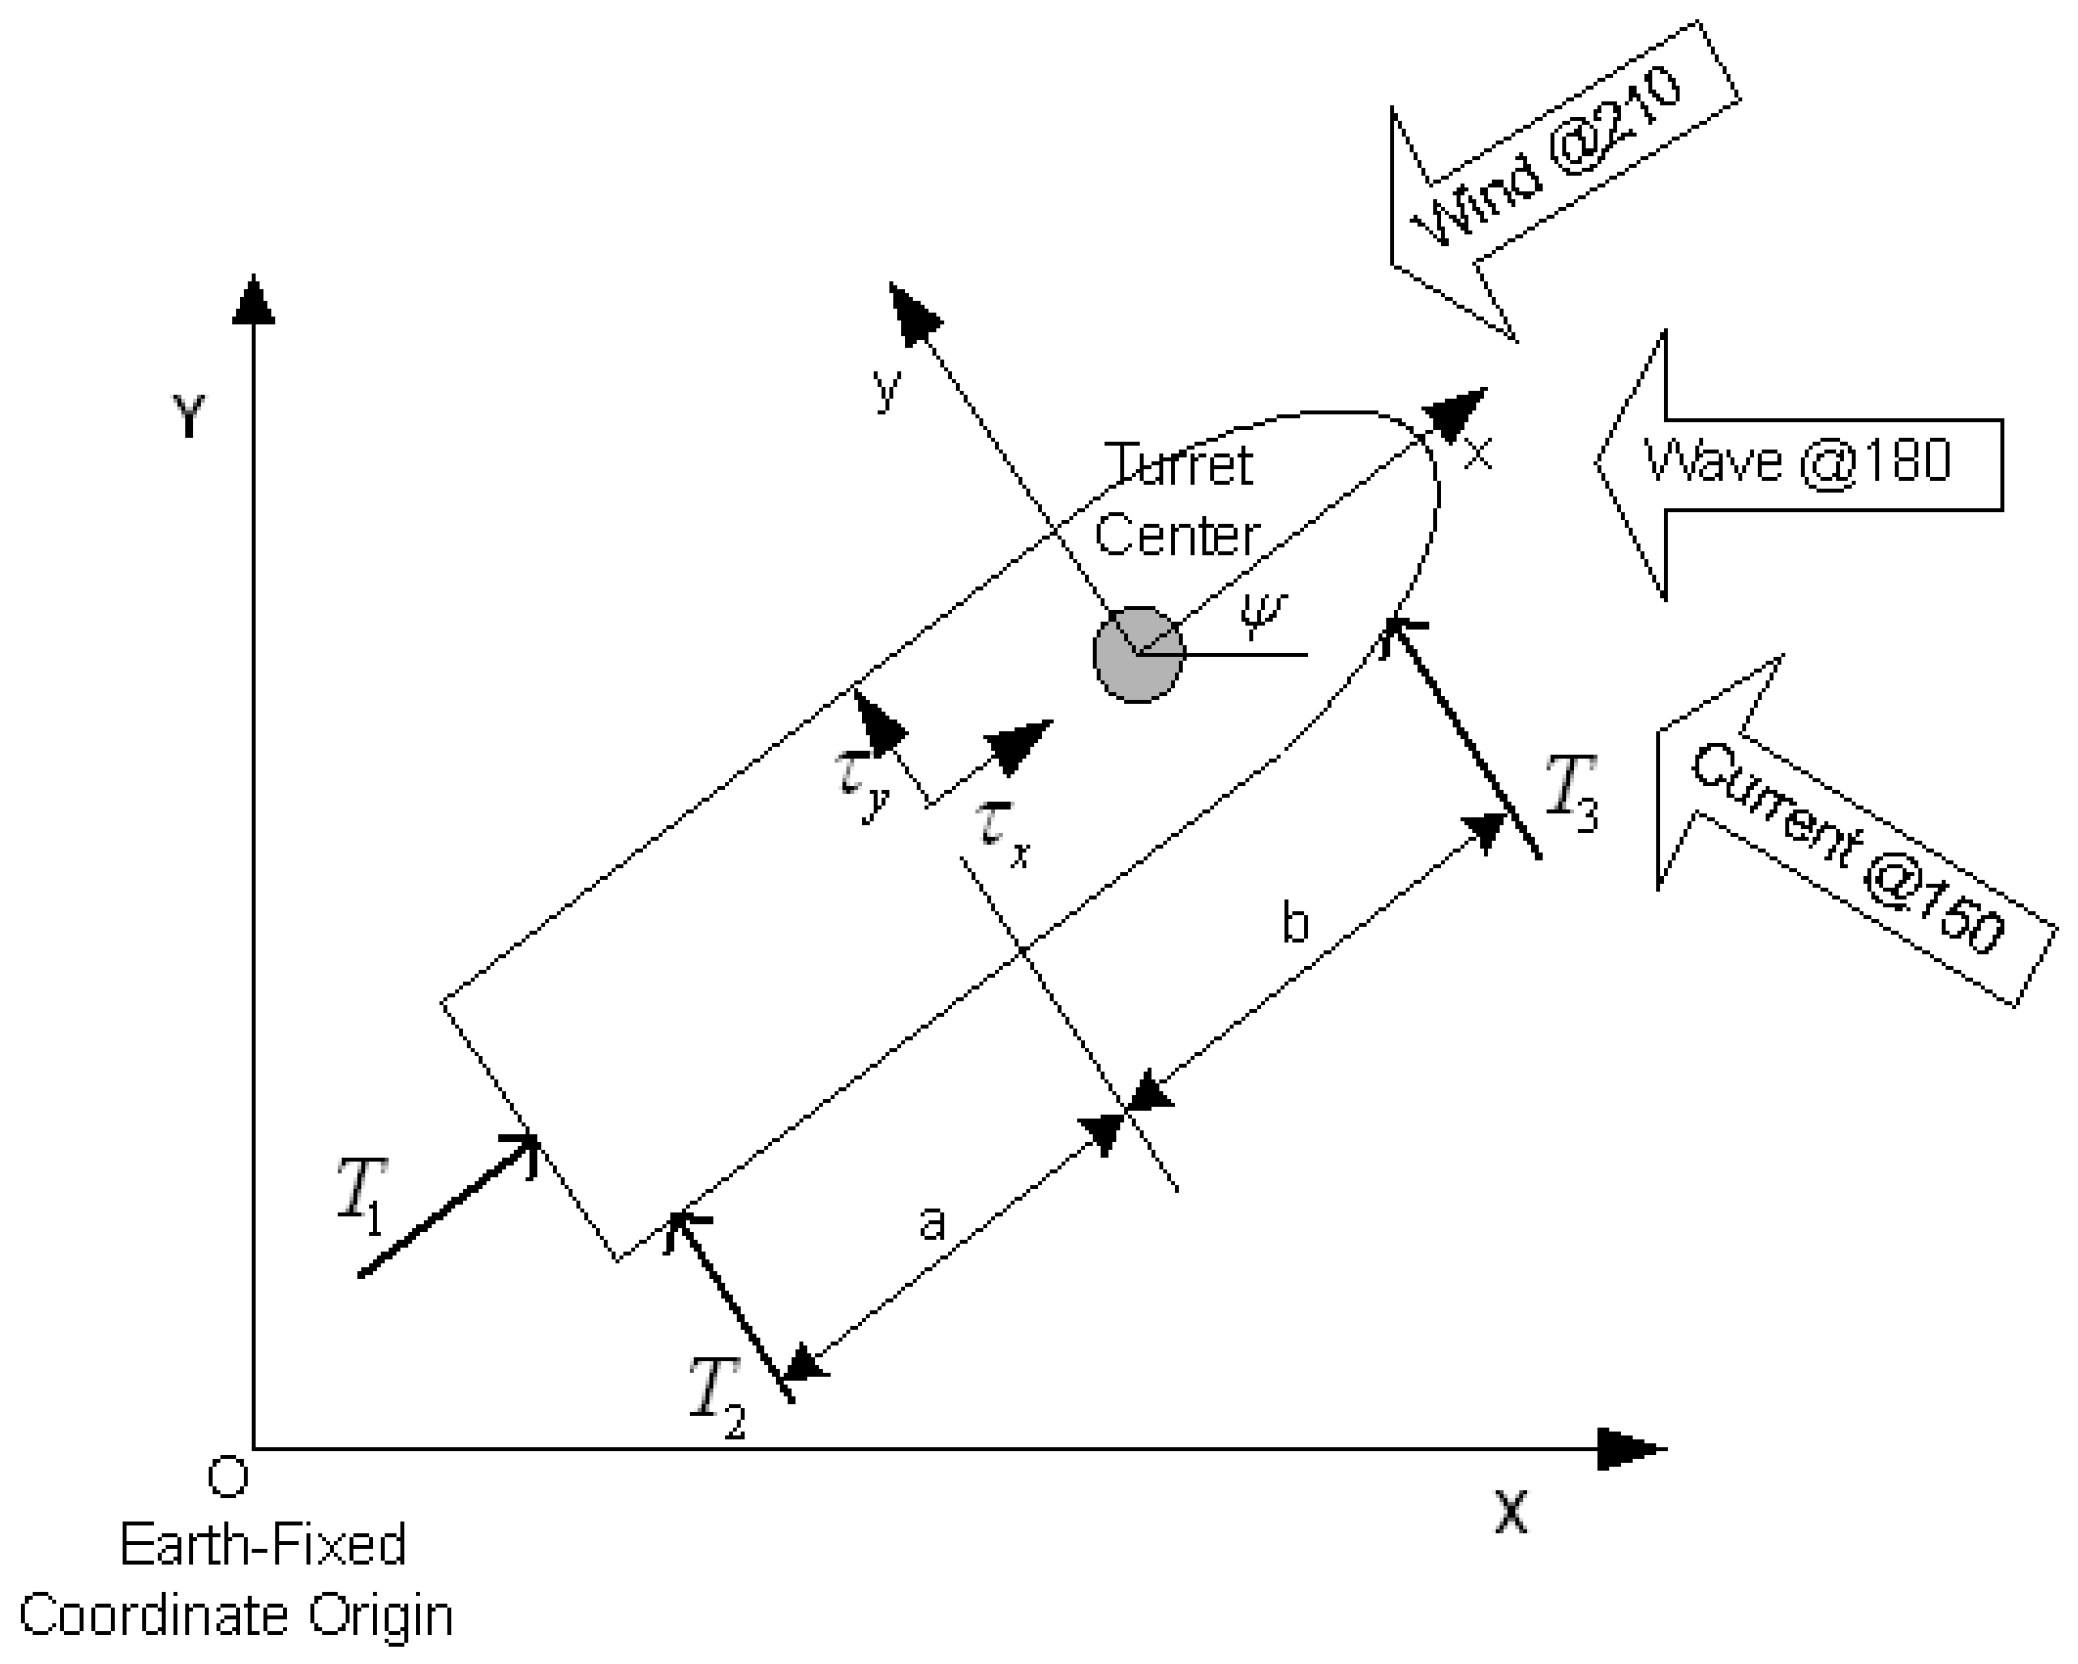
The coordinate system and environmental direction are presented in Figure 9.
The 1-year and 100-year Gulf of Mexico (GOM) hurricanes were used as the environmental conditions in the simulation. A JONSWAP (Joint North Sea Wave Project) spectrum was used for the input sea, which is summarized in Table 4.
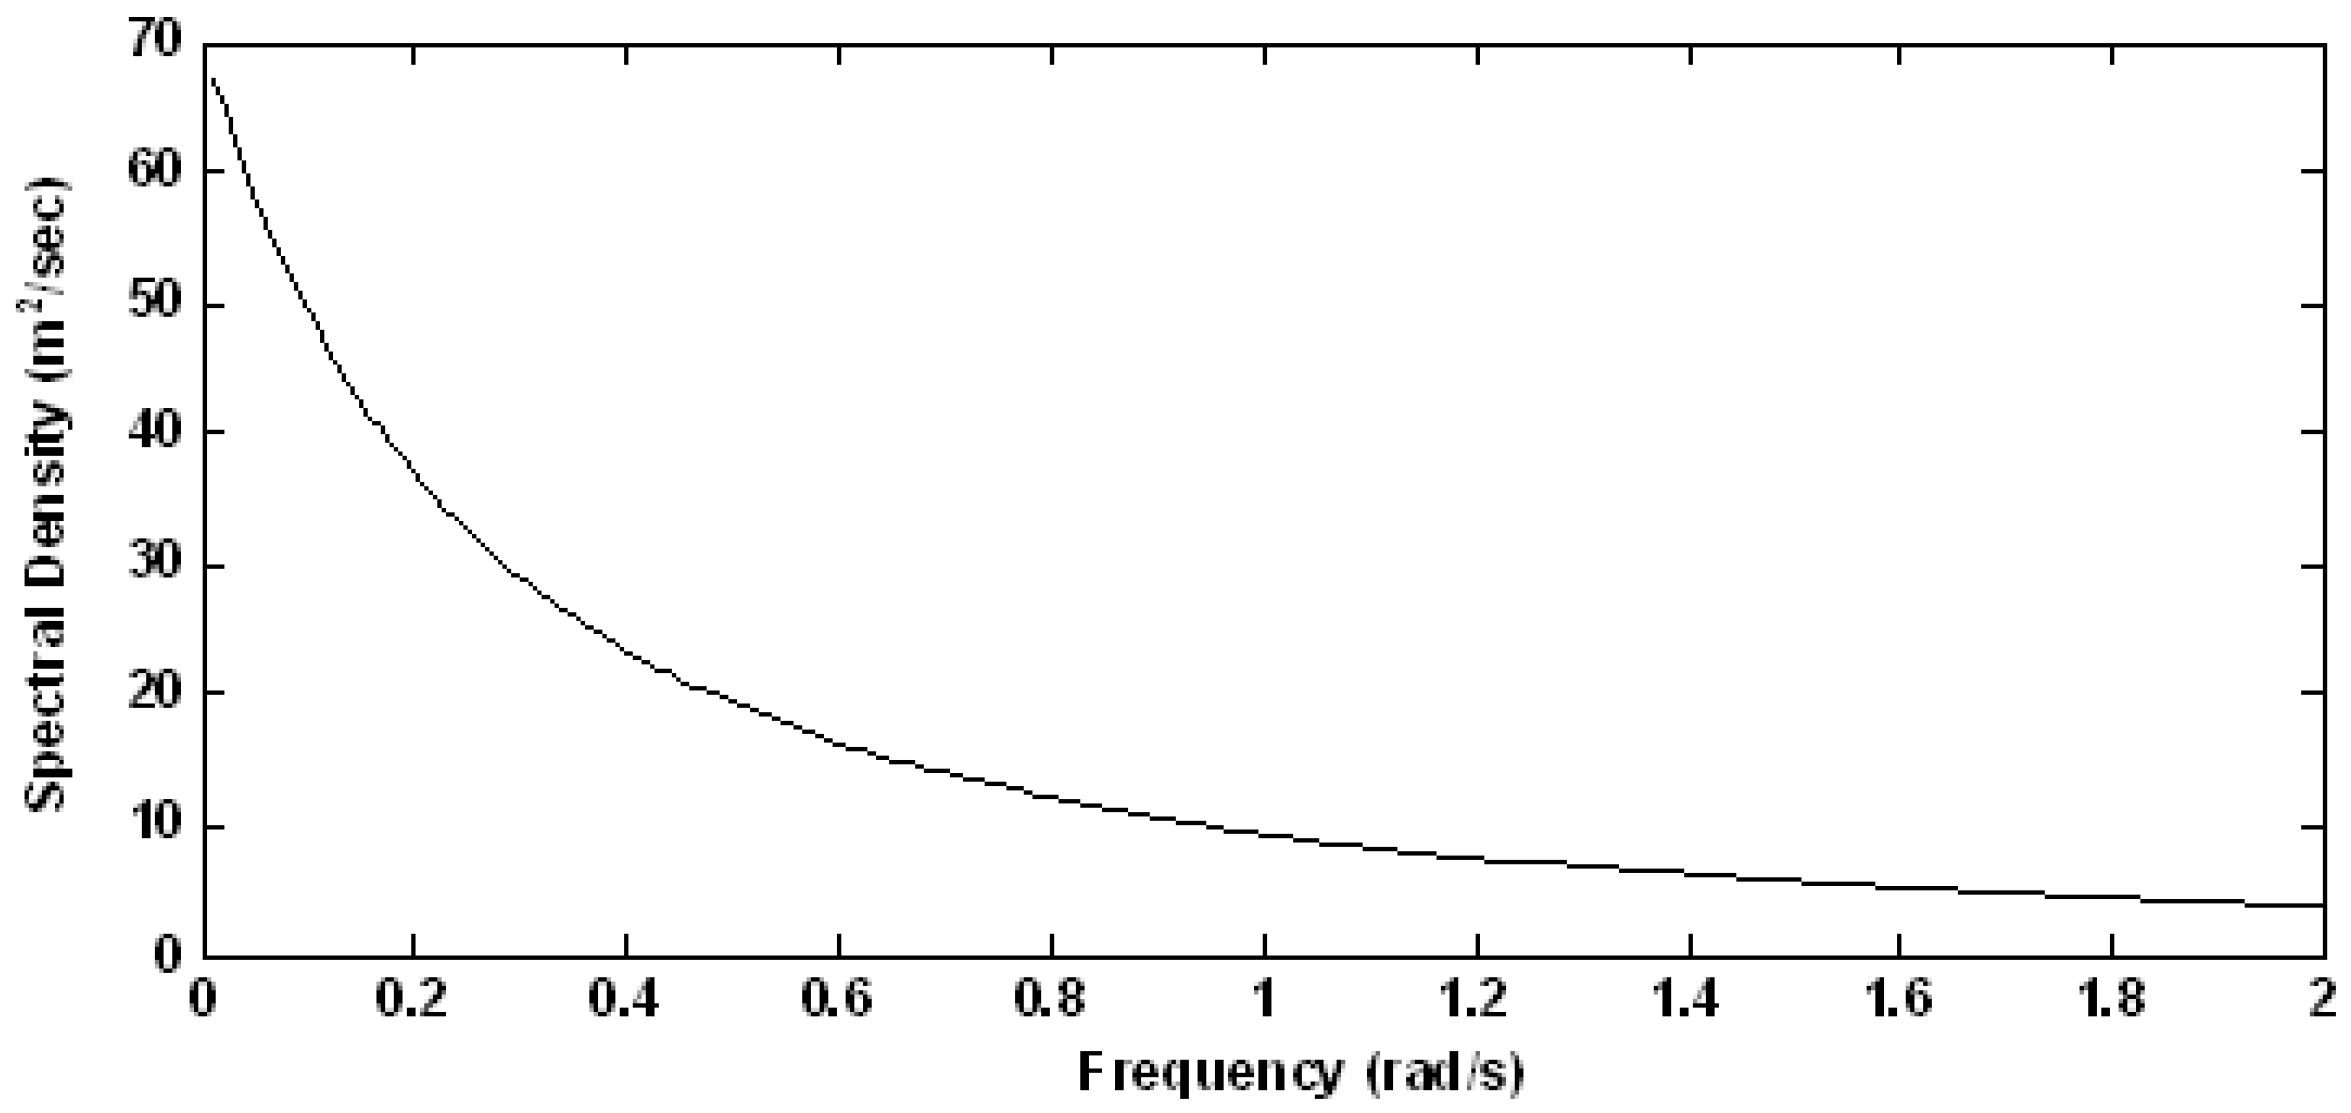
The Oil Companies International Marine Forum wind- and current-force coefficient data for a cylindrical bow tanker with a full loading condition were utilized for the simulation. The storm induced current flows from 30 degrees clockwise of the incoming wave direction. The current velocity is assumed to be 0.33 or 1.07 m/s at the water surface. Regarding the wind spectrum, the API (America Petroleum Institute) wind spectrum was used to generate the dynamic wind forces. The applied wind speed was 14.4 or 41.1 m/s at 10 m height, and its direction is 30 degrees counterclockwise of the incoming wave direction. The corresponding wind spectrum is shown in Figure 10.
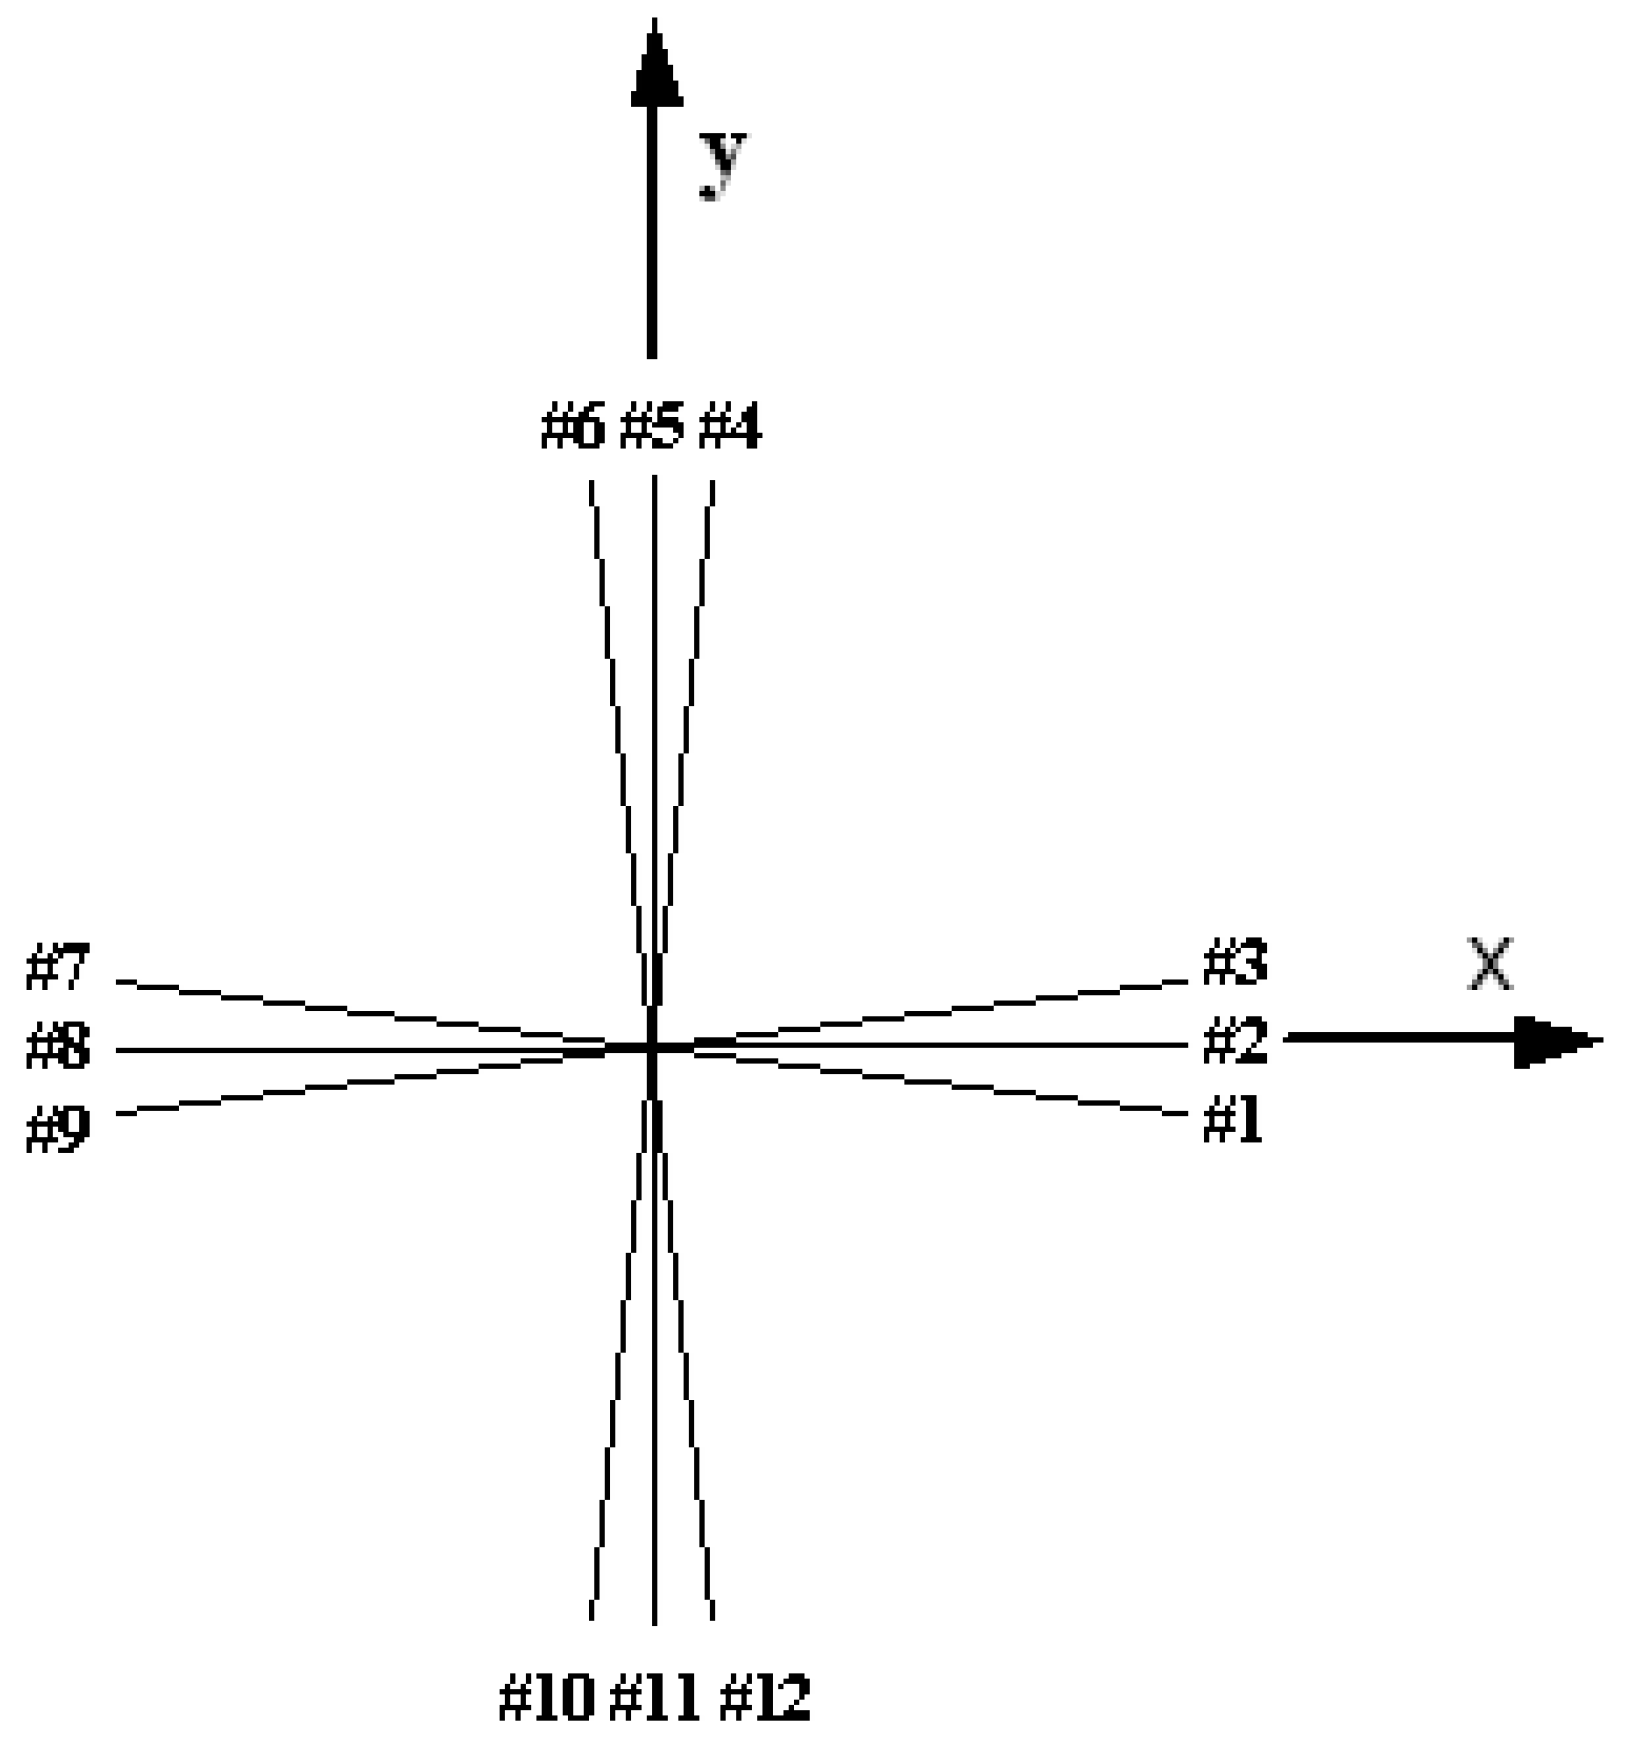
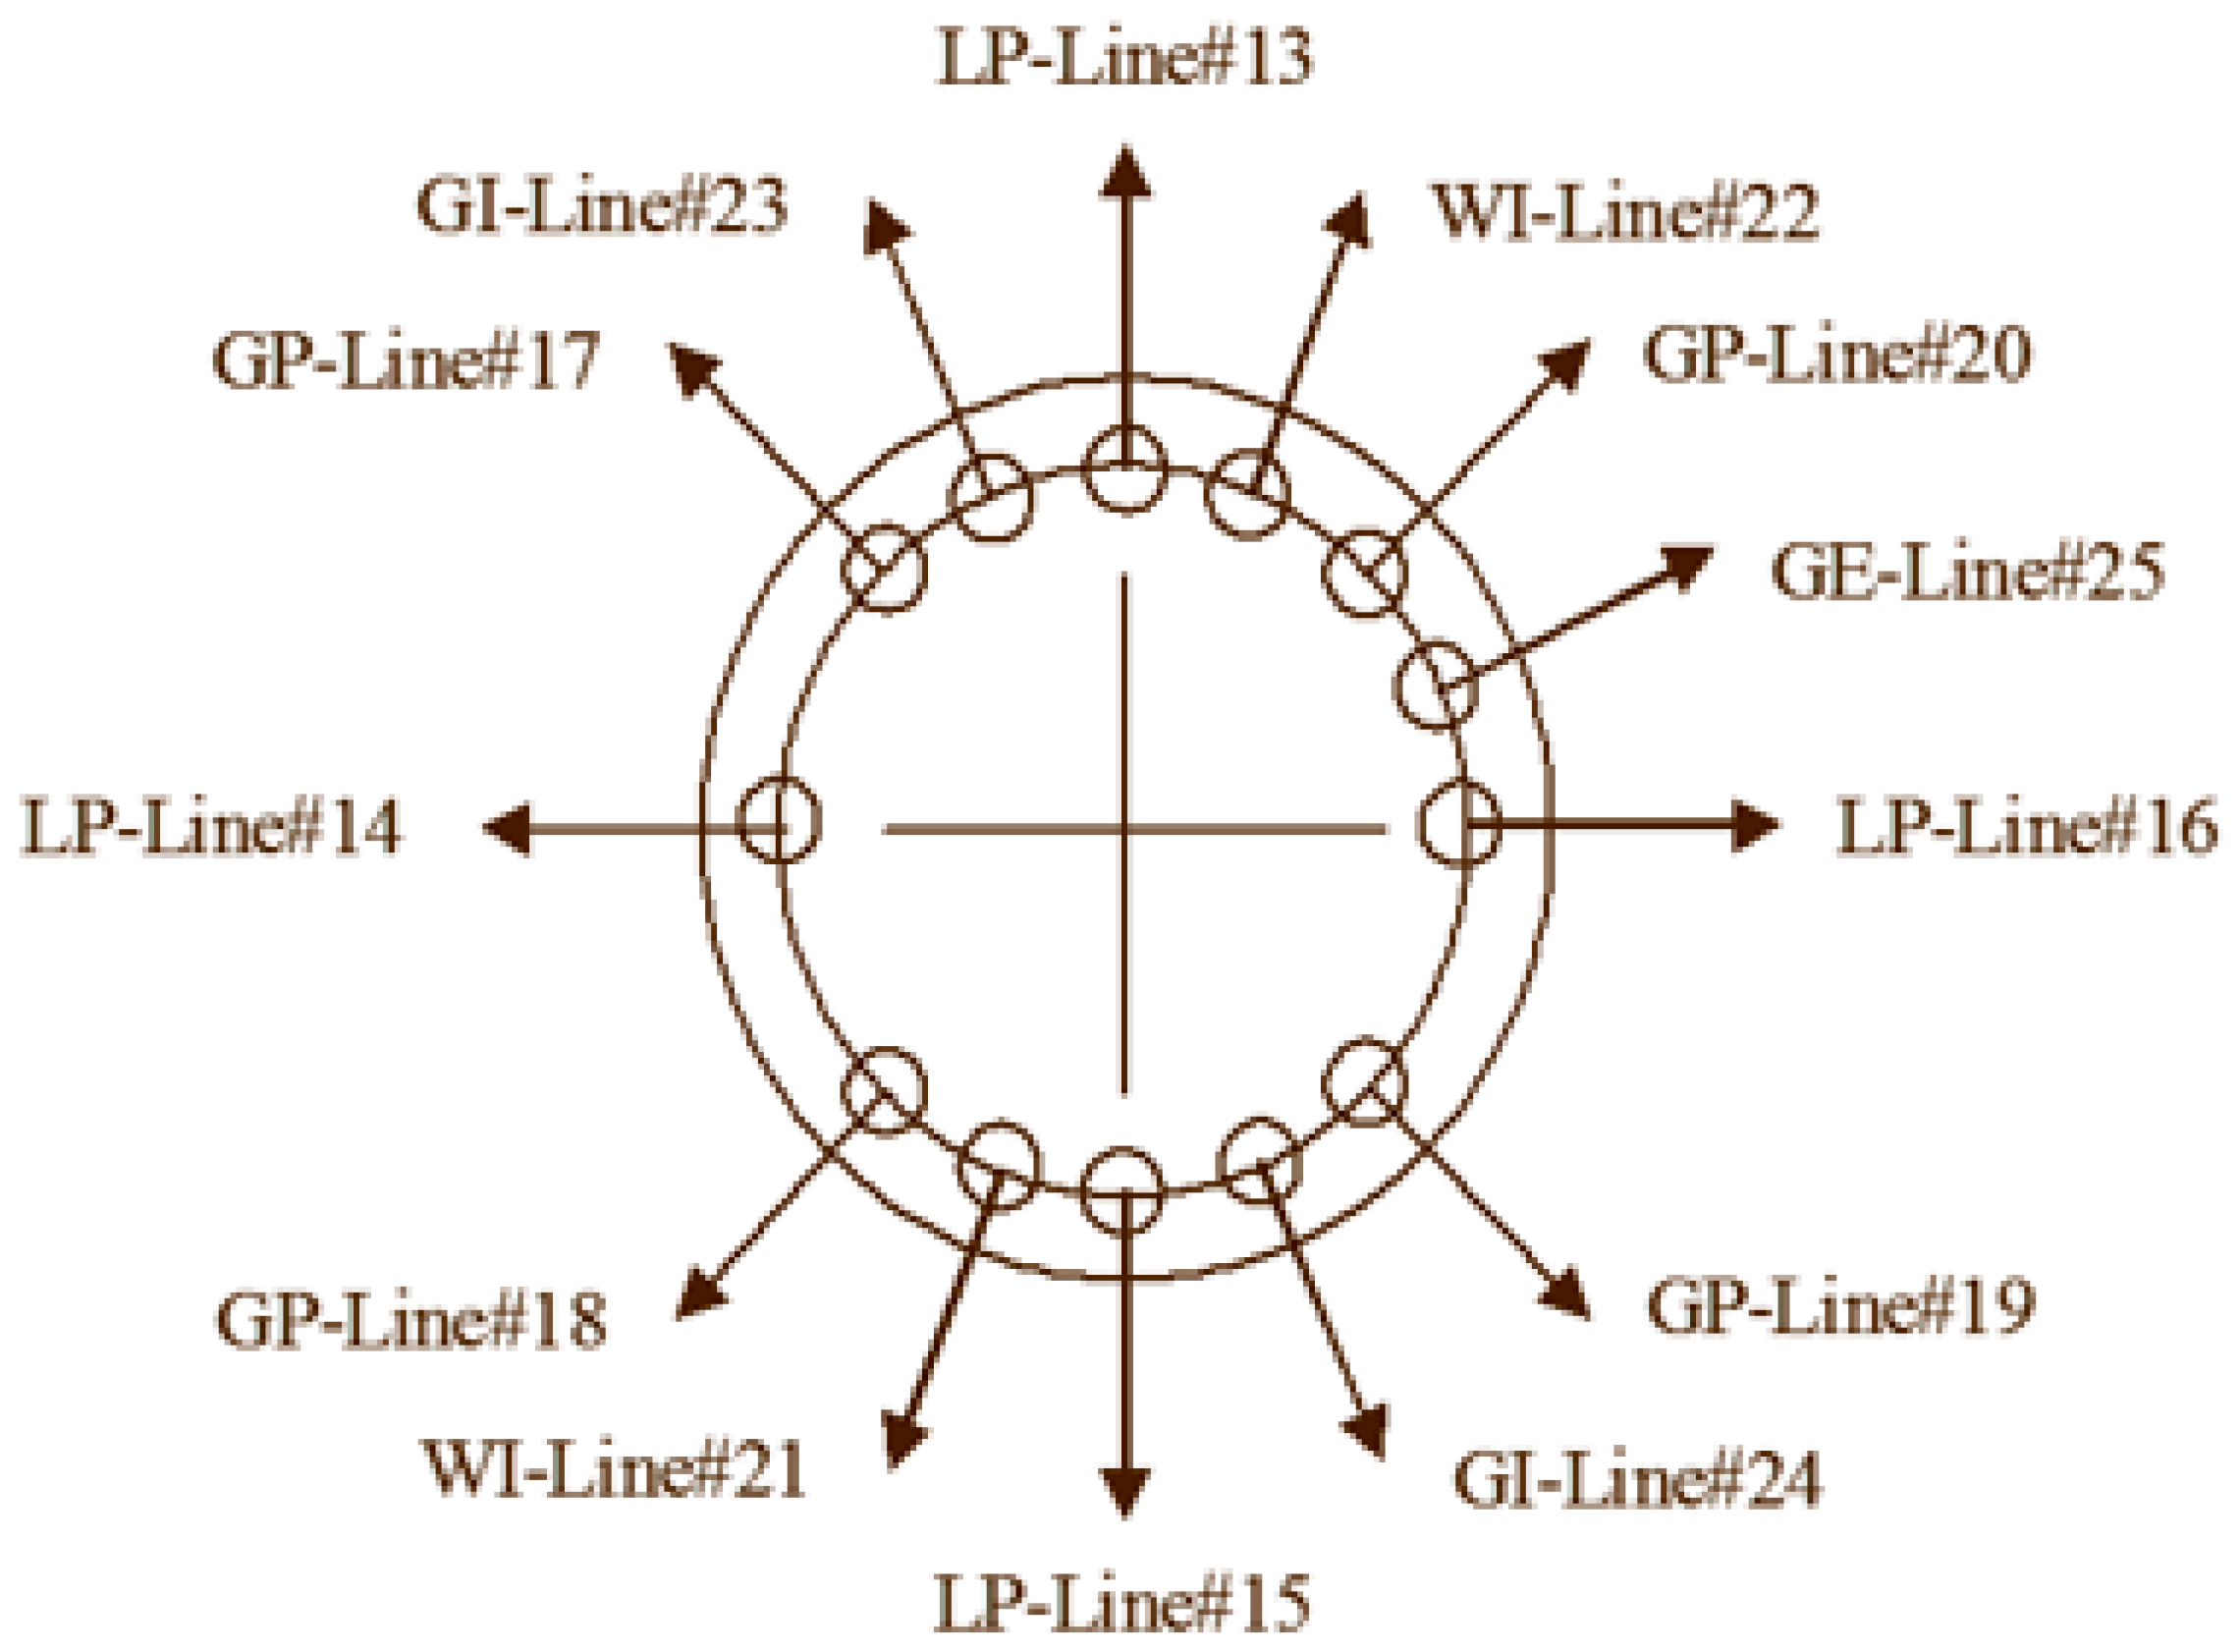
The FPSO equips twelve chain–polyester–chain mooring lines and thirteen steel catenary risers, as shown in Figure 11 and Figure 12. The particulars of mooring lines and risers are summarized in Table 5 and Table 6.

7.2. Results for GOM 100-Year Storm Condition

7.2.1. Bow–Stern Group Thruster Configuration

The DP FPSO equipped with six azimuth thrusters, was simulated for evaluating the performance of fuel-consumption reduction. 6 DOF coupled time-domain simulations were carried out under the Gulf of Mexico (GOM) 100-year storm conditions. The thruster configuration and constraints are presented in Figure 13, Table 7 and Table 8.
Trajectories depending on different thrust-allocation methods are presented in Figure 14. The left graph shows the trajectory of the penalty-method-based thrust-allocation algorithm. The right one presents trajectories of the pseudo-inverse method and the quadratic programming. The penalty programming shows slightly better position-keeping performance in the surge motion, but there is no appreciable improvement in sway and yaw motions. The maximum of mooring top tension of the penalty programming and other methods are almost the same, as can be seen in Table 9.
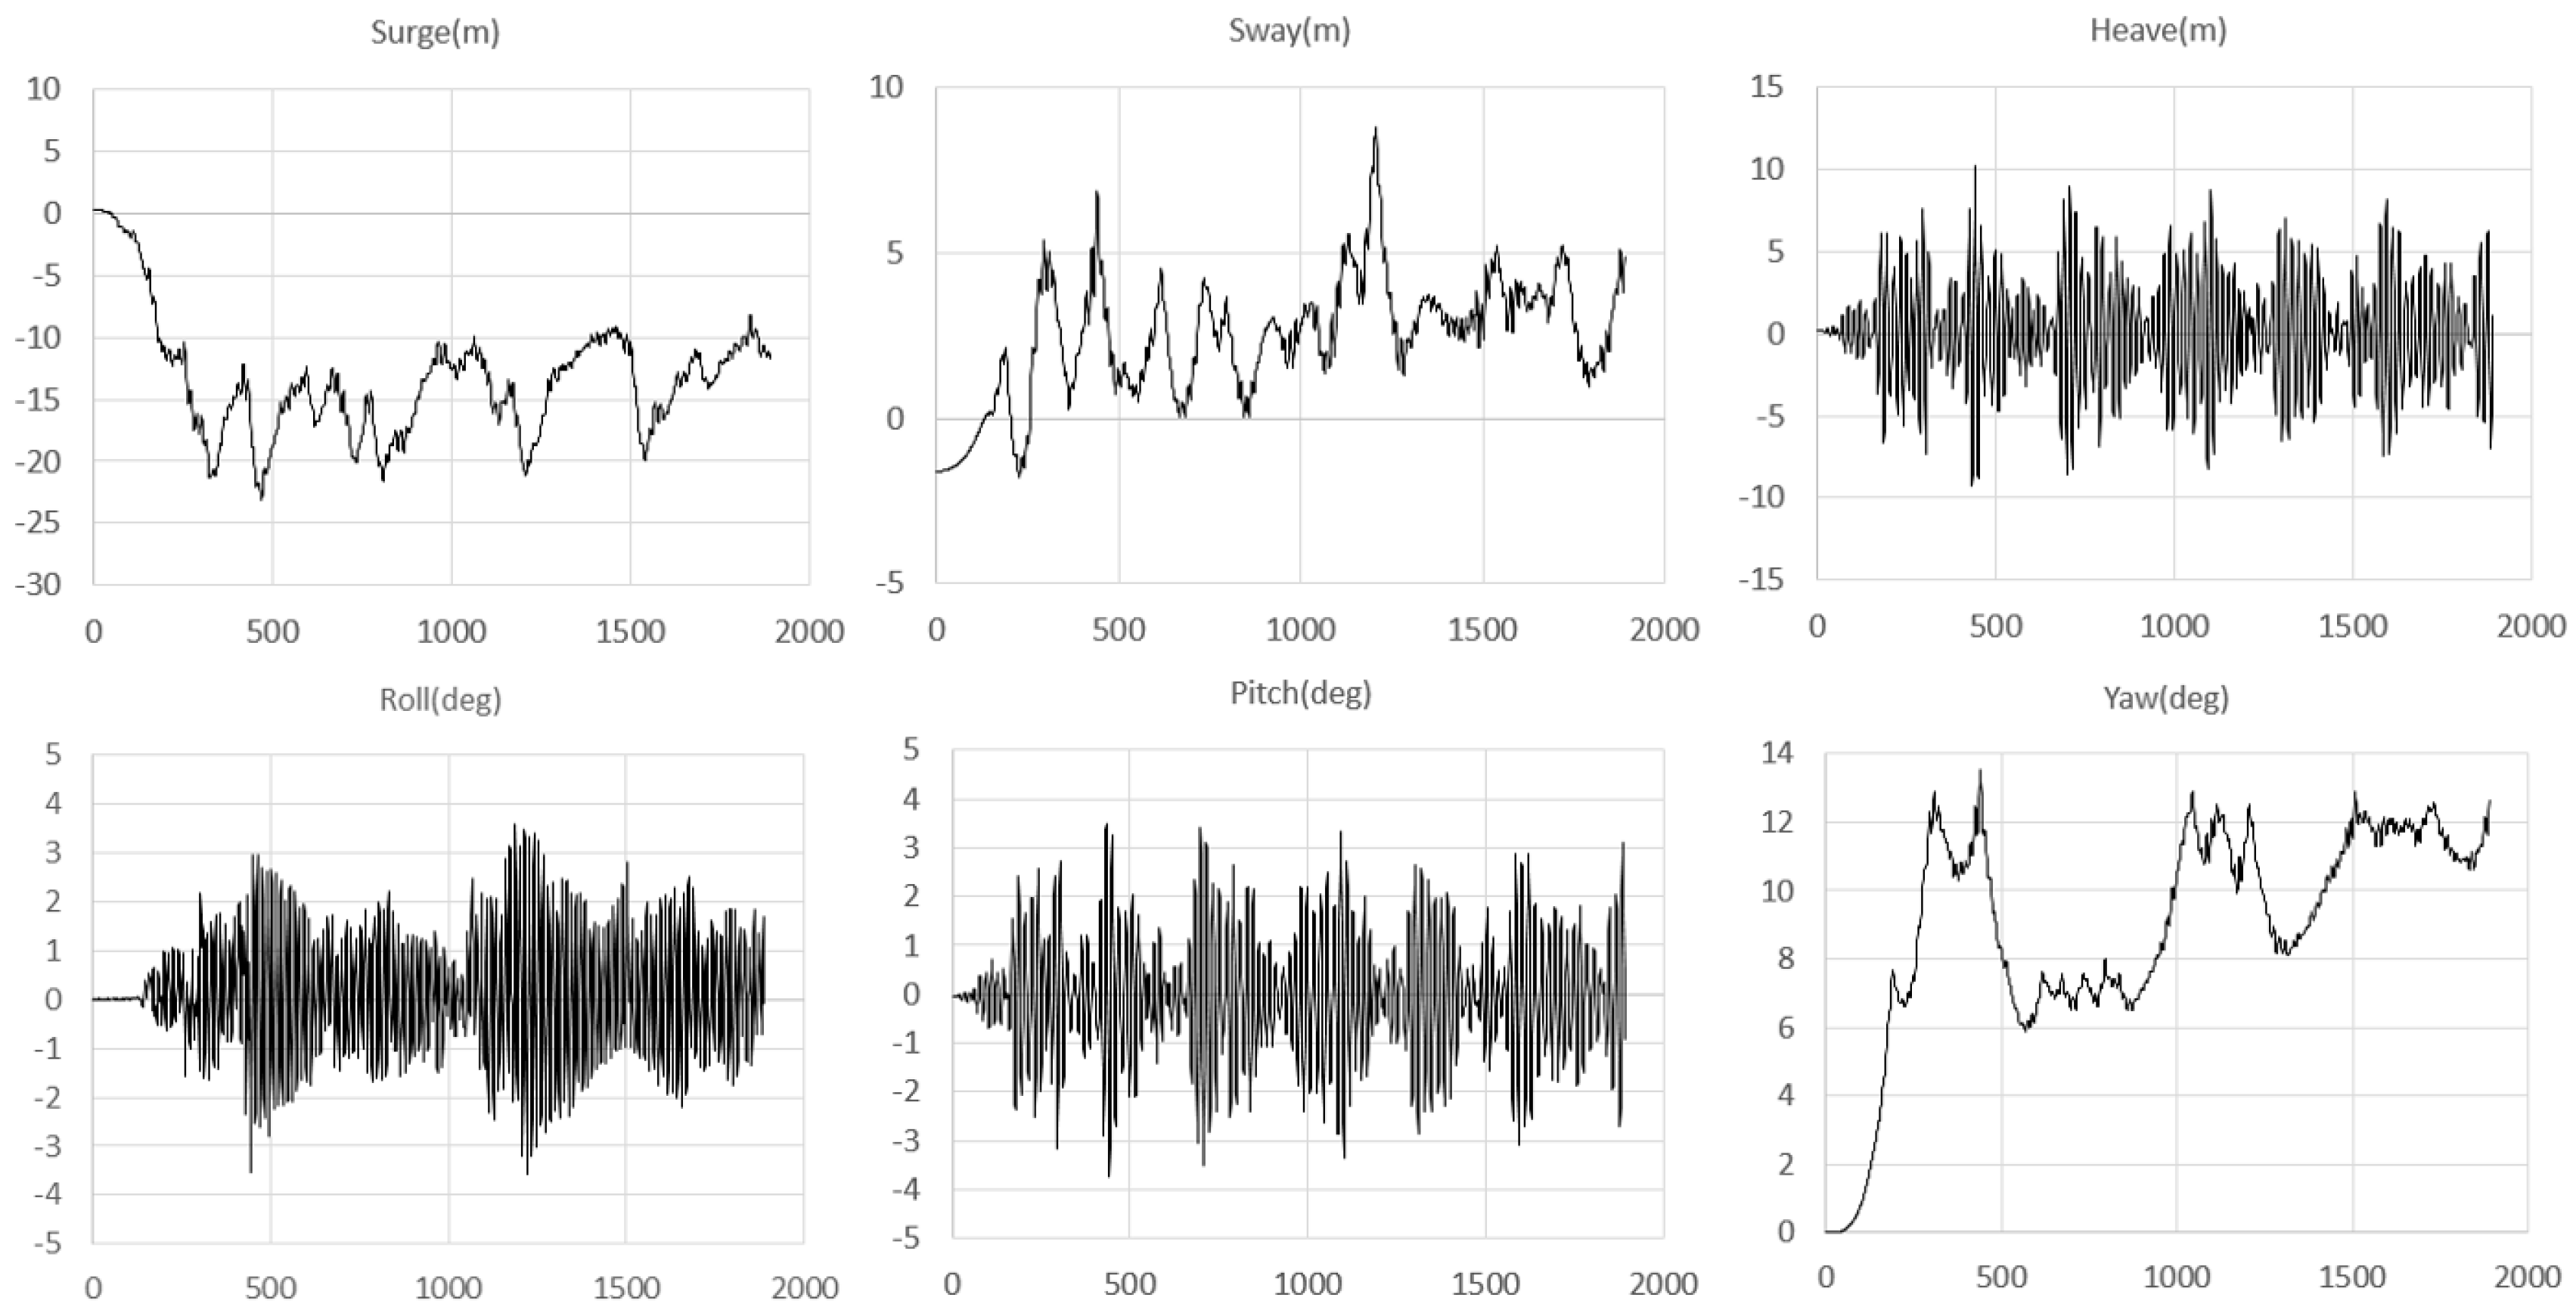
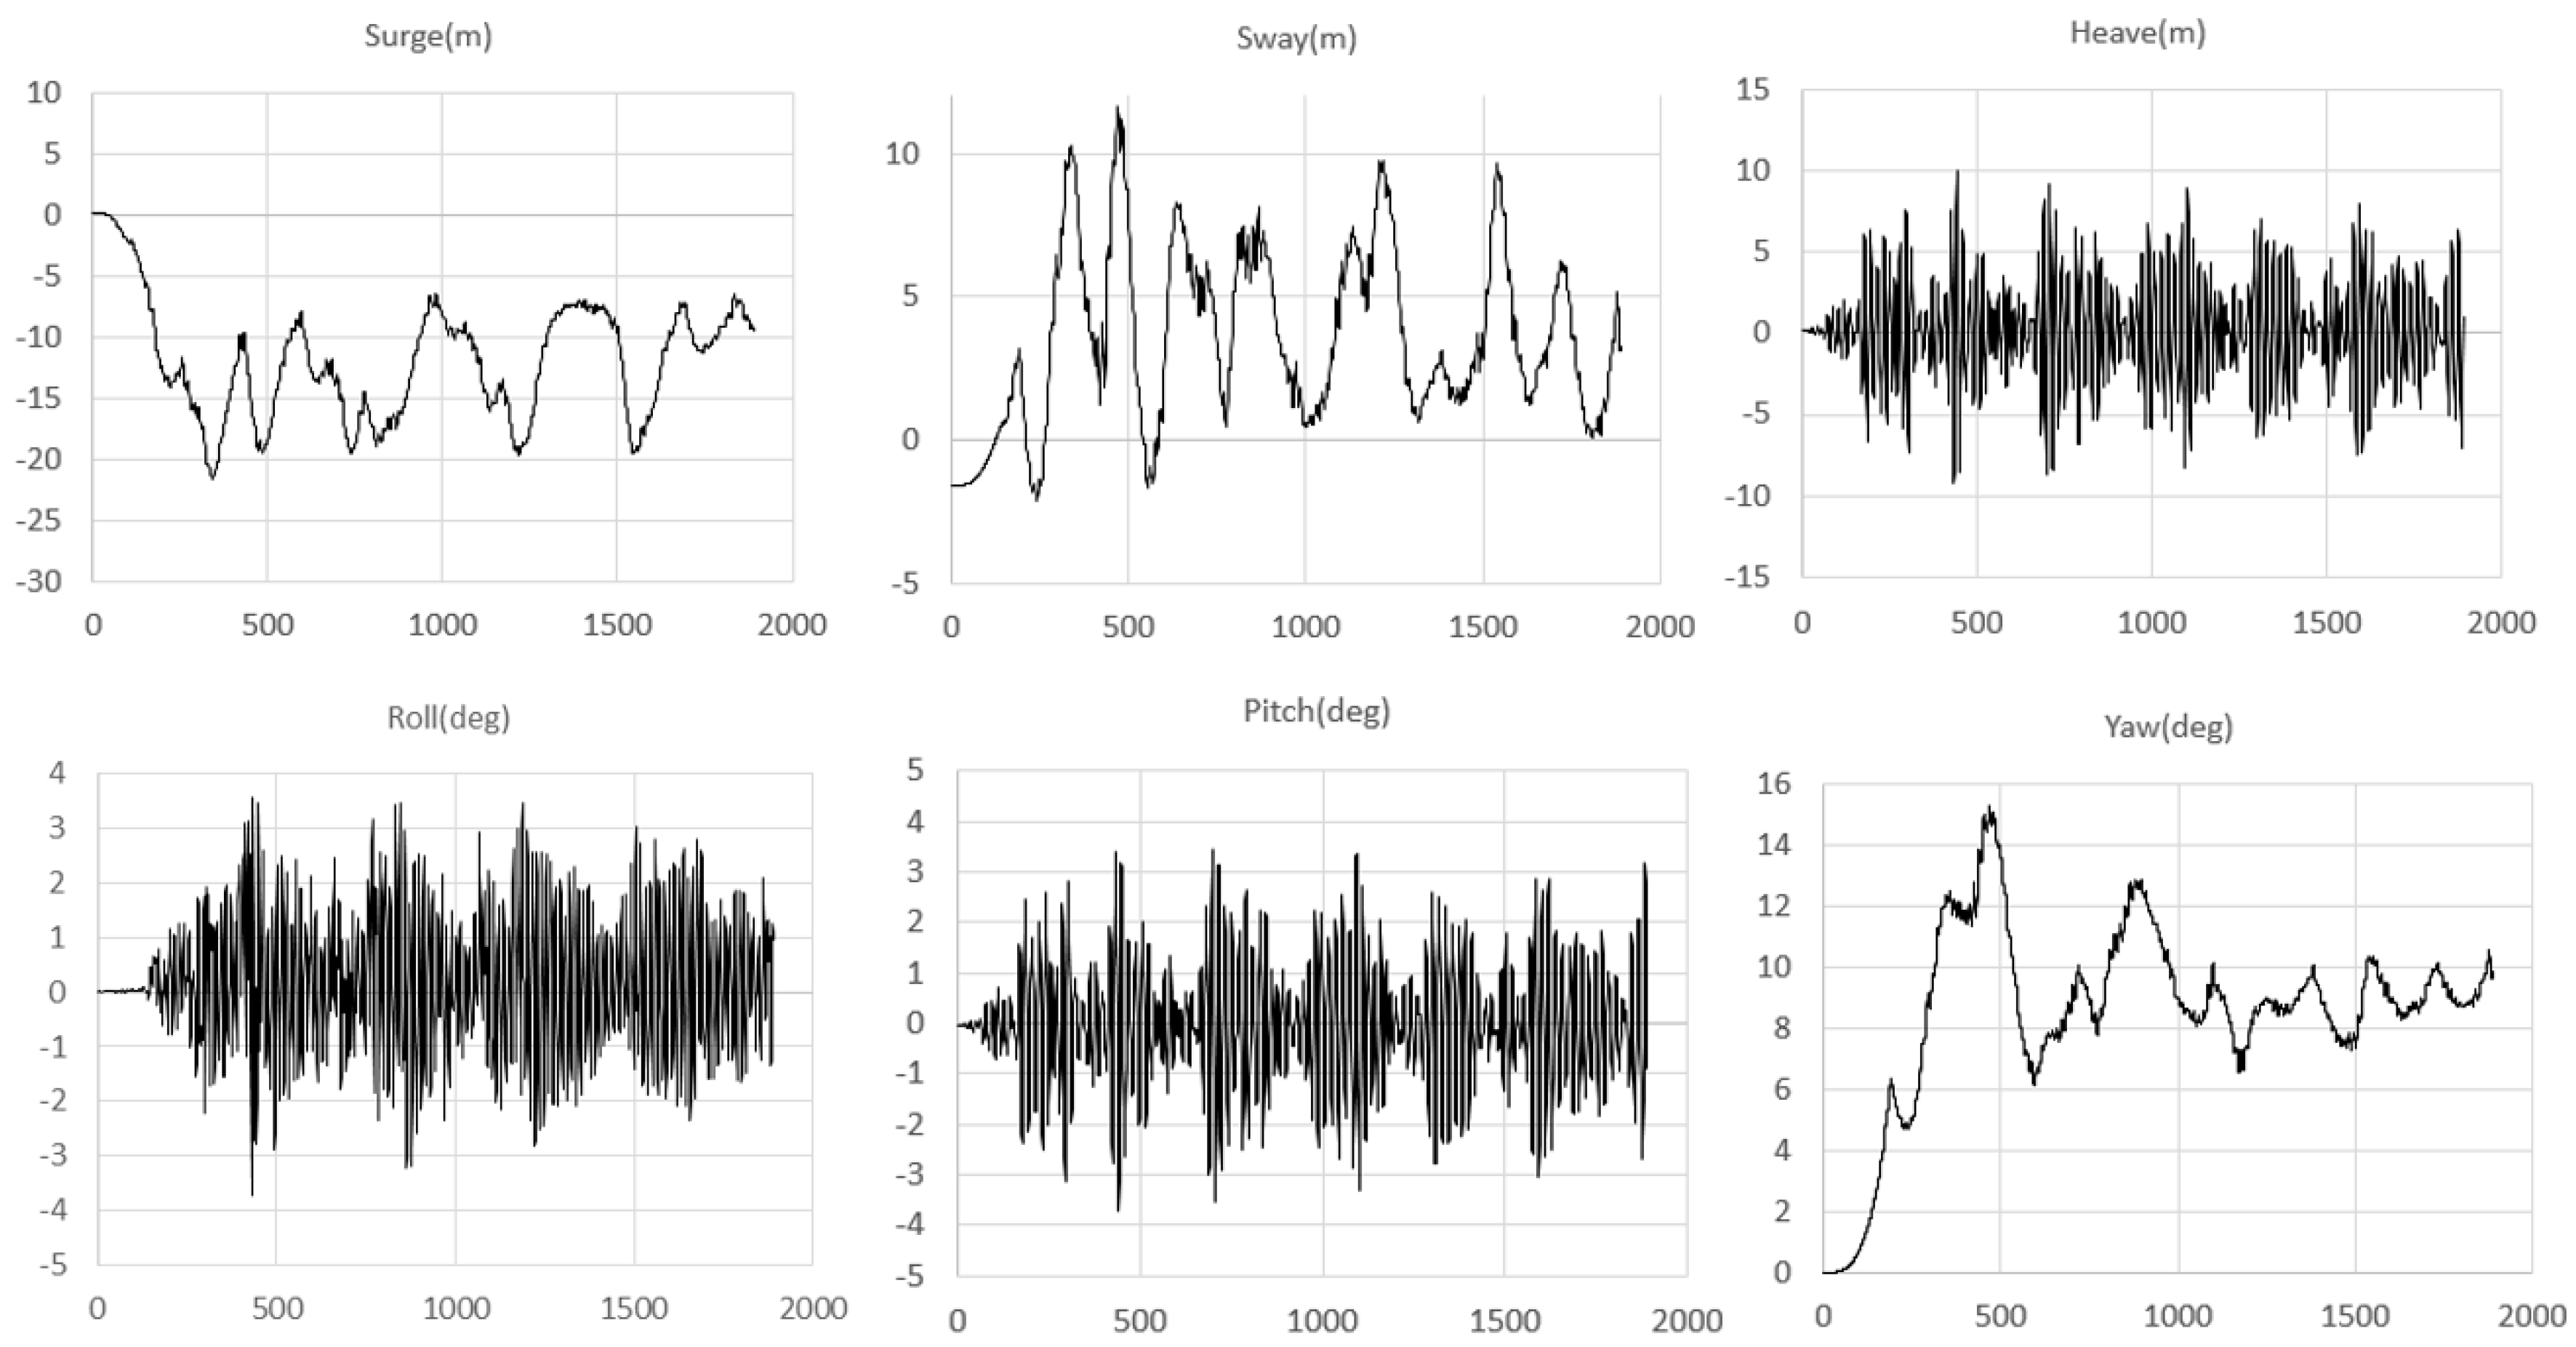
Figure 15 shows the 6 DOF motion-simulation results when the penalty programming is used as thrust-allocation method.
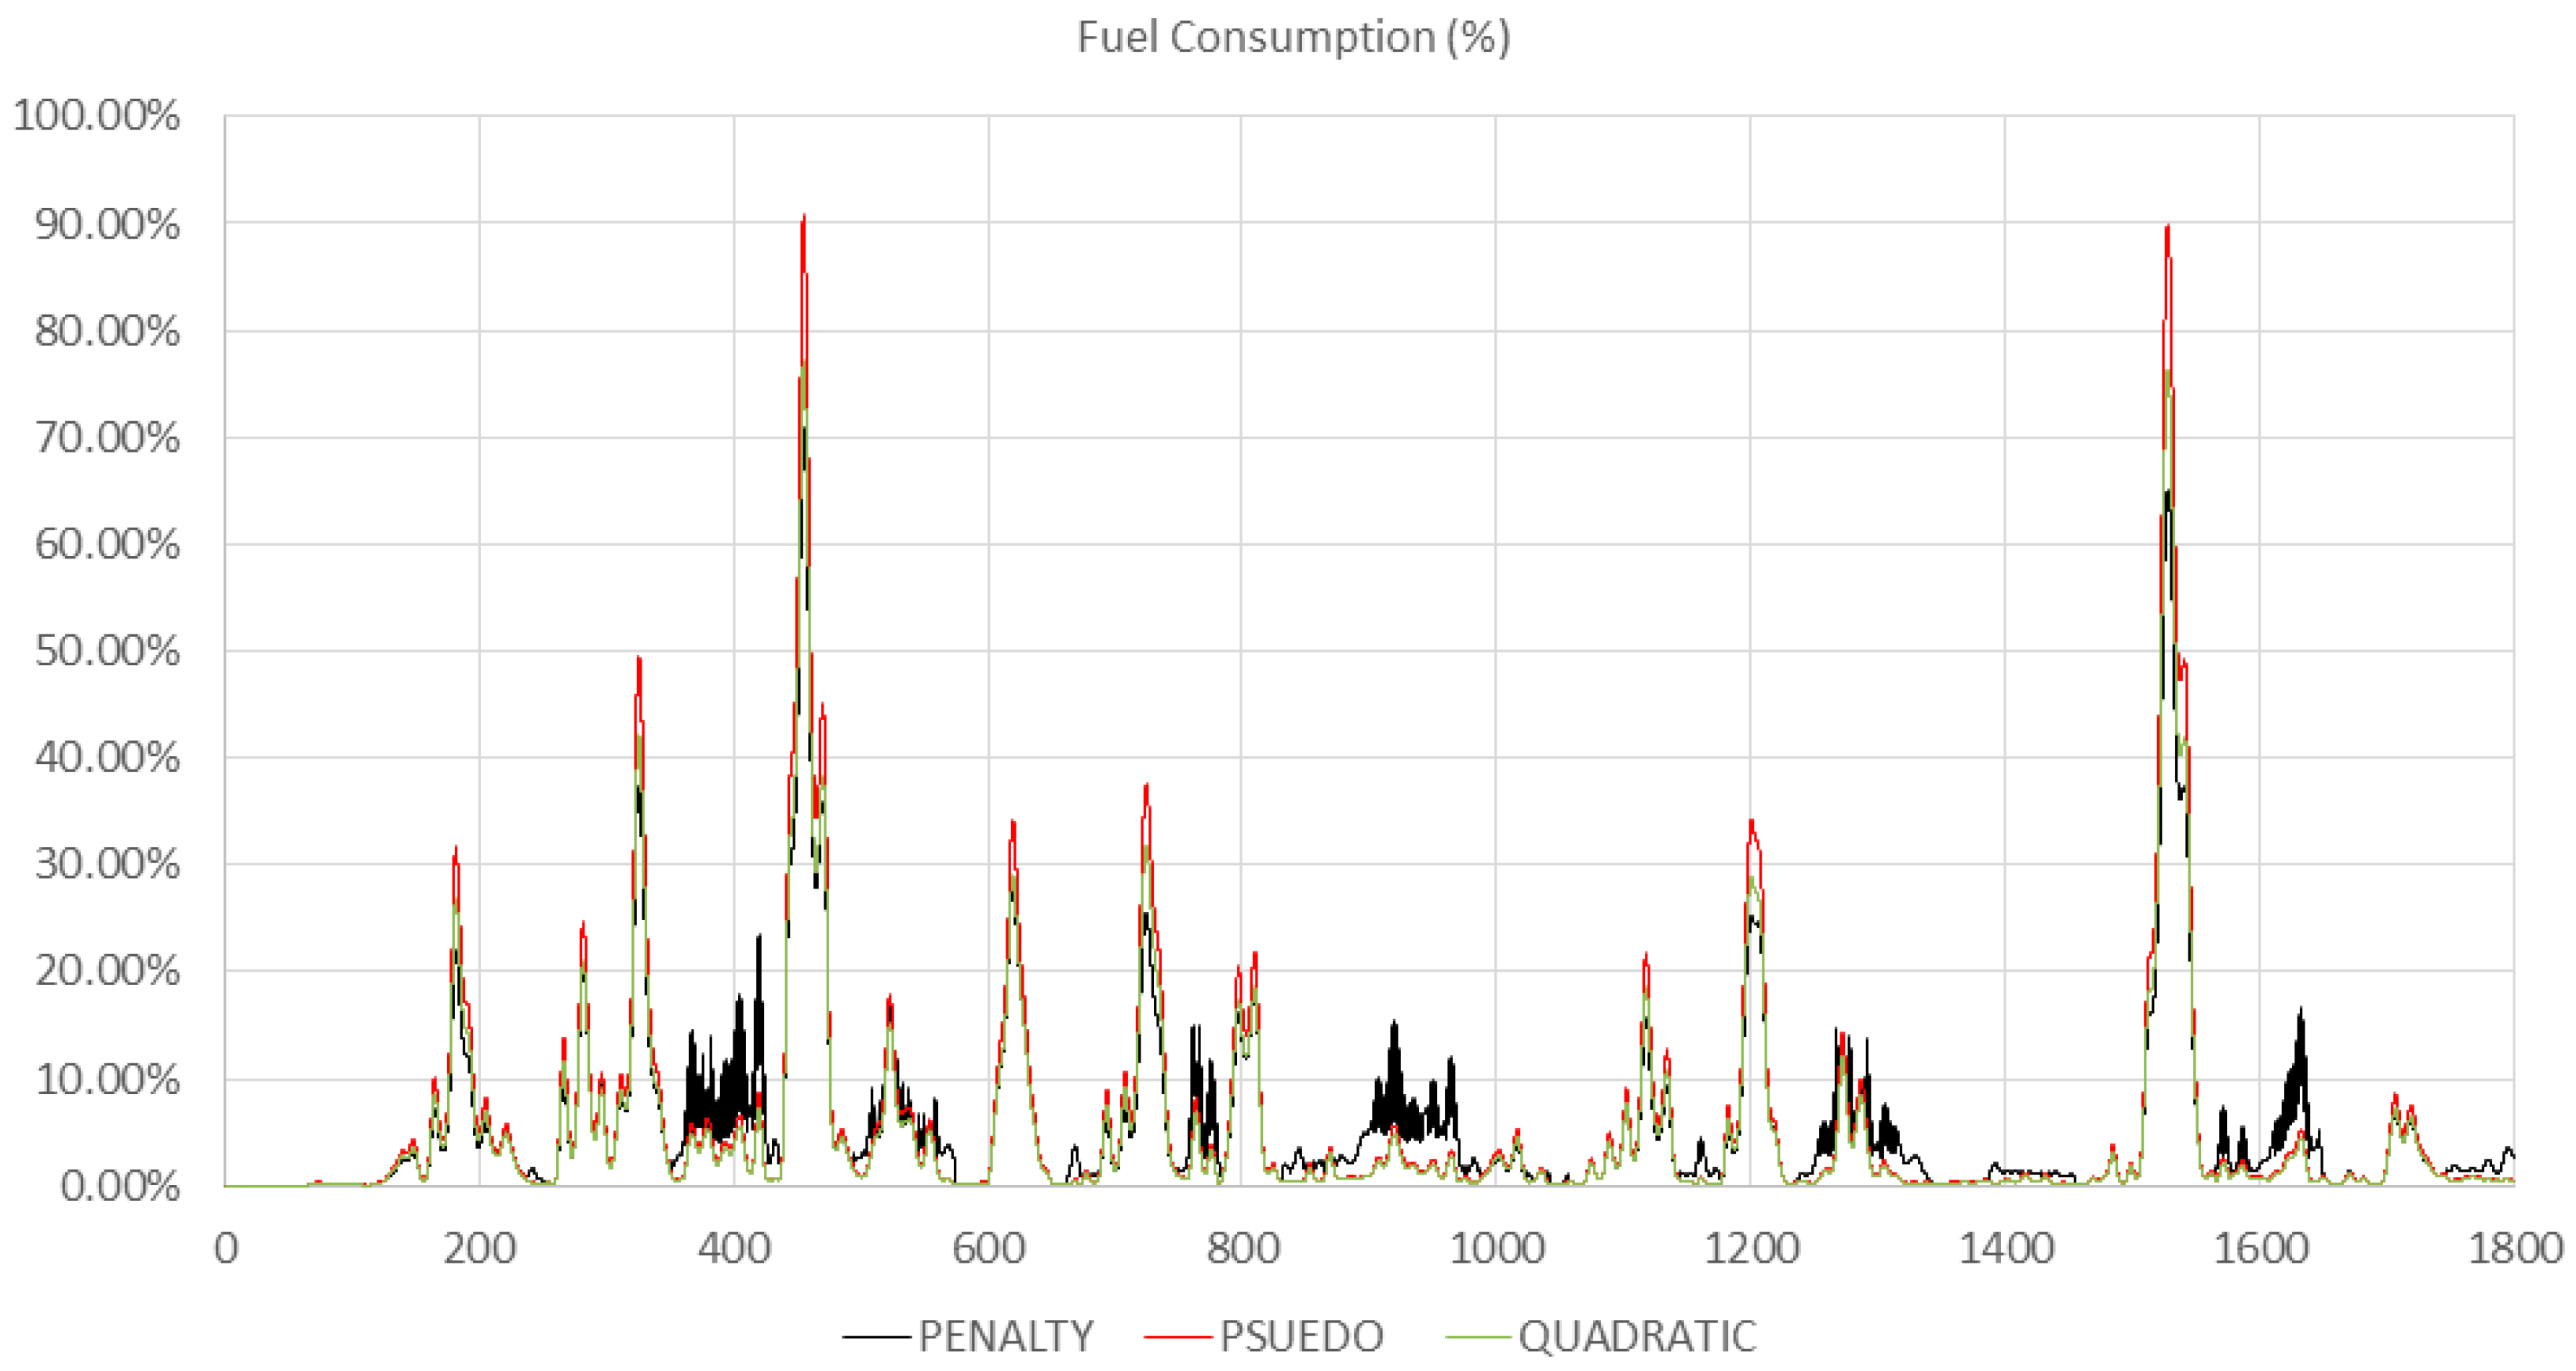
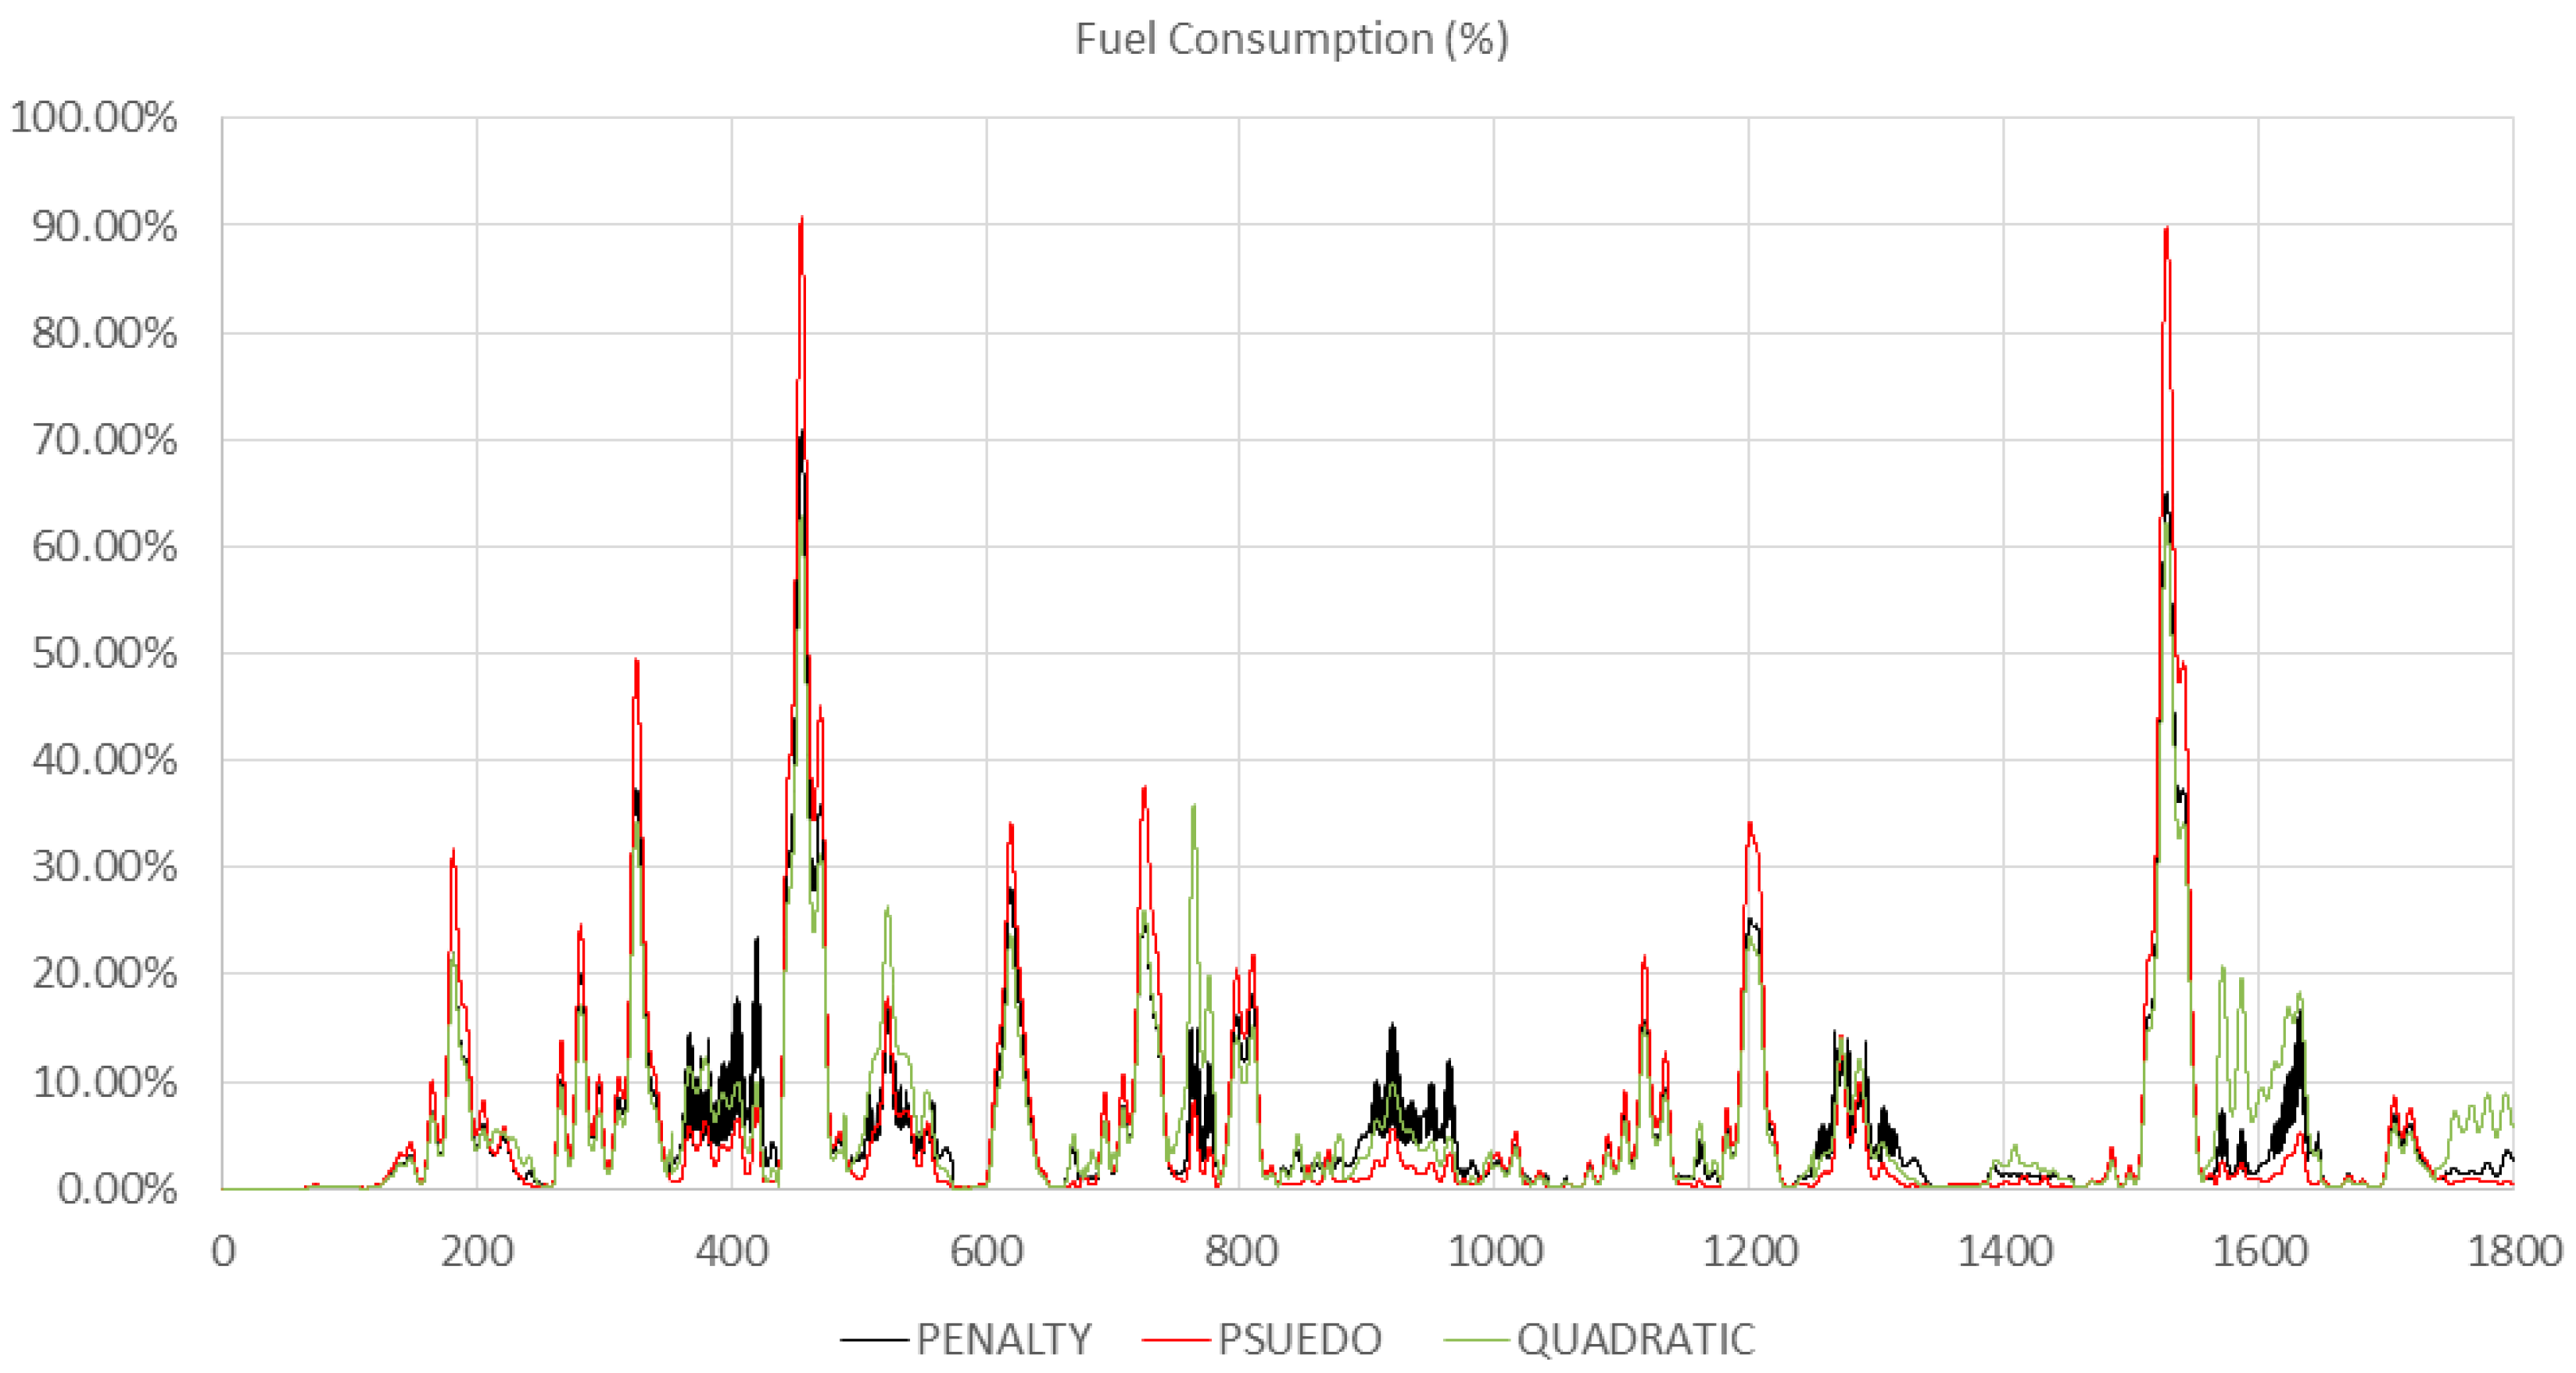
Figure 16 shows the fuel-consumption time histories by three different thrust-allocation methods. The red line is the pseudo-inverse method, and the green and black ones are the quadratic programming and penalty programming. According to the graph, the pseudo-inverse method consumes the largest amount of fuel compared to other thrust-allocation methods. Peaks of the pseudo-inverse method occur when environmental forces reach the thruster-allocation capacity. The peak of the penalty programming is lower than those of the pseudo-inverse method and quadratic programming by 32% and 26%, respectively. In the case of the accumulated fuel consumption amount, the penalty programming saves 6% and 5%, respectively, compared to the pseudo-inverse method and quadratic programming. From this comparison, it can be concluded that the penalty programing performs better than pseudo-inverse and quadratic-programming methods in keeping positions and saving fuel consumption during the severe storm.
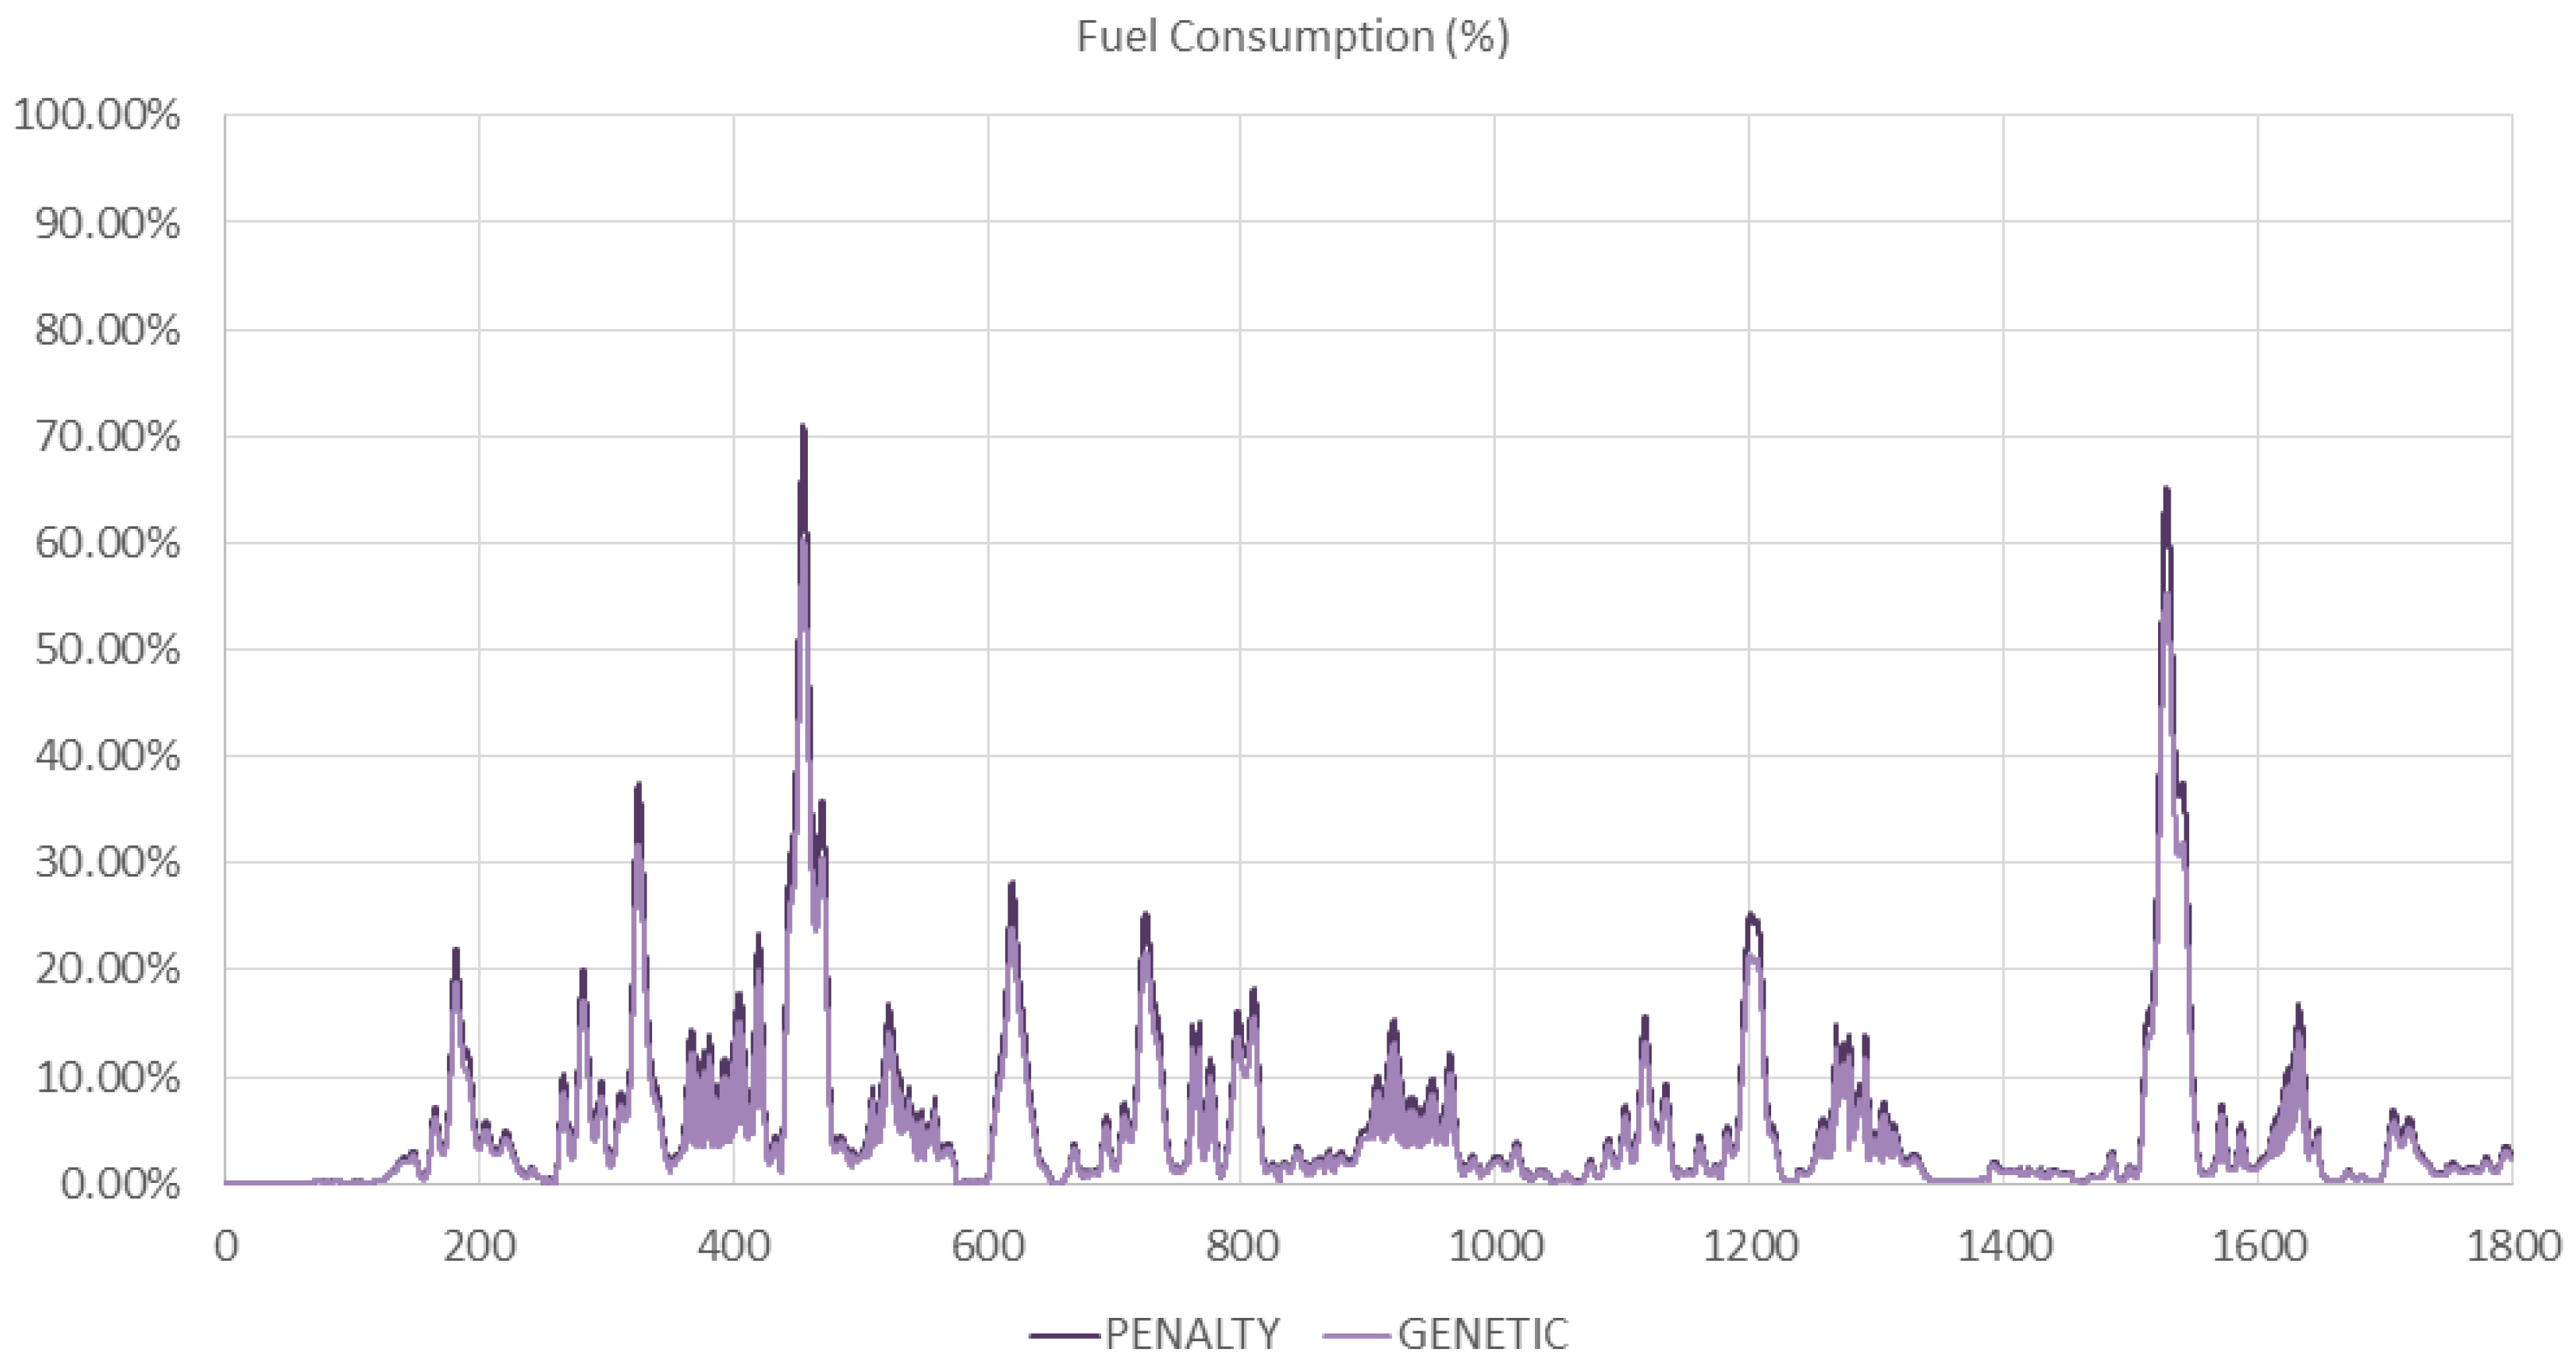
Figure 17 additionally shows the fuel-consumption history when the genetic algorithm is used. The genetic algorithm further reduced the fuel consumption by 2% compared to the penalty programming. Although genetic algorithm shows the best fuel-reduction performance, the genetic algorithm is not feasible for real-time DP controller because it takes a much longer time compared to other methods. In the case of the genetic algorithm, it generally takes more than one minute per one thrust-allocation step to optimize. Meanwhile, the penalty programming, pseudo-inverse, and quadratic-programming methods use under 1 s for thrust allocation.

7.2.2. Single Alignment

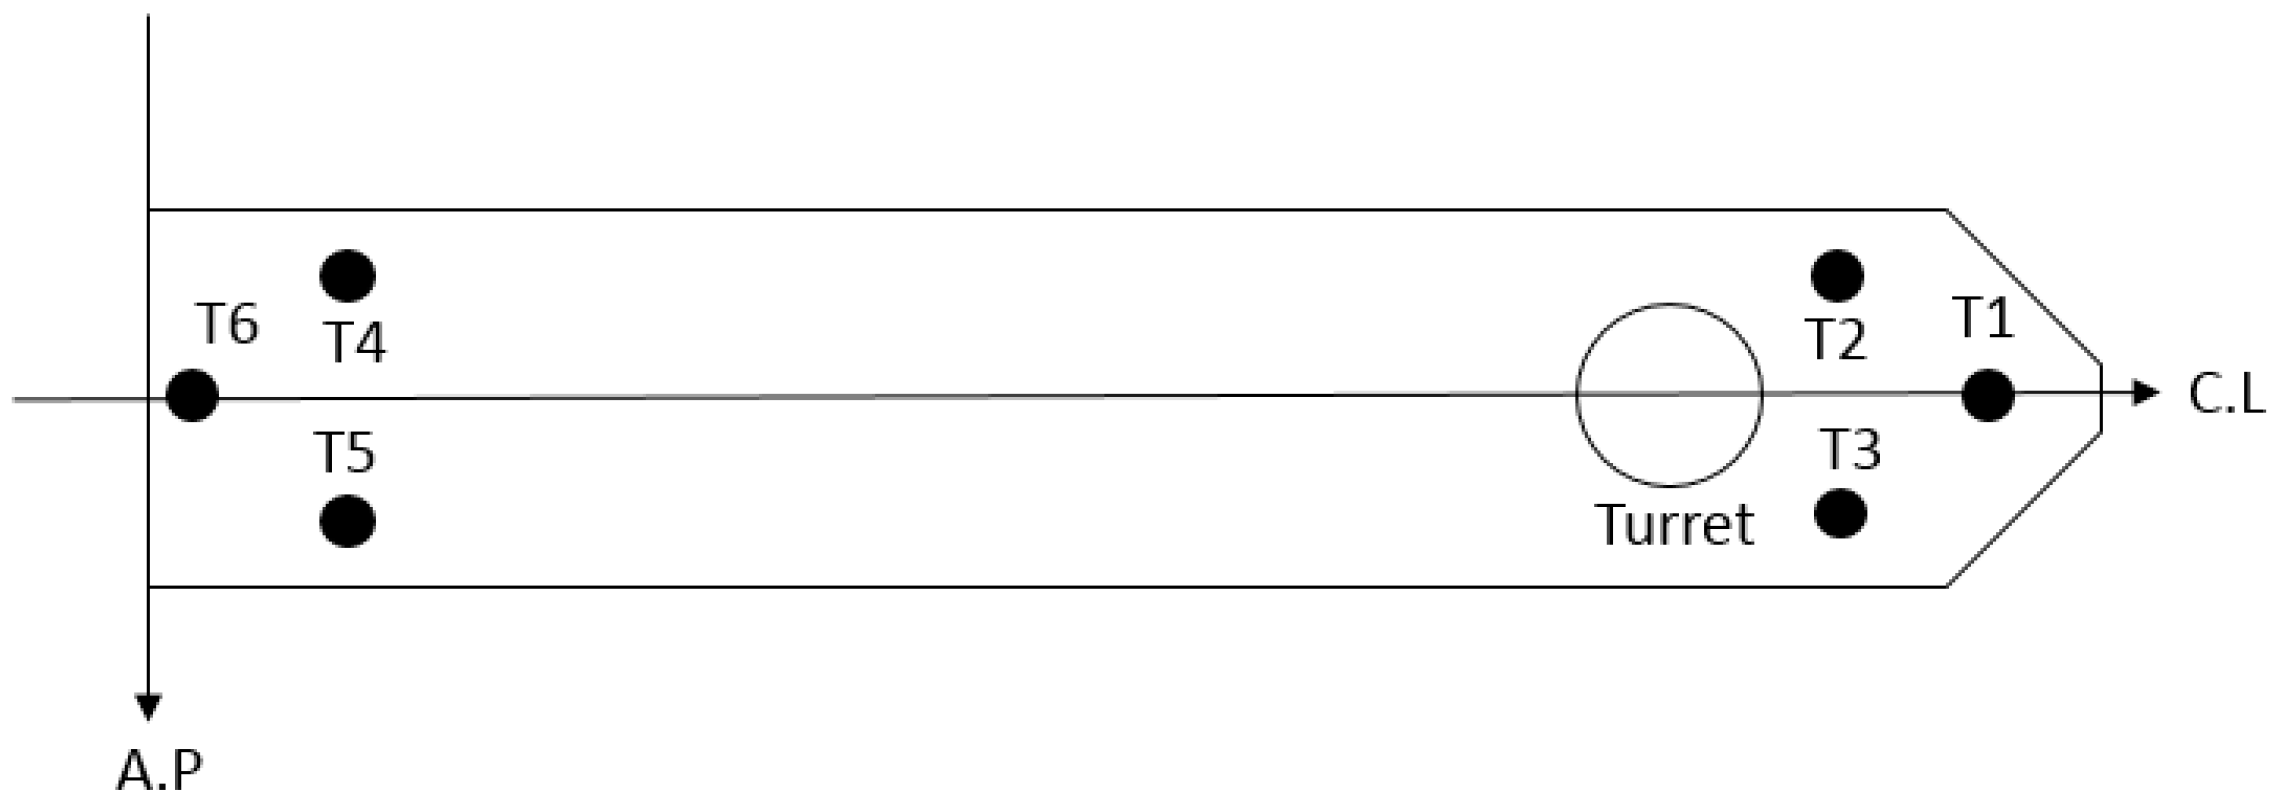
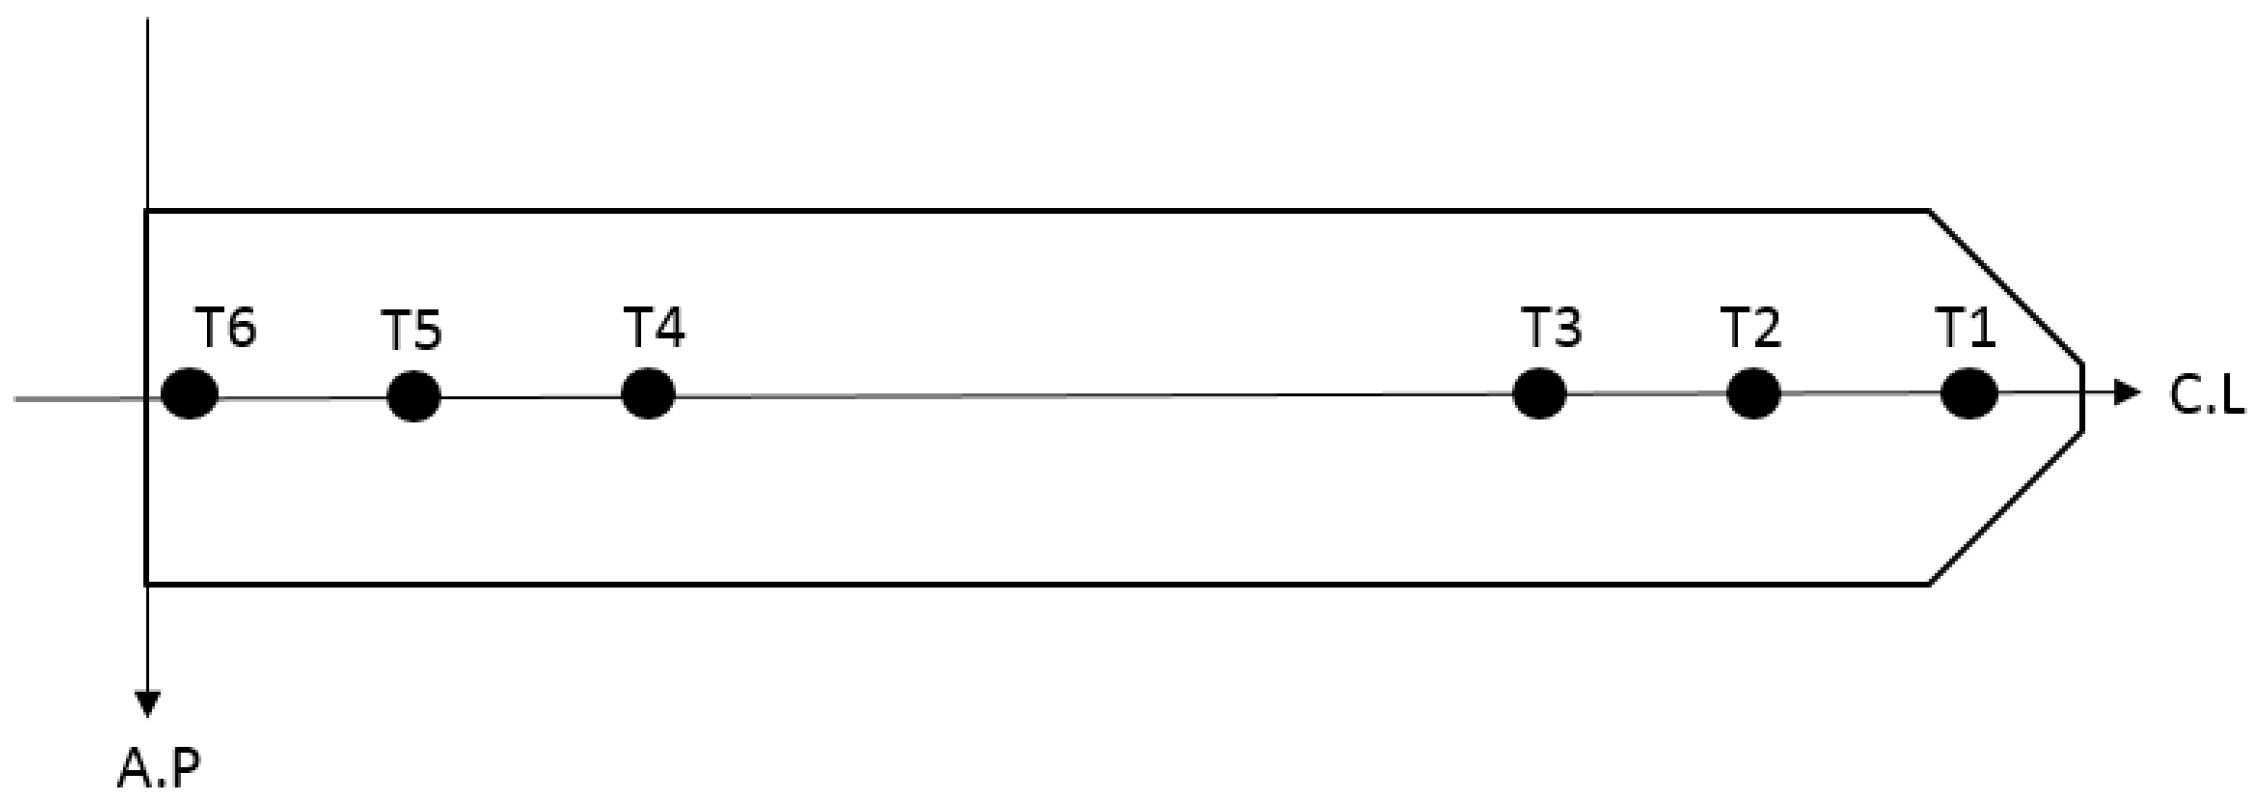
Next, to find out whether the previous conclusion depends on a specific thruster arrangement, a different thruster configuration was examined. In this case, the same six azimuth thrusters were arranged by single alignment, as shown in Figure 18. The 6 DOF-coupled time-domain simulations were carried out under the same Gulf of Mexico (GOM) 100-year storm conditions. The thruster constraints are the same as Table 7 and Table 8. Single-Alignment thruster configuration (T2 (260 m, 0 m), T3 (220 m, 0 m), T4 (90 m, 0), T5 (50 m, 0) are changed compared to Table 7.
The corresponding horizontal trajectories by three different thrust-allocation methods are given in Figure 19. The corresponding key statistics are given in Table 10. The position-keeping differences among the different thruster-allocation methods are bigger than the previous case because the single alignment has a smaller moment arm, so it reaches the thruster constraint more frequently. In this case, the penalty and pseudo-inverse methods show similar performance in the position-keeping performance, and they are better than the quadratic-programing method. Yaw-wise, the penalty method is the best. The maximum mooring top tensions of the three methods are almost the same.
In Figure 20, 6DOF motions of the DP-controlled FPSO with the penalty programming and single-line arrangements are plotted. When compared to the previous DP arrangement, the efficiency of sway and yaw modes is slightly diminished.
Figure 21 presents the fuel-consumption index by 3 different thruster-allocation methods in the single-alignment case. The total accumulated fuel consumption was increased by 1% when compared to the case of group thruster configuration. This difference comes from the thrust-allocation efficiency depending on thruster configuration. The peak of penalty programming is lower than those of pseudo-inverse method and quadratic programming by a maximum of 36% and 30%, respectively. In the case of accumulated fuel consumption, the penalty programming saves 7% and 6% in total fuel consumption, compared to the pseudo-inverse and quadratic-programming method.

7.3. Results for GOM 1-YEAR Storm Condition

Next, let us investigate whether the previous conclusion is affected by different storm conditions. In this regard, the simulation under the Gulf of Mexico (GOM) 1-year storm condition was conducted to analyze the change due to milder environmental conditions. The same DP FPSO with group configuration of six azimuth thrusters, as in Figure 13, was simulated. The thruster configuration and constraints are the same as the previous GOM 100-year group-configuration case.
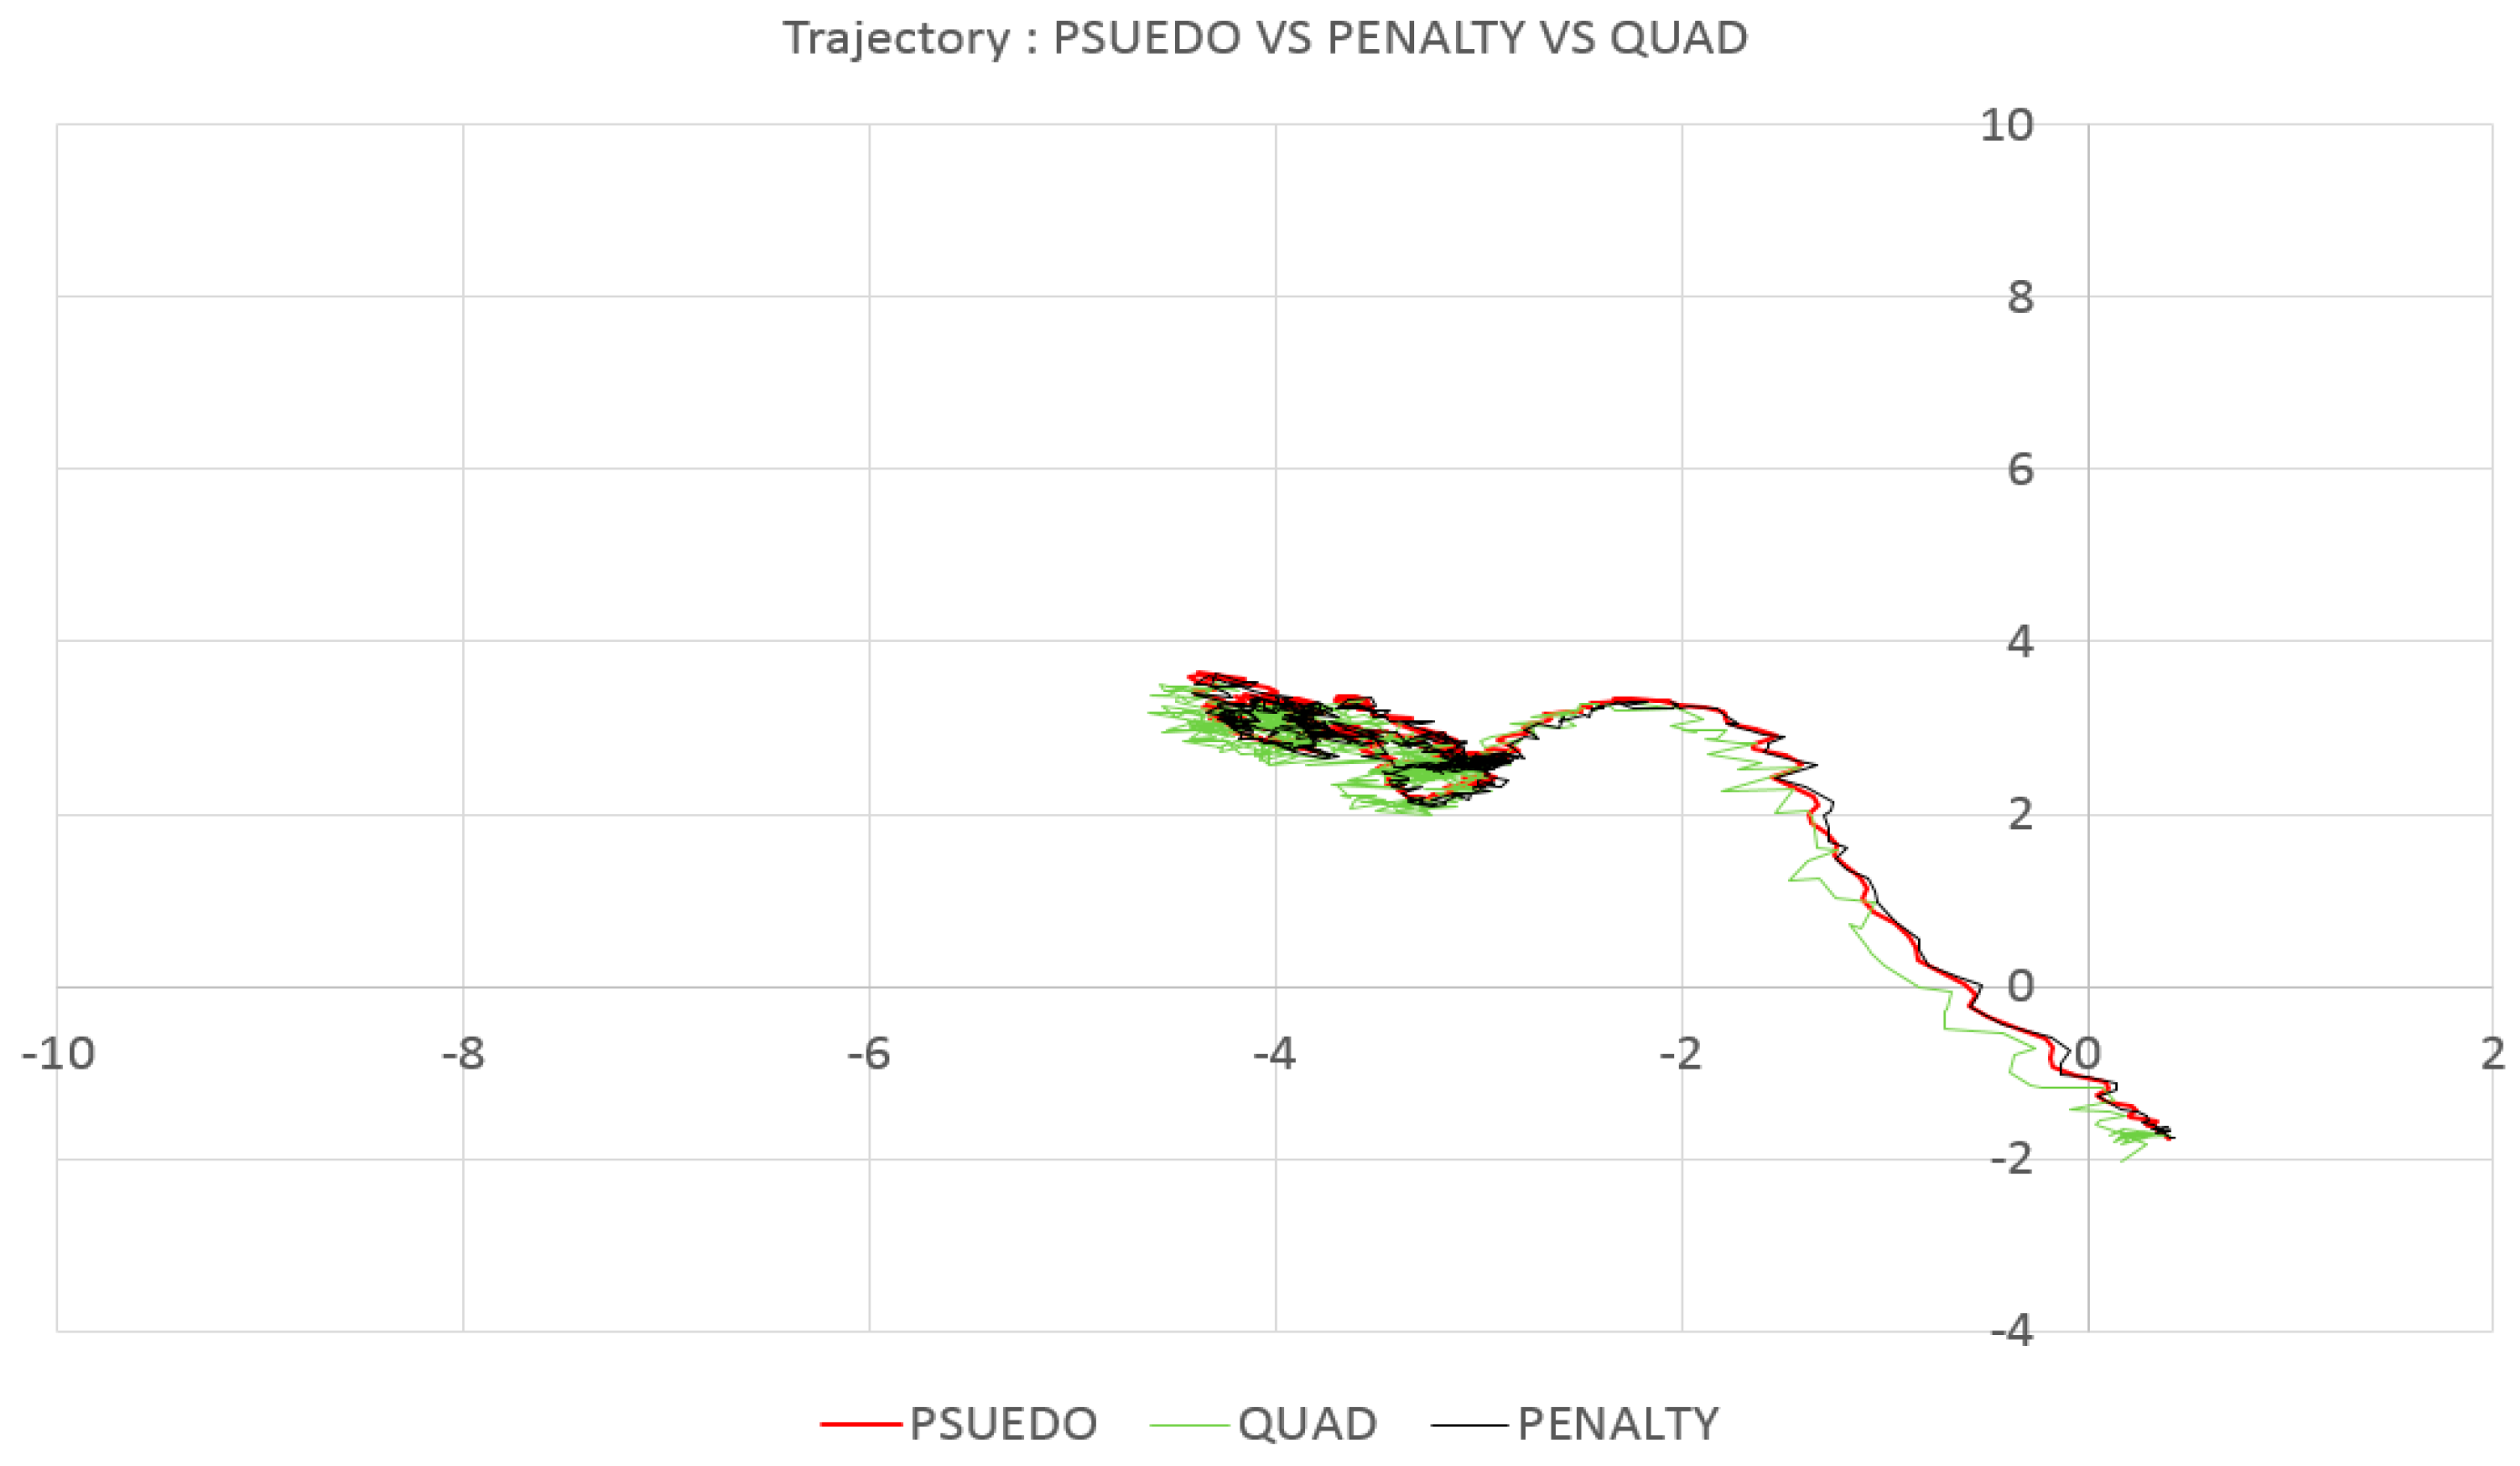
The horizontal-plane trajectories by three different allocation methods are presented in Figure 22. The watch circle is under 3 m because the environmental force is much smaller compared to the GOM 100-year condition. The corresponding statistics are summarized in Table 11. In this milder environment, there is no appreciable difference in station-keeping performance among the three different methods.
Figure 23 shows 6DOF motion results of DP-controlled FPSO with the penalty programming. In general, motion amplitudes are much smaller than those of the 100-yr storm case.
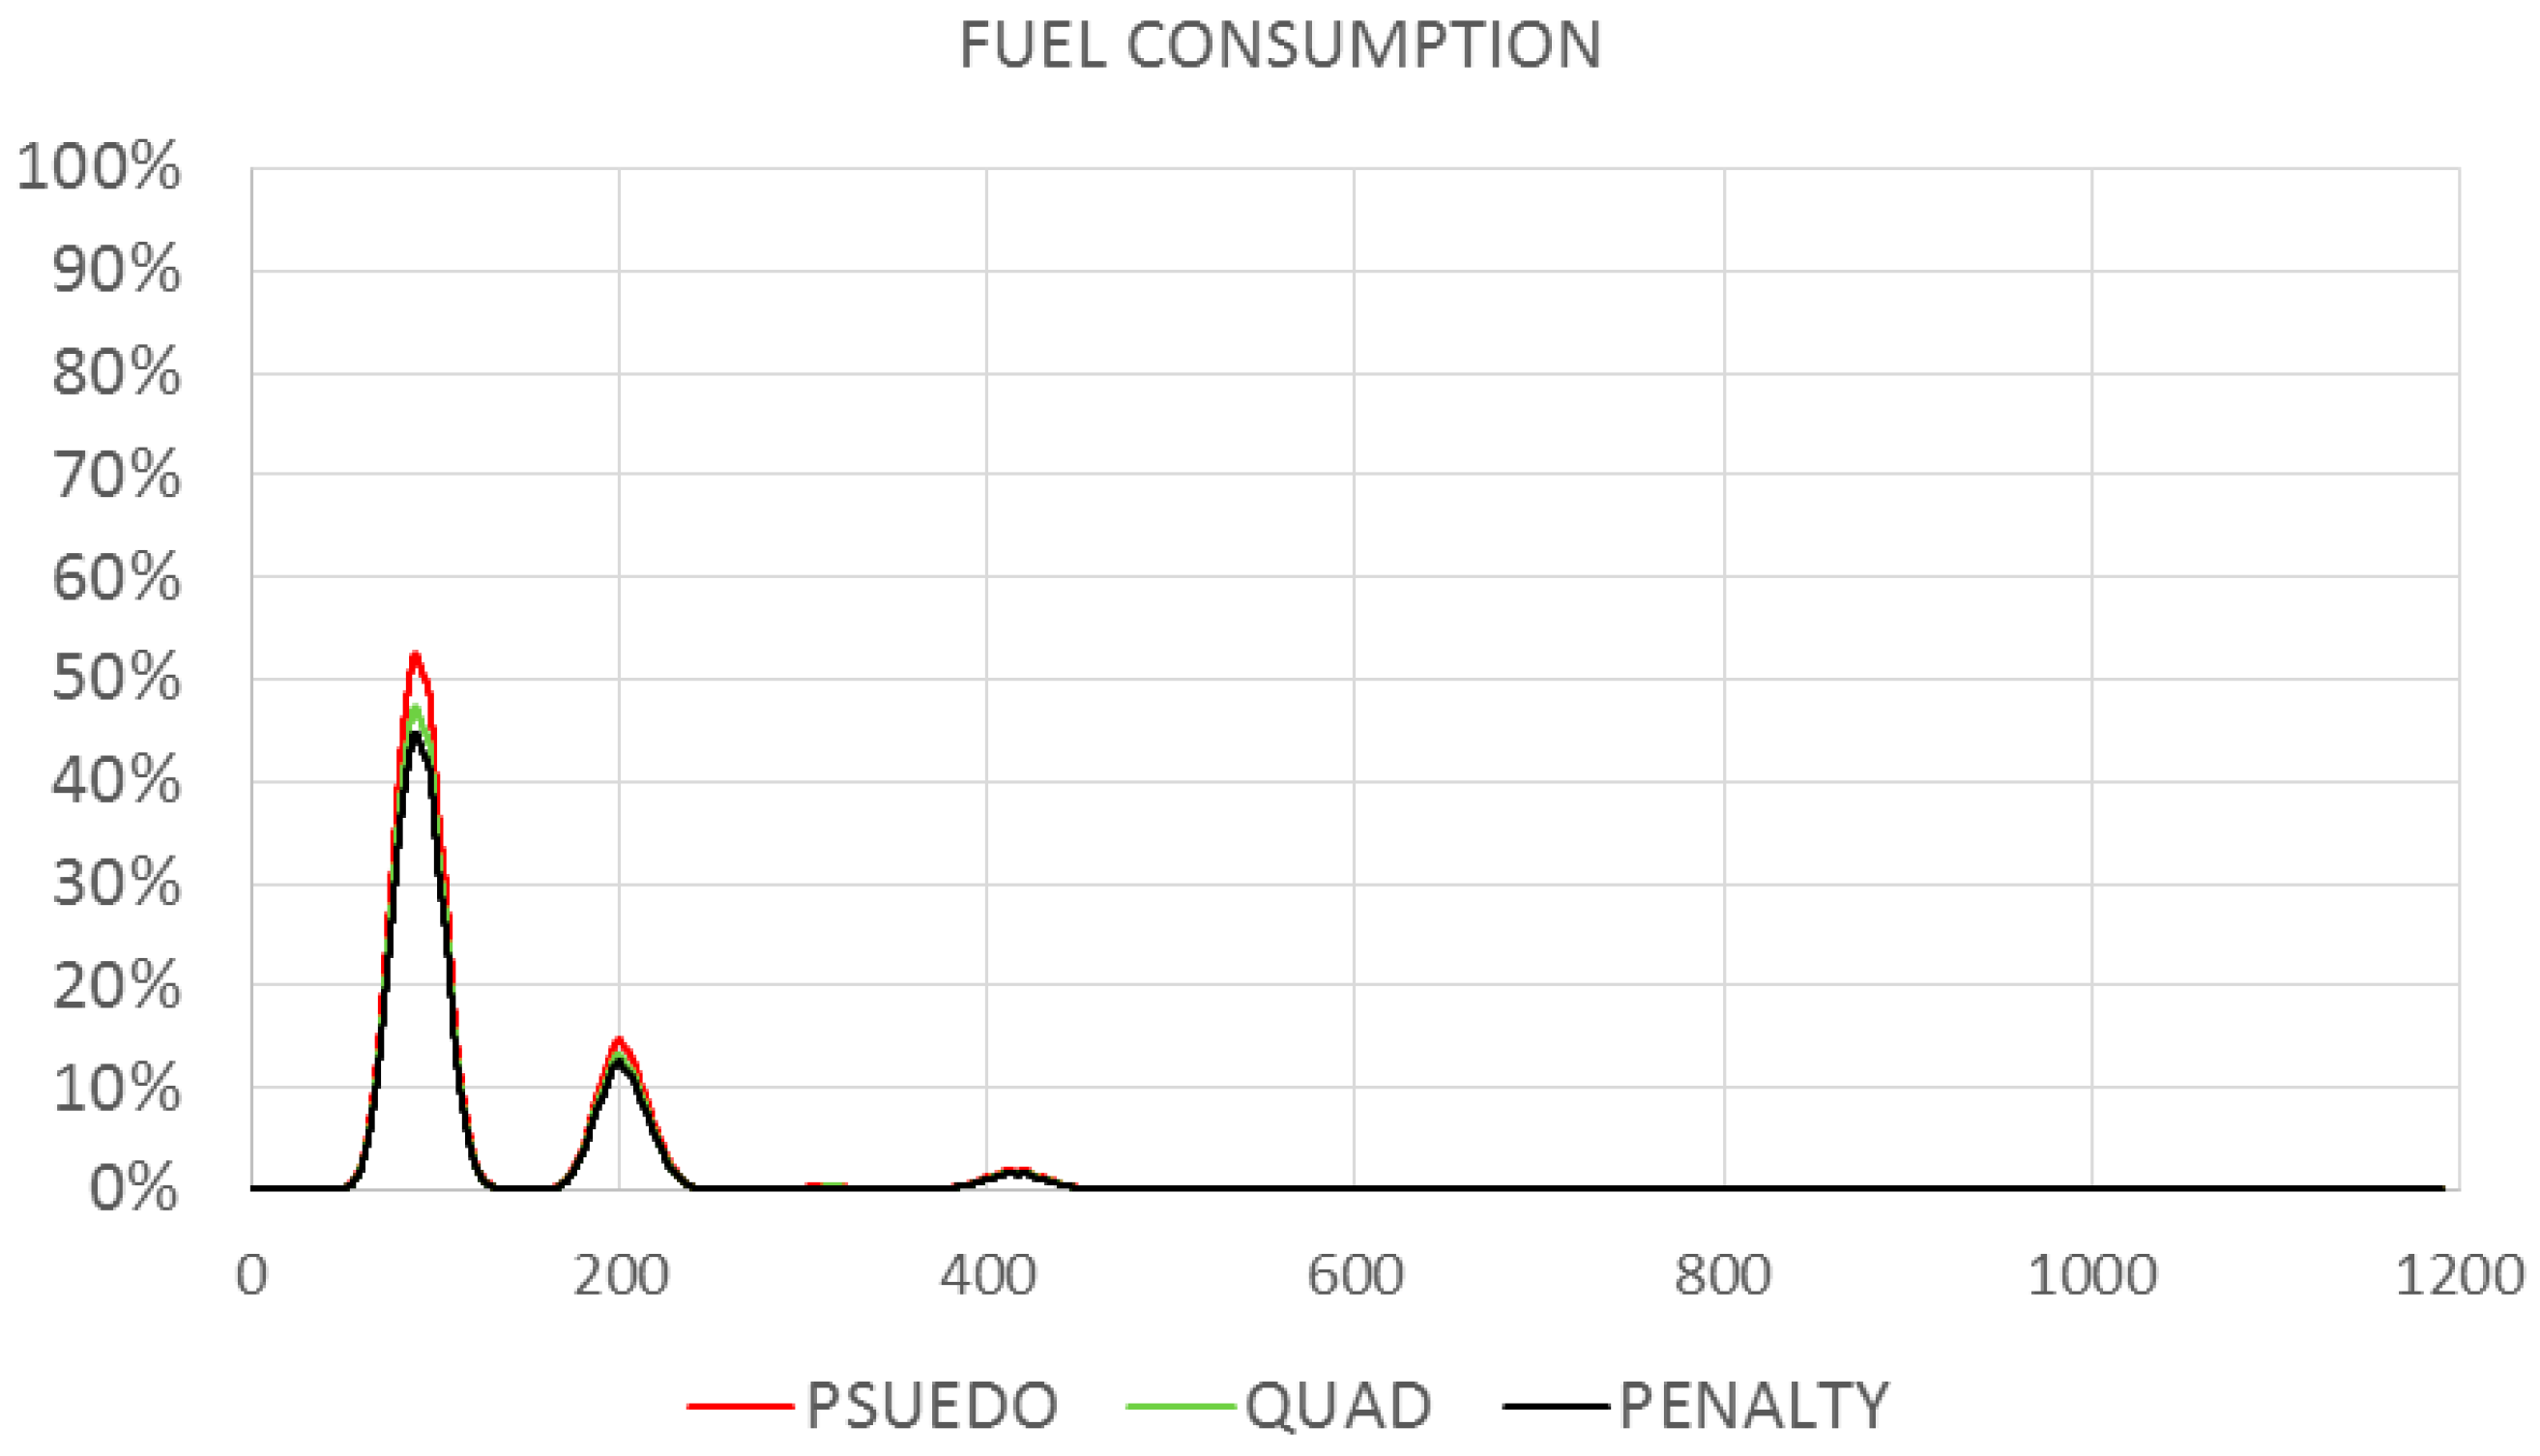
Figure 24 shows the corresponding fuel consumption based on the pseudo-inverse, penalty, and quadratic-programming methods. The peak of penalty programming is lower than that of pseudo-inverse and quadratic methods by a maximum of 13% and 9%, respectively. In the case of the accumulated fuel-consumption amount, the penalty programming saves 3% and 2% in total accumulated fuel consumption, compared to the pseudo-inverse and quadratic-programming methods.

8. Conclusions

In this research, a new thrust-allocation algorithm, penalty programming, is proposed for optimal DP operation, with minimal fuel consumption while maintaining good performance in vessel position-keeping. Its performance was compared with other existing thruster-allocation methods, such as pseudo-inverse or quadratic-programming methods. To demonstrate the performance of the respective thruster-allocation methods, a DP-controlled turret-moored FPSO was considered. The thrust-allocation methods were implemented in the time-domain hull–mooring–riser-coupled simulation program with DP control. The time-domain simulation tool was validated by comparison with reference cases.
By the time-domain simulations, the effects of environmental conditions and thruster arrangements for the respective methods were analyzed. The developed penalty programming shows the best performance in the fuel-consumption reduction compared to the conventional pseudo-inverse or quadratic-programming methods in all the cases considered. In the case of genetic algorithm, despite high performance in saving fuel, it is not feasible to apply to real-time DP controller because computation time per thrust allocation is typically longer than one minute, while other methods can be done within one second. In the case of thruster arrangement, the group-thruster configuration shows better performance compared to the single-alignment configuration.
The penalty-programming-based thrust allocation can save about 7% (or 6%) accumulated fuel consumption compared to the pseudo-inverse (or quadratic-programming) method in GOM 100-year storm condition. The penalty programming can similarly reduce the accumulated fuel consumption when compared to pseudo-inverse (or quadratic-programming) method for GOM 1-year storm condition. Moreover, this improvement of thrust allocation based on the penalty programming is valid in both single alignment and group configuration of thrusters. Moreover, the fuel saving directly contributes to less gas emissions. The developed technology can generally be applied to other offshore vessels and platforms with DP system.
Author Contributions

S.W.K. and M.H.K. conceptualized and established the methodology for the thrust allocation optimization problem together. S.W.K. conducted the validation and simulation with supervision of M.H.K. Writing—Original Draft Preparation, S.W.K.; Writing Review & Edition, M.H.K.

Acknowledgments

This research was supported by DSME (Daewoo Shipbuilding and Marine Engineering).

Conflicts of Interest

The authors declare no conflict of interest.

Abbreviations

DPdynamic positioning
DPSdynamic positioning system
FPSOfloating production storage and offloading
CO2carbon dioxide
PIDproportional integral derivative
PDproportional differential controller
DOFdegree of freedom
LQRlinear quadratic regulator

References

  1. Kim, C.; Kim, Y. Electric Power System Design and Analysis for Drilling Rig. J. Korean Soc. Mar. Eng. 2012, 36, 942–947. [Google Scholar] [CrossRef]
  2. Varalakshimi, J. Analytical Framework to Evaluate Emission Control System for Marine Engines. Ph.D. Thesis, UC Riverside University, Riverside, CA, USA, 2010. [Google Scholar]
  3. Johansen, T.A.; Fossen, T.I. Control allocation—A survey. Automatica 2013, 49, 1087–1103. [Google Scholar] [CrossRef] [Green Version]
  4. Ryu, S. Hull/Mooring/Riser Coupled Motion Simulations of Thruster–Assisted Moored Platforms. Ph.D. Thesis, Texas A&M University, TX, USA, 2003. [Google Scholar]
  5. Johansen, T.A.; Fossen, T.I. Constrained nonlinear control allocation with singularity avoidance using sequential quadratic programming. IEEE Trans. Control Syst. Technol. 2004, 12, 211–216. [Google Scholar] [CrossRef] [Green Version]
  6. Wit, C.D. Optimal Thrust Allocation Methods for Dynamic Positioning of Ships. Master’s Thesis, Delft University, Delft, The Netherland, 2009. [Google Scholar]
  7. Rindaroy, M. Fuel Optimal Thrust Allocation in Dynamic Positioning. Master’s Thesis, NTNU, Tai Bei, Taiwan, 2013. [Google Scholar]
  8. Zhao, L.; Rho, M. A thrust a thrust allocation method for efficient dynamic positioning of a semisubmersible drilling rig based on the hybrid optimization algorithm. Math. Probl. Eng. 2015. [Google Scholar] [CrossRef]
  9. Caponetto, R.; Fortuna, L.; Granziani, S.; Xilbia, M.G. Genetic algorithm, and application in system engineering: A survey. Trans. Inst. Meas. Control 1993, 15, 3. [Google Scholar] [CrossRef]
  10. Saddat, J.; Moallem, P.; Koofigar, H. Training Echo State Neural Network Using Harmony Search Algorithm. Int. J. Artif. Intell. 2017, 15, 163–197. [Google Scholar]
  11. Vrkalovic, S.; Teban, T.; Borlea, I. Stable Takagi–Sugeno Fuzzy Control Designed by Optimization. Int. J. Artif. Intell. 2017, 15, 17–29. [Google Scholar]
  12. Malecki, J. Fuzzy Track Keeping Steering Design for a Precise Control of the Ship. Solid State Phenom. 2013, 196, 140–147. [Google Scholar] [CrossRef]
  13. Rao, S. Engineering Optimization, 4th ed.; Wiley: Hoboken, NJ, USA, 2009. [Google Scholar]
  14. You, Y.J.; Choi, W.J.; Kim, D.S.; Lee, Y.B. A prediction method of the crabbing capability using penalty programming. In Proceedings of the 24th International Offshore and Polar Engineering Conference, Busan, Korea, 15–20 June 2014. [Google Scholar]
  15. Yang, C.K.; Kim, M.H. Transient effects of tendon disconnection of a TLP by hull-tendon-riser coupled dynamic analysis. Ocean Eng. 2010, 37, 678–687. [Google Scholar] [CrossRef]
  16. Yang, C.K.; Kim, M.H. The structural safety assessment of a tie-down system on a tension leg platform during hurricane events. Ocean Syst. Eng. Int. J. 2011, 1, 263–283. [Google Scholar] [CrossRef]
  17. Bae, Y.H.; Kim, M.H. Rotor-floater-mooring coupled dynamic analysis of mono-column-TLP-type FOWT (Floating Offshore Wind Turbine). Ocean Syst. Eng. Int. J. 2011, 1, 93–109. [Google Scholar]
  18. Li, D.; Liu, T.; Ji, H.; Ran, A.; Kim, M.H.; Kang, H.Y. Development and application of a DP float-over analysis program. In Proceedings of the 25th International Offshore and Polar Engineering Conference, Hawaii, USA, 21–26 June 2015. [Google Scholar]
  19. Kim, S.W.; Kim, M.H.; Kang, H.Y. Turret location impact on global performance of a thruster-assisted turret-moored FPSO. Ocean Syst. Eng. Int. J. 2016, 6, 3. [Google Scholar] [CrossRef]
Figure 1. Conventional DP-Control Frame.
Energies 11 02128 g001
Figure 2. Flow Chart of Penalty Program.
Energies 11 02128 g002
Figure 3. Uncoupled Analysis.
Energies 11 02128 g003
Figure 4. Coupled Analysis.
Energies 11 02128 g004
Figure 5. Bourbon UT 745 Type Offshore Support Vessel.
Energies 11 02128 g005
Figure 6. Thrust-Allocation Validation Results.
Energies 11 02128 g006
Figure 7. Fuel-Consumption Validation Results.
Energies 11 02128 g007
Figure 8. Mesh Generation of the DP FPSO.
Energies 11 02128 g008
Figure 9. Coordinate System and Environmental Forces.
Energies 11 02128 g009
Figure 10. America Petroleum Institute (API) Wind Spectrum.
Energies 11 02128 g010
Figure 11. Arrangement and Numbering of the FPSO Mooring Lines.
Energies 11 02128 g011
Figure 12. Arrangement and Numbering of the FPSO Risers.
Energies 11 02128 g012
Figure 13. Thruster Configuration.
Energies 11 02128 g013
Figure 14. Surge and Sway Trajectories by Three Different Thrust-Allocation Algorithms.
Energies 11 02128 g014
Figure 15. DP FPSO-Controlled Motion using the Penalty Programming.
Energies 11 02128 g015
Figure 16. Fuel-Consumption Time Histories Compared to Maximum Capacity by Three Different Thrust-Allocation Algorithms.
Energies 11 02128 g016
Figure 17. Fuel Consumption Time Histories Compared to Maximum Capacity by Penalty Programming and Genetic Algorithm.
Energies 11 02128 g017
Figure 18. Single-Alignment Configuration.
Energies 11 02128 g018
Figure 19. Surge and Sway Trajectories by Three Different Thrust-Allocation Algorithms.
Energies 11 02128 g019
Figure 20. 6DOF Motions by Penalty Programming (Single-Alignment Thruster Configuration).
Energies 11 02128 g020
Figure 21. Fuel Consumption Time History Compared to Maximum Capacity by Three Different Thrust-Allocation Algorithms.
Energies 11 02128 g021
Figure 22. Surge and Sway Trajectories by Three Different Thrust-Allocation Algorithms.
Energies 11 02128 g022
Figure 23. 6DOF Motions under GOM 1-Year Case.
Energies 11 02128 g023
Figure 24. Fuel Consumption Index Time History by Three Different Thrust-Allocation Algorithms.
Energies 11 02128 g024
Table 1. The Optimization Scheme Categorization.
Linear Object FunctionNonlinear Object Function
Linear ConstraintSimplex Method
Linear Programming
Nonlinear Programming
Quadratic Programming
Sequential Programming
Nonlinear ConstraintGenetic Algorithm
Penalty Programming
Genetic Algorithm
Penalty Programming
Table 2. Principal Dimension of Simulation Vessel.
DesignationSymbolUnitQuantity
Vessel Size-GT3325 T
Length Over AllLoA m 88.6
BreadthB m 78.8
DraftT m 18.9
Thruster ConfigurationFWD Tunnel and Azimuth Thruster: 883 kw AFT PORT and STBD Azimuth Thruster: 883 kw
Table 3. Principal Dimension of Simulation Vessel.
DesignationSymbolUnitQuantity
Production Level-bpd120,000
Storage-bbls1,440,000
Vessel Size-kDWT200
Length b/w Perpendiculars Lpp m 310
BreadthB m 47.2
DepthH m 28.0
DraftT m 18.9
Length to Beam RatioL/B-6.57
Beam to Draft RatioB/T-2.5
Displacement Δ ton240,869
Block CoefficientCb 0.85
Center of Buoyancy
Forward Section 10
FB m 6.6
Water Plane AreaA m 2 13,400
Water Plane CoefficientCw-0.9164
Center of Water Plane
Area Forward Section 10
FA m 1.0
Center of Gravity Above BaseKG m 13.3
Metercentric Height TransverseMGt m 5.8
Metercentric Height LongitudinalMGl m 403.8
Trans. Radius of Gyration in AirKxx m 14.8
Long. Radius of Gyration in AirKyy m 77.5
Yaw Radius of GyrationKzz m 79.3
Wind Area FrontAf m 2 1012
Wind Area SideAb m 2 3772
Turret in Centerline - m 63.5
behind Fpp (20.5% Lpp)
Turret Elev. below Tanker Base- m 1.5
Turret Diameter- m 15.8
Table 4. Environmental Conditions.
EnvironmentParameter GOM 1-Year Storm GOM 100-Year Storm
WAVESignificant Wave Height H s 4.3 m12.19 m
Peak Period T p 9 s14 s
Overshoot Parameter γ 22.5
WINDSpeed (m/s)14.3 m/s at 10 m41.1 m/s at 10 m
CURRENTSpeed (m/s)0.3 m/s1.07 m/s
Table 5. Mooring Line Particulars.
DesignationUnitQuantity
Water Depthm1829
Pre-TensionkN1424
Number of Linesea4 × 3
Degree between the 3 Linesdeg.5
Length of Mooring Linem2652
Radius of Location of Chainm7.0
Stoppers on Turn Table
Segment 1: Chain
Length at Anchor Pointm121.9
Diametercm9.52
Dry WeightN/m1856
Weight in WaterN/m1615
Stiffness AEkN912,120
Segment 2: Polyester
Length m2438
Diametercm16.0
Dry WeightN/m168.7
Weight in WaterN/m44.1
Stiffness AEkN186,800
Segment 3: Chain
Length at Anchor Pointm91.4
Diametercm9.53
Dry WeightN/m1856
Weight in WaterN/m1615
Stiffness AEkN912,120
Table 6. Riser Particulars.
Riser TypeTop TensionODAEEIWeight Dry/WetCdn
kNcmkNkNm2N/m-
Liquid Production (LP)222444.51.83 × 1072761927 10361
Gas Production (GP)122338.61.08 × 1071131708 5251
Water Injection (WI)404853.11.86 × 1072242802 18971.414
Gas Injection (GI)271428.73.14 × 106641810 11681.414
Gas Export (GE)91234.38.63 × 106711357 4231
Total Length of Risers3657.4 m
Table 7. Thruster Information.
Thruster Maximum Capacity 150 KN
Thruster Maximum Change Rate 20 KN/s
Thruster Angle Change Rate 10 deg/s
Thruster Position (A.P = 0, C.L = 0)T1 (290 m, 0 m)
T2 (275 m, −15 m)
T3 (275 m, 15 m)
T4 (35 m, −15 m)
T5 (35 m, 15 m)
T6 (20 m, 0 m)
Table 8. Thruster Constraints.
Thruster Capacity Constraint (KN)0 < T1,2,3,4,5,6 < 150
Thruster Angle Constraint (deg)0 < α 1 , 2 , 3 , 4 , 5 , 6 < 360
Thruster Rate Constraint Rate (KN/s)0 < T ˙ 1 , 2 , 3 , 4 , 5 , 6 < 20
Thruster Angle Change Rate (deg/s)0 < α ˙ 1 , 2 , 3 , 4 , 5 , 6 < 20
Required Force Constraint τ = B u
Table 9. Mean Value and Standard Deviation by Three Different Thrust-Allocation Algorithms.
AlgorithmSurge Mean (M)Surge STDSurge MaxSway Mean (M)Sway STDSway MaxYaw Mean (M)Yaw STDYaw MAXTop Tension Max
Penalty−13.34.87−23.42.451.847.98.893.213.518108 KN
Pseudo−13.45.64−24.92.482.187.28.783.113.108108 KN
Quad−13.15.53−24.72.432.137.18.813.213.528109 KN
Table 10. Mean Value and Standard Deviation by Three Different Thrust-Allocation Algorithms.
AlgorithmSurge Mean (M)Surge STDSurge MaxSway Mean (M)Sway STDSway MaxYaw Mean (M)Yaw STDYaw MaxTop Tension Max
Penalty−11.734.94−21.563.553.1111.688.503.0815.308110 KN
Pseudo−13.274.87−23.162.692.029.728.893.2013.518109 KN
Quad−13.205.37−22.724.732.7312.048.903.3115.528110 KN
Table 11. Mean Value and Standard Deviation by Three Different Thrust-Allocation Algorithms.
AlgorithmSurge Mean (M)Surge STDSurge MaxSway Mean (M)Sway STDSway MaxYaw Mean (M)Yaw STDYaw MaxTop Tension Max
Penalty−3.151.07−4.392.561.063.598.383.7014.194386 KN
Pseudo−3.21.07−4.432.621.063.648.413.7114.214387 KN
Quad−3.301.08−4.582.491.063.588.503.7414.404387 KN