1. Introduction
Although small islands’ energy and water supply problems and solutions have been studied for a long time, high costs are still experienced. A levelized cost of energy of EUR 0.38/kWh [
1], in some cases exceeding EUR 0.70/kWh [
2], and water costs of over EUR 11/m
3 [
3,
4] are related to the usual dependency of the shipping-fuel and water restock. Moreover, demand is often concentrated in the summer period due to island tourism vocation [
3,
5,
6].
In the last decades, islands have been considered as the ideal test-bed for renewable energy penetration, with some successful results [
7]. To mention just a few, Meschede et al. [
8] classified 1087 islands using cluster analysis allowing the identification of similar islands, in order to foster proven and well-working concepts from one island to others with analogous characteristics. Blechinger et al. [
9] assessed the renewable energy source (RES) potential of 1800 small islands, conducing to the estimation of almost 7.5 GW of photovoltaic power and 14 GW of wind power, and a potential greenhouse gas emissions and fuel consumption abatement of approximately 50%. Gils et al. [
10] analyzed the scenario pathway to a 100% RES supply in the Canary Islands by 2050. The study highlighted the need to extend electric energy use to the mobility, heating and hydrogen production in order to support the integration of a large share of intermittent renewable power generation. Maizi et al. [
11] discussed a methodology to forecast the reliability and robustness of an island power grid for a large share of intermittent sources, which jeopardize the consistency of the power supply, aiming at 100% RES penetration. Other works deal with more technological aspects, proposing different power generation schemes, energy storage and managements solutions, as reviewed by Kuang et al. [
12].
Despite the amount of theoretical studies and several international initiatives [
13,
14], renewable energy penetration is still restricted. Currently, only twenty islands are in transition toward 100% renewable energy, with ten islands having already reached the goal [
15]. In view of the emission limits defined by the European Industrial Emissions Directive for islands prior to 31 December 2019, the use of RES represents a real opportunity to advance energy transition, especially when most European islands are expecting increases in electricity demand, with an average increase of 24% from 2009 to 2020 (note that the EU-27 increase is expected to be 14%) [
16]. The barriers to fossil-fuel free stand-alone grids lie in the difficulty of managing a highly fluctuating RES power supply, with the risk of worsening the performance of the local diesel generators (also called gen-sets), typically operated at part-load. Moreover, most of the proposed actions to tackle island energy related problems deal with RES in combination with energy storage [
15,
16,
17]. Nevertheless, the introduction of storage technologies on islands is demanding, mainly because of the significant cost and interoperability difficulties [
18,
19]. Notably, in contexts like the Greek Aegean Islands or Italian minor islands, RES and energy storage technologies introduction is additionally hindered [
15,
18,
19,
20], due to severe environmental restrictions (i.e., the European Directive 2009/147 limits wind generator installation as it represents a disturbing element for bird life and migratory fluxes). The result is a low RES share, which amounts to only 1048 kW photovoltaic (PV) power and 36.85 kW wind power in the 19 Italian small islands, in spite of an overall population of 42,568 inhabitants [
15].
In this context, a desalination plant represents a relevant additional energy use (generally 4–6 kWh/m3 for sea water reverse osmosis desalination) for the generally weak islands’ energy system. Aiming at security and reliability of the power supply, small islands’ green energy transition necessarily has to go through an intermediate phase, in which it is mandatory to sift new approaches to system integration among local gen-sets, renewable sources, storage and water desalination.
The relationship between energy and water has drawn great attention in recent years, aiming at better supporting planning and understanding of potentials, both of policies and technologies [
21]. Several studies have tried to couple energy and water problems of islands: (i) aiming at fully renewable energy desalination systems as reviewed in [
22,
23,
24], or (ii) studying energy/water integrated systems, in which surplus renewable energy with respect to the local load is used for desalination purposes [
5]. Suitability of desalination to overcome water shortage problems has already been demonstrated in several applications [
3,
25], allowing water supply costs to drop (i.e., to less than EUR 4/m
3 in the Aegean Archipelago with RES energy feeding [
3]). In [
26] a nexus framework for energy and water in islands is presented, outlining a roadmap from “full input of energy and water” through “semi-input of energy and water” to “zero input of energy and water”, which leads an island’s energy and water resources to become gradually independent from the mainland.
The integration of desalination systems usually follows two main approaches: Systems driven either by energy availability or by water production objectives.
Energy availability driven systems are autonomous fully dedicated renewable desalination systems. Aiming at fulfilling water needs, the desalination section should be over-sized in order to absorb most of the renewable power peaks, overcoming low intensity and intermittence of RES [
27]. It requires energy storage and a complex design, entailing siting and spacing issues [
28]. This case represents a one-way storage, in which the energy is stored as drinkable water [
5]. With the appropriate technologies. this approach may lead to two-way storage, in which the desalination plant would import the renewable electric energy needed for the operation but also would act as a storage device and export electricity to the grid acting like a virtual battery [
29]. Although on average, renewable energy helps to lower water production costs both in RES and diesel-RES configurations [
30], literature presents cases, such as [
31], in which a reverse osmosis (RO) desalination plant solely relying on renewable energy led to a higher water production cost than an equivalent hybrid system using RES and diesel engines (DEGS) (i.e., 2.4 USD/m
3 vs. 1.8 USD/m
3). Moreover, the most current information on desalination shows that use of renewable energy for desalination has increased from 2% in 1998 to 23% in 2016 [
32,
33], but only 1% of the global desalination capacity is based on energy from renewable sources [
34], demonstrating the strong need for further work in order to assess integration possibilities of desalination and renewable energy plants, and to promote their development.
In water goal driven systems, desalination constantly represents an additional load, usually connected to the local energy grid, fed by a mix of renewable energy, fossil fuel energy and energy storage technologies [
3,
5]. These systems have higher renewable energy penetration and lower water production costs with respect to the fully autonomous desalination plants [
28]. However, new dedicated and complex management systems are needed in order to improve the system stability [
35]. In fact, as RES power fluctuations produce modifications of the load curve shape, causing sudden load power drops, diesel generators constrain RES utilization, being unable to lower their output below the minimum load settings predetermined to ensure engine efficiency and preserve engine condition. Thus, during RES energy generation, diesel load set points may produce surplus generation, which must be absorbed via regulating devices such as dump loads or energy storage systems [
36]. Moreover, low-load operation results in poor fuel efficiency and increased operation and maintenance cost due to incomplete combustion of fuel during light loads [
37]. The result is a system of increased complexity, expense and waste. Regardless of approach, it is not currently feasible to totally eliminate diesel generation within a hybrid power system. Instead, optimal or minimal diesel usage is targeted.
Thus, energy availability driven system appears to be more sustainable but need higher investments in renewable and storage technologies to achieve an affordable water production; on the contrary, water goal driven systems are affordable but impact the system stability and fuel consumption, which is generally making them less environment friendly.
The novelty of the present study precisely relies on the desalination integration approach, with the aim of overcoming the over-sizing and affordability problems of the energy availability driven desalination systems and the stability and fuel consumption issues of the water goal driven desalination systems. Desalination here is mostly driven by the necessity to mitigate the RES fluctuation effects on the local generators’ power set-points, activating it when the gen-set performance is beneath a fixed threshold, while assuring the needed water supply.
The desalination integration environment considered in the study is an island energy system based on both renewable and fossil fuel energy. As already stated, energy storage requires too bulky and costly equipment [
38] and will not be taken into account.
This study was based on the development of three models of an island energy/water system, with increased complexity, and analyzed by means of the results of hourly transient simulations over a one-year period. A dedicated control logic was developed for the integrated water/energy system management. The desalination plant acquires a twofold role of deferrable energy load and energy storage, depending on the energy plant site working conditions. The study demonstrates the capability of a simple desalination plant integrated in the local power system and operated with a proper control logic, to mitigate the negative effects of the RES fluctuations on the diesel engine generator set (DEGS) while simultaneously producing the needed water supply.
2. Case Study Description
The case study is the island of Ponza, in the Pontinian Archipelago, Tyrrhenian Sea, with a surface area of 7.5 km
2. The number of inhabitants is remarkably dependent on its touristic vocation, and can range from 4000 in winter to about 55,000 in summer. This circumstance leads to severe issues energy and water system management. Electric energy is supplied by two diesel engine (DEGS) power station. Respectively, a main power station of 6.2 MW with four engines, and a peak shaving station with installed power 2.6 MW and two engines, typically operated in summer [
39]. The yearly energy demand was approximately 11 GWh/year for 2012 (
Table 1), with a maximum power demand peak of about 5 MW in the summer period. In winter, demand amounts to 1–2.5 MW [
39]. The climate is typical of that of Mediterranean areas, with mild winters and hot summers.
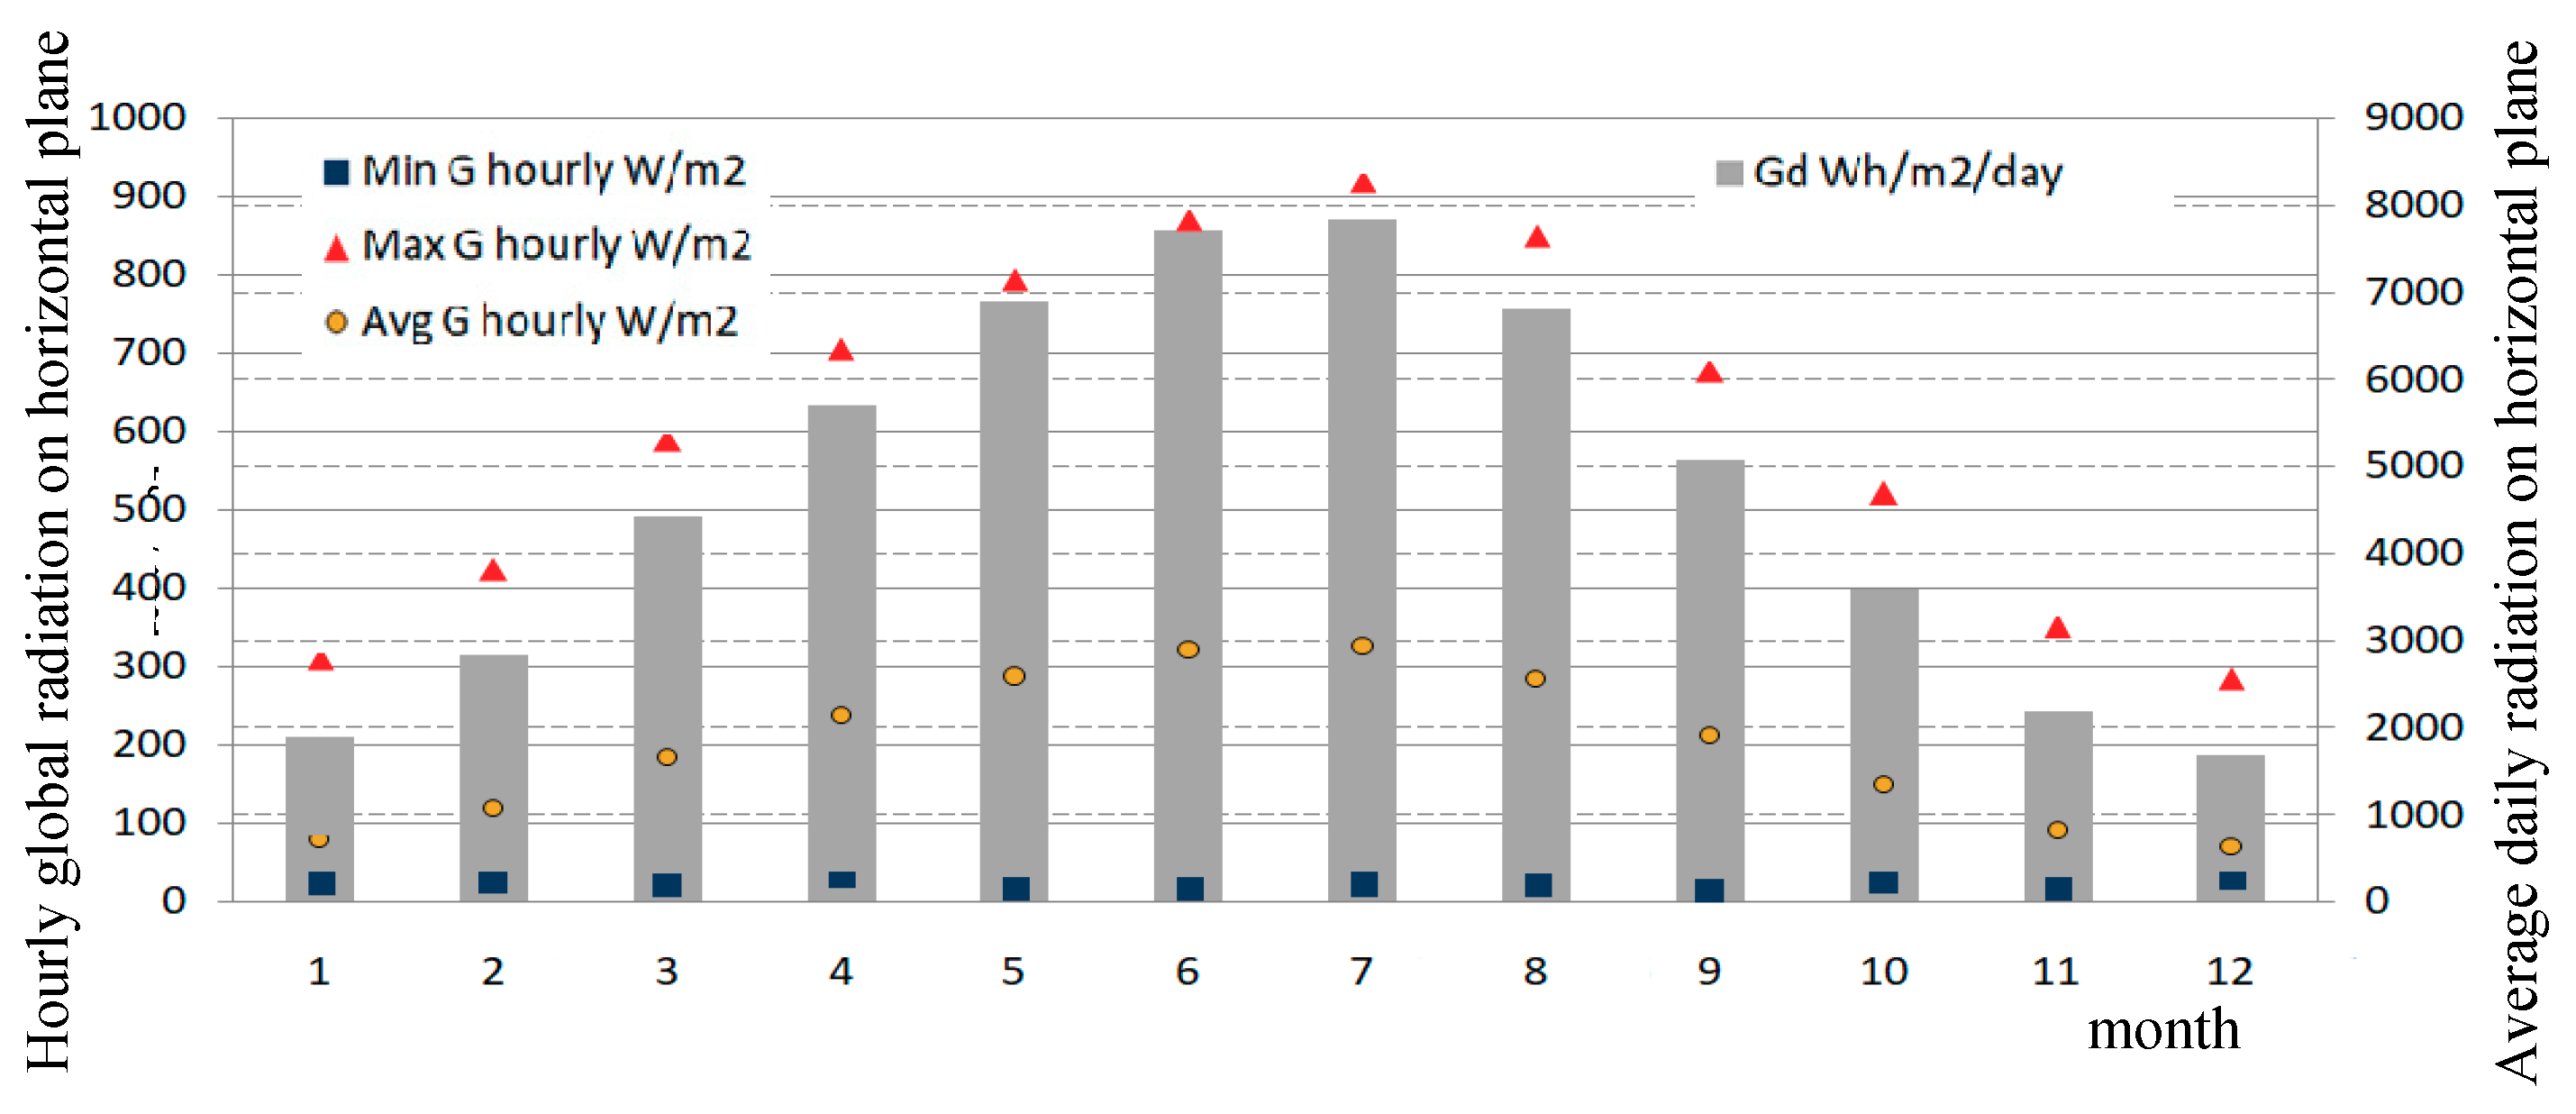
Figure 1 shows solar radiation data for Ponza Island, with the average radiation on horizontal plane varying from 1700 Wh/m
2/day in December, to 7800 Wh/m
2/day in July [
40]. Land availability and environmental regulations (i.e., European Council Directive 79/409 on wild bird migratory paths), then, are factors limiting the possibility of dedicated renewable technology installations. To this end, besides energy efficiency and photovoltaic technologies, previous studies assessed the wave-energy potential, both for on-shore [
41,
42] and near shore devices [
43].
From the water point of view, Ponza is devoid of springs or wells and completely depends on mainland supply. Water demand varies from a 10–40 m
3/h range in winter to peaks of 240 m
3/h in summer. The global amount of water supply was 400,000 m
3/year in 2015 (
Table 1), with a monthly distribution varying in the 17–75 × 10
3 m
3/month range [
44]. The water supply entails 237 water tank ship trips to bring water from the mainland, with associated emissions of approximately 2730 t
CO2eq/year. More details about the present water supply may be found in [
43]. The water authority for Ponza island is developing a project for a desalination plant, constituted by three reverse osmosis units of globally 165 kW and 1500 m
3/day fresh water production capacity. The desalination plant will be equipped with a dedicated power generation plant composed of two units of 275 kW diesel generators [
44].
Model Components Description and Data
The DEGS is modelled by six 1380 kW units of a CAT 3516 HD engine (
Table 2), with a global power of 8.28 MW. In accordance with US Department of Energy–National Renewable Energy Laboratory (NREL) [
45], it is not recommended for diesel gen-sets to be used under about 20–25% of their rated capacity, thus the minimum power ratio is set to 280 kW. The reference power is set to 600 kW. The engine efficiency is calculated as the ratio between the output power and the fuel power, which in turn depends on the fuel characteristics (density and low heating value) and the fuel consumption curve of the specific engine with respect to the power set point.
On the RES generation side, in order to perform a realistic simulation, taking into account environmental restrictions, land availability and economy, the integration of PV plants on private house rooftops has been considered [
28]. By means of a geographic information system, an availability of 43,590 m
2 of plane rooftops was estimated, without obstructions that may cause shadows, excluding the historical center and the harbor of Ponza town. In the hypothesis of a 25% share of PV penetration with respect to the surface availability, the resulting global PV power amounts to 1.8 MW
p. The selected PV panel has 260 W peak power with a 15.8% efficiency in standard conditions. The working conditions hypotheses are: 20° tilt in order to limit visual impacts and 0° azimuth. As customary for rooftop PV plants, energy storage devices are not taken into account in the present work.
For the desalination plant, the RO desalination technology has been selected as the state-of-the-art for compact water production units [
22]. The modelled system is aimed at completely satisfying the water demand, for which an hourly load curve has been reconstructed leading to a yearly water supply of 420 × 10
3 m
3/year. The desalination system size choice has been made trying to merge two essential but opposite aspects: A reduced number of units and a size able to be properly adapted to different values of power availability. The modelled plant will be composed by of eight 300 m
3/day capacity units, a permeate flow of 12.5 m
3/h/unit and 40% water recovery. The power consumption of the RO units, equipped with an energy recovery device, and considering the power request for sea-water draw, fresh water raise and brine rejection, amounts to about 360 kW, with a global specific energy consumption of 3.6 kWh/m
3. The local water storage has a cumulative capacity of 3000 m
3. The control logic of the water production is aimed at maintaining a 600 m
3 level in the storage; i.e., two days autonomy in the winter period.
In order to calculate the equivalent CO
2 emissions for the proposed scenarios, the factor used is 3.282 kg
CO2eq/kg
Diesel fuel relative to a generic diesel generator for industry purposes [
46].
3. Methodology
This study is based on the comparison of three scenarios with increasing complexity, describing the energy system in cooperation with the water desalination system.
Figure 2 shows the model flowchart for the three proposed scenarios distinguished by different colors:
The Base Case (BC) (black section in
Figure 2) models the present situation of the island and comprises the load, a power control and the gen-set. Energy and water supplies completely rely on shipping from the mainland. The power control is based on the power demand, defining the diesel engines’ set points.
The Renewable energy Configuration (ReC) (green section in
Figure 2) provides hints about the effect of the introduction of renewable energy into the small energy grid of the island. This scenario entails the addition of meteorological data and a conversion technology for renewable energy production. The power control is based on the comparison of the power demand with the renewable power availability, defining the diesel engines’ set points. Water supply completely depends on the mainland.
Desalination/Renewable energy Configuration (DeReC) (blue section in
Figure 2), in which a desalination plant is added to the renewable integrated configuration, entailing the addition of the water load, the desalination plant, the water storage tanks and a water control. The power control also takes into account the power request for the water section and the stored water level.
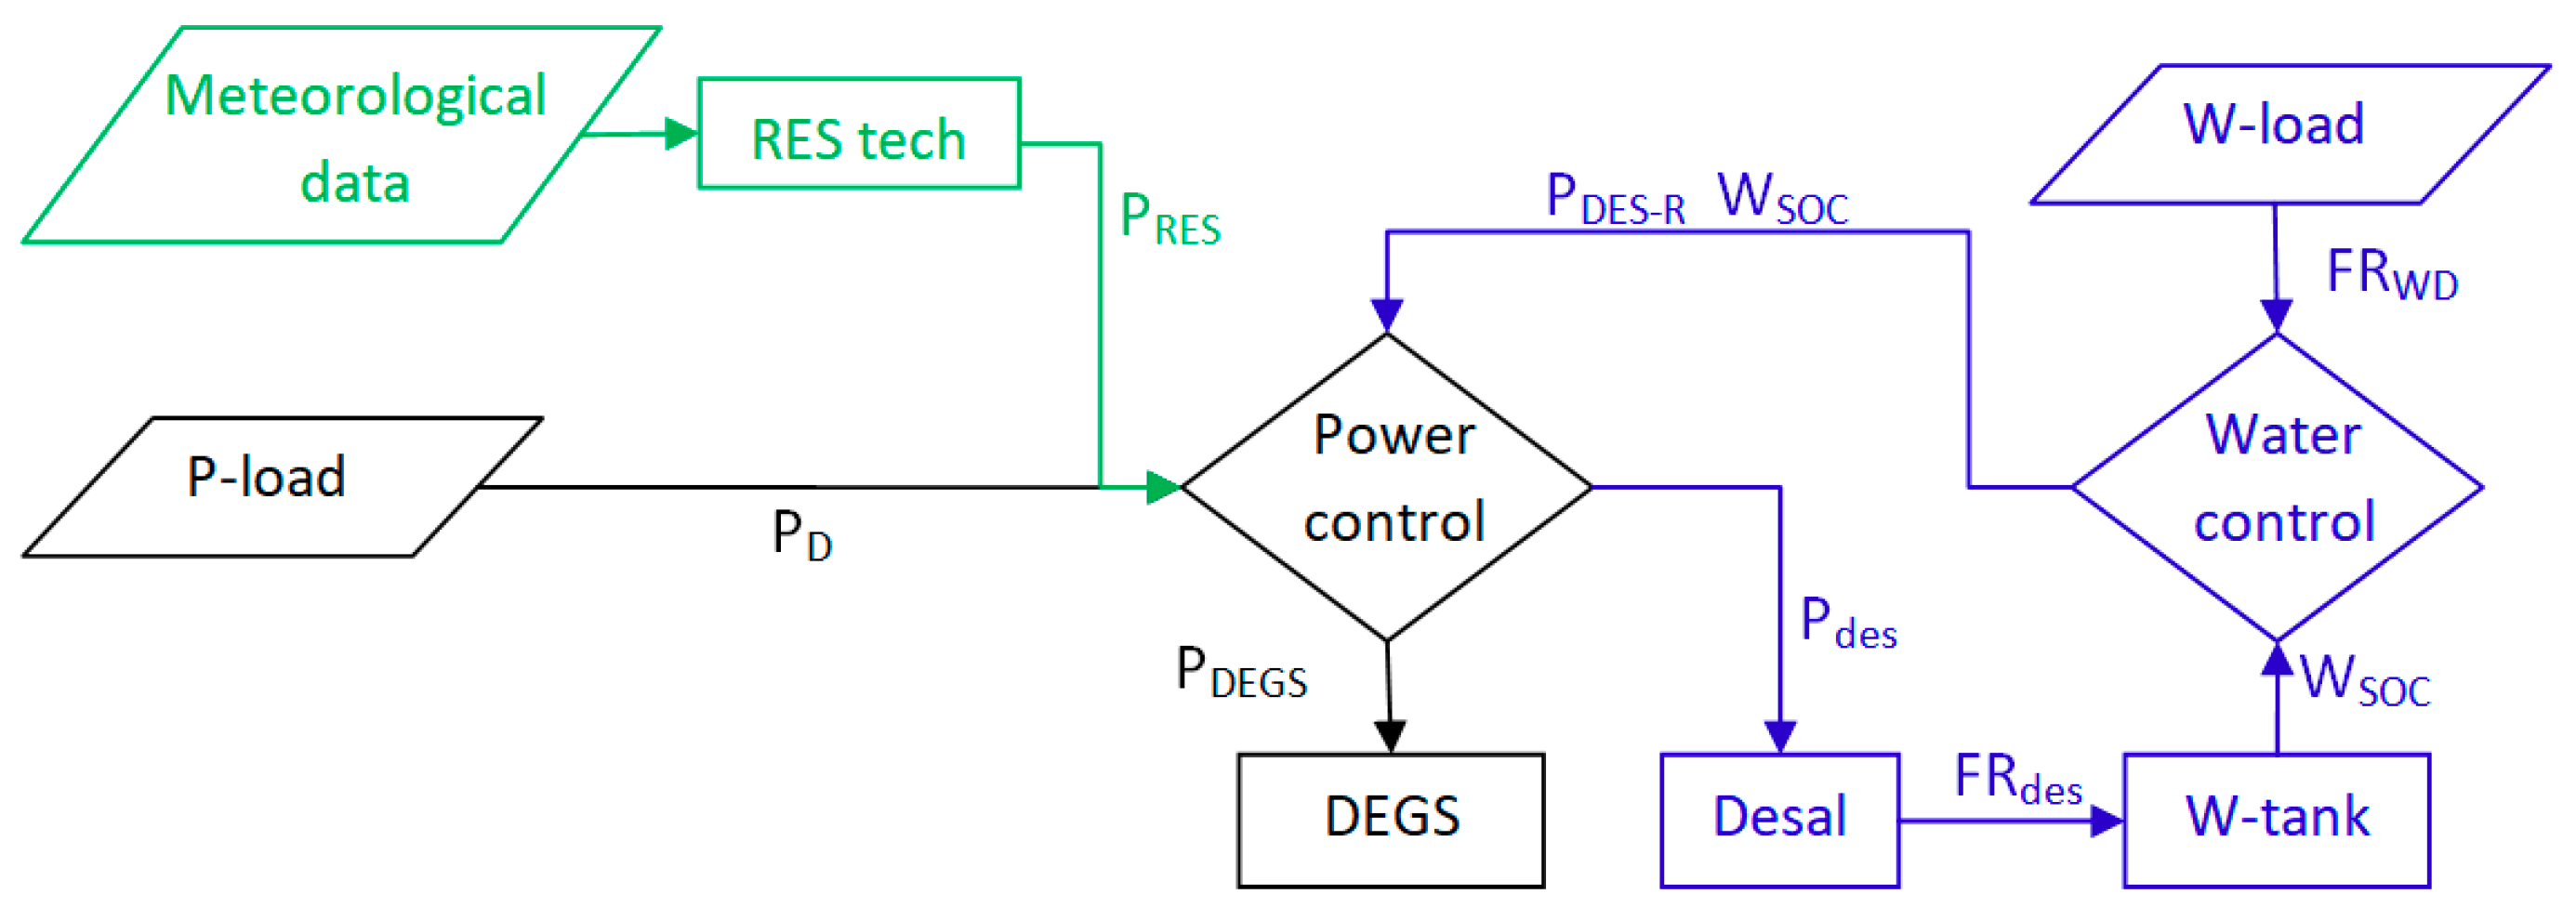
The proposed system models work on a power basis. The developed power control receives information on power demand from the local users (PD), available power from renewable source (PRES), and requested power for the desalination plant (PDES-R), aiming at the complete replenishment of the water storage. The water control receives information about water load (FRWD) and tanks’ state of charge (WSOC), determining the amount of water lacking in storage and the related power request (PDES-R). Hence, the power control compares the power information and defines the effective power supply to the desalination plant (PDES) and the DEGS power need (PDEGS).
The models proposed in this work were developed and dynamically simulated in TRNSYS (16, Solar Energy Laboratory, University of Wisconsin, Madison, WI, USA) [
47]. TRNSYS is a diffused transient analysis software, already adopted in previous works on small islands [
6,
41,
42,
48,
49]. For this work, three components were developed by the authors: The desalination unit and the energy/water controls [
50]. The simulations were hourly-based on a year time horizon.
Developed Control Logic
A novel energy/water management algorithm was developed to control the different energy and water flows among the system components. The algorithm defines five operation modes to manage the diesel generators and the desalination set-points with respect to power load of the island, renewable energy availability and water reserve.
First, the control logic guarantees energy and water supply. The aim is production of fresh water, exclusively obtained by the generator set performance improvement, in conjunction with the negative effects of the RES power contribution. In fact, RES contribution will decrease the power request to the DEGS, lowering its performance. The activation of any additional engine only for desalination purposes is limited to the cases in which stored water drops below the fixed minimum level; in all other cases the active engines are exclusively those necessary to cover the island power request. The improved DEGS performance is obtained during desalination operations by increasing the engines’ duty power, thus their efficiency, by deciding the final power set point (PDEGS) also taking into account a power threshold.
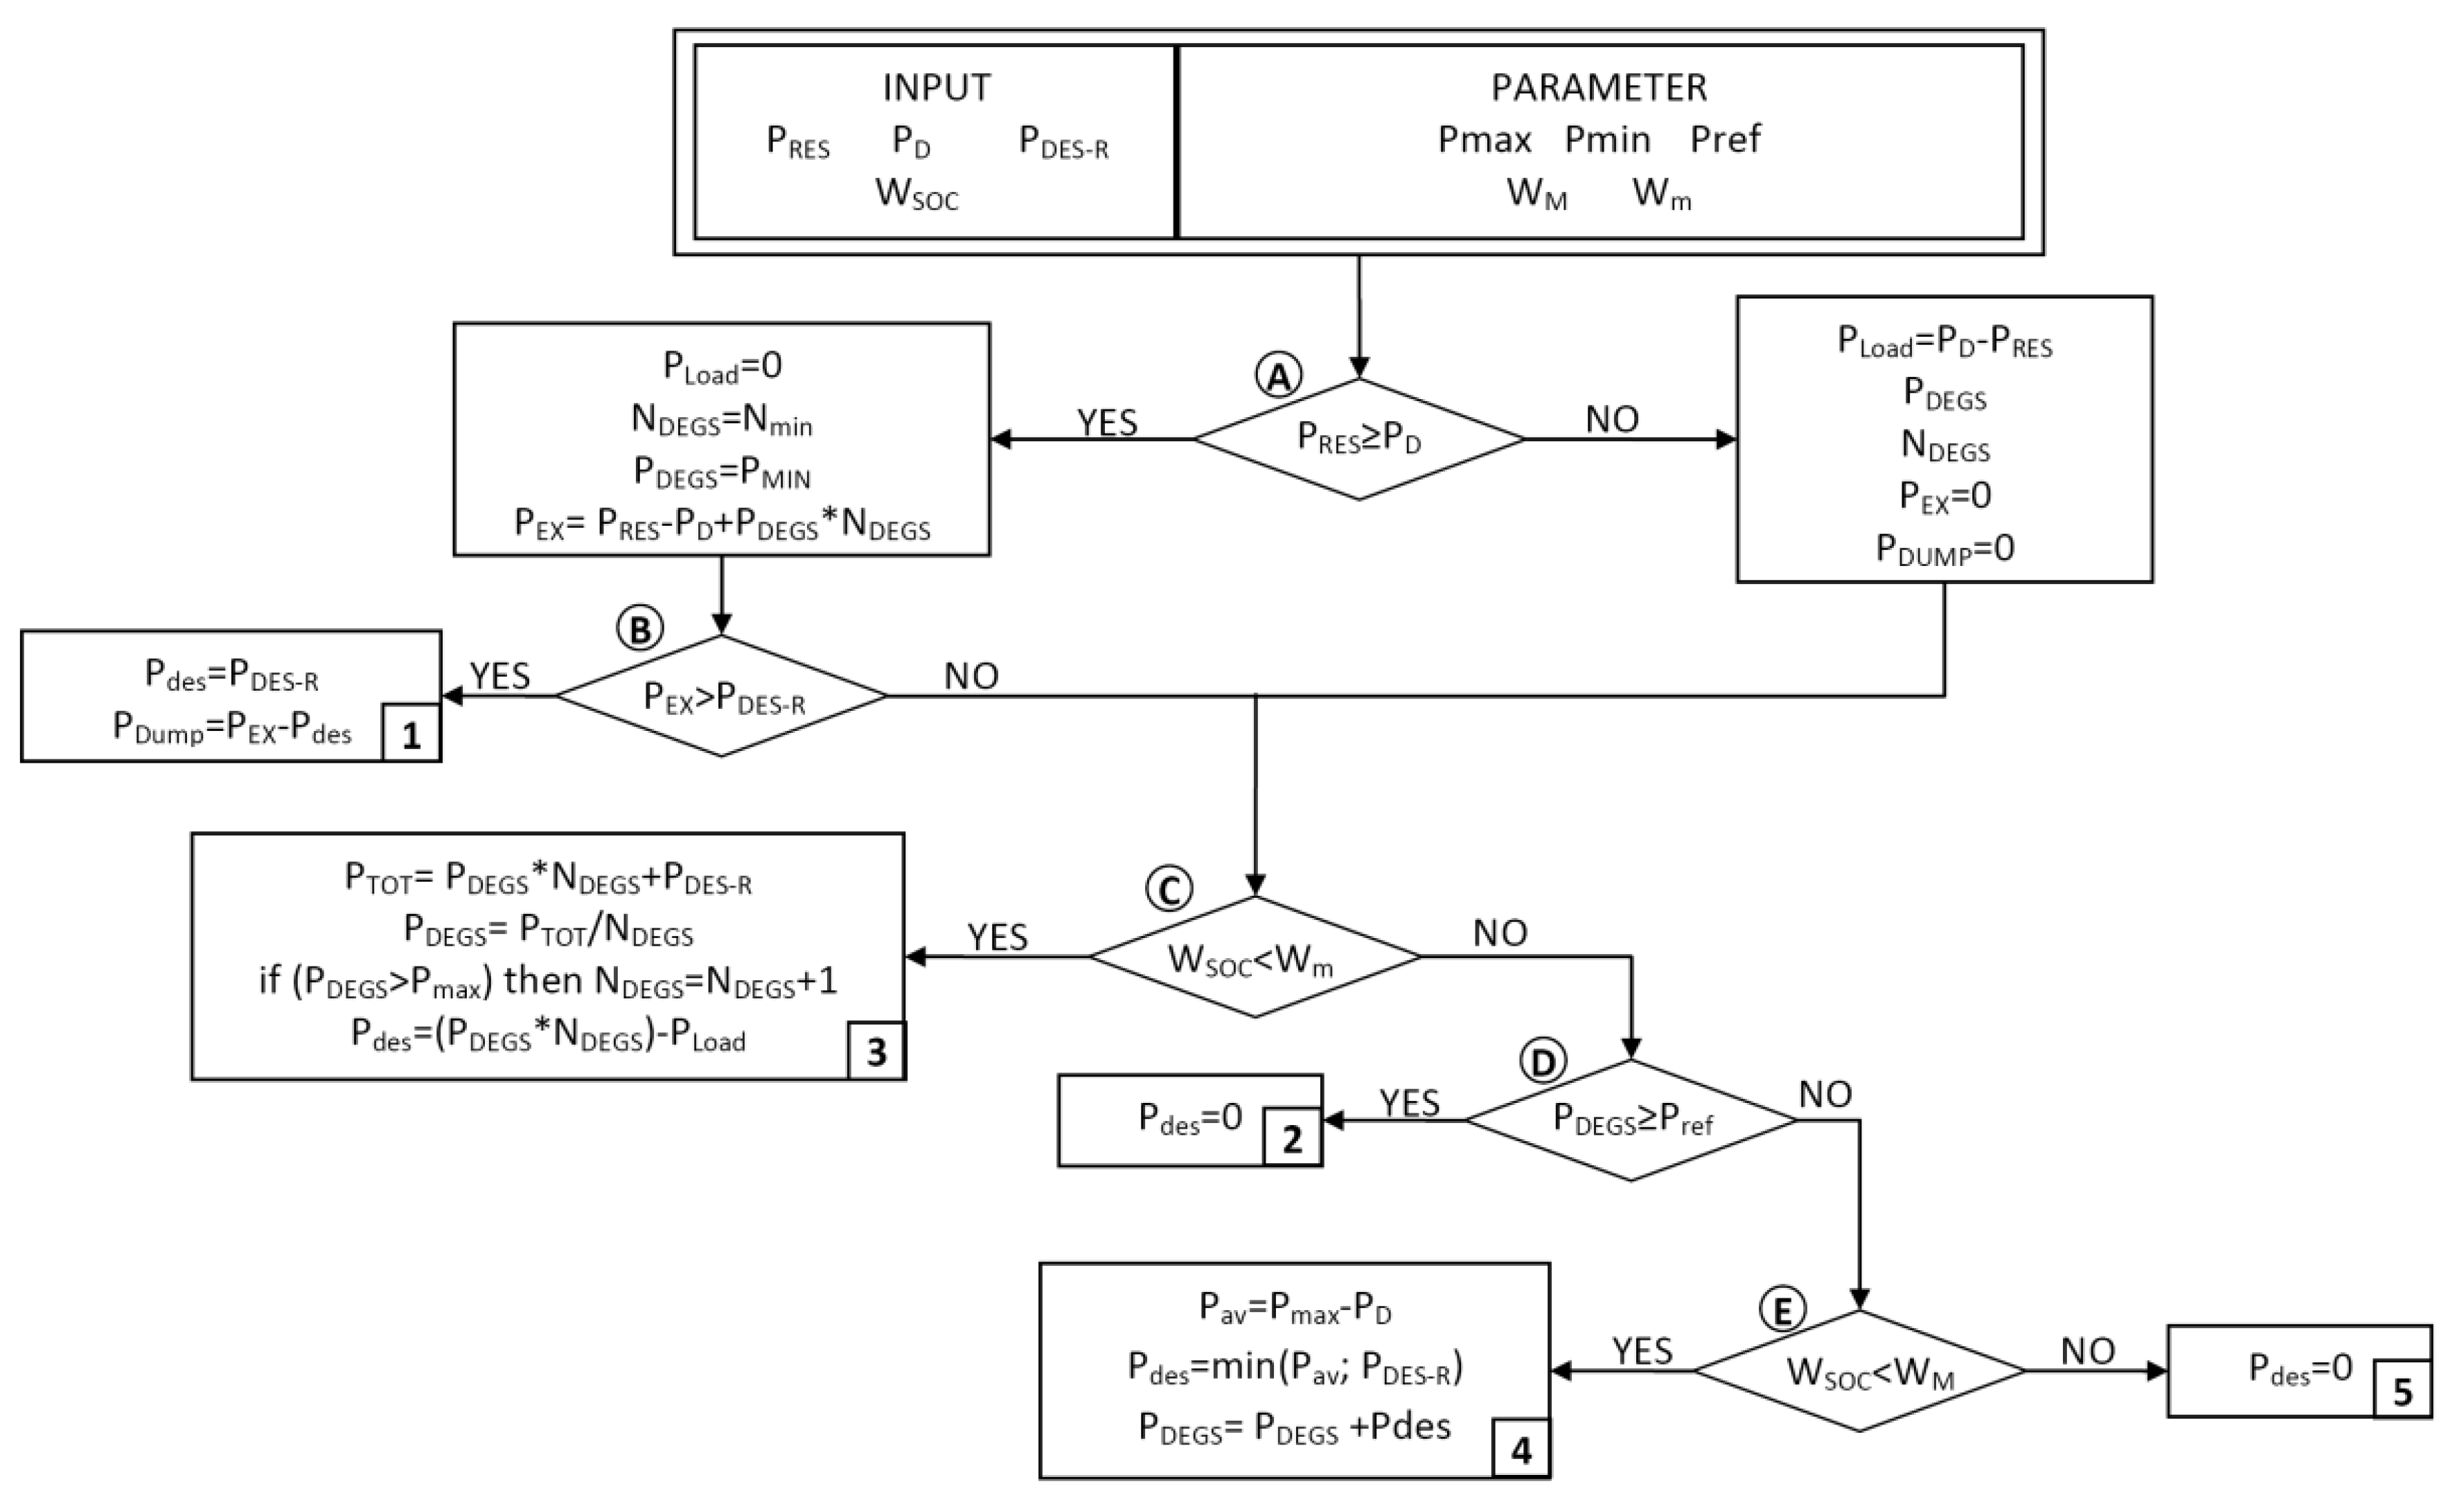
The scheme for the control module is illustrated in
Figure 3. The decision process is driven by steps indicated by letters in circles. The five modes’ ends are identified by numbered boxes. The set point is given by the comparison of renewable power availability (P
RES), reference power set (P
REF), end user power demand (P
D) and clean water production schedule given by the water storage state of charge (W
SOC) that is intended to be maintained between a minimum (W
m) and a maximum (W
M) value.
The first step checks for renewable power surplus. If renewable power (P
RES) exceeds the power demand (P
D), the DEGS is operated at minimum duty; else, an initial power set point and the engine’s number will be determined by means of the standard TRNSYS generator set control [
47], accounting for engine min-max power ratio. Hence, in case of renewable power higher than power demand, the renewable power excess added with the power from DEGS on minimum duty, resulting in P
EX, will be directly used for desalination purposes if P
EX is higher than the maximum power request for desalination (P
DES-R) (mode 1).
If PEX is less than PDES-R or PRES is less than PD, a new generator set point is determined having two options:
Power (and eventually number) of on-duty engines changes to meet the desalination plant power request, when the water tank state of charge is below Wm (mode 3); and,
On-duty engine power increases when state of charge is between Wm and WM (mode 4).
If DEGS already works at a satisfactory duty point higher than PREF, there will be no changes in the DEGS set points and no desalination (mode 2).
Desalination is also cut-out when water tanks are full (mode 5).
It is worth noting how the WM value affects the control behavior: If WM = 0, then engines are never switched on only for water desalination purposes; if WM is between 0 and 1, then in some cases engines may be switched on only for desalination purposes; and, if WM =1 then engines are always allowed to be switched on for desalination purposes.
Regarding the ReC scenario, due to the absence of desalination, the control logic operation is limited to modes 1, 2 and 5. Thus no gen-set power adjustments or increase in engine numbers will take place. In particular, in case of RES power exceeding the load, the renewable power excess added with the power from DEGS on minimum duty will be completely dumped (mode 1). In case of power load higher than RES availability, the direction on mode 2 or mode 5 only indicates whether the engines are working above the reference power or not.
4. Results and Discussion
The global performance of the simulated scenario is shown in
Table 3. In view of the island’s user load (i.e., 10,663.68 MWh/year), the RES availability considered in this work amounts to 3147 MWh/year, which represents a potential load coverage of 30%.
Due to demand/RES hourly mismatch, a RES surplus of 275.66 MWh/year is found in the ReC, indicating the effective RES load coverage amounts to 25%. Moreover, based on the hypothesis of having one engine always on duty, the global dumped energy rises to 536.61 MWh/year. Nevertheless, the RES introduction allows a reduction of the overall engines’ duty time from 12,167 to 11,097 h/year, with a 24% reduction of the global engines’ energy output and a 22% fuel consumption decrease. The effect is a 22% reduction of the equivalent carbon dioxide emissions. Besides these positive effects, a 16.45% decrease of the average engine’s power is computed, affecting the efficiency that passes from 0.3874 to 0.3691. The control logic use results are presented in
Table 4 and
Figure 4. As the ReC scenario is in absence of the desalination system, the engines’ power modulation is never engaged; consequently, there is no use of modes 3 and 4. Most of the time (i.e., 6160 h/year), the DEGS works with engine power higher than the reference power (mode 2). This behavior is distributed throughout the simulated year period. For 1667 h/year, the engines work at a power set point lower than the reference power (mode 5), but the absence of desalination does not allow power to rise to the power set point. This mode of behavior is also distributed throughout the year, but, as expected, it shows some holes in April and August when the higher power request better dampens the RES fluctuations. Finally, during 933 h/year, renewable energy availability exceeds the user load, resulting in the DEGS working with only one active engine at its minimum power, and the excess RES and DEGS power entirely dumped (mode 1). In this case, the mode distribution over the year clearly shows numerous holes, with a particular long amplitude during July and August, when the tourist-related power load far exceeds the RES contribution.
When analyzing the desalination/renewable configuration, the surplus power is used to feed the desalination plant. In particular, 276 MWh/year of the RES energy remains available for desalination after load coverage. Of such energy, 208 MWh/year are used to match the desalination side power request, allowing 58 × 103 m3/year water production (i.e., 13.8% of the entire water load). In the DeReC scenario, the dumped energy, distributed over 791 h, is reduced with respect to the ReC scenario and amounts to about 230 MWh/year. Ninety-eight percent of the power dump is due to an excess of power availability with respect to the desalination side power request. The remaining 2% of the dumped energy is attributable to the water storage fullness. As the number of engines is allowed to increase in case of water shortage, the number of overall engines’ duty time is slightly higher than in the ReC. A 10.98% increase of the mean engines’ power is registered with respect to ReC, even though it represents only 97.72% of the mean engines’ power in the BC, negatively affecting fuel consumption and engine efficiency. Carbon dioxide emissions are approximately 12% higher than in ReC but 12% less than in BC.
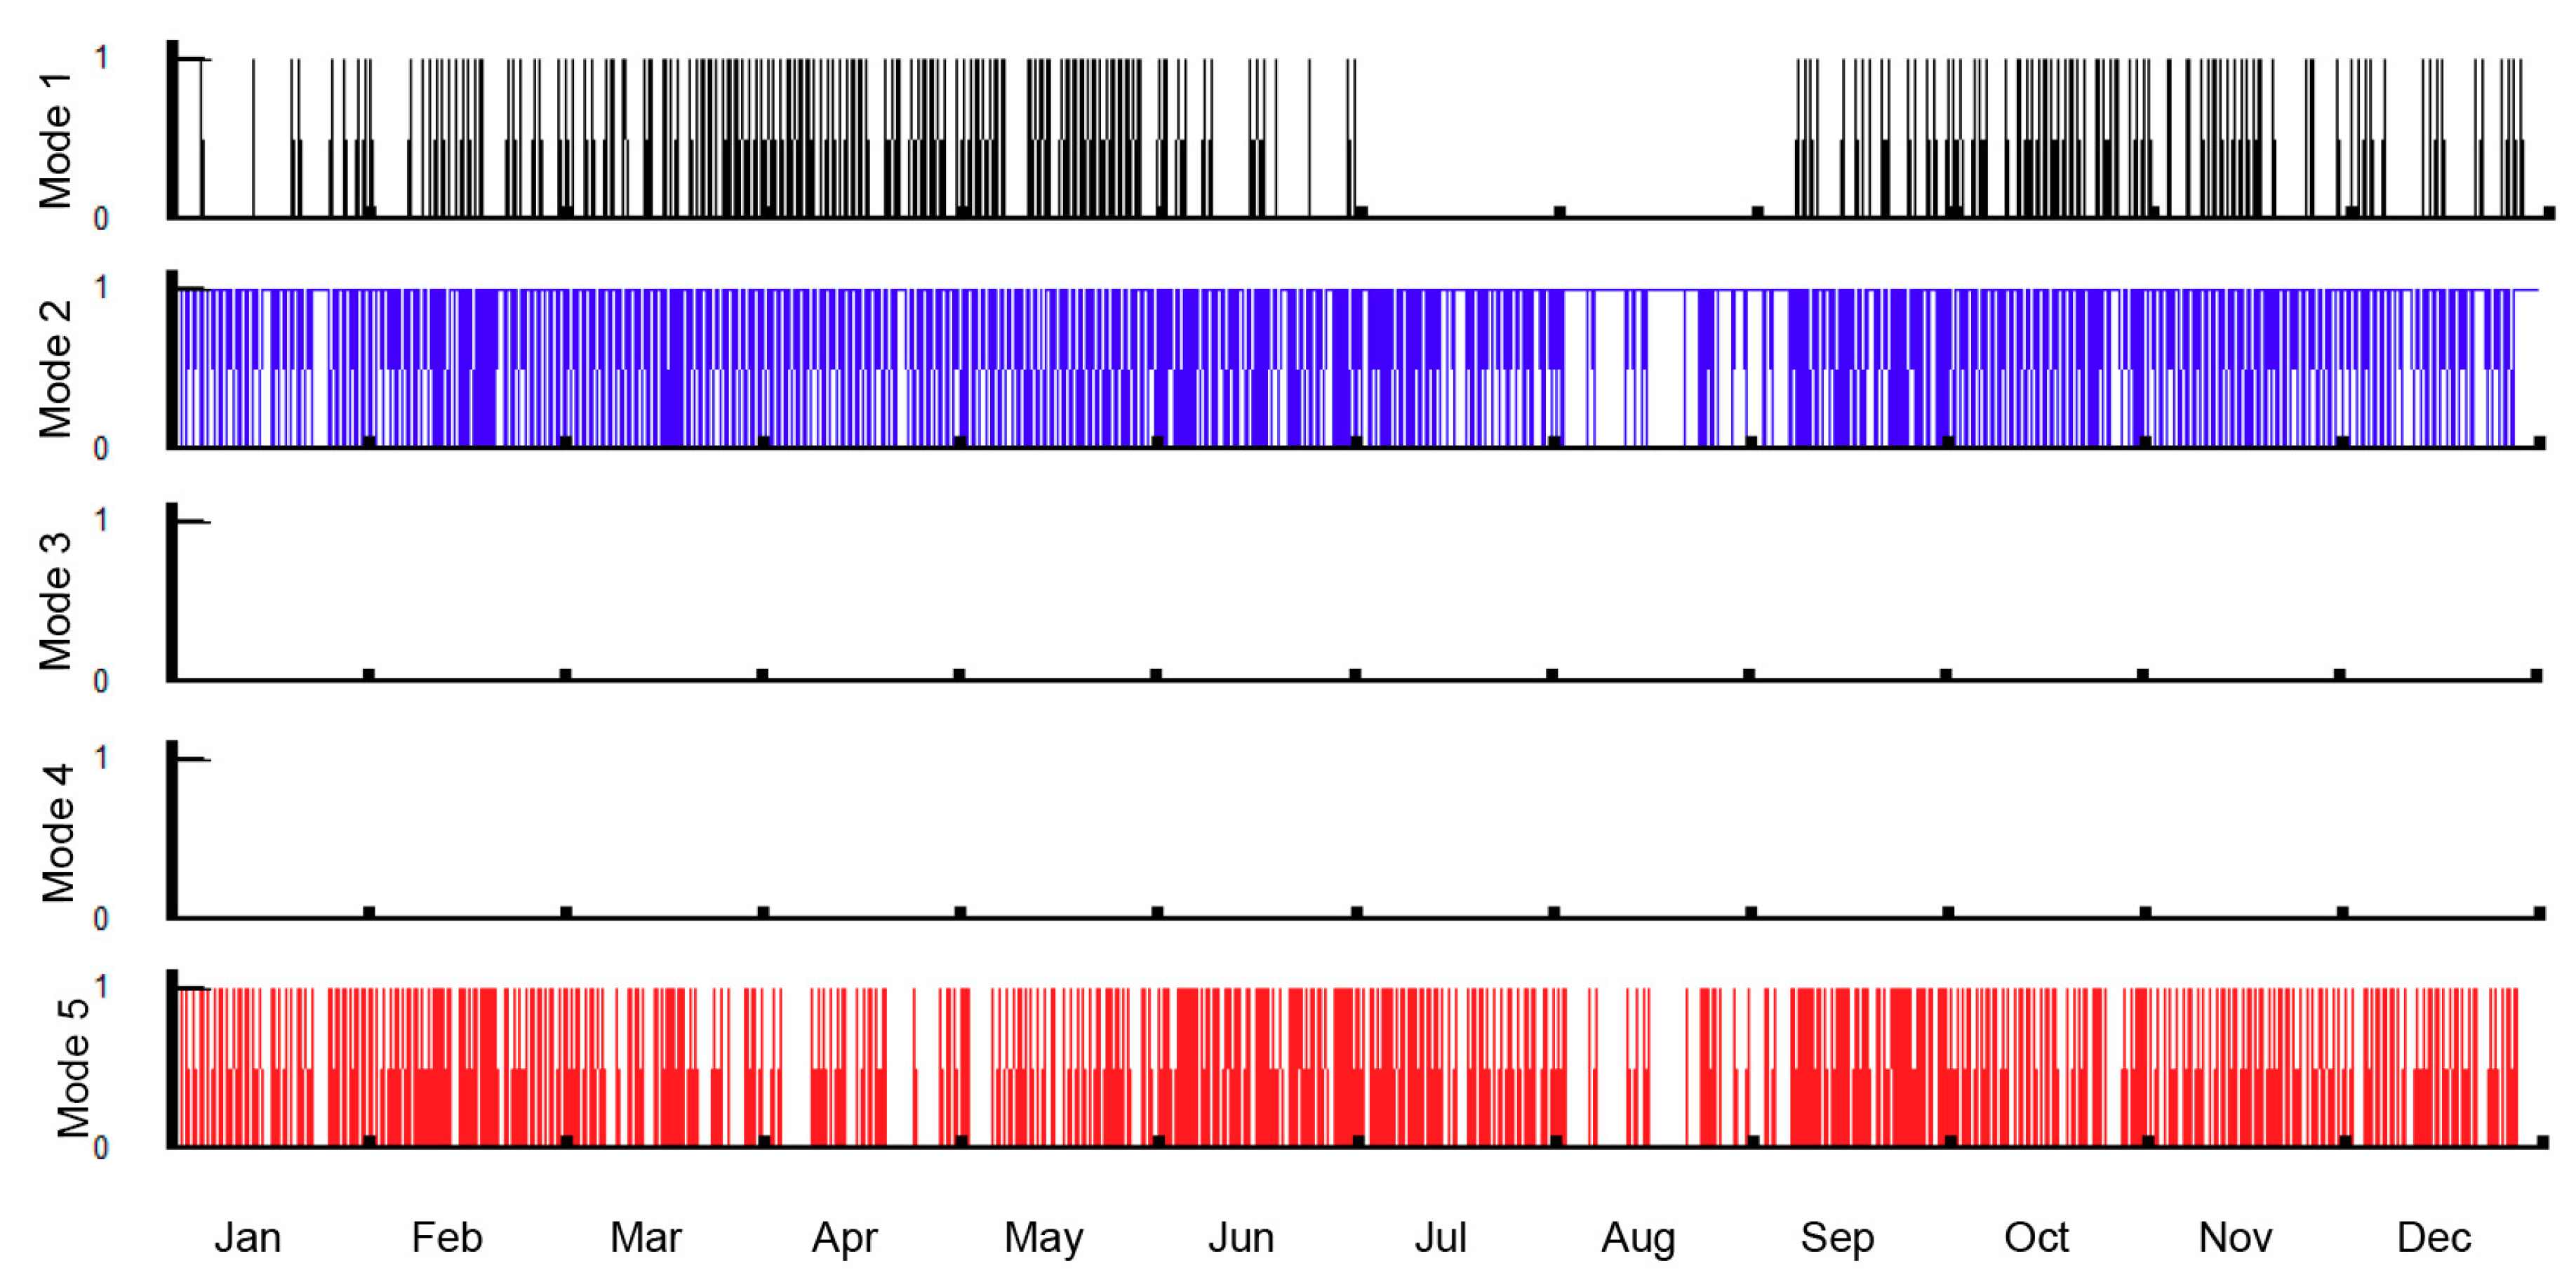
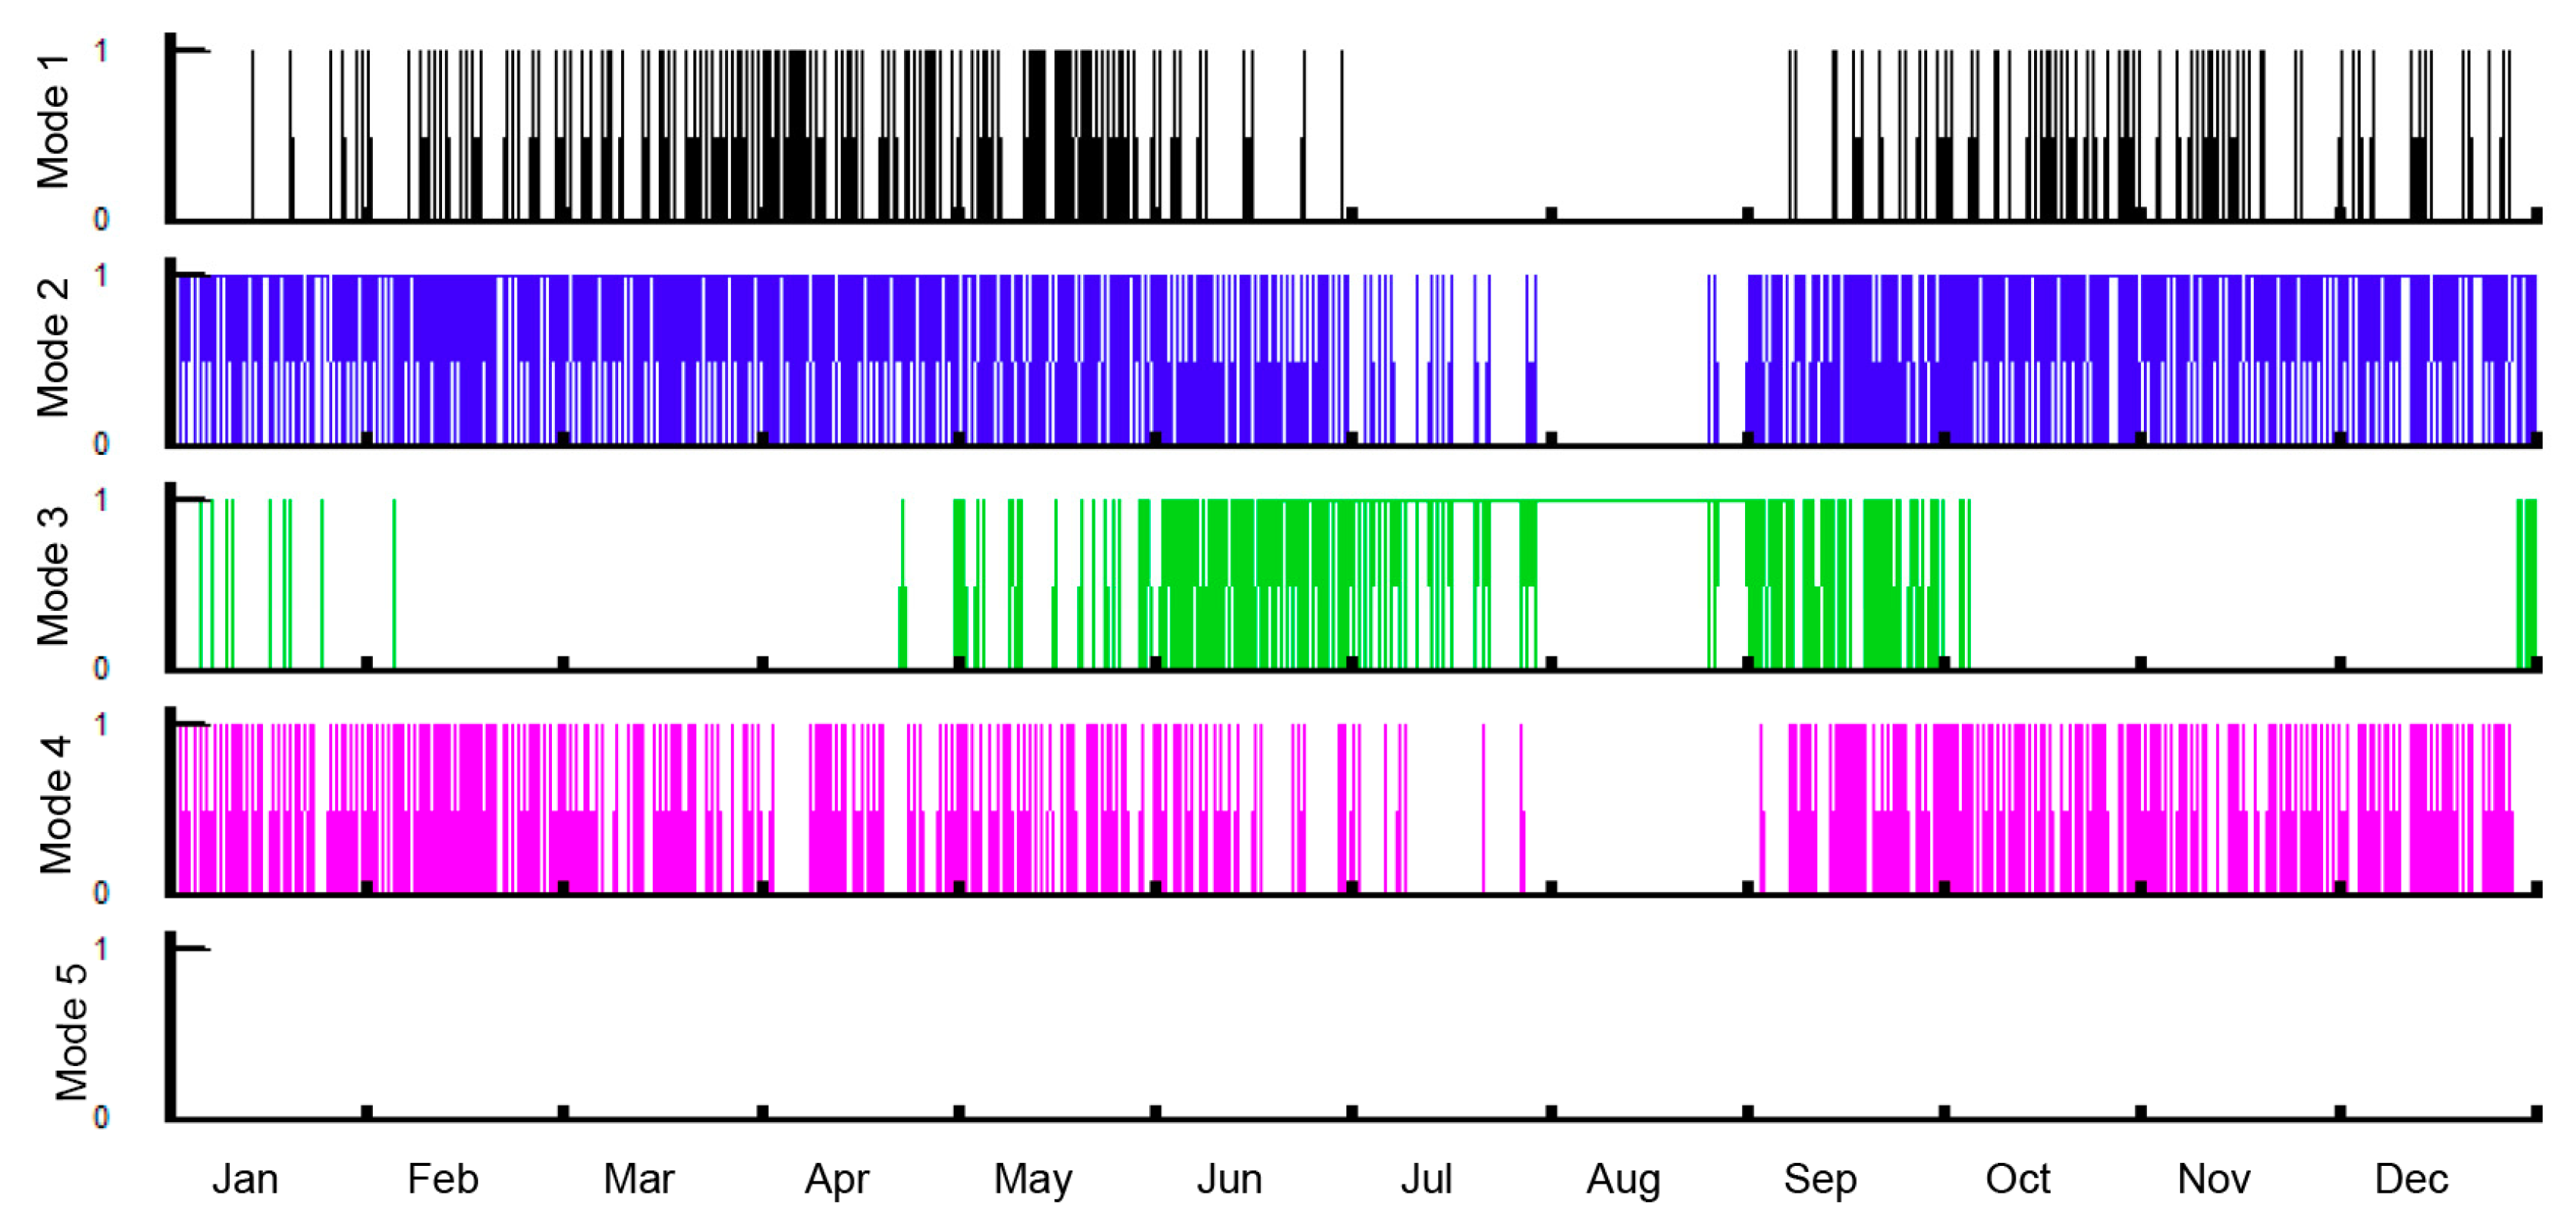
Table 4 and
Figure 5 show the results for the operating modes deriving from the control logic application. In the DeReC scenario, the water storage fullness is never concurrent with the possibility to increase the engines’ power set point, hence mode 5 is never engaged. It is evident that mode 2 remains the most frequent situation distributed over the year, with an occurrence of 4453 h and a gap during August. For 2229 h, the system registers a water level less than the fixed minimum (mode 3), conducing to the increase of the active engines’ power independently from the engines’ power set point related to the island power load coverage. Moreover, for 322 h an additional engine is switched on in order to re-establish, at least, the fixed minimum water store. In
Figure 5 it can be noticed that mode 3 is the only operation mode active during August, which is the most critical period of the year for water supply in the island. An increase of the initial engines’ power set points for desalination purposes is also registered for 1287 h in mode 4, as the engines’ power is less than the reference power.
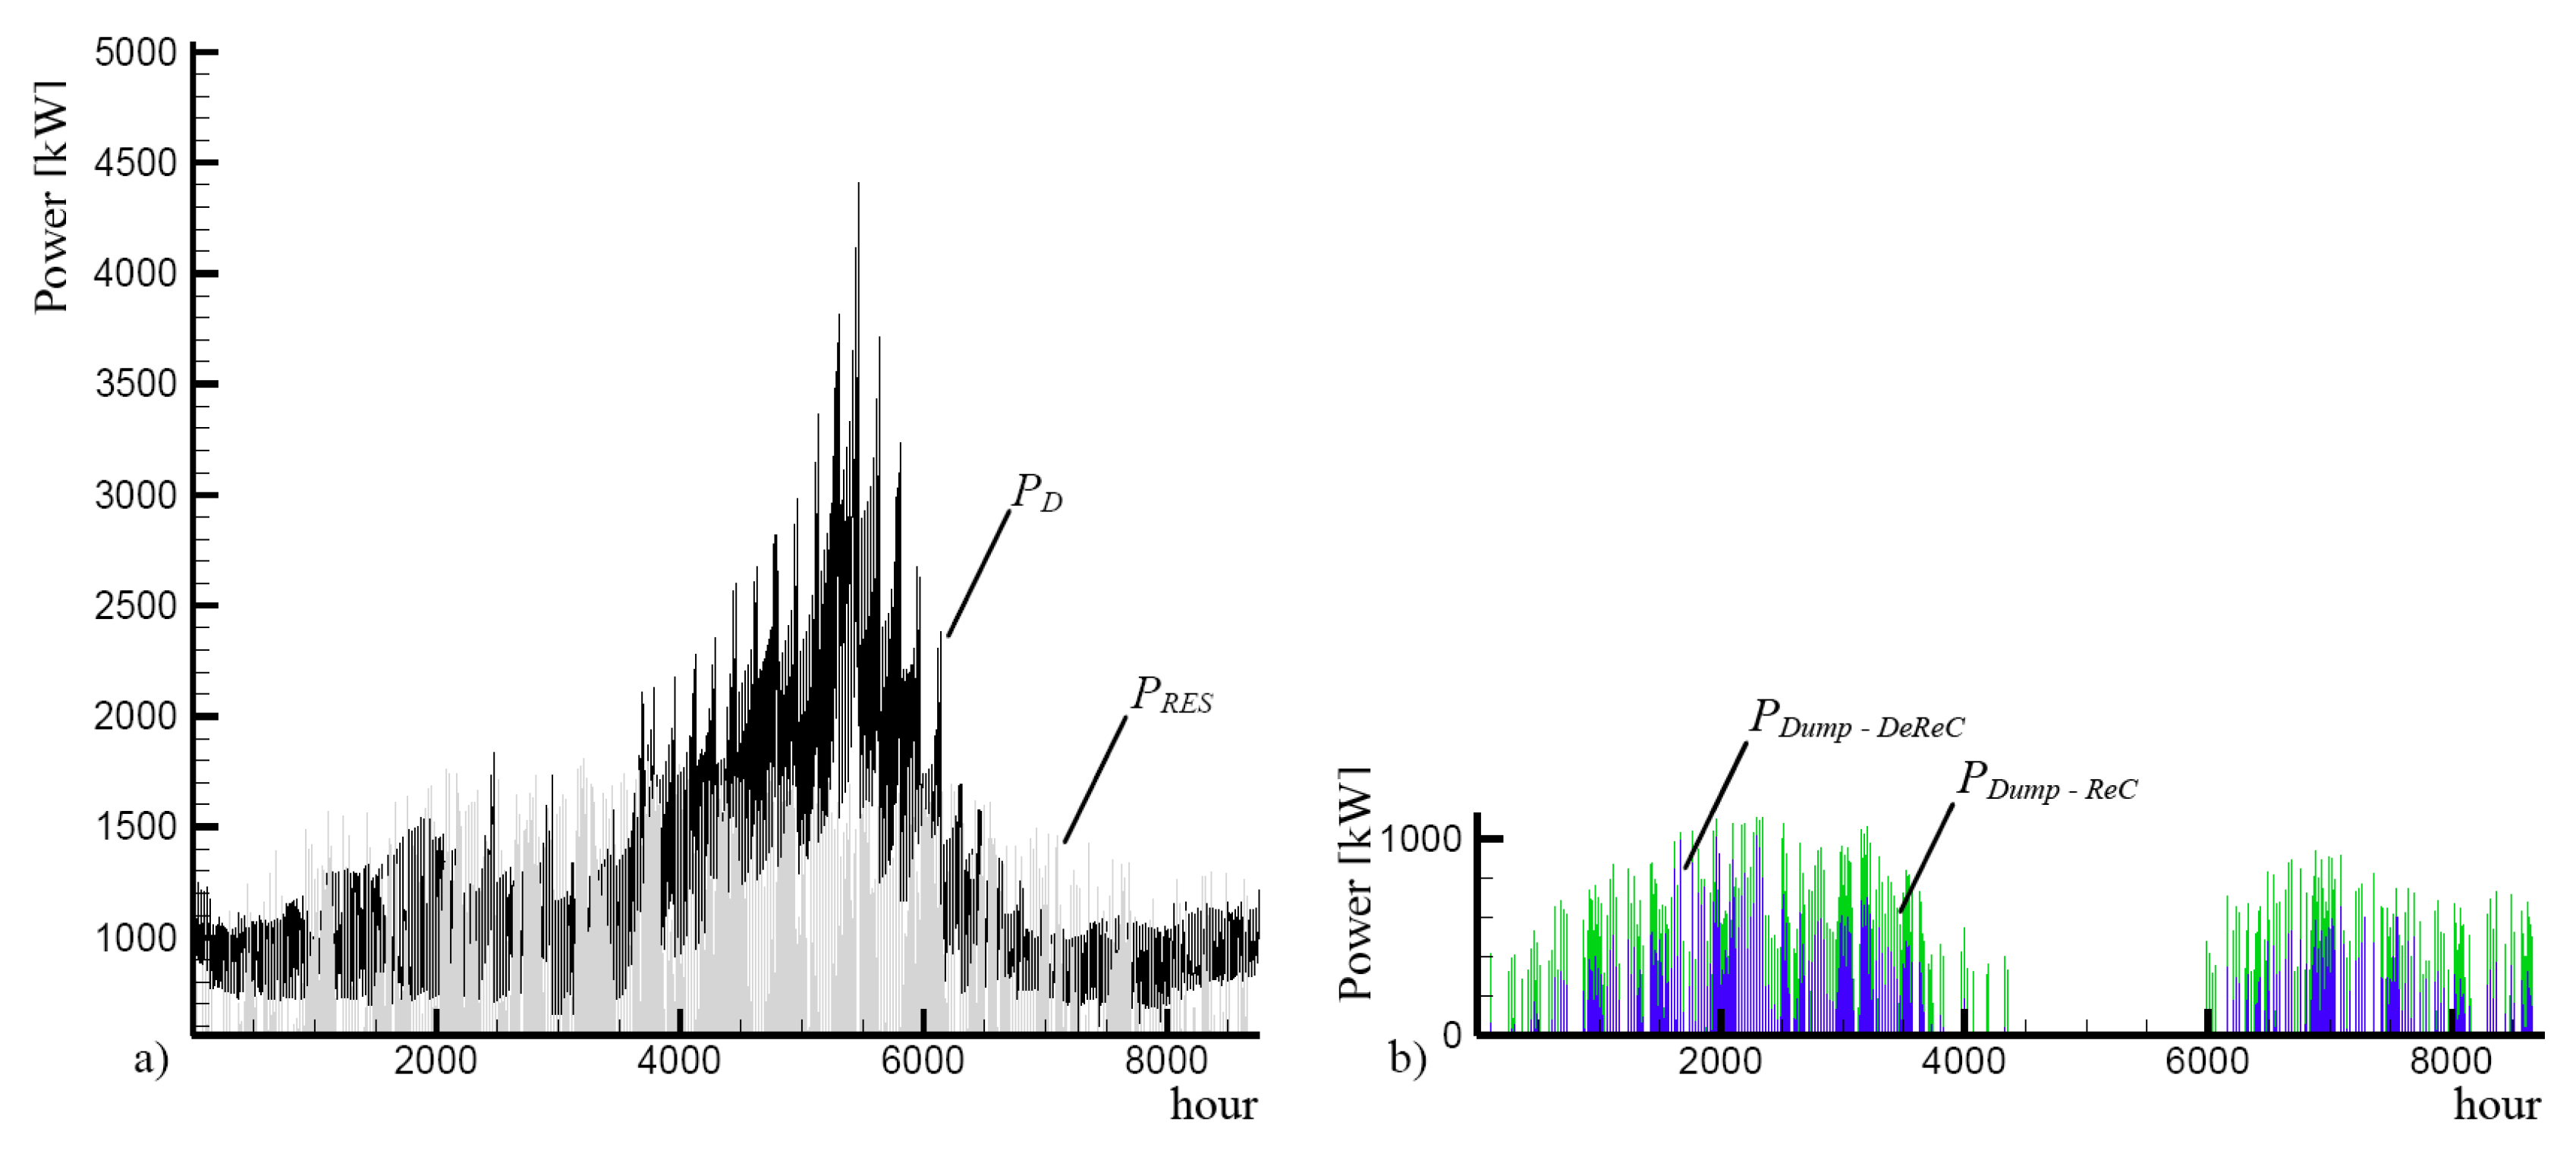
As expected, the PV-based RES power availability, distributed throughout the year, makes a higher contribution during the summer period, matching with the higher user power demand (
Figure 6a). In the summer period, the RES availability never exceeds the load, while during the rest of the year RES surplus reaches peaks of about 800 kW, with yearly RES energy surplus of about 276 MWh/year distributed over 933 h. Nevertheless, due to the hypothesis of a constantly active engine, in the ReC the dumped energy increases to a value of 537 MWh/year, while the energy absorption of the desalination side allows a decrease of the dumped energy to the value of 229 MWh/year in the DeReC.
Figure 6b shows the hourly dumped power curves for the ReC and DeReC. One can observe the similar distribution of the two curves with lower peaks for the DeReC, and the absence of power dumps from 1 July to 5 September.
Referring to the DeReC, energy supplied to the desalination plant globally amounts to about 1.5 GWh, with values exceeding 240 MWh in July and August (entailing 33% of the whole supply), and values below 100 MWh from January to April and from October to December (
Table 5). The desalination plant works 4283 h/year. The overall desalination plant duty time amounts to 32,930 h/year.
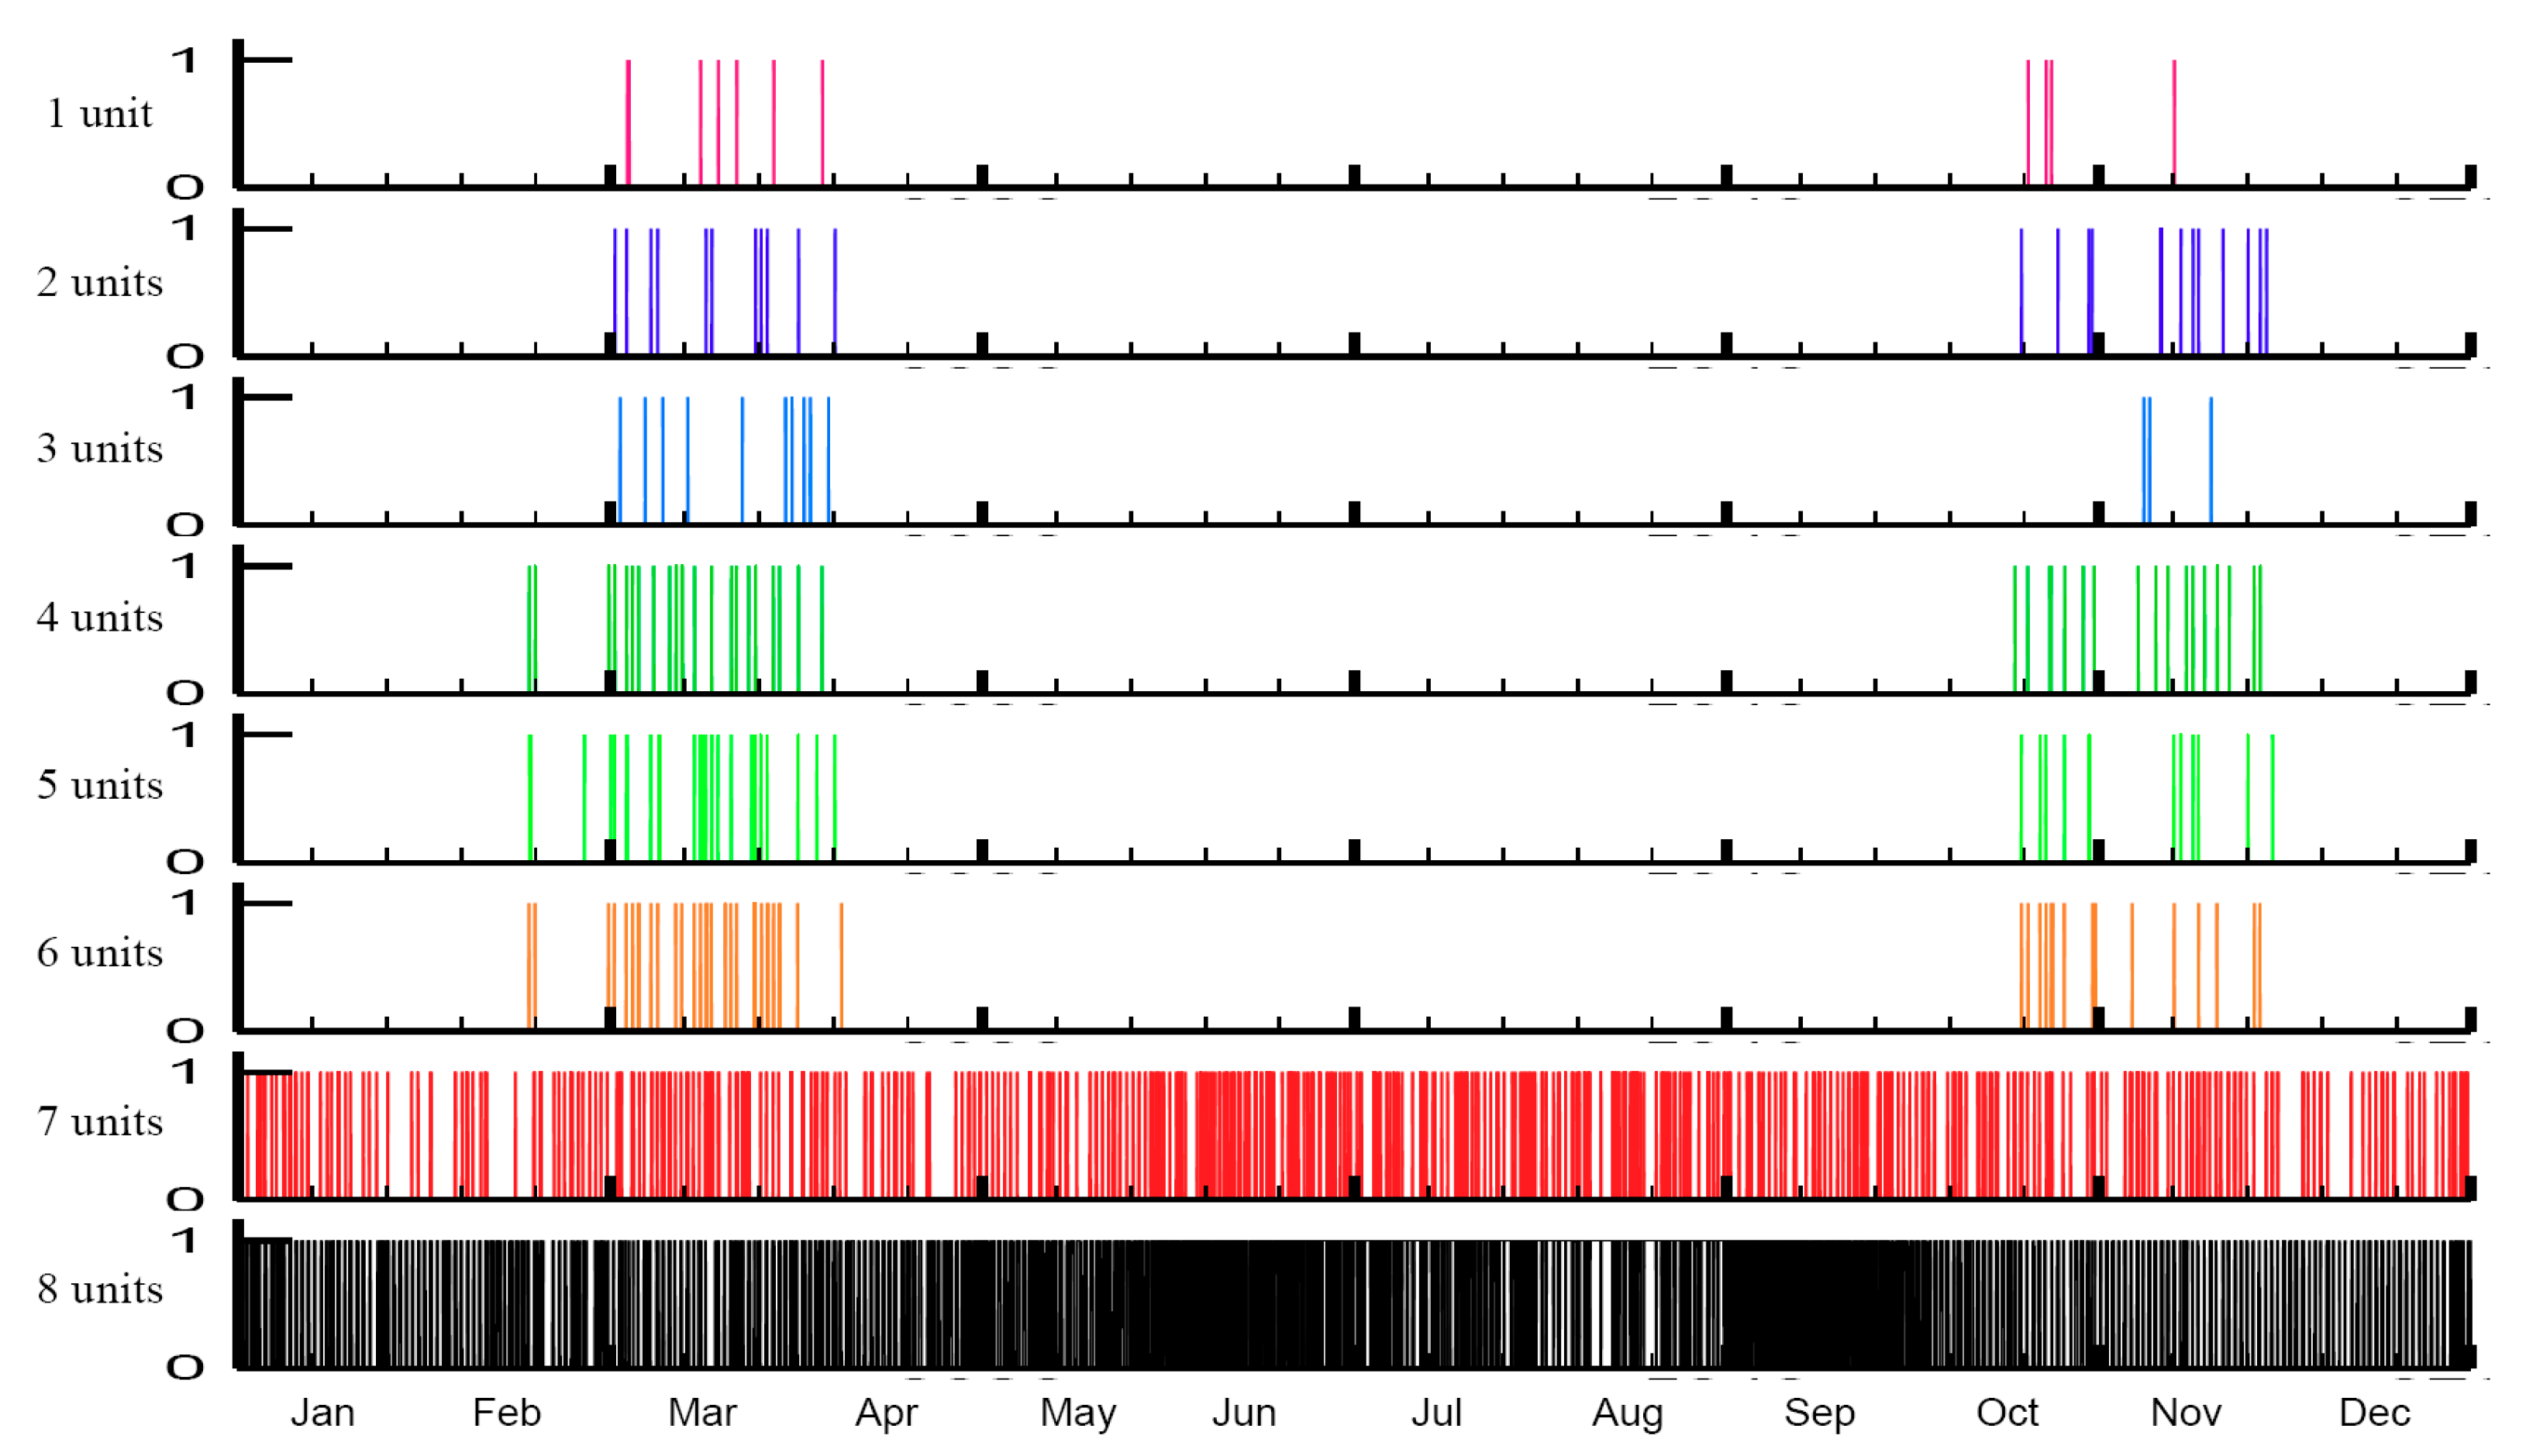
Figure 7 shows the occurrence distribution of the contemporarily active RO units during the year. Most of the time (i.e., 3463 h/year), each of the eight RO units is working. The number of hours in which only seven RO units are simultaneously on duty is 636 h/year. In these two cases, the operations are distributed throughout the year. A different behavior is shown for six to only one active RO units. In these cases, it can be seen that such situations are infrequent with an occurrence ranging from 11 to 45 h, passing from one single unit to six simultaneously active units. Moreover, these cases are focused on two periods of the year, corresponding to high storage fill levels which temporary reduce the need to desalinate water.
The DeReC scenario is able to produce 412 × 10
3 m
3/year of fresh water (i.e., 98% of the total water load), with the 2% deficit concentrated in the summer period.
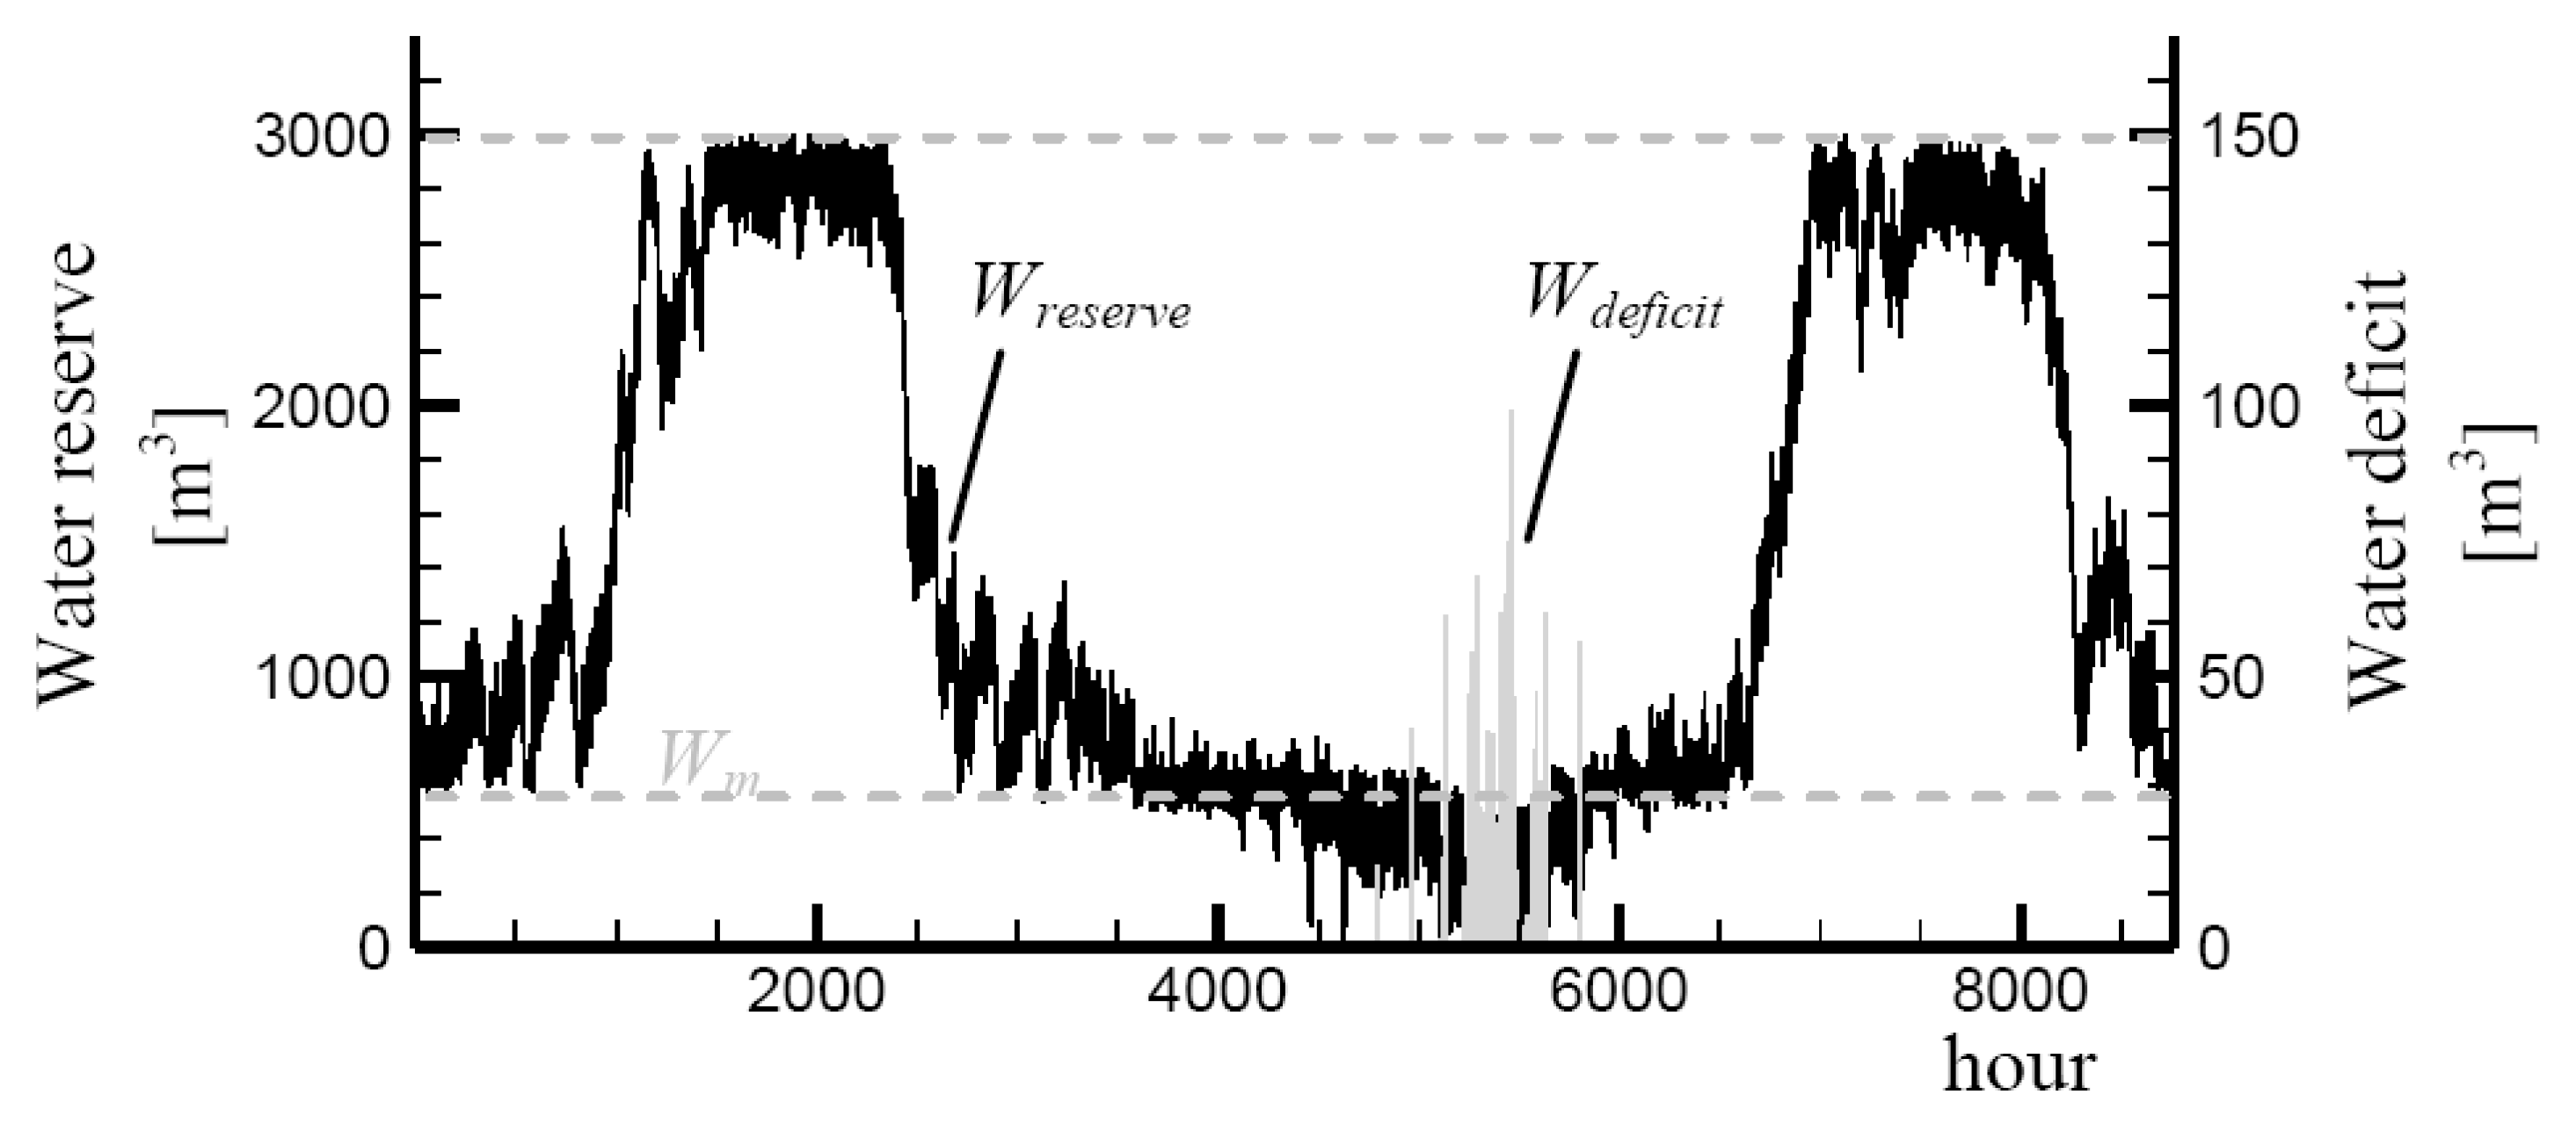
Figure 8 shows the water content in storage. The maximum water content is in correspondence with the high renewable power availability and the low users’ power and water loads in the periods from 2 March–10 April and 15 October–3 November. It is worth noting that the power dump is concentrated in the same period (see
Figure 6b) indicating that the dump is strictly related to the fullness of the water storage. For the remaining part of the year, the water content remains at levels higher than the fixed minimum of 600 m
3, with the exception of the summer period, in which water deficits are also registered with a total water lack of 4312 m
3/year occurring for 147 h distributed between 18 July and 29 August. In these cases, the DEGS are managed by increasing the duty power or by increasing the number of active engines, and the desalination station works at its maximum with very few exceptions (i.e., 26 h in which the active RO units number seven). This indicates that the water demand is higher than the RO station’s capability to completely cover the water request. Two solutions may be taken into account: (a) Resorting to an additional small size RO unit for water peak shaving purposes or, (b) substituting some of the RO units with increased water production (and power absorption) ones.
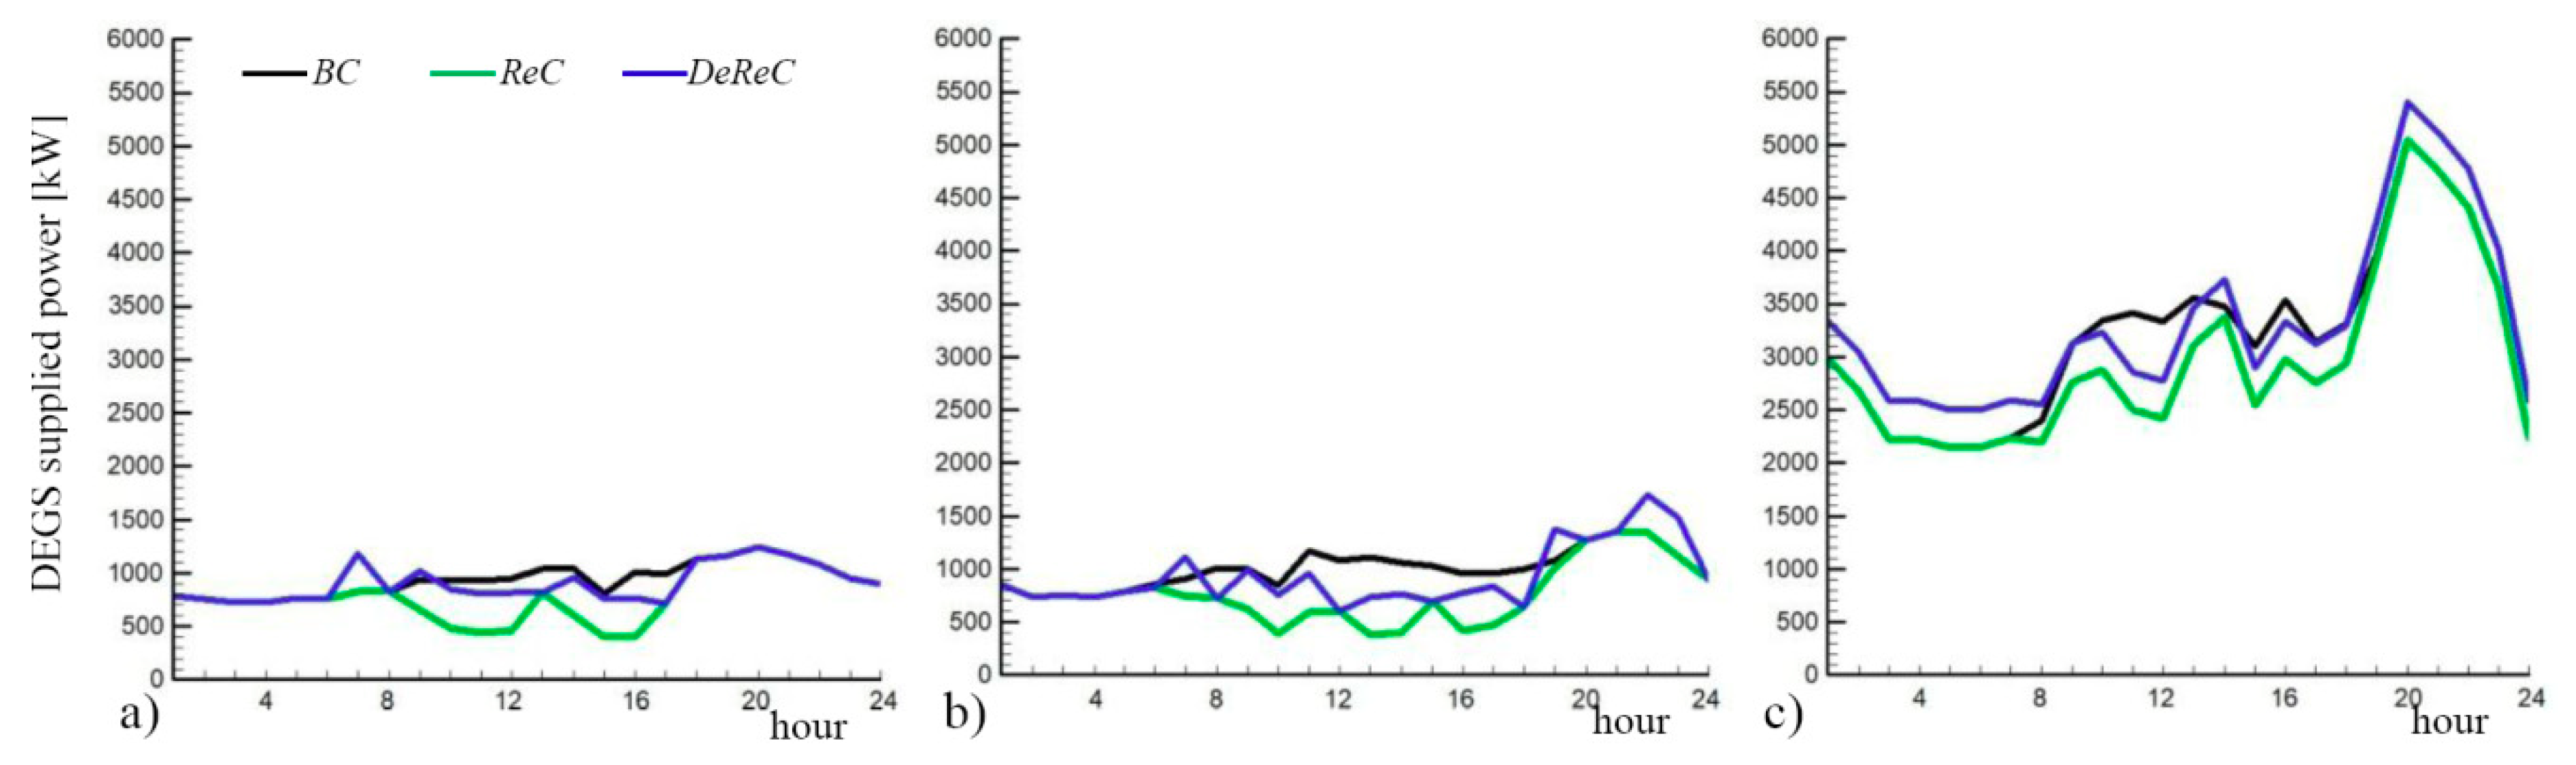
To give hints about the load-levelling performance of the system, the behavior of the supplied power from the DEGS in the three proposed scenarios is shown in
Figure 9 for three representative days: (a) A winter day (Saturday, 4 February); (b) a spring day (Thursday, 10 May); and, (c) a summer day (Thursday, 16 August). Additionally,
Table 6 shows the DEGS supplied power maximum imbalance data of the ReC and DeReC curves with respect to the BC curves in the selected winter, spring and summer days. In
Figure 9, the black line, corresponding to the BC, indicates the final users’ load curve, also for the other simulated scenarios. Generally, the intermediate position of the DeReC curve (blue line), with respect to the BC and ReC curves, demonstrates the ability of the desalination plant to act as a remedy to the DEGS power drops due to resorting to renewable energy sources. It is also worth highlighting that the RES fluctuations are barely predictable (ReC), while the proposed DeREC allows a more controlled operation of DEGS with power fluctuations that rely mostly on the adopted control logic limits.
For the winter day (
Figure 9a), the RES availability in the ReC entails a DEGS power decrease in the central hours of the day from 8 a.m. to 5 p.m., with a maximum imbalance of 60%, corresponding to 605 kW, with respect to the BC curve. The DeReC shows more constant behavior, with a maximum imbalance of 360 kW, corresponding to 43.5%, with respect to BC. Moreover, the two cases in which the DEGS power supply exceeds the BC are caused by the maximum power request from the desalination plant side due to storage water shortage. Concerning the spring day (
Figure 9b), as the RES supply increases in power and time, the gap between the ReC and BC curves show a maximum difference increase to 66%, which corresponds to 727 kW. In this case, the DeReC also presents intermediate values with a more linear behavior, with a maximum gap of 43.5%, corresponding to 467 kW. The summer day (
Figure 9c), represents the most extreme working conditions of the plant due to the high final users’ power request. The ReC and DeReC curves fluctuate more than in the other days and the DeReC curve traces the ReC curve with a constant 395 kW shift, which is the power contribution for the desalination plant. A maximum power imbalance of 911 kW is registered; nevertheless, as higher power values are involved in this period, the corresponding percentage decreases to 26.7%. In the DeReC, the DEGS power output exceeds the BC curve for most of the day-time as the desalination power request at its maximum rate (aimed at replenishing the almost-empty water storage) is added to the original users’ power load (BC curve). An exception is the 7 h-period from 10 a.m. to 5 p.m., in which the RES contribution allows the DeReC curve to under-shoot the BC curve.
Looking at the daily DEGS supplied energy difference between ReC and DeReC with respect to BC in the three selected days (
Table 6), it can be noticed, by the negative values, that in most cases the ReC and DeReC scenarios show lower DEGS energy requests than BC. The exception is represented by the DeReC scenario during the summer day, as the continuous desalination energy request is well above the RES contribution.
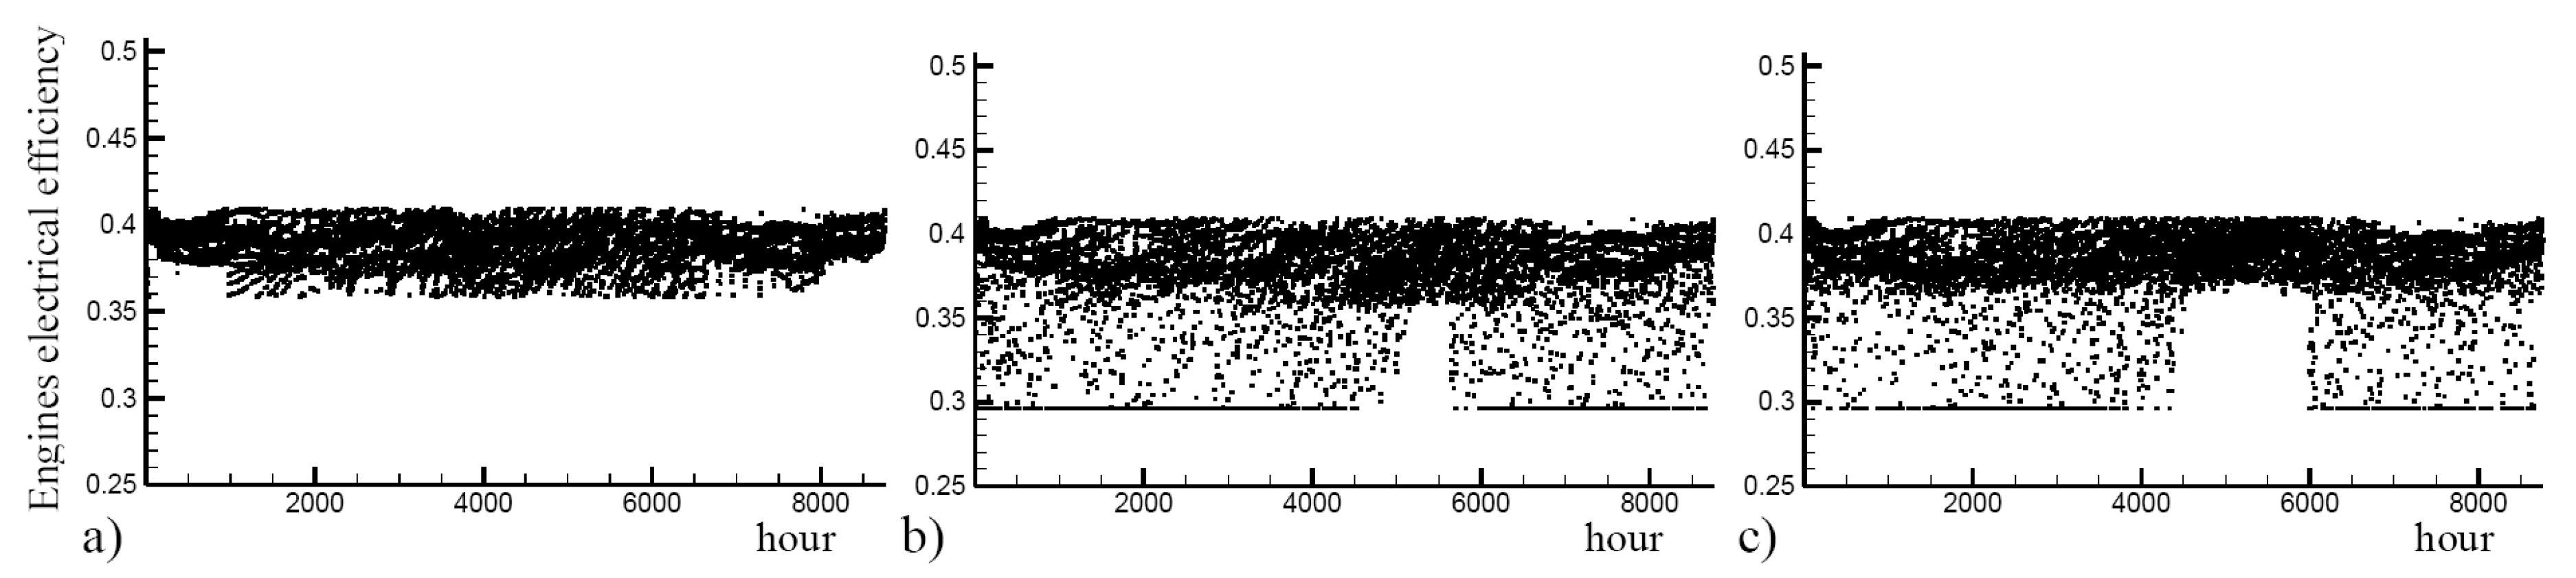
Figure 10 shows the hourly distribution of the engine efficiency for the proposed scenarios. It is evident from the comparison of
Figure 10a,b that the introduction of the renewable technology in the local power system worsens the DEGS performance, corresponding to a more dispersed efficiency values distribution, passing from a 0.3585–0.4095 range to a 0.2963–0.4095 range with an average efficiency of 0.3874 and 0.3691 in the BC and ReC, respectively. On the other hand, the use of the desalination plant (
Figure 10c), while having an efficiency range similar to the ReC, features a denser distribution of high efficiency operations driving the average value to 0.3784. Notably, both ReC and DeReC feature an elevation of minimum efficiency in summer hours (
Figure 10b,c) above 0.35, as a consequence of the engines working closer to their maximum power rating. In this respect, the DeReC scenario also exhibits the positive effects of the water-energy nexus, with a remarkably extended time interval of higher average engine efficiencies, indicating, once more, the impact of the proposed solution to the RES balancing problems in small off-grid power systems.
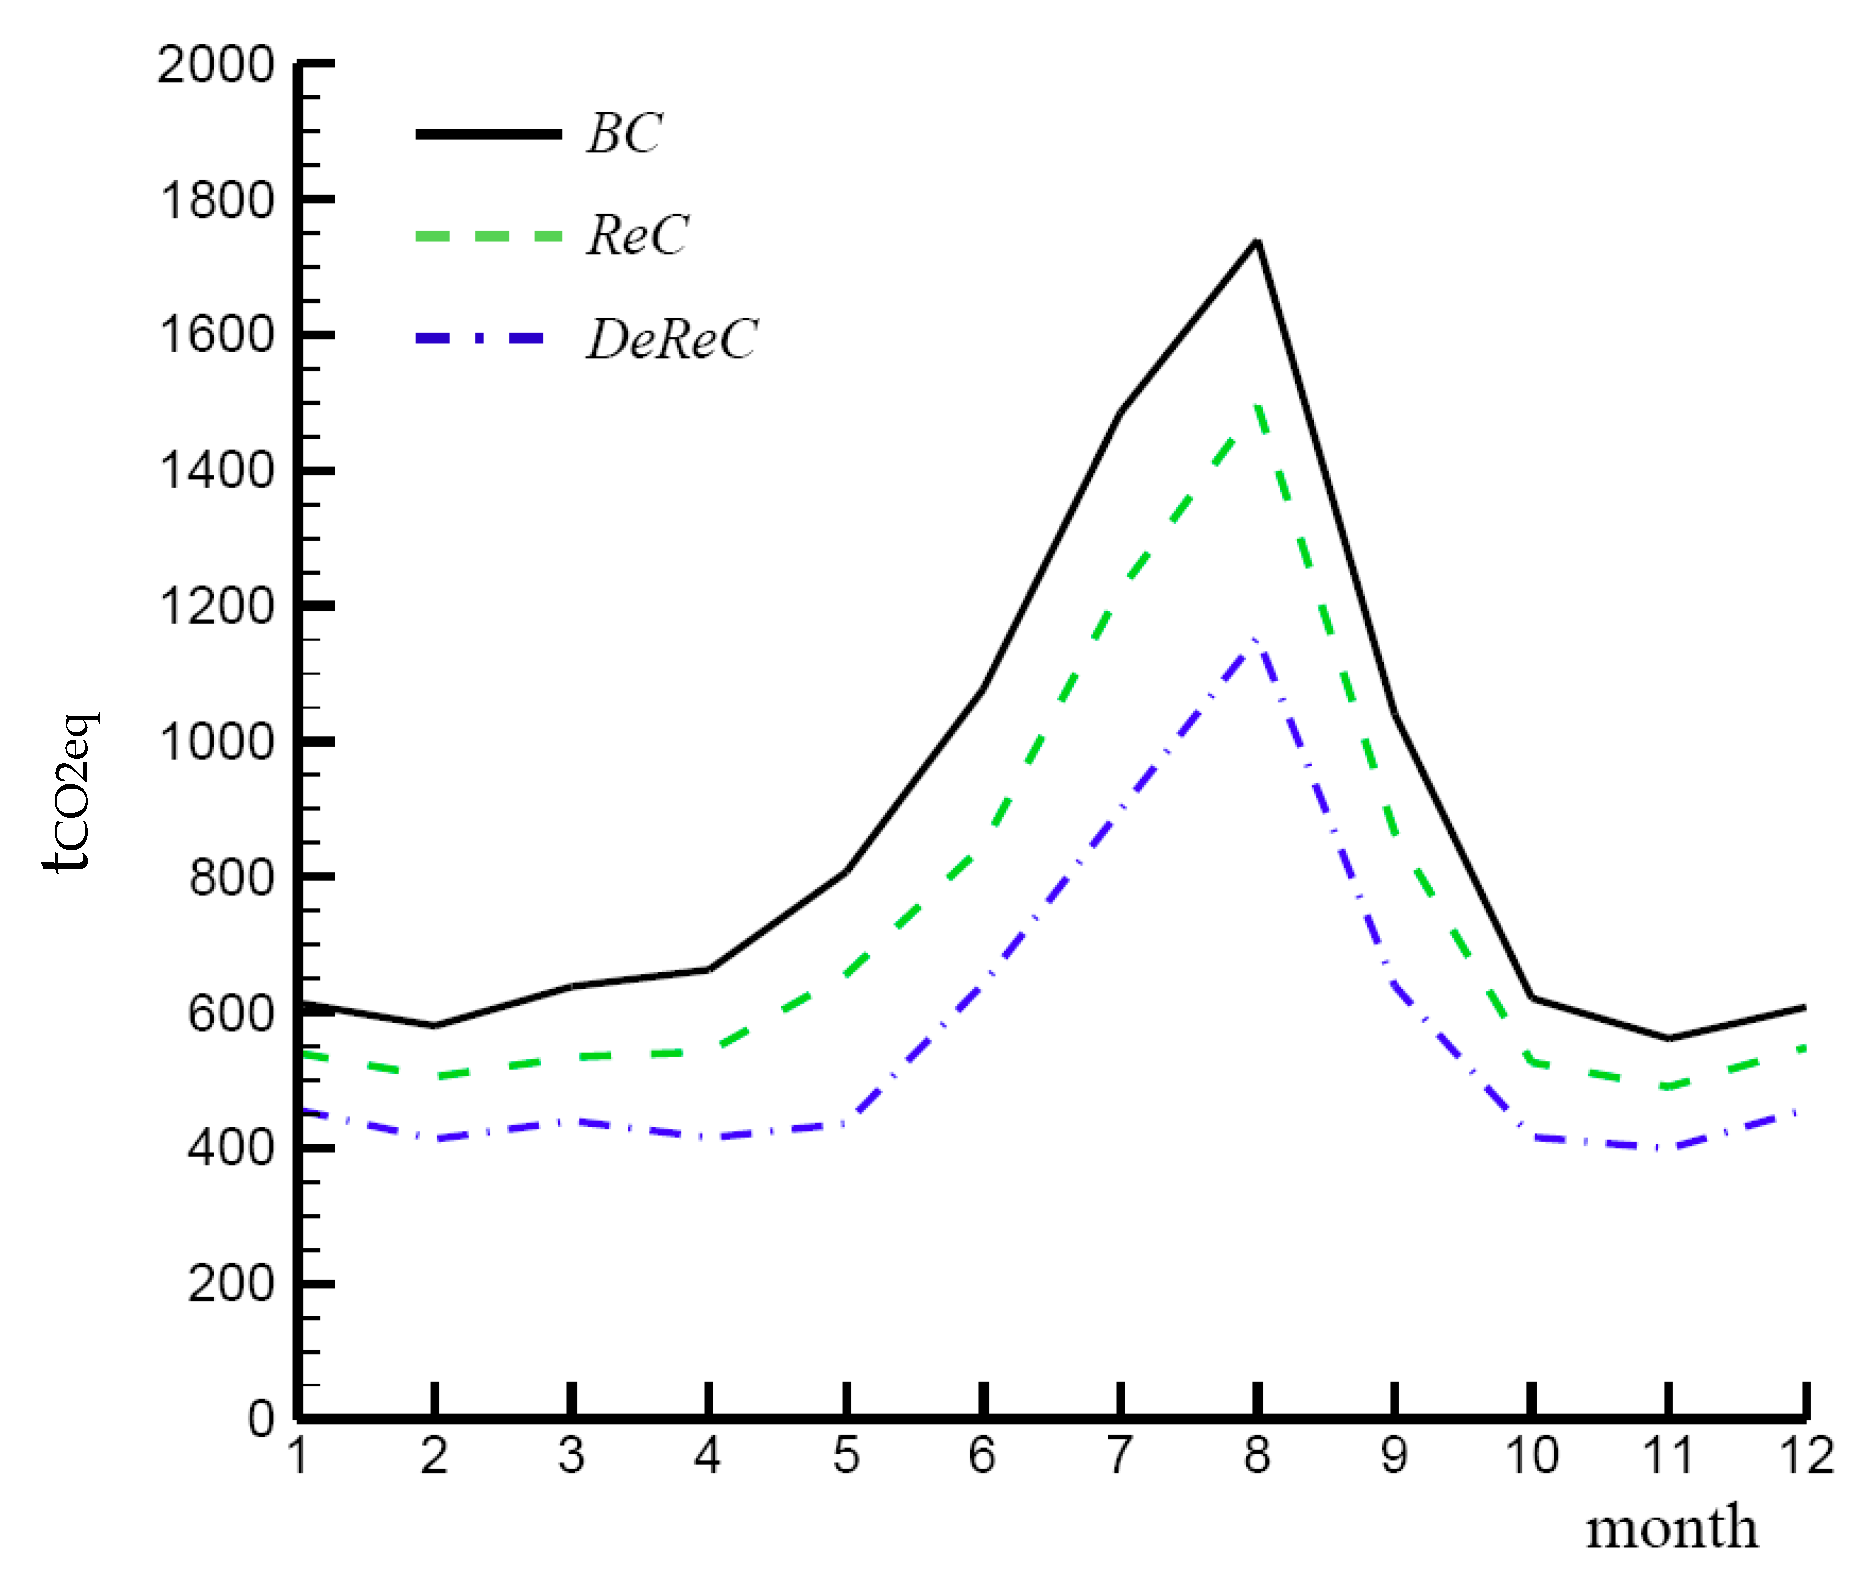
The last considered factor is the equivalent carbon dioxide emissions, shown in
Figure 11. In BC and ReC, the emissions related to the shipped water supply to the island are also taken into account, as evaluated in [
43].
The CO
2eq emissions for the fuel transport are not taken into account, as there is not dedicated transportation. Indeed, fuel procurement is made by means of the same ferry-boats that transport both people and goods to the island. The higher environmental sustainability of the DeReC is demonstrated, despite its partial reliance on fuel-derived energy. The BC and ReC curves are considerably higher than the DeReC curve, with a yearly emissions impact of +30% and +54% for ReC and BC, respectively. The emissions reduction is most marked in the May-September period, with monthly emissions savings of over 200 t
CO2eq for the DeReC with respect to BC and ReC. Globally, the emissions in the BC, ReC and DeReC amount to 10,434 t
CO2eq, 8771 t
CO2eq and 6766 t
CO2eq, respectively, indicating that the proposed DeReC system allows emissions savings of about 65% with respect to the BC and ReC.
5. Conclusions
The present study proposes a novel management scheme for integrated energy/water systems in remote areas. The control logic aims at a desalination activity no longer subjected to energy availability or water production goals but intended to smooth the load curve modified by RES fluctuations. Indeed, in the proposed scheme, water production exclusively depends on the need to balance RES fluctuations on the load curve in order to mitigate the negative effects of RES on the DEGS performance. Thus, desalination operations are only fed by energy derived from RES surplus and from set point adjustment of the already active diesel-engines. The activation of additional engines for desalination purposes is allowed only in case of water level emergency situations. These working conditions were implemented in the developed control logic of the integrated energy/water system.
The comparison of the obtained results demonstrates the capability of the proposed system management to smooth the load gaps resulting from RES fluctuations, with the desalination systems acting as an additional load during the summer period and as a one-way energy storage during the rest of the year.
The analysis demonstrated the positive effects of the proposed DeReC system on the local power system. On the RES side, the presence of the desalination system ensures higher renewable energy absorption; the RES energy dump recovery was over 50% with respect to the renewable energy integrated system without desalination. On the diesel engines side, the DeReC allows a 9% recovery of the mean engines’ power with respect to the 16.45% drop related to RES introduction in the ReC. Moreover, a recovery of 2.4% of the mean engines’ electric efficiency is registered after a 4.7% drop related to the RES introduction with respect to the base case scenario. From the global emissions point of view, taking into account current water shipping emissions, the proposed energy/water system entails equivalent CO2 emissions reduction of approximately 50% with respect to the current island situation and 30% with respect to the proposed renewable energy integration scenario.
Beside the relevance of the illustrated results, the proposed system has the capability to cover a 98% share of water demand (easily scalable to 100% with a few small control logic adjustments), mainly by adjusting the power set-point of the diesel gen-set.
It is easy to conceive of similar stand-alone power systems with water shortage problems and the uncontrolled presence of distributed renewable energy. The present study demonstrates that the addition of a relevant desalination power load to a small off-grid energy system may not represent a negative complex addition to the system, but may be able to smooth the DEGS management problems that usually occur with the inevitable RES penetration on such systems. Furthermore, it demonstrates the possibility to get benefits on the emissions side while obtaining a necessity such as fresh water. This implies the possibility of going beyond RES penetration limitations on islands or remote off-grid areas by creating a water/energy nexus.


