Abstract
Power quality is a research field related to the proper operation of devices and technological equipment in industry, service, and domestic activities. The level of power quality is determined by variations in voltage, frequency, and waveforms with respect to reference values. These variations correspond to different types of disturbances, including power fluctuations, interruptions, and transients. Several studies have been focused on analysing power quality issues. However, there is a lack of studies on the analysis of both the trending topics and the scientific collaboration network underlying the field of power quality. To address these aspects, an advanced model is used to retrieve data from publications related to power quality and analyse this information using a graph visualisation software and statistical tools. The results suggest that research interests are mainly focused on the analysis of power quality problems and mitigation techniques. Furthermore, they are observed important collaboration networks between researchers within and across countries.
1. Introduction
Power Quality is essential to guarantee the appropriate operation of electrical and electronic devices in domestic [1], commercial [2], and industrial environments [3]. Moreover, a low power quality increases energy costs and might affect the increasingly sensitive modern equipment [4]. Therefore, the electrical grid must supply power within the ranges determined by manufacturers to avoid deterioration of the connected devices during normal use [5]. More specifically, optimal power quality involves supplying clean and stable power, i.e., a steady supply voltage that satisfies the prescribed tolerance, a frequency close to the rated value, and a pure sinusoidal waveform. Furthermore, the current upward trend in large-scale integration of distributed energy resources in distribution networks has also fueled interest in knowing their power quality issues [6,7]. Nevertheless, the increasing and varying energy demands cause many loads to generate disturbances that lead to deviations from these ideal conditions, which is why some studies strongly support the need for public policies for energy efficiency and power quality improvements [8].
Several studies, including review articles, related to power quality can be found in the literature [9]. However, none of them have addressed in detail the topics in power quality that attract more attention and the characteristics of the collaboration networks among researchers in this field. Therefore, in this paper, we present a novel software-based methodology to analyse these aspects. First, we automatically obtain bibliographic data of scientific publications on power quality by using the Scopus Database API (Application programming interface) [10]. The collected information is processed through parsing techniques and structured-text refinement [11]. Then, the collaboration networks are represented using a specialised graph visualisation software [12]. Finally, we analysed the extracted information to provide insights about scientific research in power quality. It is important to emphasize that this framework is valid not only for power quality or energy issues, but also for any research topic. Let us start presenting an overview of fundamental concepts related to power quality.
1.1. Power Quality Problems
Real operation of power systems is often affected by circumstances that induce power losses and electrical disturbances. Power losses are mainly due to reactive power that causes phase displacements and harmonic disturbances [13], and causes imbalance in the power distribution among phases in the electrical network. Electrical disturbances include interruptions, transients, fast disturbances, flickering, voltage imbalance, and harmonic distortion.
Short-term disturbances include transients, voltage sag and swell, power-line flicker, and resonance. Transients are disturbances that can be generated by the activation and deactivation of machinery, static discharges, switching operations, or lightning strikes. They last for a very short time, and the electrical circuit quickly restores its steady operation without damage. A voltage sag is a decrease in the voltage level ranging from milliseconds up to a few seconds, whereas, if it lasts longer than a few seconds, it is called undervoltage. An abrupt load increase (e.g., motor activation or electric heater ignition) is among the typical causes of voltage sags. Their counterparts that are characterised by an increase in the voltage level are known as swell and overvoltage. A voltage swell involves an increase in voltage from milliseconds to a few seconds, whereas overvoltage is a swell that lasts longer than a few seconds. An abrupt load reduction generated by an inefficient voltage regulator is the most common cause of voltage swells. Flicker effects consist of random or repetitive variations in the voltage; they can be generated by the operation of electric arc furnaces and might cause visual discomfort from the intermittent operation of illumination systems. Resonance is the tendency of a system to present high-amplitude oscillations at specific frequencies, and thus cause voltage instability and overloading.
Long-term disturbances include voltage unbalance and notching, harmonic distortion, and noise. Voltage unbalance can be caused by either single-phase or unbalanced three-phase loads, whereas voltage notching is a recurring disturbance that appears during the normal operation of power electronic devices when the current commutes from one phase to another. Harmonic distortion is characterised by sporadic alterations of the pure sinusoidal waveform, which is often caused by nonlinear loads such as variable-speed drives. Noise is a random distortion in the power waveform that can originate from electrical signal interference between different equipment. Interruptions are defined as the total loss of power and can be classified according to their duration. For instance, momentary interruptions last from milliseconds to one second, temporary interruptions from one second to a few minutes, and long-term interruptions can last for minutes or even hours. These interruptions can be either planned (e.g., maintenance execution) or accidental (e.g., equipment failure, animals trapped in equipment, weather conditions, and human errors).
Power quality is a critical issue for the evaluation of distributed generation systems [14] and to assess and event detection of hybrid power systems [15].
1.2. Detection and Mitigation Techniques
Low power quality has important negative consequences such as increased energy consumption, charges for reactive power consumption, production loss, equipment damage, and data loss. Therefore, it is necessary to capture, process, and analyse real-time information for detecting and managing perturbations that affect power quality. The development of information and communications technologies (ICTs) has allowed the use of advanced methods to thoroughly study power quality problems. Specifically, ICTs are used to implement complex signal processing techniques, optimisation methods, and artificial intelligence approaches to handle the vast amount of data generated during perturbation analysis [16].
1.2.1. Signal Processing Techniques
Automatic power quality characterisation and disturbance classification are important research topics [17]. Signal processing techniques are basic tools for power quality monitoring and can be applied to analyse voltage and current from sampled measurements. Furthermore, these techniques allow to detect events and characterise (by using feature extraction) variations from measurement-based information [18]. For instance, methods such as wavelet [19] or S transforms [20] allow for efficiently monitoring electrical systems and implement real-time analysis scenarios [21,22]. In a recent investigation, an adaptive process noise covariance Kalman filter has been proposed for detecting the power quality disturbances [23]. Overall, the collection and analysis of real-time information is essential to ensure the proper perturbation detection and classification.
1.2.2. Artificial Intelligence and Optimisation Techniques
Some studies have shown that, besides digital signal processing techniques, artificial intelligence and optimisation techniques are useful to detect and classify power quality disturbances [19]. Artificial intelligence techniques are used to extract relevant information and accurately classify abnormal events that occur in electric installations [24,25].
The integration of renewable energy resources into power networks is the trend that allows for reducing the global emissions, but the output of renewable systems is intermittent and periodically changes behavior of power distribution system from unidirectional to bidirectional, which causes different types of power quality events. Some investigations have analyzed the performance of artificial intelligence in mitigating power quality events in photovoltaic grid-tied systems [26]. Other recent studies have proposed methods based on artificial intelligence techniques to optimize power quality parameters optimization in off-grid systems [27].
Despite signal processing for feature extraction and artificial intelligence for classification representing the most important stages in pattern recognition of power quality disturbances, some researchers have applied other optimisation techniques to select the most suitable features and parameters [19]. For instance, the optimisation methods in [28,29] add process layers to improve event classification and signal analysis, providing enhanced results at the expense of increased computational load.
2. Methodology
In this section, we describe the methodology to retrieve and analyse several publications related to power quality to determine the most investigated topics and identify scientific collaboration networks of researchers in the field. This methodology, which is described in detail in [30] and can be used to analyze any other research field, considers the features available through the API Interface in the Scopus Database to automate the search of articles published by authors and institutions. Then, we treat and analyse the retrieved information for different purposes. We selected Elsevier’s Scopus for this study because it is the largest database of peer-reviewed literature in different scientific fields [31].
2.1. Data Extraction Using Automated Scripts
Figure 1 shows the flowchart to implement the software for automatic information extraction from the Scopus Database, which we called research network bot (ResNetBot). The operation of this bot, which retrieves data for different analyses, can be divided into three phases:
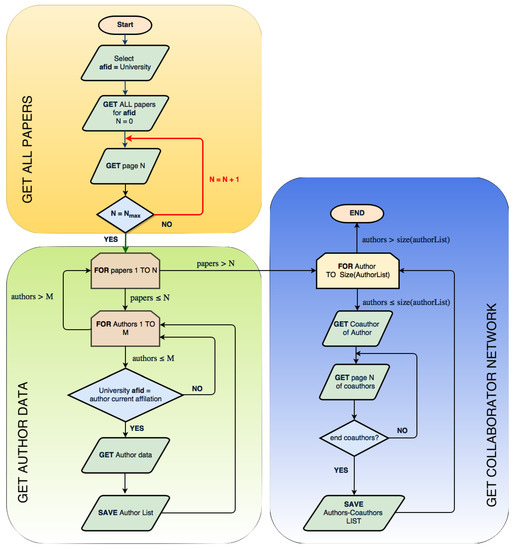
Figure 1.
Flowchart for ResNetBot implementation.
- Get publication data. In this phase, the bot retrieves information from all the publications containing power quality keywords. Specifically, the information from all the related articles is extracted and the Author ID, which is the unique identifier of an author in Scopus, is stored in the bot database, provided it was not previously registered. It is important to note that the analysis of keywords in scientific articles has been the subject of research in various areas of science and engineering [32,33].
- Get author data. From the author list of the publications collected in the previous phase, ResNetBot retrieves and stores the information that Scopus contains about each author, including registered publications and dates, affiliation history, h-index, and number of citations.
- Get the collaboration networks: the individual information of each researcher is used to establish collaborative relationships on basis to the co-authoring of papers.More specifically, in this phase, the bot applies an iterative process for each of the authors that have published papers including typical power quality keywords in their publications, then obtains information such as the number of author–co-author collaborations, the name of the institution, city, country and current affiliation of these collaborators, etc. This information is later used to construct a graph where nodes represent the researchers and edges the existence of collaboration between them, respectively.
We designed ResNetBot by combining PHP and Linux Bash to use the Scopus API according to the structure defined in [10].
2.2. Data Parsing and Text Refining
The data obtained by ResNetBot was structured according to the corresponding fields and stored as a set of plain-text files using the JavaScript Object Notation (JSON) format [34]. The Scopus API allows for requesting information at different levels of detail, and hence we programmed the bot to request full records and then select the most valuable information for our analyses. During the data verification process, some inconsistencies were detected. Nevertheless, this is a common problem of large databases given that they contain a huge amount of information from a variety of sources [35,36].
Despite the inconsistencies in the database, it is still possible to obtain valuable insights after refining the data. This depuration process is necessary because some words or phrases that express the same concepts are usually written with slight variations. For instance, when inspecting the keywords from publications, the same expression can be written with a different case, e.g., ‘Power Quality’, ‘Power quality’, and ‘power quality’. Therefore, we applied some of the refinement algorithms from the OpenRefine software [37], which include key collision and nearest neighbour methods to merge expressions that comply with the same idea but are written with syntactic variations [38,39,40]. OpenRefine has been successfully applied in previous studies [41], and can be applied to both keywords and author names. Finally, we used spreadsheets to organize the refined information and identify unique values.
2.3. Data Analysis and Visualization
The information collected by ResNetBot and subsequently treated using OpenRefine was stored in a local database. Then, we analysed this information using graph-based visualisation and statistical tools. Graph representation is useful to determine the relationships between different elements. A graph consists of a set of vertices and edges, where each vertex represents an element, and each edge establishes a relationship between two vertices. Moreover, this representation allows for including specific characteristics of the elements and their relationships. In recent years, several powerful graph visualisation tools have been developed. These software tools allow for analysing in detail the characteristics of graphs by using multiple features, such as modifying the size of vertices and edges following some criteria, grouping vertices, and drawing vertices with different colours based on their characteristics. In addition, these tools often include statistical metrics to define topological and relational characteristics among vertices. One of the most commonly used open-source tools is Gephi [42], which includes several statistical features and has been used in numerous projects and applications [43,44,45,46].
3. Results and Discussion
This section presents the validation of the proposed methodology by analysing both the most investigated topics in power quality and the scientific collaboration network based on the co-authoring of articles that contain keywords related to power quality.
3.1. Trending Topics in Power Quality Research
A general aspect to be considered is determining the main research topics in power quality. This is not straightforward given the large number of articles, and each of them usually addresses specific topics. Fortunately, keywords allow for unveiling general topics because authors usually include those that contain relevant words or phrases to allocate their publication to the subjects that they consider most appropriate.
Using the proposed methodology, we quickly processed the scientific production in power quality and its related areas according to keywords, by considering the information on several publications from 1970 to 2016. To obtain the number of publications, it was necessary to refine the data provided by the Scopus database, as the number of identified keywords was large. The number of analysed publications during the considered period was 14,053, with 10,670 of them containing keywords. We found that the dominant publication format is conference proceedings (57%), followed by journal articles (39%), and finally books (4%). The initial verification of keywords yielded a total of 51,111, out of which 18,655 were determined as unique. However, many of the keywords were identical but written with small variations (e.g., ‘power quality’ was found as ‘Power Quality’, ‘power-quality’, ‘Power quality’, or ‘power quality’). Hence, we used the OpenRefine software to merge similar text based on specialised algorithms [11]. After applying the refining algorithms, we obtained a final figure of 14,625 unique keywords.
In a recent study [9], the authors analysed keywords related to power quality by directly using the Scopus search engine. They found that, apart from the term ‘power quality’, some keywords repeatedly appeared among the articles, such as ‘harmonics’, ‘interharmonics’, ‘active filter’, and ‘voltage sag’. Hence, we aimed to extend that analysis by applying community detection [47] to the graph formed by all the publications related to power quality. Community detection allows for understanding the structure of complex networks and obtaining useful insights from them.
Figure 2 shows the communities detected using the Louvain method implemented in the Gephi statistics panel. From this figure, we conclude that the most studied topics in power quality are signal processing and artificial intelligence techniques, active filtering methods, voltage quality and restoration methods, microgrid and distributed generation, and harmonics. Moreover, some communities are highly concerned about the impact of renewable energies in power quality, and study topics on islanding and wind power. Other topics of interest include flicker, electric railways, AC/DC converters, and power factor correction.
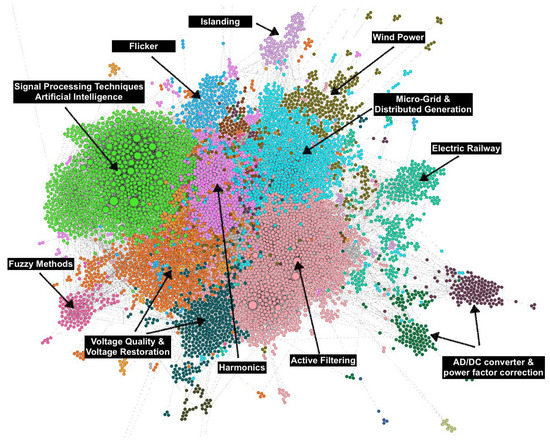
Figure 2.
Research topics related to power quality.
Table 1 lists the most used keywords in some of the communities displayed in Figure 2, where it is possible to see that articles belonging to a community often include similar keywords. Therefore, articles on a specific topic often cite those within the same scope.

Table 1.
Fifteen most used keywords among different communities.
Table 2 provides the rank of journals according to the number of published articles on power quality. Figure 3 shows a graph of publications (vertices), where edges indicate citation from one article to another. It can be noticed that articles from a given journal tend to include citations to others published in the same journal.
Table 2.
Top journals publishing articles related to power quality.
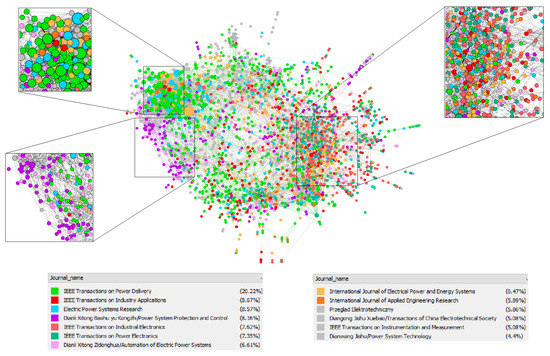
Figure 3.
Citations among journals.
3.2. Collaboration Networks in Power Quality
Apart from the analysis of the most important topics and journals related to power quality, the proposed methodology is useful to unveil scientific collaborations in the power quality community. To this end, we used a graphical approach by building different layouts based on the ForceAtlas2 plugin in Gephi [45] plugin in Gephi. This visualisation method helps construct a balanced state network that enables the interpretation of data by building a force-directed layout. This layout simulates a physical system to accommodate vertices and edges in a spatial network. Specifically, vertices repulse each other acting as charged particles, whereas edges attract their vertices by acting as springs.
Figure 4 shows the general structure of collaborations among researchers working in power quality, with vertices representing individual researchers, and edges representing co-authoring relations of at least one article related to power quality. From the graph, there can be seen regions with high concentrations of researchers (in the central part of the graph), which indicate groups of scientists performing intensive collaboration. In contrast, the regions of the graph that are weakly connected with the rest of the graph (in the outermost part of the graph) indicate small collaboration groups or individual researchers with sporadic collaborations.
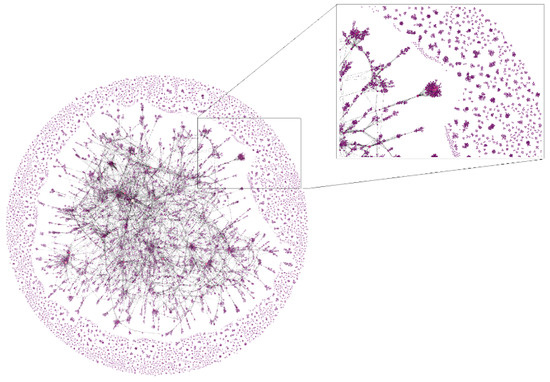
Figure 4.
Collaboration network of researchers in power quality.
In addition, we obtained the list of the top 100 researchers in power quality. To establish this ranking, we defined a thematic h-index (TH-index) to determine the h-index of the authors from their publications that only include keywords related to power quality. Figure 5a shows the numbers of citations and articles of the top 100 researchers with the highest TH-index in power quality. From the figure, we can observe that some authors have TH-index values similar to their h-indexes, which suggests that power quality is their main research field, whereas others have h-indexes higher than their TH-index values, which suggests that these authors also investigate other topics out of the scope of power quality. Figure 5b shows the collaboration network among these 100 outstanding researchers, where the size of the vertices corresponds to the eigenvector centrality that measures the influence of a vertex in a graph. From this measure, connections to high-scoring vertices contribute more to the score of a given vertex than connections to low-scoring vertices. According to Figure 5b, the researchers Matthew Bollen, Frede Blaabjerg, Ambrish Chandra, Hirofumi Akagi, Arindam Ghosh, Wilsun Xu, Josep Guerrero, William Grady, Kamal Al-Haddad, Bhim Singh, and Magdy Salama are the most influential authors in power quality. Furthermore, it can be seen that most of the top 100 researchers collaborate in a joint network either directly or indirectly, whereas some of them perform more independent investigations with the rest of these prominent researchers.
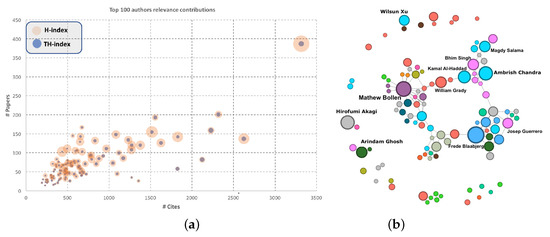
Figure 5.
(a) number of citations and articles of the top 100 researchers with the highest TH-index in power quality; (b) collaboration network of the 100 top researchers in power quality.
3.3. International Collaborations
Collaborations among researchers from different countries provide information on the level of internationalisation of an institution [48,49].
Figure 6 shows the collaboration graph in the power quality field. The colour codes represent the authors’ nationality, whereas the size of their vertices corresponds to the eigenvector centrality. The authors depicted in Figure 4 that are disconnected from the central region of the graph were not considered for Figure 6. The countries having more contributors related to power quality are China (26.04%, orange vertices), India (11.25%, blue vertices), USA (10.2%, pink vertices), Brazil (4.68%, green vertices), Iran (3.07%), Italy (2.66%), Spain (2.51%), South Korea (2.18%), United Kingdom (2.17%), and Japan (2.15%). Furthermore, most researchers mainly collaborate with peers from their own country.
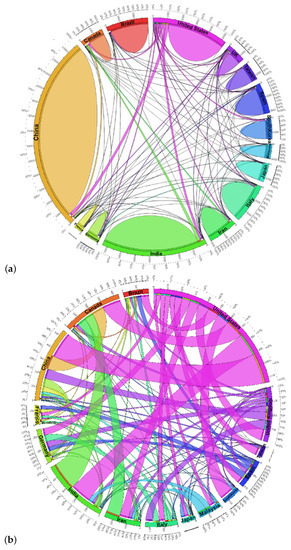
Figure 6.
(a) local and international collaborations in power quality; (b) international collaborations in power quality.
Nevertheless, despite the fact that North American researchers (pink vertices) do not represent the highest number of researchers, they constitute the core of the graph that indicates that they collaborate more intensively than their peers from other countries. In contrast, there is a low level of international collaboration among Chinese and Indian researchers. The zoomed-in view of Figure 7 shows the details of a graph region that clearly reflects international collaborations. In fact, this view shows collaboration clusters among researchers from different countries who have high eigenvector centrality values, whereas most researchers having low values collaborate with peers from their own country.
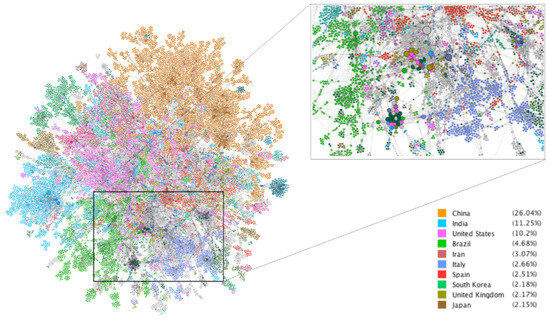
Figure 7.
Collaborations in power quality by country.
The graph in Figure 7 provides a perspective to understand the internationalisation level of researchers from the countries with high scientific production in power quality. In addition, Figure 7a shows local and international collaborations organized country, where it can be seen that most researchers collaborate with their peers from the same country. In fact, only USA, Canada, United Kingdom, and Germany have an internationalisation level above 20%. Next, Figure 6b shows filtered data from Figure 6a to focus on international collaborations among researchers. It can be seen that most international collaborations of researchers affiliated to Chinese, Indian, and Iranian institutions are established with researchers affiliated to institutions in USA and Canada, whereas researchers from institutions in other Asian countries (e.g., South Korea, Taiwan, and Japan) tend to collaborate more with researchers from USA than with researchers from Canada. Finally, the collaborations of researchers affiliated to European institutions appear to be more evenly distributed worldwide.
3.4. Institutional Collaborations
Apart from collaborations across countries, we also analysed collaborations among researchers from different institutions in the same country [50]. Figure 8a shows the collaboration network of Chinese researchers, where it is possible to see the existence of collaborations among researchers from different universities and institutions.
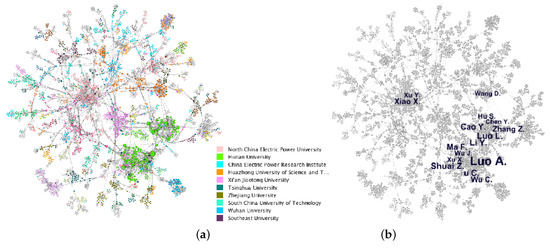
Figure 8.
(a) collaborations among Chinese researchers working in power quality; (b) researchers with eigenvector centrality value above 0.30.
In addition, we considered applying metrics that characterise the global prominence of a graph vertex. Hence, Figure 8b highlight those researchers having eigenvector centrality higher than 0.30. High values of this metric represent collaborations among prominent researchers’. The ranking of Chinese institutions by number of papers related to power quality performance is leaded by the North China Electric Power University, Hunan University, and China Electric Power Research Institute.
Figure 9 shows a similar analysis considering researchers from USA. In this case, the ranking of institutions by number of articles related to power quality performance is led by the IEEE, North Carolina State University, and Electric Power Research Institute. Moreover, there can be seen a few clusters containing most of the researchers involved with power quality, whereas the Chinese graph (see Figure 8) shows a higher dispersion.
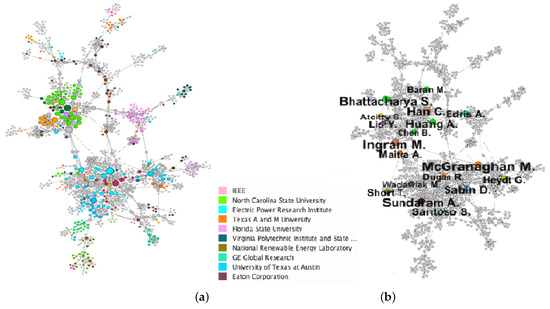
Figure 9.
(a) collaborations among North American researchers working in power quality; (b) researchers with eigenvector centrality value above 0.30.
4. Discussion
The results we have just shown offer a clear view of the areas of interest related to power quality. The method retrieves information about a large number of papers dealing with power quality. Thanks to the use of the Louvain method for detecting communities in the large graph of publications collected, it is possible to identify the most important areas of investigation in power quality. The results obtained show that the most investigated topics are: harmonics; flicker; voltage quality and restoration; active filtering; signal processing and artificial intelligence techniques; fuzzy methods; AC/DC converter and power factor correction; micro-grid and distributed generation; islanding; electric railway; and wind power.
Thus, and although obviously many articles can deal with different techniques and problems, there are areas of investigation in which researchers have a greater interest. Thus, in the area of problems, the study of harmonics is very important, since they can cause overheating of electrical machines, rise in the temperature of electrical wiring, damage to the power capacitors of the electrical network, overheating and failures in thermo-magnetic and electromagnetic switches. Furthermore, other variations which adversely affect the supply (voltage variations, flicker effect, etc.) are also widely studied in the literature. On the other hand, the results obtained also show that signal processing, artificial intelligence and optimisation techniques are used to classify power quality disturbances. These results are coincident with the results of a previous review in this research topic [19].
The proposed method clearly shows how the outstanding researchers in the field collaborate, and which are the countries in which the scientific production in power quality is more significant. It is observed that researchers affiliated to academic or research institutions from China, India, United States and Brazil have published more than the half of papers in this field. According to Scimago Journal and Country Rank (Scopus), the countries with more citable documents are in this order: United States, China, United Kingdom and Germany. Therefore, the research in power quality has significant differences from other areas of investigation. The results also indicated that most of the publications in this field are co-authored by researchers from the same country, although notable international scientific collaborations have been found, especially between researchers affiliated with North American institutions and researchers of other countries. The analysis of the collaboration network including the 100 most prominent researchers in power quality shows intensive collaborations between these researchers, which denotes their interest in working with prominent peers.
5. Conclusions
This paper aims to cover a gap in the literature by analysing the trending topics and scientific collaborations in the field of power quality, based on information about related publications. The proposed methodology consists of an automated process for the extraction of a high amount of information. First, we used a bot that retrieves data from the API interface in the Scopus Database. Then, a parsing and refinement process was applied to the retrieved data, which was later processed to both extract information on the most investigated power quality topics and analyse collaboration networks among researchers by using a graph visualisation software.
The use of Louvain method for detecting communities in the large graph of publications collected is proposed. These communities highlight the most important areas of investigation in power quality, including problems (e.g., short-term perturbations and harmonics) and mitigation techniques (e.g., active filters, artificial intelligence applications, and wavelet transform implementations). The extracted information is also used to automatically obtain the list of high-quality journals publishing papers about power quality. Another utility of the model is the possibility of determining the scientific collaborations among researchers involved with power quality, including the option of identifying the most outstanding researchers in power quality.
The main advantage of our approach is that it allows for classifying a large number of papers using community detection without the need for revising all the papers. Therefore, this approach provides a precise perspective to the researchers and engineers working on the classification of problems and solution methods of power quality (or any other research area). Based on the communities detected, the analysis of the keywords of each community allows for managing a huge number of papers and identifying those groups of papers more related to a given topic. Therefore, the proposed methodology, which can be applied to any other scientific field or discipline, is able to determine the most important research topics and collaboration networks.
Author Contributions
Conceptualization, F.G.M. and M.G.M.; Methodology, R.B.; Software, A.A.; Validation, A.A, R.B. and F.M.-A.; Formal Analysis, F.G.M.; Investigation, F.G.M. and M.G.M.; Resources, F.G.M.; Data Curation, M.G.M.; Writing—Original Draft Preparation, R.B., F.G.M. and F.M.-A.; Writing—Review and Editing, M.G.M, A.A. and F.M.-A.; Visualization, F.G.M.; Supervision, F.M.-A.; Project Administration, F.G.M and F.M.-A.
Funding
This research received no external funding.
Acknowledgments
The authors want to acknowledge the CEIA3 campus for the support on this work.
Conflicts of Interest
The authors declare no conflict of interest.
References
- Rea, J.A.; Herring, J.; Sopoćko, M.; Dempsey, P.; Armstrong, S. Survey on demand side sensitivity to power quality in Ireland. Int. J. Electr. Power Energy Syst. 2016, 83, 495–504. [Google Scholar] [CrossRef]
- Juaidi, A.; AlFaris, F.; Montoya, F.G.; Manzano-Agugliaro, F. Energy benchmarking for shopping centers in Gulf Coast region. Energy Policy 2016, 91, 247–255. [Google Scholar] [CrossRef]
- Back, J.A.; Tedesco, L.P.; Fredi Molz, R.; Benitez-Nara, E.O. An embedded system approach for energy monitoring and analysis in industrial processes. Energy 2016, 115, 811–819. [Google Scholar] [CrossRef]
- Coll-Mayor, D.; Pardo, J.; Perez-Donsion, M. Methodology based on the value of lost load for evaluating economical losses due to disturbances in the power quality. Energy Policy 2012, 50, 407–418. [Google Scholar] [CrossRef]
- Morsi, W.G.; El-Hawary, M.E. Power quality evaluation in smart grids considering modern distortion in electric power systems. Electr. Power Syst. Res. 2011, 81, 1117–1123. [Google Scholar] [CrossRef]
- Seme, S.; Lukač, N.; Štumberger, B.; Hadžiselimović, M. Power quality experimental analysis of grid-connected photovoltaic systems in urban distribution networks. Energy 2017, 139, 1261–1266. [Google Scholar] [CrossRef]
- Fouda, M.; Elwakil, A.; Radwan, A.; Allagui, A. Power and energy analysis of fractional-order electrical energy storage devices. Energy 2016, 111, 785–792. [Google Scholar] [CrossRef]
- Sauer, I.L.; Tatizawa, H.; Salotti, F.A. Communication power quality and energy efficiency assessment and the need for labelling and minimum performance standard of uninterruptible power systems (UPS) in Brazil. Energy Policy 2012, 41, 885–892. [Google Scholar] [CrossRef]
- Montoya, F.G.; García-Cruz, A.; Montoya, M.G.; Manzano-Agugliaro, F. Power quality techniques research worldwide: A review. Renew. Sustain. Energy Rev. 2016, 54, 846–856. [Google Scholar] [CrossRef]
- Elsevier. Scopus API. Available online: https://dev.elsevier.com/sc_apis.html (accessed on 2 August 2018).
- Elmagarmid, A.K.; Ipeirotis, P.G.; Verykios, V.S. Duplicate record detection: A survey. IEEE Trans. Knowl. Data Eng. 2007, 19, 1–16. [Google Scholar] [CrossRef]
- Beck, F.; Burch, M.; Diehl, S.; Weiskopf, D. A Taxonomy and Survey of Dynamic Graph Visualization; Wiley Online Library: Hoboken, NJ, USA, 2016; pp. 133–159. [Google Scholar]
- Barote, L.; Marinescu, C. Software method for harmonic content evaluation of grid connected converters from distributed power generation systems. Energy 2014, 66, 401–412. [Google Scholar] [CrossRef]
- Elbasuony, G.S.; Abdel-Aleem, S.H.; Ibrahim, A.M.; Sharaf, A.M. A unified index for power quality evaluation in distributed generation systems. Energy 2018, 149, 607–622. [Google Scholar] [CrossRef]
- Shaik, A.G.; Mahela, O.P. Power quality assessment and event detection in hybrid power system. Electr. Power Syst. Res. 2018, 161, 26–44. [Google Scholar] [CrossRef]
- Granados-Lieberman, D.; Romero-Troncoso, R.; Osornio-Rios, R.; García-Pérez, A.; Cabal-Yepez, E. Techniques and methodologies for power quality analysis and disturbances classification in power systems: a review. Gener. Transm. Distrib. IET 2011, 5, 519–529. [Google Scholar] [CrossRef]
- Gu, I.Y.H.; Styvaktakis, E. Bridge the gap: Signal processing for power quality applications. Electr. Power Syst. Res. 2003, 66, 83–96. [Google Scholar] [CrossRef]
- Bollen, M.H.; Gu, I. Signal Processing of Power Quality Disturbances; Wiley-IEEE Press: Hoboken, NJ, USA, 2006. [Google Scholar] [CrossRef]
- Khokhar, S.; Mohd Zin, A.A.B.; Mokhtar, A.S.B. A comprehensive overview on signal processing and artificial intelligence techniques applications in classification of power quality disturbances. Renew. Sustain. Energy Rev. 2015, 51, 1650–1663. [Google Scholar] [CrossRef]
- Abidin, A.F.; Mohamed, A.; Shareef, H. Intelligent detection of unstable power swing for correct distance relay operation using S-transform and neural networks. Expert Syst. Appl. 2011, 38, 14969–14975. [Google Scholar] [CrossRef]
- Montoya, F.; Alcayde, A.; Sánchez, P.; Gil, C.; Montoya, M.; Gómez, J. Comparative analysis of power variables in high performance embedded and x86 architectures using GNU/Linux. Comput. Electr. Eng. 2011, 37, 541–549. [Google Scholar] [CrossRef]
- Tse, N.C.; Chan, J.Y.; Lau, W.H.; Poon, J.T.; Lai, L. Real-time power-quality monitoring with hybrid sinusoidal and lifting wavelet compression algorithm. IEEE Trans. Power Deliv. 2012, 27, 1718–1726. [Google Scholar] [CrossRef]
- Xi, Y.; Li, Z.; Zeng, X.; Tang, X.; Liu, Q.; Xiao, H. Detection of power quality disturbances using an adaptive process noise covariance Kalman filter. Digit. Signal Process. 2018, 76, 34–49. [Google Scholar] [CrossRef]
- Kinhal, V.G.; Agarwal, P.; Gupta, H.O. Performance investigation of neural-network-based unified power-quality conditioner. IEEE Trans. Power Deliv. 2011, 26, 431–437. [Google Scholar] [CrossRef]
- Zhengyou, H.; Shibin, G.; Xiaoqin, C.; Jun, Z.; Zhiqian, B.; Qingquan, Q. Study of a new method for power system transients classification based on wavelet entropy and neural network. Int. J. Electr. Power Energy Syst. 2011, 33, 402–410. [Google Scholar] [CrossRef]
- Kow, K.W.; Wong, Y.W.; Rajkumar, R.K.; Rajkuma, R.K. A review on performance of artificial intelligence and conventional method in mitigating PV grid-tied related power quality events. Renew. Sustain. Energy Rev. 2016, 56, 334–346. [Google Scholar] [CrossRef]
- Misak, S.; Stuchly, J.; Vantuch, T.; Burianek, T.; Prokop, L. A holistic approach to power quality parameter optimization in AC coupling off-grid systems. Electr. Power Syst. Res. 2017, 147, 165–173. [Google Scholar] [CrossRef]
- Kusiak, A.; Zheng, H. Optimization of wind turbine energy and power factor with an evolutionary computation algorithm. Energy 2010, 35, 1324–1332. [Google Scholar] [CrossRef]
- Melício, R.; Mendes, V.; Catalão, J. Comparative study of power converter topologies and control strategies for the harmonic performance of variable-speed wind turbine generator systems. Energy 2011, 36, 520–529. [Google Scholar] [CrossRef]
- Montoya, F.G.; Alcayde, A.; Baños, R.; Manzano-Agugliaro, F. A fast method for identifying worldwide scientific collaborations using the Scopus database. Telemat. Inform. 2018, 35, 168–185. [Google Scholar] [CrossRef]
- Chadegani, A.A.; Salehi, H.; Yunus, M.M.; Farhadi, H.; Fooladi, M.; Farhadi, M.; Ebrahim, N.A. A Comparison between Two Main Academic Literature Collections: Web of Science and Scopus Databases. Asian Soc. Sci. 2013, 9, 18–26. [Google Scholar] [CrossRef]
- Choi, J.; Yib, S.; Lee, K.C. Analysis of keyword networks in MIS research and implications for predicting knowledge evolution. Inf. Manag. 2011, 48, 371–381. [Google Scholar] [CrossRef]
- Li, L.L.; Ding, G.; Feng, N.; Wang, M.H.; Ho, Y.S. Global stem cell research trend: bibliometric analysis as a tool for mapping of trends from 1991 to 2006. Scientometrics 2009, 80, 39–58. [Google Scholar] [CrossRef]
- Oracle. Json. Available online: http://www.json.org (accessed on 2 August 2018).
- Valderrama-Zurián, J.C.; Aguilar-Moya, R.; Melero-Fuentes, D.; Aleixandre-Benavent, R. A systematic analysis of duplicate records in Scopus. J. Informetr. 2015, 9, 570–576. [Google Scholar] [CrossRef]
- Franceschini, F.; Maisano, D.; Mastrogiacomo, L. Empirical analysis and classification of database errors in Scopus and Web of Science. J. Informetr. 2016, 10, 933–953. [Google Scholar] [CrossRef]
- Google. OpenRefine. Available online: http://openrefine.org/ (accessed on 2 August 2018).
- Baxter, R.; Christen, P.; Churches, T. A comparison of fast blocking methods for record linkage. ACM SIGKDD. Citeseer 2003, 3, 25–27. [Google Scholar]
- Jin, L.; Li, C.; Mehrotra, S. Efficient record linkage in large data sets. Database Systems for Advanced Applications, 2003.(DASFAA 2003). In Proceedings of the Eighth International Conference on Database Systems for Advanced Applications, 2003, Kyoto, Japan, 26–28 March 2003; pp. 137–146. [Google Scholar]
- Cavnar, W.B.; Trenkle, J.M. N-gram-based text categorization. Ann Arbor MI 1994, 48113, 161–175. [Google Scholar]
- Montoya, F.G.; Montoya, M.G.; Gómez, J.; Manzano-Agugliaro, F.; Alameda-Hernández, E. The research on energy in Spain: A scientometric approach. Renew. Sustain. Energy Rev. 2014, 29, 173–183. [Google Scholar] [CrossRef]
- Bastian, M.; Heymann, S.; Jacomy, M. Gephi: An open source software for exploring and manipulating networks. In Proceedings of the Third International ICWSM Conference (2009), San Jose, CA, USA, 17–20 May 2009; pp. 361–362. [Google Scholar]
- Boden, B.; Haag, R.; Seidl, T. Detecting and exploring clusters in attributed graphs: A plugin for the gephi platform. In Proceedings of the 22nd ACM International Conference on Information & Knowledge Management, New York, NY, USA, 27 October–1 November 2013; pp. 2505–2508. [Google Scholar]
- Bruns, A. How long is a tweet? Mapping dynamic conversation networks on Twitter using Gawk and Gephi. Inf. Commun. Soc. 2012, 15, 1323–1351. [Google Scholar] [CrossRef]
- Jacomy, M.; Venturini, T.; Heymann, S.; Bastian, M. ForceAtlas2, a continuous graph layout algorithm for handy network visualization designed for the Gephi software. PLoS ONE 2014, 9, e98679. [Google Scholar] [CrossRef] [PubMed]
- Daňa, J.; Ráček, J. Analysis of Czech actors’ cooperation network using Gephi. In Proceedings of the the 18th International Conference on Information Technology for Practice, Ostrava, Czech Republic, 8–9 October 2015; pp. 33–38. [Google Scholar]
- Fortunato, S. Community detection in graphs. Phys. Rep. 2010, 486, 75–174. [Google Scholar] [CrossRef]
- Altbach, P.G.; Knight, J. The internationalization of higher education: Motivations and realities. J. Stud. Int. Educ. 2007, 11, 290–305. [Google Scholar] [CrossRef]
- Kwiek, M. The Internationalization of Research in Europe A Quantitative Study of 11 National Systems From a Micro-Level Perspective. J. Stud. Int. Educ. 2015, 341–359. [Google Scholar] [CrossRef]
- Uddin, S.; Hossain, L.; Rasmussen, K. Network effects on scientific collaborations. PLoS ONE 2013, 8, e57546. [Google Scholar] [CrossRef] [PubMed]
© 2018 by the authors. Licensee MDPI, Basel, Switzerland. This article is an open access article distributed under the terms and conditions of the Creative Commons Attribution (CC BY) license (http://creativecommons.org/licenses/by/4.0/).