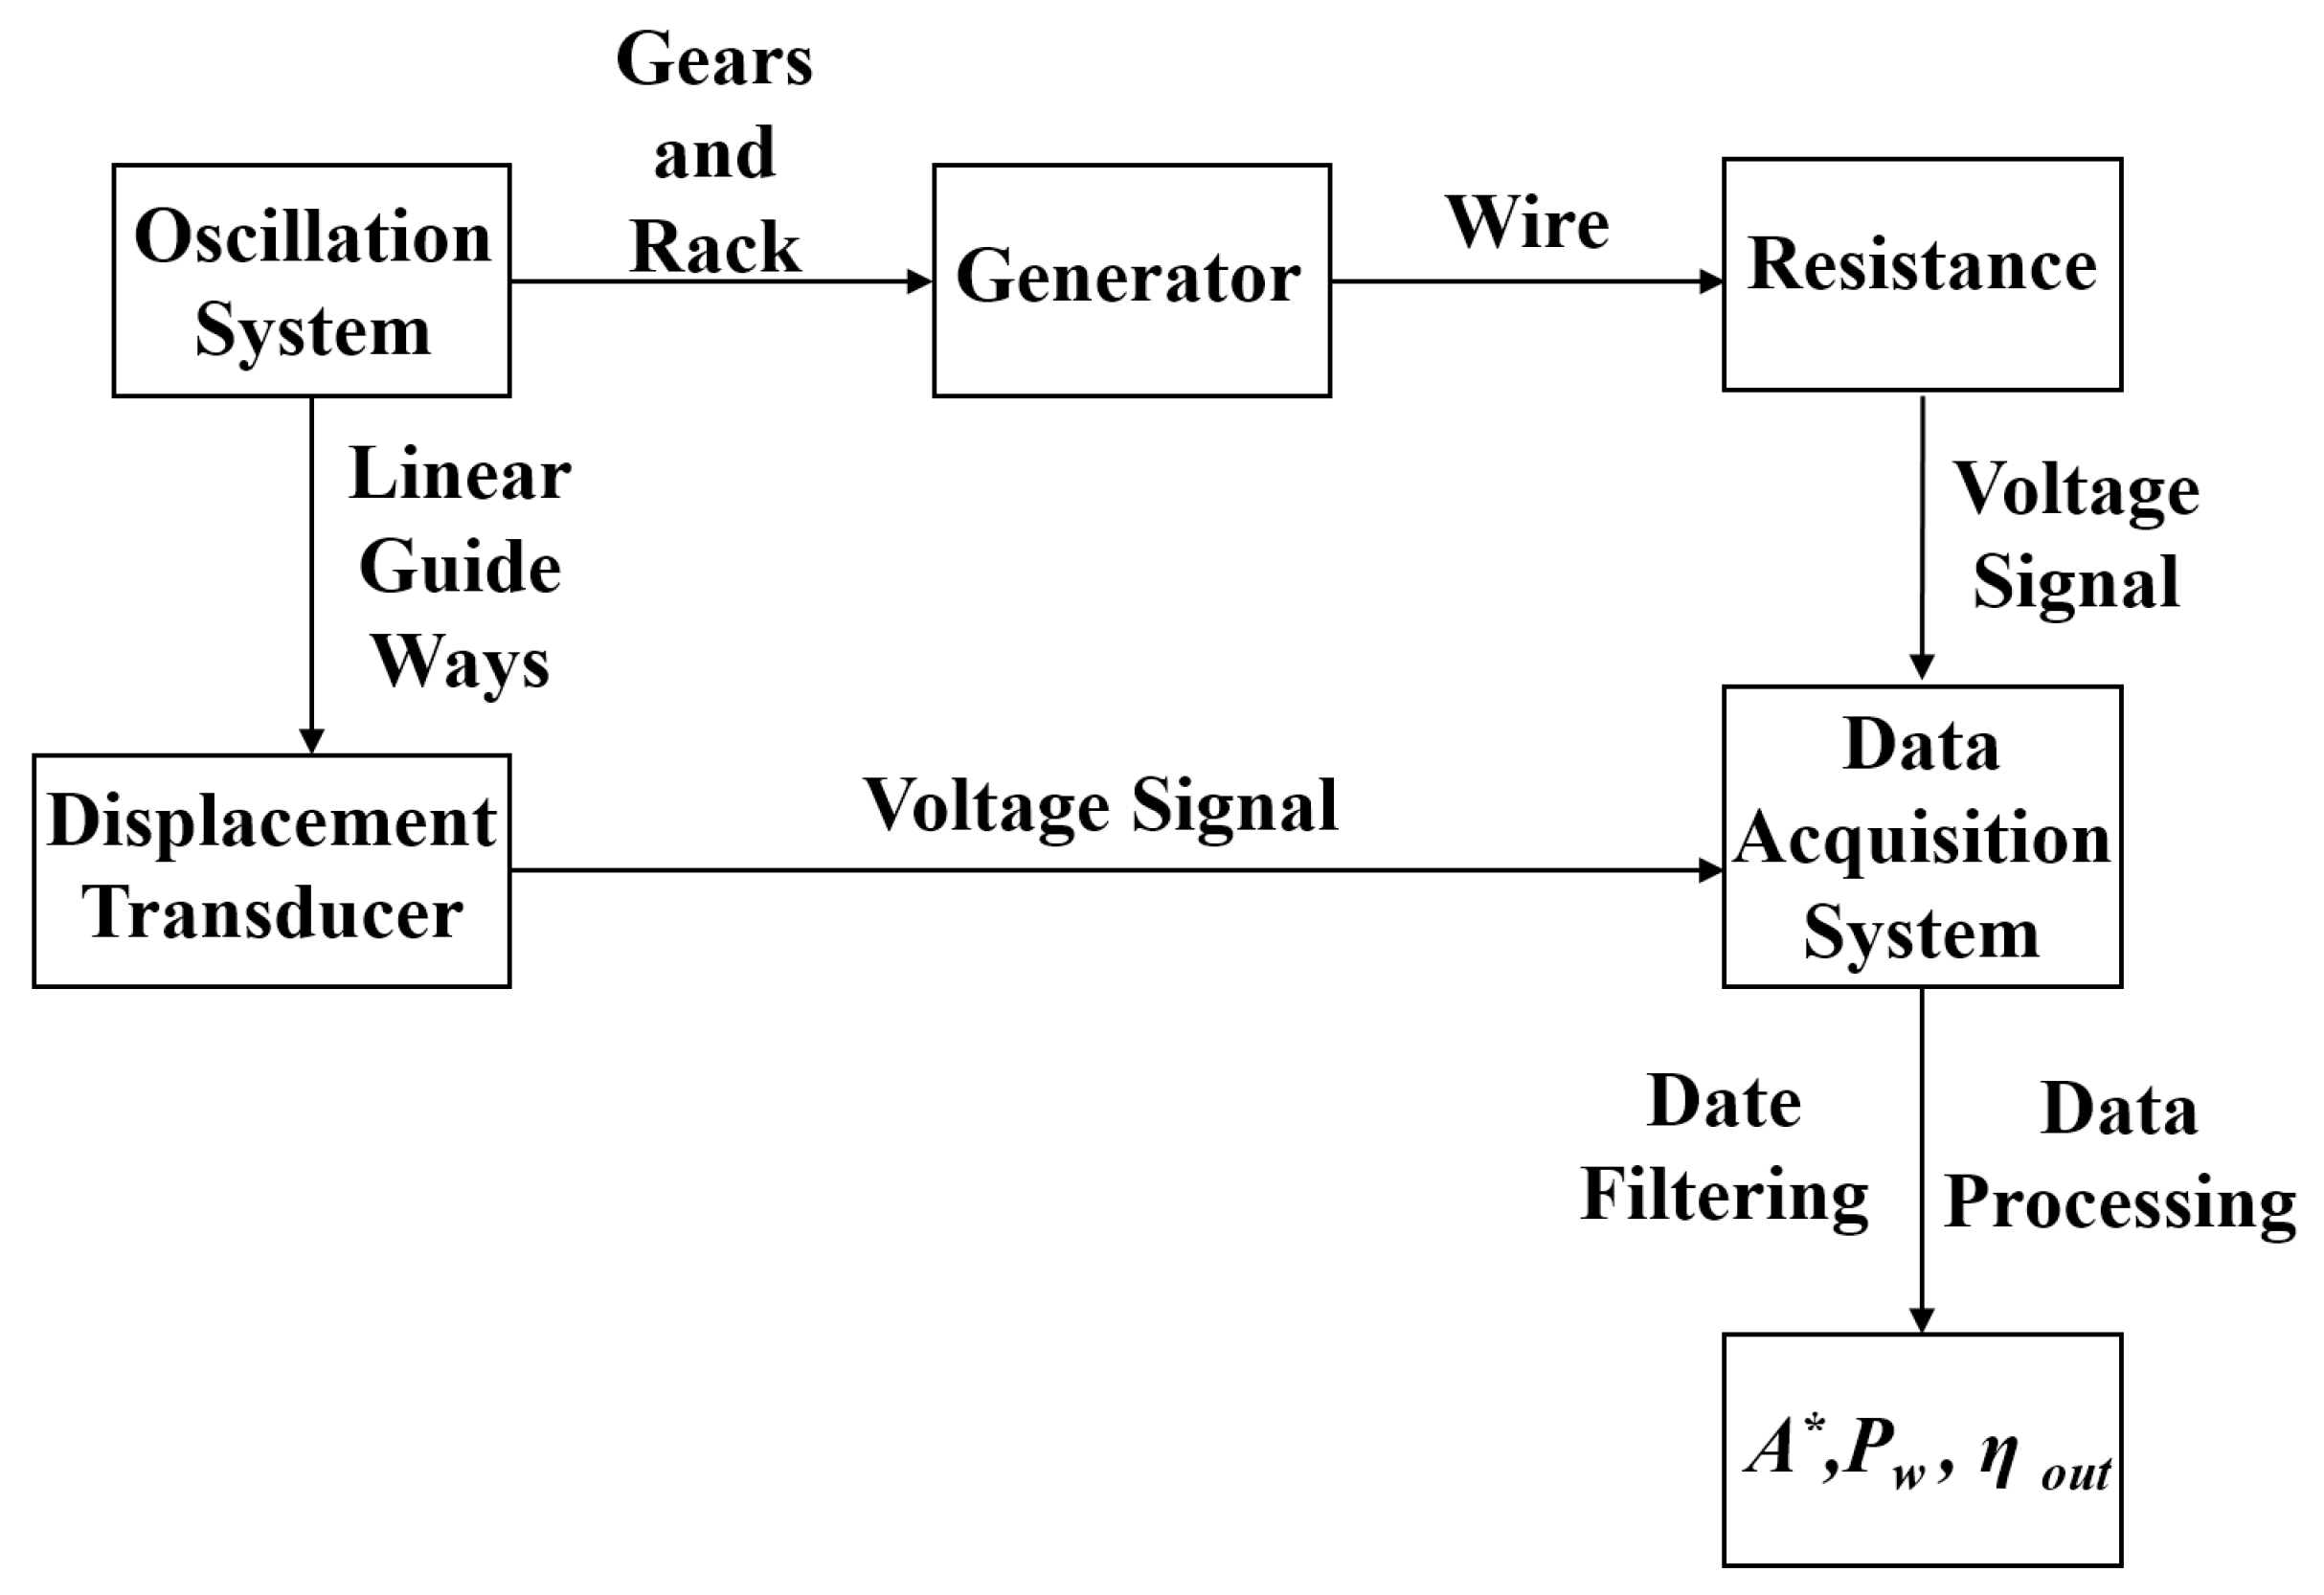
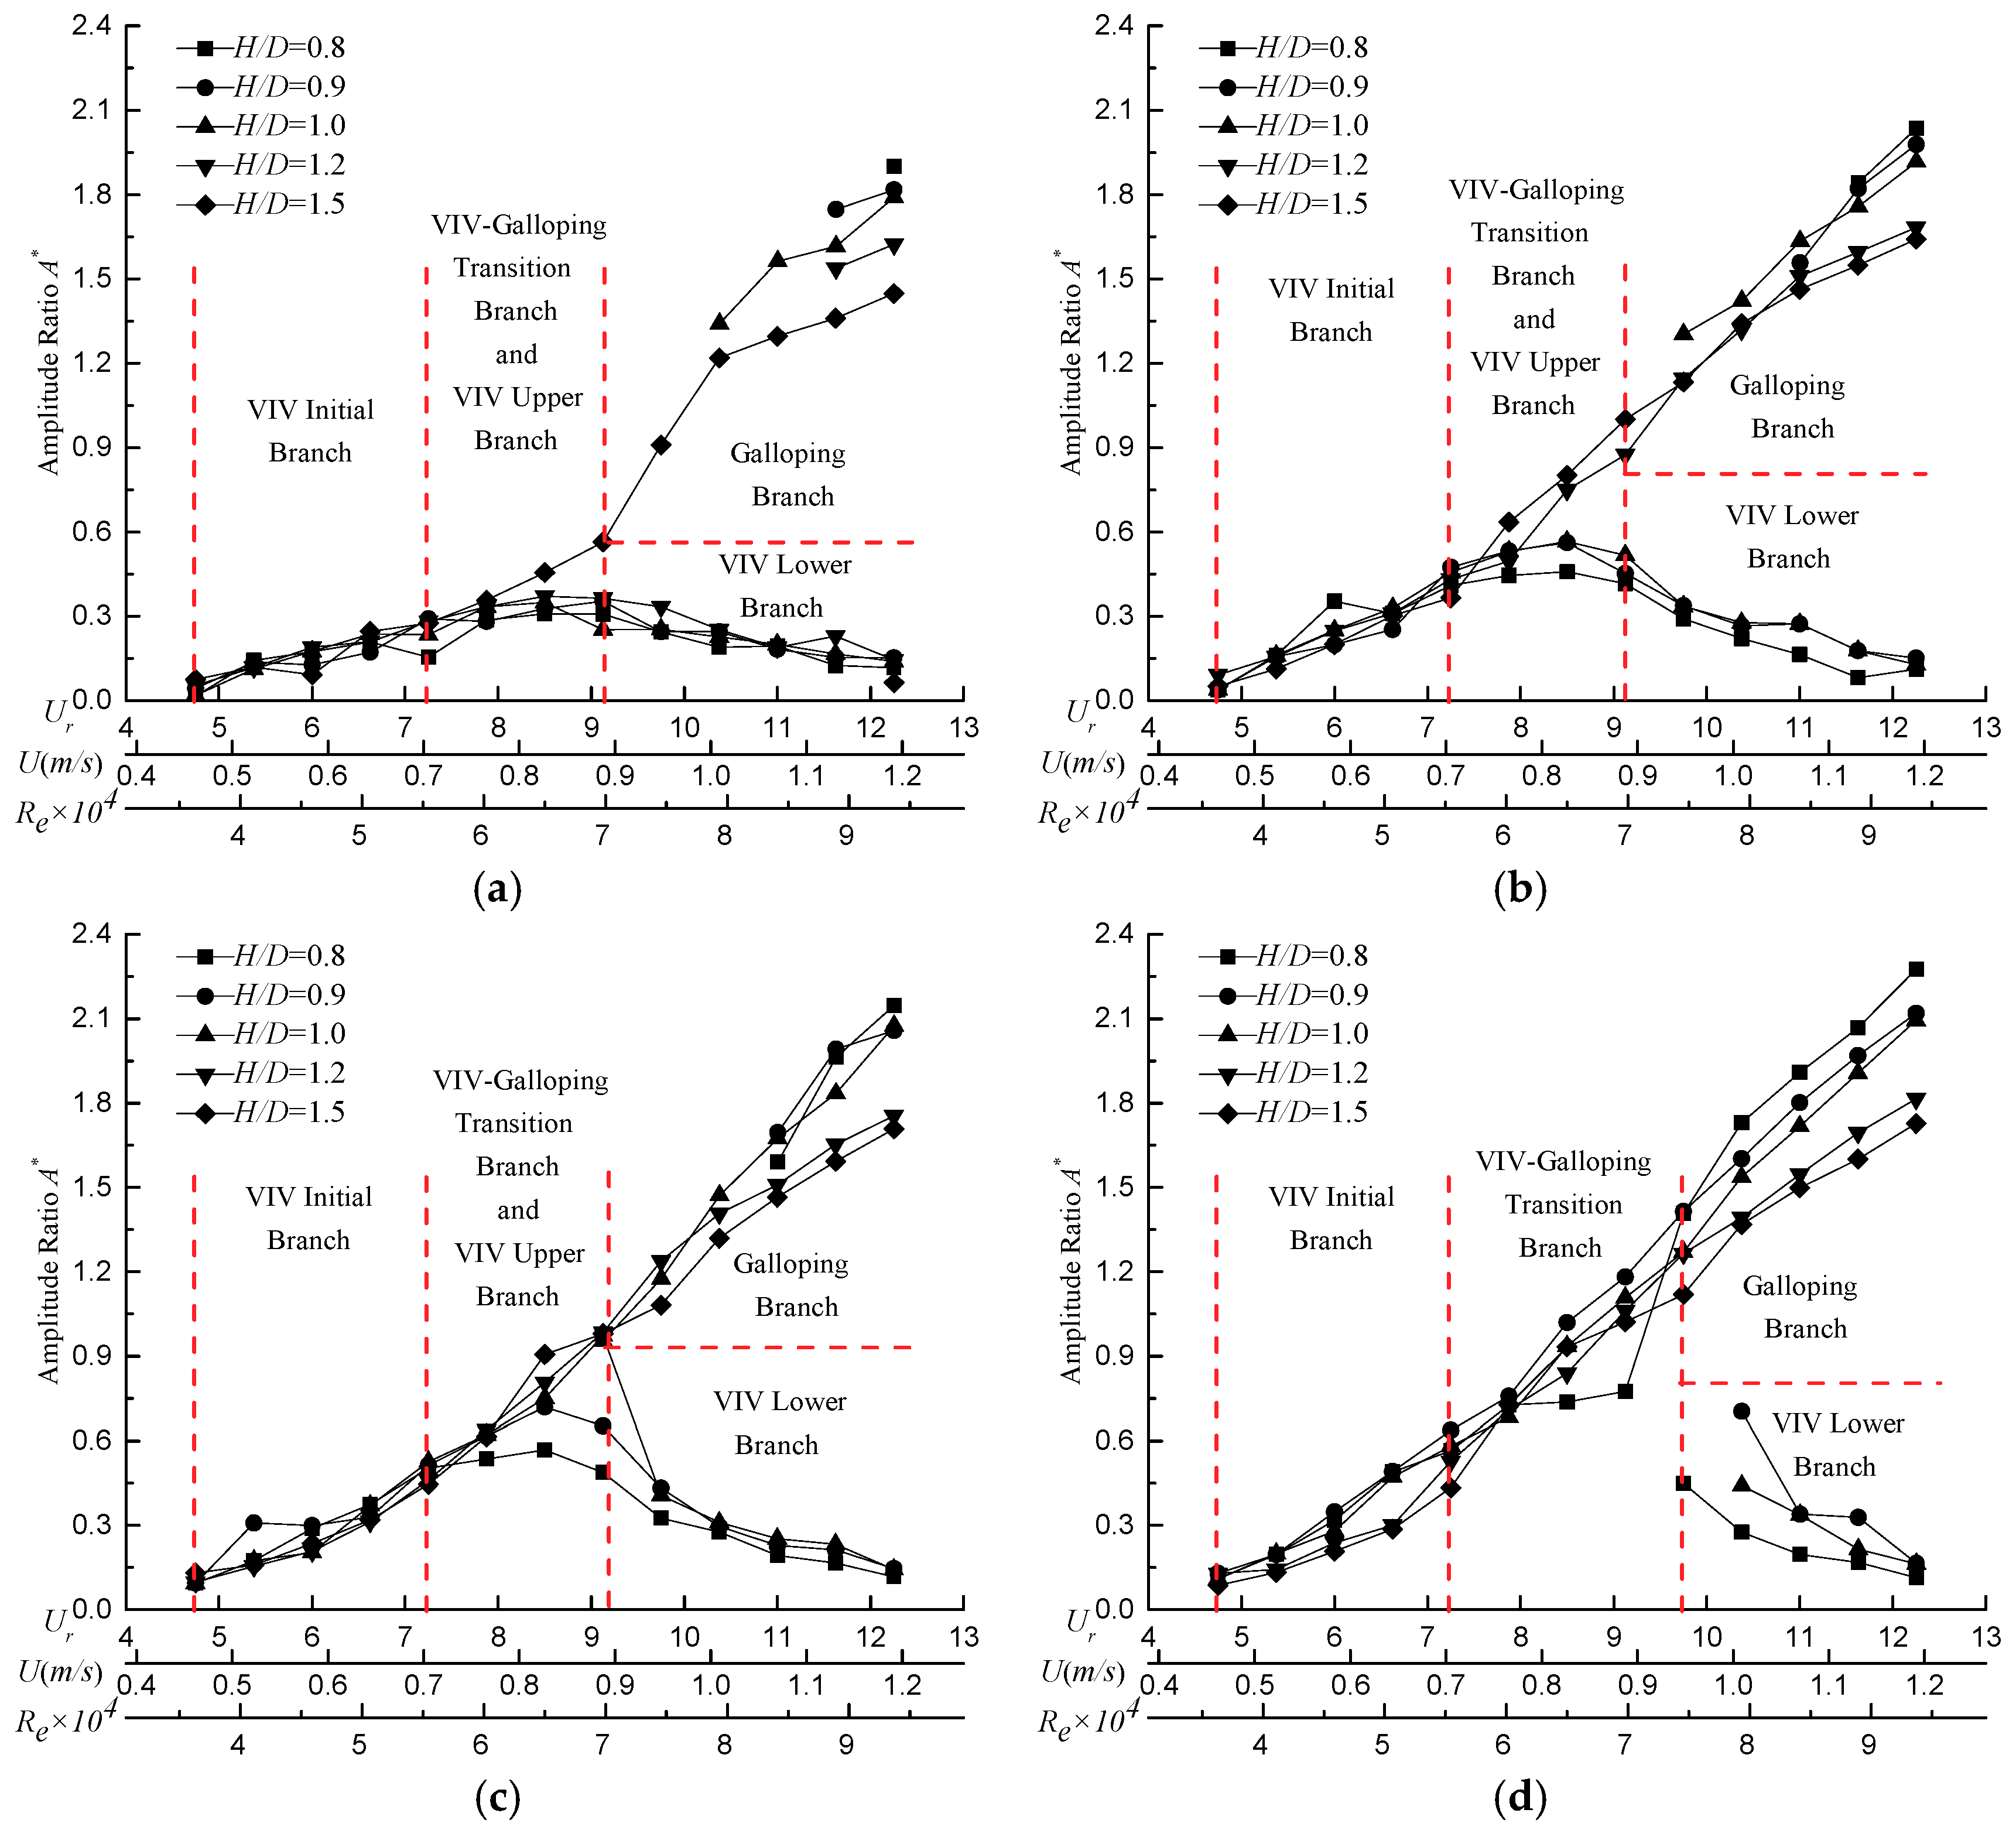
3.1.1. Amplitudes and Frequencies
To explore the FIM performances of the T-section prism in water, a series of FIM tests with 10 different
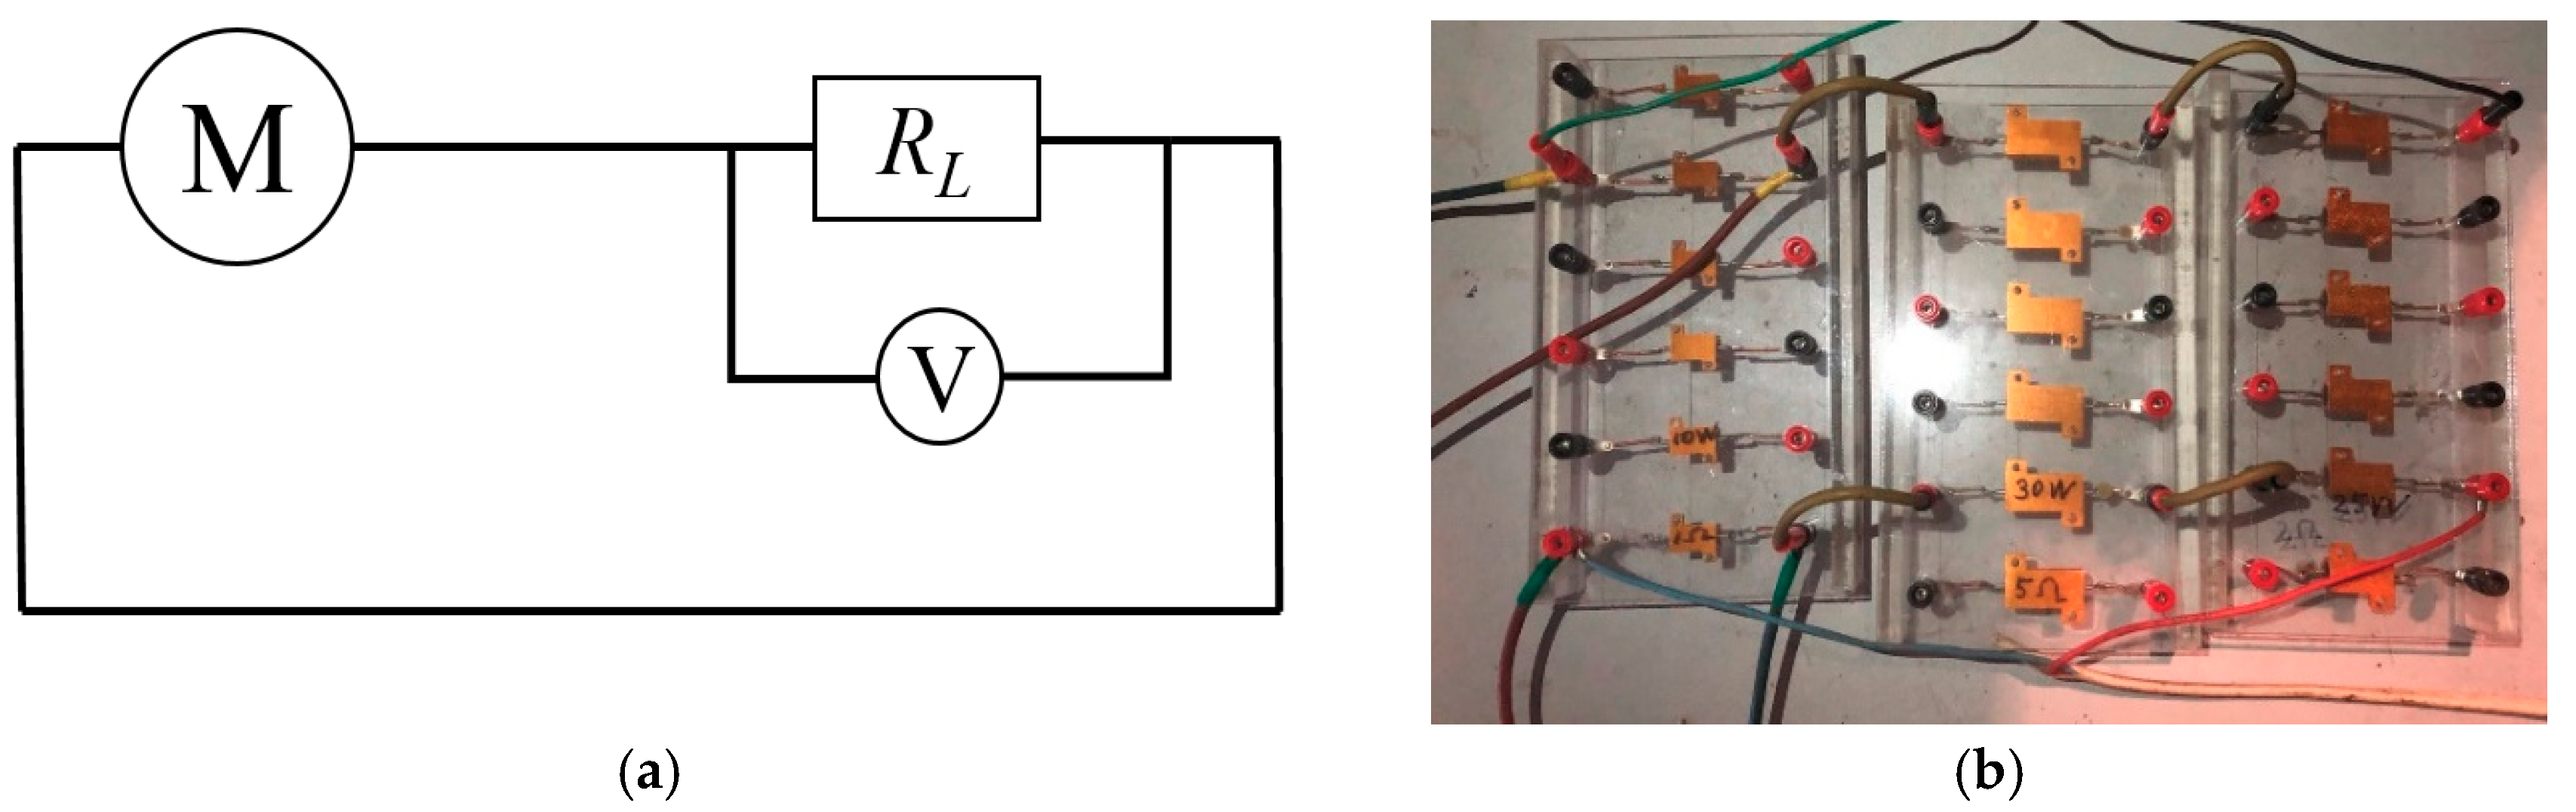
RL were carried out at
K = 1400 N/m (as seen in
Section 2.4). In
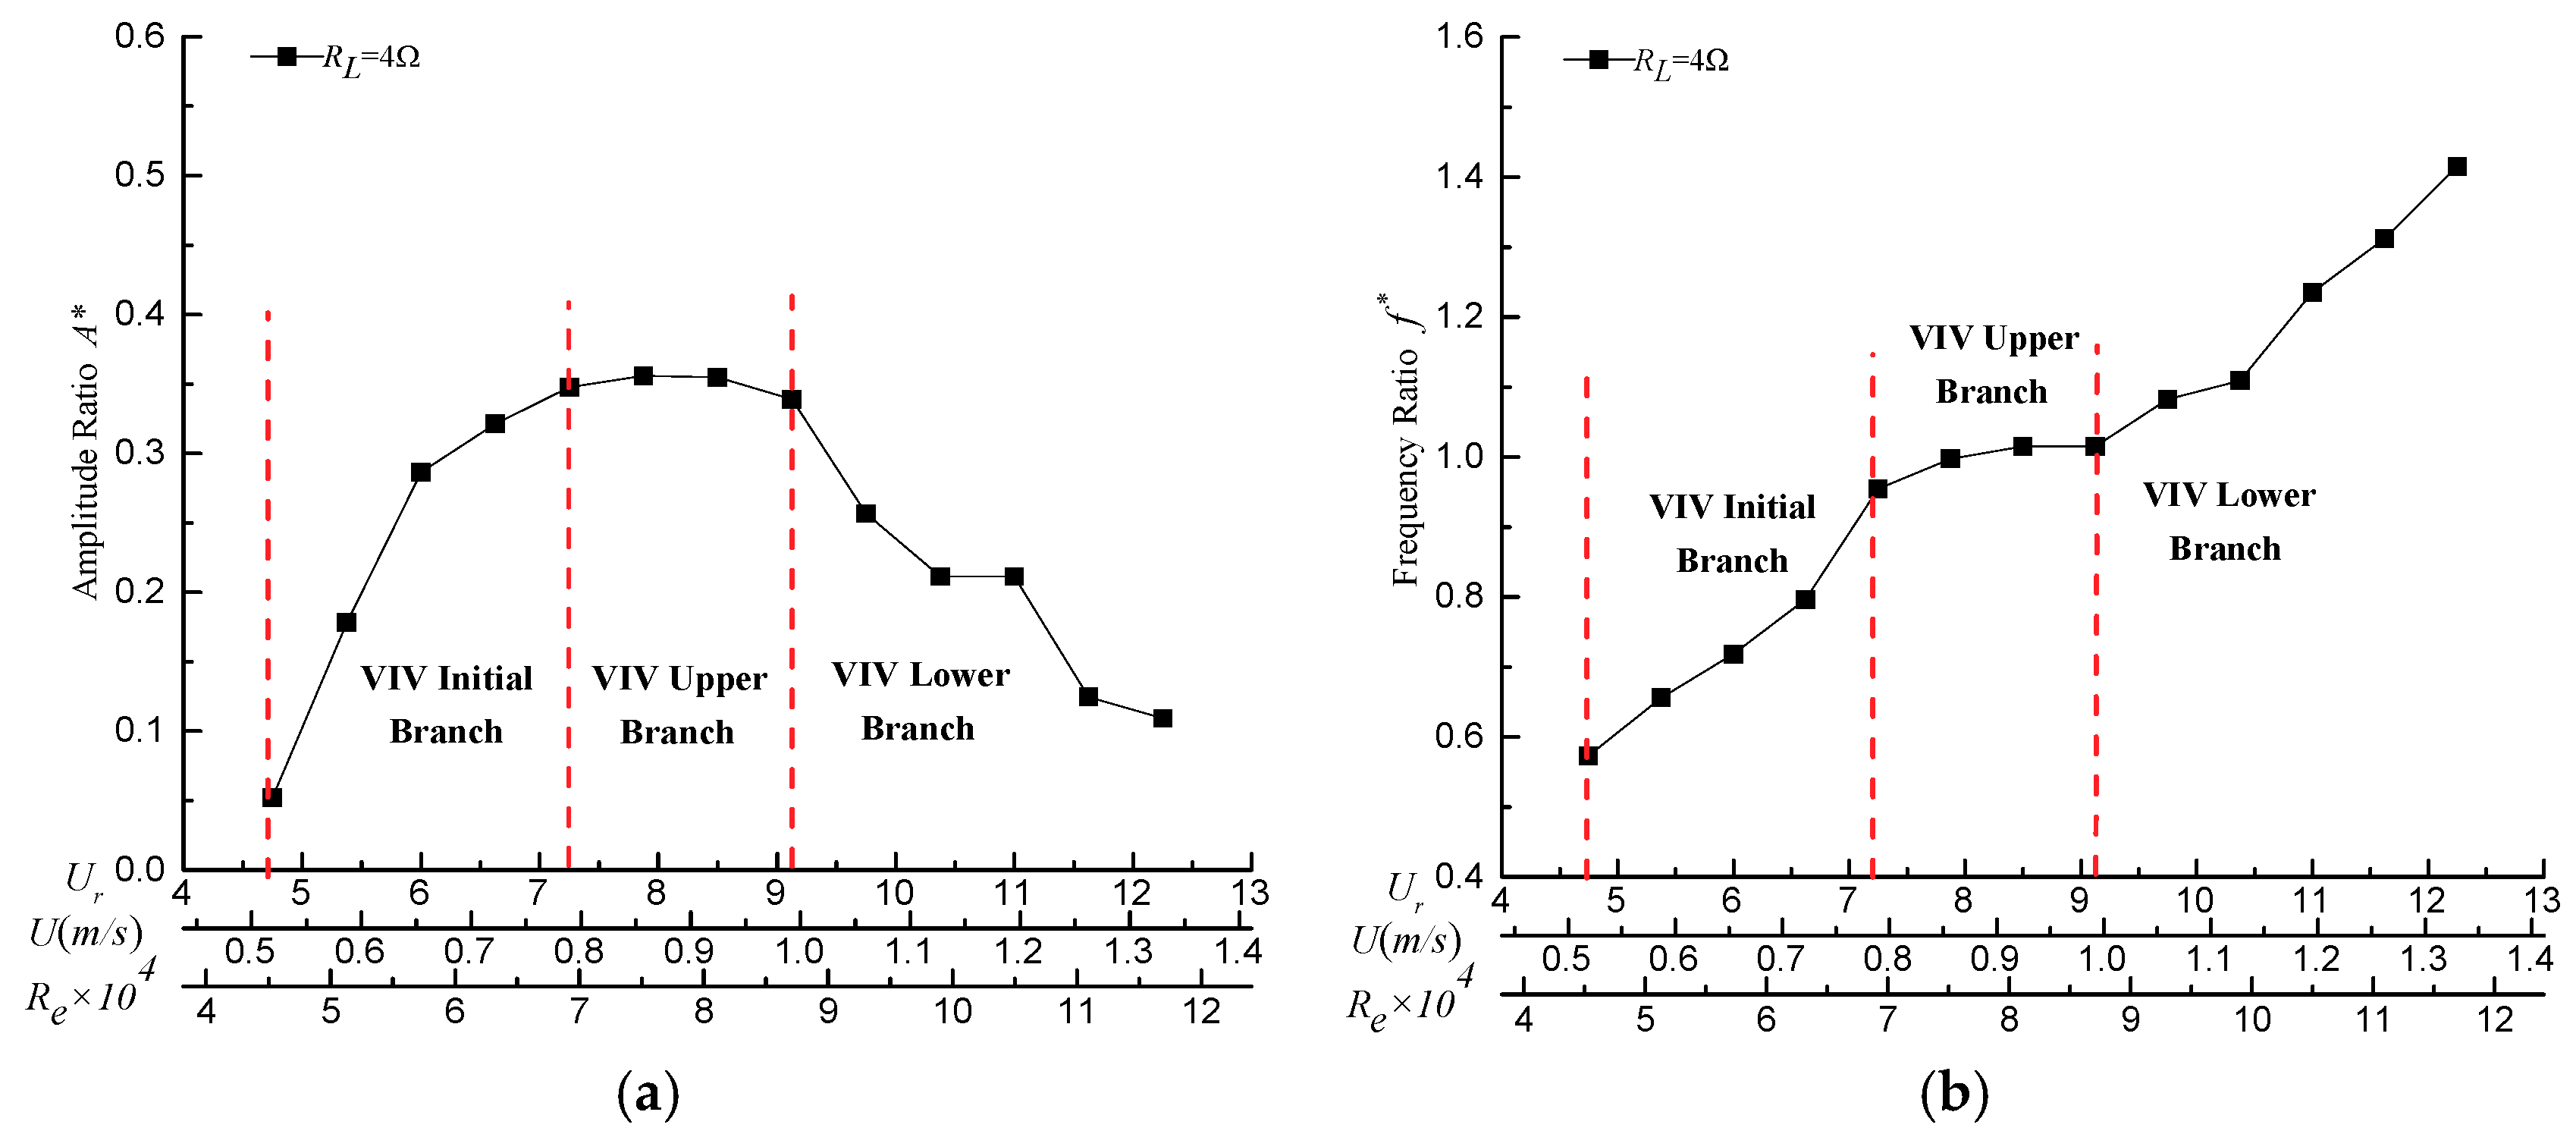
Figure 8a,
A* is the amplitude ratio (
A* =
A/D),
A denotes the average amplitude of continuous oscillation for 30 s,
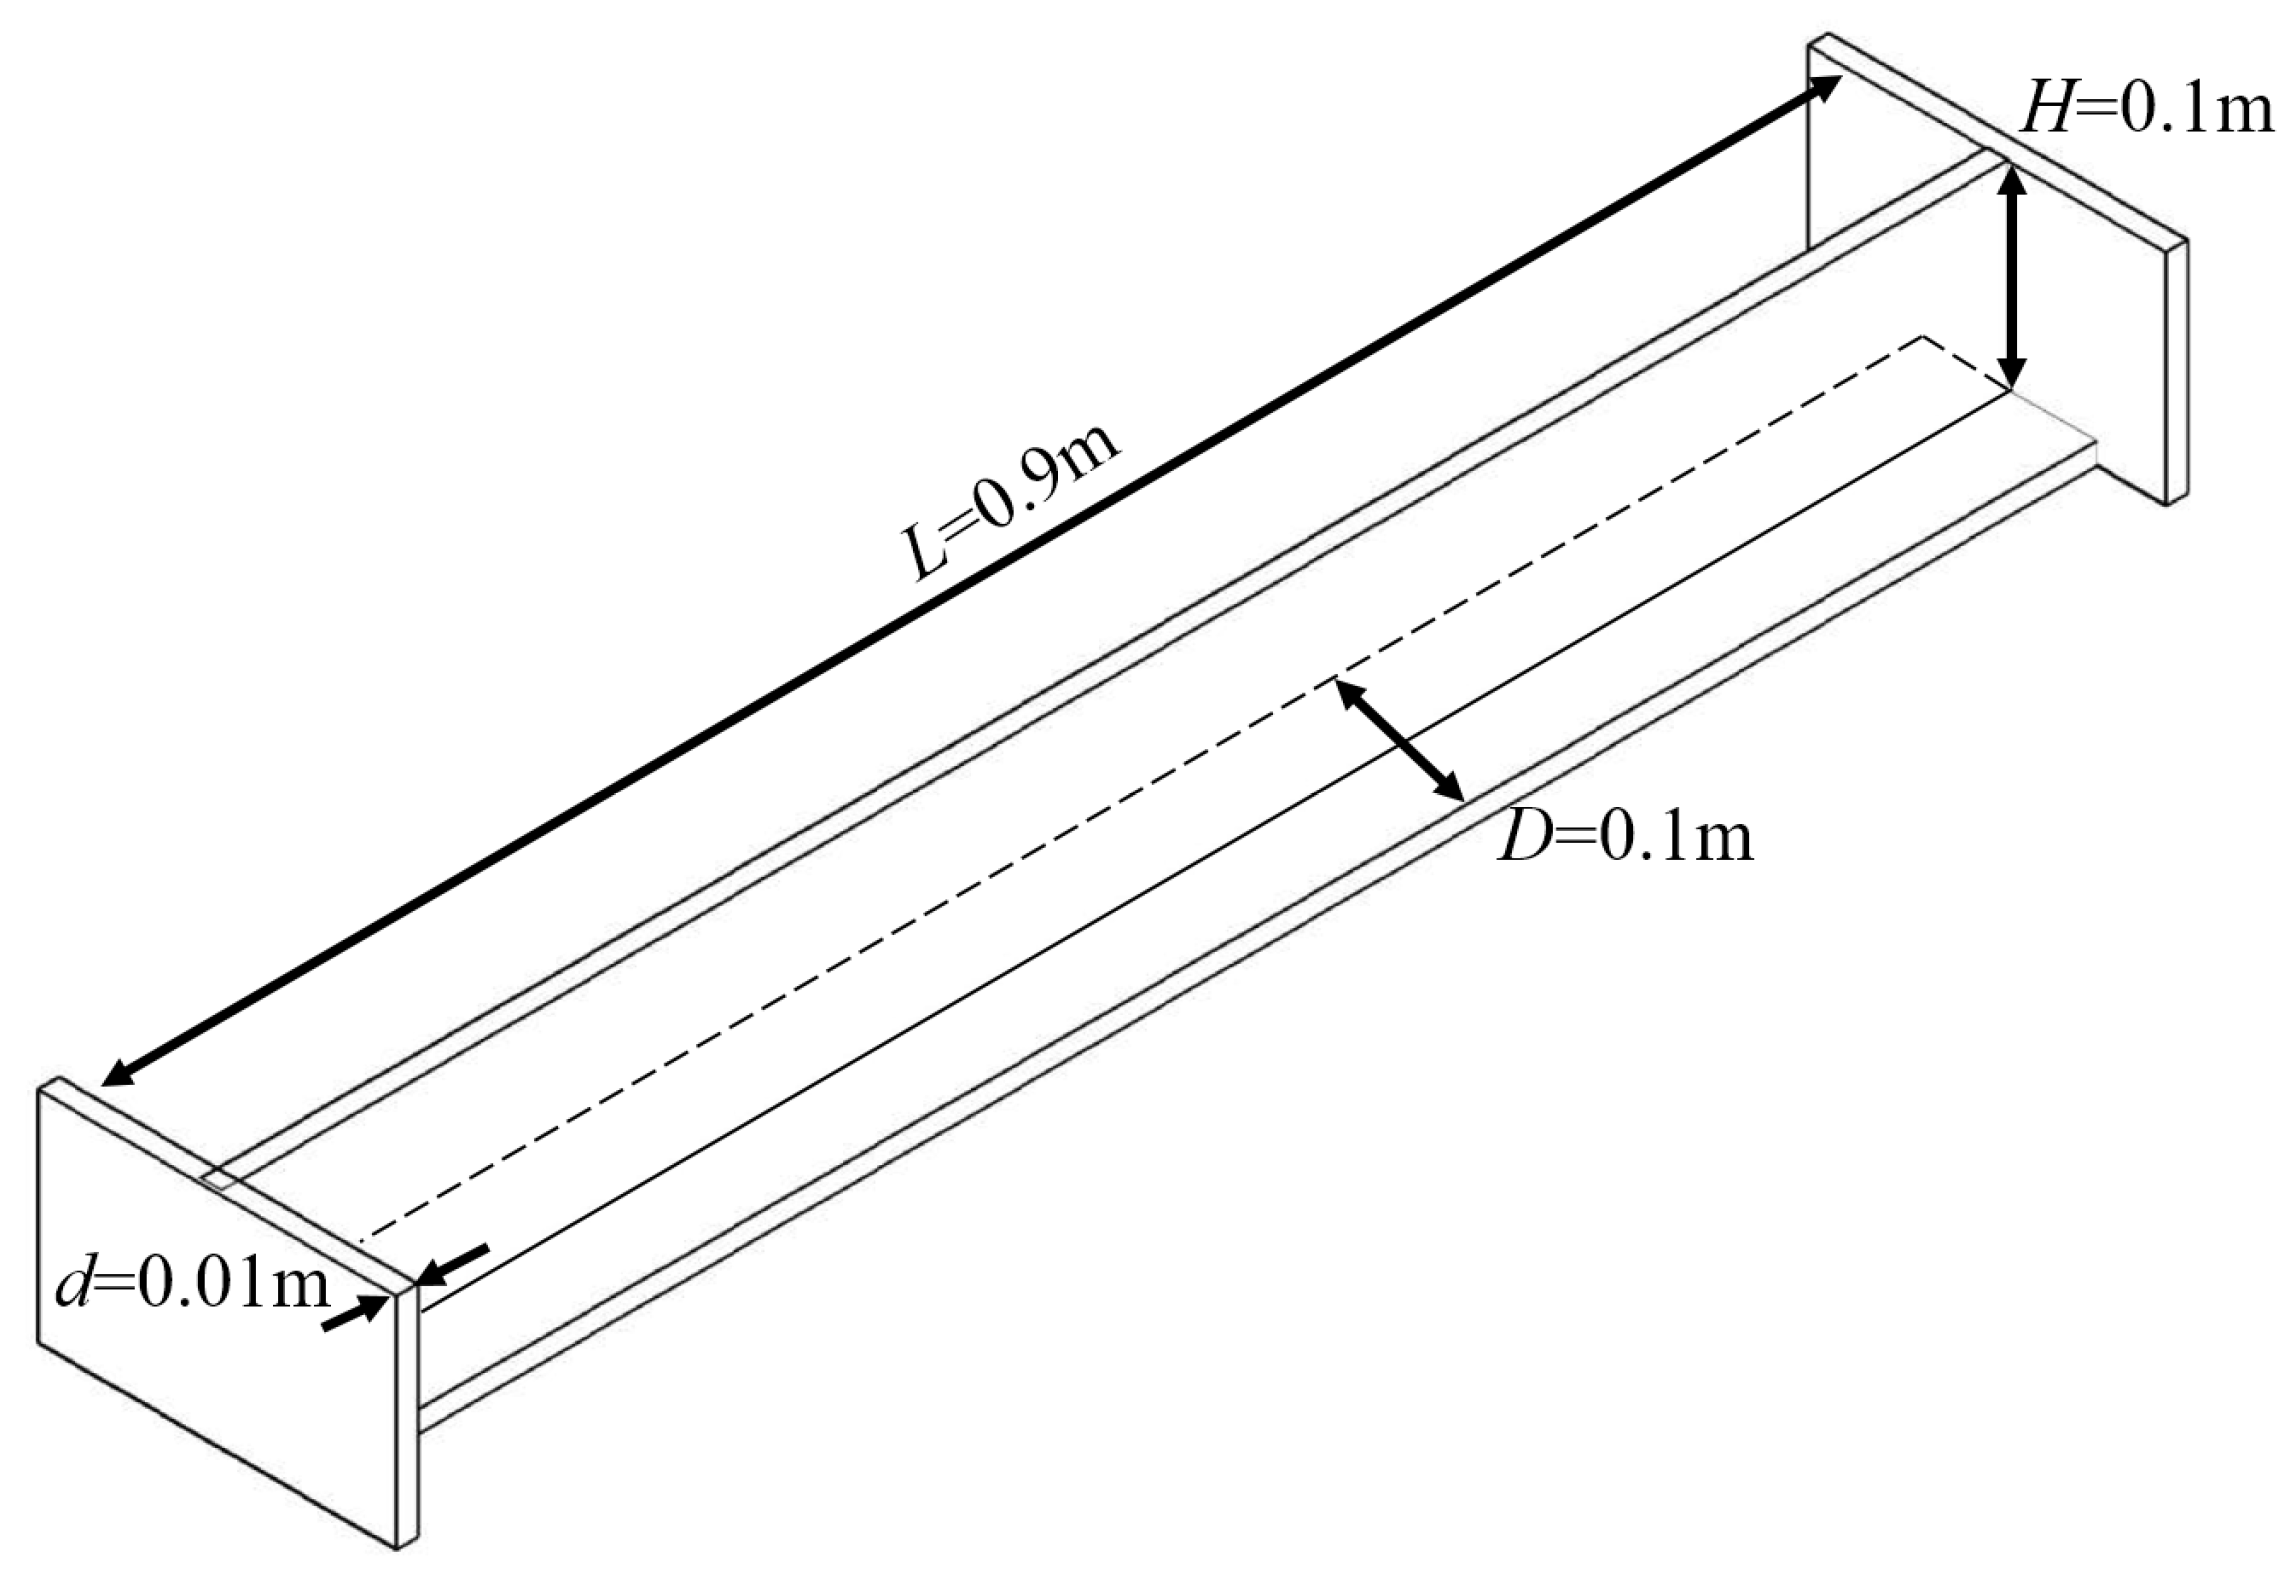
D is the projection width of the T-section prism in the direction of the incoming flow,
Ur is the reduced velocity (
Ur =
U/(
D·
fn)),
U is the incoming flow velocity, and
fn is the natural frequency in air. In
Figure 8b,
f* is the frequency ratio (
f* =
fosc/
fn), and
fosc is the main frequency of oscillation obtained from the displacement time-history curves by the Fast Fourier Transformation (FFT) method.
A* and
f* vary with
Ur;
U and the Reynolds number
Re for all
RL cases are plotted in
Figure 8,
Figure 9,
Figure 10 and
Figure 11, respectively.
(1) VIV: For
RL = 4 Ω (ζ = 0.347), the T-section prism was only characterized by the typical VIV in the range of 4.75 ≤
Ur ≤ 12.25 (shown in
Figure 8), and the prism did not present any signs of galloping. For 4.75 ≤
Ur ≤ 7.25,
A* and
f* were small but increased rapidly, indicating that the prism underwent the VIV initial branch. The motion of the prism was induced by vortex shedding, but the oscillation and vortex shedding were not synchronized well. For 7.25 ≤
Ur ≤ 9.125,
A* stayed at 0.35, and
f* increased sharply and was maintained at approximately 1. The oscillation entered the VIV upper branch (lock-in range), which was more stable than the VIV initial branch. For
Ur ≥ 9.125,
A* rapidly collapsed down to about 0.1, and
f* increased rapidly to a high level (
f* >> 1). In this range, the oscillation and vortex shedding were not synchronized well, demonstrating that the prism underwent the VIV lower branch.
(2) HG: For 8 Ω ≤
RL ≤ 13 Ω (0.208 ≤
ζ ≤ 0.305), two modes of motion could be observed in the response of the prism (shown in
Figure 9). If the prism oscillated freely (without any external forces acting on the prism), the prism underwent complete VIV responses as
Ur increased or decreased in the range of 4.75 ≤
Ur ≤ 12.25. However, when
Ur decreased from 12.25 and the prism was manually pushed by a threshold initial displacement (exceeding 1 × D), the prism first entered the galloping branch, accompanied by a large amplitude (
A* ≈ 2.3) and a stable frequency (
f* = 0.7). As
Ur decreased,
A* decreased gradually and the oscillation was still in the galloping branch. When
Ur reached 11–11.625, the oscillation was suddenly suppressed, and the oscillation mode transformed from galloping to VIV (lower branch), accompanied by a sudden collapse in
A* from 1.8 to 0.2, and a sudden jump in
f* from 0.7 to 1. It was concluded that the prism cannot be self-excited from VIV to galloping in any case, without any external conditions (such as a threshold initial displacement) or forces acting on the prism, no matter whether the velocity decreases or increases, demonstrating that the prism experiences HG responses in these cases.
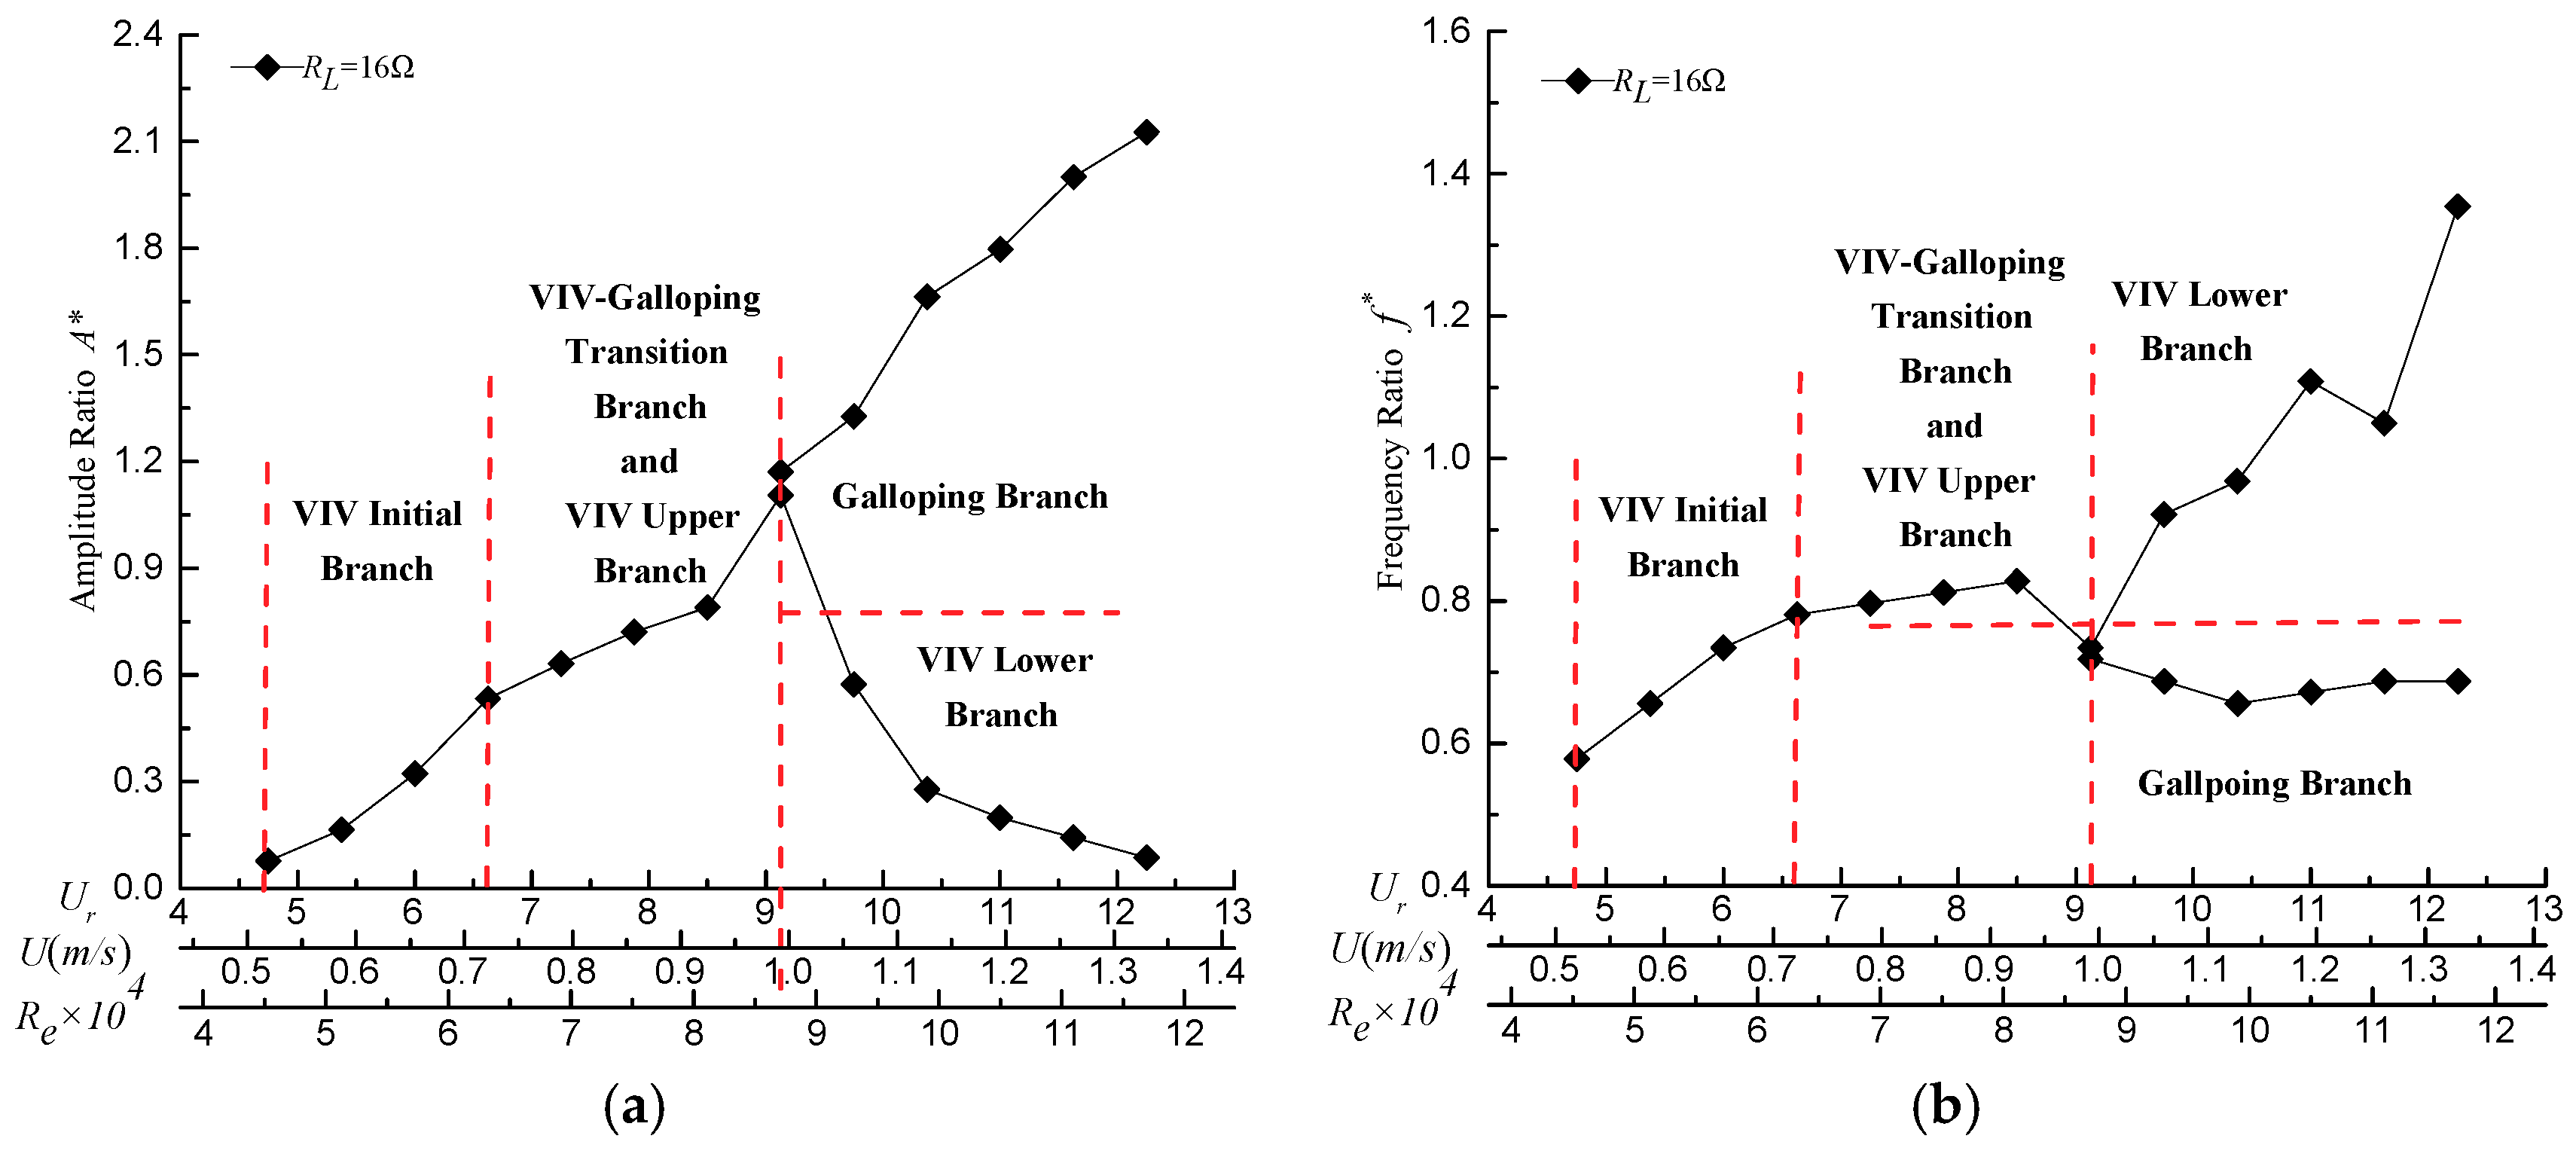
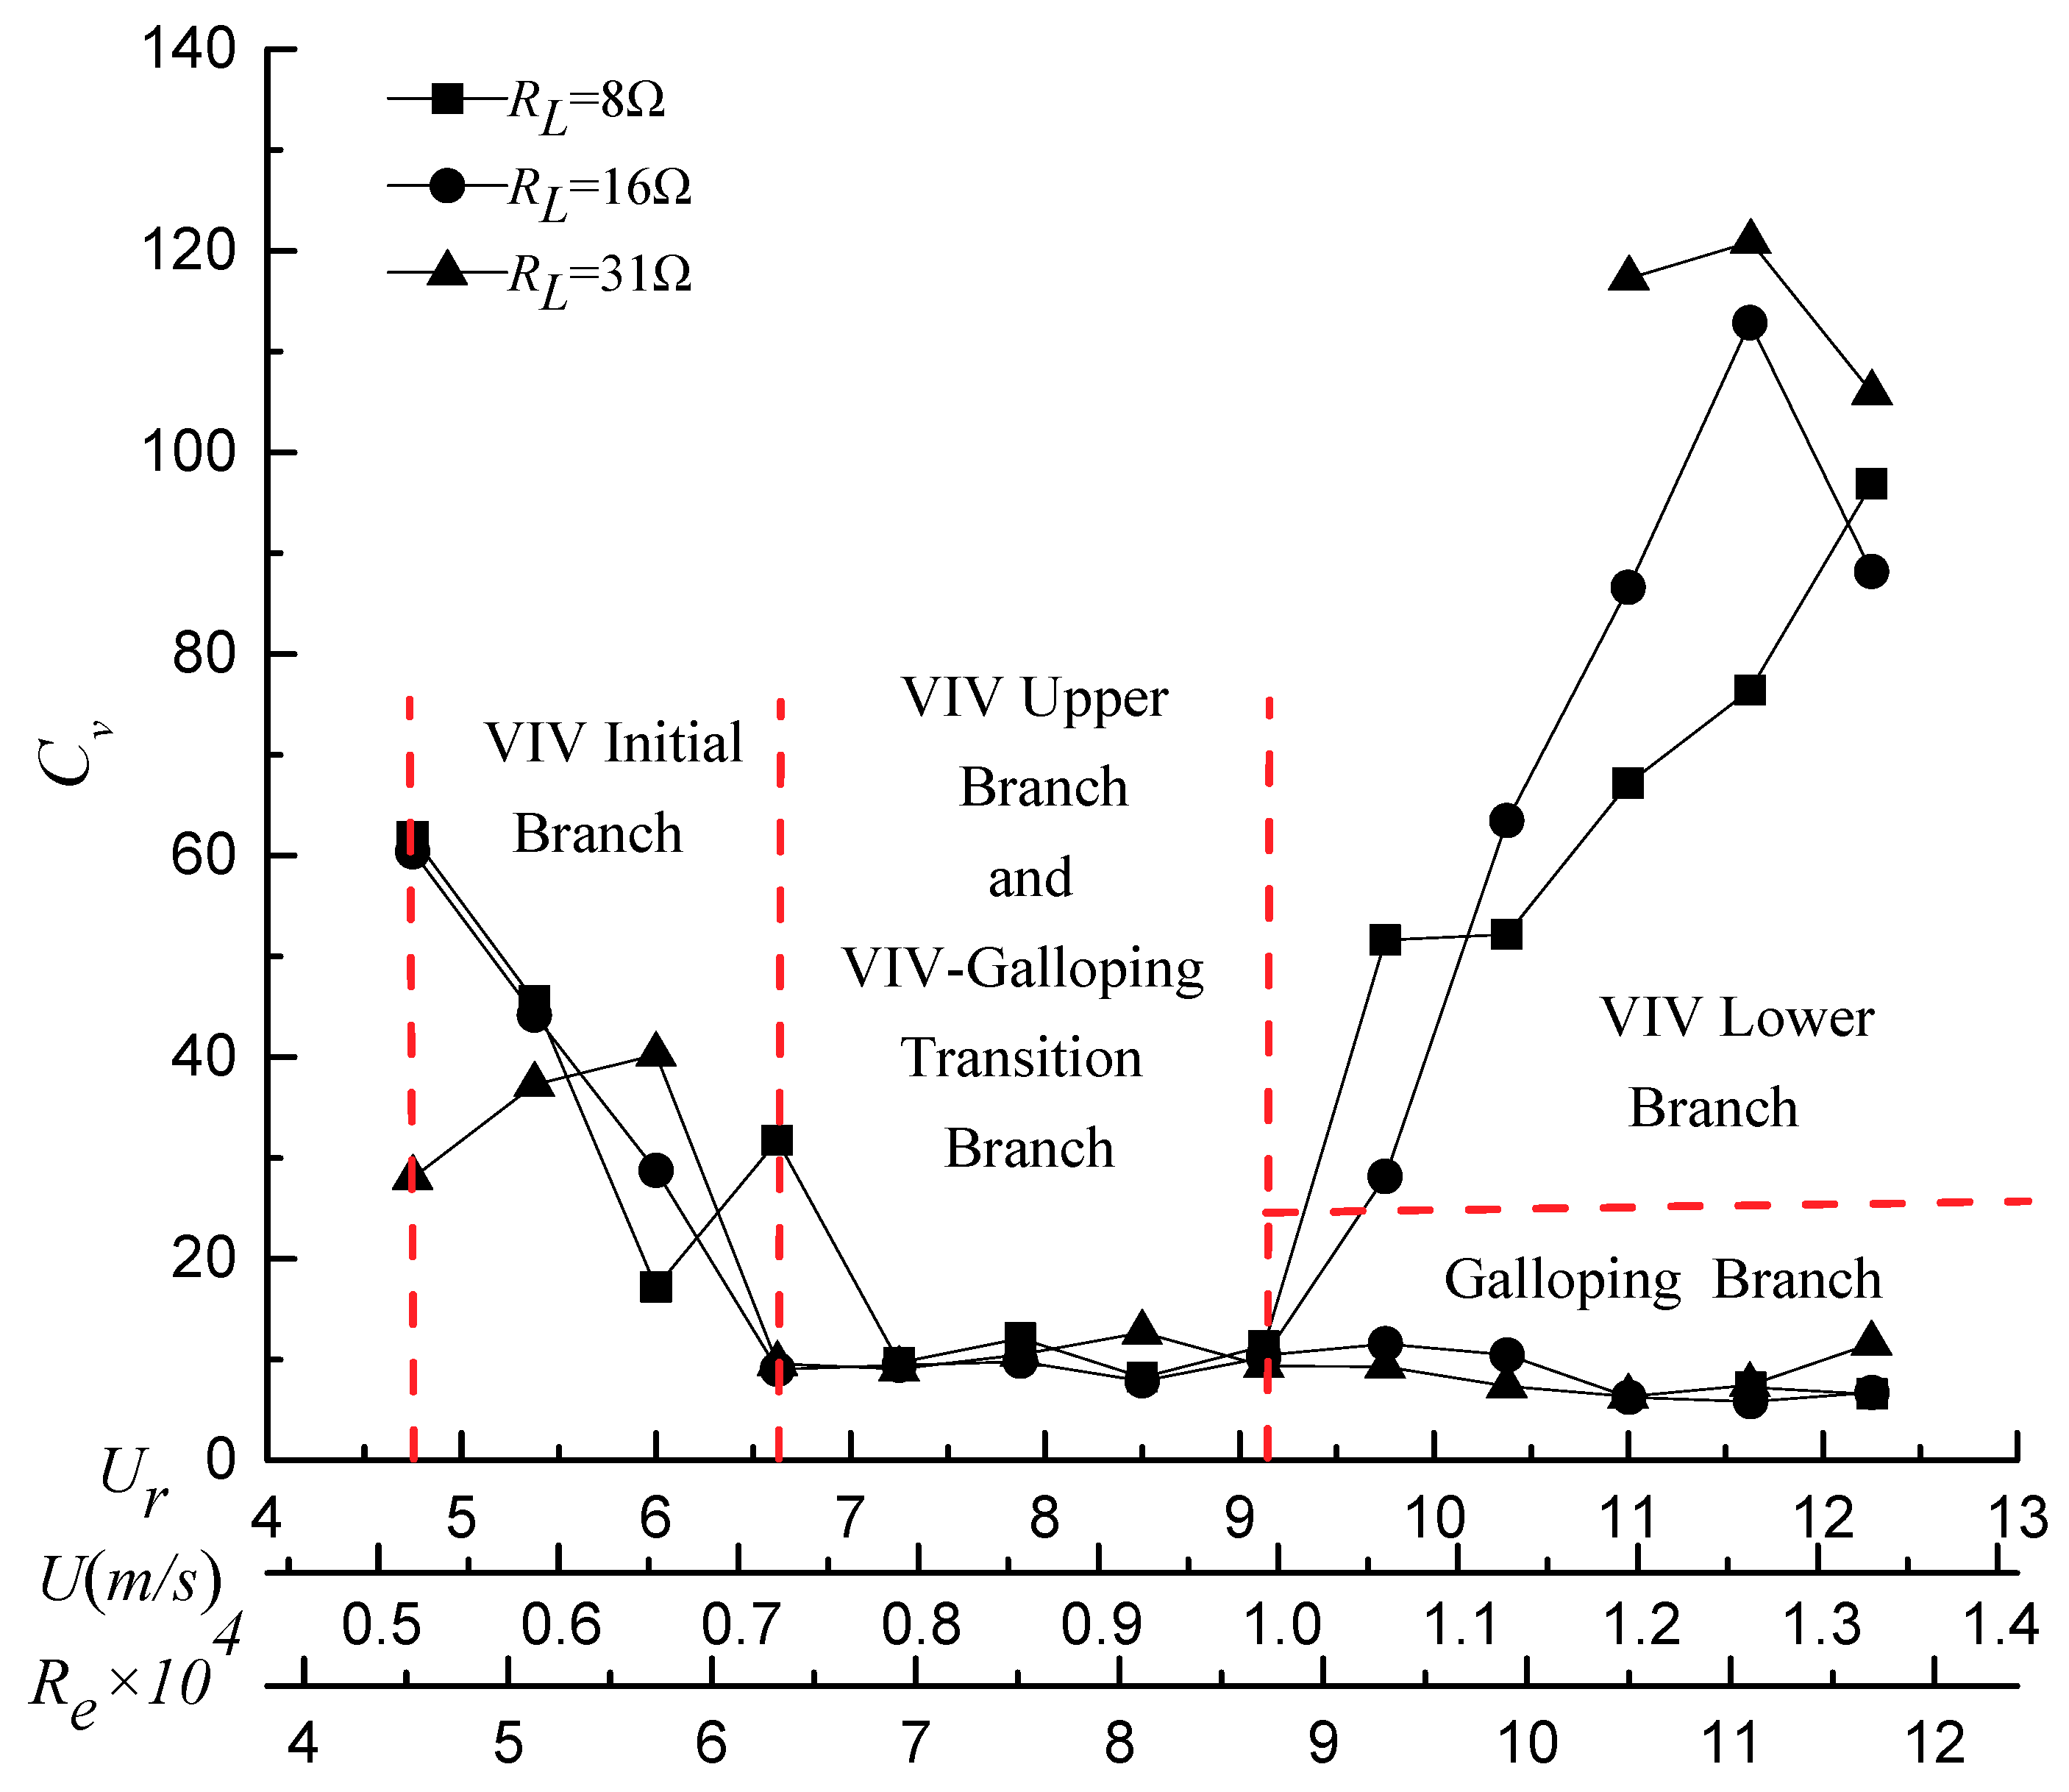
(3) Critical galloping (CG): For
RL = 16 Ω (
ζ = 0.177), the system presented both complete VIV responses and galloping while the two branches intersected (shown in
Figure 10). When
Ur increased from 4.75 to 12.25, the prism experienced a VIV initial branch, a VIV upper branch, and a VIV lower branch. If a threshold initial displacement was applied at
Ur = 12.25, the oscillation was suddenly enhanced, and the oscillation mode dramatically transformed from VIV (initial branch) to galloping, accompanied by a sudden jump in
A* from 0.08 to 2.12 as well as a sudden collapse in
f* from 1.35 to 0.68. Afterwards, the oscillation entered the galloping branch.
A* gradually decreased, with the decrease of
Ur, and
f* was maintained at about 0.7. No oscillation suppression phenomena occurred until the oscillation underwent the VIV upper branch where the intersection point was
Ur = 9.125. However, at
Ur ≥ 9.125, galloping could be induced by external excitation. This condition is actually a critical oscillation mode between HG and SG, which can be referred to as “critical galloping” (CG).
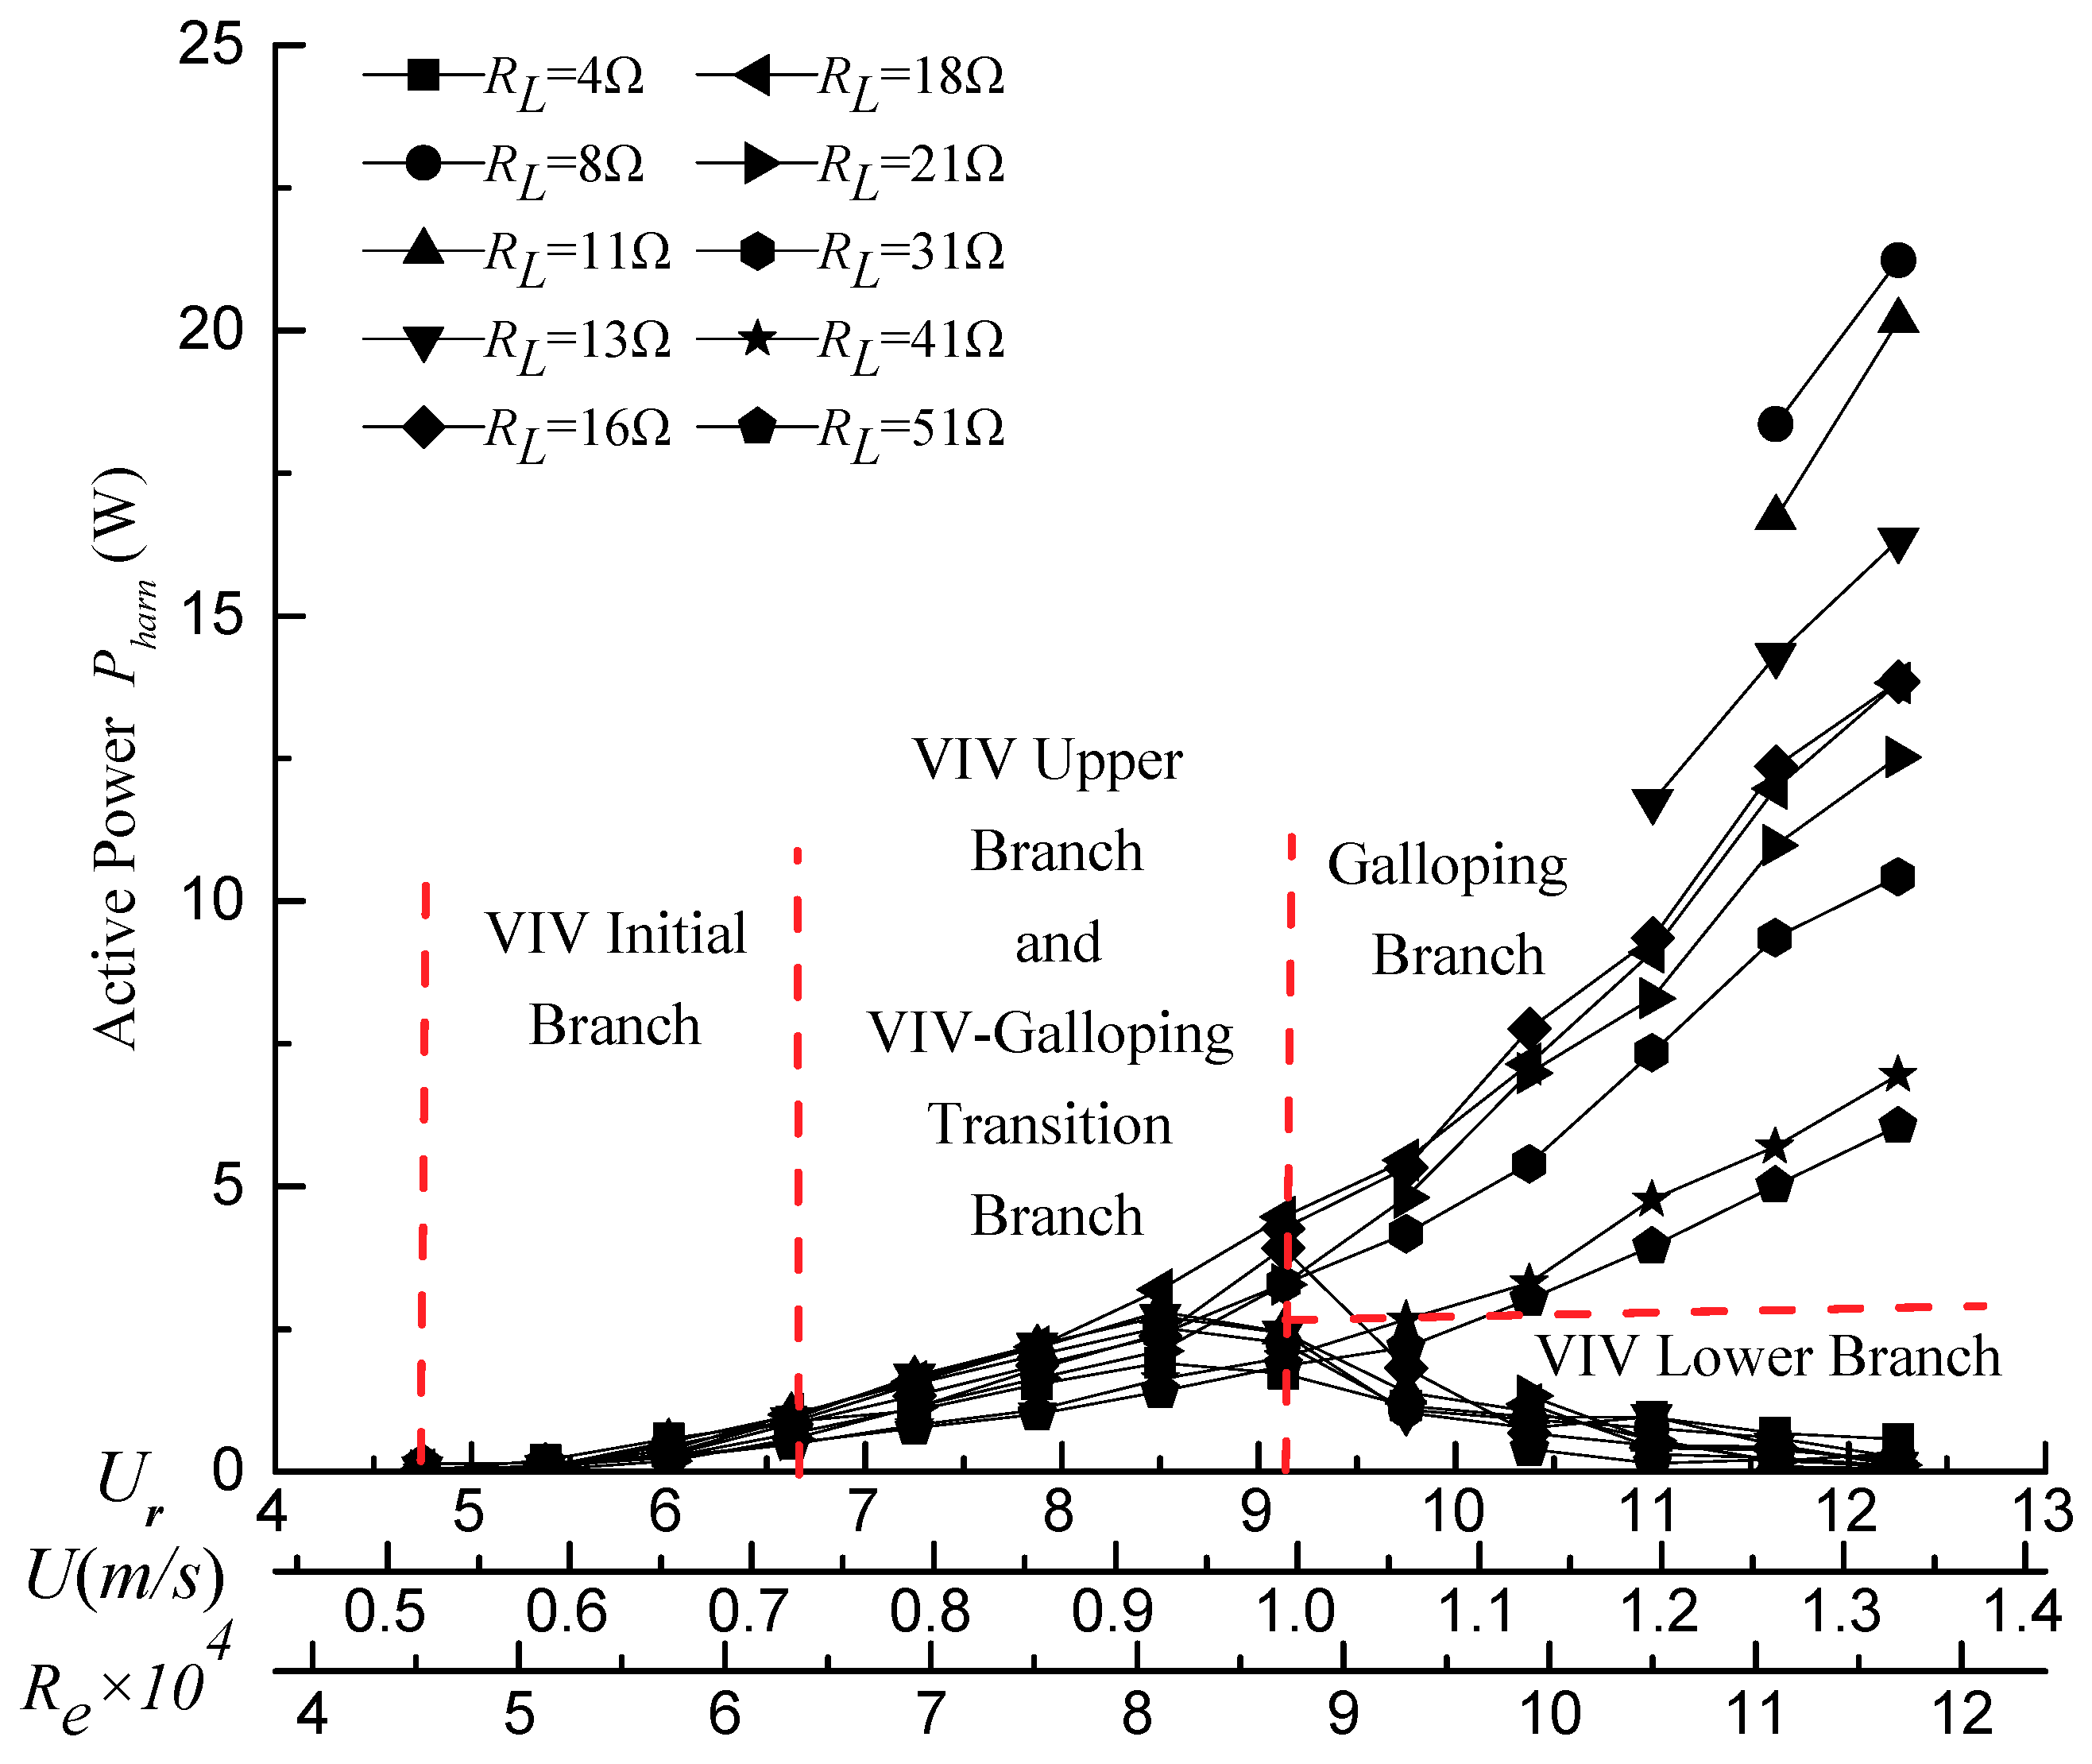
(4) SG. For 18 Ω ≤
RL ≤ 51 Ω (0.115 ≤
ζ ≤ 0.165), two modes of motion were observed in the responses of the prism. If the prism oscillated freely (without any external forces acting on the prism), the T-section prism experienced the VIV initial branch, followed by the VIV-galloping transition branch, and ended with the galloping branch (shown in
Figure 11). In the range of 4.75 ≤
Ur ≤ 6.625,
A* and
f* were small but increased rapidly, indicating that the prism underwent the VIV initial branch. In the range of 6.625 ≤
Ur ≤ 9.125,
A* continued to grow with a strong uptrend to 1.5, while
f* decreased to about 0.7 with a slight downward trend. For
Ur ≥ 9.75,
A* continued to increase up to 2.36, while
f* almost remained at 0.7. The oscillation underwent the fully developed galloping branch. On the other hand, at
Ur = 12.25, external suppression was applied to the prism; thus, the oscillation presented a low
A* ≈ 0.2 and a high
f* ≈ 1.4, the system experienced the VIV lower branch until
Ur ≤ 10.375, and the oscillation mode returned to galloping. For 6.625 ≤
Ur ≤ 10.375, the oscillation was self-excited from VIV to galloping (regardless of whether the velocity increased or decreased). If
Ur continued to increase, the oscillation would be maintained within the range of galloping. For
Ur ≥ 10.375, if there was an external suppression, the oscillation would be converted to the VIV lower branch and could not be self-excited to galloping.
It can be concluded that the oscillation responses of the T-section prism were similar to those of the triangular prism and the PTC circular cylinder. The occurrence conditions of different FIM branches of the T-section prism are listed in
Table 3.
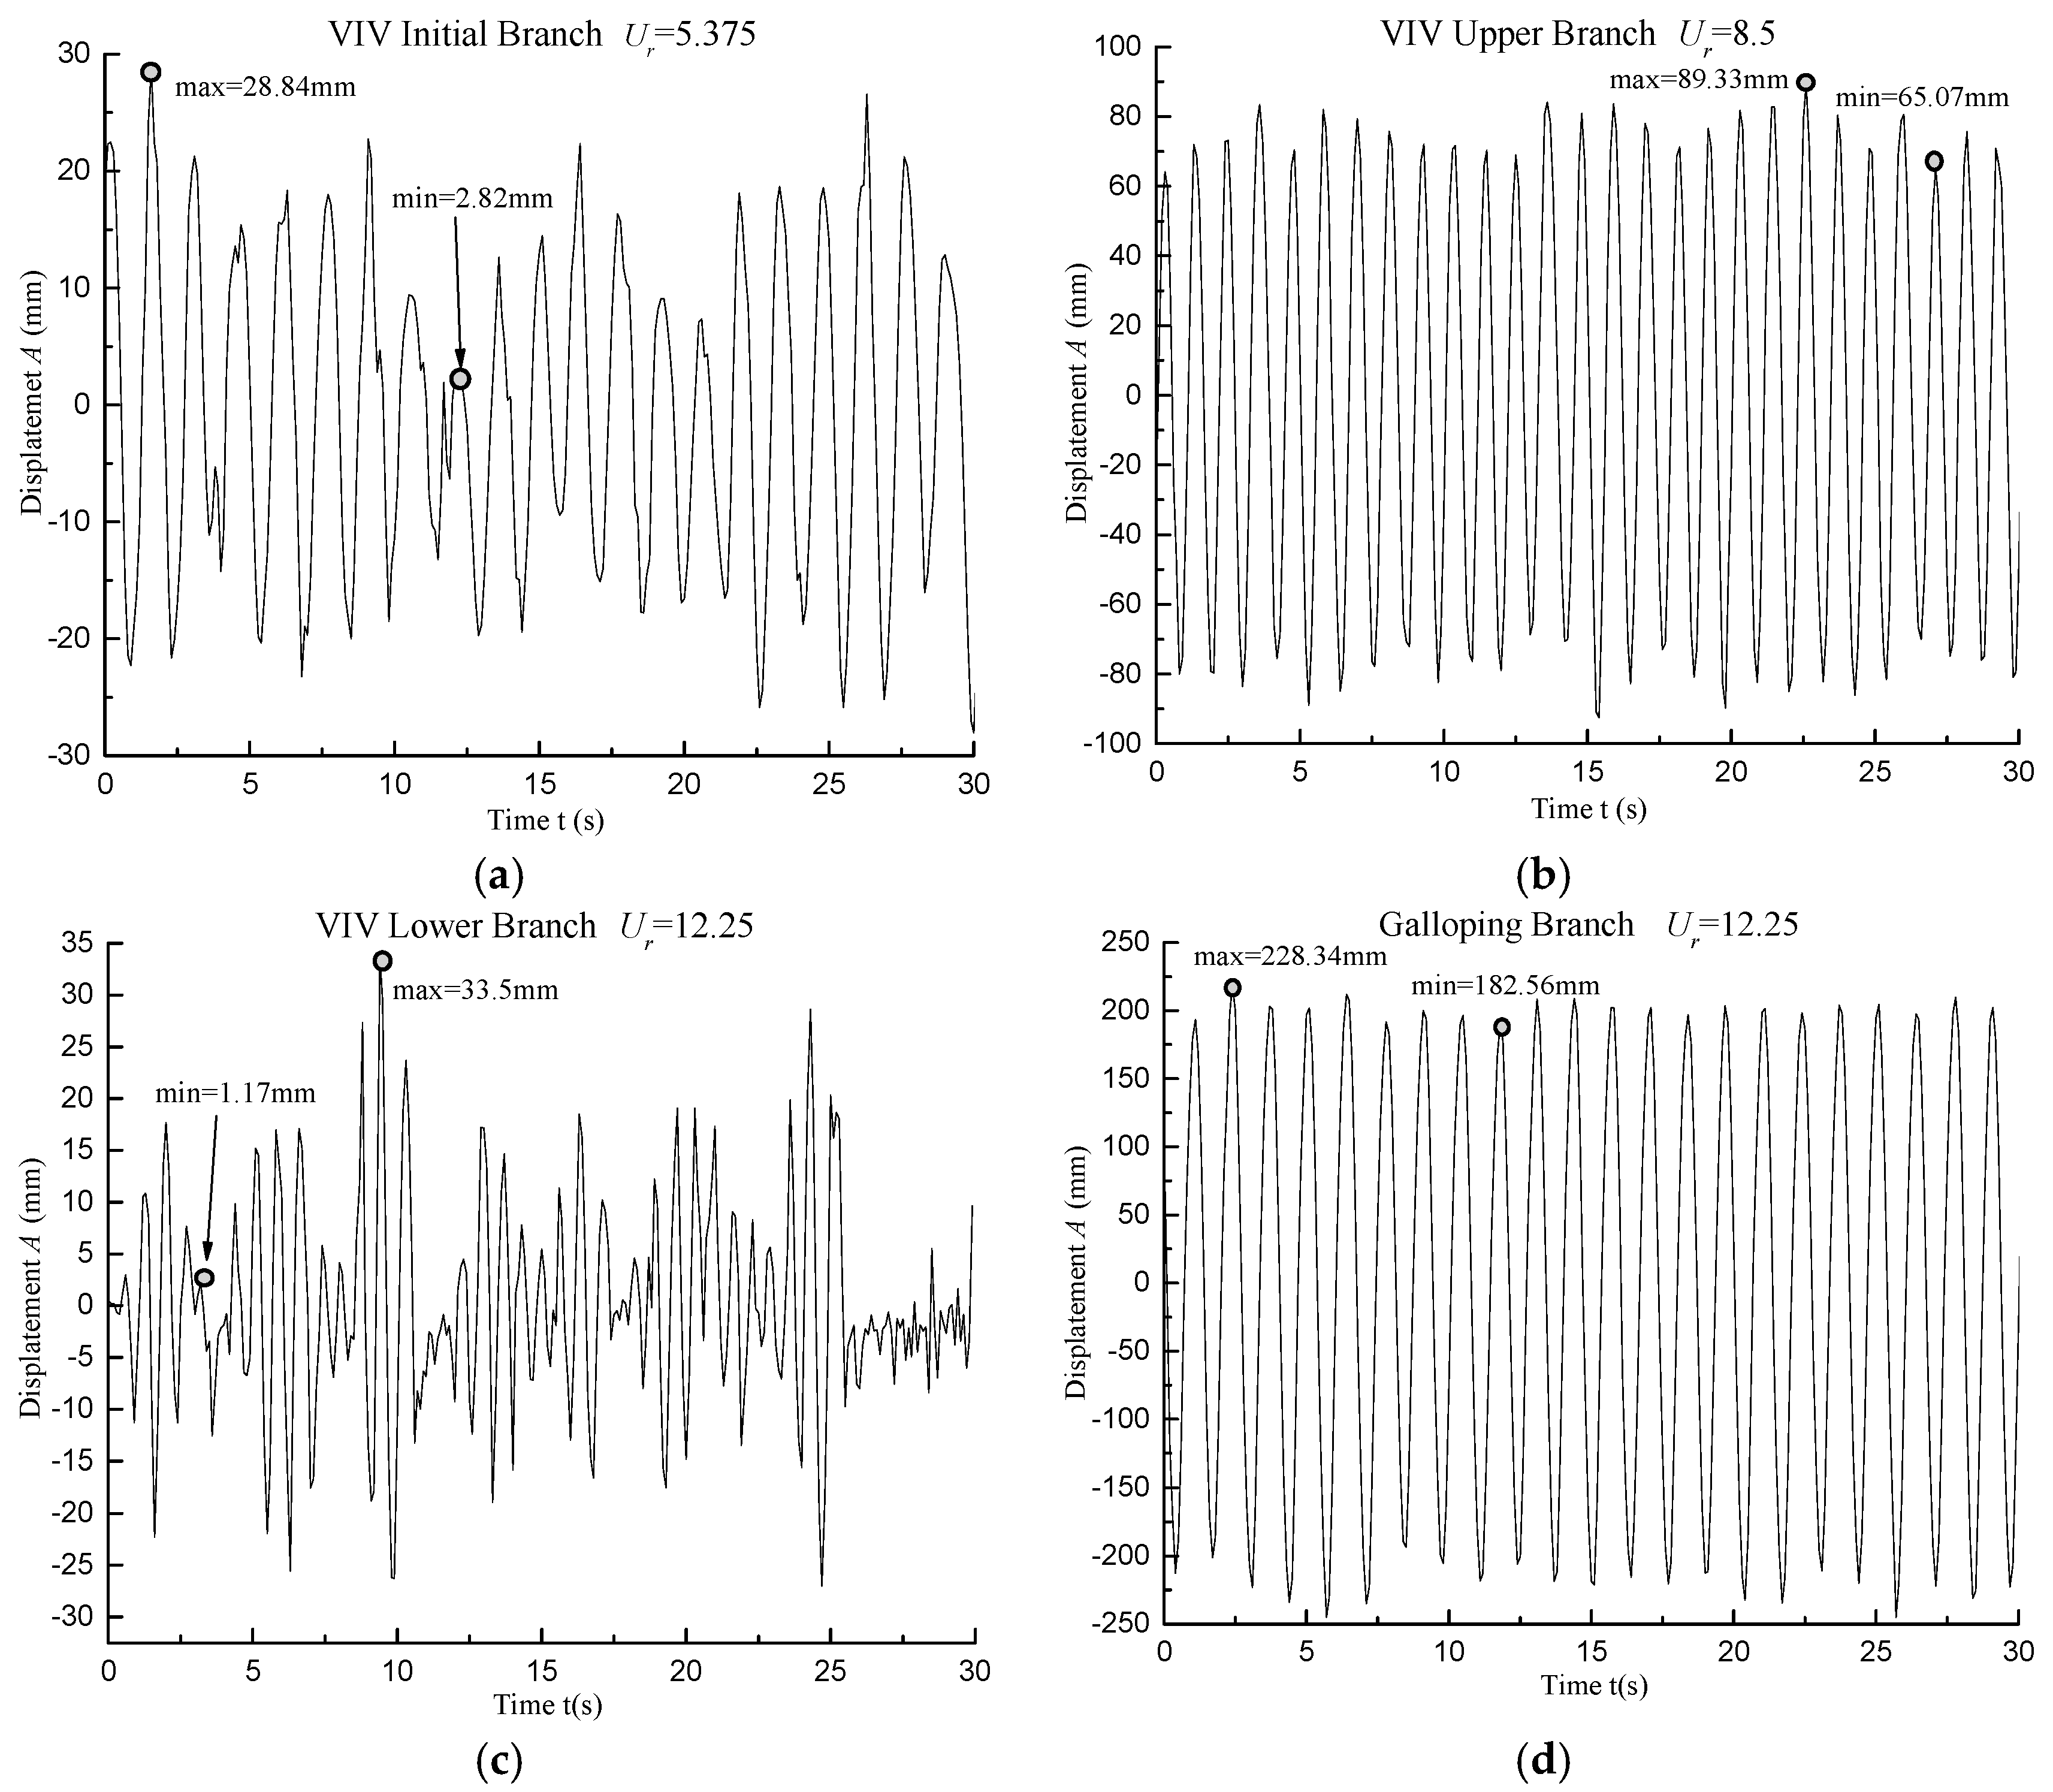
3.1.2. Time-History and Frequency Spectrum of Each Branch
In order to explore the oscillation characteristics of each branch, four typical time-history curves and frequency spectra are depicted in this section (plotted in
Figure 12 and
Figure 13). The physical parameters of the oscillation system are listed in
Table 4.
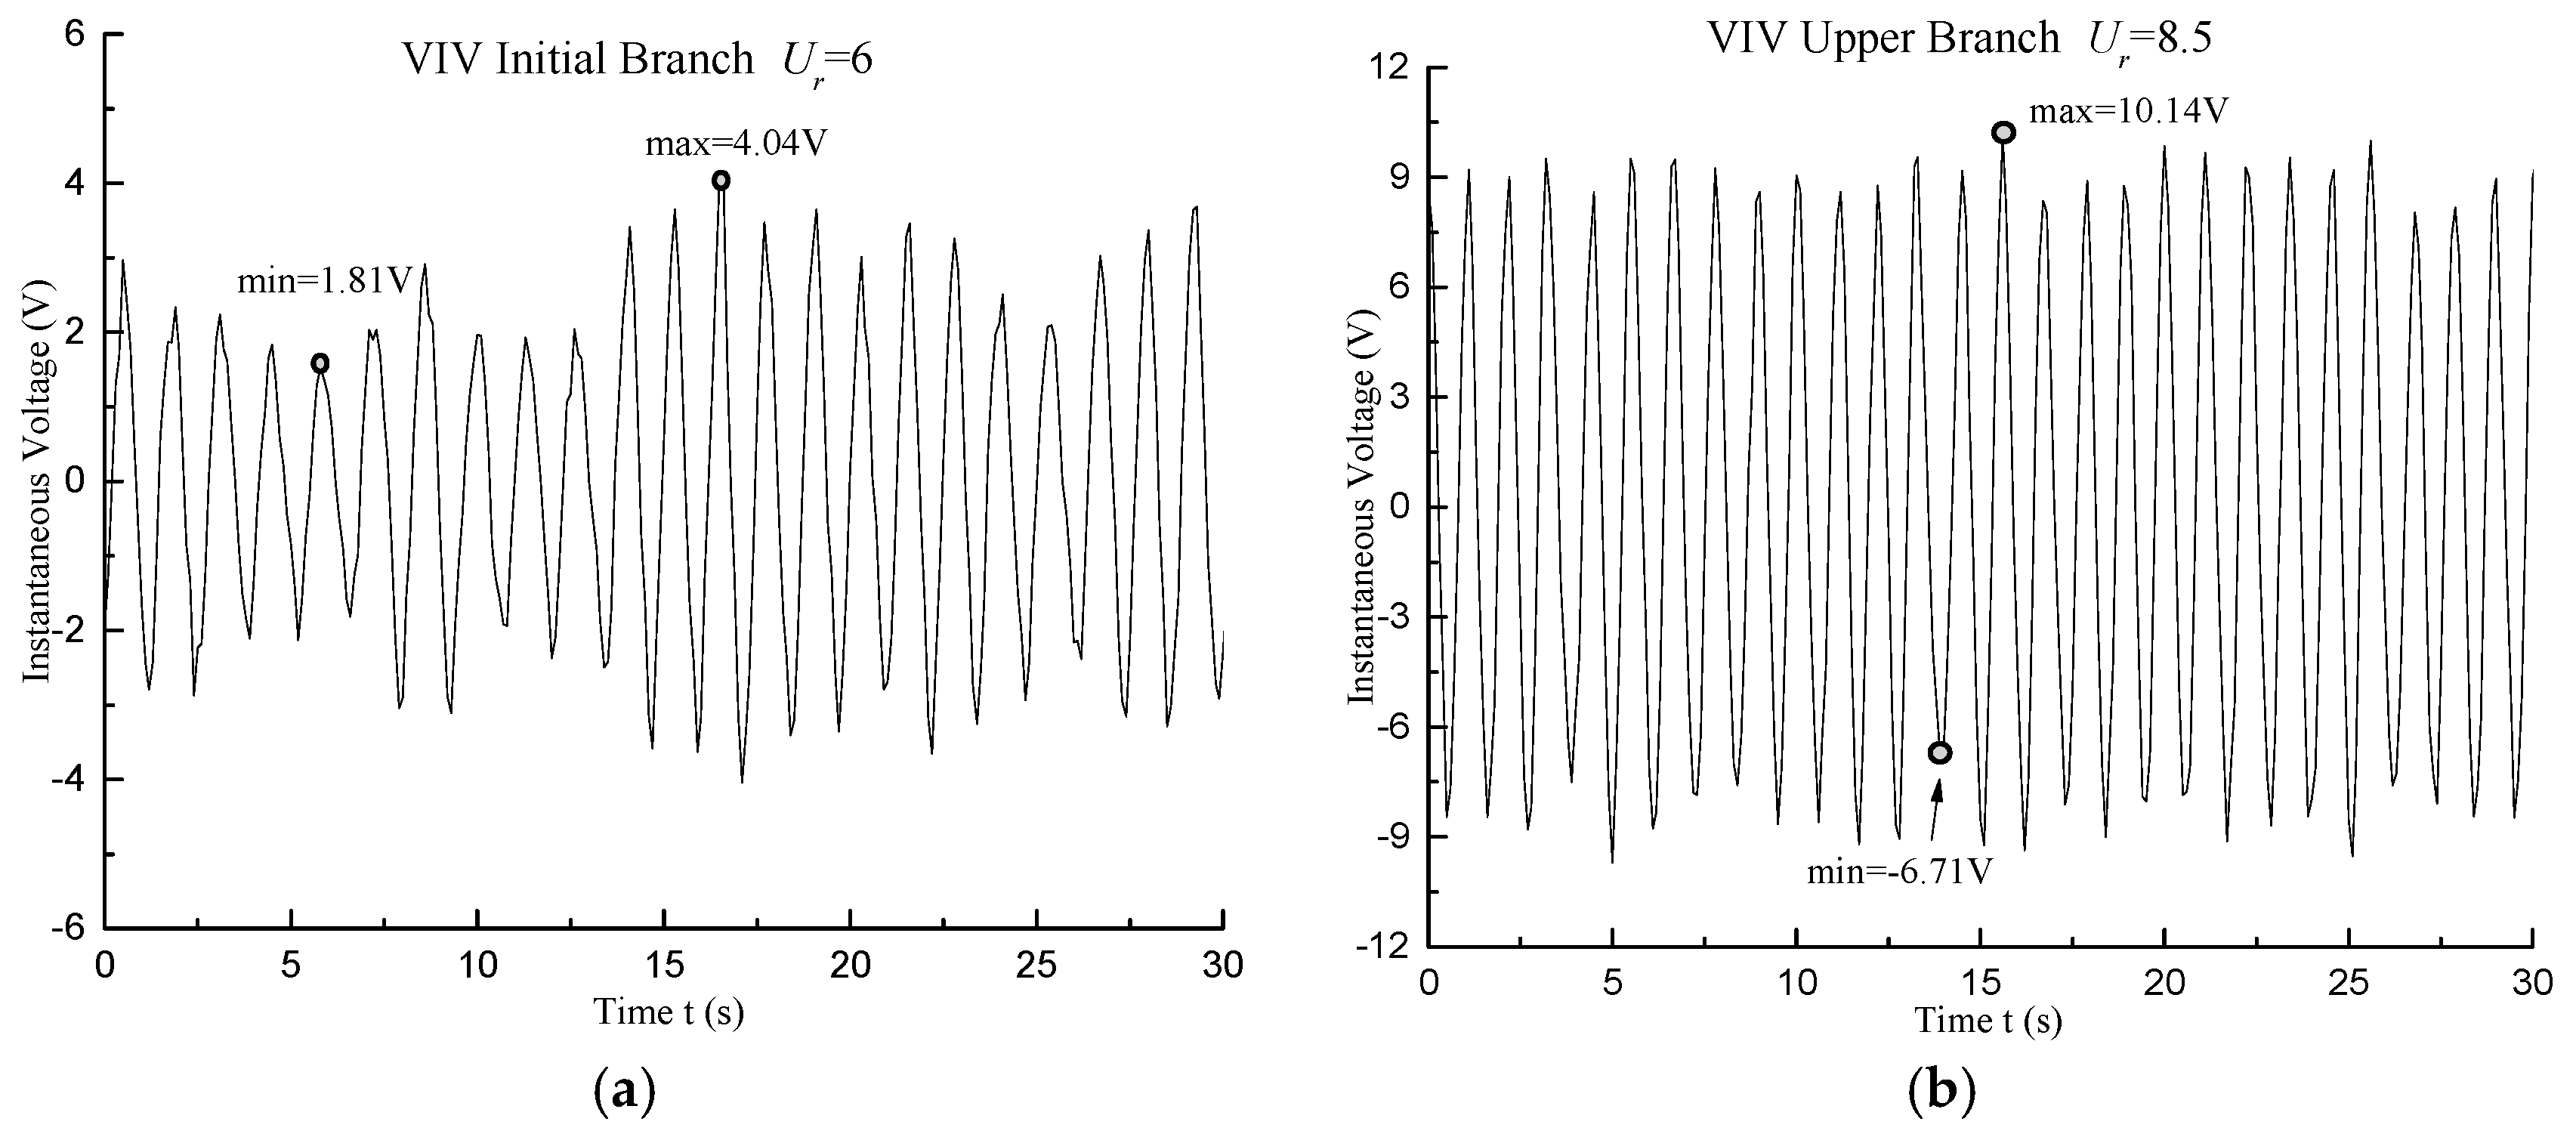
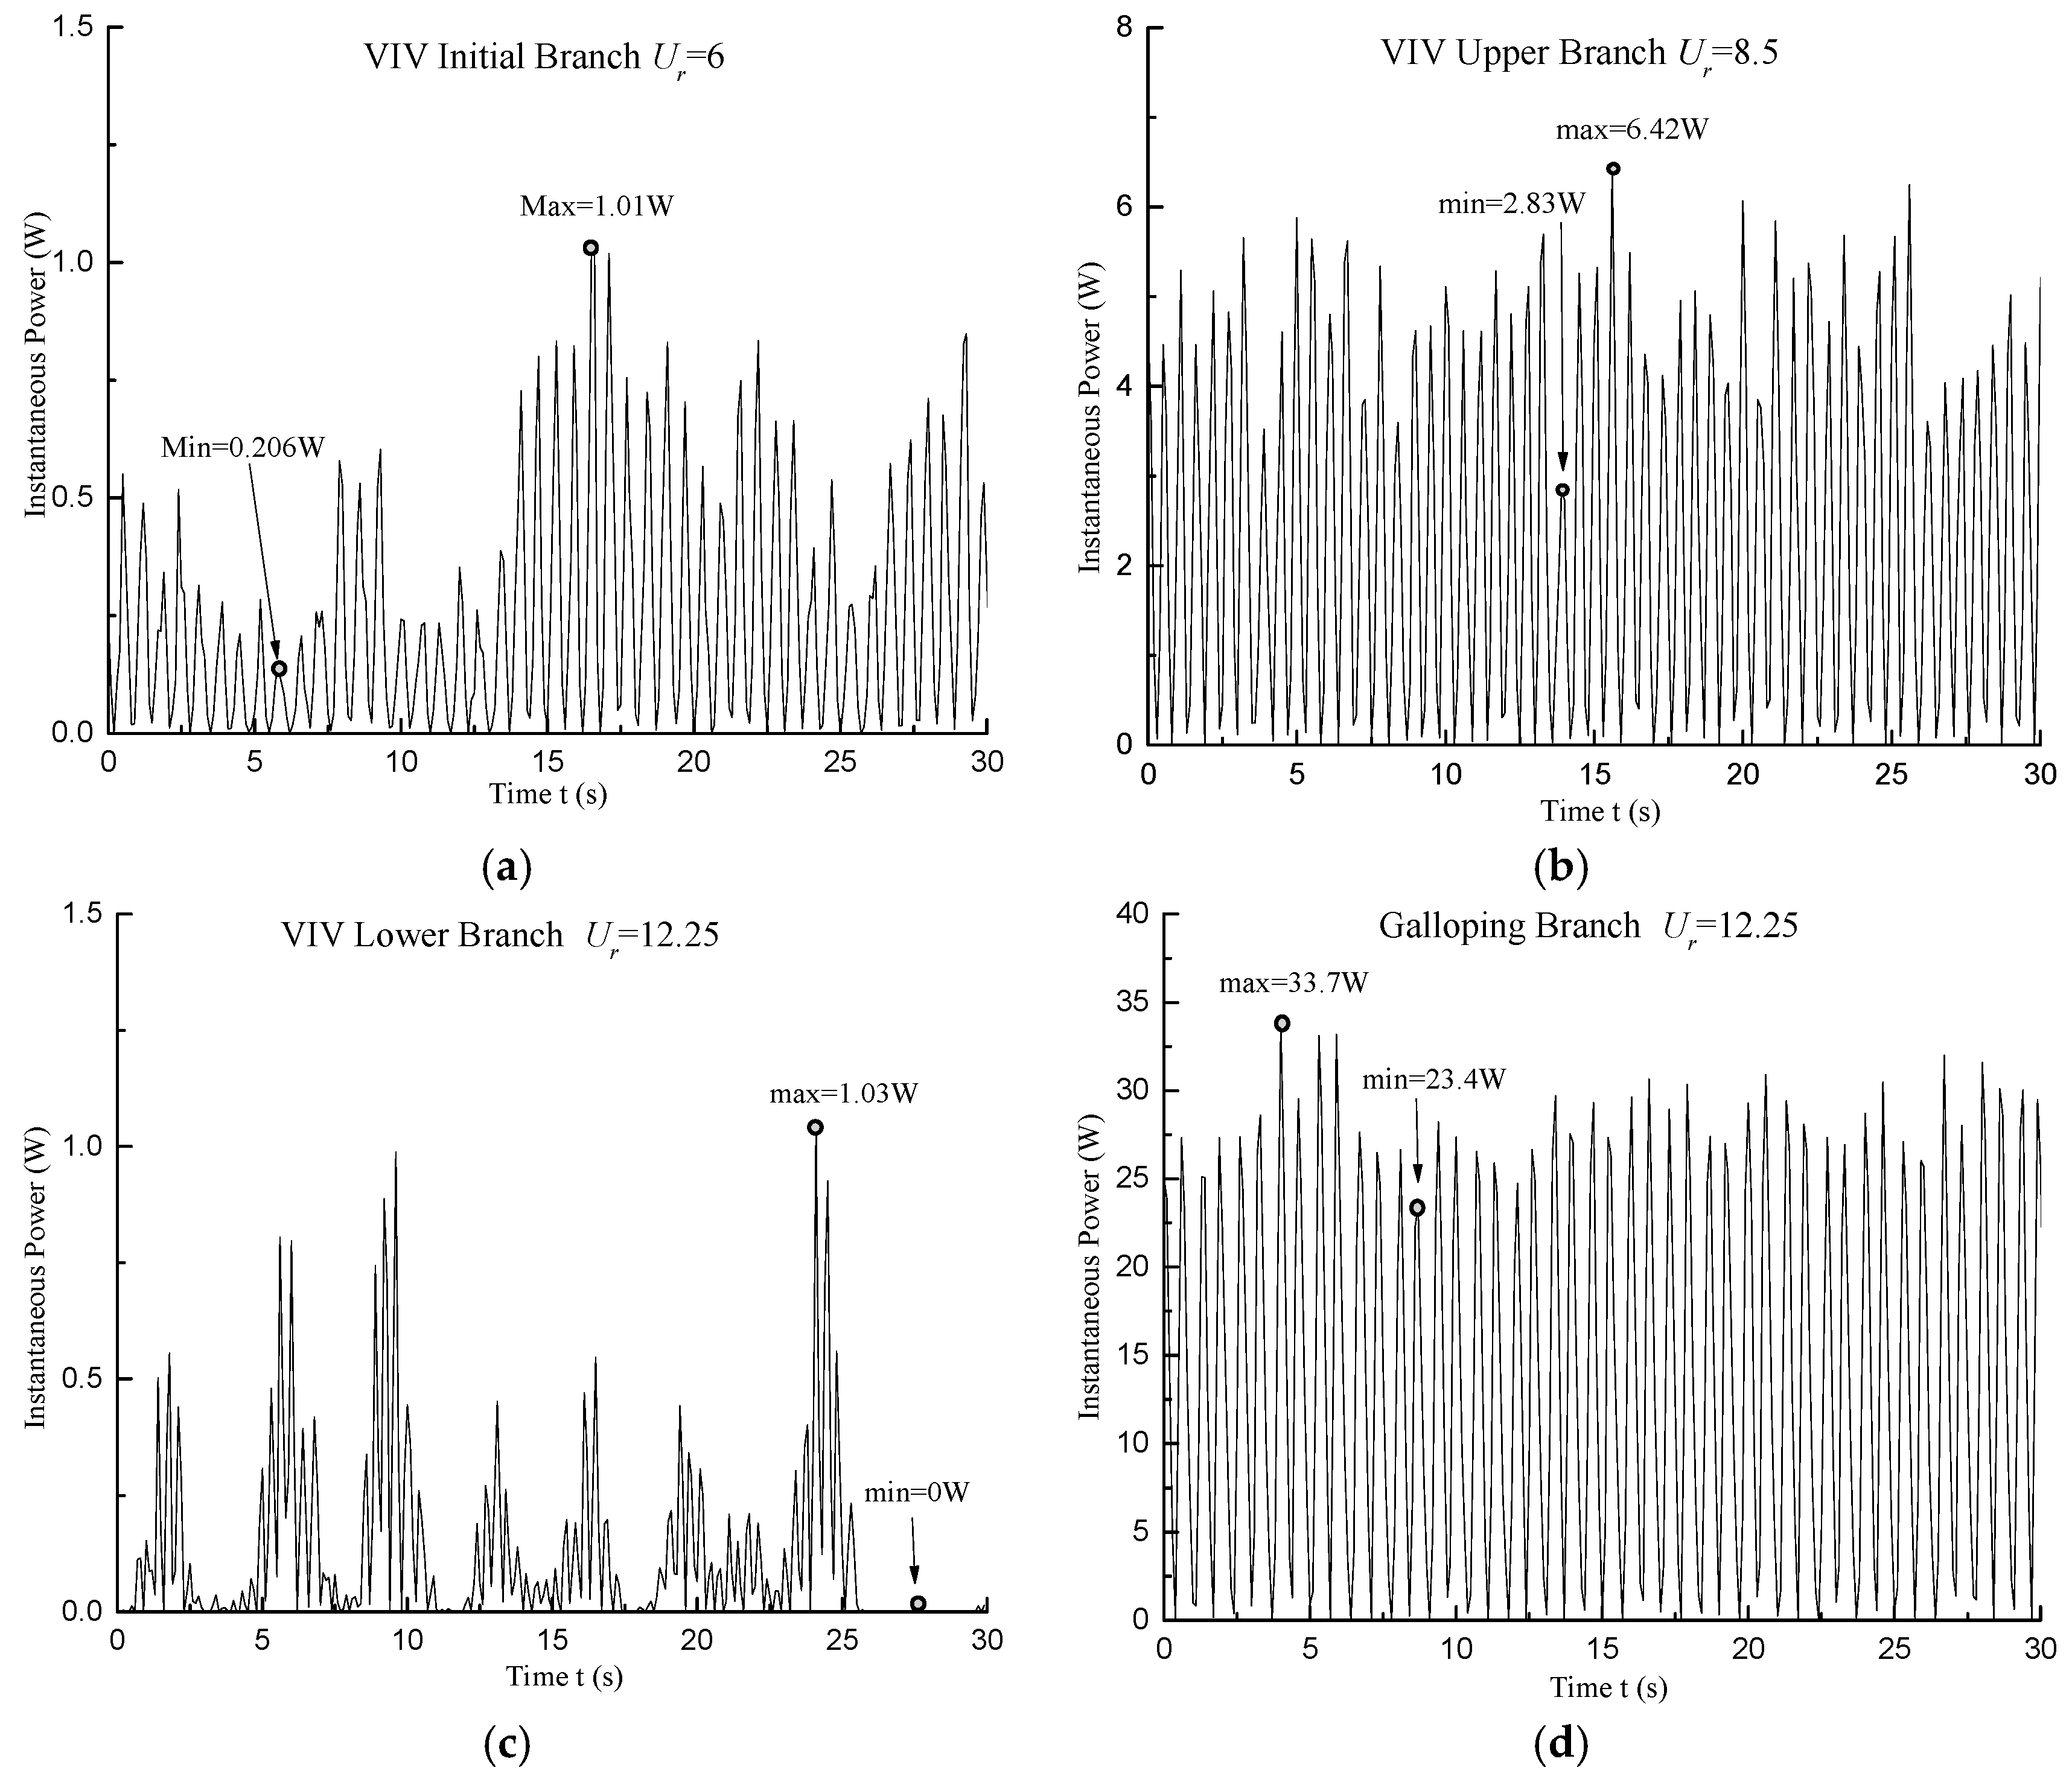
(1) Time-History
For
Ur = 5.375, the prism underwent the VIV initial branch. The time-history curve of the displacement is shown in
Figure 12a. It was observed that the minimum of the positive displacement was 2.82 mm, the maximum was 28.84 mm, and the difference between the maximum and minimum was 1.25
A (
A = 16 mm), indicating that the amplitude was low and the oscillation was unstable.
As
Ur reached 8.5, the oscillation mode entered the VIV upper branch, as shown in
Figure 12b. It was observed that the minimum of the positive displacement was 65.07 mm, the maximum was 89.33 mm, and the difference between the maximum and minimum was 0.31
A (
A = 78 mm). Moreover, the prism underwent a more stable oscillation, although there was a certain fluctuation response amplitude.
For
Ur = 12.25, it was observed that the minimum of the positive displacement was 1.17 mm, the maximum was 33.50 mm, and the difference between the maximum and minimum was 4.04
A (
A = 8 mm). The oscillation amplitude fluctuation was large and the performance was very unstable, as shown in
Figure 12c, demonstrating that the prism underwent the VIV lower branch.
For
Ur = 12.25 (galloping branch), the minimum of the positive displacement was 182.56 mm, the maximum was 228.34 mm, and the difference between the maximum and minimum was 0.21
A (
A = 212 mm), indicating that the oscillation amplitude was large and the fluctuation was small, as shown in
Figure 12d.
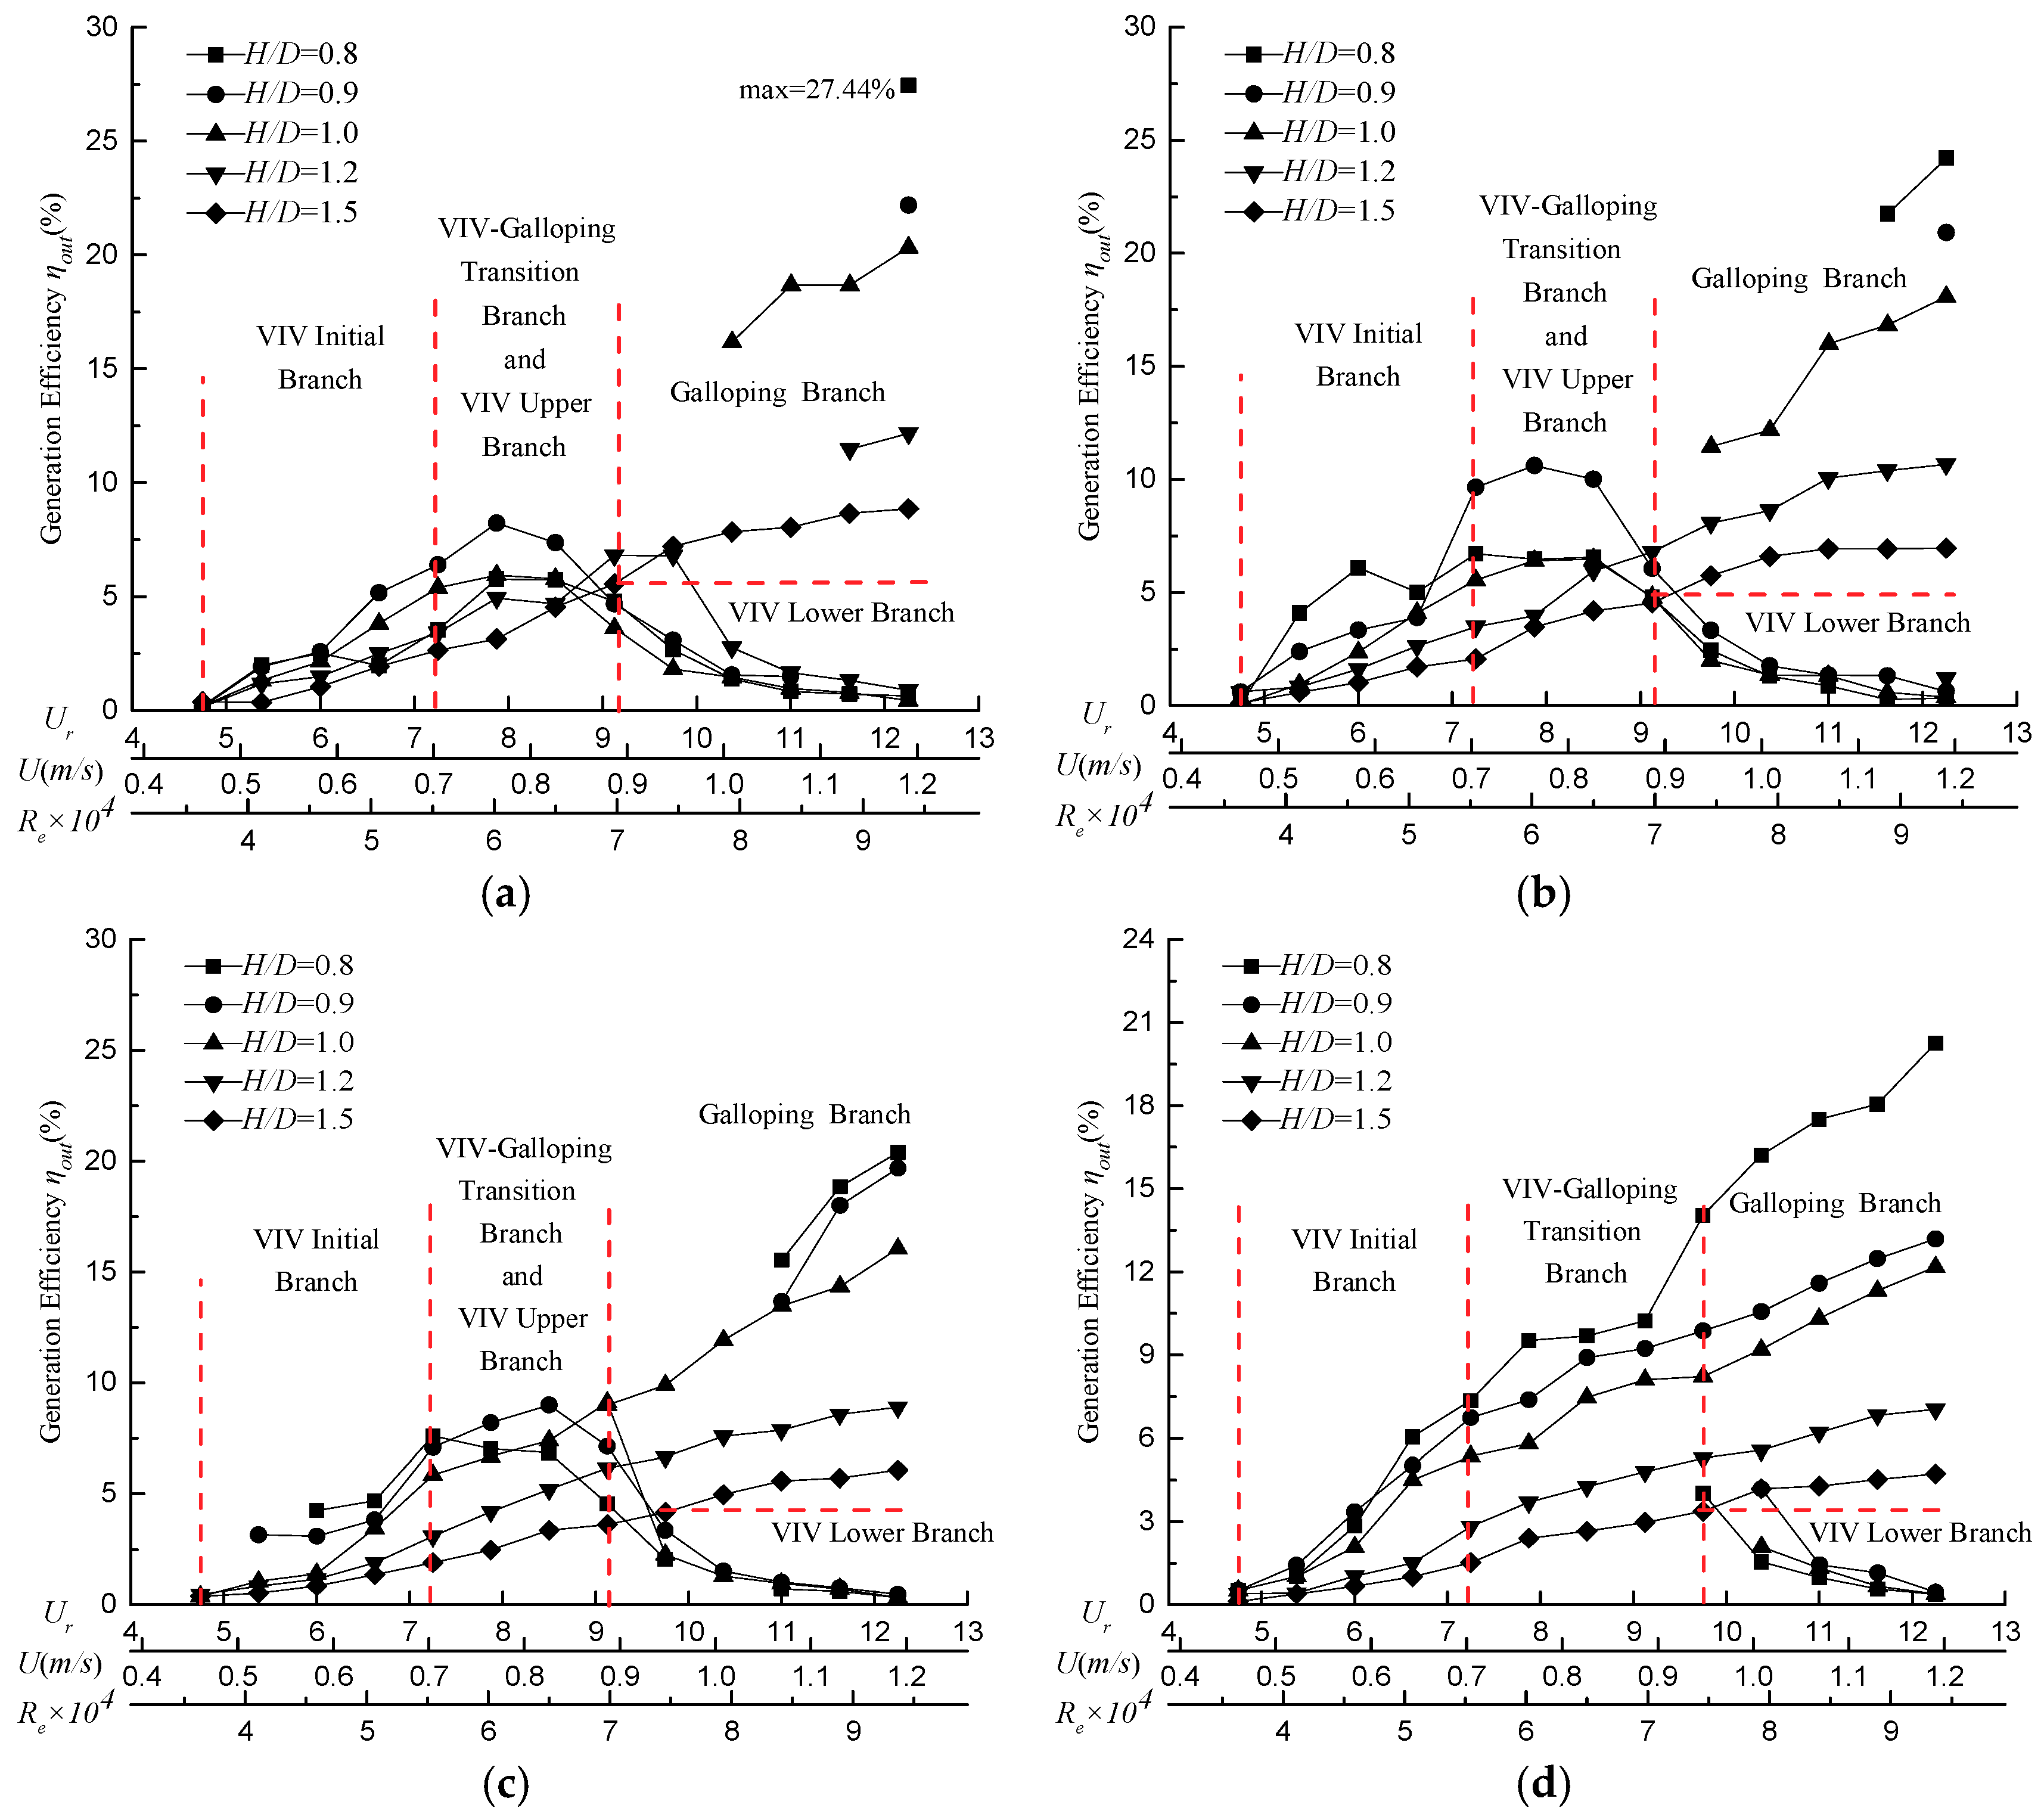
Both stability and amplitude are key parameters for energy harvesting. Thus, the galloping branch is the most suitable branch for energy extraction and utilization.
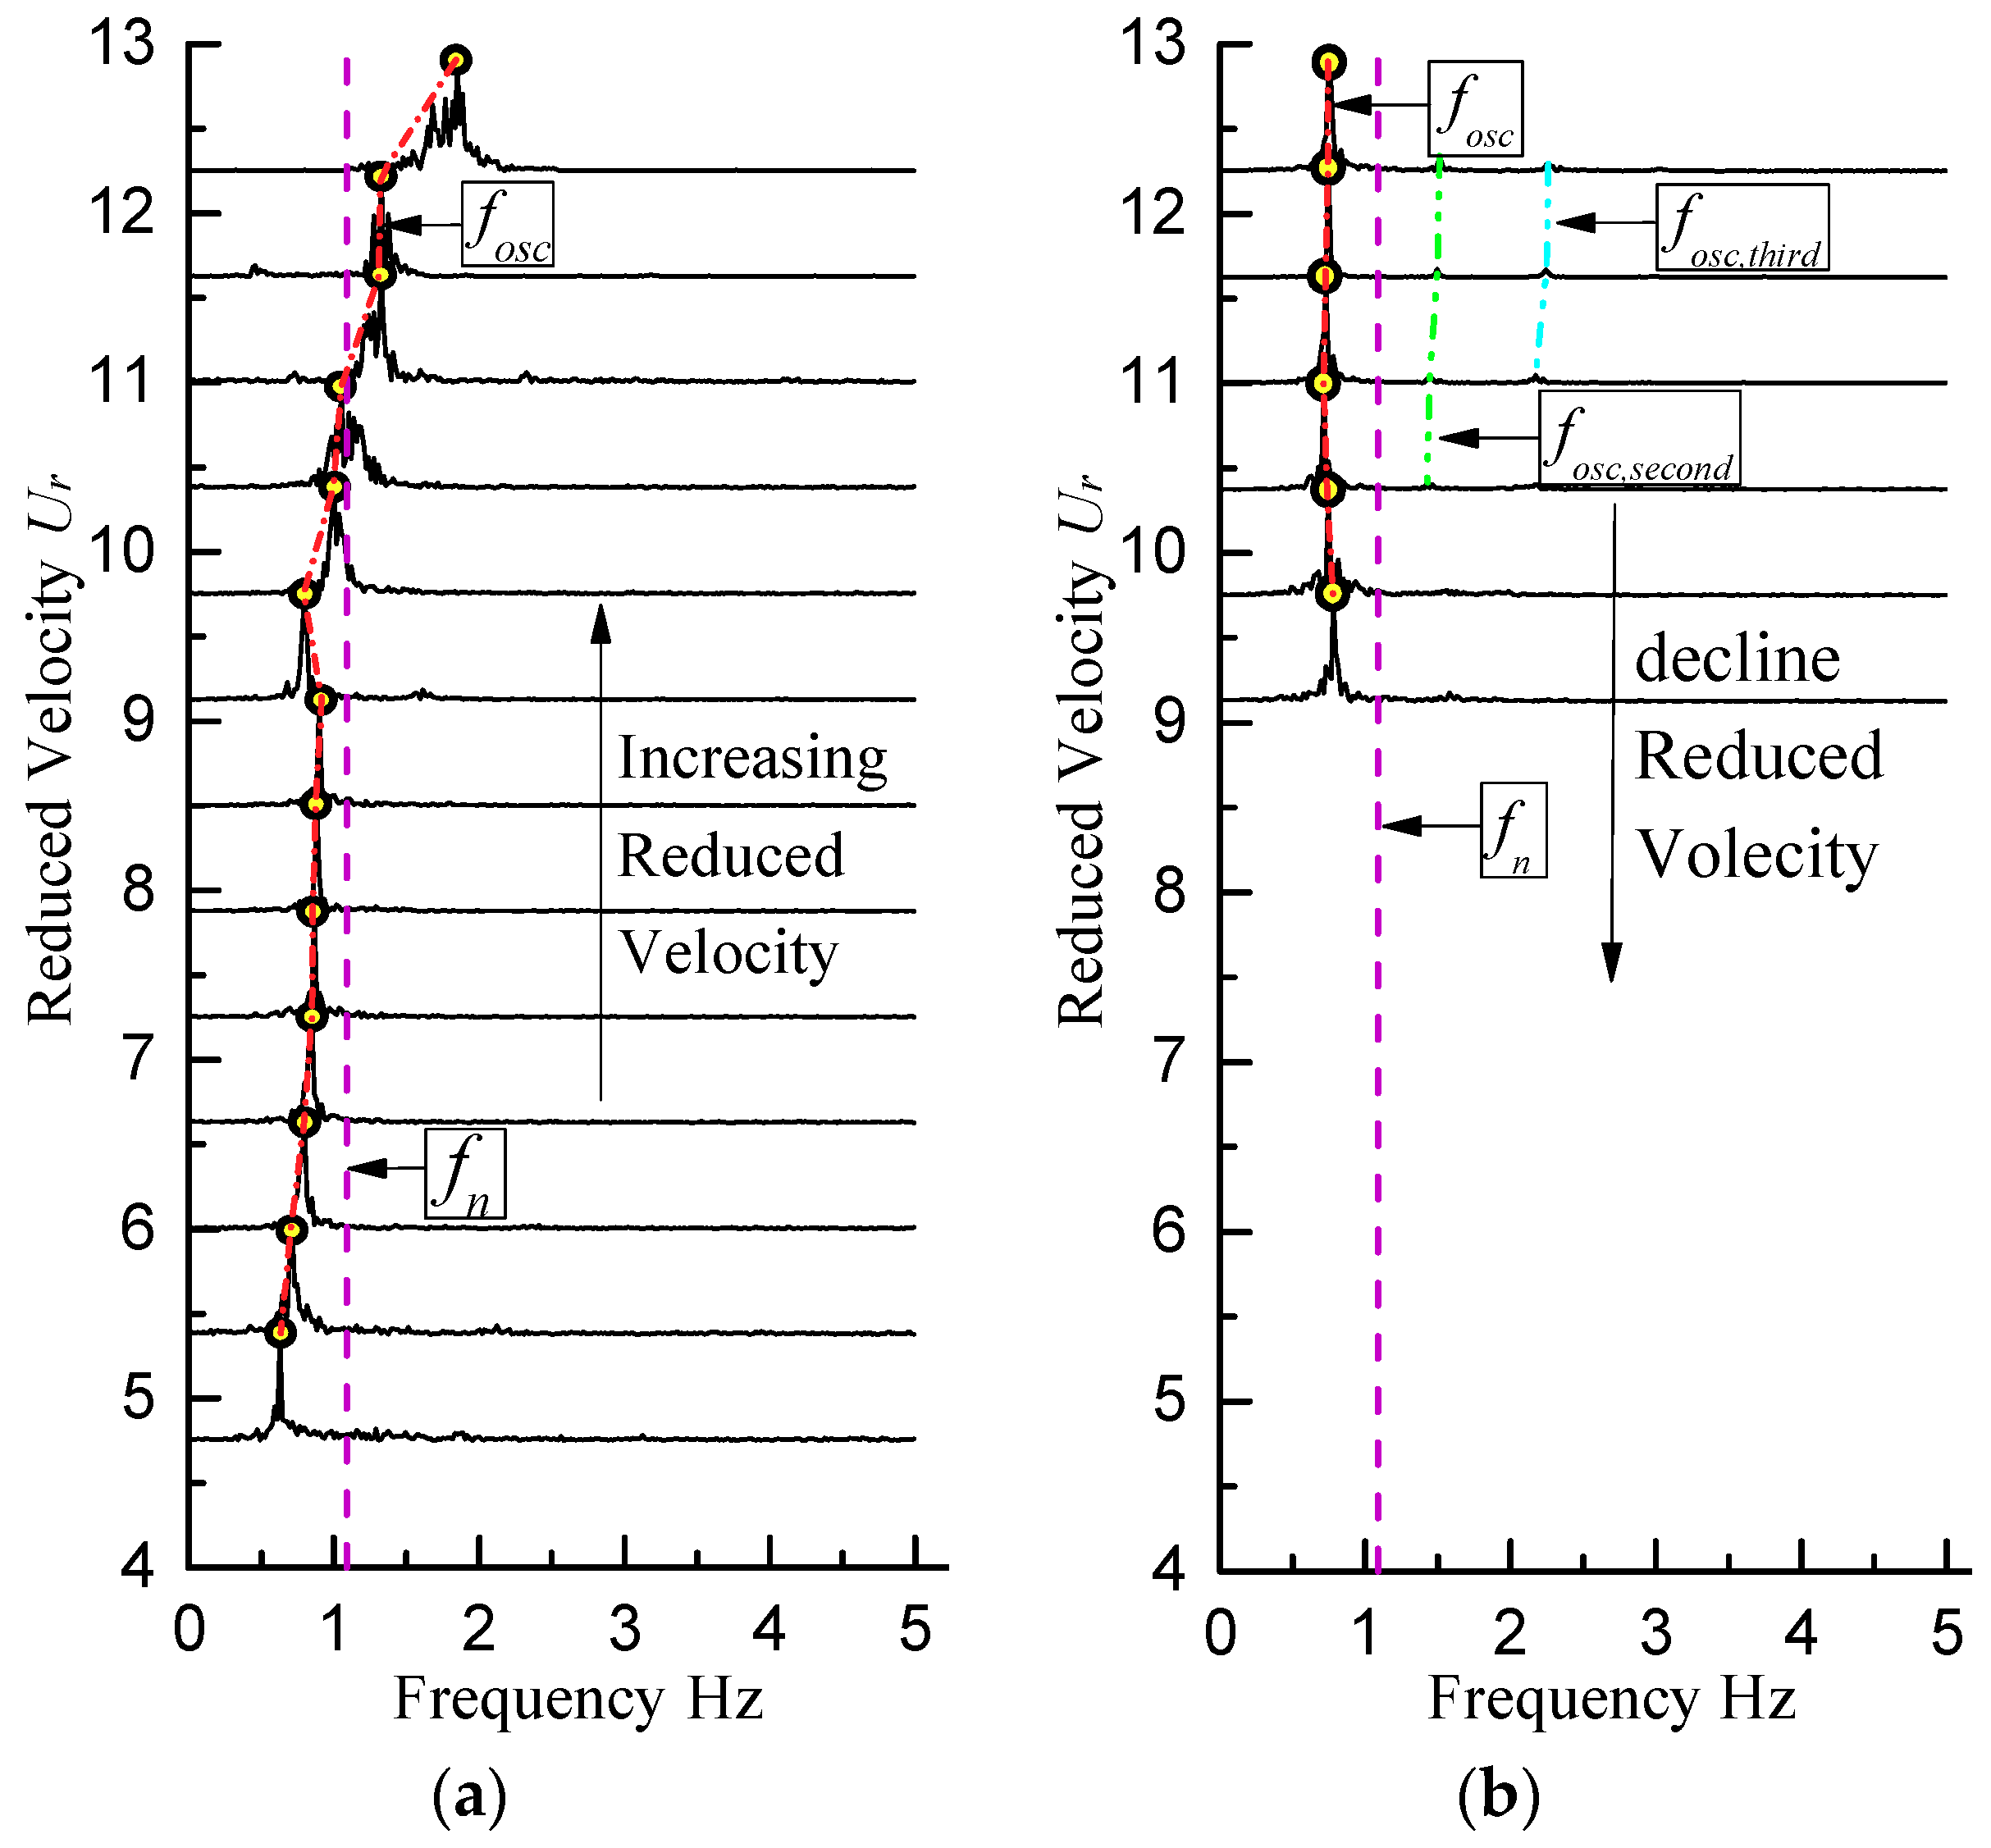
(2) Frequency Spectrum
The frequency spectrum is important for describing the oscillation characteristics and mechanical energy. The oscillation frequency of the prism was extracted by using the FFT method from the displacement time-history curves (shown in
Figure 13).
Figure 13a plots the frequency spectrum of the complete VIV branch and
Figure 13b plots the frequency spectrum of the galloping branch, while the trends of
fn and
fosc are marked by dashed lines.
For 4.75 ≤ Ur ≤ 6.625, the prism underwent the VIV initial branch, and the frequency band was wider and exhibited double peaks in the frequency spectrum, revealing that periodicity of oscillation and mechanical energy was poor.
In the range of 6.625 ≤ Ur ≤ 9.125, the prism entered the VIV upper branch, the frequency band became narrower, and the main frequency was clearly observed. The periodicity of oscillation was significantly enhanced, the prism oscillated more stably, and the main frequency was concentrated at 0.88 Hz.
For Ur ≥ 9.125, two modes of oscillation were observed. When the prism oscillated freely (without external excitation), the prism went into the VIV lower branch, the main frequency was not obvious, the frequency band widened, and the energy was very dispersed.
On the other hand, if the prism was manually pushed by a threshold initial displacement (exceeding 1 × D), the prism entered the galloping branch with a narrowed frequency band and evident first dominant frequency, as shown in
Figure 13b. It was noted that in the galloping branch, the oscillation was mainly caused by the instability of the lift force due to the T-section prism with sharp sections. Because of the lower energy and the higher frequency of the vortex shedding, the effect of vortex shedding on the prism was weaker, resulting in the second and third dominant frequencies being hardly observed in the frequency spectrum.
The conclusions of the time-history curves and frequency spectra are as follows: (1) different fluctuations are observed in each branch—the VIV upper branch and the galloping branch have higher amplitudes and more stable oscillations; (2) the VIV upper branch and the galloping branch have a better periodicity and frequency spectrum. In summary, the VIV upper branch and the galloping branch are more suitable for energy harvesting, but the galloping branch is better (shown in
Table 5).
3.1.3. Summary
The specific findings are listed as follows:
(1) With an increase of damping (decrease in load resistances), the T-section prism oscillation mode gradually changes from SG (0.115 ≤ ζ ≤ 0.165, 18 Ω ≤ RL ≤ 51 Ω) to CG (ζ = 0.177, RL = 16 Ω), and eventually to HG (0.208 ≤ ζ ≤ 0.305, 8 Ω ≤ RL ≤ 13 Ω). The oscillation mode of SG, HG, and CG all contain VIV branches and galloping branches, the only difference being whether these can be self-excited from VIV to galloping.
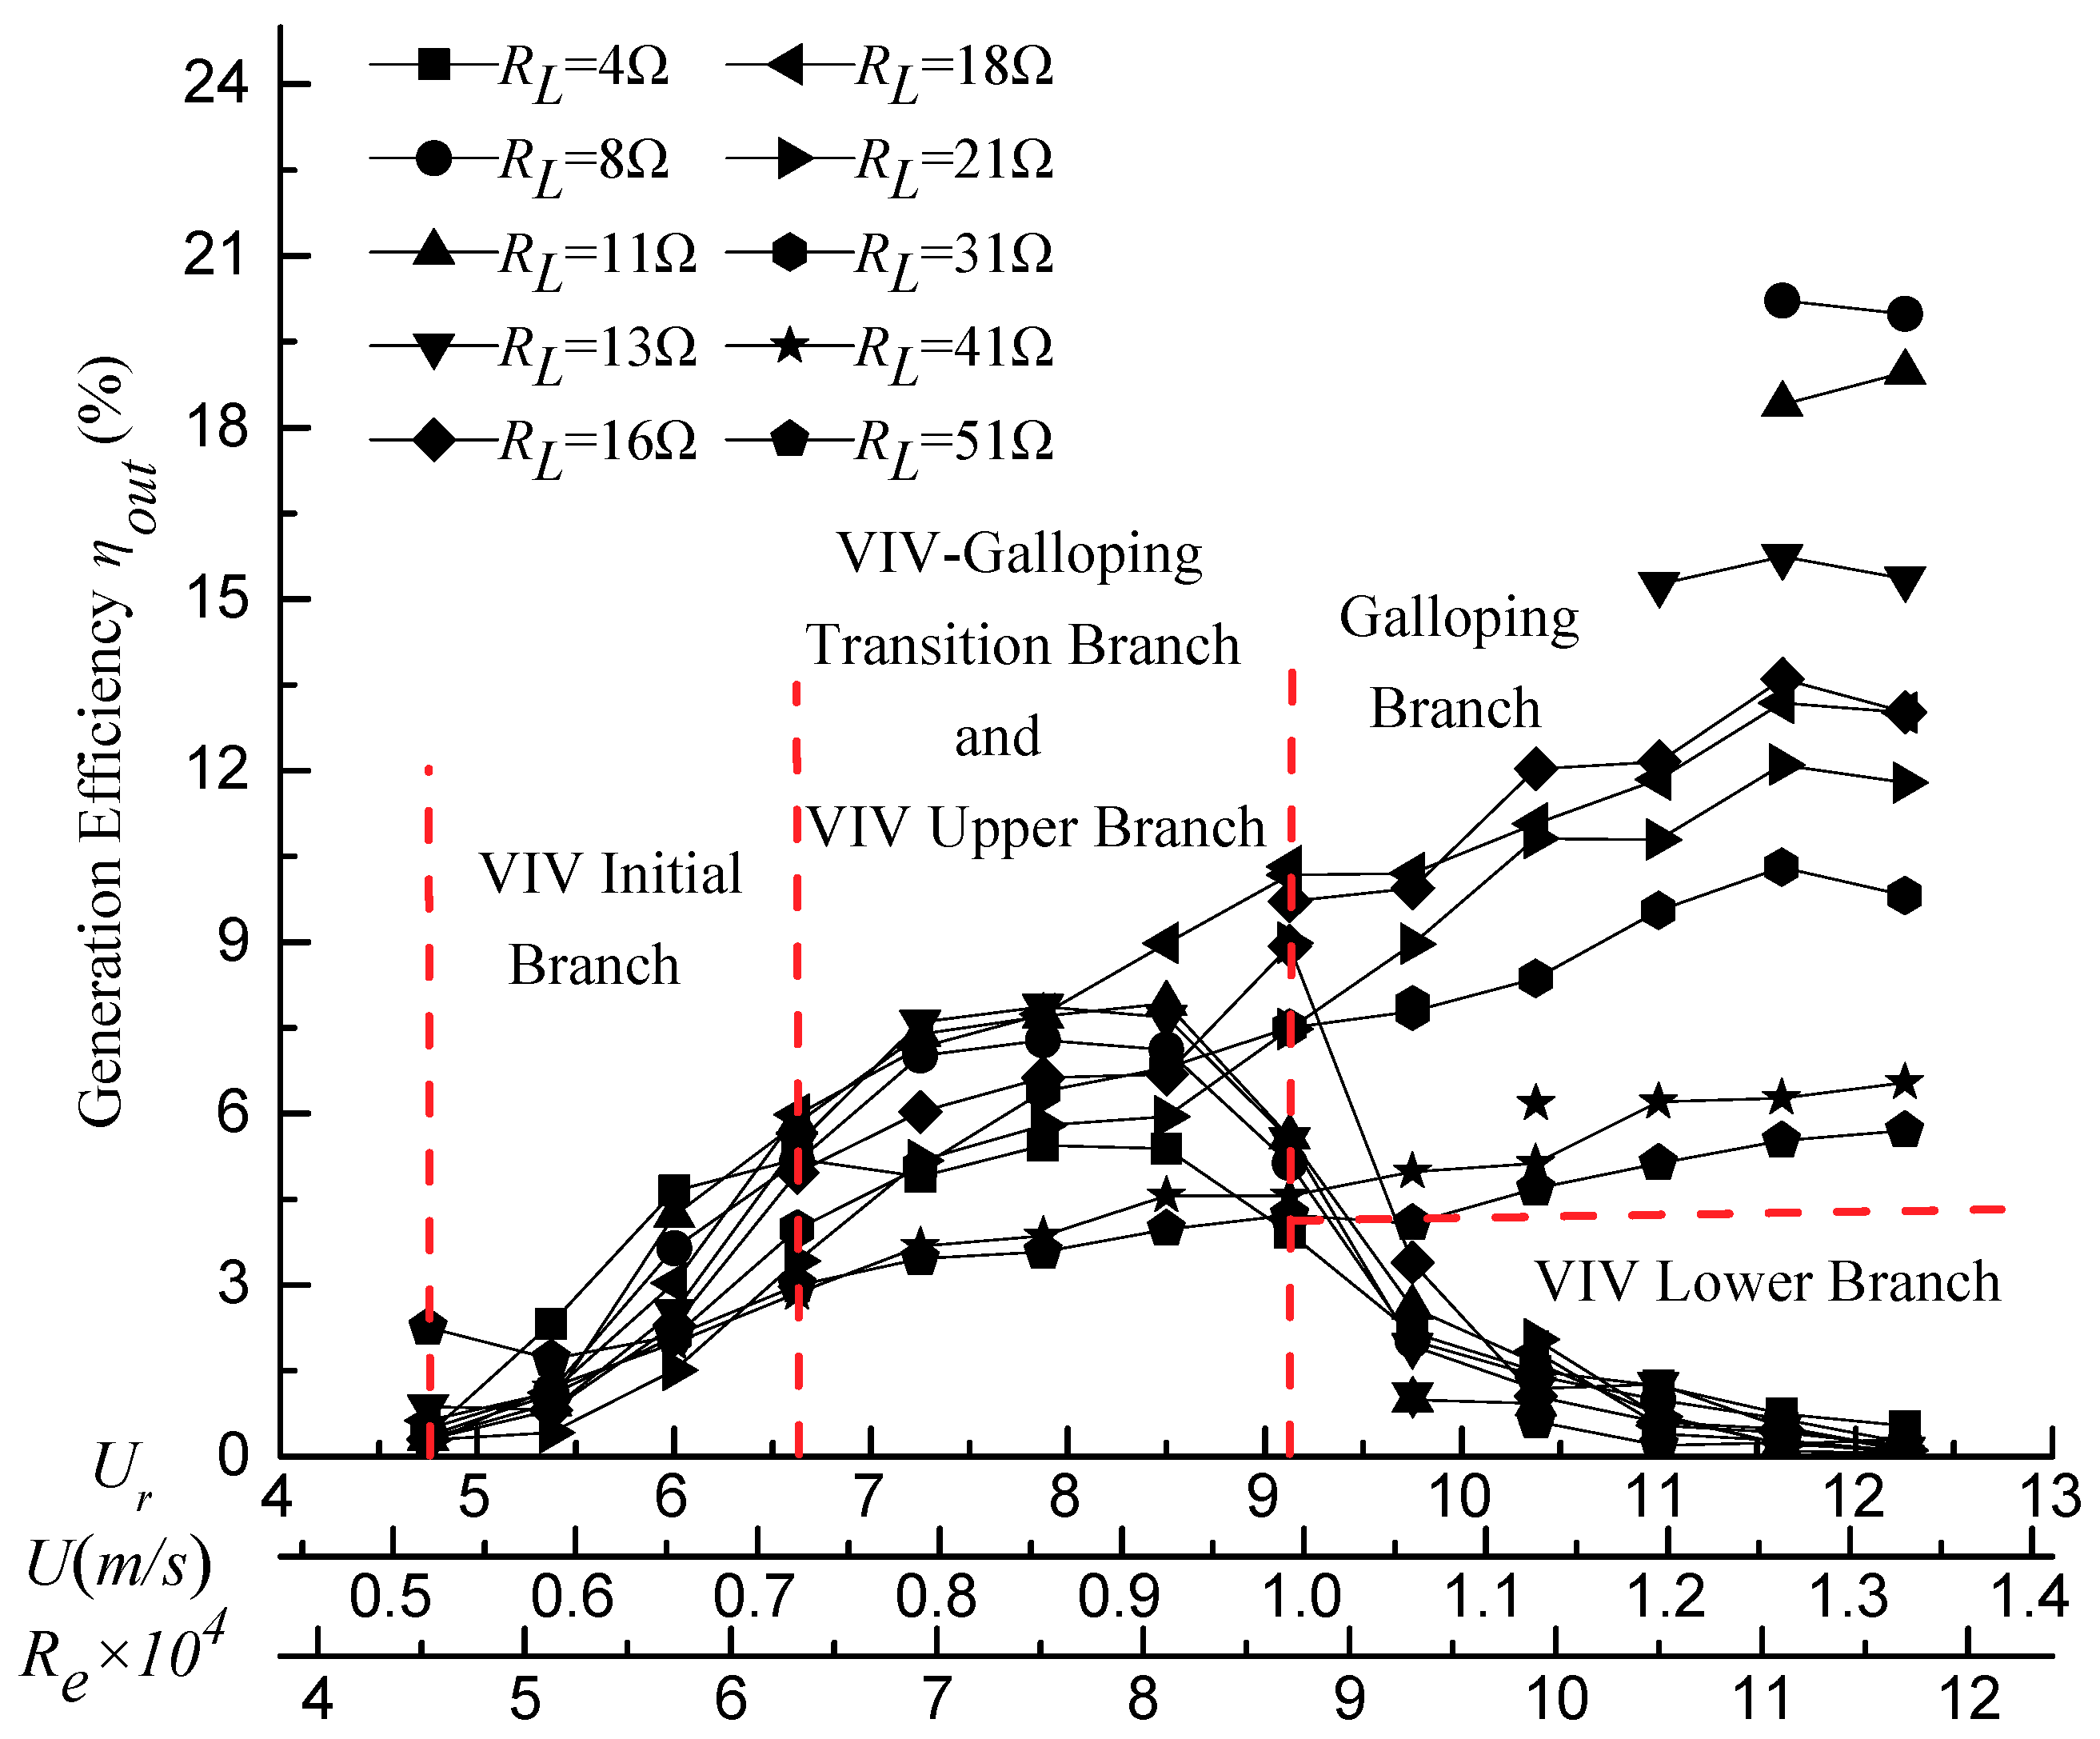
(2) The analysis of the displacement time-history curves and the frequency spectra demonstrates that the stability and intensity of the VIV upper branch and the galloping branch are both better-performing, and that the maximum amplitude of the galloping branch is larger. It can be concluded that at a high velocity (Ur ≥ 10.375, U ≥ 1.128 m/s) the galloping branch is better for harvesting energy, and at a lower velocity (6.625 ≤ Ur ≤ 9.125, 0.720 ≤ U ≤ 0.992 m/s) the VIV upper branch is better. Power generation with different load resistances will be presented in the next section.


