Abstract
The present paper describes some aspects of the bubble size and concentration of a microbubble pump with respect to flow and pressure conditions. The microbubble pump used in the present study has an open channel impeller of a regenerative pump, which generates micro-sized bubbles with the rotation of the impeller. The bubble characteristics are analyzed by measuring the bubble size and concentration using the experimental apparatus consisting of open-loop facilities; a regenerative pump, a particle counter, electronic flow meters, pressure sensors, flow control valves, a torque meter, and reservoir tanks. To control the intake, and the air flowrate upstream of the pump, a high precision flow control valve is introduced. The bubble characteristics have been analyzed by controlling the intake air flowrate and the pressure difference of the pump while the rotational frequency of the pump impeller was kept constant. All measurement data was stored on the computer through the NI (National Instrument) interface system. The bubble size and concentration are mainly affected by three operating parameters: the intake air flowrate, the pressure difference, and the water flowrate supplied to the pump. It is noted that the operating conditions that can most effectively generate microbubbles in the range of 20 to 30 micrometers are at the pressure of 5 bar and at the air flowrate ratio of 4.0 percent for the present pump. Throughout the experimental measurements, it was found that the pump efficiency changed by less than 1.2 percent, depending on the intake air supply. The performance characteristics of microbubble generation obtained by experimental measurements are analyzed and discussed in detail.
1. Introduction
A microbubble defined as a bubble having the size of 50 micrometers or less and having several unique characteristics resulting from their fine size [1]. It has the characteristics of a large surface area due to its very small diameter, a slow rising velocity inside the liquid due to the low buoyancy force, self-pressurized dissolution, a superior mass transfer efficiency, and a high dissolution rate. Due to these characteristics, microbubbles are broadly applied in various fields; sewage treatment, water purification technology, ozone water disinfection, mineral processing, natural ecology restoration, bio-pharmaceutical production, fine chemical reactions, and so on [2,3]. With further applications of microbubble technology in human life and industry, it has been getting more attention in recent years. In addition to the field of application using the inherent characteristics of the microbubbles above, they have the potential to be applied in applications such as non-detergent cleaning, skin care, sterilization cleaning and anion effect generation.
The formation and growth mechanism of microbubbles is closely related to cavitation which is one of the hydrodynamic phenomena. Although it is able to be used as a method for generating microbubbles in research area, it is not used in large-scale bubble generation applications due to high cost and technical reasons. Therefore, the following methods are generally used for bubble generation.
Typical bubble generation methods include pressurized dissolution type, gas–water circulation type, and Venturi-type. For the pressurized dissolution type bubble generator, microbubbles are generated as the pressure decreases due to injecting pressurized air into a water tank. The method uses a supersaturated condition to dissolve gas under high pressure of 3–4 bars and the gas becomes very unstable and escapes from the water [4]. As a result, microbubbles are generated in a very short time. Kim et al. [5] investigated the effect of swirling chamber and breaker disk on bubble generation by pressurized dissolution method. For the gas–water circulation type bubble generator, Takahashi [6] proved that gas mixed in a vortex flow changes continuously into microbubbles as it is broken down by the vortex. Ikeura et al. [7] found that ozone microbubbles generation by pressurized dissolution type is more efficient than gas–water circulation type to remove the residual pesticide in vegetables. The Venturi-type bubble generator is similar to the pressurized dissolution type in the bubble generation method and has been widely used due to its simple structure. Yoshida et al. [8] found that microbubbles were generated through the collision of a gas with the pressure wall formed by a shock wave. Yin et al. [9] conducted an experimental study on the bubble size distribution in the turbulence flow for the Venturi-type bubble generator and proved that the averaged bubble diameter has a dependence on the Reynolds number. Uesawa et al. [10] researched the mechanism of the bubble breakup phenomenon in a Venturi tube and obtained experimental results that the bubbles expanded once into a divergence region of the Venturi tube and then contracted rapidly and broke up into a great number of fine bubbles. Gordiychuk et al. [11] investigated the effects of the flowrates of air and water on the bubble size for a Venturi tube connected bubble generator. They measured bubble size by picturing the flow and using a post-processing algorithm. Zhao et al. [12] visualized the details of the transportation of individual bubbles in a Venturi tube by using a digital image analysis (DIA) method. An extremely rapid deceleration and intense breakup process was observed at the entrance of the diverging section of the bubble generator.
The bubble generator types described above are based on the assumption that the growth and release of a sphere bubble is formed from nozzles or orifices, and this process consists of bubble expansion stage and collapse stage [13]. This complex process of the bubble formation necessarily involves a variety of additional techniques for precisely controlling the bubble size and amount of production. On the other hand, a microbubble pump generates microbubbles by forming a vortex flow using centrifugal force in the radial direction and reaction force in the circumferential direction by rotation of impeller.
The microbubble pump with a regenerative pump type impeller (hereinafter, the term ‘microbubble pump’ is used.) has the advantages of continuous micro-sized bubble generation and a being compact single unit. In addition, the microbubble pump is able to be applied to any small-scale application requiring microbubbles, and is easy to maintain, due to its simple structure. The microbubble pump adopted in the present study has a disk-type impeller with many vanes on its periphery rotating in an annular flow path as that is usual in conventional regenerative pumps. Therefore, it follows inherent characteristics of a regenerative pump, such as having high pressure at a low flow capacity [14]. Despite the relatively low mechanical efficiency compared to the other types of pumps having an equivalent impeller diameter, the regenerative pump has advantages, such as versatile capacity and scalability, low production cost, and robust reliability. Until now, researchers on regenerative turbomachinery have been interested in improving efficiency and performance. Karlsen-Davies and Aggidis [15] reviewed overall aspects of regenerative pumps and their basic principle of operation, areas of application, performance challenges, and the improvement of geometrical parameters. Quail et al. [16] carried out parametric design through one- and three-dimensional numerical techniques and Jeon et al. [17] tried to enhance the pump performance using an optimized design. Shimizu et al. [18] experimentally analyzed the flow patterns and the bubble size of methane–water two-phase flows.
The microbubble pump has both functions of a regenerative pump and a microbubble generation in a pressurized condition. The regenerative pump having multi impeller blades generates high suction pressure with the rotation of the impeller, and thus sucks gas through tube installed upstream of the pump. The inhaled gas mixes with water inside the pump and dissolves. It is noted that the microbubble pump is able to remove water-soluble gases effectively in chemical plant environments without complicated processes [19]. Also, it has the potential to replace the bubble generator applied to conventional dissolved air flotation (DAF) systems and has an advantage in terms of operating cost and energy saving [20].
Despite the various advantages described above, research on the microbubble pump has been rare until now. This is especially true when considering the bubble size and the concentration generated from the microbubble pump with respect to operating conditions which are important in evaluating the pump performance.
In the present study, the bubble size and the concentration of a microbubble pump are investigated by experimental measurements. To measure the bubble characteristics with respect to flowrate and pressure conditions, an open-looped measuring facility has been designed. A particle counter having optical sensors and an infrared laser and a tube-linked peristaltic pump are used for analyzing the microbubbles generated from the pump. Bubble characteristics are also measured by controlling the intake air flowrates and the pressure rise of the pump, while the rotational frequency of the pump impeller was kept constant. All measured data is stored on the computer through the NI interface system. The characteristics of generated microbubbles are obtained by experimental measurements and are analyzed and discussed in detail.
2. Experimental Setup
2.1. Microbubble Pump
The microbubble pump introduced in the present study has an open channel impeller, as shown in Figure 1. It has a duct inlet for water and a port for air supply, and a duct outlet for discharging water with microbubbles. The pump is composed of a regenerative impeller with multiple blades, a casing, and a dissolution tank for discharging the pressurized and mixed bubble water. Jang et al. [21,22] conducted a numerical analysis of a regenerative blower and observed that the fluid passes through each impeller blade with recirculation flow. In the same manner as the microbubble pump, the regenerative impeller induces higher a pressure at the inlet than the outlet and the local recirculation flow at each blade passage produces microbubbles by mixing and crushing the water and air supplied.
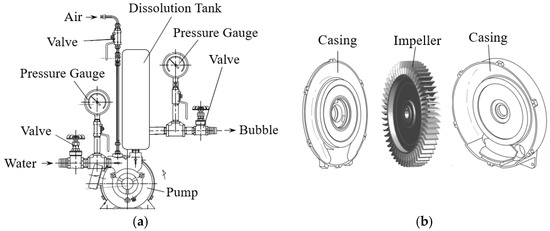
Figure 1.
Schematic view of test microbubble pump: (a) overall view; (b) pump.
The pump is made of stainless steel with capacity of 1.1 kW at rated operating conditions. A mechanical seal is installed between the pump casing and the drive shaft to prevent water leakage at high-pressurized operating conditions. The detailed specifications of the test pump are shown in Table 1. The flow and pressure coefficients of the pump from performance test at rated operating condition are 0.39 and 2.04, respectively. The outer diameter of the impeller is 72.6 mm and the number of blades is 48.

Table 1.
Specifications of test microbubble pump.
The flow coefficient () and pressure coefficient () of the pump are defined as follows.
where is the volumetric flowrate of water, is the pressure rise between the inlet and outlet of the microbubble pump, is the rotational velocity of the pump impeller at the blade tip, is the density of water, and is the cross-sectional area of the side channel of the microbubble pump.
2.2. Experimetal Apparatus and Method
Figure 2 shows the schematic diagram of the experimental apparatus of the microbubble pump. Using the experimental apparatus of the pump, the generation feature of the microbubbles and the bubble sizes are measured and analyzed with respect to the pump’s operating conditions. A water tank having the capacity of 1 ton is installed upstream of the pump to stabilize the water supply to the microbubble pump. The experimental apparatus has an open-loop water supply system, so the large water tank is necessary to keep the water supply continuous. Upper and lower reservoirs made of acrylic are installed upstream and downstream of the test pump for the checks of the water level and the visual monitoring of the microbubbles. The water level of the upper reservoir is kept constant by the optimal operation of the pump installed between the water tank and the upper reservoir. Mixed water containing microbubbles flows into the lower reservoir through the pipeline at the bottom of it, and the vertical height from the discharge port to the free surface is 0.42 m.
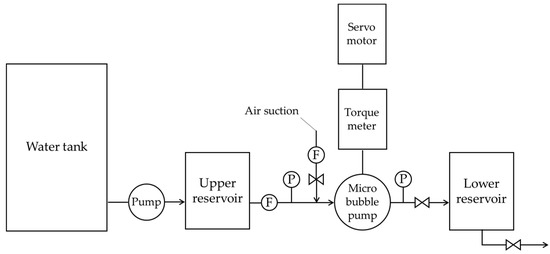
Figure 2.
Schematic diagram of a microbubble pump experimental apparatus. (F: electronic flow meter, P: electronic pressure sensor).
Two electronic flow meters are installed upstream of the microbubble pump to measure the flowrate of the supplied water and the air sucked to the microbubble pump, respectively. As for measuring the water flowrate supplied to the pump, the electronic flow meter having a range between 7 and 150 LPM (liter per minute) has been used (VVX25, Sika, Kaufungen, Germany). Considering the small air flowrate to the pump, a thermal flowrate sensor with high sensitivity and high response characteristics is introduced. The air flowrate meter has a measuring range between 0 and 2 LPM (CMS0002, Azbil, Tokyo, Japan). Two electronic pressure sensors are installed, one upstream and one downstream of the test pump to measure the pressure difference of the pump. A pressure sensor (model: PSAN-(L)V01C(P)A, Autonics, Busan, Korea) having a range between −101.3 and 0 kPa is installed upstream of the pump. On the other hand, a pressure sensor up to 1000 kPa has been used for measuring high positive pressure (model: PSAN-(L)1C(P)A, Autonics, Busan, Korea). Two valves are installed to control the suction air flowrate and the pressure of the pump.
The pump driving system is introduced to control the rotational speed of the pump and to measure the pump driving torque. A servo motor (FMA-CN10-AB00, Higen, Changwon, Korea) of 1.0 kW is installed to drive the pump at a constant rotational speed. A torque meter with a tachometer (SS-100, Ono Sokki, Yokohama, Japan) is selected for measuring the rotational speed and the torque of the pump.
A microbubble counting system is used to measure the size and the concentration of the microbubbles that are generated by the microbubble pump in respect to time. As shown in Figure 3, a microbubble counting system consists of a peristaltic pump, a particle counter, and a data processing PC. A particle counter (PC3400, Chemtrac, Norcoss, GA, USA) having optical sensors and processing electronics, including an infrared laser, is introduced. The measuring range of the bubble size is between 2 and 125 μm while the pump flowrate of the microbubble into the particle counter is kept at 75 mL/min. A constant flow pump (JWS-600, JenieWell, Seoul, Korea) is used to send a constant amount of the microbubbles to the counting system through a tube-linked peristaltic pump (JWS-600, JenieWell, Seoul, Korea).
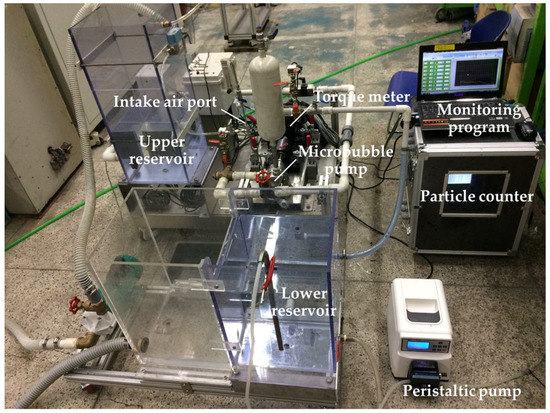
Figure 3.
Picture of a microbubble pump experimental apparatus.
Microbubbles have very sensitive characteristics, depending on the pump pressure and suction air flowrate. In order to measure the performance characteristics of microbubble generation, the measuring ranges of variables, such as pressure and air flowrate, are determined through preliminary experiments. The experimental conditions are shown in Table 2. In the table, the air flowrate ratio, Ra, represents the ratio of the air flowrate and the water flowrate.
Table 2.
Experimental conditions.
3. Result and Discussion
3.1. Performance Curve of Test Microbubble Pump
Prior to measuring the microbubbles generated, the pump performance is obtained by an open loop pump test facility, as shown in Figure 4. It is noted that the pump performance is determined by the water supply only, in the absence of air suction. Mechanical efficiency () of the pump is derived from following Equation (3).
where and are the torque acting on the rotational axis and the angular velocity of the microbubble pump impeller, respectively.
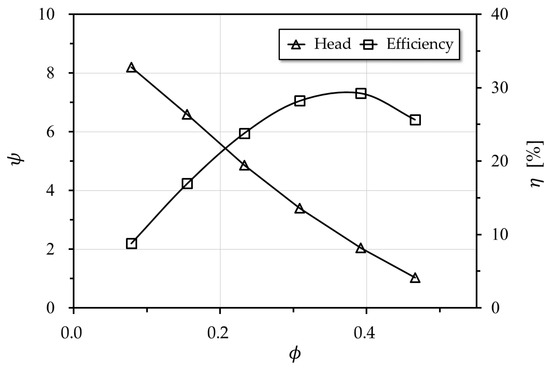
Figure 4.
Performance curve of test microbubble pump.
3.2. Bubble Size and Distribution
Since the diameter of microbubbles are usually considered to be 50 micrometers or less, the present study also analyzes the bubble size range. Figure 5, Figure 6 and Figure 7 show bubble concentration (c) with respect to the bubble diameter (d) at the three different pump pressure conditions, while the air flowrate ratio (Ra) also being changed. The particle counter used for the measurement of the bubble size and concentration automatically converts the total counts of particles to the volume of them and displays the concentration of particles in ppb. That is, the bubble concentration in the unit of ppb means the relative volume ratio of air and water with a scale of one billionth. It is noted that the bubble concentration is determined at the fixed rotational speed of impeller of 3550 rpm. As shown in Figure 6, the bubble concentration is higher when the pump pressure is at 5 bar, than the other two pressures in Figure 5 and Figure 7. A higher bubble concentration is distributed between the 20 and 30 micrometer bubble diameters at a pump pressure of 5 bar, as shown in Figure 6. When considering the microbubble generation by mixing the water and suction air at the blade passage with the rotation of the impeller, it is understood that optimal pump pressure is important to generate a higher concentration of microbubbles. On the other hand, the amount of suction air is also an important factor for bubble generation.
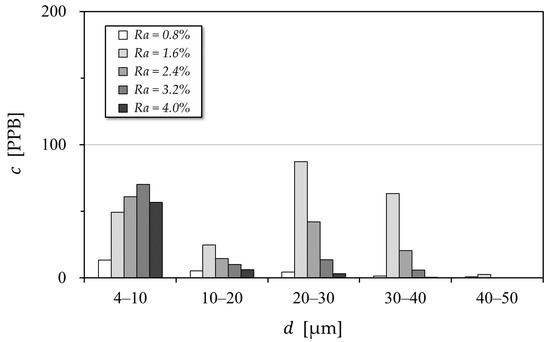
Figure 5.
Bubble concentrations at the pump pressure of 4 bar.
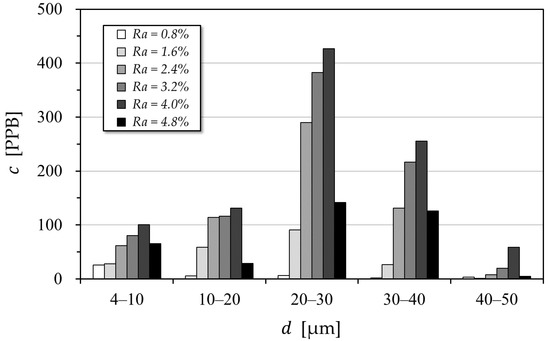
Figure 6.
Bubble concentrations at the pump pressure of 5 bar.
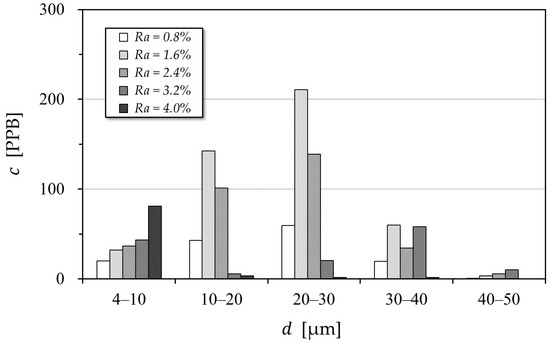
Figure 7.
Bubble concentrations at the pump pressure of 6 bar.
Figure 8 shows the bubble concentration with respect to the air flowrate ratios at the pump pressure of 5 bar, which is the optimal operation condition for microbubble generation. As shown in the figure, the microbubble concentration at the range of 20–30 micrometers is the most prevalent when compared to other ranges. It is noted that the most efficient operational condition for microbubble generation is located near the 4.0 percent air flowrate ratio. The bubble concentration increases with the increase of the intake air flowrate ratios from 0.8 to 4.0, and then rapidly decreases at 4.8 percent. Thus, the optimal intake air amount for the maximum bubble concentration can be determined.
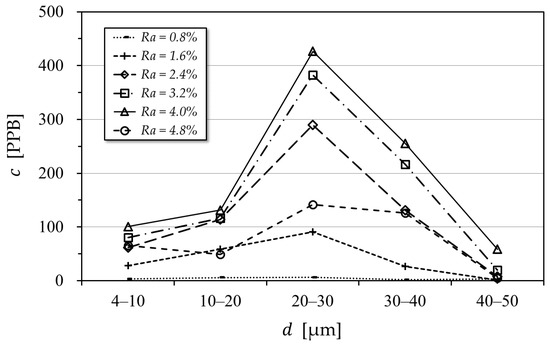
Figure 8.
Bubble concentration with respect to the airflow ratios at the pump pressure of 5 bar.
Figure 9 shows microbubbles from the maximum generation condition with the pump pressure of 5 bar and the air flowrate ratio of 4.0 percent, and the minimum condition with the pump pressure of 4 bar and the air flowrate ratio of 3.2 percent. Unlike to the picture of Figure 9a, the microbubbles have a gray milky color under the best operational condition in Figure 9b.
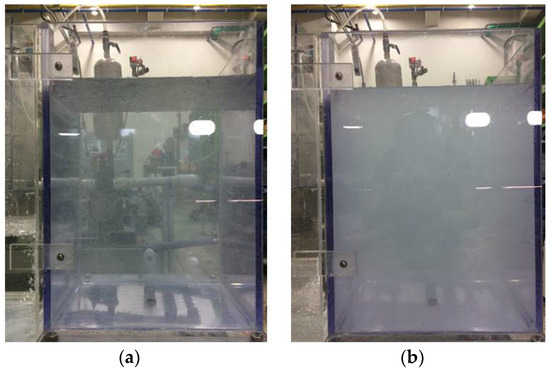
Figure 9.
Picture of microbubbles: (a) pump pressure of 4 bar and air flowrate ratio of 3.2 percent; (b) pump pressure of 5 bar and air flowrate ratio of 4.0 percent.
3.3. Effect of Intake Air Flowrate on Pump Performance
In order to understand the effect of the suction air flowrate on the pump performance, the pump performance is compared at the operational conditions of the pump, with the pressure of 5 bar and the air flowrate ratio of 4.0 percent, as shown in Figure 10. This operation condition corresponds to the maximum generation of microbubbles. As shown in the figure, pressure and efficiency have a similar tendency for both air suction conditions, while the maximum difference of the pump efficiency is less than 1.2 percent. Therefore, the performance difference of the microbubble pump can be neglected depending on the air flowrate ratio.
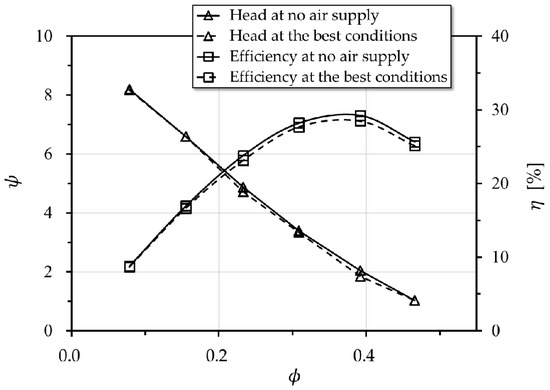
Figure 10.
Effect of the suction air flowrate on the pump performance.
3.4. Relationship between Microbubble Generation and Dissolved Oxygen
For measuring the dissolved oxygen concentration during microbubble generation, a dissolved oxygen meter with a range between 0 and 90 mg/L has been used (Orion Star A223, Thermo Scientific, Waltham, MA, USA). Its resolution is 0.01 or 0.1 mg/L and has a relative accuracy is ±0.2 mg/L.
Figure 11 shows the dissolved oxygen and microbubble concentration with respect to time at the pump pressure of 5 bar and the air flowrate of 4.0 percent, which is the maximum microbubble generation condition. The dissolved oxygen concentration is measured during microbubble generation. As shown in the Figure, dissolved oxygen rapidly increases up to 180 s after pump operation, then increases more gradually, subsequently decreasing rapidly after stopping pump operations at 420 s. It can be seen that the tendency of the oxygen dissolved amount changing in resects to time is the same as the generated amount of microbubbles. From these results, it can be said that the time variation of the oxygen concentration and the concentration of microbubbles measured in the present study have a close relationship from generation to extinction.
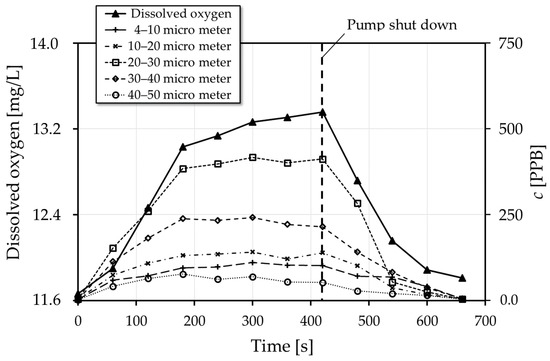
Figure 11.
Dissolved oxygen and microbubble concentration in respect to time at the pump pressure of 5 bar and the air flowrate ratio of 4.0 percent.
3.5. Correlation between Microbubble Diameter and Terminal Rise Velocity
The terminal rise velocity estimated at the lower reservoir where the microbubbles generated from the pump are stored as shown in Figure 3 is compared to theoretical Equation for spherical fluid body derived by Hadamard and Rybczynski as follows [23,24].
where , , , , and are the terminal rise velocity, the difference in density between air and water, gravitational acceleration, the radius of the microbubble, viscosity of water and internal viscosity of air, respectively. In case of negligible internal viscosity like air, Equation (4) and diameter of microbubble become following Equations:
where is the diameter of microbubble.
As shown in Equation (6), the bubble diameter can be predicted from the terminal velocity. In the methodology to determine it, Parkinson et al. have introduced visualization and image analysis by attaching a high-speed camera [25]. In this study, it was estimated from the time required for the concentration change of microbubbles at the conditions under which the microbubble was generated at the maximum for pump pressure of 4–6 bar.
Figure 12 shows the terminal velocity with respect to the microbubble diameter. In the figure, Hadamard and Rybczynski indicate the theoretical relation between the microbubble diameter and the terminal velocity. The microbubble diameters for three different pump pressures shows a similar tendency to the theoretical formula of Hadamard and Rybczynski. In particular, the microbubble diameter of about 20 m determined at the pump pressure of 5 bar shows a relatively good agreement to the value acquired from the theoretical formula. It is noted that the highest concentration of microbubbles measured by the particle counter is at the pump pressure of 5 bar. Throughout the theoretical comparison of the microbubble size based on the terminal velocity, it can be said that the experimental study on the characteristics of microbubbles generated from the pump with respect to operating conditions has been carried out properly.
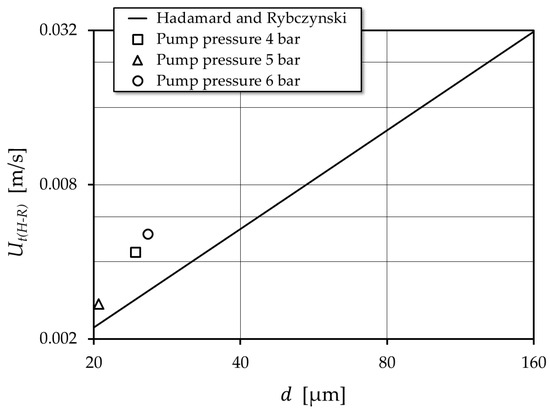
Figure 12.
Terminal rise velocity with respect to microbubble diameter.
4. Conclusions
Bubble size and the concentration of a microbubble pump have been investigated by controlling intake air flowrates and pump pressure of 4, 5 and 6 bar, while the rotational frequency of the pump impeller was kept constant. The results are summarized as follows:
- (1)
- Microbubble pumps with a regenerative impeller induce higher pressure differences from the inlet to the outlet and local recirculation flow at each blade passage. Considering the microbubble generation by mixing the water and suction air at the blade passage with the rotation of the impeller, optimal pump pressure is important to generate a higher concentration of microbubbles. It is noted that the amount of air suction is also an important factor for optimal bubble generation.
- (2)
- Among the three different pump pressures, the bubble concentration of the test microbubble pump is highest when the pump pressure is 5 bar. The highest bubble concentration is distributed between the 20 and 30 micrometer bubble diameters, while the air flowrate ratio (Ra) is 4.0 percent.
- (3)
- In the condition of higher bubble concentrations, it can be seen that pressure and efficiency of the microbubble pump have a similar tendency, regardless of the air supply. In the present pump, the maximum difference of the pump efficiency is less than 1.2 percent. So, the performance differences of the microbubble pump can be neglected, depending on the air flowrate ratio.
- (4)
- Throughout the measurement of the dissolved oxygen concentration during microbubble generation, the tendency of the amount of oxygen dissolved to change with respect to time is the same as the generated amount of microbubbles. It is noted that the time variation of the oxygen concentration and the concentration of microbubbles have a close relationship from generation to extinction.
- (5)
- Using a theoretical comparison of the terminal rise velocity with respect to the bubble size derived by Hadamard and Rybczynski, the microbubble diameters obtained from present measurements show a similar tendency to the theoretical formula.
Author Contributions
C.-M.J. designed the experiments; J.-Y.Y. advised throughout the research; S.-Y.J. performed the experiments, analyzed the data, and wrote the paper.
Funding
This work is supported by a grant (13IFIP-B06700801) from Industrial Facilities & Infrastructure Research Program funded by the Ministry of Land, Infrastructure and Transport of Korea government.
Conflicts of Interest
The authors declare no conflicts of interest.
Nomenclature
| concentration of microbubbles | |
| diameter of microbubble | |
| gravitational acceleration | |
| radius of microbubble | |
| cross-sectional area of side channel of microbubble pump | |
| pressure rise between inlet and outlet of microbubble pump | |
| volumetric flowrate of water | |
| Ra | air flowrate ratio |
| torque acting on rotational axis of microbubble pump impeller | |
| rotational velocity of microbubble pump impeller | |
| terminal rise velocity | |
| Greek Letters | |
| machinical efficiency of microbubble pump | |
| viscosity of water | |
| internal viscosity of air | |
| difference in density between air and water | |
| density of water | |
| flow coefficient | |
| pressure coefficient | |
| angular velocity of microbubble pump impeller |
References
- Khuntia, S.; Majumder, S.K.; Ghosh, P. Microbubble-aided water and wastewater purification: A review. Rev. Chem. Eng. 2012, 28, 191–221. [Google Scholar] [CrossRef]
- Takahashi, M. Effect of shrinking microbubble on gas hydrate formation. J. Phys. Chem. B 2003, 107, 2171–2173. [Google Scholar] [CrossRef]
- Takahashi, M. Potential of Microbubbles in Aqueous Solutions: Electrical Properties of the Gas-Water Interface. J. Phys. Chem. B 2005, 109, 21858–21864. [Google Scholar] [CrossRef] [PubMed]
- Agarwal, A.; Ng, W.J.; Liu, Y. Principle and application of microbubble and nanobubble technology for water treatment. Chemosphere 2011, 84, 1175–1180. [Google Scholar] [CrossRef] [PubMed]
- Kim, H.S.; Lim, J.Y.; Park, S.Y.; Kim, H.J. Effects on swirling chamber and breaker d3isk in pressurized-dissolution type micro-bubble generator. KSCE J. Civ. Eng. 2017, 21, 1102–1106. [Google Scholar] [CrossRef]
- Takahashi, M. Base and technological application of micro-bubble and nanobubble. Mater. Integration 2009, 22, 2–19. [Google Scholar]
- Ikeura, H.; Kobayashi, F.; Tamaki, M. Removal of residual pesticide, fenitrothion, in vegetables by using ozone microbubbles generated by different methods. J. Food Eng. 2011, 103, 345–349. [Google Scholar] [CrossRef]
- Yoshida, A.; Takahashi, O.; Ishii, Y.; Sekimoto, Y.; Kurata, Y. Water purification using the adsorption characteristics of microbubbles. Jpn. J. Appl. Phys. 2008, 47, 6574–6577. [Google Scholar] [CrossRef]
- Yin, J.; Li, J.; Li, H.; Liu, W.; Wang, D. Experimental study on the bubble generation characteristics for an venturi type bubble generator. Int. J. Heat Mass Transf. 2015, 91, 218–224. [Google Scholar] [CrossRef]
- Uesawa, S.; Kaneko, A.; Nomura, Y.; Abe, Y. Study on bubble Beakup behavior in a venturi tube. Multiphane Sci. Technol. 2012, 24, 257–277. [Google Scholar] [CrossRef]
- Gordiychuk, A.; Svanera, M.; Benini, S.; Poesio, P. Size distribution and Sauter mean diameter of micro bubbles for a Venturi type bubble generator. Exp. Therm. Fluid Sci. 2016, 70, 51–60. [Google Scholar] [CrossRef]
- Zhao, L.; Mo, Z.; Sun, L.; Xie, G.; Liu, H.; Du, M.; Tang, J. A visualized study of the motion of individual bubbles in a venture-type bubble generator. Prog. Nuclear Energy 2017, 97, 74–89. [Google Scholar] [CrossRef]
- Rodríguez-Rodríguez, J.; Sevilla, A.; Martínez-Bazán, C.; Gordillo, J.M. Generation of Microbubbles with Applications to Industry and Medicine. Ann. Rev. Fluid Mech. 2015, 47, 405–429. [Google Scholar] [CrossRef]
- Nesbitt, B. Handbook of Pumps and Pumping; Elsevier: London, UK, 2005. [Google Scholar]
- Karlsen-Davies, N.D.; Aggidis, G.A. Regenerative liquid ring pumps review and advances on design and performance. Appl. Energy 2016, 164, 815–825. [Google Scholar] [CrossRef]
- Quail, F.J.; Scanlon, T.; Baumgartner, A. Design study of a regenerative pump using one-dimensional three-dimensional numerical techniques. Eur. J. Mech. B/Fluids 2012, 31, 181–187. [Google Scholar] [CrossRef]
- Jeon, S.Y.; Kim, C.K.; Lee, S.M.; Yoon, J.Y.; Jang, C.M. Performance enhancement of a pump impeller using optimal design method. J. Them. Sci. 2017, 26, 119–124. [Google Scholar] [CrossRef]
- Shimizu, T.; Yamamoto, Y.; Tenma, N. Experimental analysis of two-phase flows and turbine pump performance. Int. J. Offshore Polar Eng. 2016, 26, 371–377. [Google Scholar] [CrossRef]
- Ahmadun, F.-R.; Pendashedh, A.; Abdullah, L.C.; Biak, D.R.A.; Madaeni, S.S.; Abidin, Z.Z. Review of technologies for oil and gas produced water treatment. J. Hazard. Mater. 2009, 170, 530–551. [Google Scholar]
- Lundh, M.; Jonsson, L.; Dahlquist, J. The influence of contact zone configuration on the flow structure in a dissolved air flotation pilot plant. Water Res. 2002, 36, 1585–1595. [Google Scholar] [CrossRef]
- Jang, C.M.; Han, G.Y. Enhancement of Performance by Blade Optimization in Two-Stage Ring Blower. J. Them. Sci. 2010, 19, 383–389. [Google Scholar] [CrossRef]
- Jang, C.M.; Lee, J.S. Shape Optimization of a Regenerative Blower Used for Building Fuel Cell System. Open J. Fluid Dyn. 2012, 2, 208–214. [Google Scholar] [CrossRef]
- Hadamard, J.S. Hadamard, Mouvement permanent lent d’une sphère liquide et visqueuse dans un liquide visqueux. Acad. C. R. Sci. 1911, 152, 1735–1752. [Google Scholar]
- Rybczynski, W. Über die fortschreitende Bewegung einer flüssigen Kugel in einem zähen medium. Bull. Acad. Sci. Cracovie Ser. A 1911, 1911, 40–46. [Google Scholar]
- Parkinson, L.; Sedev, R.; Fornasiero, D.; Ralston, J. The terminal rise velocity of 10–100 μm diameter bubbles in water. J. Colloid Interface Sci. 2008, 322, 168–172. [Google Scholar] [CrossRef] [PubMed]


© 2018 by the authors. Licensee MDPI, Basel, Switzerland. This article is an open access article distributed under the terms and conditions of the Creative Commons Attribution (CC BY) license (http://creativecommons.org/licenses/by/4.0/).