Article

Performance Evaluation of Mesophilic Anaerobic Digestion of Chicken Manure with Algal Digestate

1
College of Water Resources and Civil Engineering, China Agricultural University, Beijing 100083, China
2
Department of Environmental Engineering, Technical University of Denmark, Kgs. DK-2800 Lyngby, Denmark
3
Department of Agricultural and Biological Engineering, University of Illinois at Urbana-Champaign, Urbana, IL 61801, USA
4
Key Laboratory of Nonpoint Source Pollution Control, Ministry of Agriculture, Beijing 100081, China
*
Authors to whom correspondence should be addressed.
Energies 2018, 11(7), 1829; https://doi.org/10.3390/en11071829
Submission received: 4 June 2018 / Revised: 26 June 2018 / Accepted: 27 June 2018 / Published: 12 July 2018

Abstract

:
Dilution is considered to be a fast and easily applicable pretreatment for anaerobic digestion (AD) of chicken manure (CM), however, dilution with fresh water is uneconomical because of the water consumption. The present investigation was targeted at evaluating the feasibility and process performance of AD of CM diluted with algal digestate water (AW) for methane production to replace tap water (TW). Moreover, the kinetics parameters and mass flow of the AD process were also comparatively analyzed. The highest methane production of diluted CM (104.39 mL/g volatile solid (VS)) was achieved with AW under a substrate concentration of 8% total solid (TS). The result was markedly higher in comparison with the group with TW (79.54–93.82 mL/gVS). Apart from the methane production, considering its energy and resource saving, nearly 20% of TW replaced by AW, it was promising substitution to use AW for TW to dilute CM. However, the process was susceptible to substrate concentration, inoculum, as well as total ammonia and free ammonia concentration.

1. Introduction

Livestock manure without appropriate management can cause serious problems to the environment, such as odor, attraction of insects, rodents, and other pests, release of animal pathogens, as well as surface and groundwater pollution [1]. Anaerobic digestion (AD) is considered to be an attractive and efficient technology for livestock manure treatment, apart from the main target of organic matter removal and environment pollution control, simultaneously producing biogas for local energy needs [2]. Chicken manure (CM) with an original dry matter of 20–25% or more, has a high fraction of biodegradable organic matter [3,4]. Thus, conversion of the organic matter of CM to renewable energy through the AD process will not only reduce the adverse impact on the environment, but will also make great contributions to the energy supply [5].
Although AD technology in livestock manure treatment for biogas production is very mature and considerable research has been intensively conducted [6,7], limited studies can be found on the AD of CM, especially mono-digestion [4,8]. The AD of original CM with a low carbon to nitrogen (C/N) ratio of 5–10 usually ends up with reactor instability, and even failure, due to its inactive enzymes, affecting material transportation and inhibiting methanogenic microflora as a result of free ammonia (FA) accumulation [9,10,11,12]. Total ammonia nitrogen (TAN), produced through biological degradation of nitrogenous matter, was made up of ammonium ions (NH4+) and FA. Both forms can directly and indirectly lead to inhibition in the AD process [12]. For one thing, the partitioning between these forms was related to temperature and pH [10]. Ammonia inhibition was proven to occur in the range of 1500–3000 mg/L TAN with pH above 7.4, whereas if the TAN concentrations were in excess of 3 g/L, ammonia was claimed to be toxic irrespective of pH [5,13]. In addition, acclimated or unacclimated inoculum used was also an important factor for ammonia tolerance [14]. TAN concentration of 1700–1800 mg/L was completely inhibitory with unacclimated inoculum under mesophilic conditions [12]. However, with acclimation, inhibitory TAN levels could increase up to 7000 mg/L or more [15], and 100% ammonia inhibition occurred in the range of 8000–13,000 mg/L depending on the acclimatization condition and the pH of the reactor [16]. Thus, it is important to state the temperature, pH conditions, and inoculum quality while reporting the ammonia inhibition thresholds.
Several attempts were proposed to avoid the ammonia accumulation during the AD process of CM. Co-digestion with different carbon-rich biomasses to achieve a favorable C/N ratio was tested, such as co-digestion with hog wastes [6], municipal solid waste [17], and chicken processing waste [18]. Dilution with water to reduce high TS concentration of the original CM (20–25%) to a lower and appropriate one (0.5–3%) was investigated to eliminate ammonia inhibition [19], which has been widely used in the actual applications. However, dilution with fresh water is considered to be uneconomical due to the water consumption and the subsequent treatment of large amounts of effluent [20,21]. Meanwhile, fresh water cannot enhance the feedstock biodegradability or the operational efficiency of the AD process [10]. Therefore, wastewater containing certain amounts of organic matter has been used to dilute organic waste to produce biogas because the goals of enhancing methane production, recycling wastewater, and water saving can be achieved simultaneously, such as seawater for camel excrement [22] and sugar mill wastewater for rice straw and cow dung [19]. However, there is a lack of knowledge about the effect of different diluents on the methane production and stability in mono-digestion of CM at different substrate concentration levels.
Liquid digestate, as an important byproduct of AD process, is rich in recalcitrant organic compounds (total nitrogen of 139–3456 mg/L, total phosphorus of 7–381 mg/L) and its management is considered as the bottleneck for the biogas industry [23]. Microalgae can utilize carbon, nitrogen, phosphorus, and other nutrients from digestate, enhancing microalgae growth, as well as reducing cultivation costs and environmental impacts [24]. Chlorella 1067 can recover most of the nutrients in CM-based digestate with its high protein content of 47.34%TS and a relatively low C/N of 5.97 [25]. However, the separation of Chlorella 1067 and digestate involves additional energy consumption and the substantial amounts of effluent should be further treated.
In this study, two kinds of diluents (tap water and algal digestate water) were investigated in terms of the methane production potential and process performance. Results were modelled with different kinetic models to validate the effect of different diluents on the ultimate methane yield. Mass flow analysis was also performed to assess and compare the feasibility for further application. Moreover, the multi-inhibited factors in the AD process of diluted CM were investigated, such as ammonia, substrate concentration, and inoculum.

2. Results and Discussion

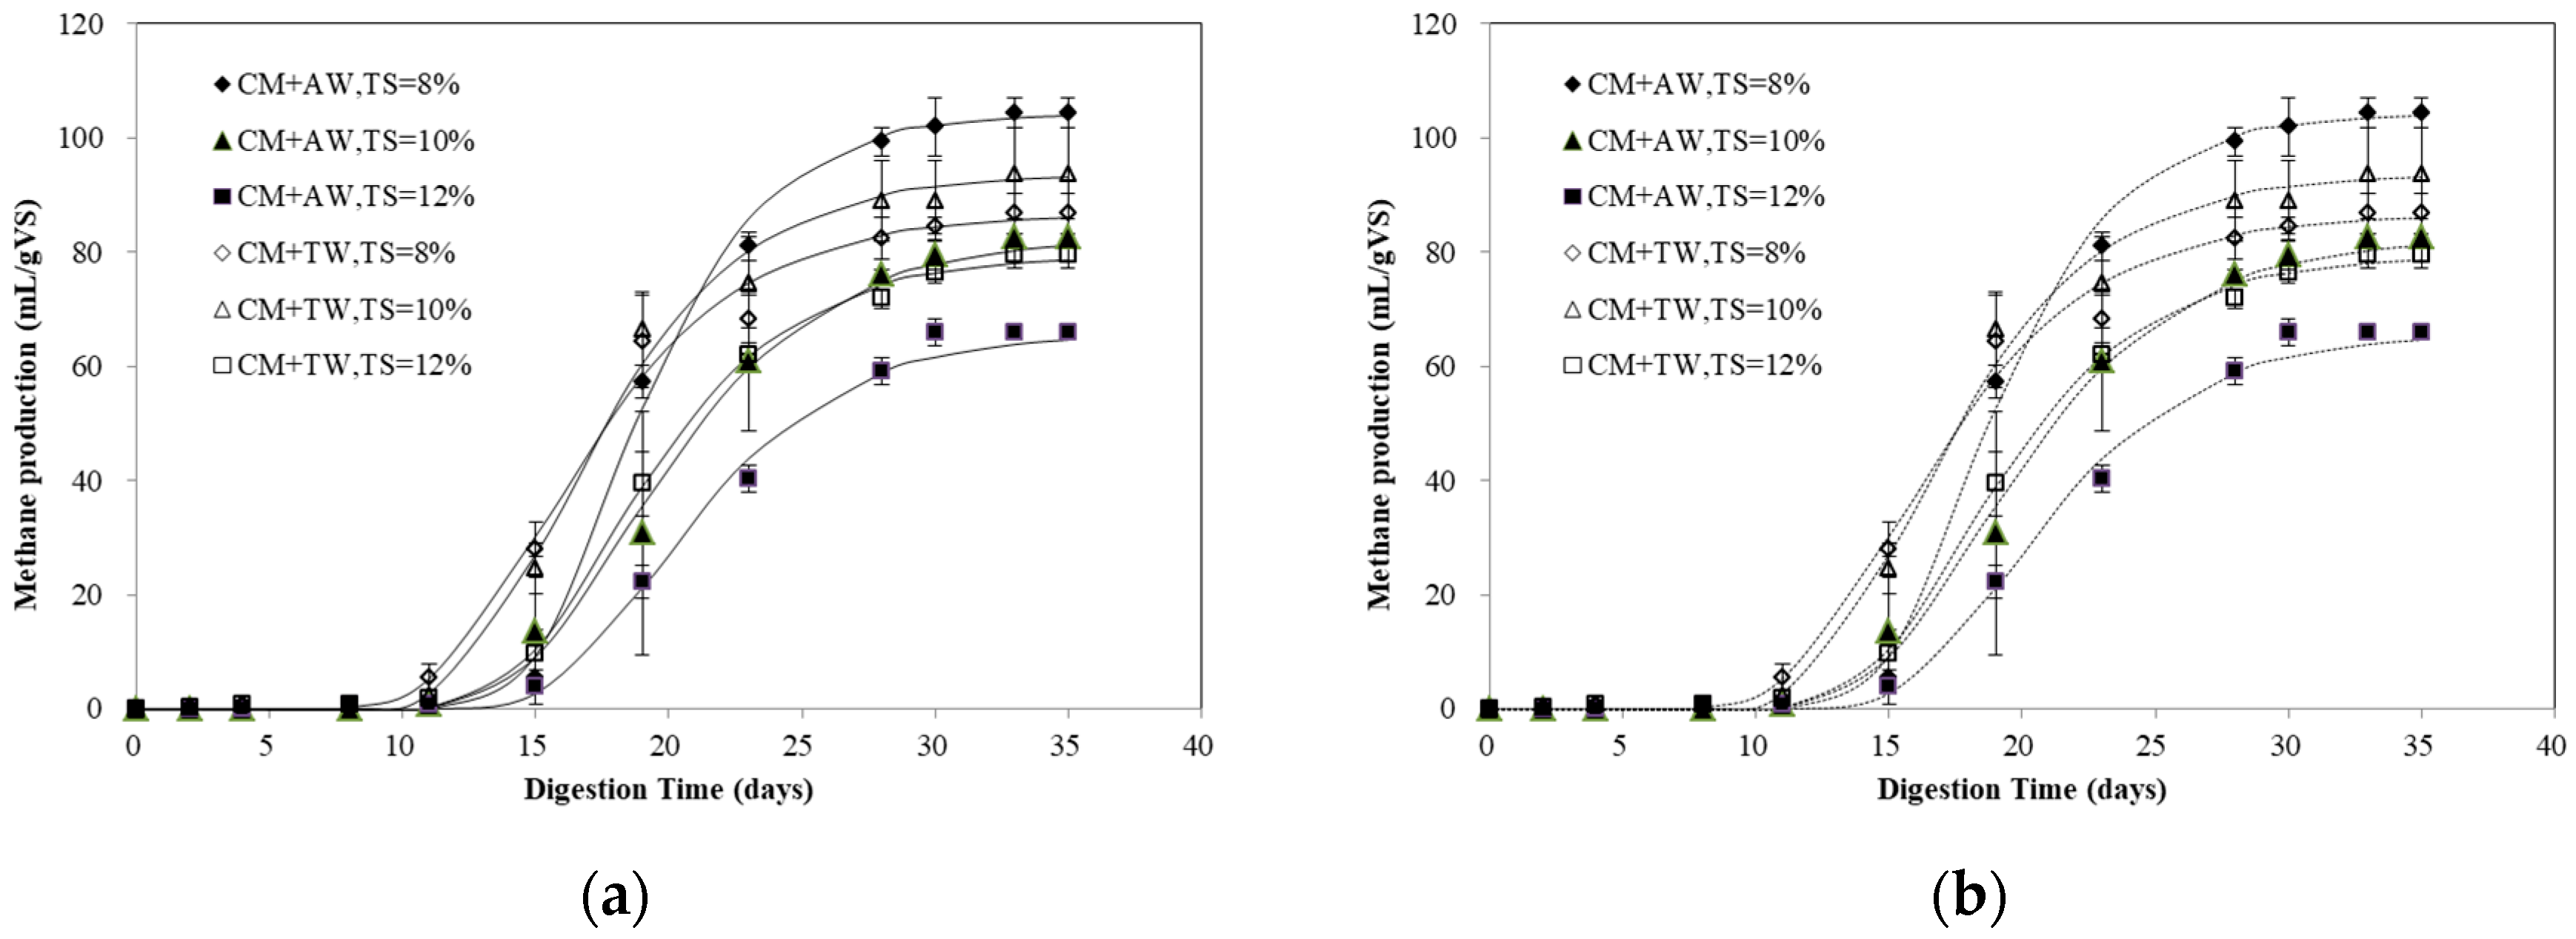
2.1. Methane Production

The maximal methane production (104.39 mL/gVS) of diluted CM was obtained with AW at TS of 8% (Figure 1), which was 11.27% higher than that of the best performed TW group at TS of 10% (93.82 mL/gVS). Apart from the treatment of AW at TS of 8%, the methane production of the AW group were all less than that of the TW group under the same TS levels. The AD process was found to be very sensitive to the feeding substrate composition [26]. For diluted CM, it was proved that the characteristics of different diluents, especially the nutrient composition, could affect the AD process. Compared with TW, AW, as a mixture of digestate and Chlorella 1067, contains a certain amount of organic matter (TS: 0.21–0.47%, VS: 44.66–52.62%TS), as well as a number of metal elements and trace elements. It is worth mentioning that algae biomass had been widely used for co-substrate in the AD process, and it demonstrated that synergism had occurred while Chlorella 1067 was used as a co-feedstock for CM [25]. In this study, the synergism might be achieved at the low substrate concentration of 8% TS. In addition, high nitrogen substrates, like CM, can pose an inhibitory effect in the AD process through NH3 accumulation [18]. While the ammonia inhibition occurs, the pathway of acetate shifts from acetoclastic to hydrogenotrophic methanogenesis [10,27]. However, for AW, it can provide the lacking nutritional elements to synthesize the enzymes needed in syntrophic hydrogenotrophic methanogenesis, especially at the essential stage for propionic acid degradation [10].
The methane yield of diluted CM obtained in the present study was lower than those reported in the literature (270–400 mL/gVS) [20,21,28]. It should be pointed out that anaerobic digestion is a dynamic process influenced by several parameters, like inoculum source, inoculum substrate ratio, nutrient, and others. Moset et al. [29] reported that the inoculum source had a significant impact on methane potential and the inoculum to substrate ratio (ISR) was dependent on the substrate. Due to the long time for the microbial population to adapt and degrade the substrate, the longer lag phase was observed at lower ISR (0.25). This was in line with the result of the present study (Figure 1). Li et al. [28] pointed out that the suitable substrate-to-inoculum ratio for mono-digestion of CM was 1.5. In this study, a low C/N ratio of CM, high ammonia concentration, poorly-adapted inoculum, and low ISR (<0.25) may be the reason for the low methane production. The amount of microorganisms in the digester was increased with higher ISR and it was beneficial for a well-balanced startup of the anaerobic reaction and inhibition resilience [18,30]. Thus, it is very important to provide the necessary microorganisms with a high ISR and a low substrate concentration to reduce feeding shock and inhibition risk, as well as shorten the adaptation time of the microbial population.

2.2. Kinetic Analysis

The experimental data were modelled with the modified Gompertz model and logistic model (Figure 1) and the results are summarized in Table 1. The results of the two models and the experimental data were in high agreement (p > 0.05). The R2 values of the modified Gompertz model were all higher than 0.992, with the difference between the measured and predicted methane production ranging from <0.40% to <1.85%. For the logistic model, the R2 values and the difference percentage were 0.9908–0.9970 and 0.08–0.76%, respectively.
An obvious lag phase was detected since less than 10% of the final cumulative methane production of diluted CM was obtained within the first ten days (Figure 1). Obviously, the inoculum was not adapted to afford digesting the diluted CM, so the AD process was in an inhibited steady-state or inhibited stage within the first several days, and it was expected to observe an initial lag phase in each trial. Additionally, uric acid breakdown causes the ammonia accumulation. CM contains a high content of the undigested proteins, uric acid, and nitrogen contents [5]. While anaerobically decomposed, the uric acid could significantly contribute to the formation of ammonia: 0.75 parts methane, 4.25 parts carbon dioxide, and four parts of ammonia would be produced by one part uric acid [4]. It should be noted that the AW group showed a lag phase of 14–16 days for both the modified Gompertz model and the logistic model, longer than that of the TW group (Table 1). Chlorella 1067, cultivated in digestate, was also a nitrogen-rich biomass like CM [25]. Thus, with dilution with AW (TAN 268.24–485.50 mg/L), some additional nitrogen might have been added and increased the inhibition risk. The methane production gradually increased after an obvious lag phase. The maximal methane production of CM was achieved with AW at TS of 8%, indicating that AW and CM had a positive effect on the methane production at a low substrate concentration. In addition, for nitrogen-rich CM with a high substrate concentration, the AD process was hampered by FA inhibition resulting in a poor methane yield and, consequently, a long retention time. These results were consistent with the study of Bujoczek et al. on the high solid AD of CM, and it was reported that highest gas production was obtained at a TS level of 5% [4].

2.3. pH, TAN, FA Concentration, and C/N of Liquid Digestate

The TAN concentration of diluted CM with AW and TW at different substrate concentration was presented in Figure 2a. Under mesophilic conditions, TAN concentrations continued to rise within 17 days and had a range of 1970 to 2460 mg/L at the 17th day. It was confirmed that the process was not adapted to high TAN concentrations as evidenced by the long lag phase and low methane production in the early stage (Figure 1 and Table 1). Due to the characteristics of AW, the initial TAN concentration of the AW group was similar, or slightly higher, than that of the TW group at the same TS levels. It was interesting that the TAN concentration was found to be similar for both the AW group and the TW group as the AD process went on. In addition, it was found that the higher substrate concentration, the higher the TAN concentration, so dilution was an alternative to reduce the risk of TAN inhibition during CM mono-digestion. Additionally, the low substrate concentration was a benefit for startup, process stability, diluting ammonia toxicity, and even methane production.
In the first nine days, FA concentration gradually increased within the range of 100 mg/L, and then increased significantly with the increasing pH value and TAN concentration (Figure 2a–c). As the TAN and FA increased, the pH value also increased, which was also reported by Hassan et al. [31]. The maximal FA values for all the treatments were found in the 17th day. Apart from the FA concentration (110–200 mg/L) of the AW group with substrate concentrations of 8% and 10% TS, that of the other treatments were all more than 300 mg/L. Different studies reported that below 99–150 mg/L was the acceptable limit for the methanogens [32,33]. Therefore, the FA concentrations of all the treatments were over the inhibition threshold, which might result in an unstable AD process due to the loss of methanogenic activity [34]. After 17 days, the microorganisms gradually adapt to the environment, the FA concentration began to decrease and the methane yield rapidly increased. At the end of the experiment, the FA concentration was decreased at about 150 mg/L for each treatment.
The methane production of diluted CM was low in this study. The effect would be carried out from two negative aspects. One was the higher FA concentration caused by the raw material characteristics, high initial substrate concentration, and low ISR. The other was the low C/N ratio of the liquid fractions of the digested feedstock (Figure 2d). Specifically, the initial C/N ratio of the AW group (4.46–5.60) was lower than that of the TW group (6.77–7.16), while there was only the diluent variable at this time due to the high TN concentration of AW. However, they were both outside the ideal range of the C/N ratio of 20–30 [35]. This was mainly caused by intrinsic characteristics of CM. In addition, the best performed methane production and degradation efficiency of diluted CM with AW was mainly attributable to the synergetic effect and the nutrient composition of CM and AW, so the AD process was not only influenced by the C/N ratio. The results were in line with the study of Wang et al. [33]. During the AD process, the TOC concentration decreased and the TAN concentration increased, resulting in the decreased C/N ratio.

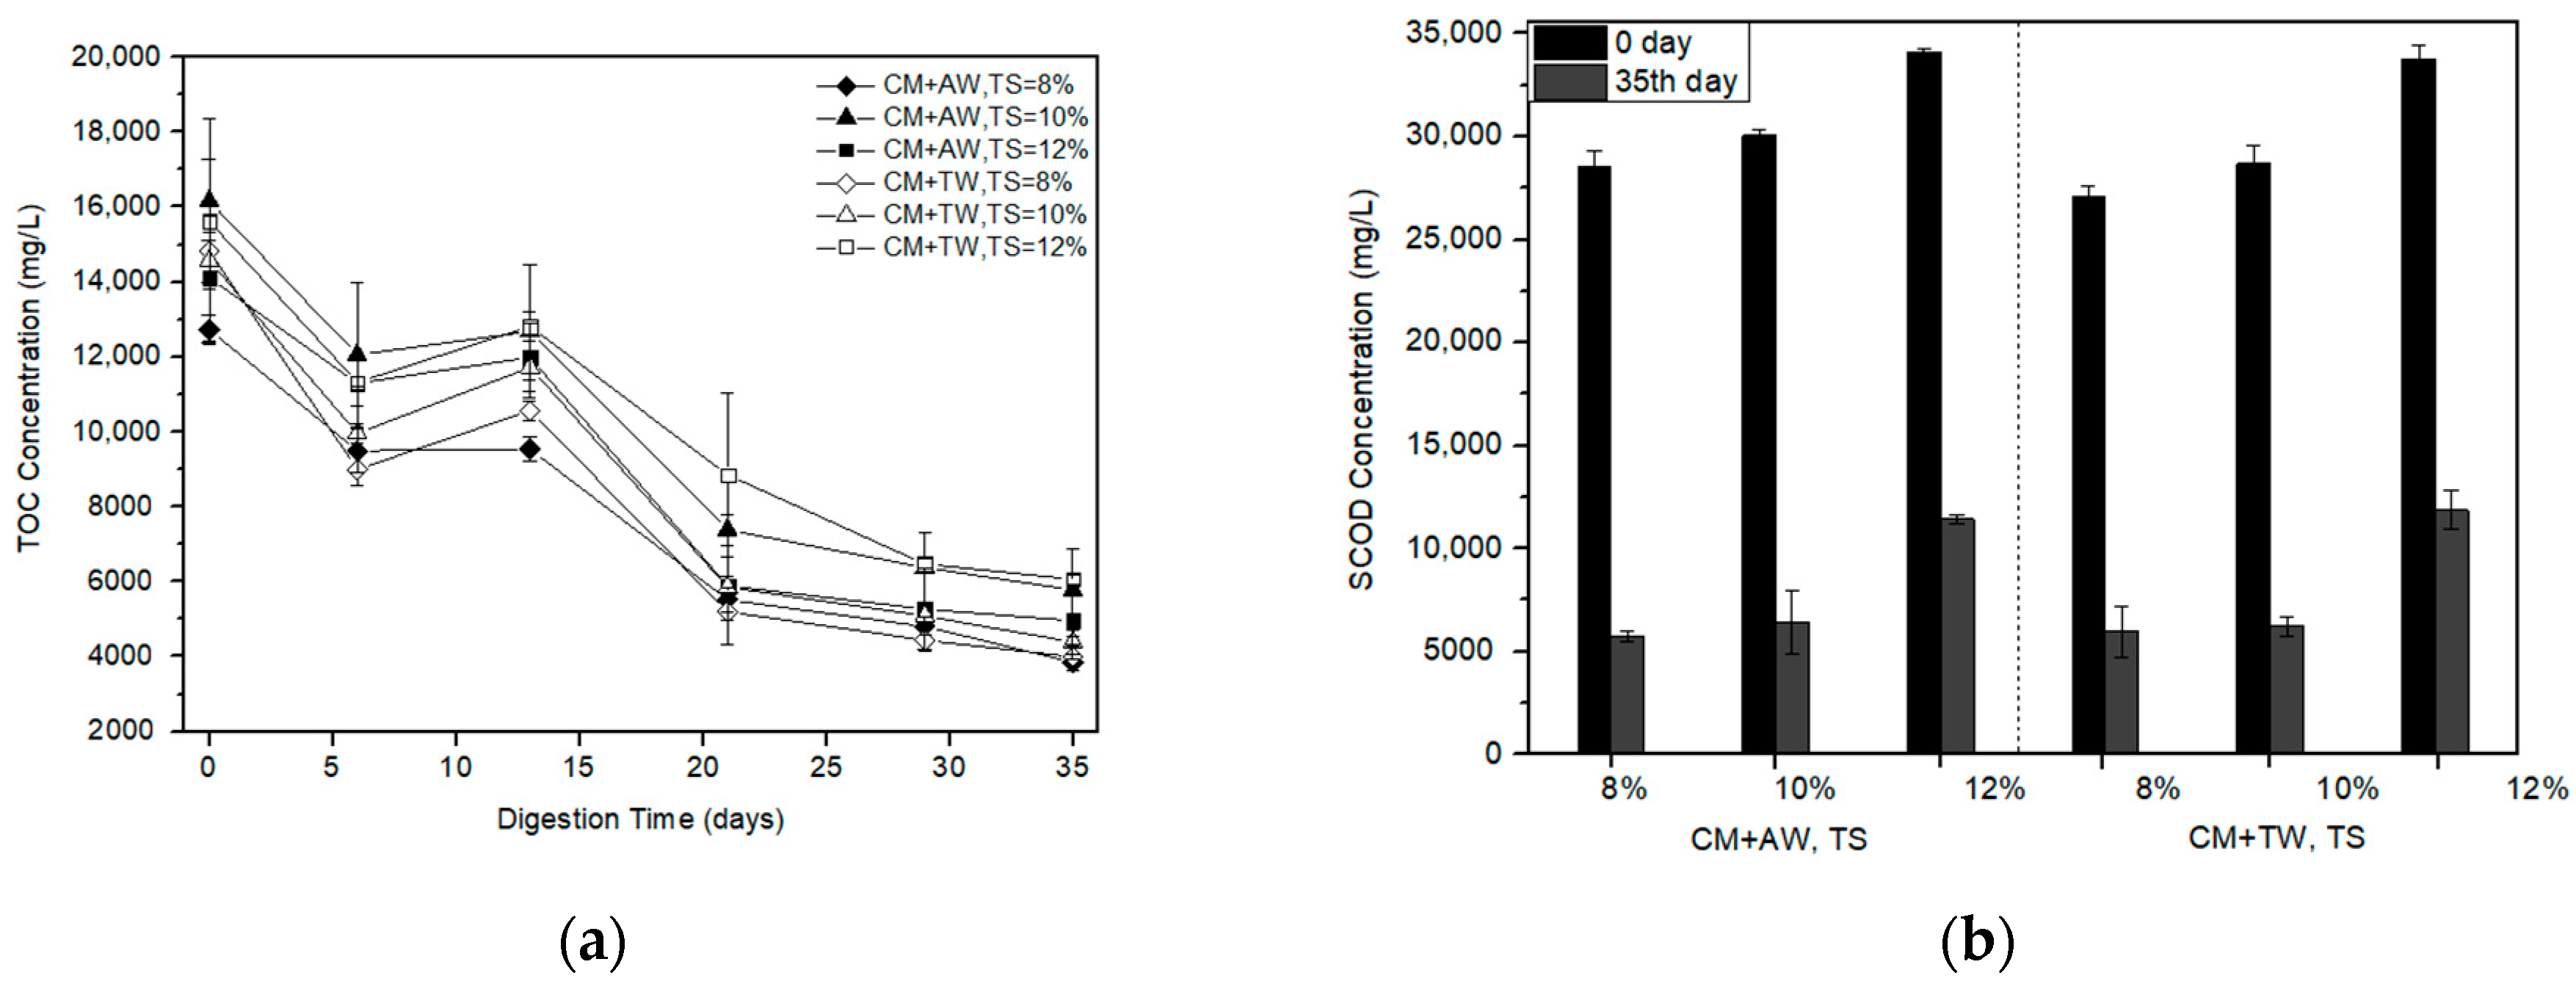
2.4. TOC Concentration and SCOD Removal

It was obvious that TOC concentration of the AW group and the TW group had a similar trend (Figure 3a). The TOC concentration of each treatment was nearly over 10,000 mg/L within the first 13 days. Subsequently, the TOC concentration began to rapidly decrease and the methane yield increased (Figure 1). At the end of the experiment, the lowest TOC concentration of diluted CM was obtained with AW at a TS of 8% and kept at about 3850 mg/L. TOC removal of each treatment are more than 60%.
Results showed that the SCOD removal decreased with the increasing substrate concentration (Figure 3b). The maximum SCOD removal of 79.79% was achieved by the diluted CM with AW of 8%TS, which was in line with the results of methane production (Figure 1). Compared with other treatments, it had relatively high AD efficiency and less residual organic matter for further treatment. In addition, the importance of the substrate concentration for methane production was proved, as well as for organic matter degradation.

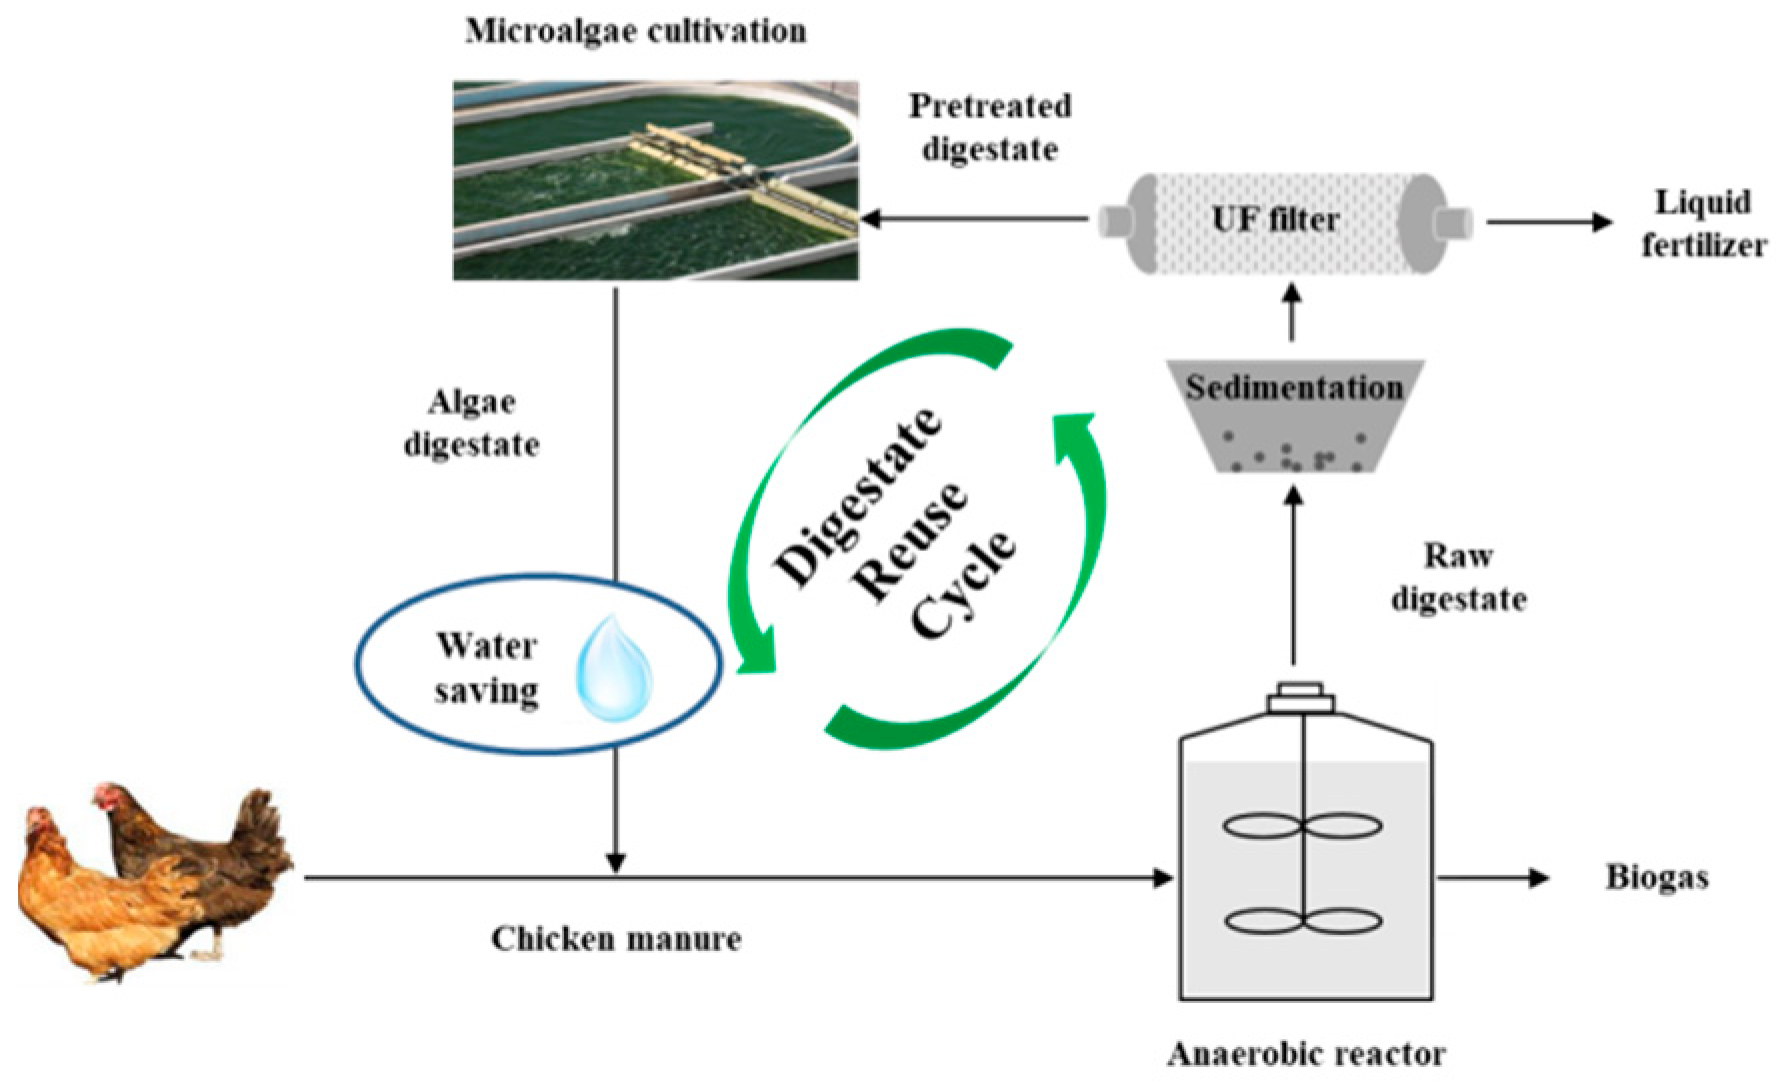
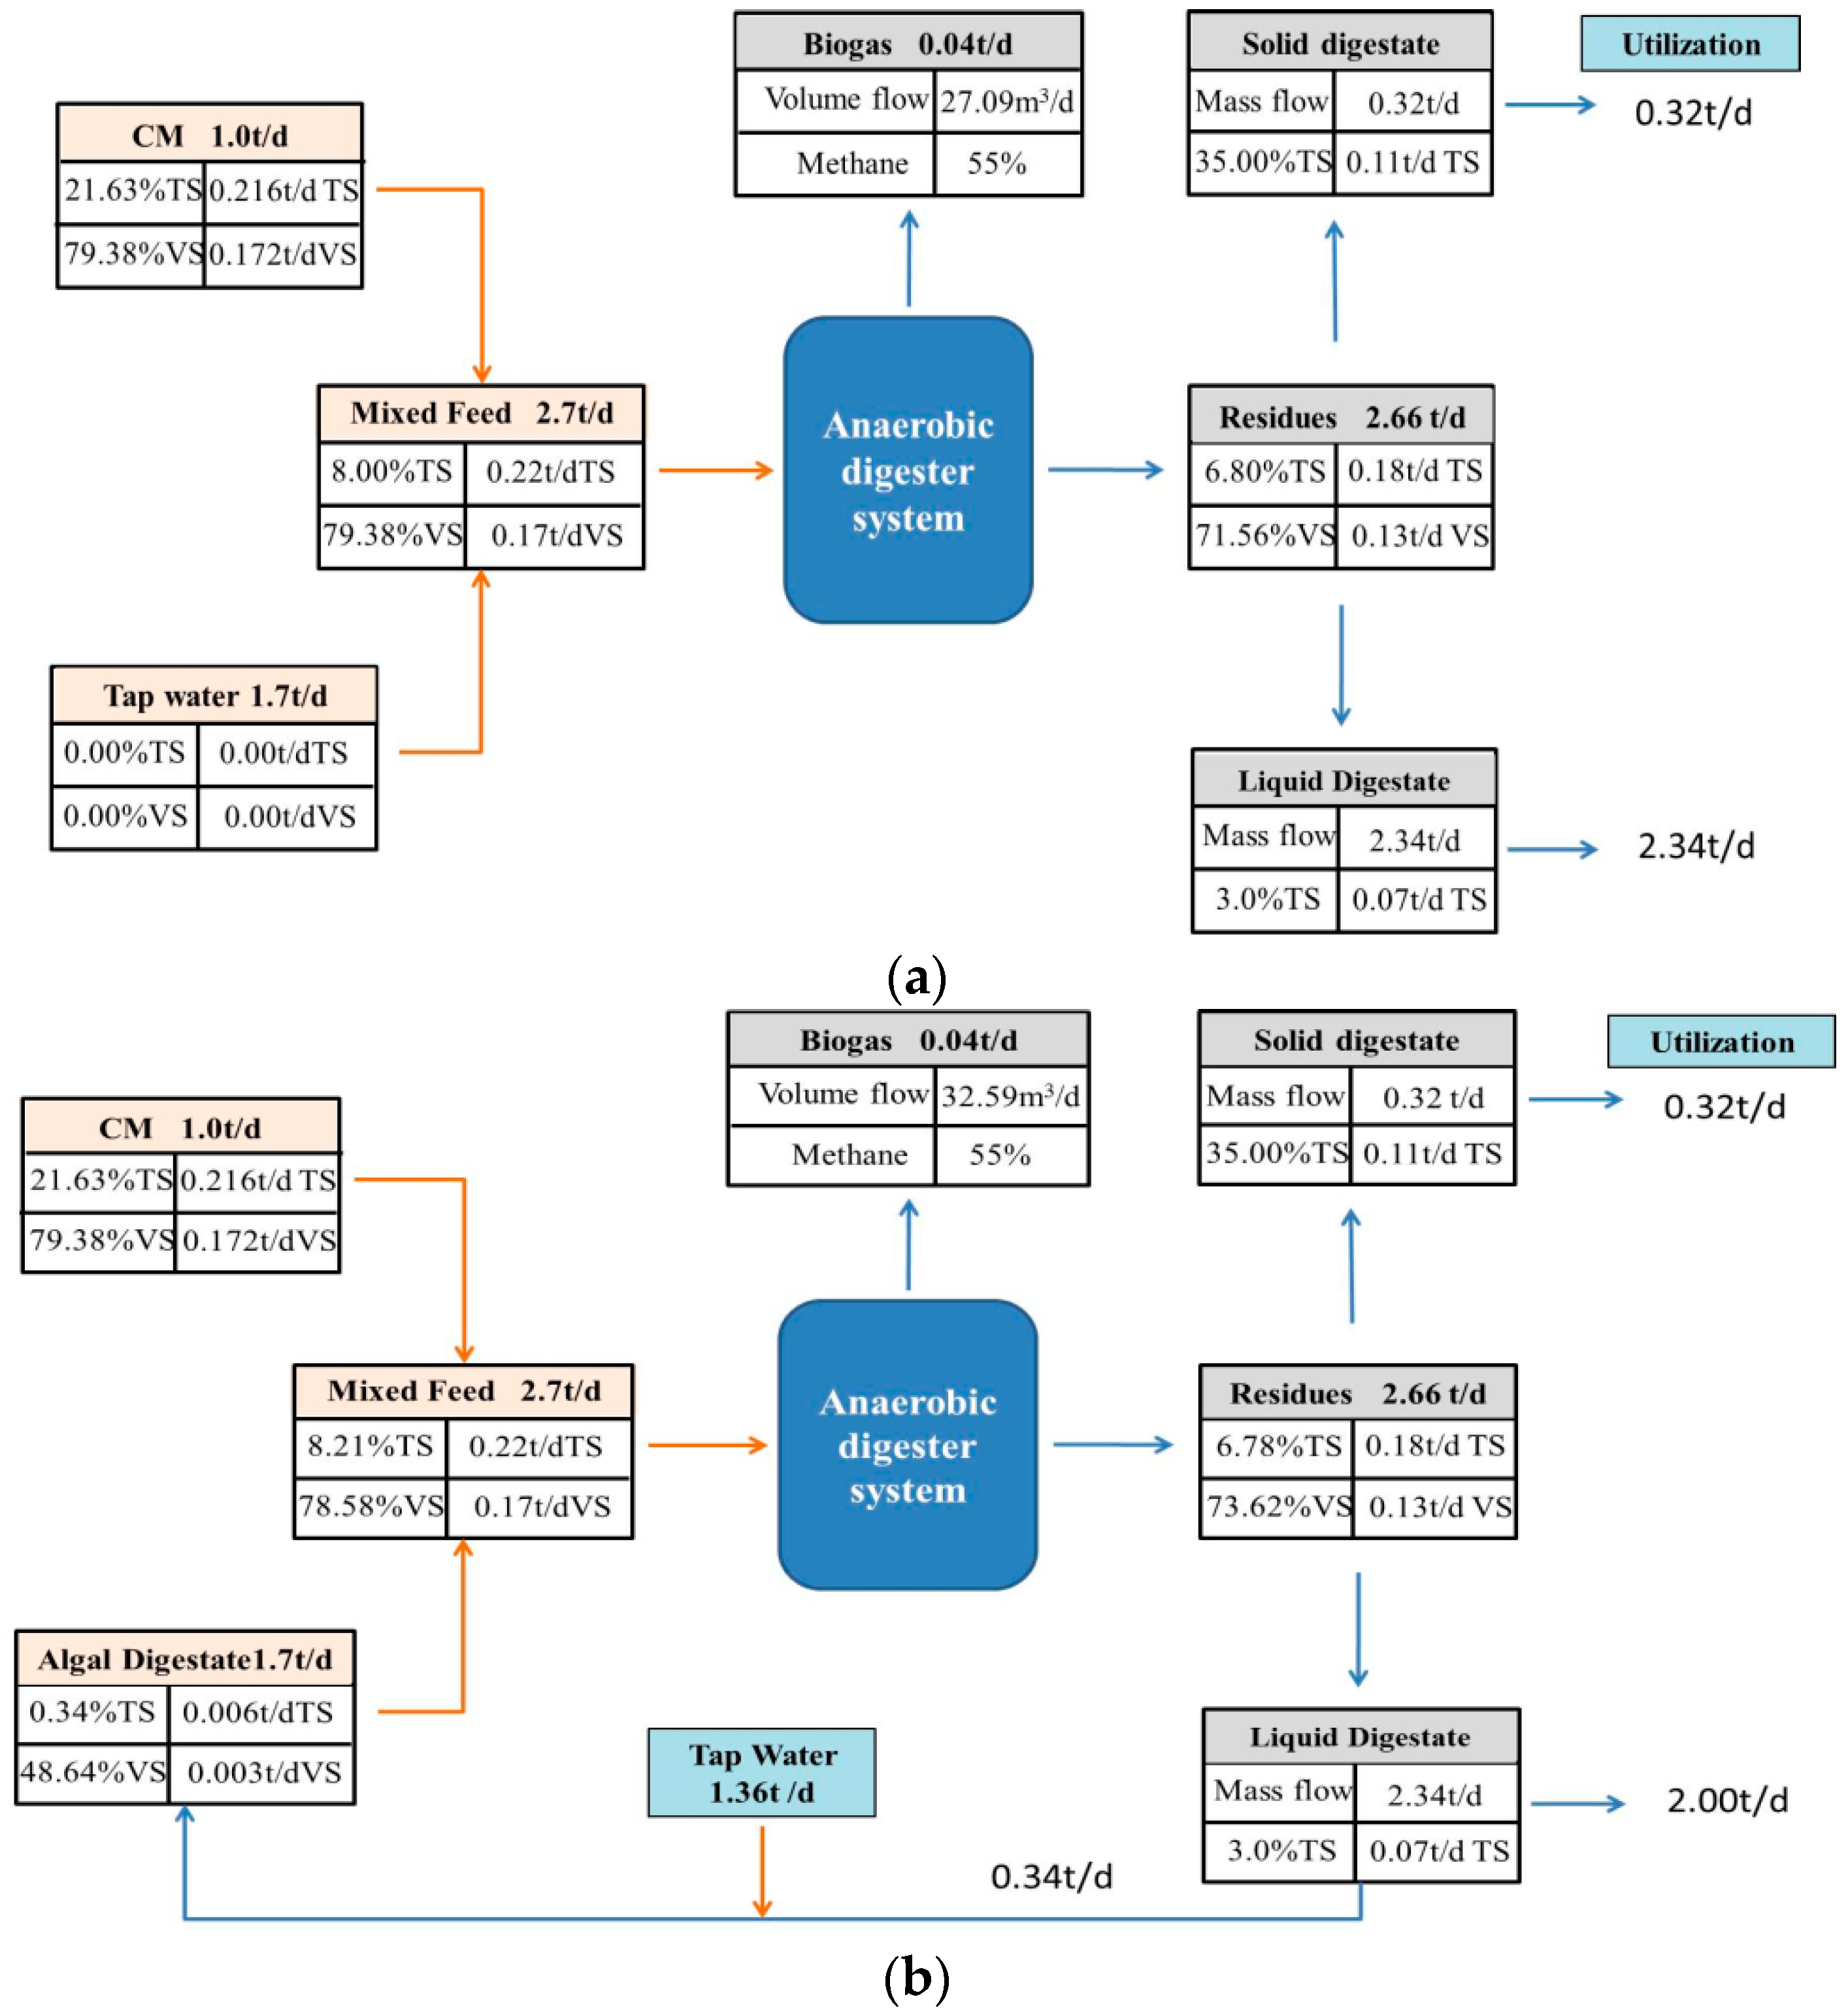
2.5. Mass Flow and Water Substitution

Based on the experimental data, the feasibility of using AW to dilute CM for anaerobic digestion was determined. A closed loop process could be formed, including digestate reuse and diluting CM with algae digestate water for biogas production (Figure 4). CM was firstly fed for AD process to produce biogas. Then, the liquid digestate was recycled as media to cultivate Chlorella 1067 and the unseparated algae digestate water was then used as the diluent for regulating CM to the targeted feeding concentration.
A hypothesized process with 1.0 t/day of CM and a substrate concentration of 8%TS was used for calculation. The values of TS, VS, and methane production were all based on the experimental data. From a mass flow perspective, using AW in place of TW to dilute CM was advantageous (Figure 5). The AD process generated 0.04 t biogas, 0.32 t solid digestate and 2.34 t liquid digestate. For using TW, 1.70 t tap water was needed to dilute CM achieving the substrate concentration of 8%TS per day. However, using AW, 0.34 t liquid digestate and 1.36 t tap water would be used, equivalently using 14.53% of liquid digestate and saving 20% of tap water per day. Hence, the current observations indicated that using AW for diluting CM was feasible for methane production coupled with digestate reuse and saving clean water. For the whole year, 124.1 t of liquid digestate would be utilized, simultaneously saving the same amount of clean water.

3. Materials and Methods

3.1. Substrate, Inoculum, and Diluent Characteristics

The original CM (TS: 21.63%; VS: 79.38%TS) was obtained from Minhe Co., Ltd. (Penglai, Shandong, China), and stored at 4 °C before use. The C/N ratio of the CM was 9.28. Two different diluents were used: one was tap water (TW) and the other was algal digestate water (AW). Chlorella 1067 was cultivated in the CM-based liquid digestate obtained from a mesophilic anaerobic digester at Minhe Co., Ltd. after ultra-filtration treatment in a 400 L open raceway pond. The cultivation conditions were the same as that reported by Li et al. [25]. Then the mixture of Chlorella 1067 and digestate without separation was called as AW (TS: 0.21–0.47%, VS: 44.66–52.62%TS, TAN 268.24–485.50 mg/L) and directly used as the diluent in this study. AW also contained some metallic elements and trace elements, such as calcium (Ca), cobalt (Co), iron (Fe), magnesium (Mg), zinc (Zn), potassium (K), manganese (Mn), and others derived from the CM-based digestate. Anaerobically-digested sludge (ADS) was used as inoculum and was taken from a mesophilic anaerobic digester in the Little Red Door sewage treatment plant (Beijing, China). The ADS (TS: 1.47%, VS: 98.53%TS) was enriched with glucose in the lab under mesophilic conditions prior to use.

3.2. Experimental Design

The raw CM was diluted to 8%, 10%, and 12% (based on TS) from the original CM using AW and TW, respectively. Subsequently, CM was mixed with the ADS in a ratio of 2:5 (40 g:100 g) based on wet weight and placed in a set of 250 mL anaerobic reactors sealed with rubber stoppers. There were two tubes in the rubber stopper, one was above the liquid level to connect with the gas bag to accumulate the biogas produced, and the other was below the liquid level for taking the liquid sample. Two milliliters of liquid sample was taken once every 3–5 days during days 1–21, and once at the 35th day, respectively. The batch reactors were operated under mesophilic conditions (35 ± 1) °C. Seven trials were conducted, including three for diluted CM with AW at TS of 8, 10, and 12%; another three for the TW with the same TS range; and one only with inoculum was operated as a blank to correct the methane production of the AW group and TW group. Batch experiments were operated in a thermostat oscillator (SHA-B, Changzhou Guohua Electric Appliance Co., Ltd., Jintan, Jiangsu Province, China) at the target temperature. The batch experiments lasted 35 days. All trials were conducted in triplicate and all the results were reported as mean values with standard deviations.

3.3. Analytical Methods

The TS and VS were performed according to the APHA standard methods [36]. Element components (C, H, O, and N) of the CM were determined using an elemental analyzer (Vario MICRO Cube, Elementar Analysensysteme GmbH, Donaustraße, Germany).
The amount of CH4 and CO2 was determined by a gas chromatograph (GC 1490, Agilent Technologies, Santa Clara, CA, USA) equipped with a thermal conductivity detector and nitrogen gas as the carrier gas at a flow rate of 50 mL/min. The injector, oven, and detector temperatures were 150, 120, and 150 °C, respectively. The pH value was measured using a digital pH meter (FE20, Mettler Toledo Co., Inc., Shanghai, China). The total nitrogen (TN) was measured by the method of potassium persulfate oxidation using an UV–VIS spectrophotometer (UV-1800, Meipuda Instruments Co., Ltd., Shanghai, China). The TAN was determined using salicylic acid-hypochlorite spectrophotometry. The total organic carbon (TOC) was tested using a TOC analysis meter (TOC-VCPN, Shimadzu Company, Tokyo, Japan). The soluble chemical oxygen demand (SCOD) was measured using a potassium permanganate oxidation method. The free ammonia (FA) concentration was calculated based on TAN concentration and experimental conditions including temperature and pH using Equation (1) [37]:
NH 3 TAN = ( 1 + 1 0 - pH 10 ( 0.09018 + 2729.92 T ( k ) ) ) 1
where NH3 is the concentration of FA in mg/L, TAN is the total ammonia nitrogen concentration in mg/L, pH is the pH value determined in the reactor, and T(k) is the temperature (Kelvin).

3.4. Kinetics Analysis

Methane production and lag phase are both important factors in determining the efficiency of the AD process, thus, the modified Gompertz model (Equation (2)) [38] and logistic model (Equation (3)) [38] were applied to fit the lag time, methane production rate, and predict the methane production potential as a function of time:
P ( t ) = P m a x e x p { e x p [ R m e ( λ t ) / P m a x + 1 ] }
P ( t ) = P m a x / { 1 + exp [ 4 R m ( λ t ) / P m a x + 2 ] }
where P(t) is the cumulative methane production (mL/(gVS)) at a given time t(d). Pmax is the maximum accumulative methane potential (mL/(gVS)). Rm is the maximum methane production rate (mL/(gVS.d)). λ is the lag phase (d) and e is the base of the natural logarithm (2.71828).
Data analysis for the two models was carried out with the Solver function of Microsoft Excel 2010 (Microsoft Corporation, Redmond, WA, USA) and the correlation coefficient (R2) was used to evaluate the accuracy of the fitting results.

4. Conclusions

The novel idea of replacing TW with AW, to dilute CM for anaerobic digestion is feasible. The highest methane production of diluted CM (104.39 mL/gVS) was achieved with an AW of 8%TS. The result was markedly higher than that of the TW group (79.54–93.82 mL/gVS). A closed loop process can, thus, be built including digestate reuse and diluting CM with algae digestate water for biogas production. Thereby two benefits will be obtained. One is to enhance methane yield, recycle AW, and reduce water consumption; another is to decrease the energy consumption for separating microalgae and digestate. However, the AD process was susceptible to substrate concentration, the inoculum to substrate ratio, as well as TAN and FA concentrations. In consideration of the low C/N ratio of CM and AW, additional carbon sources can be added to improve the methane production, achieve nutrient balance, and reduce inhibition risk in future studies.

Author Contributions

The paper was a collaborative effort among the authors. Conceptualization: N.D. and Y.Z.; formal analysis: P.G.K.; funding acquisition: H.L.; investigation: X.R. and R.L.; writing—original draft: N.D.; and writing—review and editing: Y.Z., C.L., and H.L.

Funding

This research was funded by the National Natural Science Foundation of China (51506217) and the open fund of the Key Laboratory of Nonpoint Source Pollution Control, Ministry of Agriculture, P. R. China.

Acknowledgments

The authors also acknowledged the support by Shandong Minhe Biotech Limited Company.

Conflicts of Interest

The authors declare no conflict of interest.

References

  1. Sakar, S.; Yetilmezsoy, K.; Kocak, E. Anaerobic digestion technology in poultry and livestock waste treatment—A literature review. Waste Manag. Res. 2009, 27, 3–18. [Google Scholar] [CrossRef] [PubMed]
  2. Nasir, I.M.; Ghazi, T.I.M.; Omar, R. Anaerobic digestion technology in livestock manure treatment for biogas production: A review. Eng. Life Sci. 2012, 12, 258–269. [Google Scholar] [CrossRef]
  3. Abouelenien, F.; Nakashimada, Y.; Nishio, N. Dry mesophilic fermentation of chicken manure for production of methane by repeated batch culture. J. Biosci. Bioeng. 2009, 107, 293–295. [Google Scholar] [CrossRef] [PubMed]
  4. Bujoczek, G.; Oleszkiewicz, J.; Sparling, R.; Cenkowski, S. High solid anaerobic digestion of chicken manure. J. Agric. Eng. Res. 2000, 76, 51–60. [Google Scholar] [CrossRef]
  5. Abouelenien, F.; Fujiwara, W.; Namba, Y.; Kosseva, M.; Nishio, N.; Nakashimada, Y. Improved methane fermentation of chicken manure via ammonia removal by biogas recycle. Bioresour. Technol. 2010, 101, 6368–6373. [Google Scholar] [CrossRef] [PubMed]
  6. Magbanua, B.S., Jr.; Adams, T.T.; Johnston, P. Anaerobic co-digestion of hog and poultry waste. Bioresour. Technol. 2001, 76, 165–168. [Google Scholar] [CrossRef]
  7. Boe, K.; Angelidaki, I. Serial CSTR digester configuration for improving biogas production from manure. Water Res. 2009, 43, 166–172. [Google Scholar] [CrossRef] [PubMed]
  8. Niu, Q.; Takemura, Y.; Kubota, K.; Li, Y.Y. Comparing mesophilic and thermophilic anaerobic digestion of chicken manure: Microbial community dynamics and process resilience. Waste Manag. 2015, 43, 114–122. [Google Scholar] [CrossRef] [PubMed]
  9. Kadam, P.C.; Boone, D.R. Influence of pH on ammonia accumulation and toxicity in halophilic, methylotrophic methanogens. Appl. Environ. Microbiol. 1996, 62, 4486–4492. [Google Scholar] [PubMed]
  10. Sun, C.; Cao, W.X.; Banks, C.J.; Heaven, S.; Liu, R.H. Biogas production from undiluted chicken manure and maize silage: A study of ammonia inhibition in high solids anaerobic digestion. Bioresour. Technol. 2016, 218, 1215–1223. [Google Scholar] [CrossRef] [PubMed] [Green Version]
  11. Yangin-Gomec, C.; Ozturk, I. Effect of maize silage addition on biomethane recovery from mesophilic co-digestion of chicken and cattle manure to suppress ammonia inhibition. Energ. Convers. Manag. 2013, 71, 92–100. [Google Scholar] [CrossRef]
  12. Yenigün, O.; Demirel, B. Ammonia inhibition in anaerobic digestion: A review. Process Biochem. 2013, 48, 901–911. [Google Scholar] [CrossRef]
  13. Calli, B.; Mertoglu, B.; Inanc, B.; Yenigun, O. Effect of high free ammonia concentrations on the performances of anaerobic bioreactors. Process Biochem. 2005, 40, 1285–1292. [Google Scholar] [CrossRef]
  14. Angelidaki, I.; Ellegaard, L.; Ahring, B.K. Applications of the anaerobic digestion process. In Biomethanation II. Advances in Biochemical Engineering/Biotechnology; Ahring, B.K., Ed.; Springer: Berlin/Heidelberg, Germany, 2003; pp. 1–33. [Google Scholar]
  15. Tian, H.L.; Fotidis, I.A.; Mancini, E.; Treu, L.; Mahdy, A.; Ballesteros, M.; González-Fernández, C.; Angelidaki, I. Acclimation to extremely high ammonia levels in continuous biomethanation process and the associated microbial community dynamics. Bioresour. Technol. 2018, 247, 616–623. [Google Scholar] [CrossRef] [PubMed]
  16. Sung, S.; Liu, T. Ammonia inhibition on thermophilic anaerobic digestion. Chemosphere 2003, 53, 43–52. [Google Scholar] [CrossRef]
  17. Matheri, A.N.; Ndiweni, S.N.; Belaid, M.; Muzenda, E.; Hubert, R. Optimising biogas production from anaerobic co-digestion of chicken manure and organic fraction of municipal solid waste. Renew. Sustain. Energy Rev. 2017, 80, 756–764. [Google Scholar] [CrossRef]
  18. Li, C.; Strömberg, S.; Liu, G.J.; Negs, I.V.; Liu, J. Assessment of regional biomass as co-substrate in the anaerobic digestion of chicken manure: Impact of co-digestion with chicken processing waste, seagrass and Miscanthus. Biochem. Eng. J. 2017, 118, 1–10. [Google Scholar] [CrossRef]
  19. Goel, A.; Gupta, S. Biogas from organic waste diluted with sugar mill waste water. Asian J. Chem. 2007, 19, 3435–3439. [Google Scholar]
  20. Niu, Q.; Qiao, W.; Qiang, H.; Hojo, T.; Li, Y.Y. Mesophilic methane fermentation of chicken manure at a wide range of ammonia concentration: Stability, inhibition and recovery. Bioresour. Technol. 2013, 137, 358–367. [Google Scholar] [CrossRef] [PubMed]
  21. Nie, H.; Jacobi, H.F.; Strach, K.; Xu, C.; Zhou, H.; Liebetrau, J. Mono-fermentation of chicken manure: Ammonia inhibition and recirculation of the digestate. Bioresour. Technol. 2015, 178, 238–246. [Google Scholar] [CrossRef] [PubMed]
  22. Gamal-El-Din, H. Biogas from organic waste diluted with seawater. In Biogas Technology, Transfer and Diffusion; El-Halwagi, M.M., Ed.; Springer: Dordrecht, The Netherlands, 1986; pp. 417–423. [Google Scholar]
  23. Xia, A.; Murphy, J.D. Microalgal cultivation in treating liquid digestate from biogas systems. Trends Biotechnol. 2016, 34, 264–275. [Google Scholar] [CrossRef] [PubMed]
  24. Uggetti, E.; Sialve, B.; Latrille, E.; Steyer, J.P. Anaerobic digestate as substrate for microalgae culture: The role of ammonium concentration on the microalgae productivity. Bioresour. Technol. 2014, 152, 437–443. [Google Scholar] [CrossRef] [PubMed] [Green Version]
  25. Li, R.R.; Duan, N.; Zhang, Y.H.; Liu, Z.D.; Li, B.M.; Zhang, D.M.; Lu, H.F.; Dong, T.L. Co-digestion of chicken manure and microalgae Chlorella 1067 grown in the recycled digestate: Nutrients reuse and biogas enhancement. Waste Manag. 2017, 70, 247–254. [Google Scholar] [CrossRef] [PubMed]
  26. Li, J.; Wei, L.; Duan, Q.; Hu, G.; Zhang, G. Semi-continuous anaerobic co-digestion of dairy manure with three crop residues for biogas production. Bioresour. Technol. 2014, 156, 307–313. [Google Scholar] [CrossRef] [PubMed]
  27. Karakashev, D.; Batstone, D.J.; Trably, E.; Angelidaki, I. Acetate oxidation is the dominant methanogenic pathway from acetate in the absence of Methanosaetaceae. Appl. Environ. Microbiol. 2006, 72, 5138–5141. [Google Scholar] [CrossRef] [PubMed] [Green Version]
  28. Li, Y.Q.; Zhang, R.H.; Liu, X.Y.; Chen, C.; Xiao, X.; Feng, L.; He, Y.F.; Liu, G.Q. Evaluating methane production from anaerobic mono- and co-digestion of kitchen waste, corn stover, and chicken manure. Energy Fuels 2013, 27, 2085–2091. [Google Scholar] [CrossRef]
  29. Moset, V.; Al-zohairi, N.; Møller, H.B. The impact of inoculum source, inoculum to substrate ratio and sample preservation on methane potential from different substrates. Biomass Bioenergy 2015, 83, 474–482. [Google Scholar] [CrossRef]
  30. Raposo, F.; Banks, C.J.; Siegert, I.; Heaven, S.; Borja, R. Influence of inoculum to substrate ratio on the biochemical methane potential of maize in batch tests. Process Biochem. 2006, 41, 1444–1450. [Google Scholar] [CrossRef]
  31. Hassan, M.; Ding, W.M.; Shi, Z.D.; Zhao, S.Q. Methane enhancement through co-digestion of chicken manure and thermo-oxidative cleaved wheat straw with waste activated sludge: A C/N optimization case. Bioresour. Technol. 2016, 211, 534–541. [Google Scholar] [CrossRef] [PubMed]
  32. Ahring, B.K.; Angelidaki, I.; Johansen, K. Anaerobic treatment of manure together with industrial-waste. Water Sci. Technol. 1992, 25, 311–318. [Google Scholar] [CrossRef]
  33. Wang, X.; Yang, G.; Feng, Y.; Ren, G.; Han, X. Optimizing feeding composition and carbon-nitrogen ratios for improved methane yield during anaerobic co-digestion of dairy, chicken manure and wheat straw. Bioresour. Technol. 2012, 120, 78–83. [Google Scholar] [CrossRef] [PubMed]
  34. Koster, I.W.; Lettinga, G. Anaerobic digestion at extreme ammonia concentrations. Biol. Wastes 1988, 25, 51–59. [Google Scholar] [CrossRef]
  35. Kayhanian, M. Ammonia inhibition in high-solids biogasification: An overview and practical Solutions. Environ. Technol. 1999, 20, 355–365. [Google Scholar] [CrossRef]
  36. Eaton, A.D.; Clesceri, L.S.; Greenberg, A.E. Standard Methods for the Examination of Water and Wastewater, 21th ed.; American Public Health Association/American Water Works Association/Water Environment Federation: Washington DC, USA, 2005. [Google Scholar]
  37. Hansen, K.H.; Angelidaki, I.; Ahring, B.K. Anaerobic digestion of swine manure: Inhibition by ammonia. Water Res. 1998, 32, 5–12. [Google Scholar] [CrossRef]
  38. Tsapekos, P.; Kougias, P.G.; Egelund, H.; Larsen, U.; Pedersen, J.; Trénel, P. Mechanical pretreatment at harvesting increases the bioenergy output from marginal land grasses. Renew. Energy 2017, 111, 914–921. [Google Scholar] [CrossRef]
Figure 1. Methane accumulation fitted by the modified Gompertz model (a) and logistic model (b).
Energies 11 01829 g001
Figure 2. TAN (a), pH (b), FA (c), and C/N (d) profile with digestion time for diluted CM.
Energies 11 01829 g002
Figure 3. TOC concentration (a) and SCOD removal (b) profile with the digestion time for diluted CM.
Energies 11 01829 g003
Figure 4. A closed loop system of CM diluted by algae digestate water.
Energies 11 01829 g004
Figure 5. Mass flow of CM digestion with TW (a) and AW (b).
Energies 11 01829 g005
Table 1. Accumulated methane production, methane production rate (Rm), and duration of the lag phase (λ) predicted by the modified Gompertz model and the logistic model.
Kinetic ParametersUnitCM + AW, TSCM + TW, TS
8%10%12%8%10%12%
Modified Gompertz Model
RmmL/(gVS.d)12.07 ± 0.358.54 ± 1.466.22 ± 0.027.81 ± 0.358.96 ± 0.547.71 ± 0.51
λd14.69 ± 0.1014.96 ± 2.7115.73 ± 0.1911.37 ± 0.4012.17 ± 0.2314.03 ± 0.85
R2 >0.9973>0.9963>0.9957>0.9924>0.9947>0.9984
Measured methane yieldmL/(gVS)104.39 ± 2.5482.74 ± 0.4465.89 ± 0.0286.77 ± 3.6393.82 ± 7.9779.54 ± 2.23
Predicted methane yieldmL/(gVS)104.03 ± 2.0282.15 ± 0.3464.67 ± 0.0386.33 ± 2.8693.39 ± 6.3078.54 ± 1.68
Difference%<0.40<0.74<1.85<0.64<0.69<1.44
Logistic Model
RmmL/(gVS.d)11.56 ± 0.308.54 ± 1.535.90 ± 0.087.80 ± 0.55 8.87 ± 0.607.48 ± 0.61
λd14.72 ± 0.0915.11 ± 2.6715.80 ± 0.16 11.48 ± 0.35 12.25 ± 0.1814.08 ± 0.84
R2 >0.9920 >0.9962>0.9970 >0.9908 >0.9912>0.9966
Measured methane yieldmL/(gVS)104.39 ± 2.5482.74 ± 0.4465.89 ± 0.02 86.77 ± 3.63 93.82 ± 7.9779.54 ± 2.23
Predicted methane yieldmL/(gVS)104.32 ± 2.0682.62 ± 0.3565.39 ± 0.02 86.71 ± 2.9593.75 ± 6.4679.21 ± 1.76
Difference%<0.08 <0.15<0.76 <0.09 <0.13<0.49

