Article

Critical Resolution and Sample Size of Digital Rock Analysis for Unconventional Reservoirs

1
Department of Engineering Mechanics and CNMM, Tsinghua University, Beijing 100084, China
2
National Energy Tight Oil & Gas Research Centre, Petroleum Geology Research & Laboratory Center, Research Institute of Petroleum Exploration & Development (RIPED) PetroChina, Beijing 100083, China
*
Authors to whom correspondence should be addressed.
Energies 2018, 11(7), 1798; https://doi.org/10.3390/en11071798
Submission received: 15 May 2018 / Revised: 11 June 2018 / Accepted: 5 July 2018 / Published: 9 July 2018
(This article belongs to the Section L: Energy Sources)

Abstract

:
Digital rock analysis (DRA) has exhibited strong ability and significant potential to help people to image geological microstructures and understand transport mechanisms in rocks underground, especially for unconventional reservoirs like tight sandstone and shale. More and more new technologies have been developed for higher resolutions, which always come with higher expense. However, the balance between cost (money and time) and benefit has never been figured out quantitatively for these studies. As the cost and benefit are directly related to image resolution and size, this work is focusing on whether there is a critical resolution and sample size when using DRA for accurate enough predictions of rock properties. By numerically changing the digital resolutions of the reconstructed structures from high-resolution micro-computed tomography (CT) scanned tight rock samples, it is found that the permeability predictions get stable when the resolution is higher than a cut-off resolution (COR). Different from physical rocks, the representative element volume (REV) of a digital rock is influenced by the digital resolution. The results of pore-scale modeling indicate that once sample size is larger than the critical sample size and the scan resolution higher than the critical resolution for a given rock, the predicted rock properties by DRA are accurate and representative.

1. Introduction

Digital rock analysis (DRA) has become a powerful tool for modeling transport in real rock samples that have been imaged with X-ray computed tomography (CT) or other three-dimensional (3D) imaging techniques [1]. With this tool, complex pore structures of rocks can be obtained and characterized. Otherwise, transport processes through the structures can be simulated to reveal the mechanisms. What is more important is that rock properties such as relative permeability can be predicted in weeks or less [2,3], which greatly saves time compared to laboratory core tests [4], especially for unconventional reservoirs. DRA is firstly applied to simple rock samples with Arns et al. [5] and Keehm et al. [6] successfully predicting the conductivity and permeability for Fontainebleau sandstone. With developments of advanced imaging system and computation ability, DRA has been applied to study varying rock properties such as elastic properties [7,8], relative permeability [9,10,11] and to varying types of rocks such as carbonates [12,13,14] and shales [15,16,17]. It is accepted that DRA is a necessary complement of lab experiments, and it may be referred as virtual laboratory/experiments [18,19].
Though DRA is promising, it is still a challenge of its wide application. The main limitation lies in the high cost to deal with high resolution rock structures [20,21]. As high resolution images can capture the structure details, researchers are keen on obtaining higher resolution images [22,23,24]. Current imaging techniques can provide wide scan resolution ranging from hundreds micrometer to several nanometers [25]. However, the high resolution imaging systems are usually too expensive. Though CT or other imaging techniques are not so rare today, few researchers can afford the price of high-resolution CT equipment. What is more, it takes much longer time to prepare the sample and scan its structures when resolution gets higher, which weakens fast analysis performance. Even if high resolution images are well acquired, it might still be a challenge to process such large datasets and perform simulations through it [20], which demands usage of high performance clusters of central processing unit (CPU) and graphics processing unit (GPU).
Despite the high cost of high resolution DRA, the benefit is really limited and even analysis results conducted at higher resolution might be worse. Since there is trade-off between sample size and resolution, sample size of high resolution scan is usually small [26,27,28,29,30]. Though high resolution imaging gets digital rock almost the real one, the small sample size risks losing representativeness and the results can be useless. This means that it is never better to perform DRA with higher resolution in view of cost as well as benefit.
To achieve acceptable analysis results with appropriate cost requires a careful consideration of both resolution and sample size. Works have been done on the effect of sample size and resolution, however almost all of them are done separately [31,32,33,34,35,36,37]. The effect of sample size is well studied since Bear [38] brought up the idea of representative element volume (REV), which is the smallest volume over which the measurement result is representative of the macroscopic property. Many researchers checked the sample size to achieve REV [31,33,39,40,41,42], but they ignored the influence of resolution. Though difference between experiment and DRA might be concluded to inadequate resolution [27,30,43], quantitative study of resolution effect is few [44]. Houben et al. [22] scanned the clay with varying resolutions, however analysis was conducted on two-dimensional (2D) images and only qualitative influence of resolution on pore shape was reported. Alyafei et al. [34] applied numerical approach to change the image resolution and no clear trend of permeability dependence on resolution was observed. Shah et al. [35] studied function between permeability and voxel size and the result showed that permeability continued changing when approaching the smallest voxel size. All these results fail to answer the question whether a high enough resolution exist to obtain a stable permeability.
Several factors exist that prevent the clear understanding of resolution effect on permeability. The first is the REV size. No researches above checked the requirement of REV when studying resolution effect. However, all discussions on permeability and comparison with experiment results should rely on REV [38]. The second one is the error introduced by mesh resolution. Though Borujeni et al. [32] investigated the effect of mesh resolution on simple generated structures to separate the influence of image resolution and mesh resolution on permeability, none of other researchers considered this difference when computing transport properties. The last one is the influence of image processing. As images are obtained at different resolutions, the effect of image processing is not the same and can introduce error to the results.
To critically study the effect of resolution and the joint influence of sample size and resolution on performance of DRA to find a balance between cost and benefit, two tight sandstone samples from China are analyzed in this work. The image resolution is numerically changed with a coarsening process. To avoid the influence of image processing, a two-step image processing procedure is taken. With carefully checking the influence of mesh resolution, its effect is excluded with an extrapolation calculation of permeability. After image resolution effect is well quantified, both effects of sample size and resolution are studied and the critical resolution and sample size are found.

2. Materials and Methods

In this work, over twenty rocks have been analyzed from five different basins of China: Changqing, Daqing, Shengli, Erdos and Karamay oil-fields. After checking the connectivity and REV of porosity on reconstructed structures, two samples with good imaging quality are chosen for further analysis. The typical rock samples selected in this work are from Changqing and Daqing oil-fields in China. They are scanned with micro-CT and information of the scanned images is given in Table 1. Here resolution r0 is reciprocal of voxel size Δ 0 and image size N represents the voxels in each side of the structure.
Structures with varying sizes and resolutions will be reconstructed from the raw images. All these structures are of cubic shape, so side length and resolution are used to depict them. For simplicity, base resolution r 0 is chosen to normalise the physical length l and resolution r with N = l × r 0 and R = r / r 0 . Thus, structure can be denoted as for example CQ-N1000-R0.5, which means that it is from Changqing sample and the sample size and resolution are 1000 × 0.28 = 280   μ m and 0.5 × 3.57 = 1.59   pixel / μ m respectively.

2.1. Structure Reconstruction Procedure

The image processing procedure is divided into two steps to numerically vary the resolution and size. Take Changqing sample for example, the first step is to reconstruct CQ-N1000-R1 from raw images, and typical image processing procedures are applied [45]. The other step is to change size and resolution to obtain structure such as CQ-N500-R0.25 from CQ-N1000-R1. This part mainly deals with two operations, one is cropping and the other one is coarsening. Flowchart of the image processing procedure is shown in Figure 1.
As all the other structures are obtained from CQ-N1000-R1 and DQ-N1000-R1, these two are called base structures and all others are called derivative structures. Main benefit of the two-step processing procedure is that the influence of segmentation algorithm can be excluded when discussing effect of sample size and resolution, because the derived structures are all from a well-defined base structure.
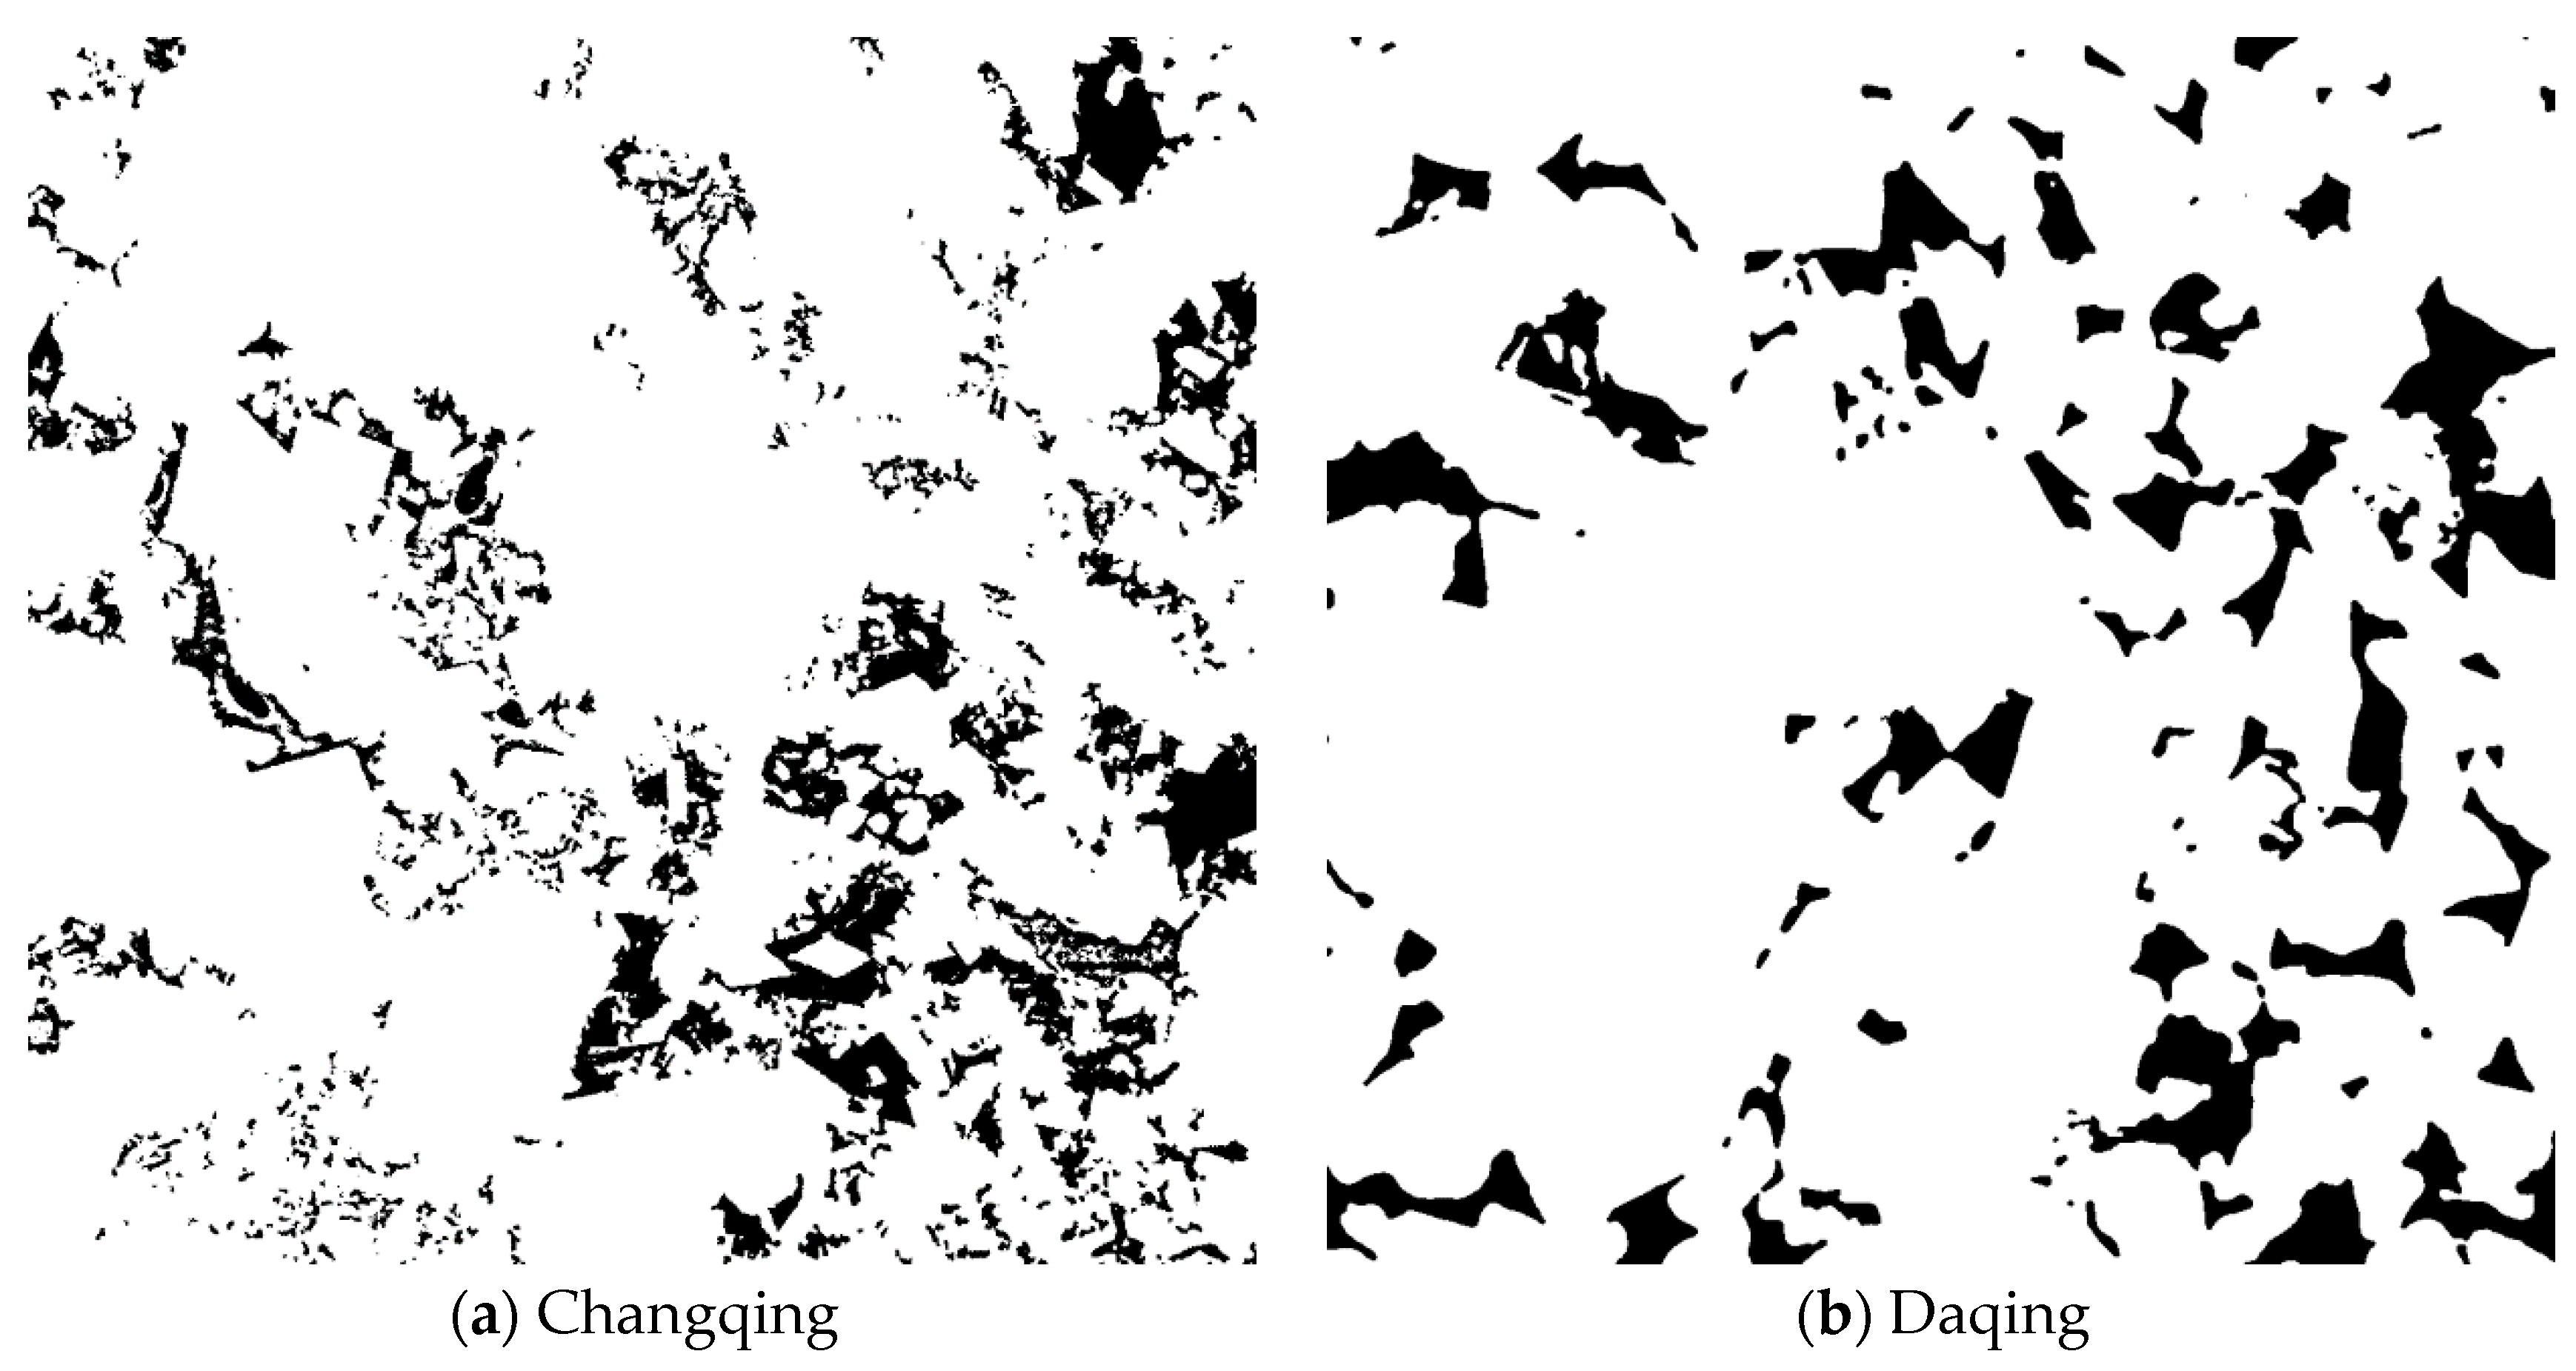
Base structure is reconstructed following typical image processing procedure, that is, pre-processing, image segmentation and post-processing [45,46]. In pre-processing part, brightness and contrast of the raw images are adjusted to make the images clearer, and median filter is used to smooth the images and reduce background noises. After that, segmentation is completed with Huang’s algorithm [47] and the images are segmented into pores and solids. Finally, the connected pores are extracted in post-processing part, which makes preparation for the following flow simulation and removes the tiny isolated pores that are most probably produced during image processing. 2D slices of the base structures are shown in Figure 2.
To note, there are many other algorithms proposed for image segmentation and choice of the algorithm might influence the reconstructed structure [23,46,48]. It is hard to judge and analyze the influence of image processing, since different algorithm seems to suit different cases [48]. The reason for choosing Huang’s algorithm is that there is no remarkable improvement on the extracted structure when other algorithms are used. As choice of the segmentation algorithm does not directly influence the following analysis of sample size and resolution effect, influence of segmentation is not investigated here.
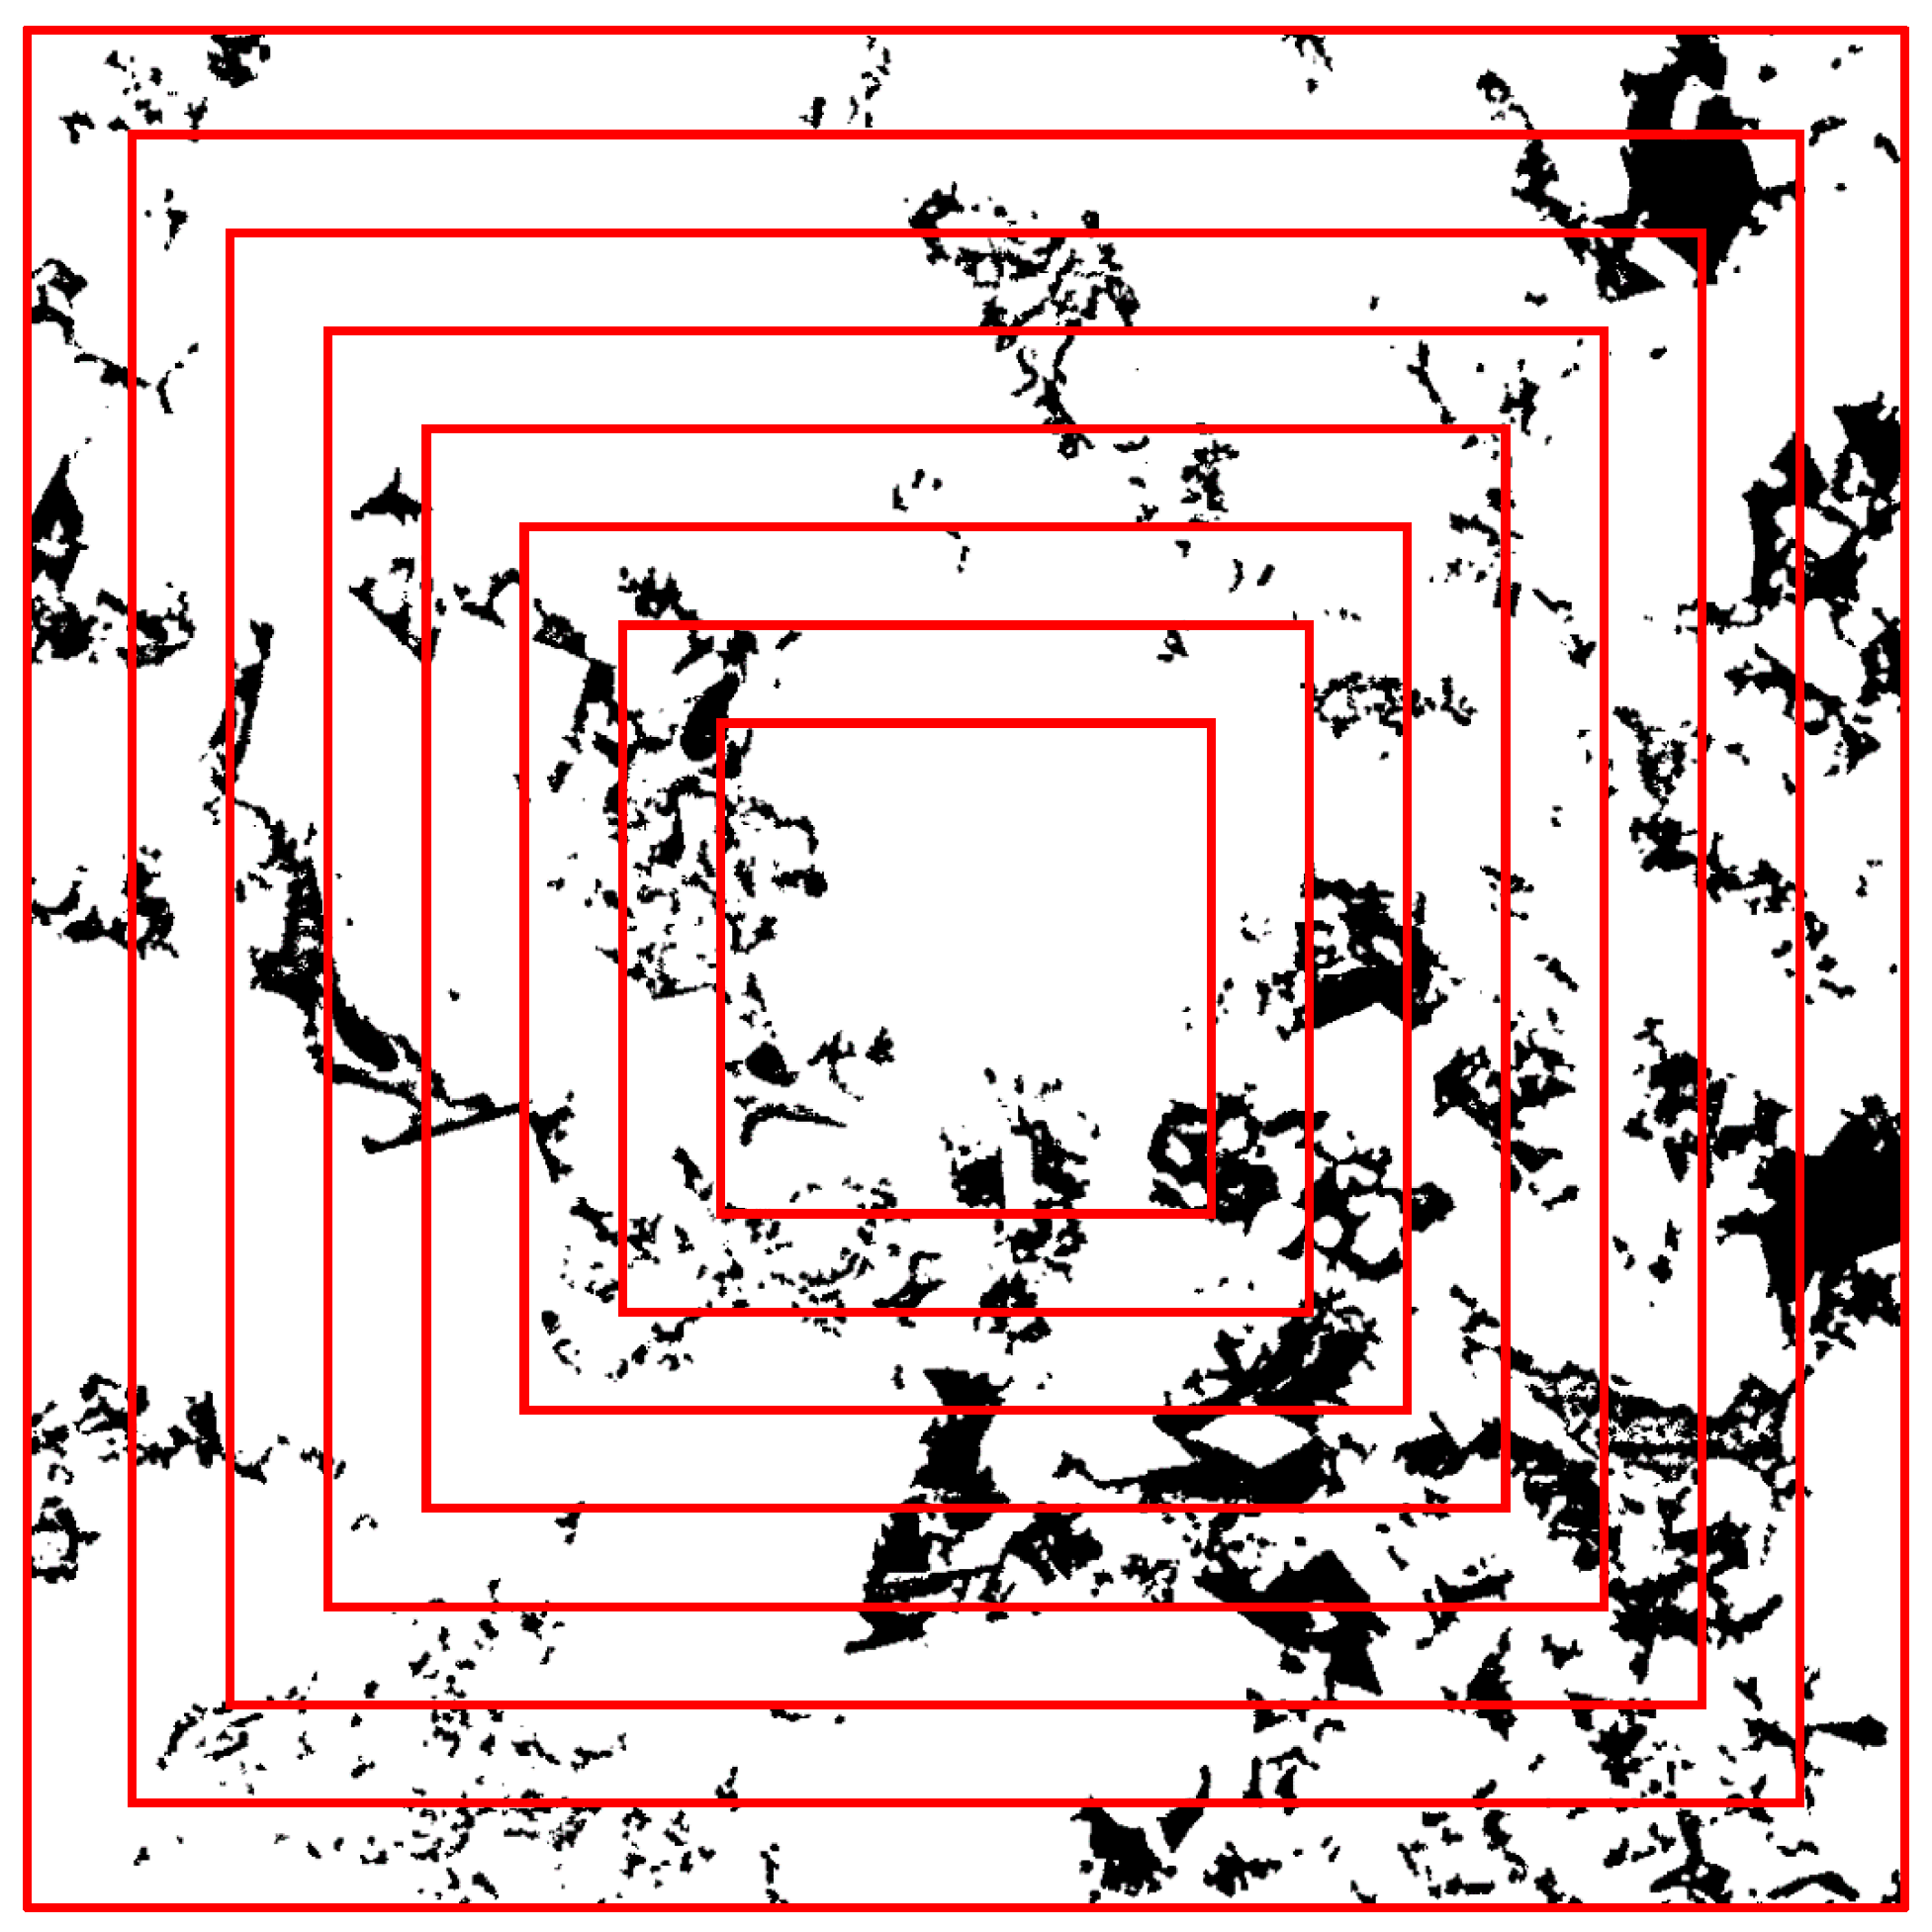
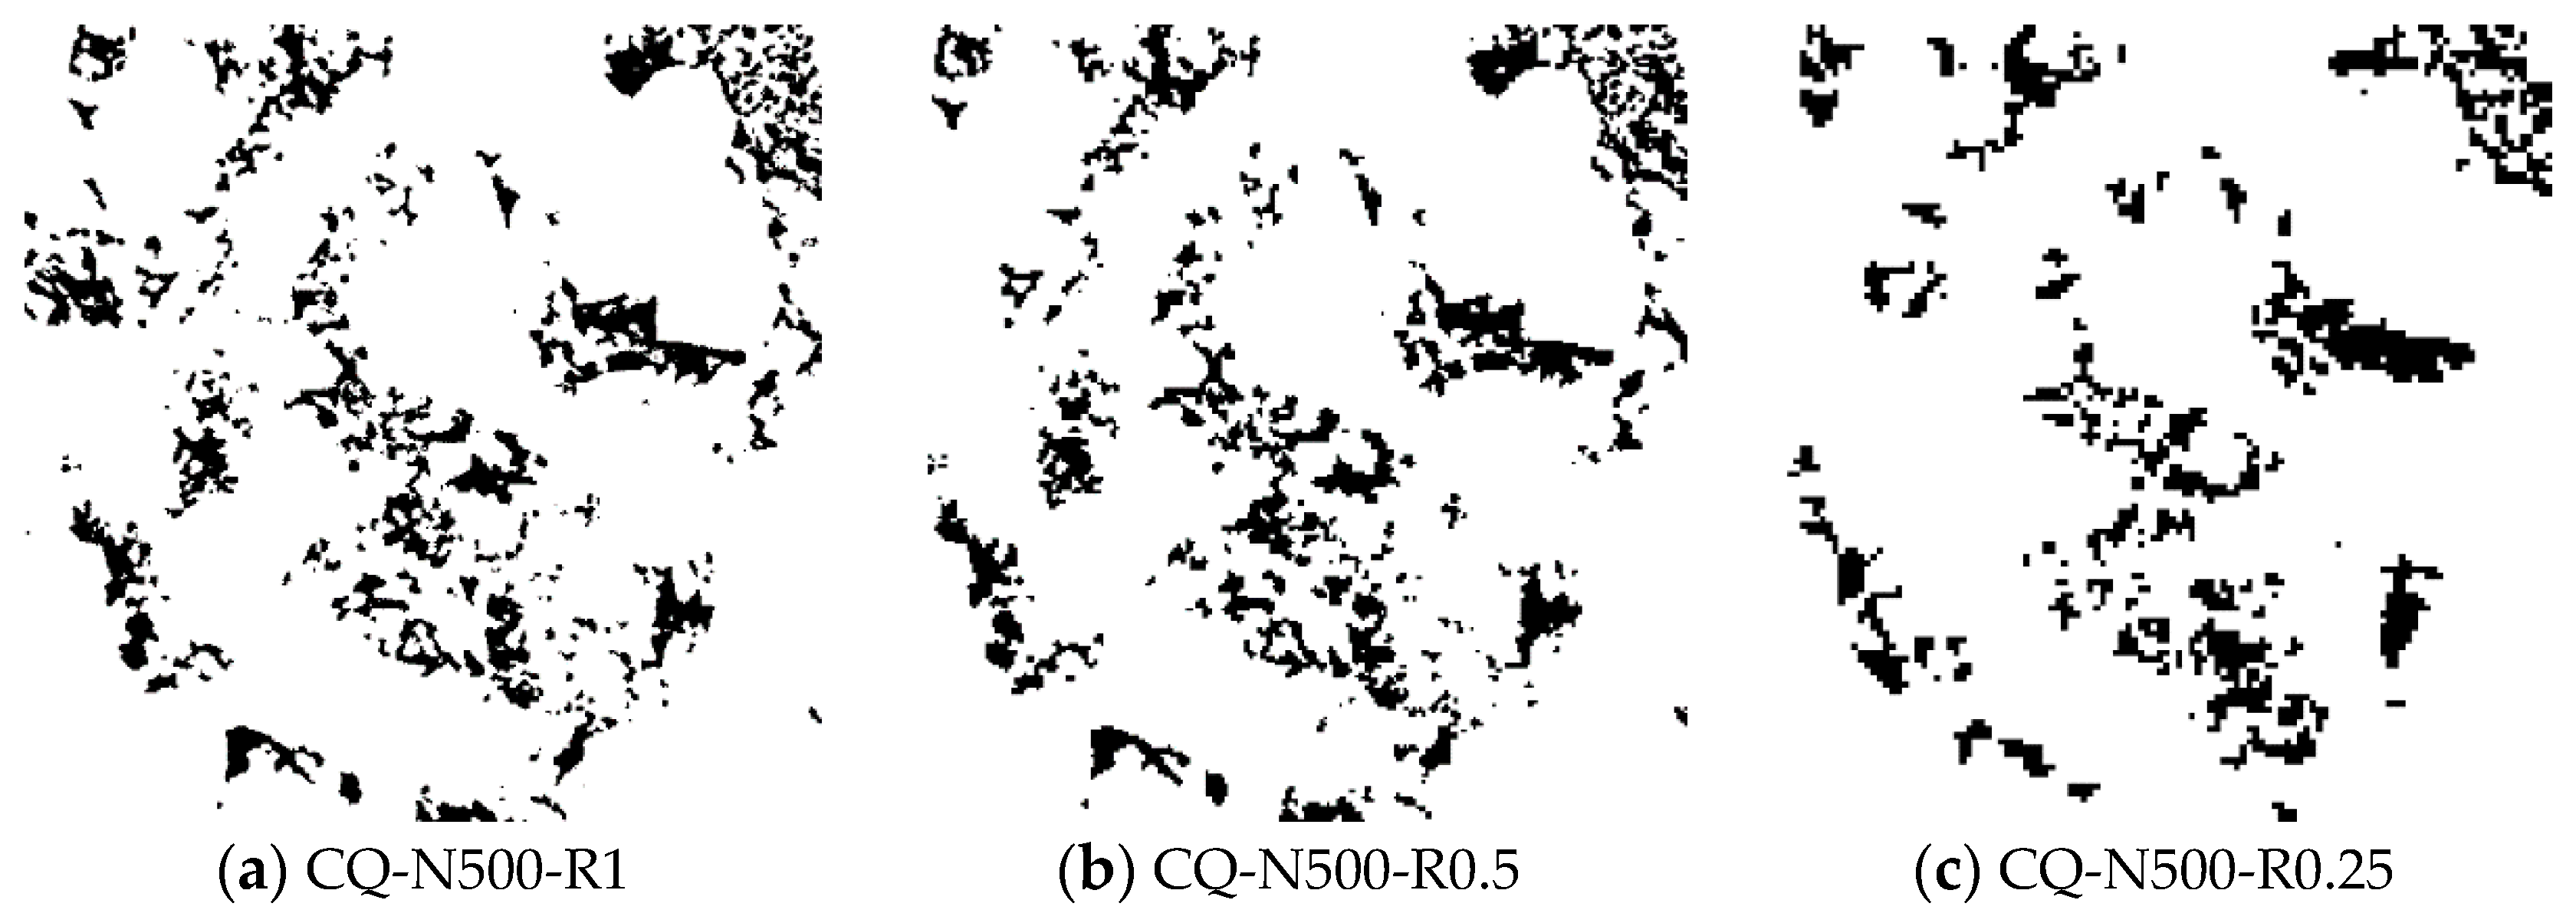
All other structures are then derived from base structure with cropping and coarsening operation. Cropping operation is used to change the structure size by keeping the cubic center fixed and extracting a smaller cubic. Schematic plot of cropping is shown in Figure 3 with a 2D slice as an example.
Coarsening operation consists of three steps. In the first step, the structure is resampled into smaller frame with larger voxel size and bilinear interpolation is used when averaging the pixel values. Due to the averaging process, the images are no longer binary and need to be segmented in the second step. The global threshold value is set to keep the total porosity closest to that at base resolution. In the third step, the connected pores are extracted and this ends the coarsening operation. An example of coarsening result is given in Figure 4.
In the second step, no segmentation algorithm is chosen since the resampled images are not real grey raw images as the intermediate value pixels are few and only exist at the interface between pores and solids. To avoid the bias and maintain similarity between coarsened structure and structure at base resolution, keeping the total porosity almost constant is a good way. In fact, if certain segmentation algorithm is used in coarsening operation, results can be misleading and the influence is given in Appendix A.
One thing to note is that the order of these two operations should have no effect on the derived structures. The connected porosity of derived structures from Changqing sample is examined by changing process order of operations when N is chosen as 400, 600 and 800 and R as 0.25, 0.50 and 0.75 respectively. The relative error is almost less than 0.1% and it is less when sample size is larger since the border influence of the averaging process is smaller. So the two operations can be seen as commutative and the effect of changing operation order can be ignored.

2.2. Permeability Calculation

Permeability is calculated for the images with applying finite volume method (FVM) to solve the Navier-Stokes equations at pore-scale. The computation is performed with OpenFOAM [49], an open-source c++ library for computational fluid dynamics (CFD). To separate the influence between image resolution and mesh resolution [32], meshes are refined at certain image resolution and an extrapolation permeability calculation approach is taken. The computation method and extrapolation permeability calculation are validated with flow through body-centered cubic (BCC) packing of spheres.

2.2.1. Case Set-Up

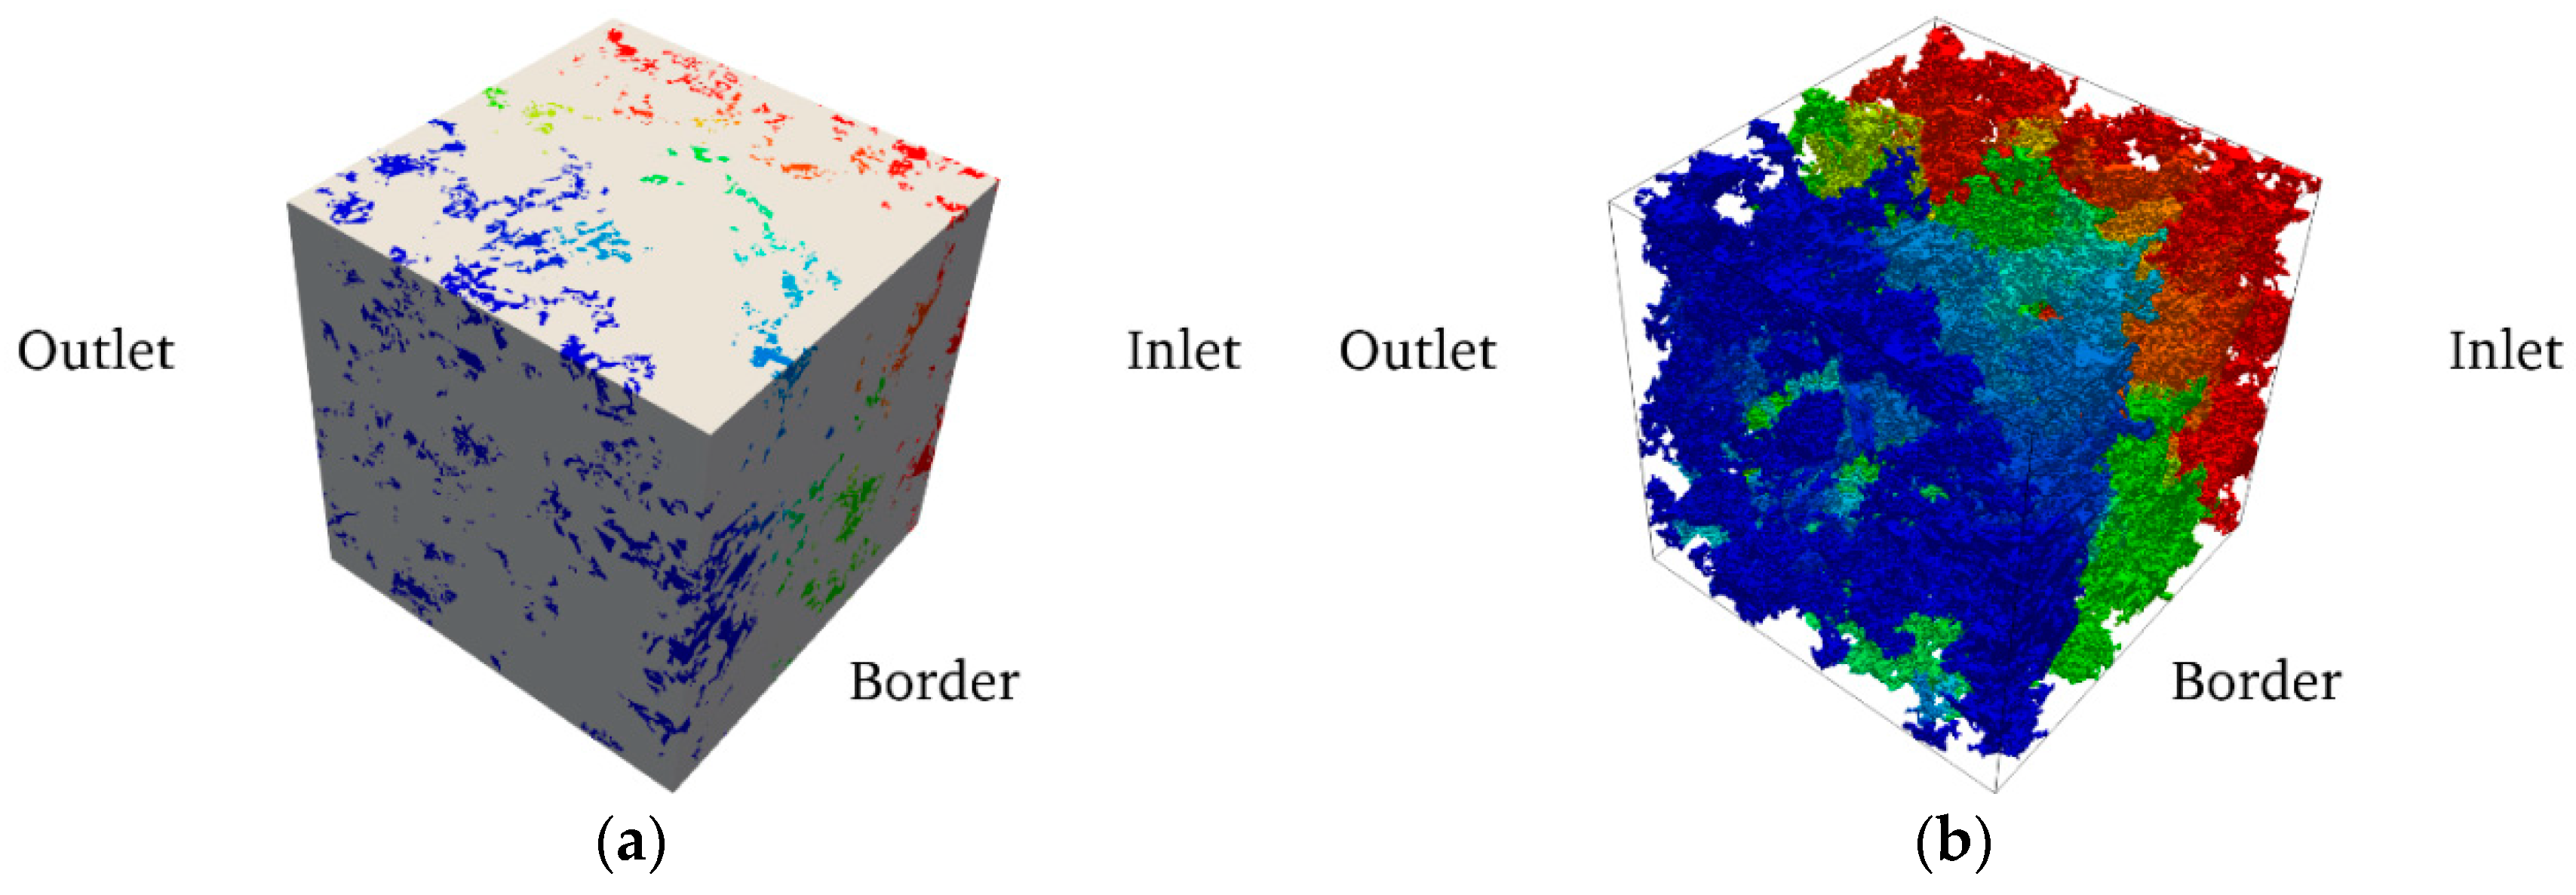
The computational domain is shown in Figure 5. Water flow through the porous media is considered to calculate the permeability and the governing equation is as follows:
𝛻 u = 0 ,
u t + 𝛻 ( u u ) = 𝛻 p ρ + ν Δ u ,
where p and u are the pressure and velocity respectively, while ρ and ν are the density and kinetic viscosity of water, given as 1000   kg / m 3 and 1.0 × 10 6   m 2 / s respectively. At wall of the porous media, no-slip boundary condition is given. Fixed pressure condition is set at inlet and outlet to maintain certain pressure difference, while no-slip boundary is also used at the border.

2.2.2. Extrapolation Permeability Calculation

With certain pressure difference, the flow rate of steady state is calculated and permeability is obtained using Darcy’s law. To well capture the image resolution influence, meshes are refined to eliminate the influence of mesh resolution [32]. As structured meshes are used and basic mesh size is equal to the voxel size, all image details are preserved in the meshes. In the refinement, each mesh cell is divided into s 3 smaller mesh cells and s is the refinement level, which takes value of 2 ,   3 ,   4 , . In this way, the same image resolution is preserved during the mesh refinement process as no changes are applied to structures except the mesh size, and mesh resolution effect can be studied and excluded.
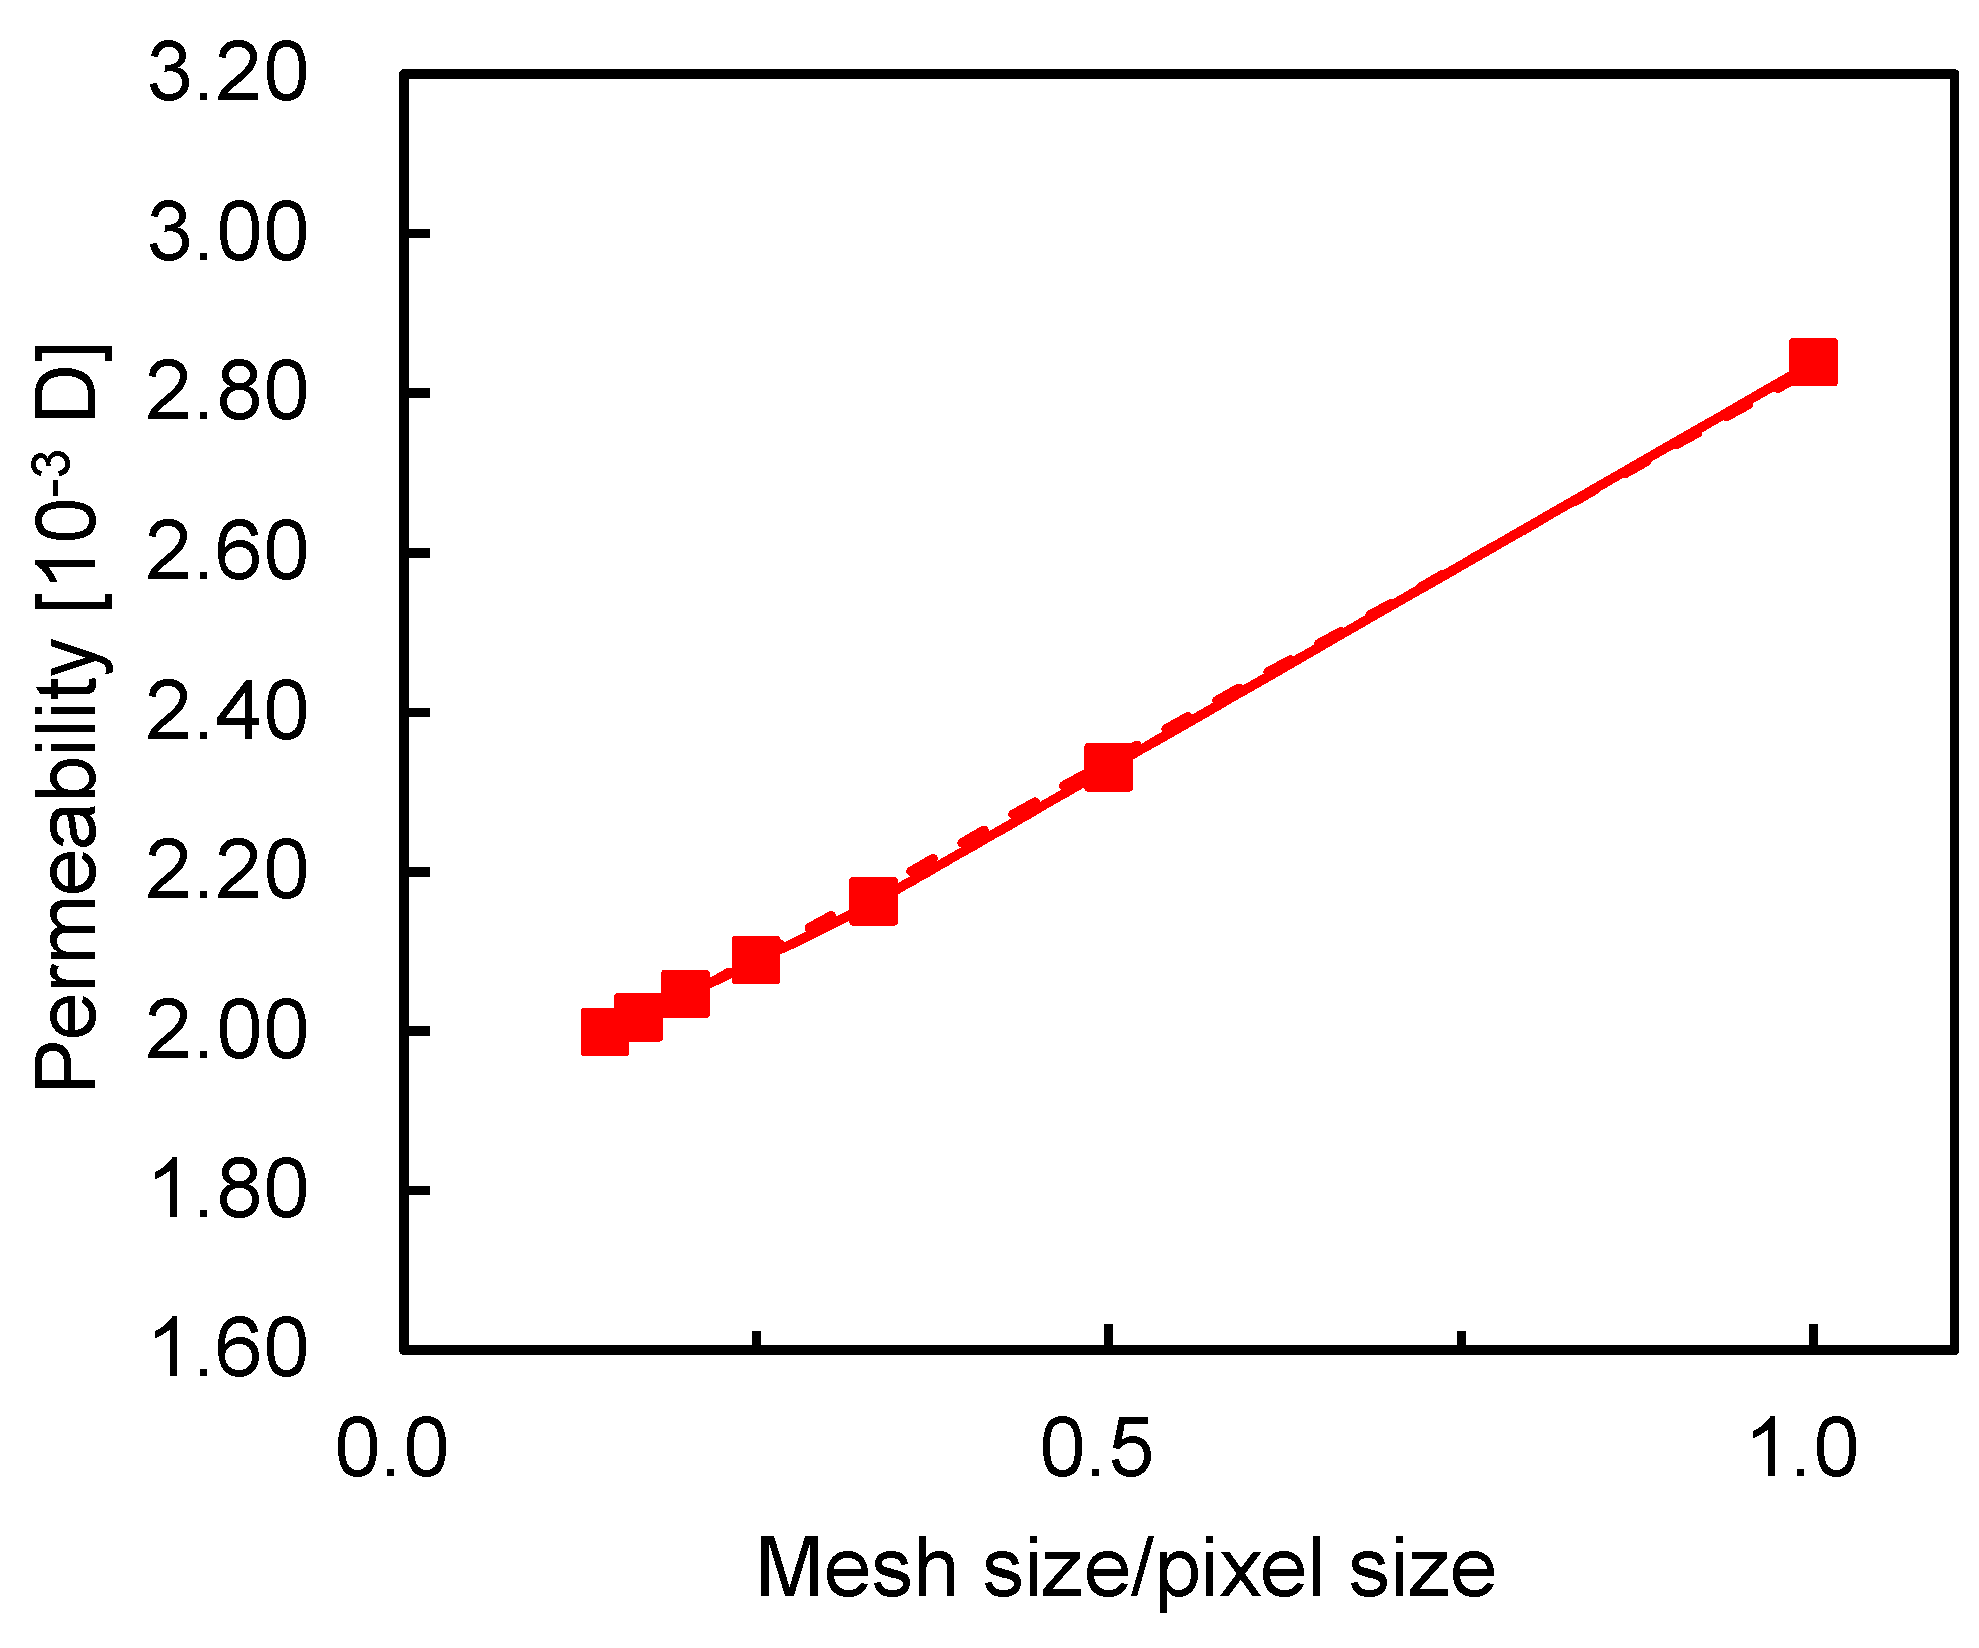
The permeability result of CQ-N100-R1 calculated at different refinement level is given in Figure 6. A clear linear relation between calculated permeability with mesh size exists. As refined meshes gives much more accurate flow field information through porous media, the permeability of images with given resolution is more accurately calculated at higher mesh resolution. It can be seen that calculated permeability at lowest mesh resolution is almost 1.4 times of that at highest resolution. Thus to lower the error introduced by finite mesh resolution, extrapolation is used to get the final permeability as
k = 2 k refi k base .
Here, k base is the permeability obtained when mesh size is equal to pixel size and k refi is obtained with refinement level s = 2 . This is valid when calculated permeability changes linearly with mesh size, and in other words it means the computation method is of first order space convergence.

2.2.3. Validation

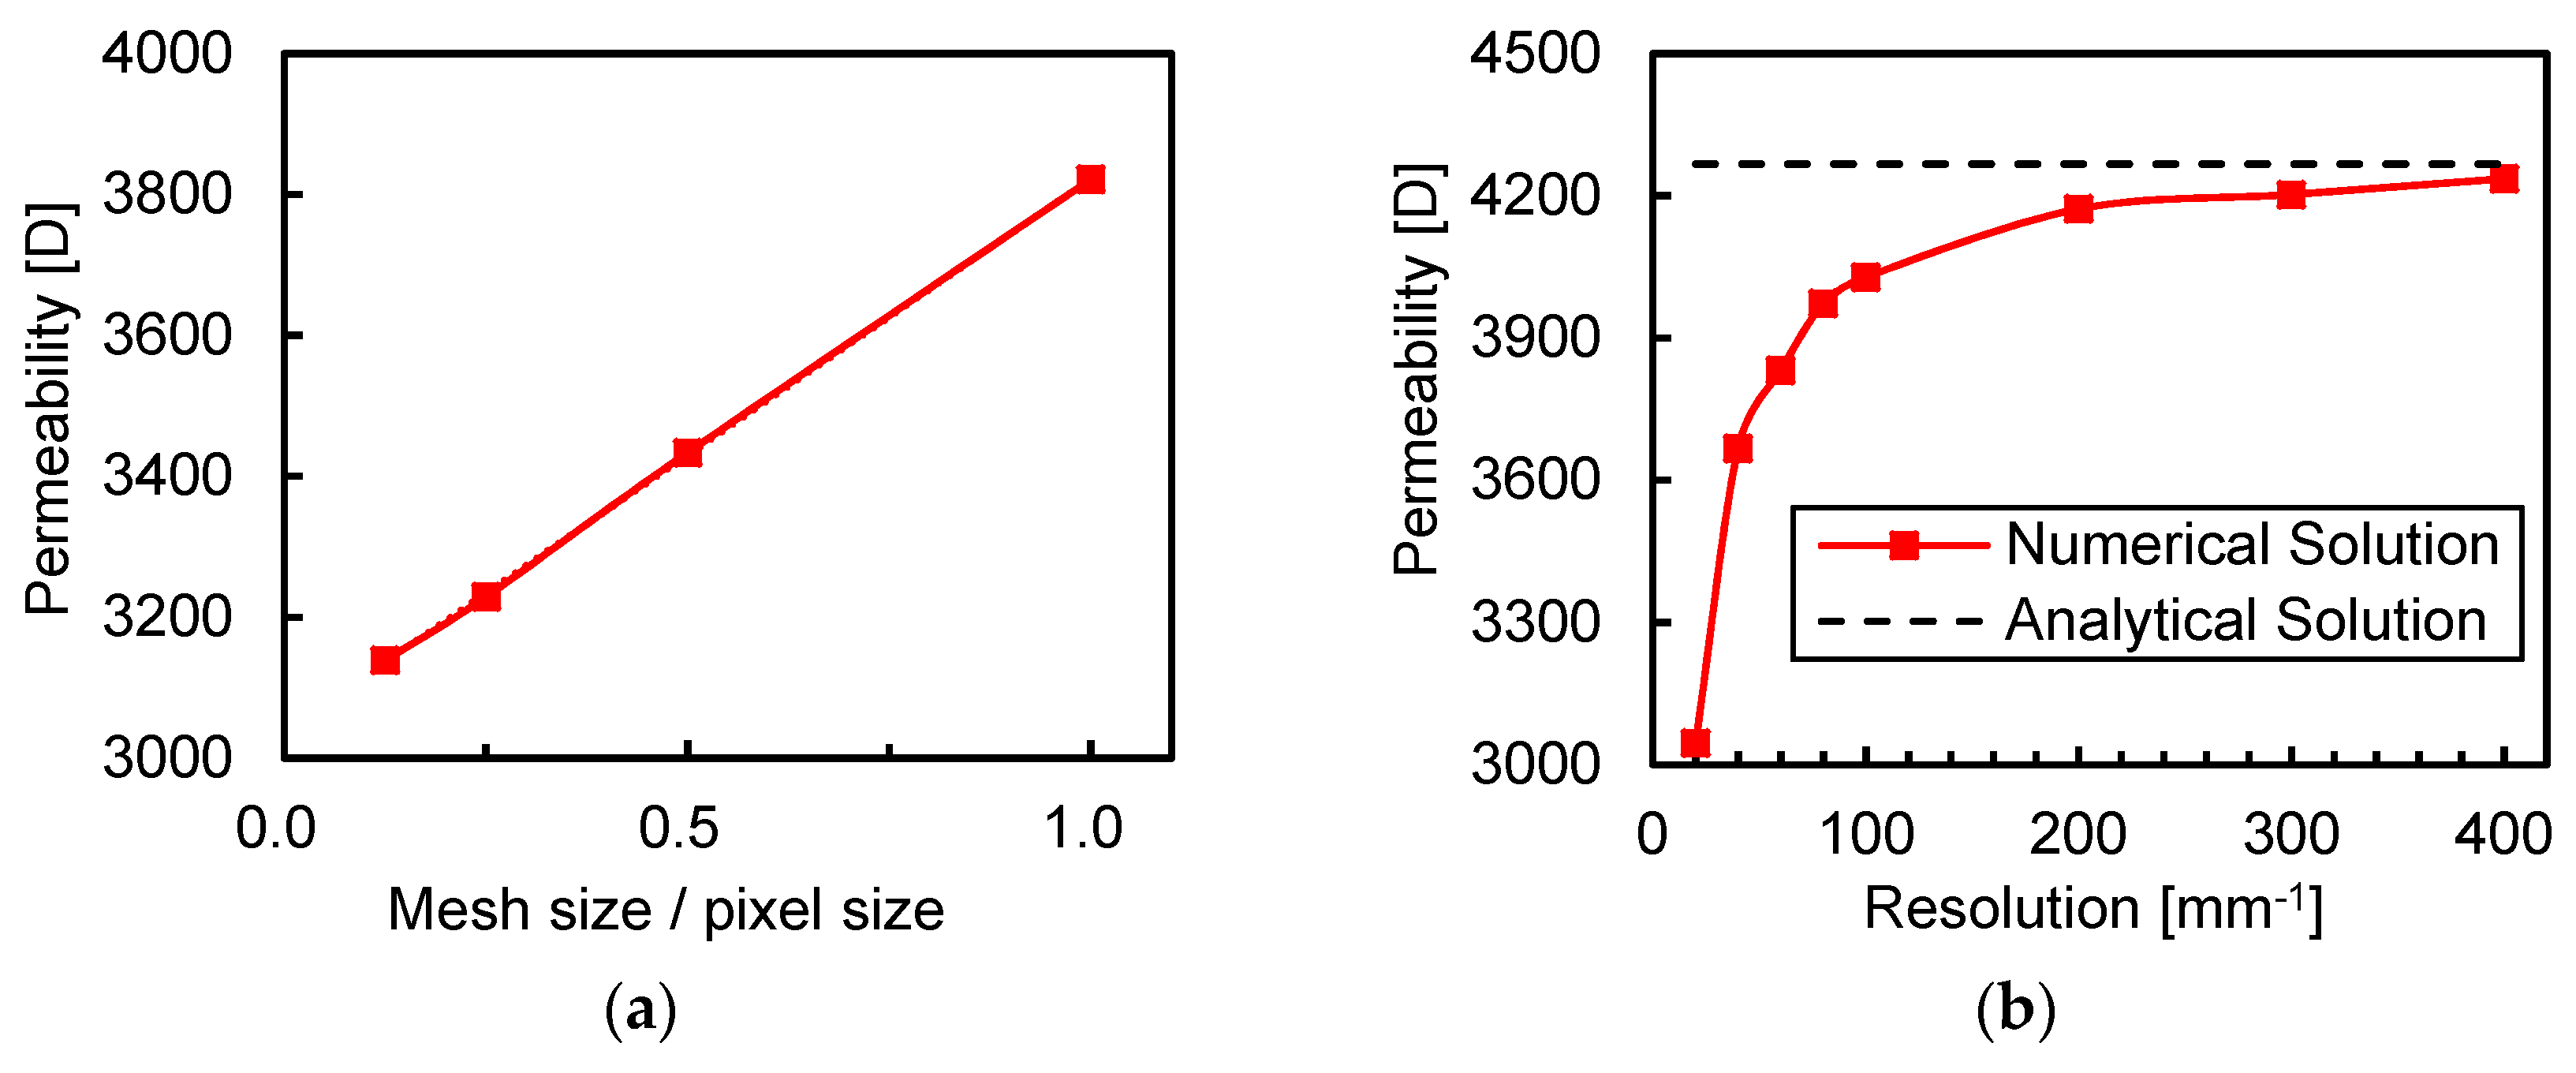
To validate computation method and the extrapolation permeability calculation, flow through BCC packing of spheres is considered [50,51,52]. Unit length of the BCC cell is set as 1   mm and the radius of the sphere is 0.35   mm . Different resolutions are used to resolve the BCC structure and obtain images with varying voxel sizes. As the total length is fixed, BCC-N40 for example is used to denote the structures, which means the resolution is 40 pixel/mm. The fluid is also water, and surrounding boundary is set as symmetry plane with fixed pressure given at the inlet and outlet. The extrapolation method is used to calculate the permeability and result is shown in Figure 7. It is clear that linear relation between calculated permeability and mesh size still exists. What is more important is that the extrapolated permeability converges to analytical permeability when image resolution increases. This is in fact a general result because increasing image resolution decreases the geometry difference. This result also shows the possibility of quantifying the resolution effect. If the variance tolerance is 10 % , resolution of 60   mm 1 is high enough to obtain an acceptable permeability result. Cut-off resolution (COR) can tn be introduced it his similar way as REV, which represents the coarsest resolution above which computed result from DRA is accurate with the real property.
The results also reveal that two kinds of error exist when calculating permeability. One is the numerical error, which is affected by the mesh resolution, time step, discretization schemes and linear algebra system solver accuracy [53]. It reveals the error between the numerical solution and the analytical solution for the same system. For steady state computation, mesh resolution induced error is dominant. The other one is geometry error, which is the error introduced by geometry inconsistency. For the BCC structure, the numerical error will decrease when refining meshes but geometry error always exists unless the structure is well resolved. When extrapolation method is used, the geometry error is highlighted and effect of resolution can be well captured.

2.2.4. REV and COR Determination Approach

When reached REV or COR, the rock property will be stable and changeless. Suppose M rock property data points y i are collected at varying xi, i = 1, 2, ⋯, M. x i here represents sample size or image resolution and is increasing monotonically. If stable property is reached at m -th point, rock property can be estimated with mean property from this point as Φ m = mean ( y i ) ,   i m . When property is stable, small variation from the mean property is expected. The variation is calculated as the maximal relative error E m = m a x ( | y i Φ m Φ m | ) ,   i m . If E m is within a variation limit ε , the assumption is true and REV or COR is reached at m -th point. The smallest i to meet the assumption I = min i ( E i ε ) determines REV or COR as x I and rock property as Φ I . In this work, the variation limit ε is set as 10%.

3. Results and Discussions

3.1. Resolution Effect

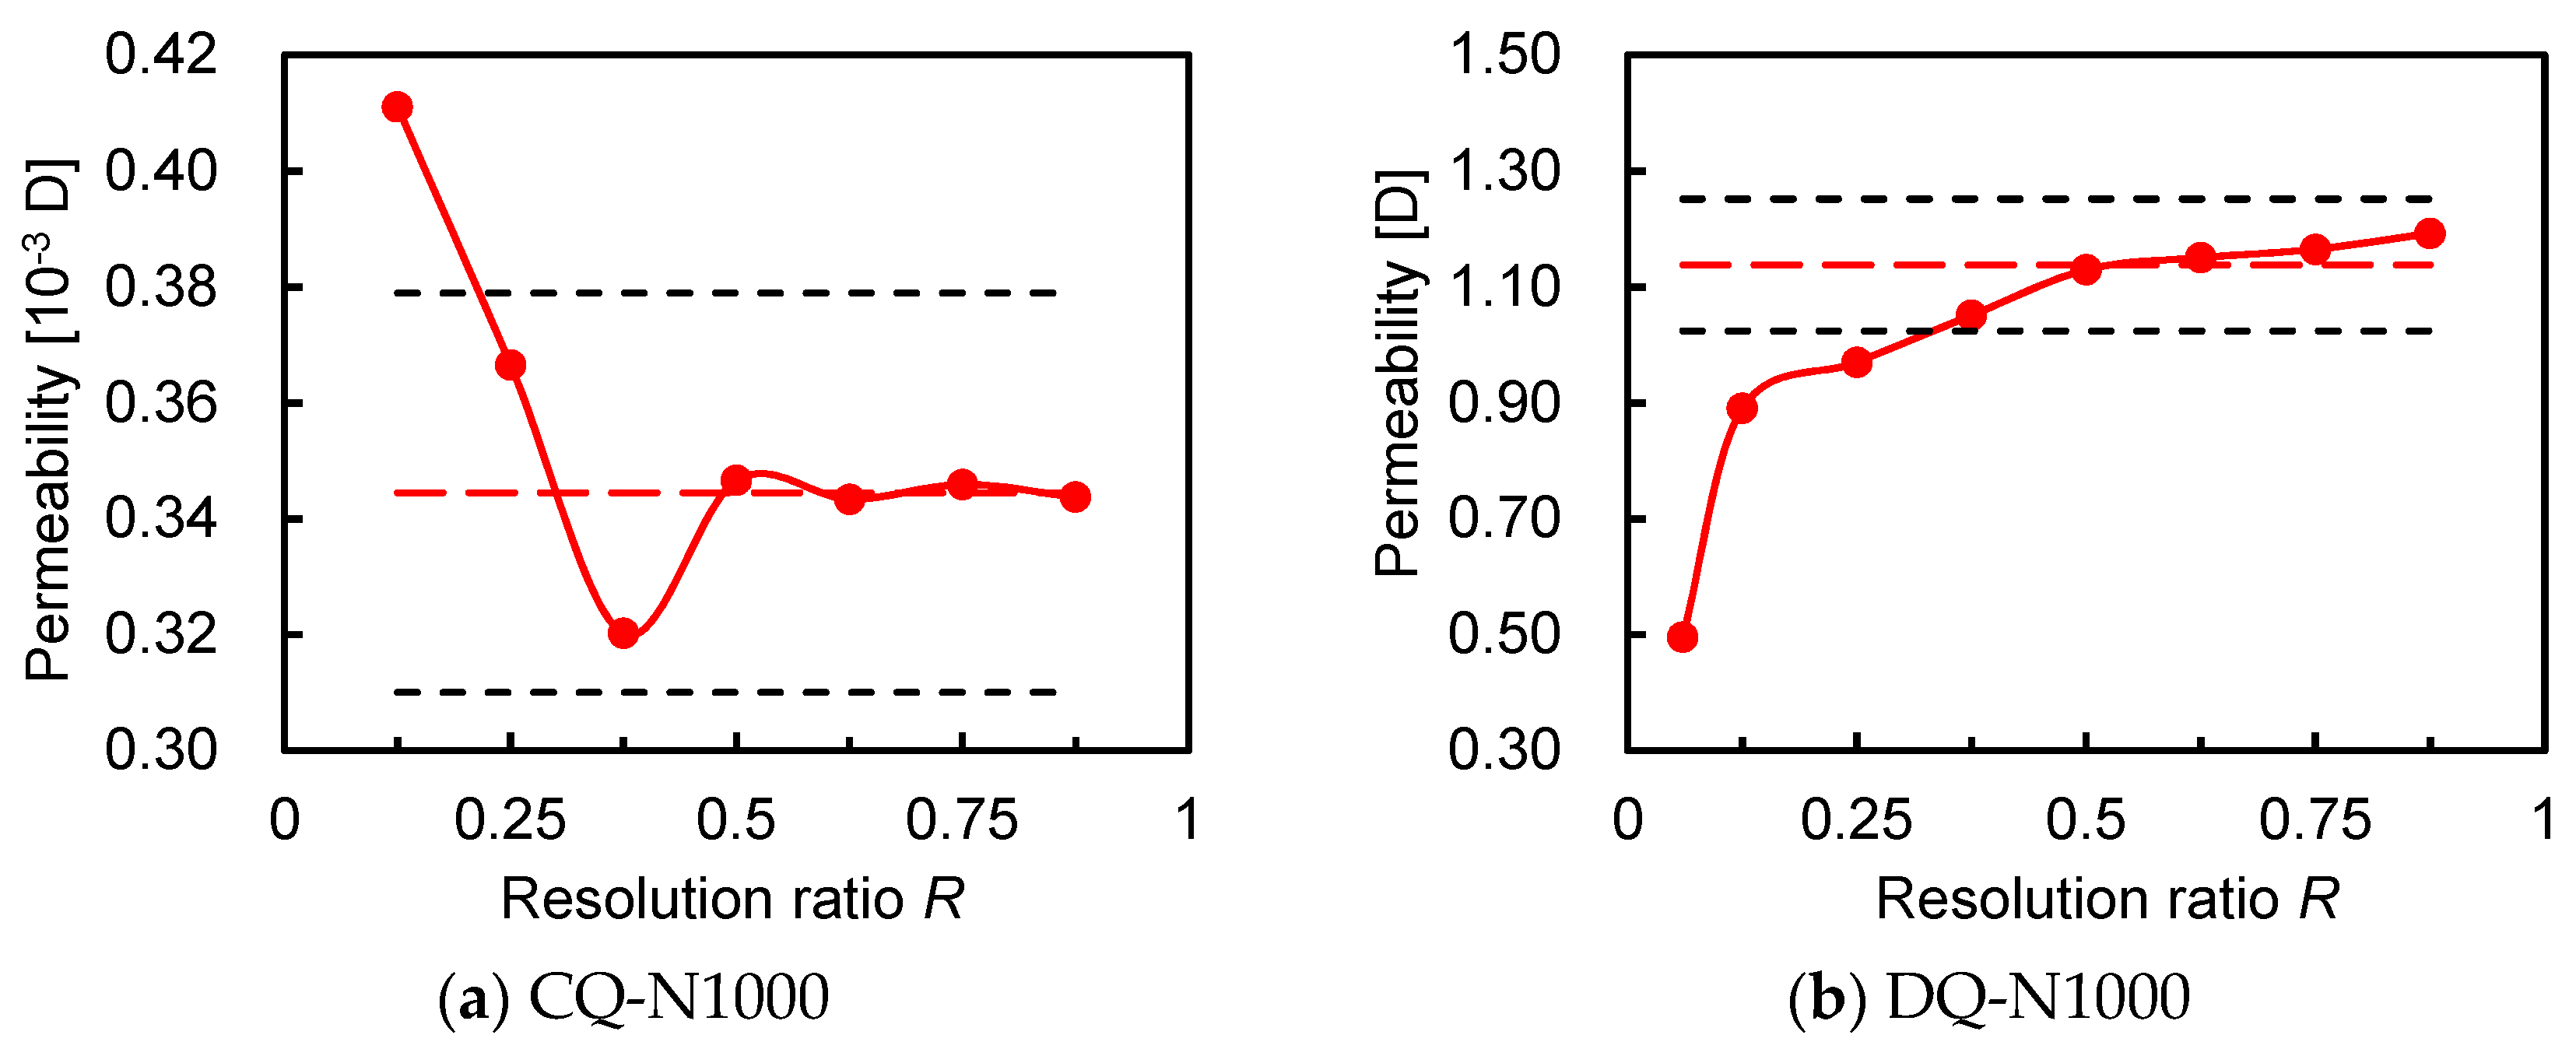
The resolution effect on rock property is considered first to check whether COR exists in real rock samples. Results calculated at N = 1000 are shown in Figure 8. It clearly shows that variation of permeability decreases when resolution increases and it finally reaches stable. This means that permeability can be estimated accurately at certain low resolution, which proves the existence of COR.
For two samples, COR is found as R = 0.25 and 0.375, and the stable permeability is 0.35 × 10 3   D and 1.14   D respectively. However, if the sample size is checked, it turns out that DQ-N1000-R1.0 fails to be representative though the resolution is high enough. Results and detailed discussions will be given in next section. As DQ-N1000-R1.0 is not representative, it is not qualified to estimate permeability and is excluded in the following discussion of resolution effect.
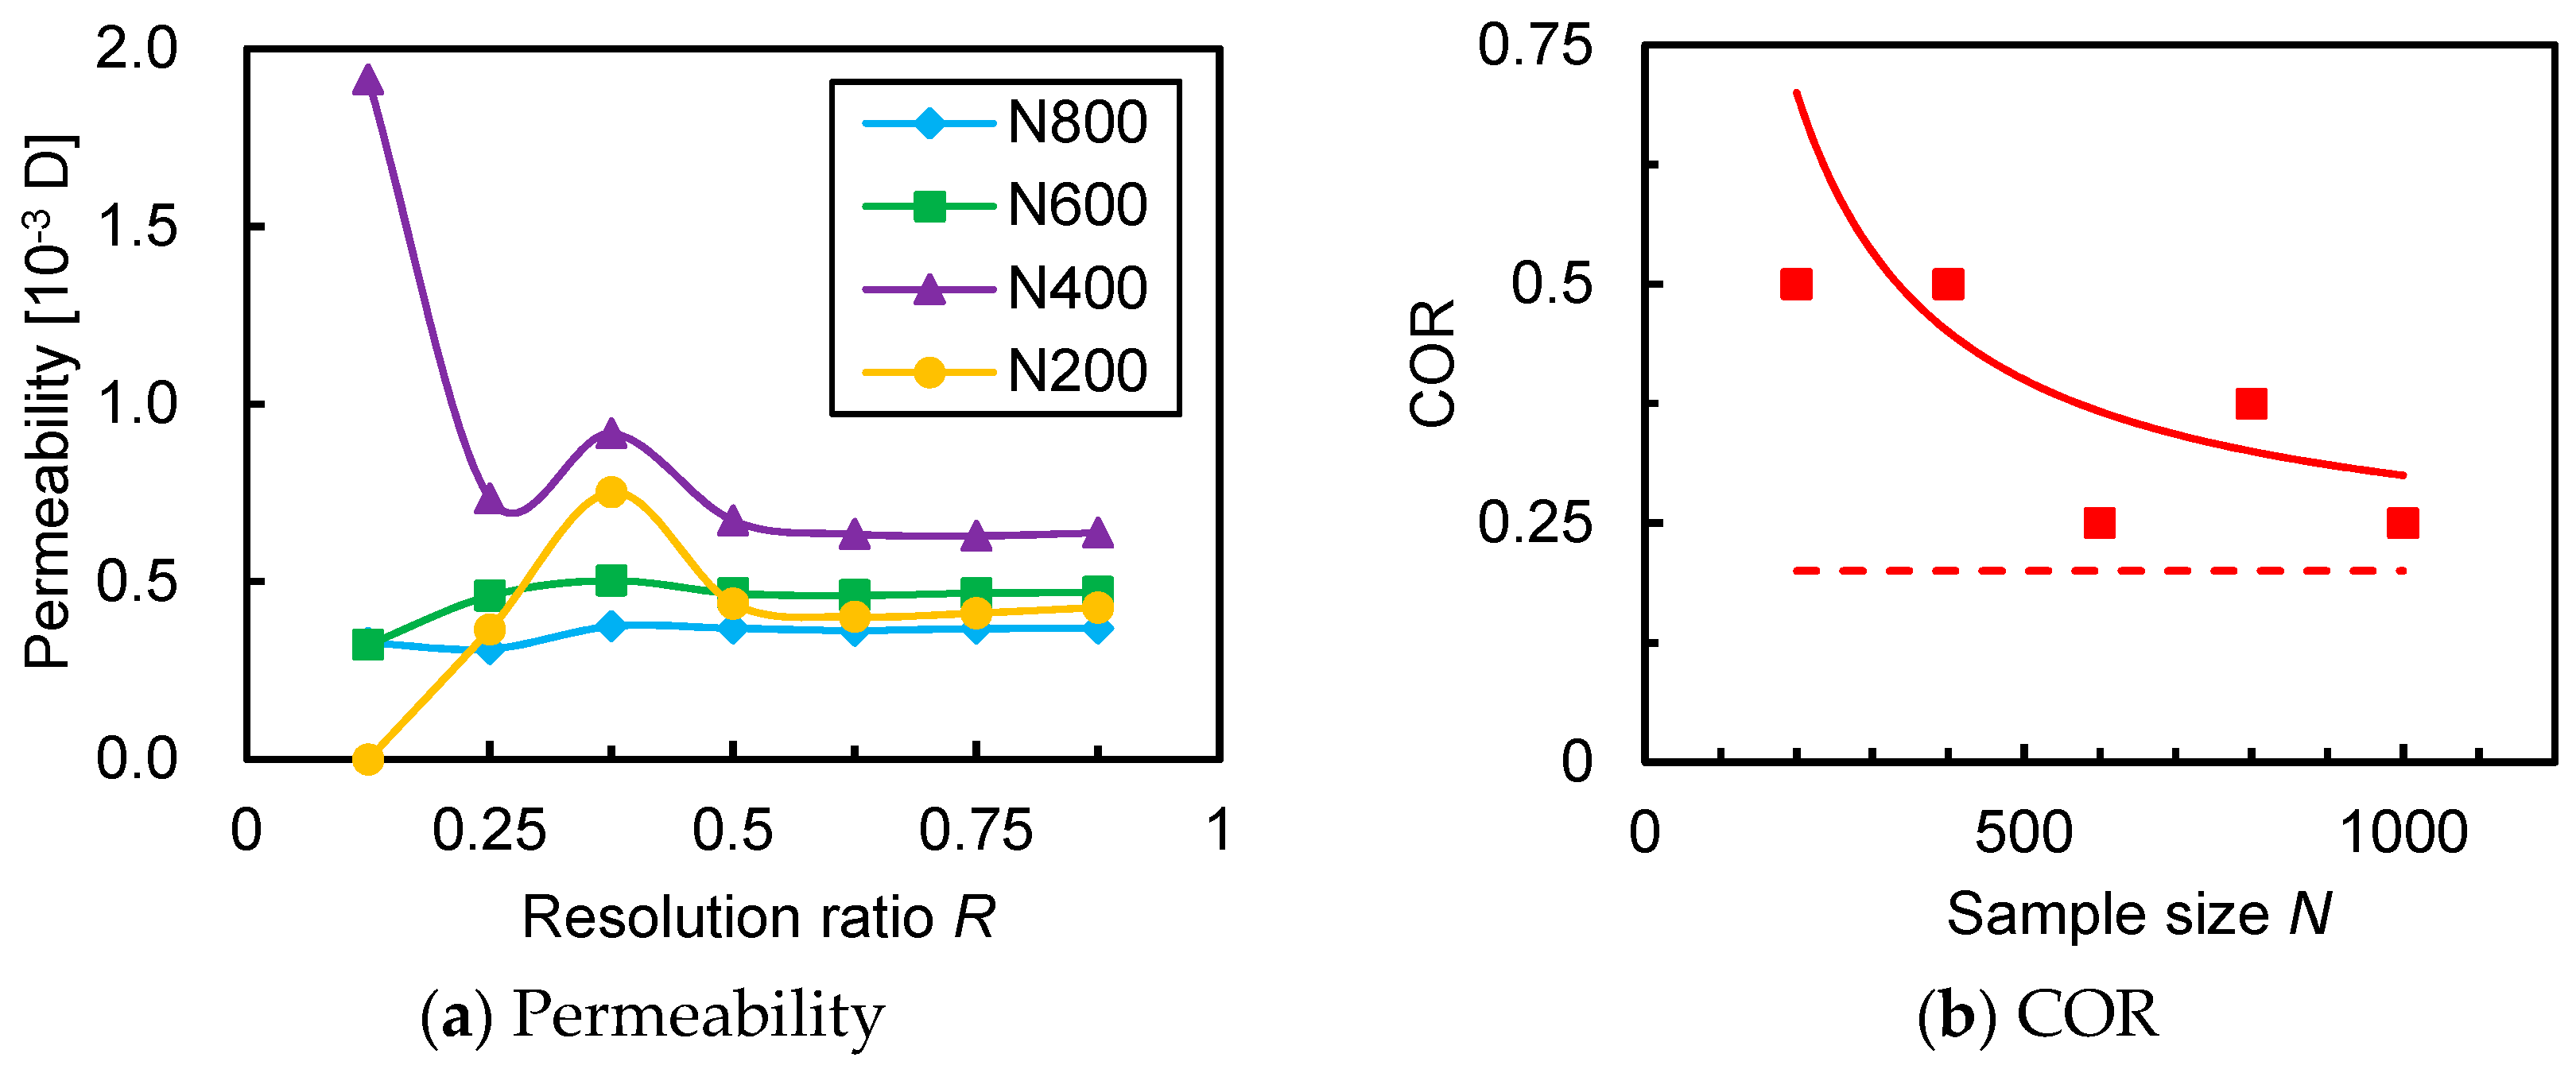
As REV determines a range of sample sizes, it is necessary to check the dependence of COR on sample size. Results are given in Figure 9. It can be seen that for different sample sizes COR is not the same, even when REV is reached at N = 800 . A schematic tendency plot is given and the explanation is that with larger sample size the oscillation introduced by geometry error can be better removed and thus a lower COR is obtained. As COR changes with sample size and rock property has to be representative, sample size effect is then discussed.

3.2. Sample Size Effect

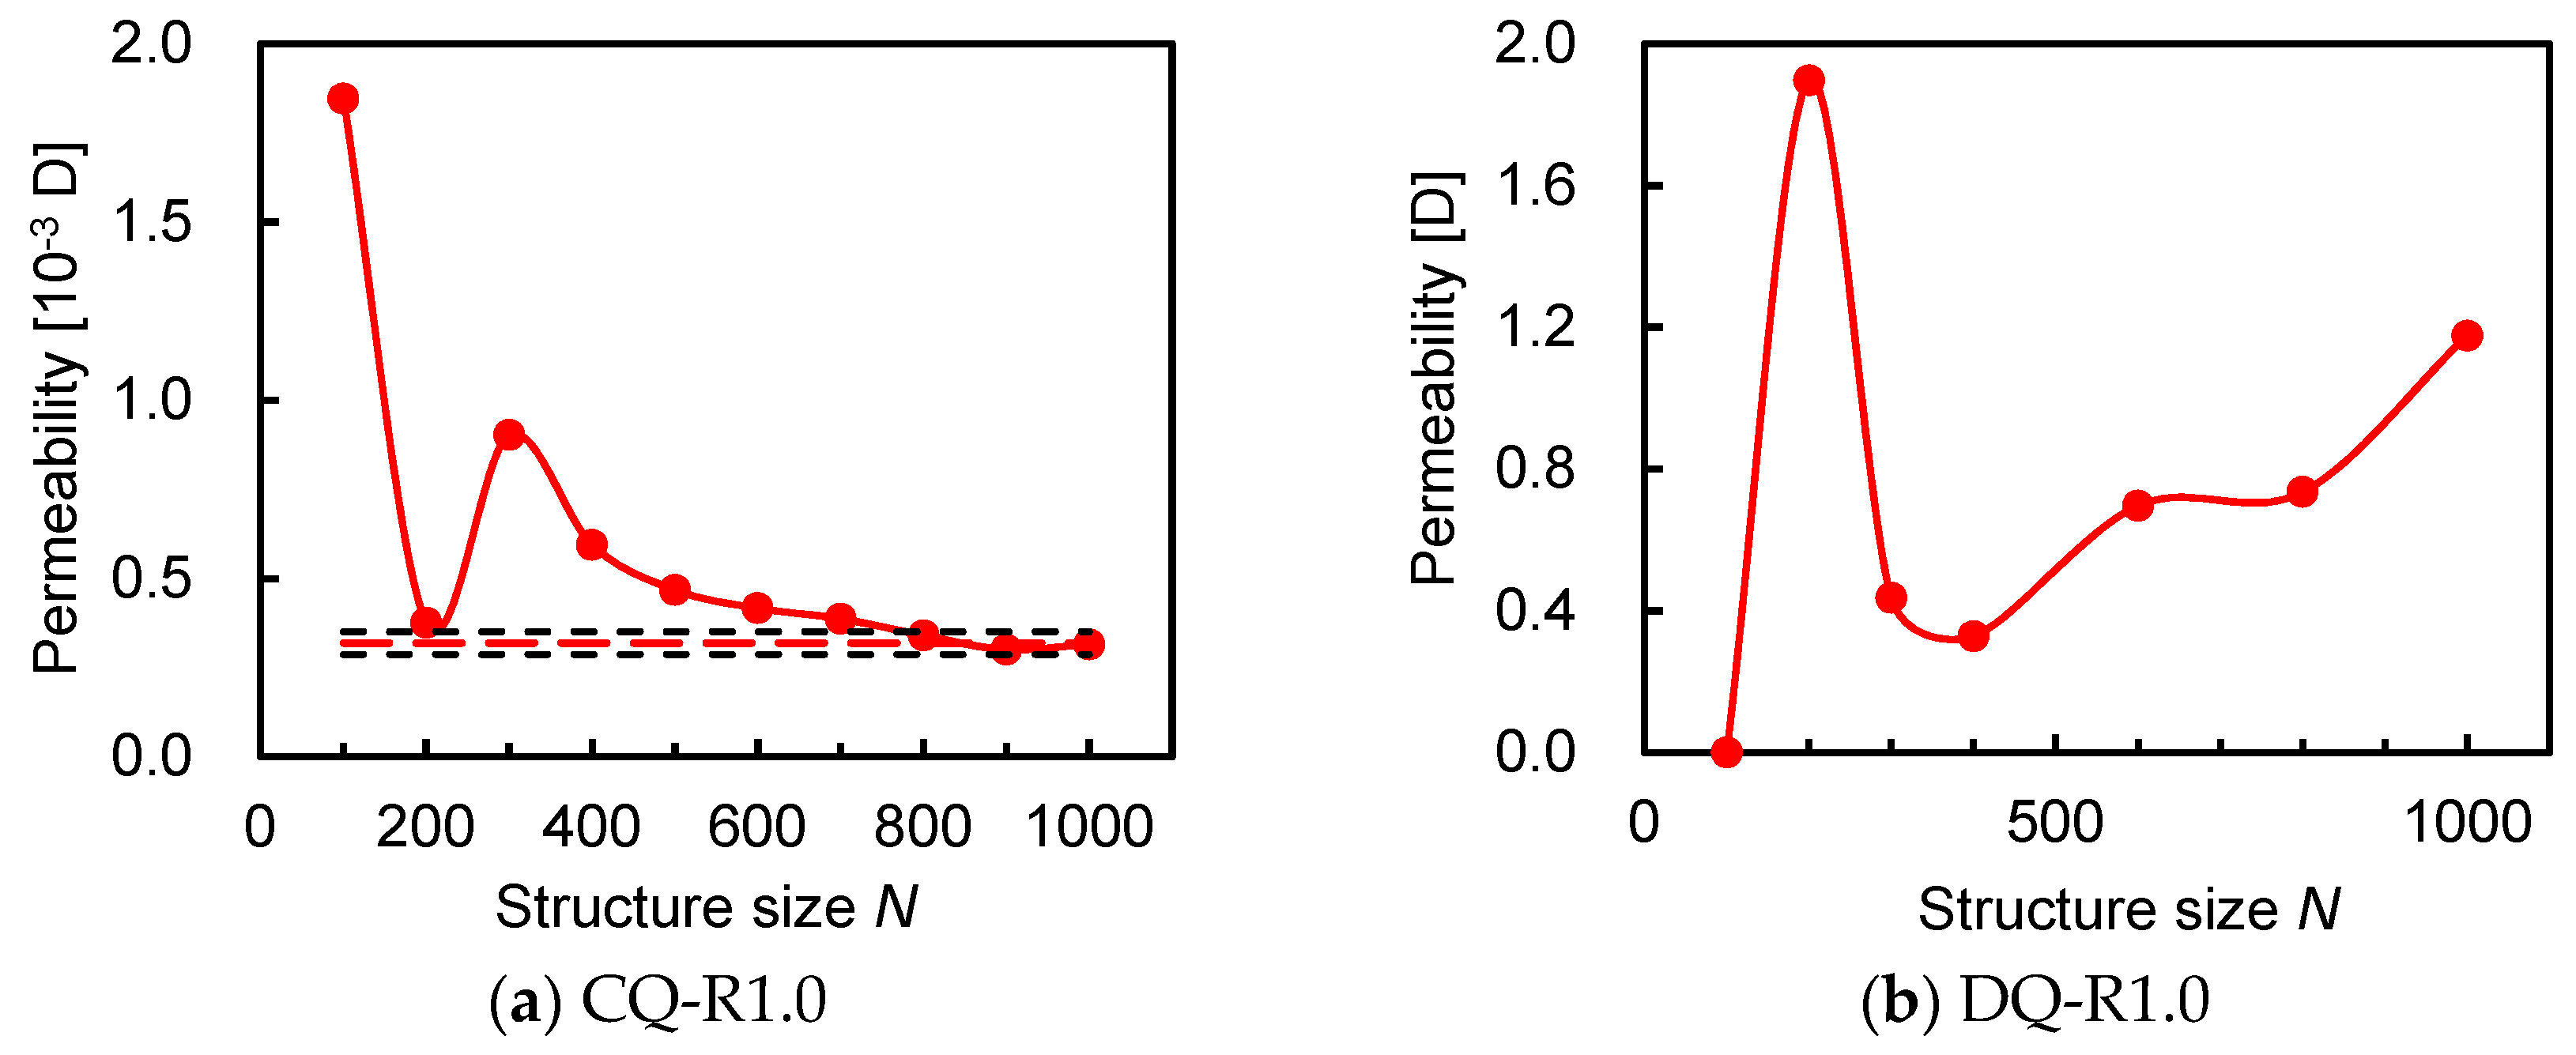
It has to be checked whether REV is reached to guarantee the representativeness of permeability. The results are given in Figure 10. It shows that if sample size is not large enough, the result displays big difference and no accurate permeability can be found, just like Daqing sample. But when increasing sample size, the oscillation will be vanished and stable permeability can be obtained when REV is reached.
For Changqing sample, REV is N = 800 and stable permeability is 0.32 × 10 3   D . For Daqing sample, it fails to reach REV though the resolution is high enough. This result implies that high resolution can lead to a useless result even though high cost is spent, and it is necessary to choose a moderate resolution.
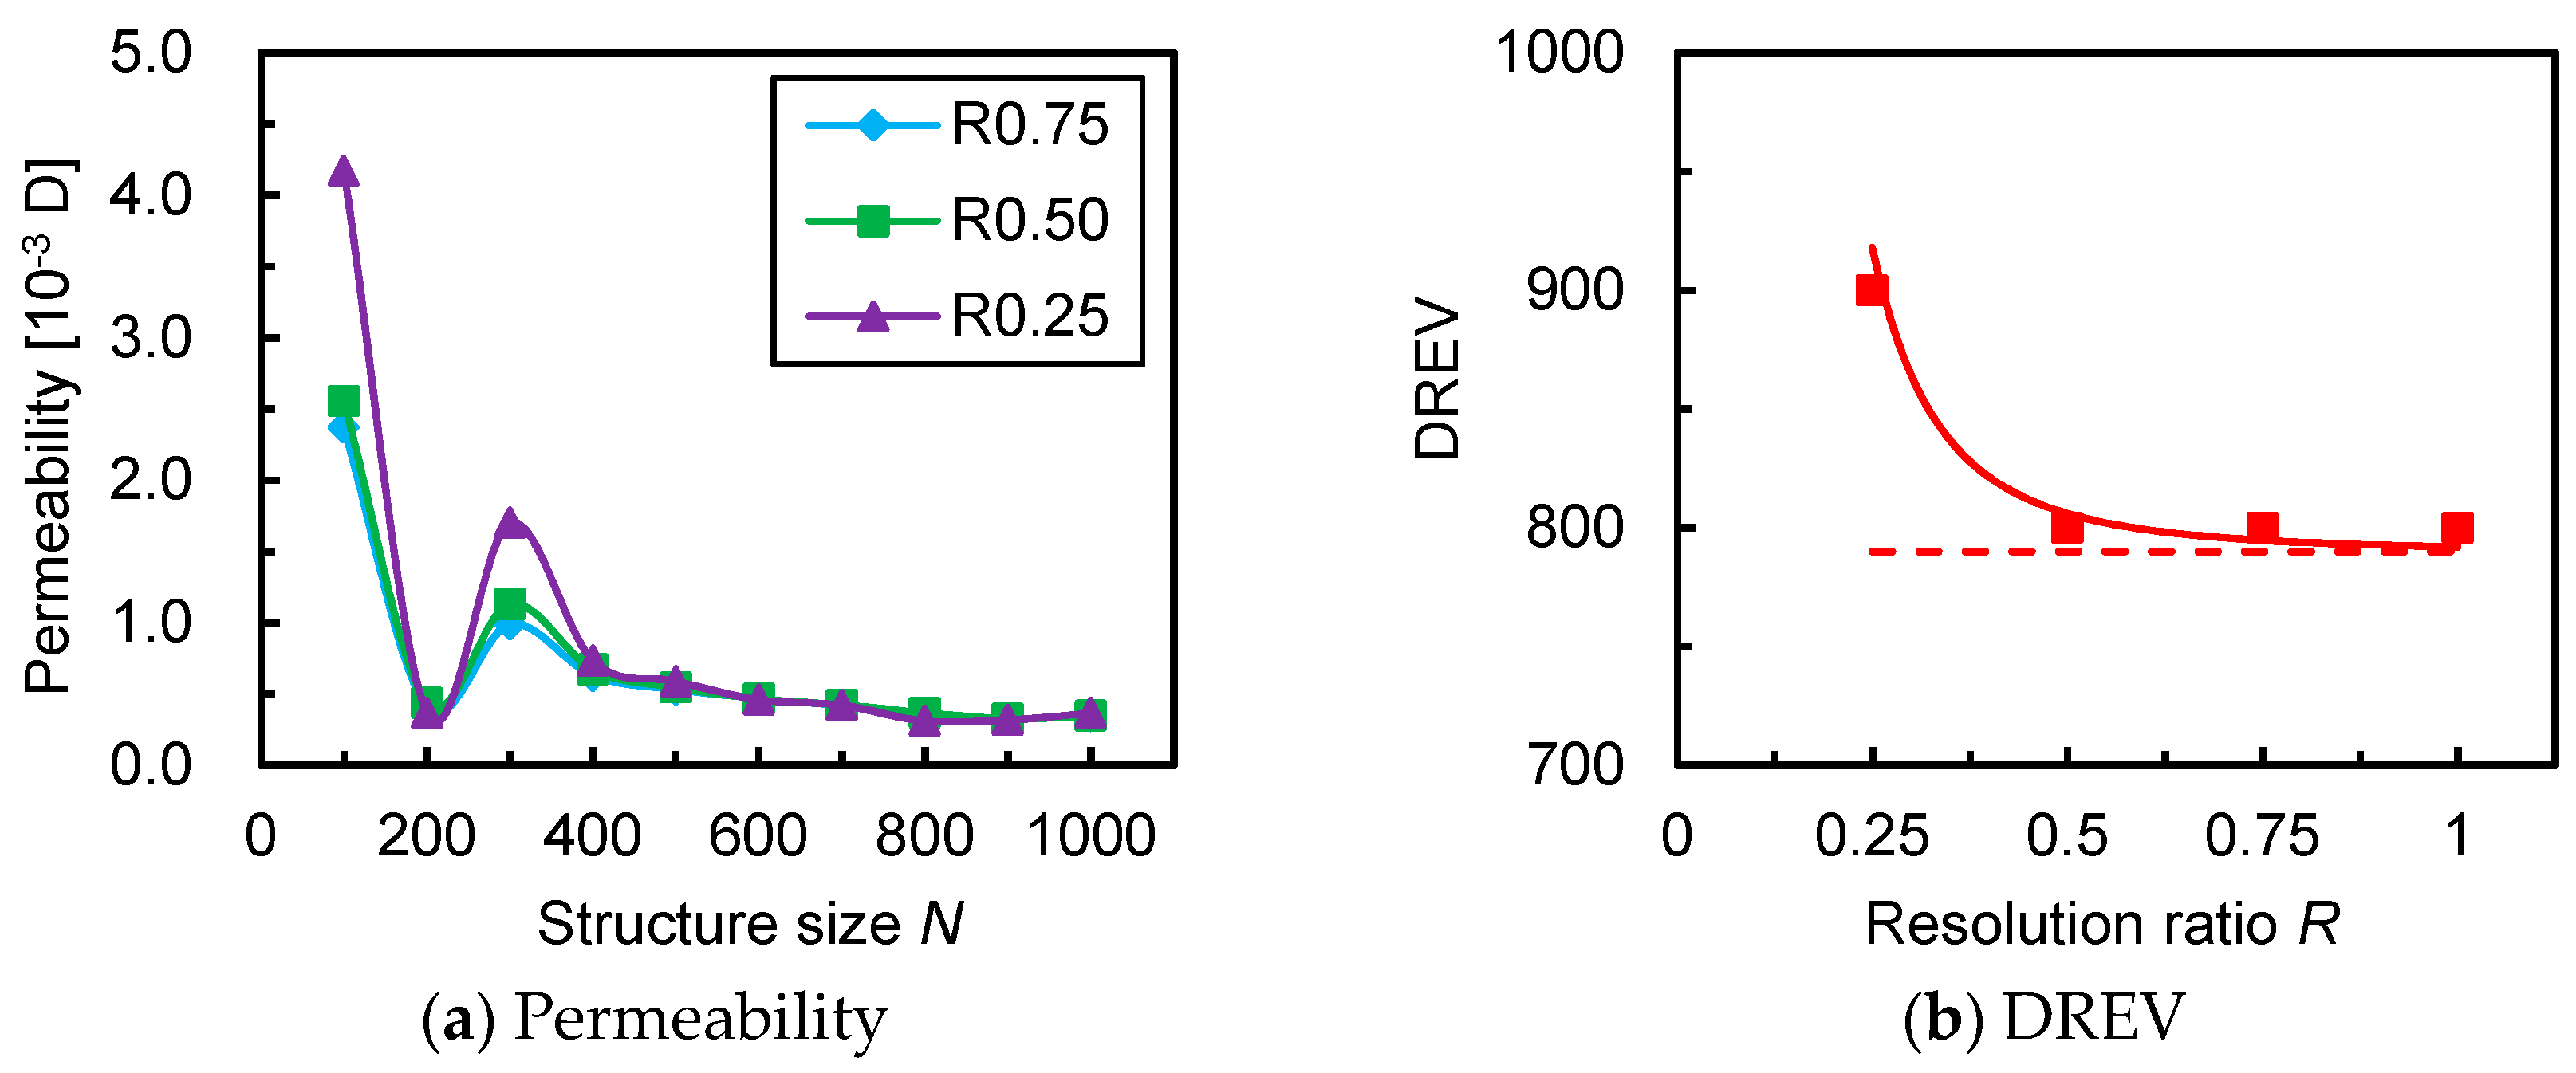
As REV is a physical concept, it should be independent of resolution. However, results in Figure 11 show that at different resolutions the estimated REV for digital rock can be different. In fact, this result is natural because the “REV” estimated from digital rock is not real REV and it is named digital REV (DREV). As there is inconsistence between the reconstructed structure and real structure, estimation from digital rock is different from real property. It is expected that all estimations obtained from digital rock are dependent on resolution and will converge to real properties when resolution is high enough. Therefore, DREV will converge to REV when resolution increases just as the schematic tendency plot displays.

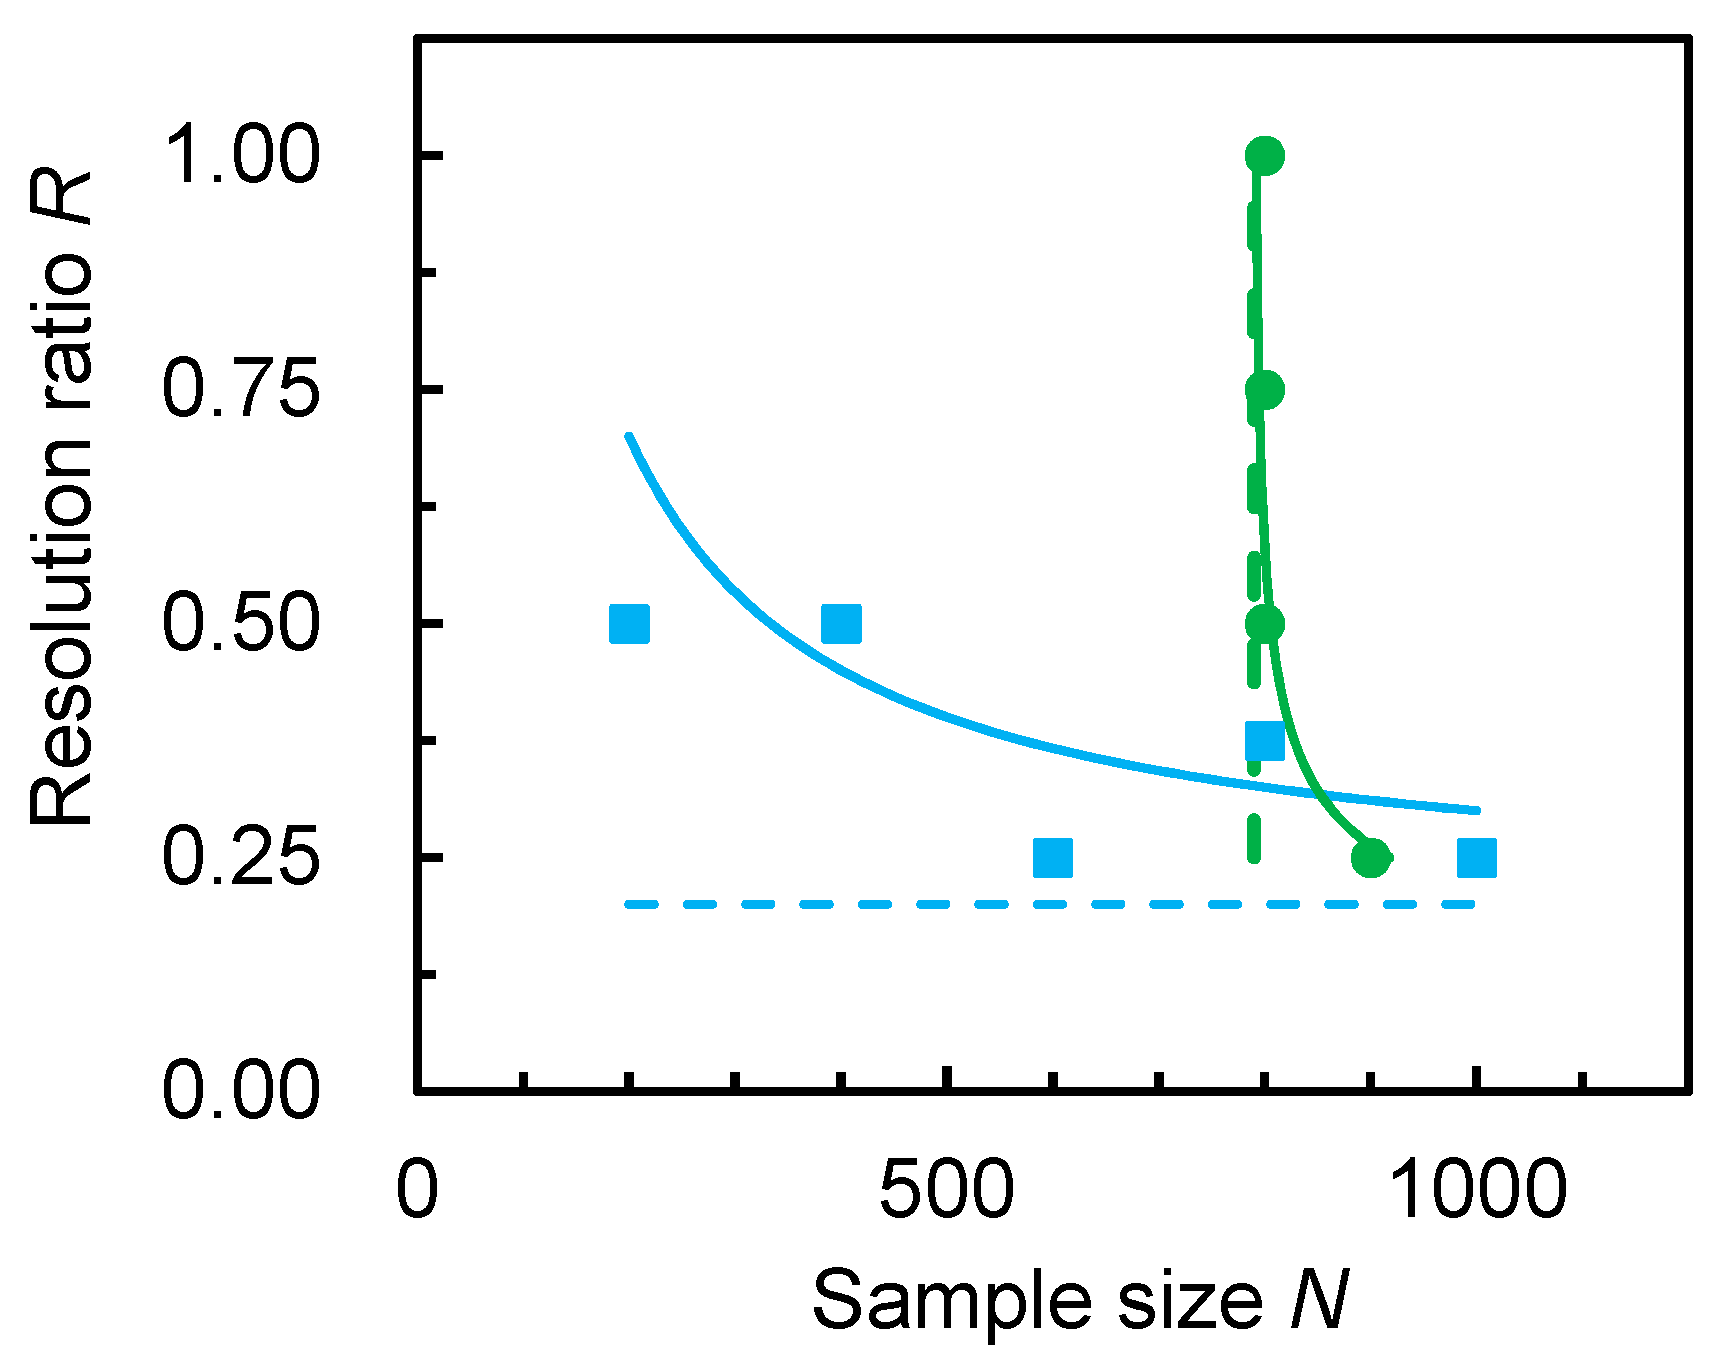
3.3. Critical Resolution and Sample Size

Above results clearly indicate that sample size and image resolution are directly influencing the DRA results together, thus it is always necessary to take these two factors into consideration at the same time. With COR and DREV plot together in Figure 12, a stable permeability region can be obtained as the intersection region of the two curves. In this region, resolution is high enough to reach COR and sample size is large enough to reach DREV, so the estimated permeability is stable and accurate. In real applications, to balance cost and benefit, resolution and sample size should be chosen in this region. To decouple the interaction between sample size and resolution for simplicity of application, critical resolution and sample size are introduced to cut a square region from the irregular region as a sufficient condition region. In this way, accurate and representative rock property can be estimated from DRA when scan resolution is higher than critical resolution and sample size is larger than critical sample size. As the DREV changes little when resolution changes, the critical sample size is chosen as N c = 800 . And the critical resolution is chosen as the highest COR when sample size is larger than critical sample size, which is R c = 0.375 . Finally the critical resolution and sample size are obtained for permeability of Changqing sample, the critical resolution is r c = 1.34   pixel / μ m and critical sample size is lc = 0.224 mm.
The existence of critical resolution and sample size is important, especially for decision of the imaging system when applying DRA. An imaging system usually gets an applicable range of resolution and sample size. For certain rock sample, if resolution is chosen too high the sample size can be too small to be representative. Critical resolution and sample size provides a criterion to deal with this trade-off between resolution and sample size, which can produce satisfying results with relatively low cost.
It has to be noted that critical resolution and sample size are investigated for single phase flow of Newtonian fluid in tight sandstone samples in this work. As REV is dependent on rock types and transport processes, it can be expected that the critical values are also different for different transport process such as two-phase flow and electrical conductivity, different fluids properties such as non-Newtonian fluids and different rock types such as shales and carbonates. Nevertheless, method used in this work can be easily extended to deal with the more complex cases mentioned above. The only changes are the reconstructed structures and computed properties. This method can also be applied to check whether critical resolution and sample size are reached.

4. Conclusions

DRA has become a powerful way to estimate rock properties, and sample size and scan resolution need to be carefully chosen for good performance and appropriate cost. In this work, it is demonstrated that the critical resolution exists for estimating permeability using DRA, thus accurate results can be obtained with the lowest cost. It is observed that interaction exists between effect of sample size and resolution, and this leads to the dependence of estimated REV on resolution, which should be carefully checked for DRA. The critical resolution and sample size are introduced to decouple the interaction for simple applications. In real applications, estimation obtained from DRA is representative and accurate once the scan resolution is chosen higher than critical resolution and sample size larger than critical sample size. The results obtained in this work are based on the assumption of Newtonian fluid and available continuum theory. Complex fluids and multi-phase flow will be considered in future work.

Author Contributions

T.L. performed processing and analysis of data and wrote the paper. X.J. provided materials. M.W. organized the research and provided guidance and critical review of the work.

Acknowledgments

This work is financially supported by the NSF grant of China (No. U1562217), and National Science and Technology Major Project on Oil and Gas (No.2017ZX05013001).

Conflicts of Interest

The authors declare no conflicts of interest.

Appendix A

A two-step image processing procedure is used to reconstruct the rock structure and numerically change the sample size and resolution in this work. As mentioned above, direct influence of results comes from the second step. It is found that coarsening operation to alter the structure resolution is very sensitive to the segmentation algorithm and can severely influence the results.
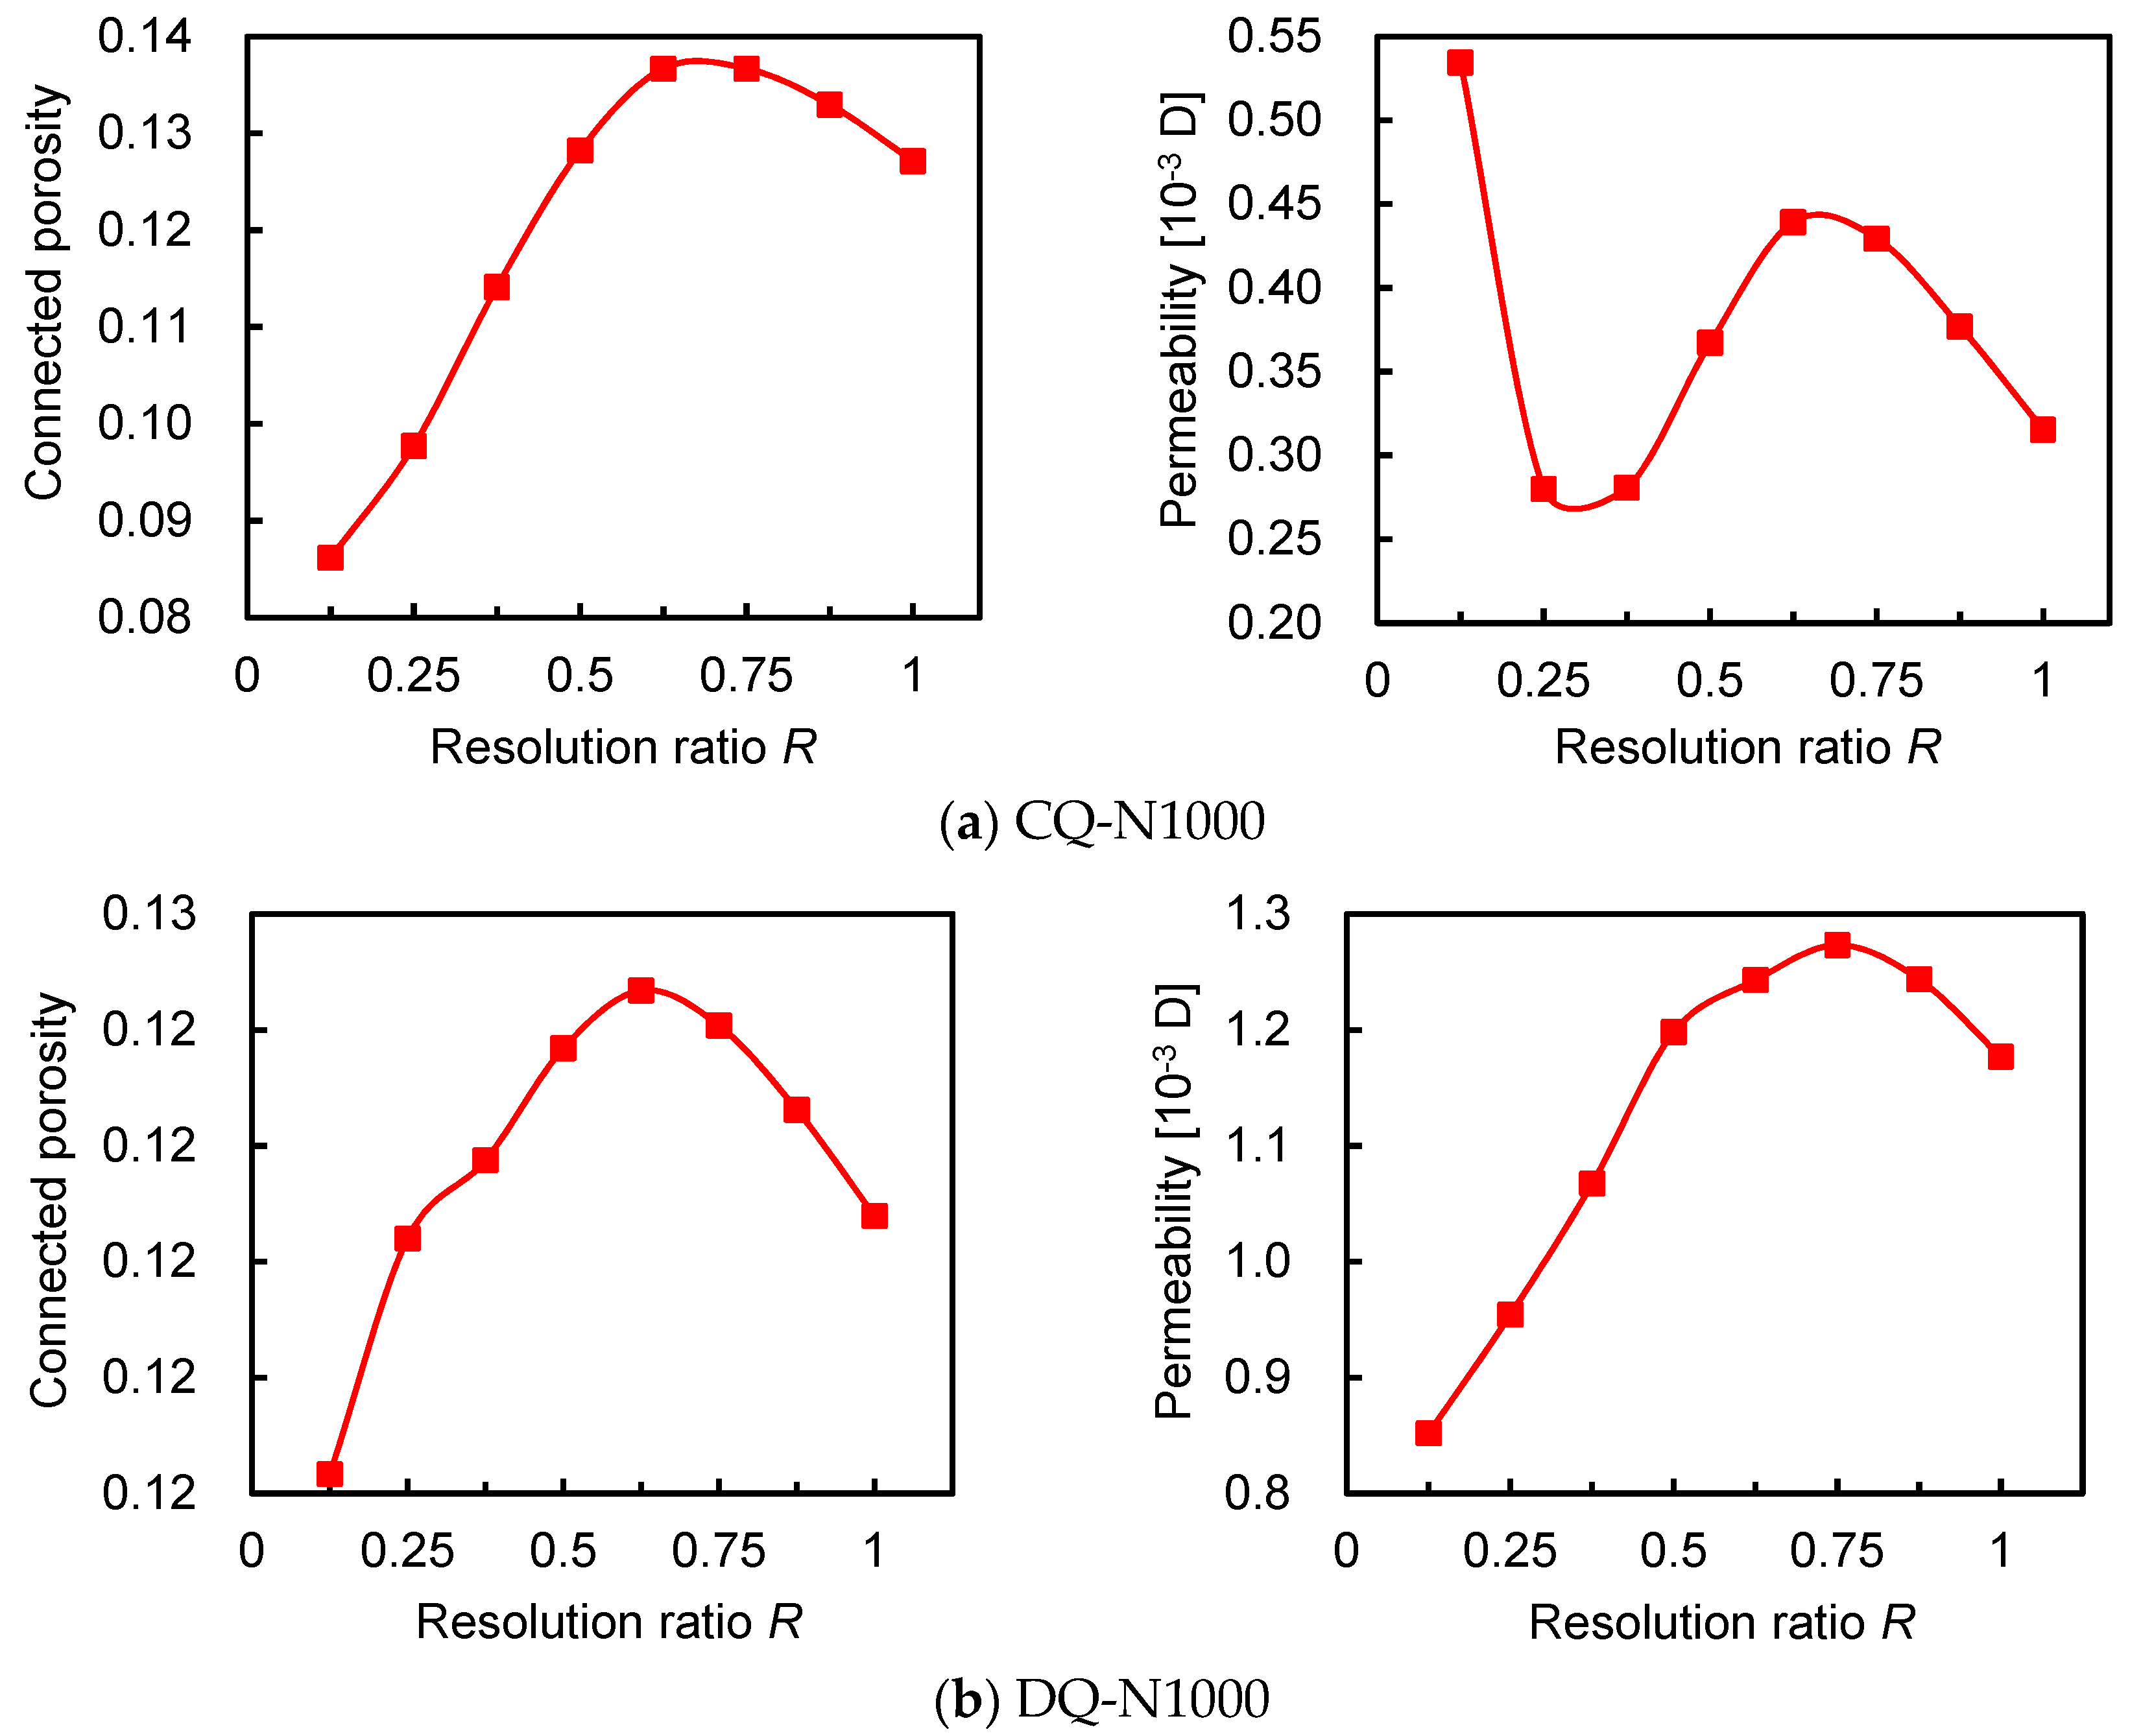
If same segmentation algorithm is chosen in coarsening operation as in first-step reconstruction, results obtained are shown in Figure A1. It can be seen that when R is above 0.625, connected porosity of both samples shows a clear tendency of decrease and this leads to the decrease of permeability. Thus, no stable property is observed as results shown in Figure 8.
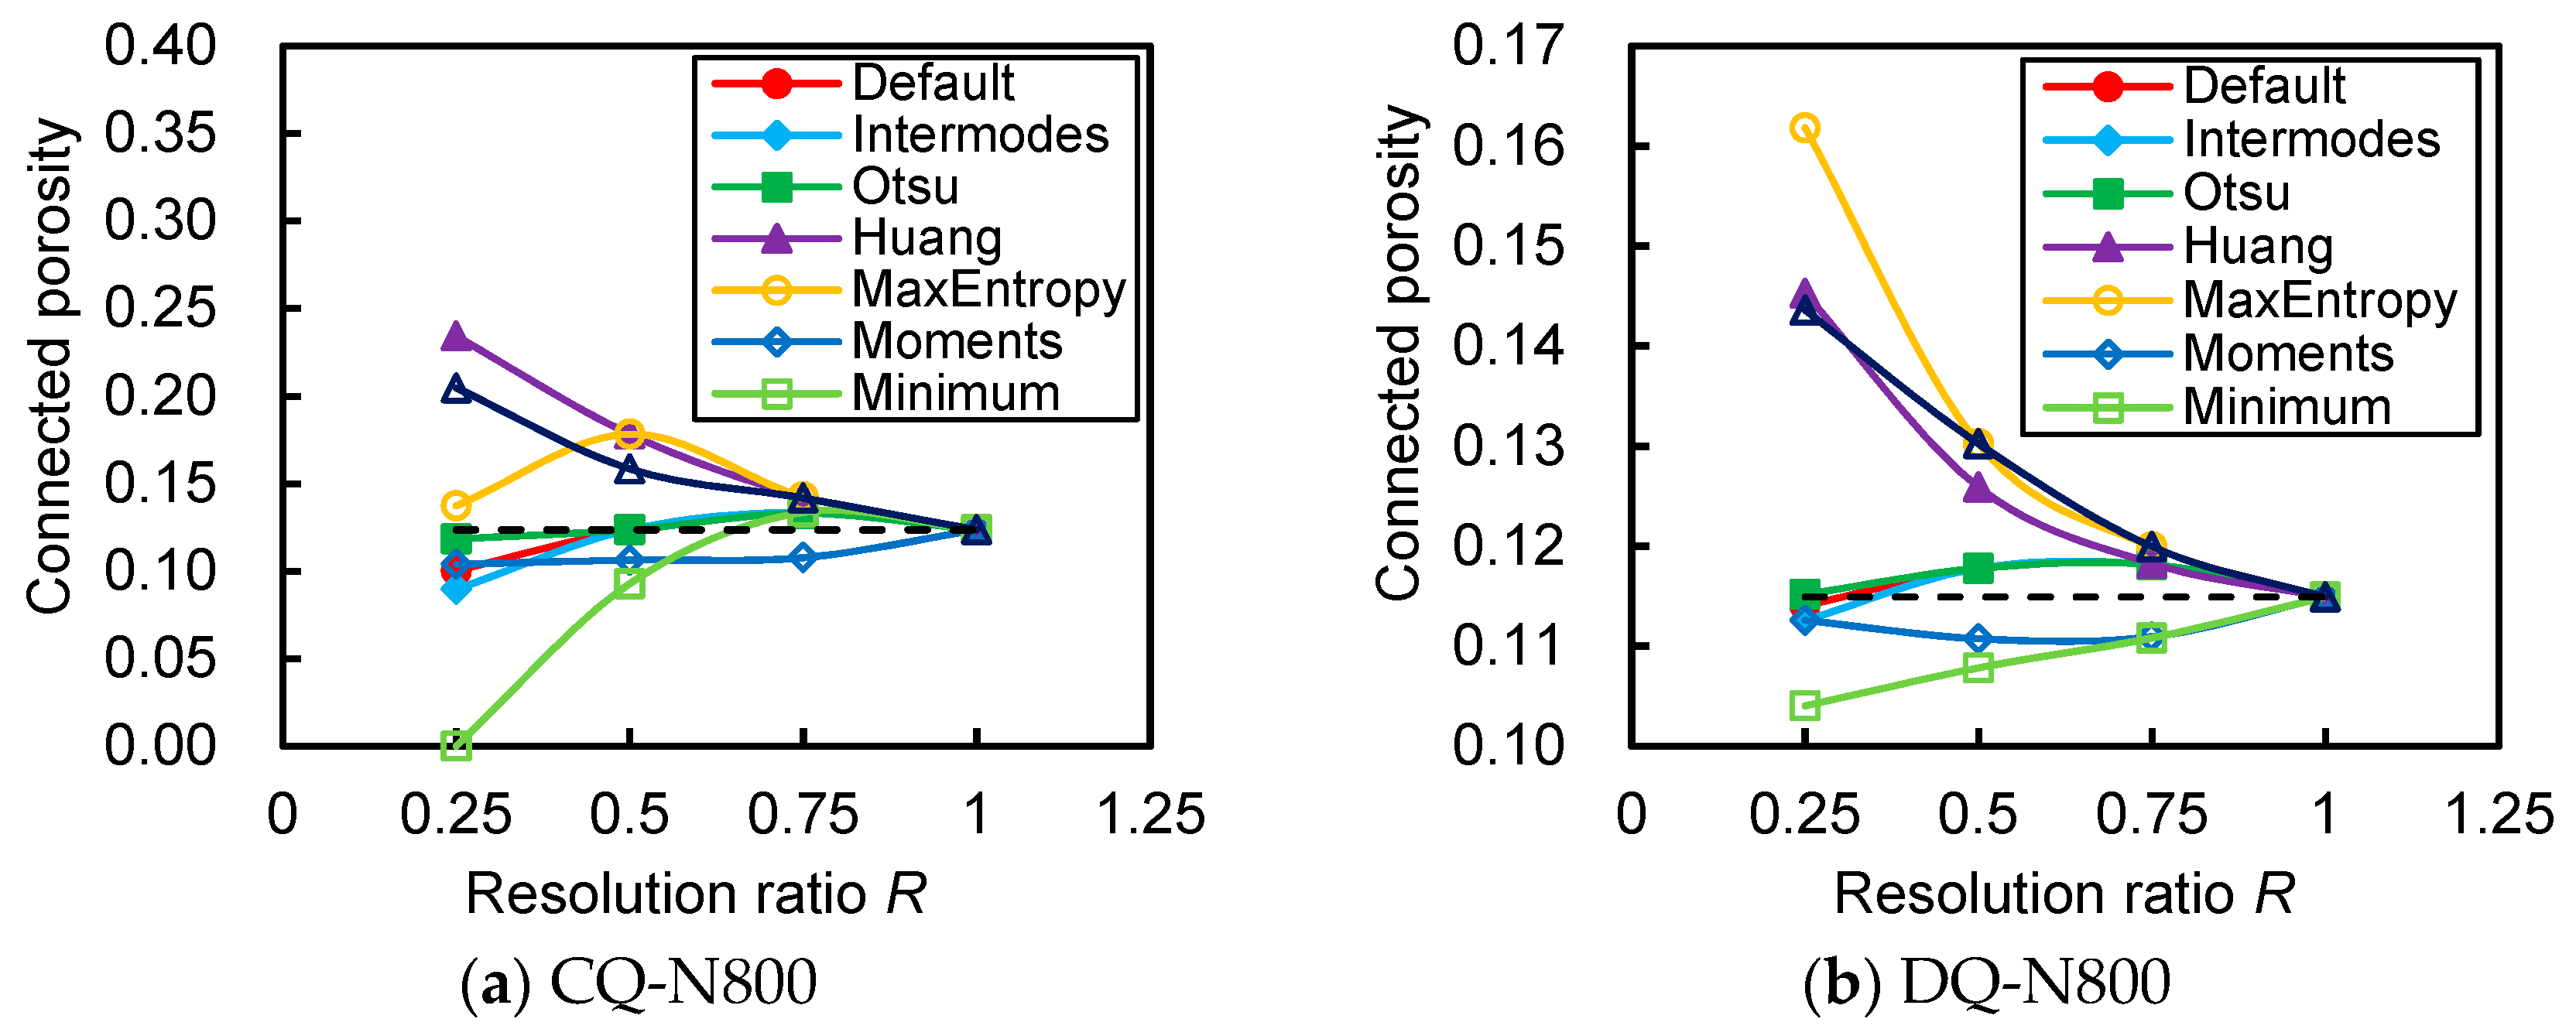
This kind of result is produced because there is tendency to alter porosity when certain segmentation algorithm is used. Several algorithms commonly used in Image J [54] is investigated and the result is shown in Figure A2. In view of physics, the porosity should tend to be constant when the resolution is high. However, it is clear to observe that no algorithm succeeds to maintain a stable porosity, even for Daqing sample of which the structure is well resolved. This tendency of segmentation algorithm will lead to misunderstandings of the resolution effect. One thing to note is that even when structures are resolved physically under several resolutions, the tendency of segmentation algorithm might still exist and thus careful consideration needs to be taken when reconstructing the structures at varying resolutions.
Figure A1. Resolution effect on connected porosity and calculated permeability at N = 1000 sample size with Huang’s algorithm used in coarsening operation.
Energies 11 01798 g0a1
Figure A2. Influence on connected porosity of segmentation algorithm used in coarsening operation.
Energies 11 01798 g0a2

References

  1. Al-Marzouqi, H. Digital rock physics using CT scans to compute rock properties. IEEE Signal Process. Mag. 2018, 35, 121–131. [Google Scholar] [CrossRef]
  2. Rassenfoss, S. Need a faster measure of relative permeability? Take a CT scan and follow with digital rock analysis. J. Pet. Technol. 2017, 69, 28–31. [Google Scholar] [CrossRef]
  3. Jerauld, G.R.; Fredrich, J.; Lane, N.; Sheng, Q.; Crouse, B.; Freed, D.M.; Fager, A.; Xu, R. Validation of a workflow for digitally measuring relative permeability. In Proceedings of the SPE Abu Dhabi International Petroleum Exhibition & Conference, Abu Dhabi, UAE, 13–16 November 2017. [Google Scholar]
  4. Koronfol, S.; Grader, A.; Suhrer, M.; Toelke, J.; Mu, Y.; Dernaika, M.; Pratap, M.; Al Hammadi, M.; Al Ratrout, A.; Kalam, M.Z. Capillary pressure and relative permeability assessment on whole core samples from a giant middle easteren carbonate reservoir utilizing digital rock physics. In Proceedings of the Abu Dhabi International Petroleum Exhibition and Conference, Abu Dhabi, UAE, 10–13 November 2017. [Google Scholar]
  5. Arns, C.H.; Knackstedt, M.A.; Pinczewski, M.V.; Lindquist, W. Accurate estimation of transport properties from microtomographic images. Geophys. Res. Lett. 2001, 28, 3361–3364. [Google Scholar] [CrossRef] [Green Version]
  6. Keehm, Y.; Mukerji, T.; Nur, A. Permeability prediction from thin sections: 3D reconstruction and lattice-boltzmann flow simulation. Geophys. Res. Lett. 2004, 31. [Google Scholar] [CrossRef]
  7. Madadi, M.; Jones, A.C.; Arns, C.H.; Knackstedt, M.A. 3D imaging and simulation of elastic properties of porous materials. Comput. Sci. Eng. 2009, 11, 65–73. [Google Scholar] [CrossRef]
  8. Saenger, E.H.; Enzmann, F.; Keehm, Y.; Steeb, H. Digital rock physics: Effect of fluid viscosity on effective elastic properties. J. Appl. Geophy. 2011, 74, 236–241. [Google Scholar] [CrossRef]
  9. Grader, A.; Kalam, M.; Toelke, J.; Mu, Y.; Derzhi, N.; Baldwin, C.; Stenger, B. A comparative study of digital rock physics and laboratory scal evaluations of carbonate cores. In Proceedings of the International Symposium of the Society-of-Core-Analysts, Halifax, Novia Scotia, Canada, 4–7 October 2010. [Google Scholar]
  10. Kalam, M.Z. Digital rock physics for fast and accurate special core analysis in carbonates. In New Technologies in the Oil and Gas Industry; InTech: London, UK, 2012. [Google Scholar]
  11. Miller, K.; Vanorio, T.; Keehm, Y. Evolution of permeability and microstructure of tight carbonates due to numerical simulation of calcite dissolution. J. Geophys. Res. 2017, 122, 4460–4474. [Google Scholar] [CrossRef]
  12. Lopez, O.; Mock, A.; Øren, P.E.; Long, H.; Kalam, Z.; Vahrenkamp, V.; Gibrata, M.; Seraj, S.; Chacko, S.; Al Hammadi, M. Validation of fundamental carbonate reservoir core properties using digital rock physics. In Proceedings of the International Symposium of the Society of Core Analysts, Aberdeen, Scotland, UK, 27–30 August 2012. [Google Scholar]
  13. Andrä, H.; Combaret, N.; Dvorkin, J.; Glatt, E.; Han, J.; Kabel, M.; Keehm, Y.; Krzikalla, F.; Lee, M.; Madonna, C. Digital rock physics benchmarks—part ii: Computing effective properties. Comput. Geosci. 2013, 50, 33–43. [Google Scholar] [CrossRef]
  14. Nunes, J.P.P.; Blunt, M.J.; Bijeljic, B. Pore-scale simulation of carbonate dissolution in micro-CT images. J. Geophys. Res. 2016, 121, 558–576. [Google Scholar] [CrossRef] [Green Version]
  15. Almarzooq, A.; AlGhamdi, T.; Koronfol, S.; Dernaika, M.; Walls, J. Shale gas characterization and property determination by digital rock physics. In Proceedings of the SPE Saudi Arabia Section Technical Symposium and Exhibition, Al-Khobar, Saudi Arabia, 21–24 April 2014. [Google Scholar]
  16. Sun, H.; Yao, J.; Cao, Y.C.; Fan, D.Y.; Zhang, L. Characterization of gas transport behaviors in shale gas and tight gas reservoirs by digital rock analysis. Int. J. Heat Mass Transf. 2017, 104, 227–239. [Google Scholar] [CrossRef]
  17. Wang, Z.Y.; Jin, X.; Wang, X.Q.; Sun, L.; Wang, M.R. Pore-scale geometry effects on gas permeability in shale. J. Nat. Gas Sci. Eng. 2016, 34, 948–957. [Google Scholar] [CrossRef] [Green Version]
  18. Sakellariou, A.; Arns, C.H.; Sheppard, A.P.; Sok, R.M.; Averdunk, H.; Limaye, A.; Jones, A.C.; Senden, T.J.; Knackstedt, M.A. Developing a virtual materials laboratory. Mater. Today 2007, 10, 44–51. [Google Scholar] [CrossRef]
  19. Dvorkin, J.; Armbruster, M.; Baldwin, C.; Fang, Q.; Derzhi, N.; Gomez, C.; Nur, B.; Nur, A. The future of rock physics: Computational methods vs. Lab testing. First Break 2008, 26, 63–68. [Google Scholar]
  20. Bultreys, T.; De Boever, W.; Cnudde, V. Imaging and image-based fluid transport modeling at the pore scale in geological materials: A practical introduction to the current state-of-the-art. Earth Sci. Rev. 2016, 155, 93–128. [Google Scholar] [CrossRef]
  21. Zhang, H.; Yuan, P.; Wu, J.; Mezzatesta, A.; Jin, G.; Satti, R.; Koliha, N.; Bautista, J.; Crouse, B.; Freed, D. Using digital rock modeling to estimate permeability and capillary pressure from NMR and geochemical logs. In Proceedings of the SPE Middle East Oil & Gas Show and Conference, Manama, Bahrain, 6–9 March 2017. [Google Scholar]
  22. Houben, M.E.; Desbois, G.; Urai, J.L. A comparative study of representative 2D microstructures in shaly and sandy facies of opalinus clay (mont terri, switzerland) inferred form BIB-SEM and MIP methods. Mar. Pet. Geol. 2014, 49, 143–161. [Google Scholar] [CrossRef]
  23. Vlahinić, I.; Andò, E.; Viggiani, G.; Andrade, J.E. Towards a more accurate characterization of granular media: Extracting quantitative descriptors from tomographic images. Granul. Matter 2014, 16, 9–21. [Google Scholar] [CrossRef]
  24. Kelly, S.; El-Sobky, H.; Torres-Verdín, C.; Balhoff, M.T. Assessing the utility of fib-sem images for shale digital rock physics. Adv. Water Resour. 2016, 95, 302–316. [Google Scholar] [CrossRef]
  25. Li, G.G.; Diaz, E.; Nur, A.M. Rock physical properties computed from digital core and cuttings with applications to deep gas exploration and development. In Proceedings of the SPE Deep Gas Conference and Exhibition, Manama, Bahrain, 24–26 January 2010. [Google Scholar]
  26. Gualda, G.A.; Rivers, M. Quantitative 3D petrography using x-ray tomography: Application to bishop tuff pumice clasts. J. Volcanol. Geotherm. Res. 2006, 154, 48–62. [Google Scholar] [CrossRef]
  27. Caubit, C.; Hamon, G.; Sheppard, A.; Øren, P. Evaluation of the reliability of prediction of petrophysical data through imagery and pore network modelling. Petrophysics 2009, 50, 322–334. [Google Scholar]
  28. Cnudde, V.; Boone, M.; Dewanckele, J.; Dierick, M.; Van Hoorebeke, L.; Jacobs, P. 3D characterization of sandstone by means of x-ray computed tomography. Geosphere 2011, 7, 54–61. [Google Scholar] [CrossRef]
  29. Khalili, A.D.; Arns, C.H.; Arns, J.-Y.; Hussain, F.; Cinar, Y.; Pinczewski, W.V.; Latham, S.; Funk, J. Permeability upscaling for carbonates from the pore-scale using multi-scale Xray-CT images. In Proceedings of the SPE/EAGE European Unconventional Resources Conference & Exhibition-From Potential to Production, Vienna, Austria, 20–22 March 2012. [Google Scholar]
  30. Smith, M.M.; Sholokhova, Y.; Hao, Y.; Carroll, S.A. Co 2-induced dissolution of low permeability carbonates. Part i: Characterization and experiments. Adv. Water Resour. 2013, 62, 370–387. [Google Scholar] [CrossRef]
  31. Nordahl, K.; Ringrose, P.S. Identifying the representative elementary volume for permeability in heterolithic deposits using numerical rock models. Math. Geosci. 2008, 40, 753–771. [Google Scholar] [CrossRef]
  32. Borujeni, A.T.; Lane, N.; Thompson, K.; Tyagi, M. Effects of image resolution and numerical resolution on computed permeability of consolidated packing using LB and FEM pore-scale simulations. Comput. Fluids 2013, 88, 753–763. [Google Scholar] [CrossRef]
  33. Mostaghimi, P.; Blunt, M.J.; Bijeljic, B. Computations of absolute permeability on micro-CT images. Math. Geosci. 2013, 45, 103–125. [Google Scholar] [CrossRef]
  34. Alyafei, N.; Raeini, A.Q.; Paluszny, A.; Blunt, M.J. A sensitivity study of the effect of image resolution on predicted petrophysical properties. Transp. Porous Media 2015, 110, 157–169. [Google Scholar] [CrossRef]
  35. Shah, S.; Gray, F.; Crawshaw, J.; Boek, E. Micro-computed tomography pore-scale study of flow in porous media: Effect of voxel resolution. Adv. Water Resour. 2016, 95, 276–287. [Google Scholar] [CrossRef] [Green Version]
  36. Cui, D.; Sun, W.; Wang, Q.N.; Gu, C.P. Use of tomography to estimate the representative elementary volume in mortars stained with potassium iodide. Mater. Des. 2018, 147, 80–91. [Google Scholar] [CrossRef]
  37. Ledesma-Alonso, R.; Barbosa, R.; Ortegon, J. Effect of the image resolution on the statistical descriptors of heterogeneous media. Phys. Rev. E 2018, 97, 023304. [Google Scholar] [CrossRef] [PubMed] [Green Version]
  38. Bear, J. Dynamics of Fluids in Porous Media; Dover Publications: New York, NY, USA, 1972. [Google Scholar]
  39. Kameda, A.; Dvorkin, J.; Keehm, Y.; Nur, A.; Bosl, W. Permeability-porosity transforms from small sandstone fragments. Geophysics 2006, 71, N11–N19. [Google Scholar] [CrossRef]
  40. Okabe, H.; Oseto, K. Pore-scale heterogeneity assessed by the lattice-boltzmann method. In Proceedings of the International Symposium of the Society of Core Analysts, Trondheim, Norway, 12–16 September 2006. [Google Scholar]
  41. Al-Raoush, R.; Papadopoulos, A. Representative elementary volume analysis of porous media using X-ray computed tomography. Powder Technol. 2010, 200, 69–77. [Google Scholar] [CrossRef]
  42. Mu, Y.; Sungkorn, R.; Toelke, J. Identifying the representative flow unit for capillary dominated two-phase flow in porous media using morphology-based pore-scale modeling. Adv. Water Resour. 2016, 95, 16–28. [Google Scholar] [CrossRef]
  43. Madonna, C.; Almqvist, B.S.; Saenger, E.H. Digital rock physics: Numerical prediction of pressure-dependent ultrasonic velocities using micro-ct imaging. Geophys. J. Int. 2012, 189, 1475–1482. [Google Scholar] [CrossRef]
  44. Beckingham, L.E.; Peters, C.A.; Um, W.; Jones, K.W.; Lindquist, W.B. 2D and 3D imaging resolution trade-offs in quantifying pore throats for prediction of permeability. Adv. Water Resour. 2013, 62, 1–12. [Google Scholar] [CrossRef]
  45. Sheppard, A.P.; Sok, R.M.; Averdunk, H. Techniques for image enhancement and segmentation of tomographic images of porous materials. Physica A 2004, 339, 145–151. [Google Scholar] [CrossRef]
  46. Schlüter, S.; Sheppard, A.; Brown, K.; Wildenschild, D. Image processing of multiphase images obtained via x-ray microtomography: A review. Water Resour. Res. 2014, 50, 3615–3639. [Google Scholar] [CrossRef]
  47. Huang, L.-K.; Wang, M.-J.J. Image thresholding by minimizing the measures of fuzziness. Pattern Recognit. 1995, 28, 41–51. [Google Scholar] [CrossRef]
  48. Sezgin, M.; Sankur, B. Survey over image thresholding techniques and quantitative performance evaluation. J. Electron. Imaging 2004, 13, 146–168. [Google Scholar] [CrossRef]
  49. Jasak, H.; Jemcov, A.; Tukovic, Z. OpenFOAM: A C++ library for complex physics simulations. In Proceedings of the International Workshop on Coupled Methods in Numerical Dynamics, Dubrovnik, Croatia, 19–21 September 2007. [Google Scholar]
  50. Sangani, A.S.; Acrivos, A. Slow flow through a periodic array of spheres. Int. J. Multiph. Flow 1982, 8, 343–360. [Google Scholar] [CrossRef]
  51. Larson, R.E.; Higdon, J.J.L. A periodic grain consolidation model of porous media. Phys. Fluids A 1989, 1, 38–46. [Google Scholar] [CrossRef]
  52. Holmes, D.W.; Williams, J.R.; Tilke, P. Smooth particle hydrodynamics simulations of low Reynolds number flows through porous media. Int. J. Numer. Anal. Methods Geomech. 2011, 35, 419–437. [Google Scholar] [CrossRef]
  53. Pletcher, R.H.; Tannehill, J.C.; Anderson, D. Computational Fluid Mechanics and Heat Transfer, 3rd ed.; Taylor & Francis: Abingdon-on-Thames, UK, 2012. [Google Scholar]
  54. Abràmoff, M.D.; Magalhães, P.J.; Ram, S.J. Image processing with ImageJ. Biophotonics Int. 2004, 11, 36–42. [Google Scholar]
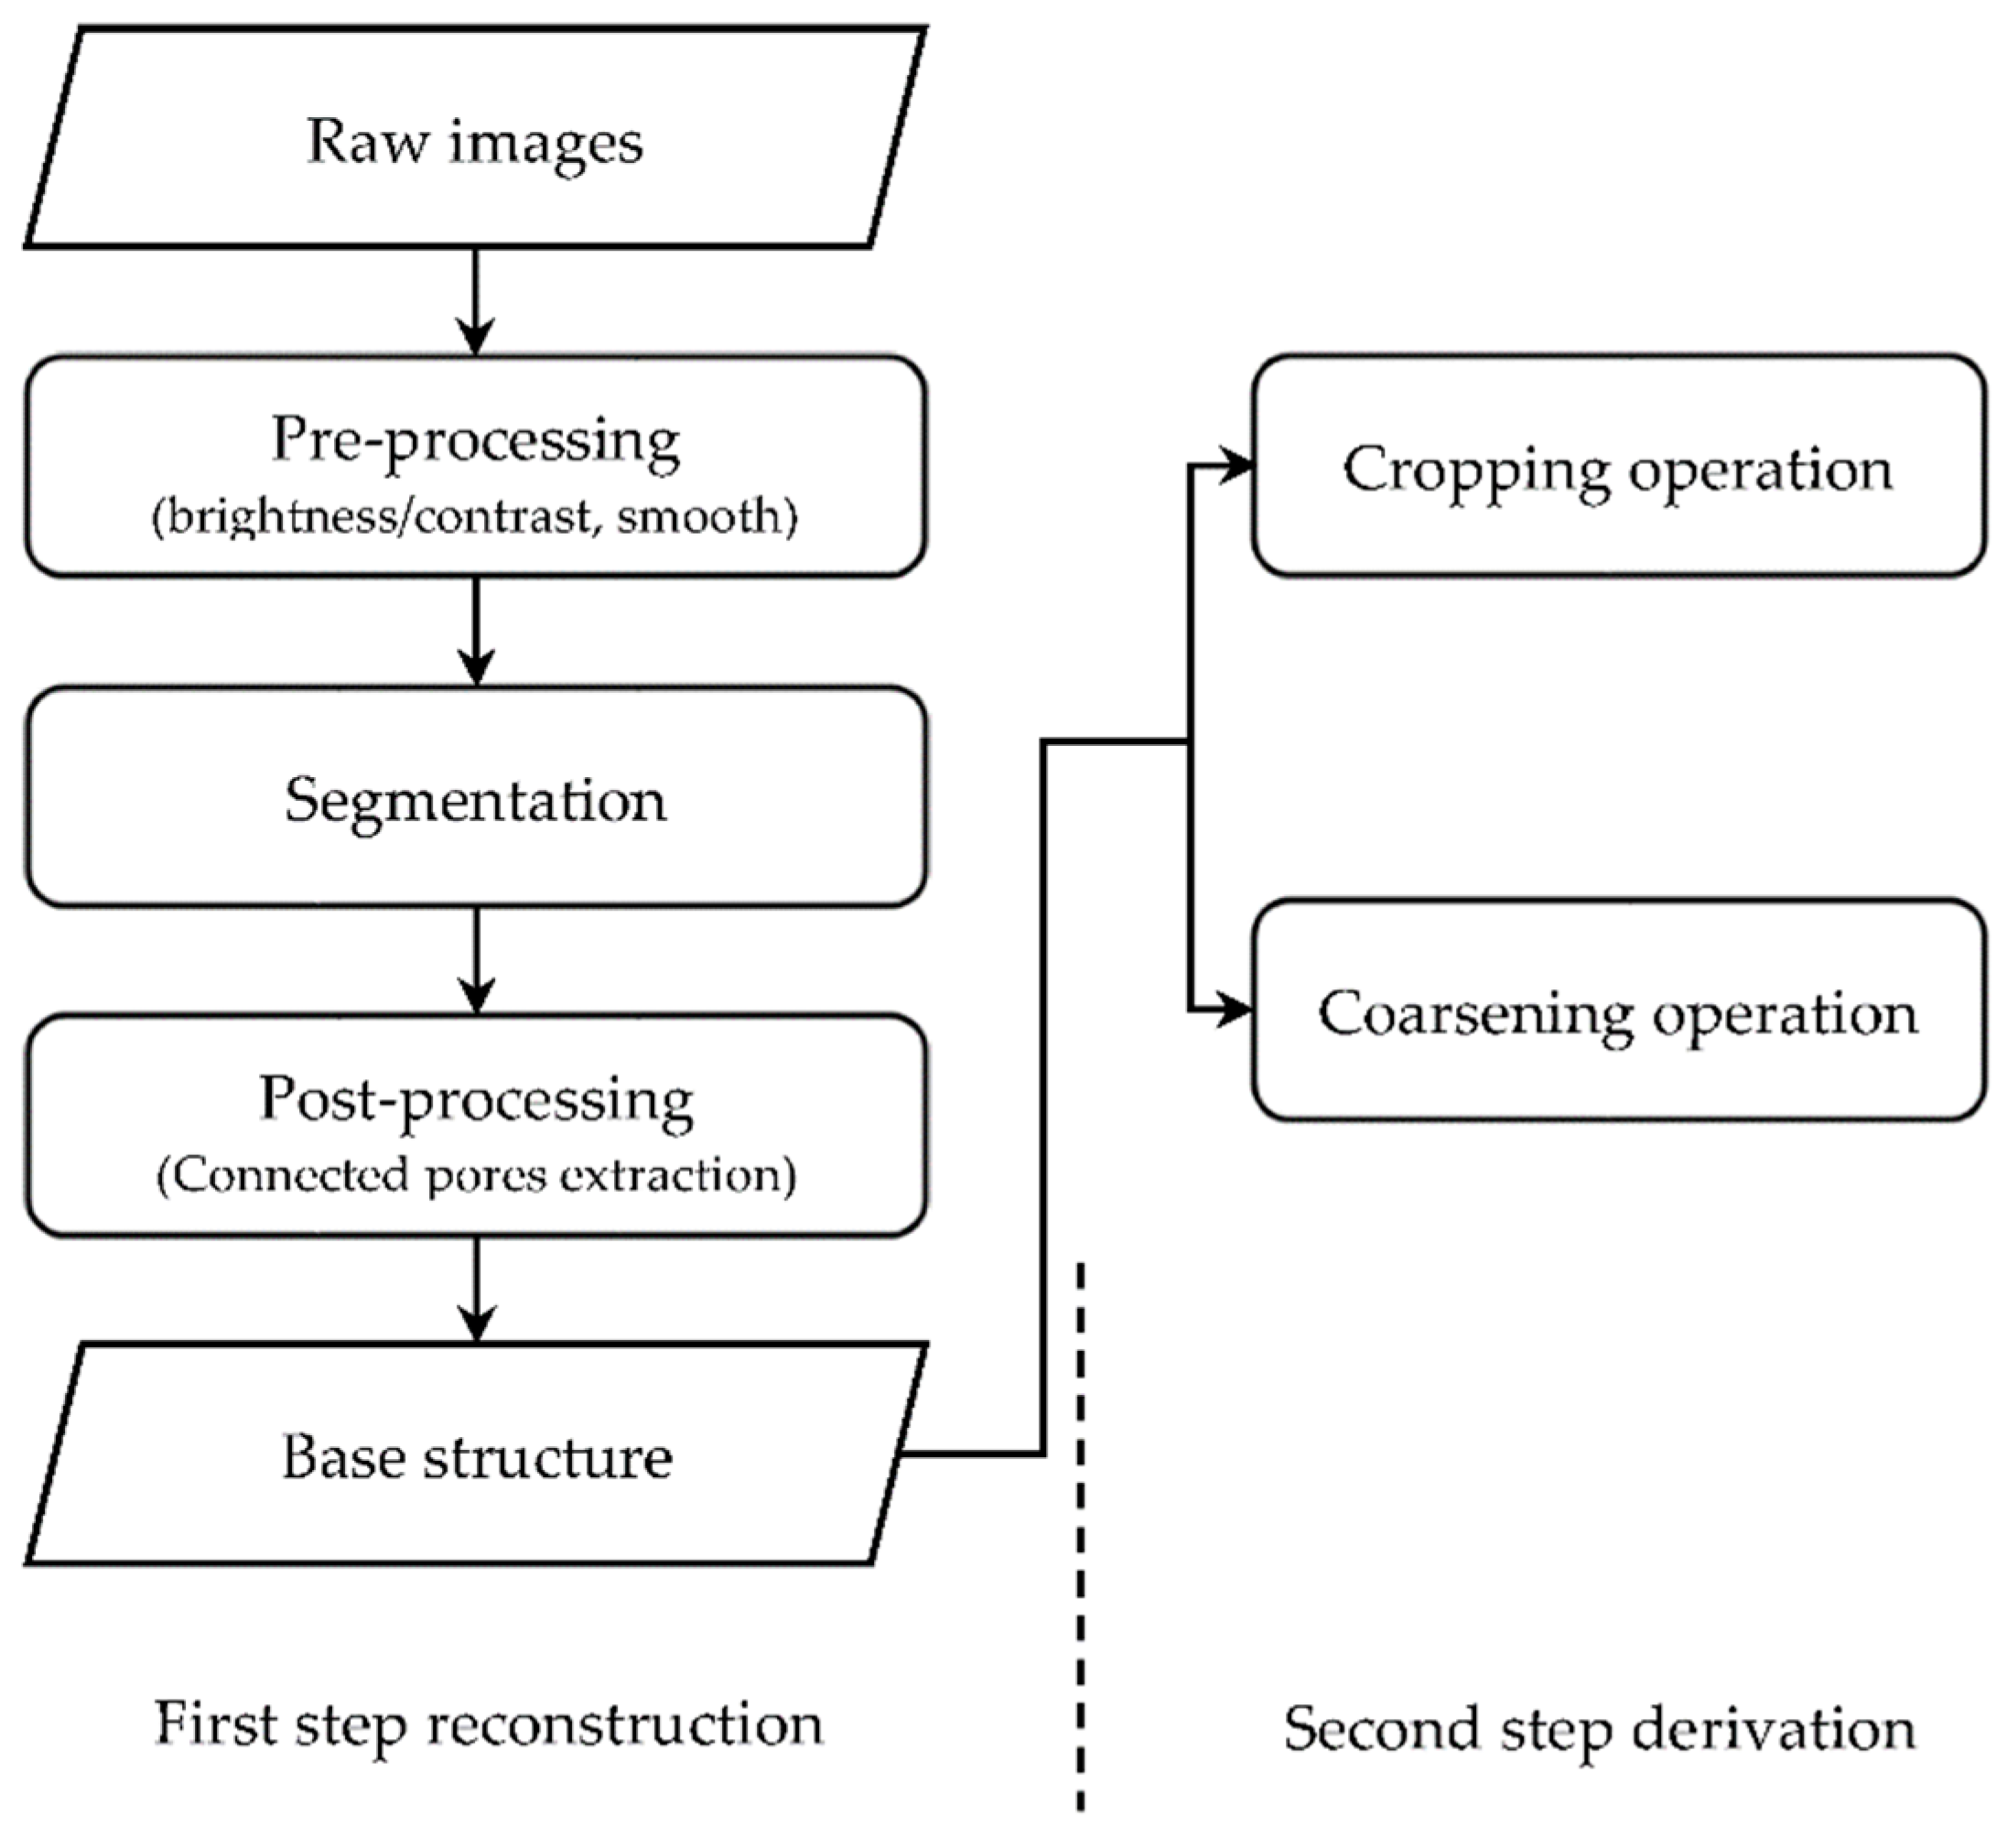
Figure 1. Procedure of two-step image processing.
Energies 11 01798 g001
Figure 2. 2D slice of reconstructed base structure (black part are pores, same in following figures).
Energies 11 01798 g002
Figure 3. 2D schematic plot of cropping operation.
Energies 11 01798 g003
Figure 4. 2D slice of Changqing sample after coarsening operation.
Energies 11 01798 g004
Figure 5. Computation domain of reconstructed structure. (a) Whole domain including gray solid part and color pore part is presented; (b) Only pore part structure is presented. The color reflects the pressure distribution.
Energies 11 01798 g005
Figure 6. Linear dependence of calculated permeability on mesh size for CQ-N100-R1.
Energies 11 01798 g006
Figure 7. Validation result for BCC unit. (a) Linear dependence of calculated permeability on mesh size for BCC-N20; (b) Convergence to analytical value of extrapolated permeability with increasing resolution.
Energies 11 01798 g007
Figure 8. Resolution effect on calculated permeability at N = 1000 sample size. Red long-dashed line is the estimated mean permeability and two black short-dashed lines cover 10% variation from the mean permeability.
Energies 11 01798 g008
Figure 9. Influence of sample size on resolution effect. (a) Resolution effect on calculated permeability at varying sample sizes; (b) Influence of sample size on COR. Solid line is schematic plot and dashed line is asymptotic line of solid line.
Energies 11 01798 g009
Figure 10. Sample size effect on calculated permeability at R = 1.0 resolution.
Energies 11 01798 g010
Figure 11. Influence of resolution on sample size effect. (a) Sample size effect on calculated permeability at varying resolutions; (b) Influence of resolution on DREV. Solid line is schematic plot and dashed line is asymptotic line of solid line.
Energies 11 01798 g011
Figure 12. Joint effect of resolution and sample size. Blue squares represents COR at varying sample sizes and green dots represents DREV at varying resolutions.
Energies 11 01798 g012
Table 1. Size and resolution of raw images.
Image ParameterChangqingDaqing
Pixel   size   Δ 0 0.28   μ m 2.8   μ m
Resolution   r 0 3.57   pixel / μ m 0.357   pixel / μ m
Image size N 1000 1000