1. Introduction
The use of raw coal is popular in harsh cold zones throughout the world, especially in cold cities with a large number of detached houses. Thus, such cities face air pollution problems. One of these cities is Ulaanbaatar (Mongolia), which is reported to be one of the top fivecities with the worst air quality, and one of the coldest capital cities in the world [
1].
Several cities have managed to solve this problem by directly eliminating the use of raw coal by replacing coal-stoves with zero-emission equipment via legal process or decreasing the use of raw coal in stages with the assistance of incentive programs and tax-free systems for the application of eco-friendly technologies. In Ulaanbaatar, the electric heater is considered the most economically and technically feasible solution that can be implemented. However, this solution has the following disadvantages: 1. electric heaters added to thousands of houses will increase the peak power transfer load by a significant amount during the cold period, which is currently one of the biggest problems in Mongolia [
2]; 2. the annual current expenses associated with the use of electric heaters are relatively high for people who live in a detached house compared with those associated with the use of a coal-stove; and 3. power plants in Mongolia use coal to produce electricity, which implies that the application of electric heaters will not contribute to decreasing CO
2 emissions, even if it decreases the air pollution in the city.
The authors of the current study present the thermal output and performance results for an evacuated tube solar thermal system combined with a coalstove and an electric heater (immersed in a tank), which is called a“triple system”. A comparison of the CO
2 emissions of this triple system with those of a coal-stove and an electric heater alone, based on their emission factors, showed that the triple system can decrease CO
2 emissions by 32% and 18% when using acoal-stove and electric heater, respectively [
3]. This study was carried out in Ulaanbaatar between 2015 and 2016. The following advantages of the triple system can be emphasized: 1. this system can steadily supply heat for detached houses, regardless of the lack of electric power since the stove recovers from the instability of the solar thermal system and sudden interruptions of electricity, which turn the electric heater off; 2. the annual current expenses of the proposed system are lower than those of electric heaters; and 3. it is more effective at decreasing CO
2 emissions (as mentioned above), and can also decrease the city’s air pollution.
However, ensuring the city-wide availability of this system is difficult because the heat production by the solar collector system is affected by dust deposition on the transparent surfaces of the solar collectors. Dust deposition is caused by air pollution generated by the overuse of raw coal. In addition, the reflected irradiance caused by the back side of the system and by roofs, with or without snow cover, can disrupt predictions when using evacuated tube solar collectors.
The TraNsient SYStems (TRNSYS) software platform [
4] has been used to model and analyze the performance of solar thermal applications under different operating conditions and scenarios. TRNSYS was developed by the University of Wisconsin and represents one of the most popular advanced dynamic building energy simulation programs, and it is composed of a number of component modules (called “Types” in TRNSYS terminology) that can be selected from the TRNSYS libraries and enhanced by experimental results, manufacturer performance data, or information available in the current scientific literature. TRNSYS has been widely used for the simulation of solar thermal systems, and several studies have reported that TRNSYS was successfully used to simulate domestic or small-case solar applications [
5,
6,
7,
8,
9,
10,
11].
In the current study, the potential of solar energy utilization under the climatic conditions in Ulaanbaatar (Mongolia) is investigated by performing the following tasks: long-term measurements to determine the operational performance of the evacuated tube solar thermal system; long-term dust deposition tests to measure the transmittance of the glass tubes exposed for various periods and to identify the dust deposition behavior on the glass tubes; long-term measurements to model the reflected irradiance from the roof of a house whether covered with snow or not; development of a dust deposition model based on the experimental results of dust deposition tests and environmental data (such as PM10 wind, rain, and snow); and assessment of the TRNSYS model for predicting the performance of solar thermal collectors.
The objectives of this paper can be summarized as follows: Developing a TRNSYS model to predict the performance of a solar thermal system in Ulaanbaatar; estimating the degrading effect of dust deposition on the solar thermal recovery; and analyzing an appropriate strategy for cleaning the solar collectors and evaluating the effects so that the potential of solar thermal utilization can be assessed. The authors of the current work expect that the results from this study can be used as a reference in several cities throughout Mongolia, and cities in the cold regions of Central and East Asia, and East Europe, which have the same problem with the use of the coal and air-pollution from combustion [
12,
13].
2. System and Control Description
A typical detached house with an area of 50 m
2 that is situated in the Chingiltei Ger District of Ulaanbaatar (106°54′ E and 47°57′ N) was fitted with the above-mentioned triple system for heating and was equipped with measurement devices and sensors. The solar thermal system has four evacuated tube solar collectors with an aperture area of 11.2 m
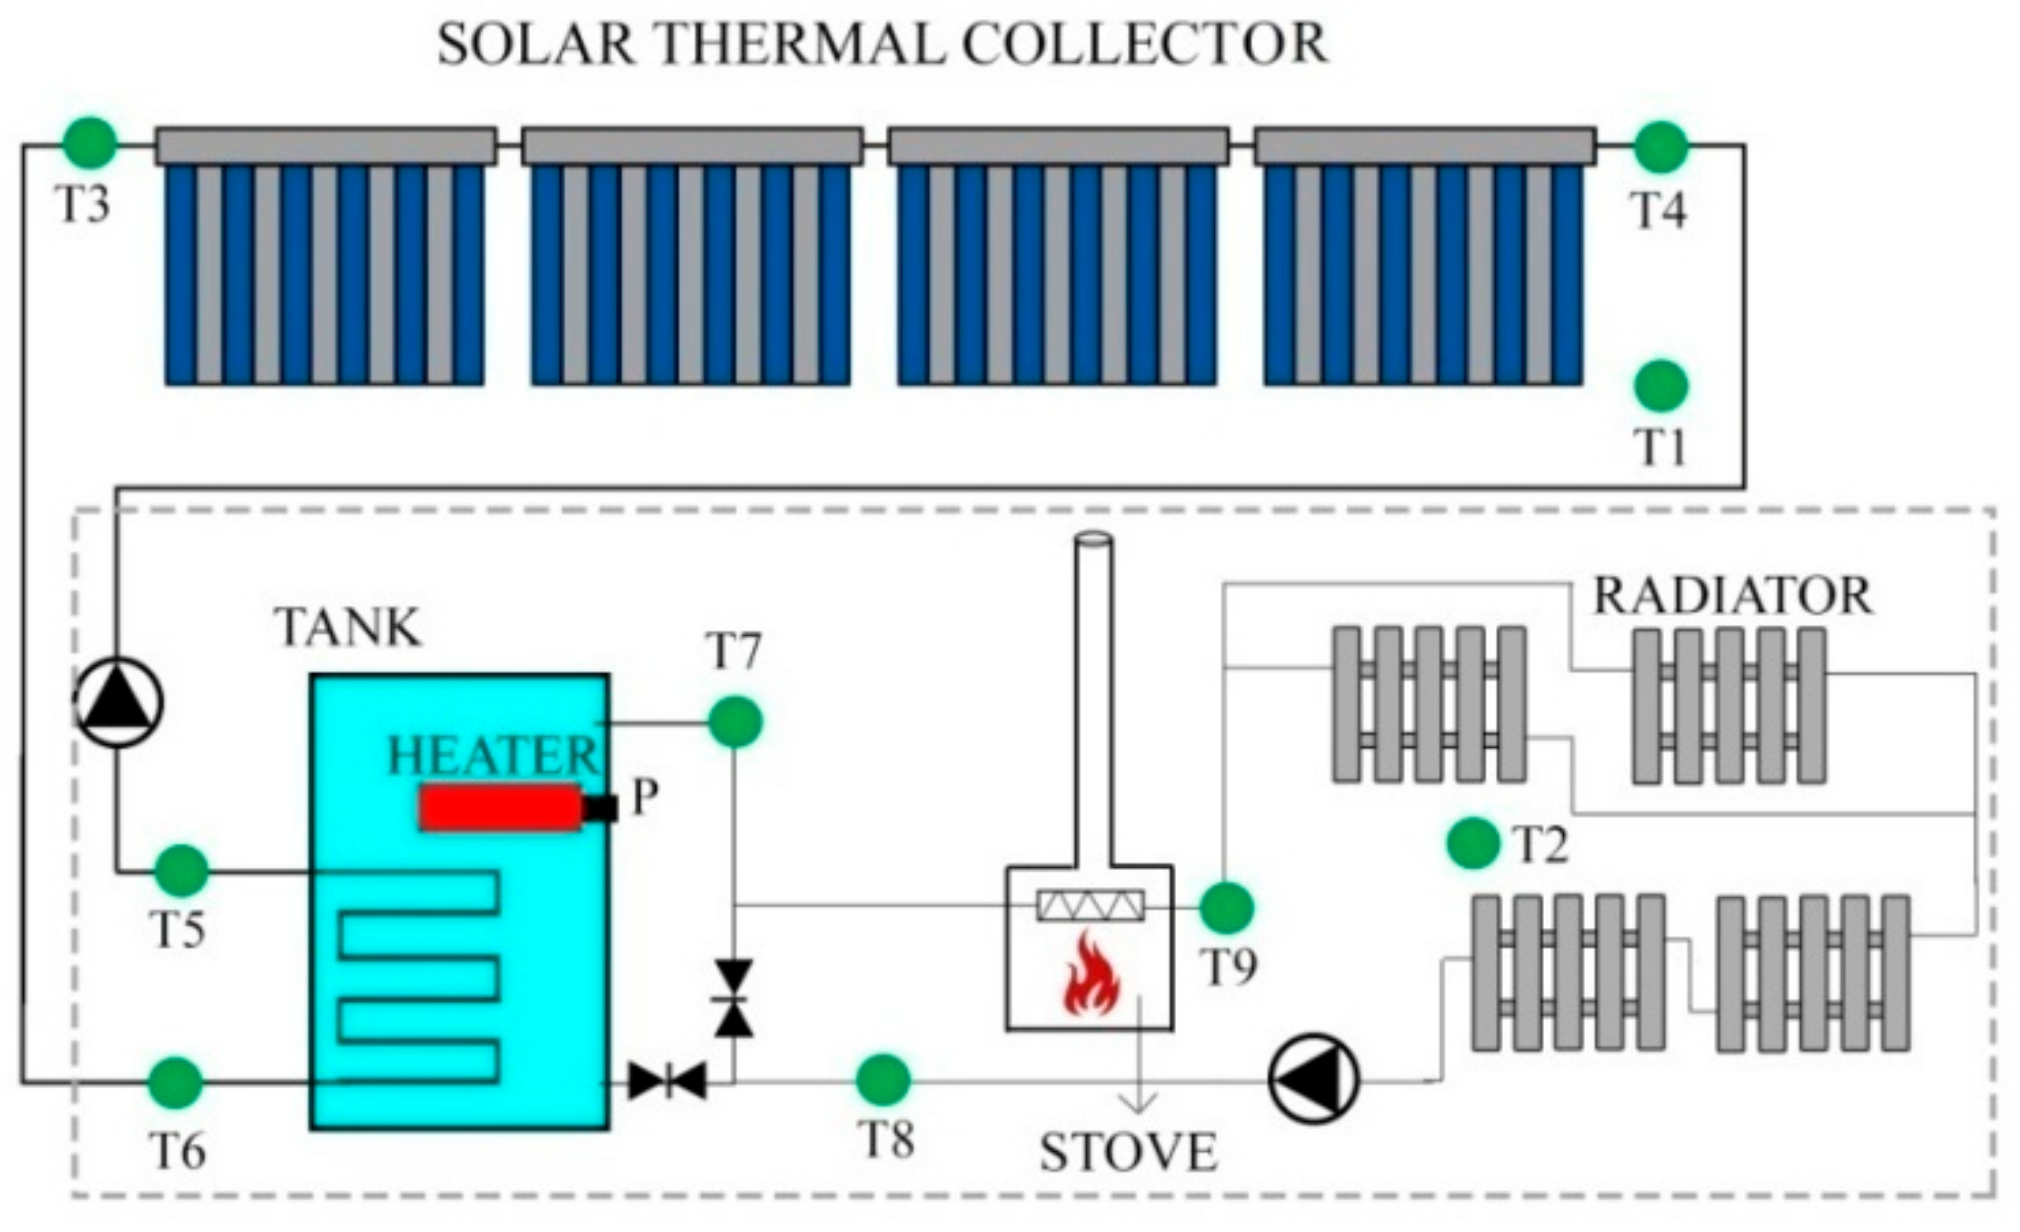
2 and a conversion factor of 0.73 (according to a catalogue), as well as a 500-L heated storage tank, which includes a 3kW electric heater. The solar collectors are inclined at an angle of 60°, and their surface azimuth is directed at 10° to the west. The coal-stove has a rated capacity of 6 kW. The triple system supplies heat to the four radiators installed inside the house.
Figure 1 shows the entire heating system serving the detached house.
A controller of the triple system governs a solar circuit pump, a radiator circuit pump, and the electric heater in the tank based on the operating conditions. The solar circuit pump is directed by a temperature difference function: When the temperature difference between the fluids flowing through the supply and return pipes reaches the switch-on temperature difference, the solar circuit pump is triggered; and when the temperature difference reaches the switch-off temperature difference while pumping the fluid, the pump is automatically stopped. The radiator circuit pump is also directed by another temperature difference function to address the internal temperature. The electric heater in the tank is directed by both time and temperature difference functions: when the temperature of the tank reaches a maximum value, if the time function is still active, then the electric heater is stopped; and when the temperature of the tank reaches the minimum value, the electric heater is triggered regardless of any adjustment of the time function. The stove is operated manually, usually in the morning (approximately 7:00–9:00 a.m.) and in the evening (approximately 6:00–9:00 p.m.) during cold periods.
3. Modeling
TRNSYS software (version 17, Madison, WI, USA) was used to model the house along with the heating system. It is a program for transient system simulations and has been used extensively to simulate solar energy applications. TRNSYS has the advantage that any component from an extensive library of components can be easily used, thereby changing the parameters embedded in the models. In this paper, modeling of the solar thermal collectors of the “triple system” heating system was considered in detail for the purpose of assessing the potential of solar thermal utilization and analyzing the appropriate cleaning strategy. In addition, there is no consideration of operational strategy of the electric heater and coal-stove, because the effect of the operational strategy on the efficiency of collectors is supposed to be less as the electric heater was employed to keep houses inside temperatures between 19 °C and 24 °C with the assistance of the controller of the triple system, and the stove usually operated to increase temperature inside the house during the extra heat loss of the house in the morning and the peak power transfer load in the evening between October 2015 and May 2016.
3.1. Modeling the Solar Thermal System
An evacuated tube solar collector (Type.71), weather data processor (Type.15), output data reader (Type.25), and input data reader (Type.9a) were chosen as main components needed to simulate the solar thermal collectors, and their parameters were defined. Between October 2015 and May 2016, the main parameters measured, such as ambient temperature, global solar irradiance at the angle of 60°, mass flow rate, and collector inlet temperature, were provided to input data readers (Type.9a).
On the other hand, solar thermal output was affected by the reflected irradiance from the back side of the collectors and dust deposition on the glass tubes of the collectors. Thus, their effects were modeled using actual measurement of reflected irradiance and long-term dust deposition tests.
3.2. Model of Reflected Irradiance
The reflected irradiance from the back side of the evacuated tube collectors can significantly affect the efficiency and performance of the evacuated tube solar collectors since the roof of a house is whitish and covered with snow in winter. As the measurement of the back side irradiance was not conducted between 2015 and 2016, the reflected irradiance was modeled using empirical study.
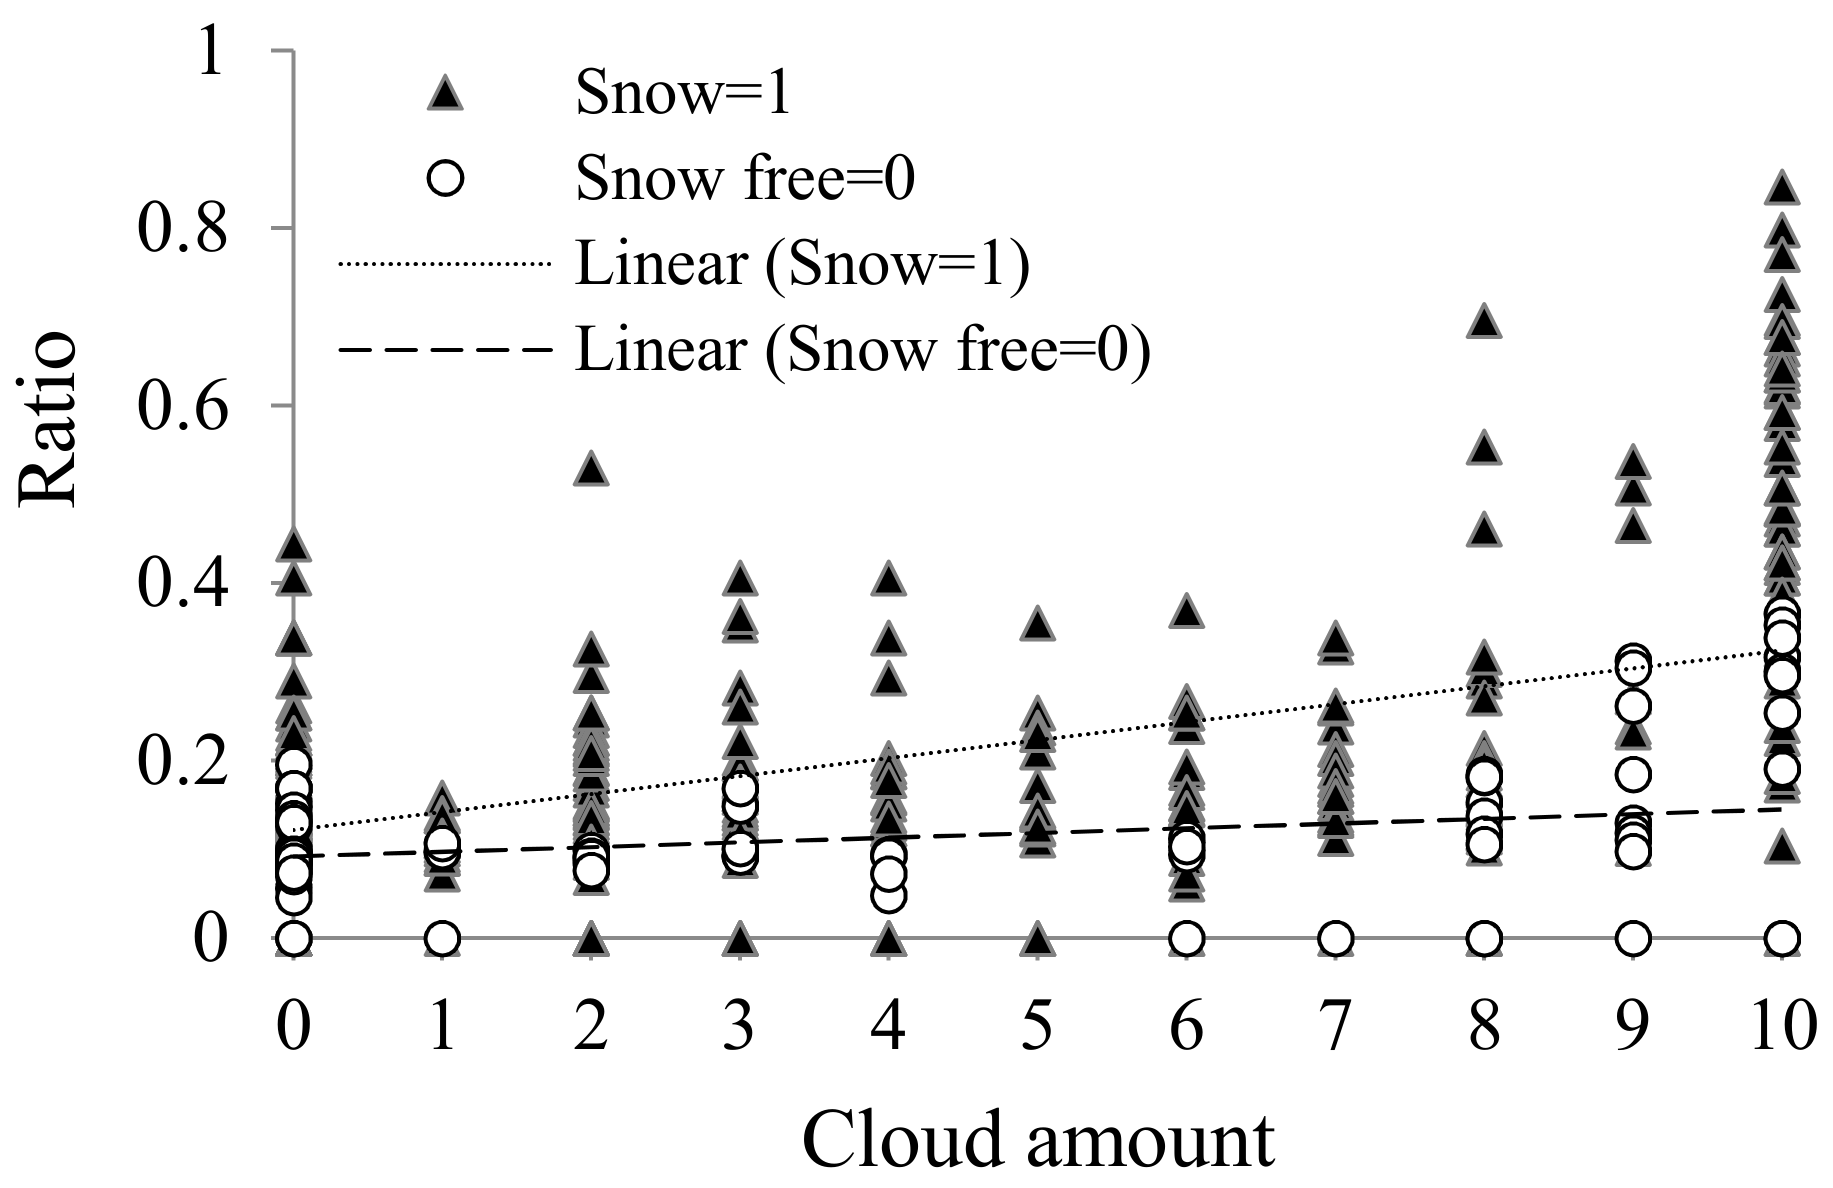
To define the reflection coefficient of the roof that is covered in snow or snow-free, the solar irradiance values at the front and back of the collector were measured with pyranometers (Model-CM3) with a typical accuracy of ±5% between October 2017 and February 2018. Moreover, environmental parameters such as the hourly amount of cloud cover, ambient temperature, and precipitation, which were measured by a weather station close to the exposure site, were gathered, and notes were taken regarding snow cover on the roof during the same measurement period. The weather station measured the cloud amount as ranging from 0 tenths to 10 tenths according to the international meteorological code (FM 12-IX SYNOP) [
14]. When the roof was covered in snow and snow-free, the correlations between the ratio of the back irradiation values to the front irradiation values and cloud amounts are shown in
Figure 2.
The back-side irradiance was modeled as a linear regression function based on the front solar irradiance, cloud data and snow covering the roof. As a result, Equation (1) was derived; the correlation between the measured and estimated values was 0.98 and the R
2 value was 0.96.
where
is the estimated back-side irradiance,
is the measured front-side irradiance,
is an independent parameter representing the snow covering, and
is an independent parameter representing the cloud amount. The parameter
X1 is equal to 1 when the roof is covered by the snow and equal to 0 when the roof is snow-free.
The current model of the back-side irradiance was combined into TRNSYS model calculating the collector outlet temperature. The parameters, such as cloud data measured by the weather station between 2015 and 2016, and information about snow covering the roof, which was based on the notes and photos taken during the measurement period from October 2015 to May 2016, were provided to input data readers (Type.9a).
3.3. Model of Daily Change in Transmittance
The dust deposition behavior on glass tubes of an evacuated tube solar collector was investigated by the authors of the current study [
15]. The authors conducted long-term dust deposition tests between October 2015 and May 2016; gathered environmental data such as PM
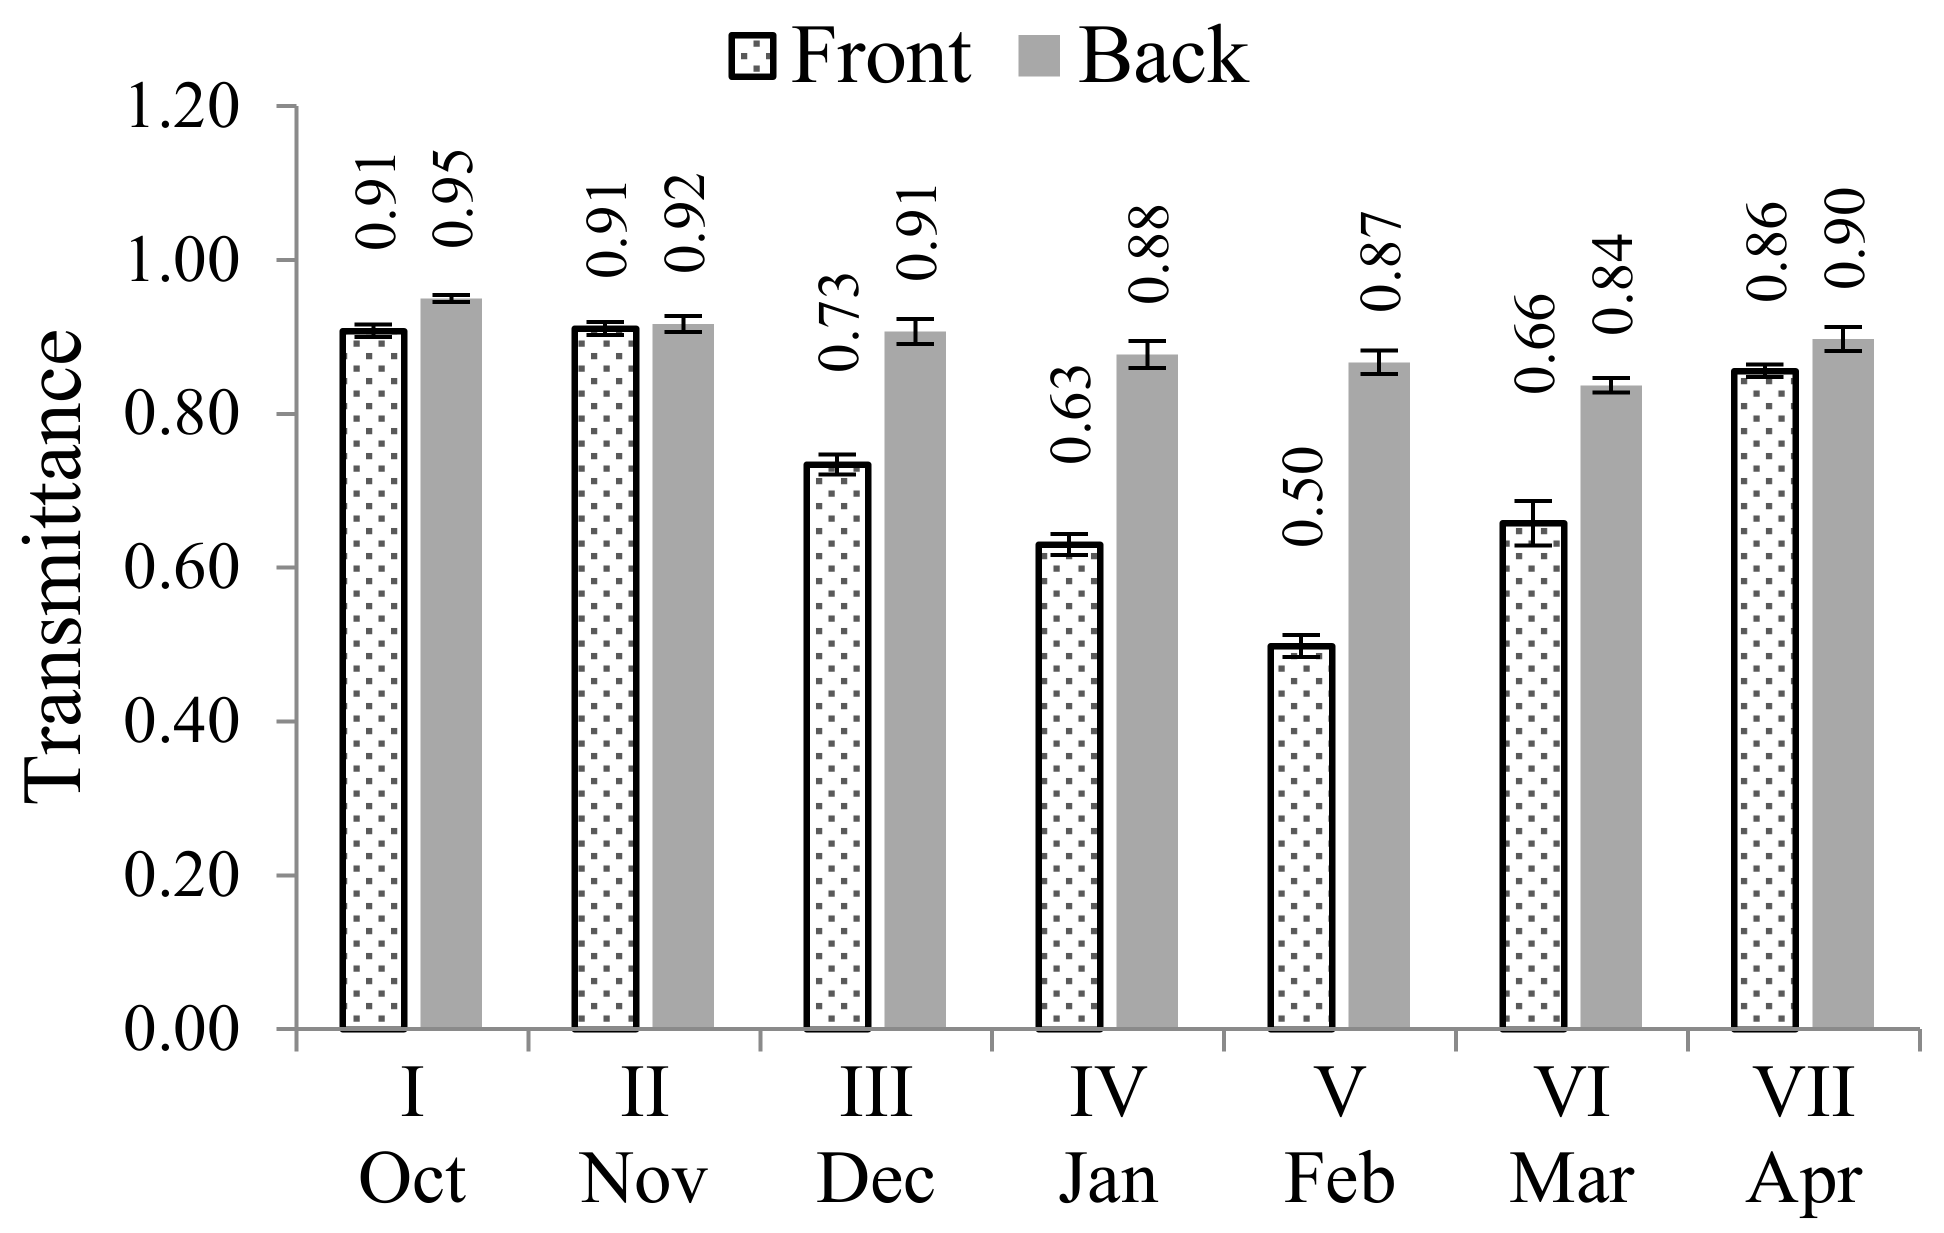
10, rain, snow, cloud, wind speed, and direction during that period; and modeled daily change in transmittance of the glass tubes. One set collector, including 30 evacuated glass tubes, was used for the tests and situated next to the solar collector system. Half of the tubes were exposed to actual environmental conditions for various periods, in steps of 28 days, to determine the long-term dust deposition behavior. After the exposure process, the transmittance values of all the exposed glass tubes were measured from the back and front sides using pyranometers with an accuracy < ±5%. The measurement results are shown in
Figure 3. Transmittance of the glass tubes decreased until February and then increased up to almost the initial value by May, when the measurements were performed from the front side. When the measurements were performed from the back side, the transmittance of the glass tubes was quite steady. These results indicate that the front side is easily contaminated by airborne dust and cleaned by rain and snow, whereas the back side is neither contaminated nor cleaned easily.
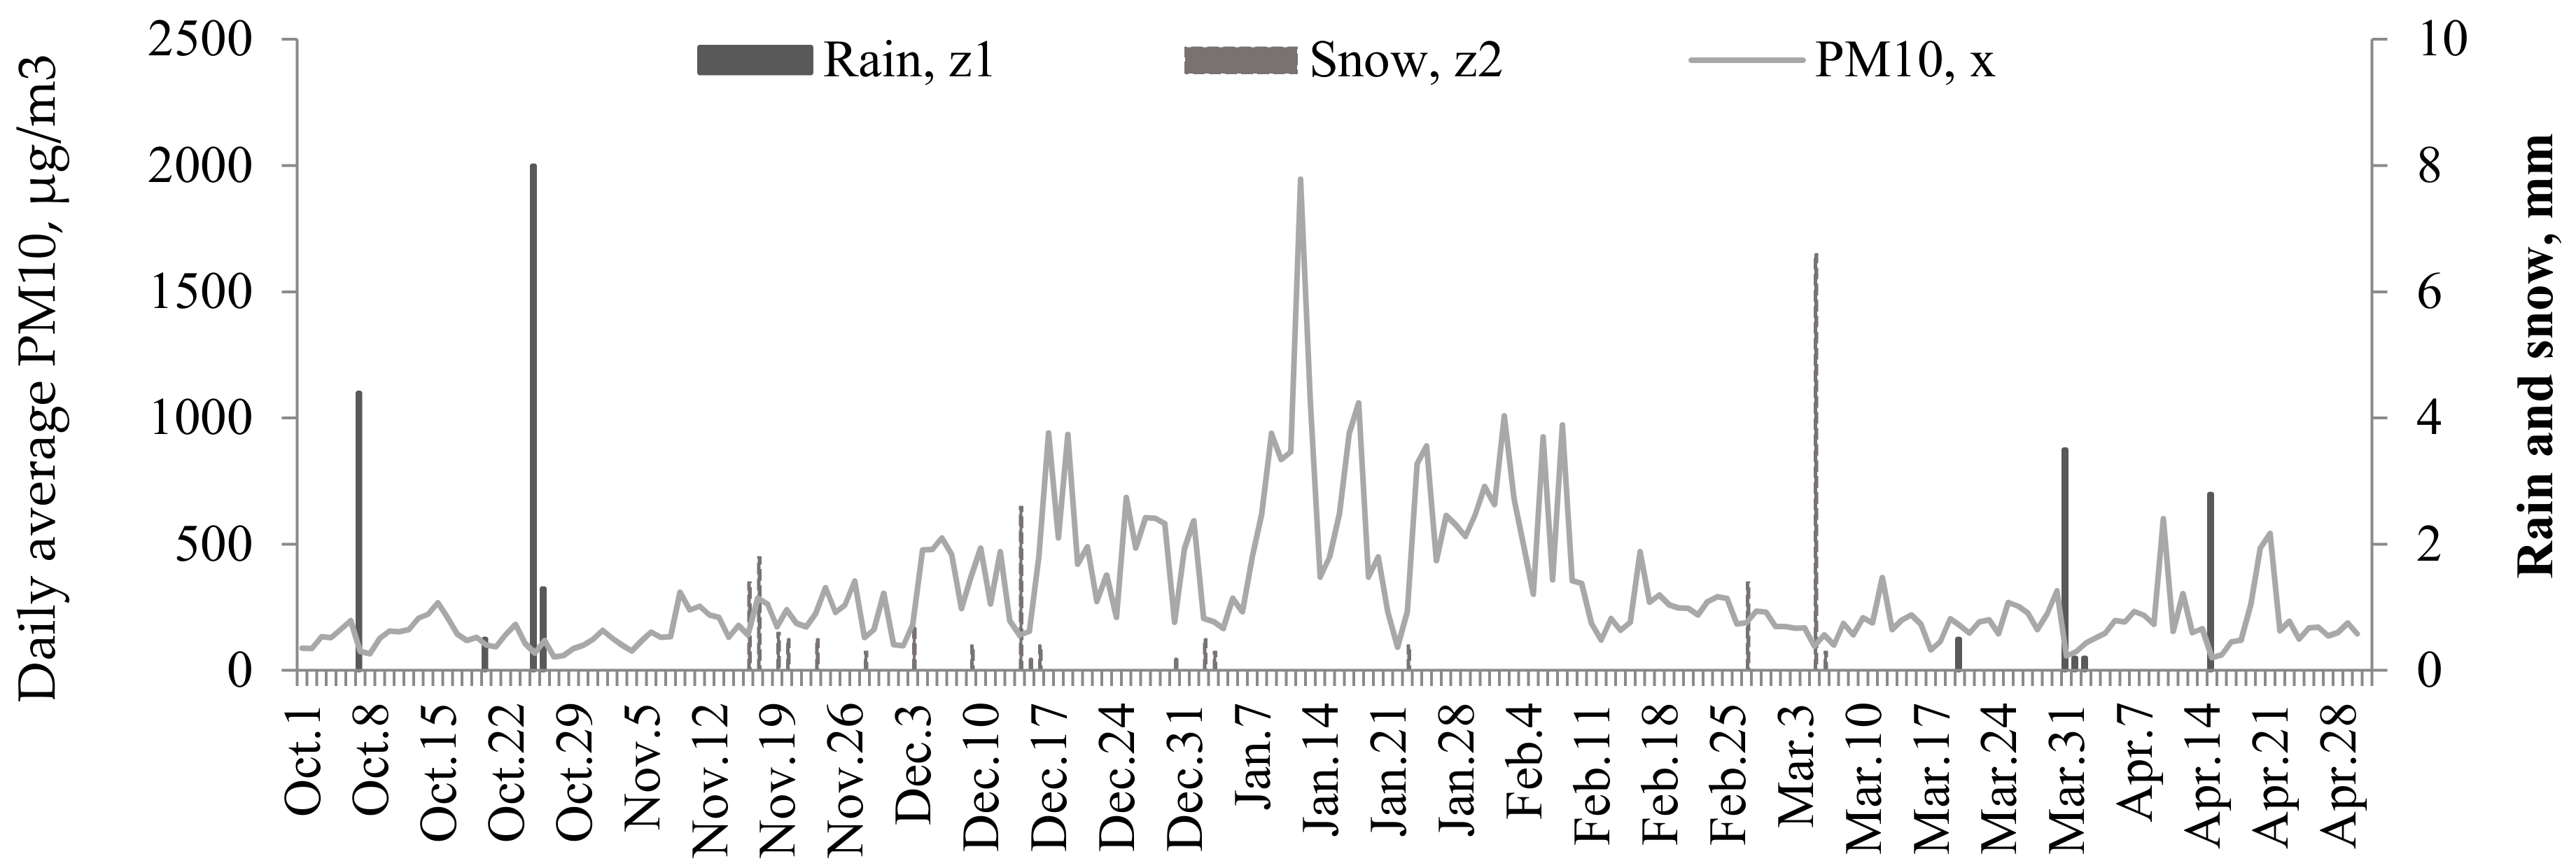
Figure 4 shows the environmental conditions, such as the PM
10, rain, and snow measured by the weather station throughout the duration of the tests. The behavior of the PM
10 is the same every year, with the highest level of air pollution observed in January and decreasing air pollution observed starting at the end of February [
16]. In addition, January and February have the lowest precipitation in general, as shown below [
17].
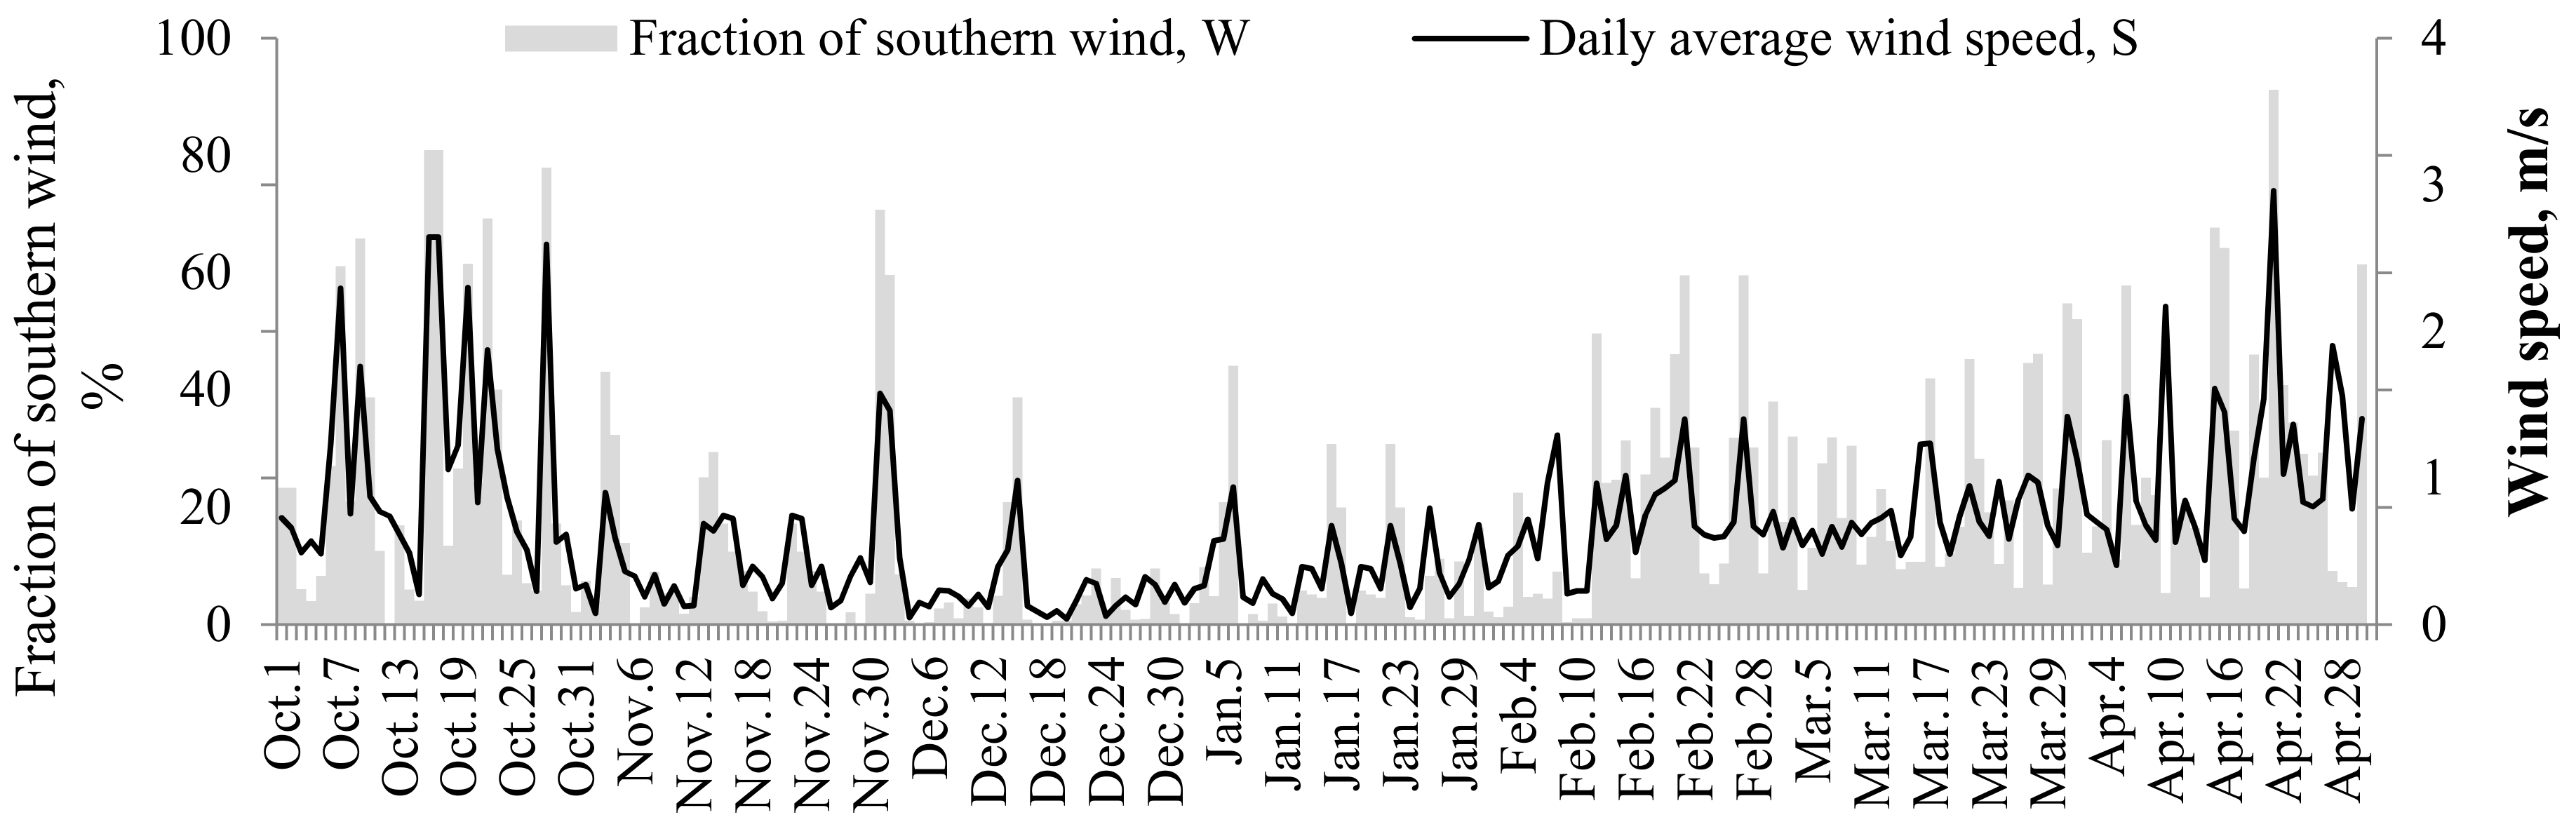
Figure 5 shows the daily average wind speed and the daily fraction of the wind that blew from the south, southeast, and southwest. The fraction is calculated as expressed in Equation (2). The daily average wind speed was high in spring and autumn and low in winter. This phenomenon was similar to the data measured by weather stations for several years.
After the long-term dust deposition tests between 2015 and 2016, the daily change in transmittance was modeled using the results of long-term dust deposition tests and environmental data, such as wind, rain, snow, and PM10. The model was formulated as an optimization method in which the objective function is to minimize the sum of squared errors between the estimated and measured values. As a result, the authors discussed the model and the results from the model, for example, effects of wind and snow on dust deposition on the glass tubes.
Because the number of exposed glass samples was low (eight glass tube), the optimization provides several results with high R
2 values. By adding some constraints on the air pollution factor (
A) and rain factor (
C) expressing that
A cannot have a negative effect on and
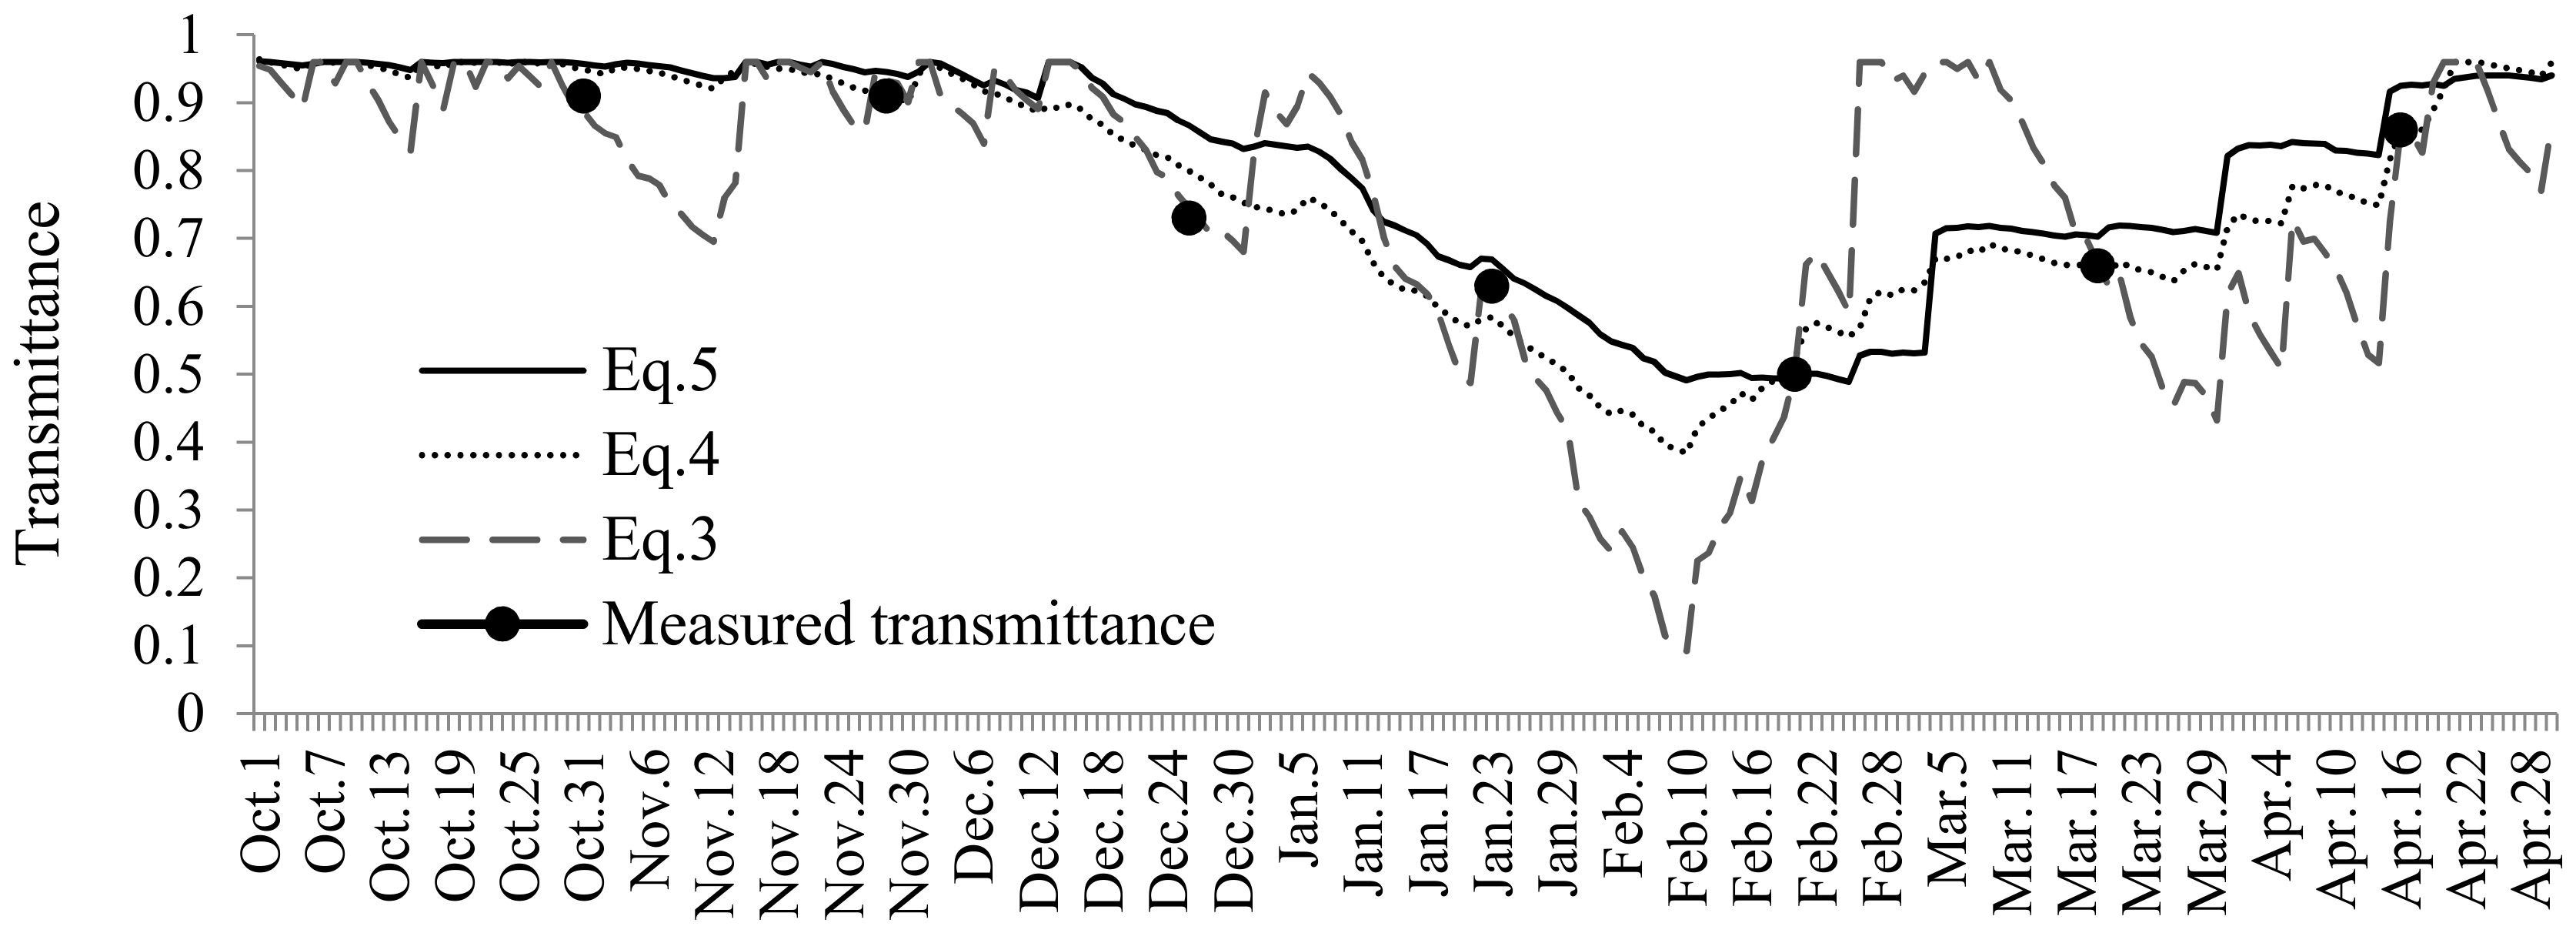
C cannot have a positive effect on the reduction in transmittance of the glass tubes, the following equations were sorted out. The estimated and measured transmittance values are shown in
Figure 6.
where
τ2,i−1 −
τ2,i is daily change in transmittance, which was measured to be 0.96; and
x, w, s, z1, and
z2 represent the daily average PM
10, wind direction, wind speed, daily rain, and daily snow measured, respectively.
The model of the daily change in transmittance was combined into the TRNSYS model. The parameters, such as precipitation and airborne dust (PM10), measured by the weather station per day, average wind speed, and fraction of wind direction measured during the measurement period between October 2015 and May 2016, were provided to input data readers (Type.9a).
3.4. TRNSYS Model of Solar Thermal Collectors
After incorporating the models of reflected irradiance and the daily behavior of transmittance into the TRNSYS model, the outlet temperature of the solar collector component in TRNSYS is expressed as:
where
A is the aperture area of the collectors,
is absorptance of the absorber plate,
is trasmittance of the collector covers including the inner and outer tubes, which is determined by the manufacturer as >0.91,
is the overall thermal loss coefficient of the collector per unit area,
is the thermal loss coefficient dependency,
is the overall collector heat removal efficiency factor,
is the measured inlet temperature,
is the specific heat of collector fluid,
is the measured flow rate,
is the difference between the temperatures of the collector inlet and ambient air, and
is transmittance reduction of the inner tube, which is assumed to approximately equal the difference between
and
.
4. Validation of the Solar Collector Model
Validation is an important process for any simulation. The TRNSYS model of the solar thermal system was validated by means of a comparison with the data measured during October and April, during which the collectors were nearly clean and the roof was snow-free.
Table 1 lists the sensors used for measuring the heat carrier fluid temperature at inlet (
Tin) and outlet (
Tout) of solar collectors, the volumetric flow rate of fluid flowing inside the collectors (
), and the global solar irradiance (
Gm), highlighting their operating ranges and related uncertainty.
The relative uncertainty associated to the collector measurement efficiency was <6% in October <16% in April.
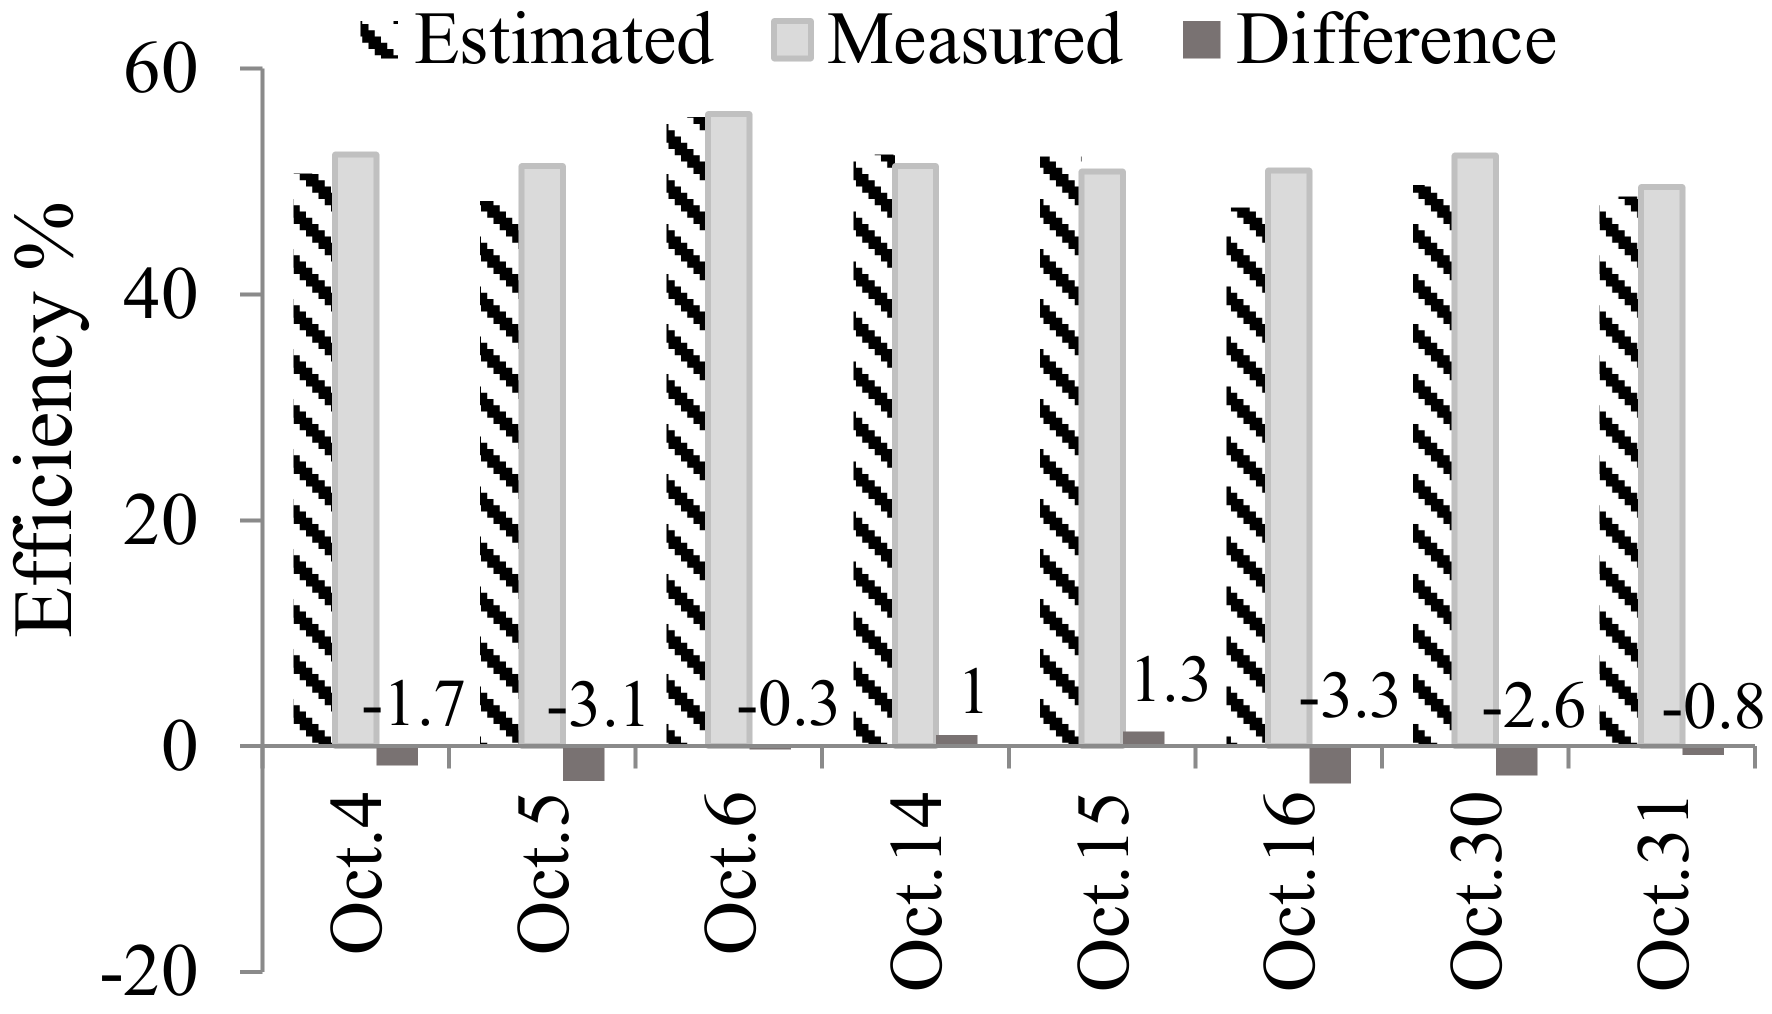
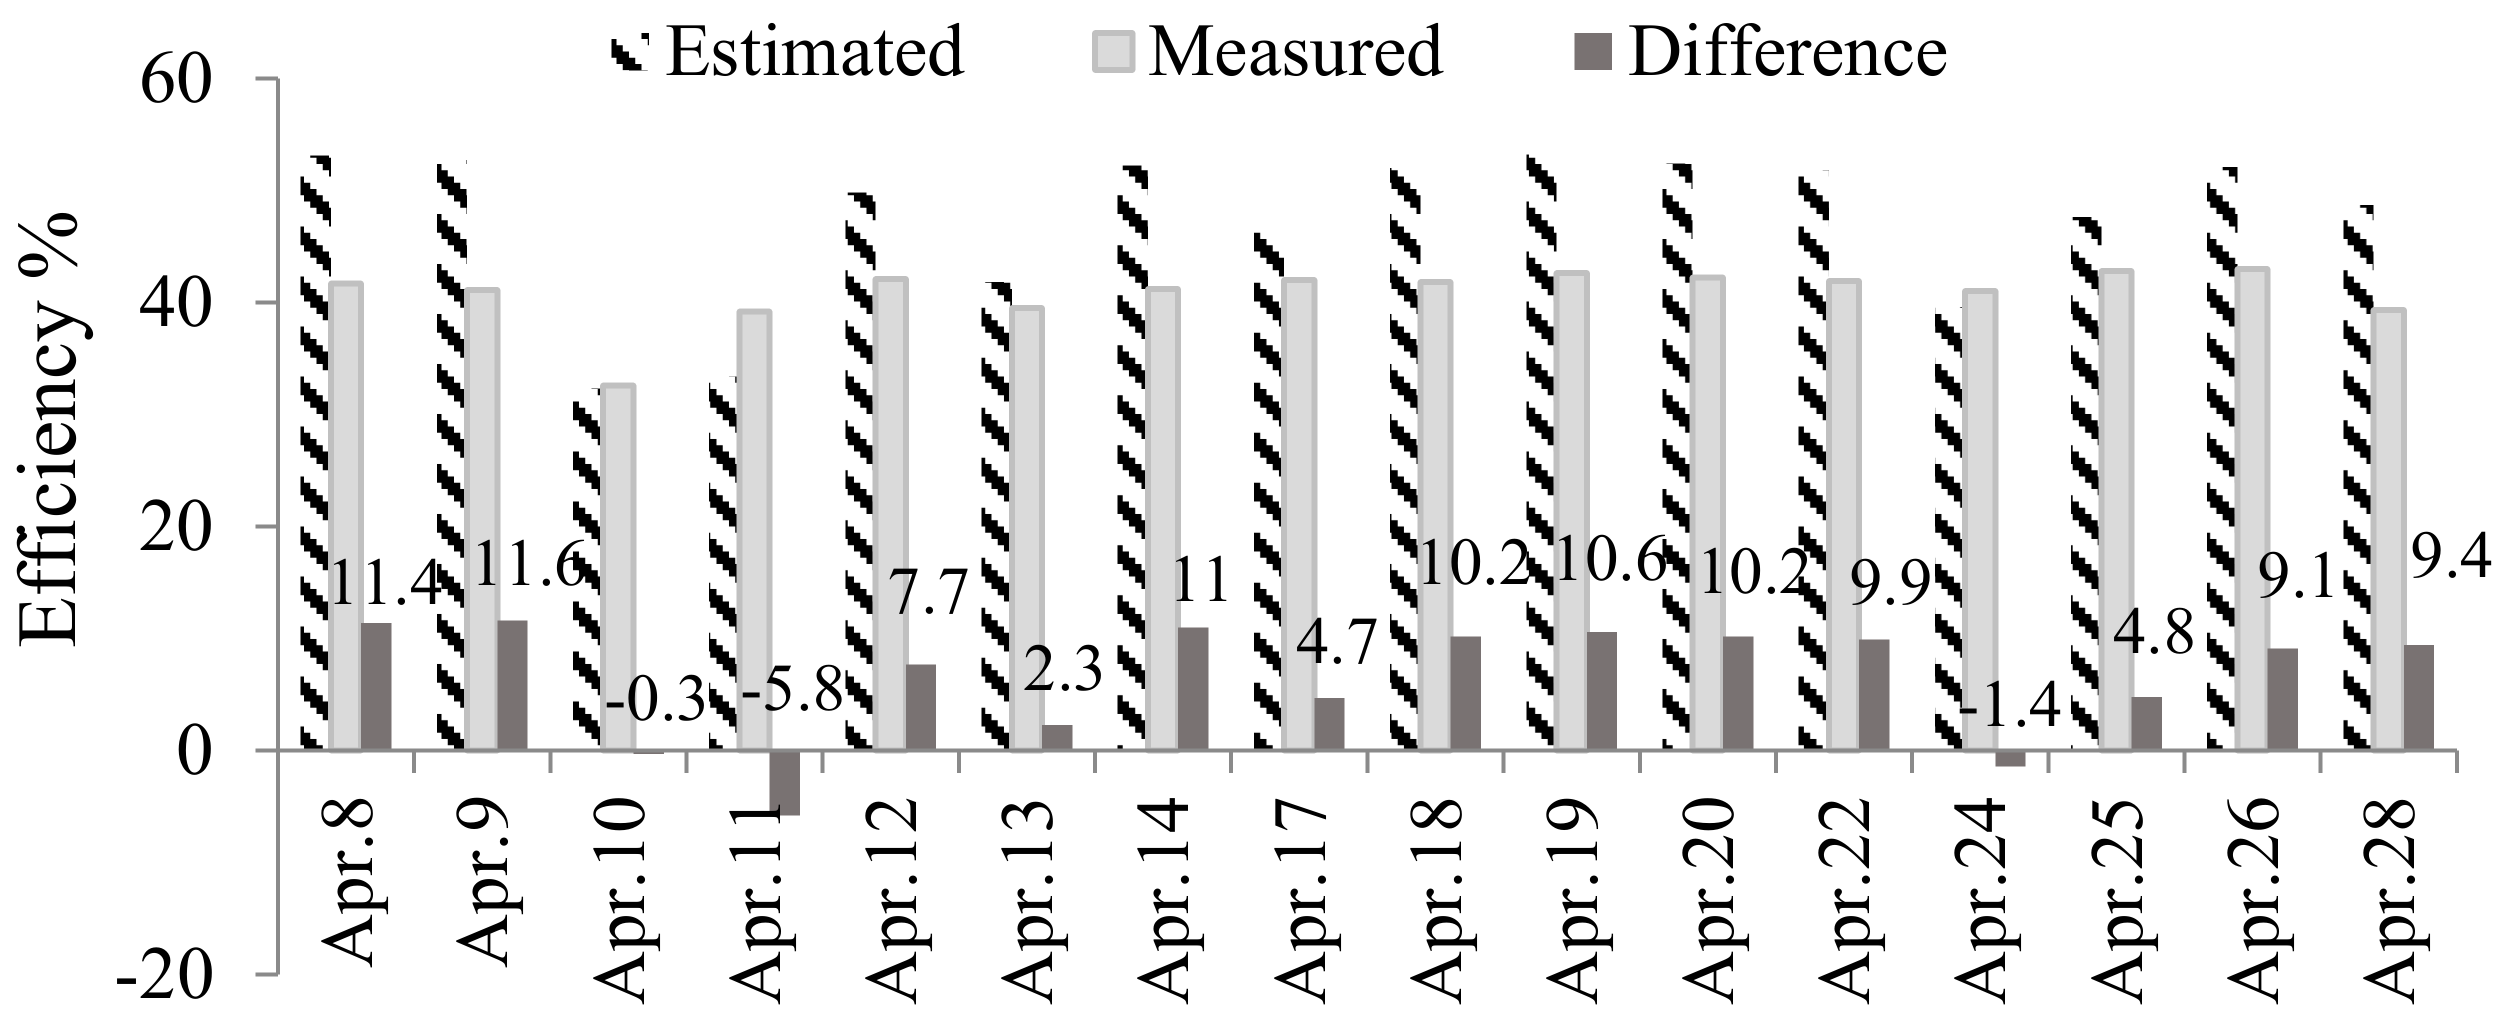
Figure 7 and
Figure 8 report the experimental and predicted daily thermal efficiencies during October 2015 and April 2016, respectively, as a function of the day. The differences between the estimated and measured values were generally lower than 11% in terms of daily efficiency during those months.
Since the TRNSYS model was considered to have been validated, the dust deposition model was embedded into the validated model in order to calculate daily efficiencies of the collectors during the rest months between January 2015 and March 2016. Among the dust deposition behaviors plotted by Equations (3)–(5), the behavior plotted by Equation (5) was chosen for the future calculations, because when Equation (5) was employed, the error between the performance calculated by TRNSYS and the actual measured performance was minimal from the available results. The correlations between the estimated and measured daily collector efficiencies during each month are shown in
Figure 9.
In terms of energy produced by the collectors, the max difference between the estimated and measured daily total energy was 4.5 MJ/day on 29 November, 5.1 MJ/day on 28 December, 9.2 MJ/day on 10 January, 10.1 MJ/day on 12 February, and 10.2 MJ/day on 26 March. These differences were attributed to the error in measuring the solar irradiance due to the air pollution or snow covering the glass surfaces of pyranometers; particularly, the biggest differences emerged after heavy snow fall.
5. Performance Analysis of Solar Thermal Collectors in Ulaanbaatar
5.1. Assessment of Degradation by Dust Deposition
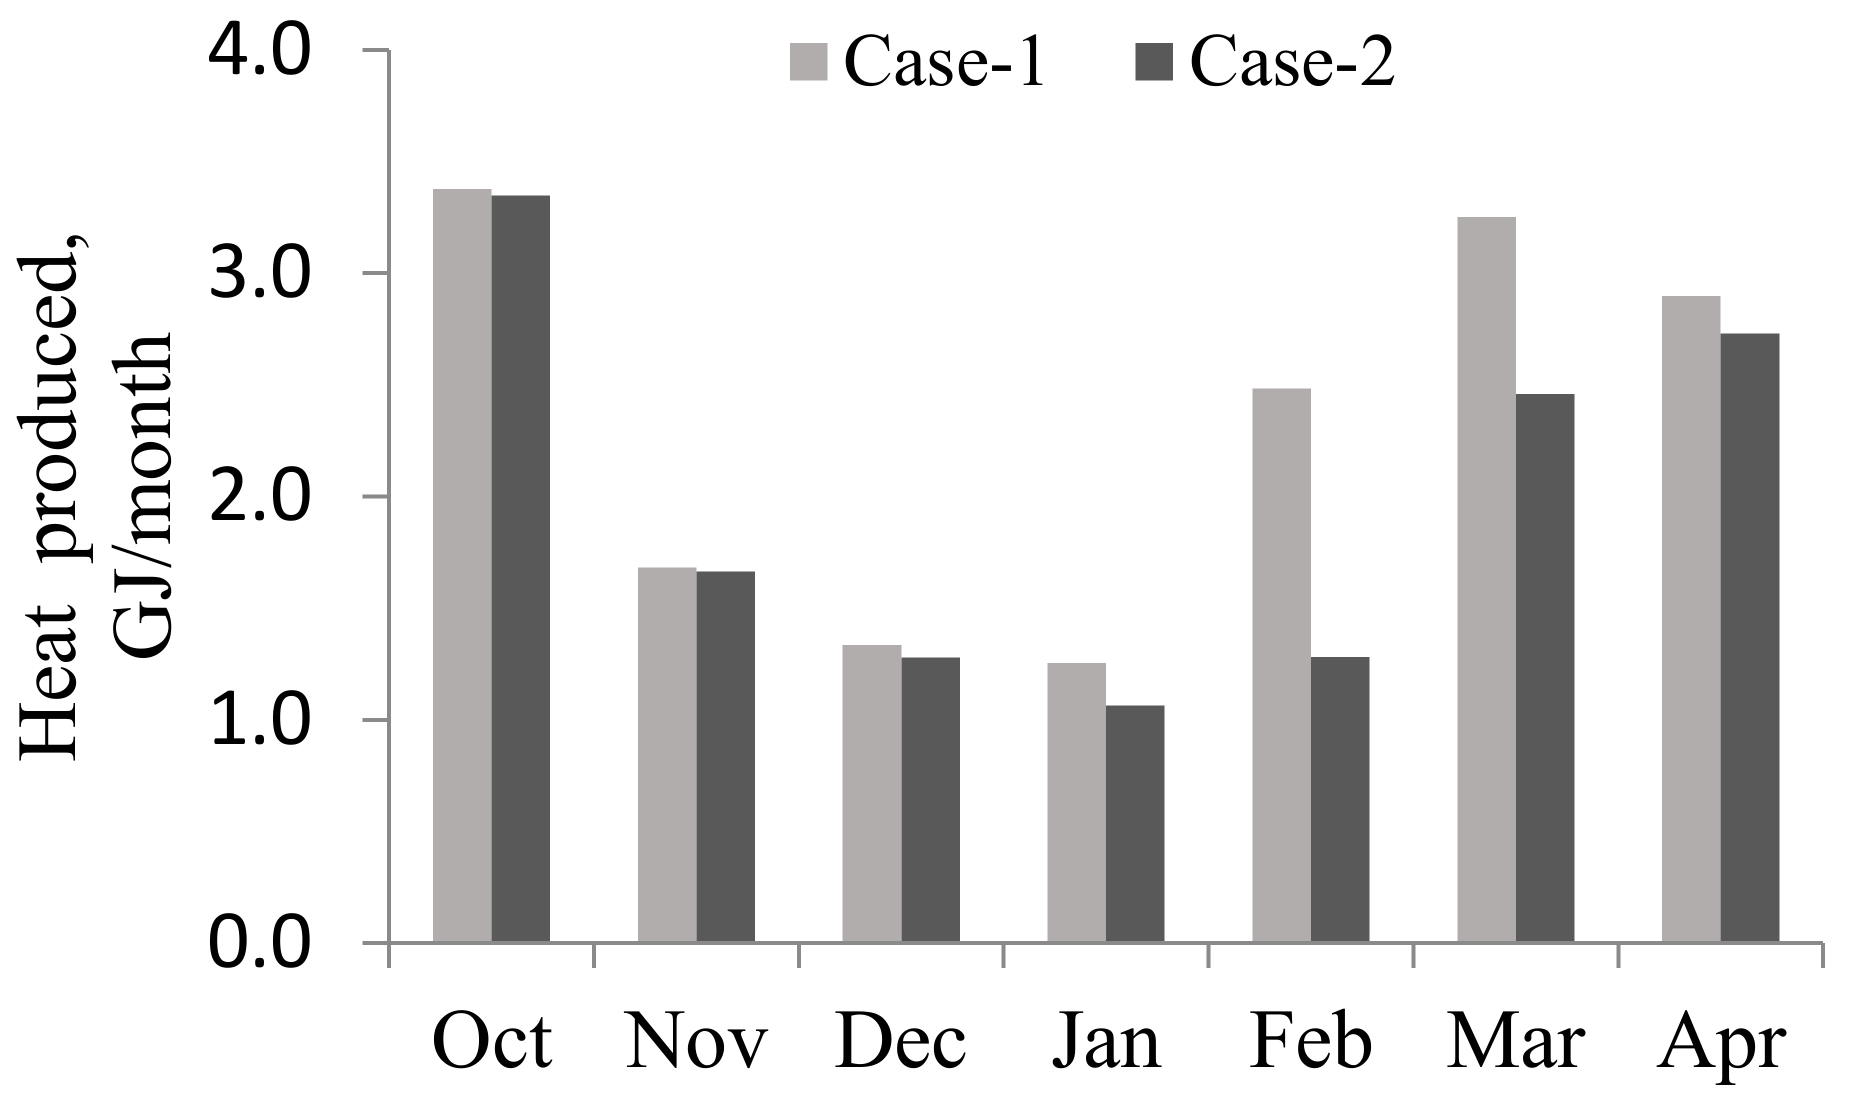
Figure 10 shows the monthly total thermal outputs of the collectors with daily cleaning (Case-1) and no cleaning (Case-2, which used the daily change in transmittance plotted by Equation (5)). The Case-1 results show that more energy (2.5 GJ) is produced compared with that of Case-2 during the duration of heating from October until May. The biggest difference in monthly performance of 1.2 GJ was observed in February.
5.2. Assessment of Cleaning Strategy
The main issue associated with the operation of dirt-covered collectors is estimating the cleaning period or frequency to optimize the heat recovery. Since Ulaanbaatar is a harsh and cold city, the water cannot be used. In addition, solar collectors are usually installed on inclined roofs, which increases the difficulty of cleaning them. Thus, a strategy considering a single cleaning during the duration of heating between October and May is selected taking into account that frequent cleaning is infeasible in practice.
The estimated daily behavior of transmittance changes depending on the day during which the cleaning is operated. In order to take into account for this change in TRNSYS, component Type.21 was used. Component Type.21 addresses each time step with the corresponding day numbers of the year, so that the time steps with same day numbers can receive the same daily value of transmittance. Then, the following additional restrictions were employed and integrated into Equation (5) to estimate daily changes of transmittance:
where
representsday numbers provided by the Type.21;
is the simulation start day (1 October), which is 273; and
is cleaning day, which is given by manual.
With the assistance of the restrictions above taking into account the cleaning day, the TRNSYS was run several times, changing the cleaning day (). Each run of TRNSYS gave a value of cumulative heat collected between October and May so that the values could be compared.
5.3. Results and Discussion
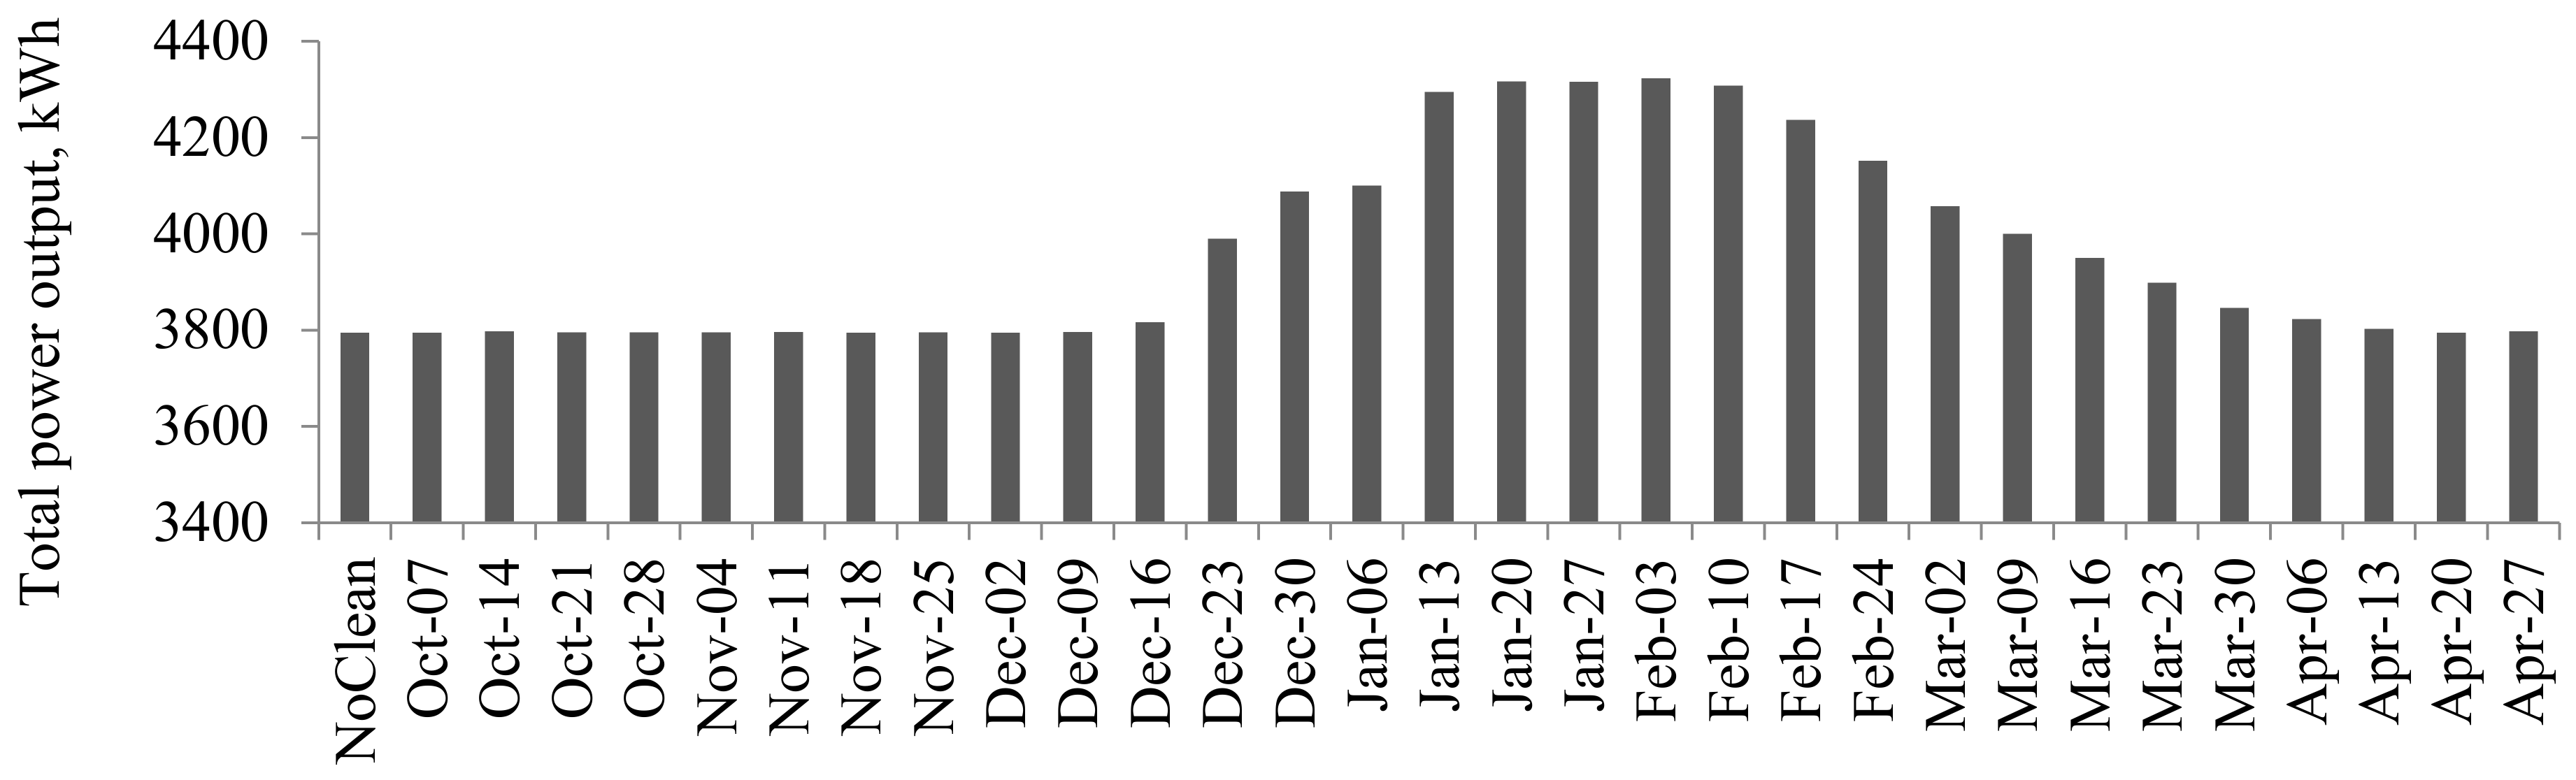
Using the step of 7 days, TRNSYS was run 31 times in total. Thus, 31 different days between October and April were chosen as test days to evaluate the best cleaning day. The results of the cumulative recovered heat values from October to April according to the cleaning date are shown in
Figure 11. The highest values of cumulative recovered heat were observed when the cleaning was performed between 13 January and 10 February. This finding can be explained by considering that the air pollution reached the maximum rate during the measurement period on 12 January, and that the total precipitation rate in January and February was 2.8 mm, which represented only 7% of the total precipitation that fell during the measurement periods.
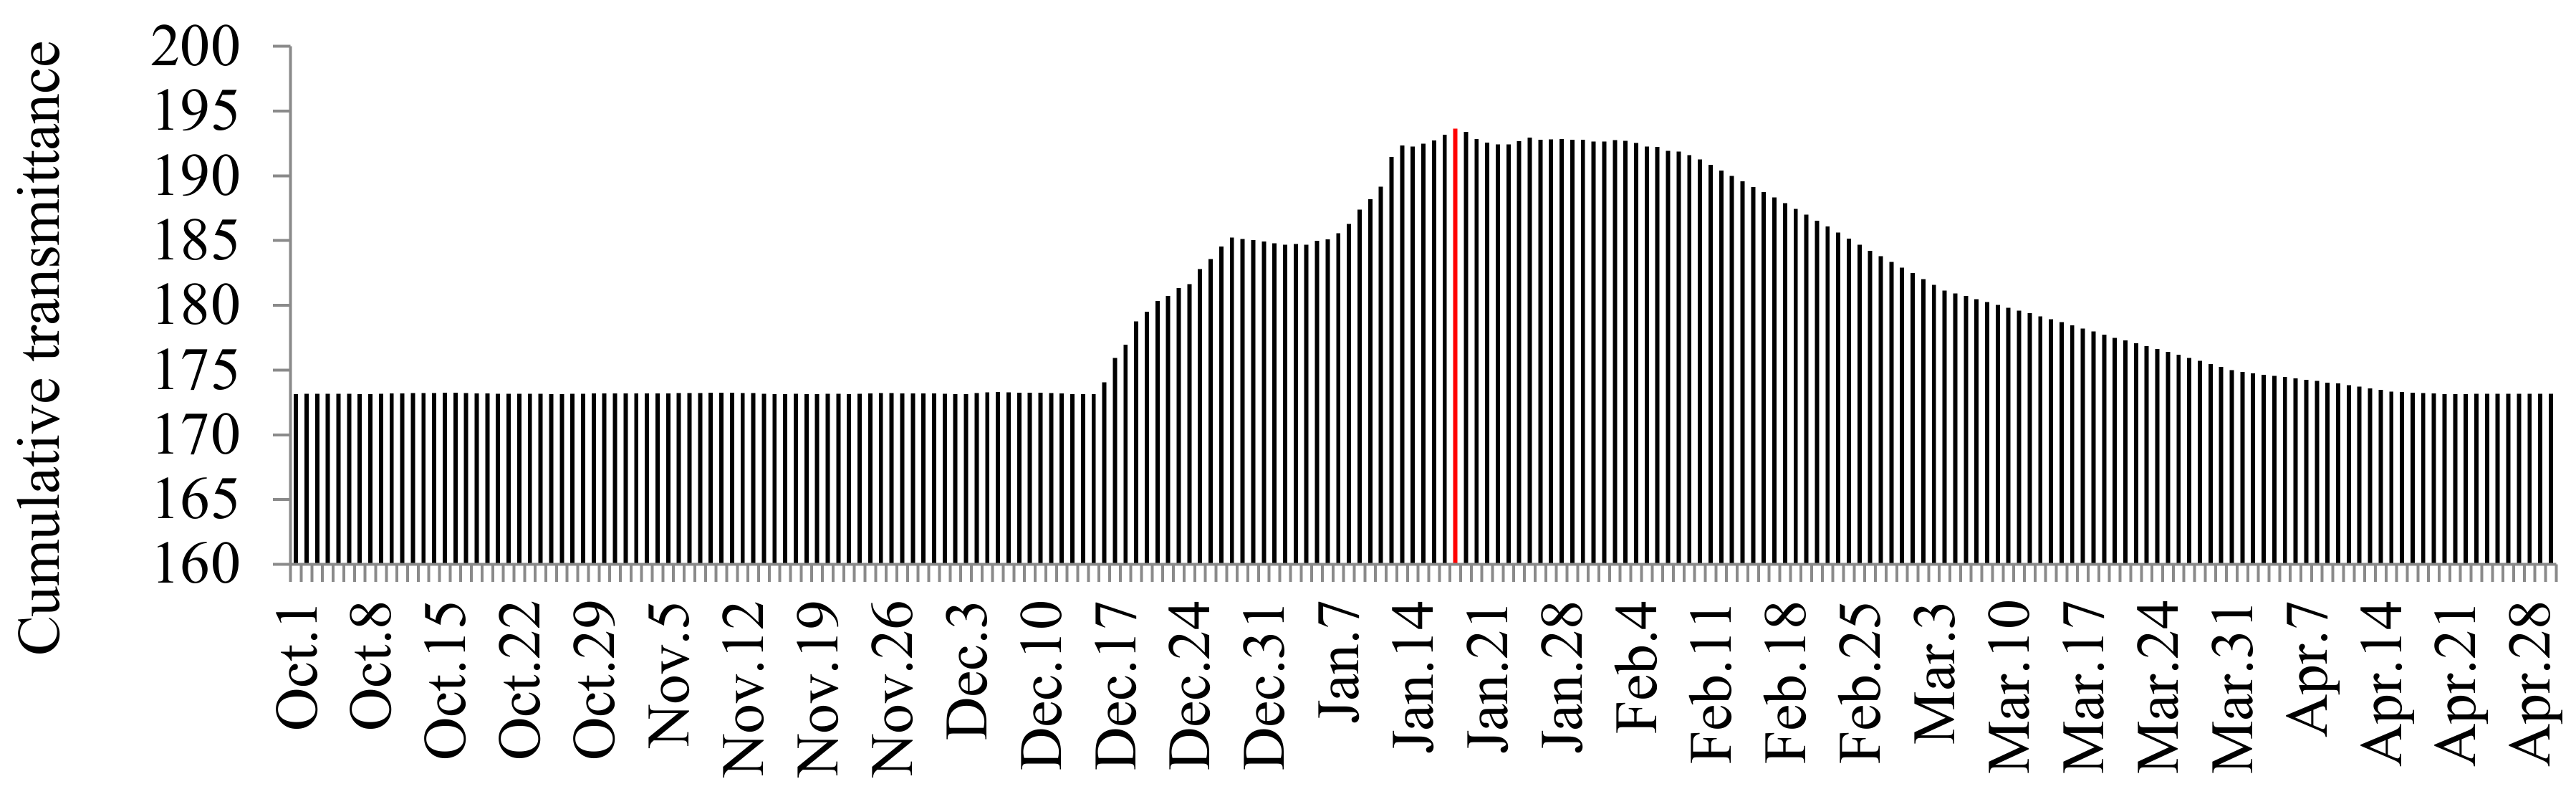
In addition to the cumulative heat, the cumulative transmittance was calculated by changing the cleaning day one by one between October and May to evaluate the best cleaning time. The results are shown in
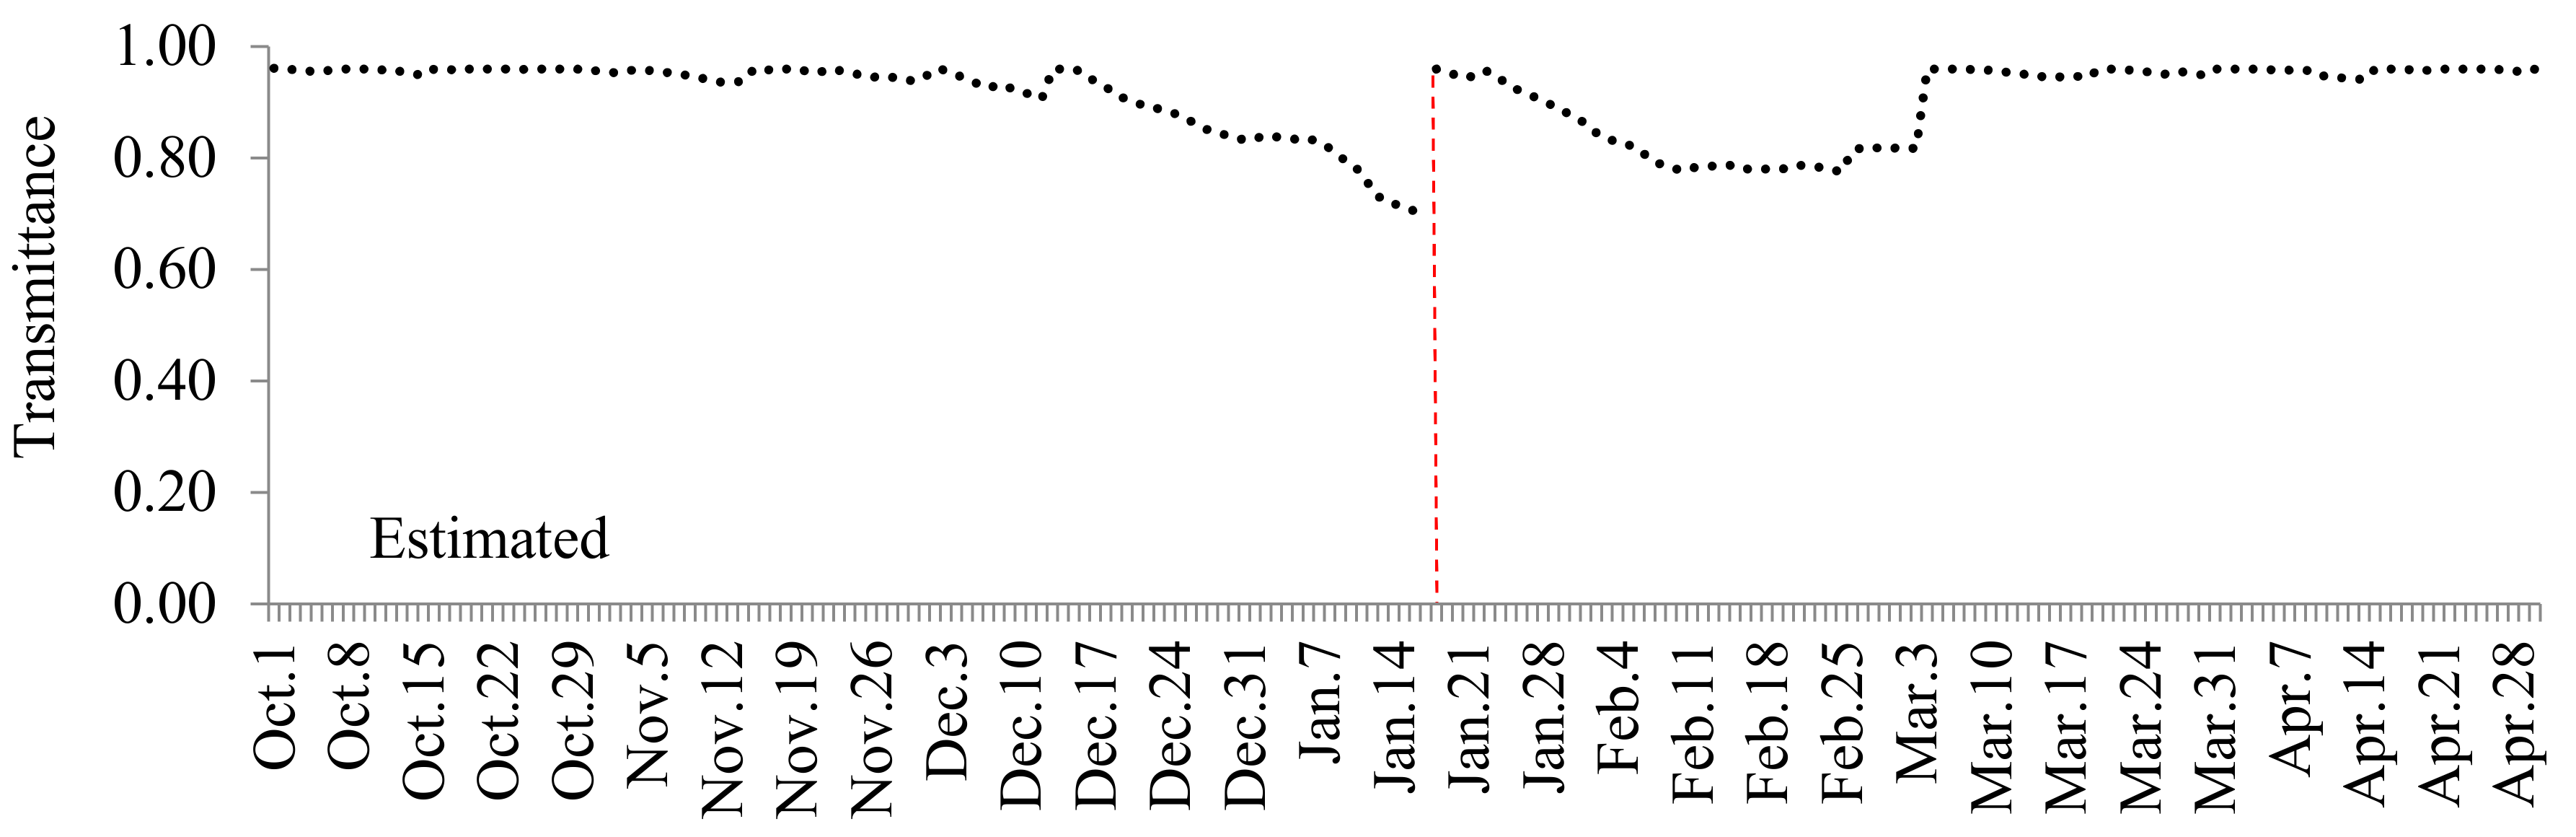
Figure 12. In this case, a higher cumulative transmittance value was observed in the same period as that of the cumulative heat, with the highest value observed on January 18. The transmittance behavior observed when the solar collector tubes were cleaned on January 18 is shown in
Figure 13 (the daily change in transmittance was calculated with Equation (5)).
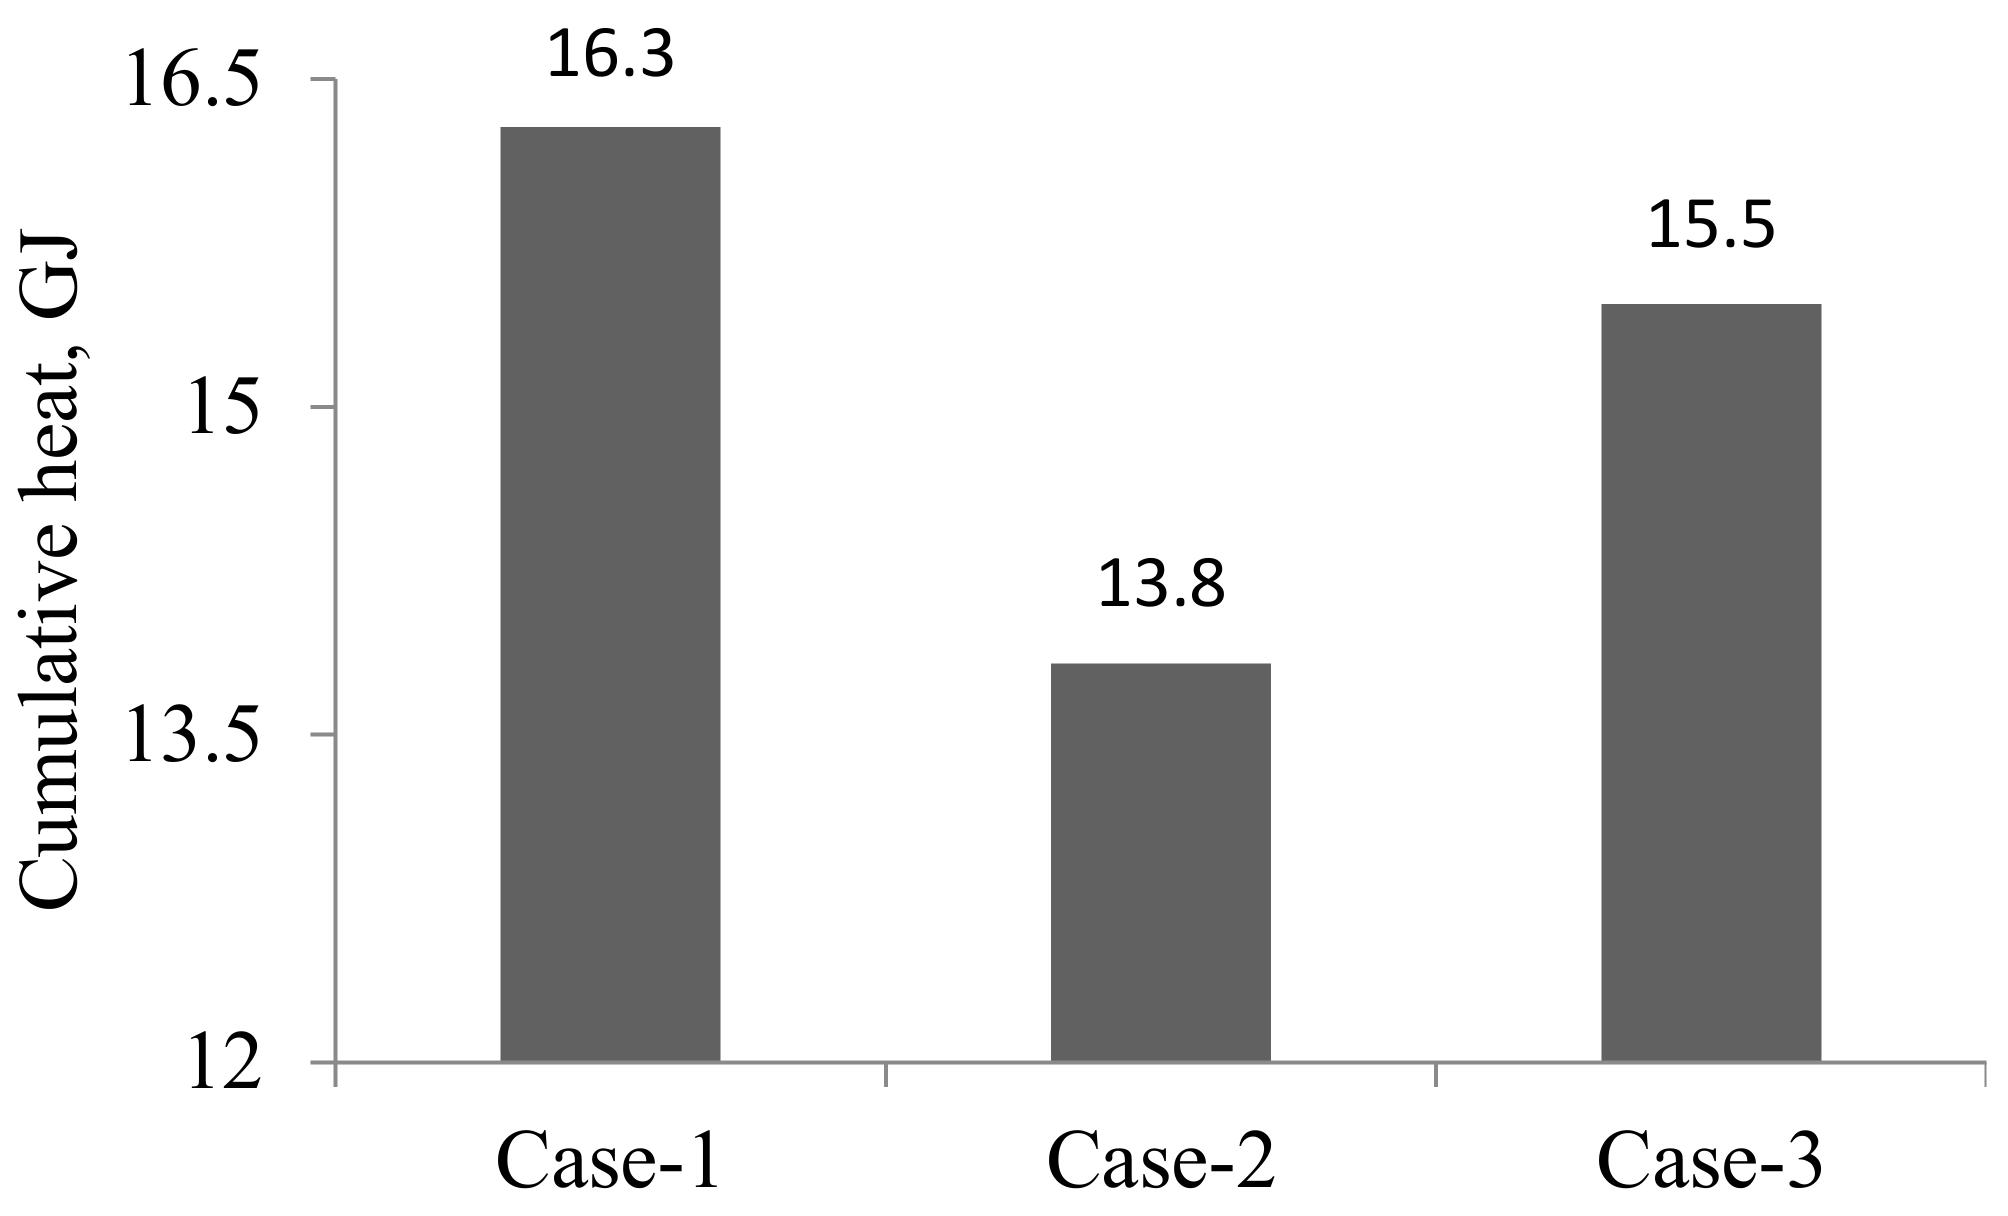
Figure 14 presents a comparison of the cumulative heat values obtained by the collectors in threecases: I. The collectors are cleaned every day during the heating period between October and May; II. The collectors are never cleaned; III. The collectors are cleaned once on 18 January. When the collectors were kept clean (Case-1), 18% more energy was produced with respect to the collectors that were not cleaned. When the collectors were cleaned once (Case-3), 12% more energy was produced with respect to the collectors that were not cleaned.
Economic efficiency of cleaning the collectors once during the duration of heating (Case-3) was 61,389 Tugrug (equal to about 25
$ USD) in terms of saved cost from the application of the electric heater compared with the collectors never cleaned (Case-2). In Ulaanbaatar, the cost of electricity is 130 Tugrug/kWh (5.3 cents/kWh) [
18].
6. Conclusions
The cumulative heats under different cleaning strategies in which the collector was cleaned once a year on different days were calculated and compared; the best results were obtained between the middle of January and the beginning of February. Therefore, if the system is only cleaned once a year, then cleaning should be performed in the season in which precipitation is lowest and on the days after air pollution reaches its maximum rate and begins to decrease (see
Figure 4).
The cumulative transmittance was also calculated to estimate the best cleaning time. The result was the same as that of the cumulative heat calculation, which implies that the dust deposition behavior model can be used to estimate the best cleaning time instead of using the TRNSYS model, which includes dust deposition and reflection models as long as the prediction of the dust deposition behavior is thoroughly considered.
The calculations show that as long as the solar thermal collector is kept clean during the heating period between October and May, 16.3 GJ of energy can be produced by the solar collectors and 2.46 GJ of energy can be recovered by cleaning every day. This amount of energy is equal to burning 237 kg of coal in the stove of the “triple system”. During actual operations between 2015 and 2016, the triple system consumed 1.2 tons of raw coal to heat the house.
We believe that the method of this study, which was developed for evaluating the cleaning strategy of the solar collectors and assessing the potential of solar thermal utilization with the assistance of TRNSYS model including the dust deposition calculation, will help in applications of solar thermal systems in cold and polluted areas.
Author Contributions
Conceptualization, A.A. (Atsushi Akisawa); Data curation, A.A. (Amarbayar Adiyabat); Formal analysis, P.E.; Investigation, P.E.; Methodology, A.R. and A.A. (Atsushi Akisawa); Project administration, A.A. (Amarbayar Adiyabat); Software, A.R.; Supervision, A.A. (Atsushi Akisawa); Validation, A.R., S.S. and A.C.; Writing—original draft, P.E.; Writing—review & editing, A.R.
Funding
This research received no external funding.
Acknowledgments
This work was supported by the Mongolian-Japan Engineering Education Development project /M-JEED/ [JR code: J13A15].
Conflicts of Interest
The authors declare no conflict of interest.
Nomenclature
| A | Aperture area of the collectors [m2] |
| Day number at which the collector is cleaned |
| Specific heat of collector fluid [kJ/kg-K] |
| Day numbers provided by the component Type.21 |
| Overal collector heat removal efficiency factor |
| Estimated reflected solar irradiance reaching the collectors from the back [kJ/h-m2] |
| Measured solar irradiance reaching the collectors from the front [kJ/h-m2] |
| i | Index of days |
| Measured flow rate [kg/h] |
| S | Wind speed [m/s] |
| Simulation start day in TRNSYS |
| t | Measurement step (=2 min) |
| T | Number of daily measurement steps (=720) |
| Temperature measured at the collector inlet [°C] |
| Difference between temperatures of the collector inlet and ambient air |
| Overall thermal loss coefficient of the collector per unit area [kJ/h-m2-K] |
| Thermal loss coefficient dependency [kJ/h-m2-K2] |
| W | Daily fraction of the southern wind direction |
| w | Wind direction [0–360°] |
| Parameter representing snow coverage |
| Parameter representing the presence of clouds [tenths] |
| x | Daily average airborne particles PM10 [µg/m3] |
| Total daily rain [mm] |
| Total daily snow [mm] |
| Absorptance of the absorber plate of collectors |
| Conversion factor or intercept coefficent of the collectors |
| Trasmittance of collector covers (inner and outer glasses) |
| Transmittance of an outer glass tube without dust |
| Transmittance of a dirty glass tube |
| Transmittance reduction of the collectors due to dust depostion |
| Transmittance reduction of the inner tube with a selective coating |
| Product of the cover transmittance and the absorber absorptance at normal incidence conditions |
References
- UNICEF. Understanding and Addressing the Impact of Air Pollution on Children’s Health in Mongolia; UNICEF: Ulaanbaatar, Mongolia, 2011; Available online: https://www.unicef.org/environmet/files/Understanding_and_addressing_the_impact_of_ air_pollution.pdf (accessed on 24 May 2018).
- Enebish, N. Overview of Energy/Electicity Demand and Renewable Energy Potential in Mongolia. In Proceedings of the Asion Super Grid Workshop, Seoul, Korea, 25–27 May 2016; Available online: https://www.renewable-ei.org/images/pdf/20160525/Enebish_Namjil.pdf (accessed on 28 May 2018).
- Erdenedavaa, P.; Adiyabat, A.; Atsushi, A.; Otgonjanchiv, E. Performance analysis of solar thermal system for heating of a detached house in harsh cold region of Mongolia. Renew. Energy 2018, 117, 217–226. [Google Scholar] [CrossRef]
- TRNSYS. The Transient Energy System Simulation Tool. Available online: http://www.trnsys.com (accessed on 19 June 2018).
- Saleem, M.S.; Haider, A.; Abas, N. Review of solar thermal water heater simulations using TRNSYS. In Proceedings of the Power Generation Systems and Renewable Energy Technologies (PGSRET), Slamabad, Pakistan, 10–11 June 2015. [Google Scholar]
- Ayompe, L.M.; Duffy, A.; McCormack, S.J.; Conlon, M. Validated TRNSYS model for forced circulation solar water heating systems with flat plate and heat pipe evacuated tube collectors. Appl. Therm. Eng. 2011, 31, 1536–1542. [Google Scholar] [CrossRef]
- Budihardjo, I.; Morrison, G.L.; Behnia, M. Development of TRNSYS Models for Predicting the Performance of Water-in-Glass Evacuated Tube Solar Waterheaters in Australia; Destination Renewables—Australian and New Zealand Solar Energy Society: Sydney, Australia, 2003. [Google Scholar]
- Serban, C.; Eftimie, E.; Coste, L. Simulation Model Intrnsys of a Solar House from Brasov Romania. Renew. Energy Power Qual. J. 2011, 1, 494–499. [Google Scholar] [CrossRef]
- Karim, A.R.M.; Kasaeian, A.; Kaabinejadian, A. Performance investigation of solar evacuated tubecollector using TRNSYS in Tehran. Int. J. Renew. Energy Res. 2014, 4, 497–503. [Google Scholar]
- Mohammed, M.N.; Alghoul, M.A.; Abulqasem, K.; Mustafa, A.; Glaisa, K.; Ooshaksaraei, P.; Yahya, M.; Zaharim, A.; Sopian, K. TRNSYS simulation of solar water heating system in Iraq. In Recent Researches in Geography Geology Energy Environment and Biomedicine; Wseas LLC: Corfu Island, Greece, 2011; ISBN 978-161-804-022-0. [Google Scholar]
- Andres, A.C.; Lopez, J.M.C. TRNSYS model of a thermosiphon solar domestic water heater with a horizontal store and mantle heat exchanger. Sol. Energy 2002, 72, 89–98. [Google Scholar] [CrossRef]
- Peter, H.; Zauresh, A. Household coal demand in rural Kazakhstan: subsidies, efficiency, and alternatives. Energy Policy Res. 2017, 4, 55–64. [Google Scholar] [CrossRef]
- WHO. Residential Heating with Wood and Coal: Health Impacts and Policy Options in Europe and North America; WHO: Marmorvej, Denmark, 2015; ISBN 978-928-905-076-0. [Google Scholar]
- University of Nairobi. Available online: http://meteorology.uonbi.ac.ke/sites/default/files/cbps/sps/meteorology/SMR204%20NOTE_1.pdf (accessed on 21 June 2018).
- Purevdalai, E.; Atsushi, A.; Amarbayar, A.; Erdenesuvd, O. Observation and Modeling of Dust Deposition on Glass Tube of Evacuated Solar Thermal Collectors in Mongolia. Available online: https://doi.org/10.1016/j.renene.2018.06.077 (accessed on 19 June 2018).
- The World Bank. Air Quality Analysis of Ulaanbaatar: Improving Air Quality to Reduce Health Impacts; The World Bank: Washington, DC, USA, 2011; Available online: https://openknowledge.worldbank.org/handle/10986/26802 (accessed on 24 May 2018).
- Mongolian Statistical Information Service, Sum of Precipitation. Available online: http://www.1212.mn/tables.aspx?tbl_id=DT_NSO_2400_026V1&aimag_center_select_all=0&aimag_centerSingleSelect=_511&YearM_select_all=1&YearMSingleSelect=&viewtype=linechart (accessed on 24 May 2018).
- Mongolian Energy Regulatory Commission, Official Site. Available online: http://erc.gov.mn/index.php?newsid=675# (accessed on 22 June 2018).
© 2018 by the authors. Licensee MDPI, Basel, Switzerland. This article is an open access article distributed under the terms and conditions of the Creative Commons Attribution (CC BY) license (http://creativecommons.org/licenses/by/4.0/).

 ,
, 


