Article

Influence of Temperature on the Microstructure Deterioration of Sandstone

1
College of Architecture and Civil Engineering, Xi’an University of Science and Technology, Xi’an 710054, China
2
State Key Laboratory for Geo-Mechanics and Deep Underground Engineering, China University of Mining & Technology, Xuzhou 211116, China
3
School of Resources and Geosciences, China University of Mining & Technology, Xuzhou 211008, China
4
College of Energy, Xi’an University of Science and Technology, Xi’an 710054, China
*
Authors to whom correspondence should be addressed.
Energies 2018, 11(7), 1753; https://doi.org/10.3390/en11071753
Submission received: 7 June 2018 / Revised: 24 June 2018 / Accepted: 2 July 2018 / Published: 4 July 2018
(This article belongs to the Special Issue Geothermal Energy: Utilization and Technology 2018)

Abstract

:
Macroscopic properties of sandstone are commonly attributed to the degradation of its microstructure during heating treatment processes. However, few previous studies have focused on comprehensive observations on how the microstructure of sandstone changes with temperature. In this study, a kind of sandstone containing quartz, albite, calcite, and laumontite (little), was collected from Linyi (Shandong Province, China) to observe the microstructure degradation changes with temperature by X-ray diffraction (XRD), Scanning electron microscopy (SEM) and thermo-gravimetric analyses (TGA). Firstly, 10 groups of sandstone samples were heated from 25 °C to 900 °C. Then, some core micro-parameters including lattice constant, full width at half maximum (FWHM), micro-strain, dislocation density, TGA curve changes and failure characteristic of the mineral were analyzed comprehensively. Finally, the underlying mechanism causing the microscopic thermal damage at different temperature intervals was also discussed. The results showed that: (1) quartz, the framework component of this sandstone, underwent an α- to β-phase change over the temperature range from 400 °C to 600 °C. This phenomenon caused the lattice constant, micro-strain, dislocation density and TGA curve to decrease sharply during this interval, leading to the microstructure deterioration of sandstone; (2) calcite underwent a decomposition reaction between 600 °C and 800 °C, and resulted in the XRD pattern peak, lattice constant, micro-strain and TGA curve dropping continuously. It destroyed further the internal microstructure of sandstone and produced numerous inter-granular cracks around quartz crystals; (3) further examination found that the decomposition reactions of minerals presented non-synchronized characteristics due to the different sensitivities of minerals to temperature, which led to thermal stress, thermal fracturing of minerals, and thermal reactions happening in different temperature intervals.

1. Introduction

Recently, the demand for underground space resources is becoming more and more important, which includes underground space utilization, underground resources exploitation (e.g., geothermal energy, coal, shale gas, coal-bed methane, etc.). With the strong demand for these underground resources, underground engineering had gained great importance. For example, the deepest exploitation depth around the world has reach to 4800 m in South Africa [1]. In China there are dozens of deep mines with depths exceeding 1000 m [2]. An urgent issue for these Km level deep mines is the high temperature problem. As a matter of fact, exploitation of hot dry rocks for geothermal energy also faces the phenomenon of thermally induced damage of reservoir rocks due to elevated temperature dependence [3,4,5]. Rocks under high temperature or after high temperature treatment will display a decrease in their physical and mechanical properties, such as uniaxial compressive strength, wave velocity and elastic modulus and so on [6,7,8,9,10]. In essence, these changes of macroscopic properties are related with the degradation of the rock microstructure. It is necessary to understand the micromechanism of rock degradation to explain and predict the changes of macroscopic properties after a heating treatment.
X-ray diffraction (XRD) pattern analysis, as a modern test technique, has some unique advantages when studying rock microstructure. For example, it can reflect phase retrieval, quantitative, crystal structure, formation of new phase and domain size analyses [11,12]. Up to now, it has been widely used in material science to analyze the microstructure characteristics of rocks [13,14]. Many researchers, such as Holmboe and Vázquez [15,16], have used XRD to study how the mineral composition changes for rock and soil materials. Meanwhile, some new XRD approaches including high resolution X-ray computed tomography (HRXCT), submicrometer hyperspectral X-ray (SH-XRD) have also been adopted in the recent work [17,18]. The scanning electron microscopy (SEM) technique provides a visual method to observe the microstructure change processes of materials using electron beam to scan the sample. The grain size, crack, hole, and mineralogical morphology can be obtained directly by means of SEM images [19,20]. It has been broadly used to measure the thermal crack expansion process and the quantitative micro-crack density and extension changes with heat treatment [21,22,23]. Meanwhile, thermo-gravimetric analyses (TGA) is a conventional and appropriate method widely used in the study of rocks, and concrete materials to determine the weight changes with temperature. It also can observe visually mineral decompositions and reactions by the local curve peak [24,25]. Therefore, combinations of SEM and TGA methods are commonly adopted to observe the microstructure deterioration and the corresponding thermal reaction process of rocks during heating [26,27,28].
In this study, some microstructure parameters of sandstone, including lattice constant, full width at half maximum (FWHM), micro-strain, dislocation density, TGA curve changes, failure characteristics and crack length were comprehensively analyzed using XRD, TGA and SEM after different heating temperature treatments and the underlying mechanisms are also proposed to explain why the microstructure deterioration suffered from thermal damage can significantly influence the macroscopic strength decrease.

2. Samples and Experiment Methods

2.1. Samples Preparation

The samples were extracted by means of a sampling drill from fresh sandstone blocks obtained at Linyi City (Shandong Province, China). Then, according to the ISRM suggested method for determining the indirect tensile strength of rock materials [29], all sandstone samples were cut into flat cylinders of 50 mm in diameter and 25 mm in height, and sample ends were polished carefully by a grinding machine till the deviation ranges of the flatness and roughness were less than 0.5 mm and 0.05 mm, respectively.
XRD analysis (D8 Advance X-ray Diffractometer, Bruker Corporation, Karlsruhe, Germany) represented that the mineralogical components of this kind of sandstone are quartz, albite, calcite, and laumontite (little). In particular, the main grains (0.05–0.2 mm) of this sandstone were quartz and albite, which built the framework components of this kind of sandstone, while the matrix, composed of smaller mineral grains (<0.05 mm) with calcite, which occupied the interstitial spaces between the main grains.
In order to study the thermal damage process at different high temperatures, 10 groups with the same Φ50 × 25 mm cylinders of each sandstone sample were prepared for heating experiments. All the heating treatments were conducted in a high-temperature furnace (CTM-300A series muffle furnace, Coal Chemical Instrument Company, Chengdu, China). The heating process consisted of three steps:
Step 1:
Ten group samples were heated to 10 target temperatures including 25 °C, 100 °C, 200 °C, 300 °C, 400 °C, 500 °C, 600 °C, 700 °C, 800 °C and 900 °C respectively with a ratio of +5 °C/min, according to similar previous works [30,31].
Step 2:
30 min was set to maintain the temperature constant in order for the whole sample to achieve the default state after the target temperature was reached [30].
Step 3:
After the heating treatment, the sample was cooled in the furnace to room temperature (about 25 °C) at a rate of −10 °C/min [32,33].

2.2. Experiment Schemes

Firstly, when all heated sandstone samples had cooled to room temperature (about 25 °C), some typical local areas of these samples were examined to observe the micro-structure deterioration and local failure by using a special SEM instrument (QuantaTM 250, FEI, Hillsboro, OR, USA). The tested samples were trimmed to less than 50 mm and the standard deviations were limited to ±1 mm before the spraying of resin. The polishing surface matrix of each sample was then observed with a magnification 500×. The scanning was performed at an accelerating voltage of 30 kV and working distance of 10–20 mm under vacuum conditions.
Secondly, X-ray tests were conducted using an XRD instrument (D8 Advance X-ray Diffractometer, Bruker Corporation, Karlsruhe, Germany). The XRD instrument has a wide range from a start position of 4° to the end of 80°, and a step size of 0.02°. It can perform a full range of tests to examine crystal structures of powder samples, crystallite size determination, microstrain analysis, residual stress analysis, and preferred orientation. Therefore, in our experiments it can determine lattice constants, FWHM, microstrains, and dislocation density. The sample was crushed to be powdery with the grain size less than 400 mesh. Each sample was observed and analyzed by the help of the software that came with the XRD instrument. The main parameters of the instrument and test condition are listed in Table 1.
Finally, the thermal gravimetric analysis (TGA) was performed to acquire the chemical, mechanical and resistance behaviors after heating treatment using a TGA analyzer (STA409C, Netzsch Co., Ltd., Selb, Germany). The records of weight loss with temperature can be obtained automatically with its data acquisition system. In our experiment, all powdered samples were placed in a platinum holder and the tests were carried out in an inert environment. Meanwhile, the temperature rate was controlled with 5°C/min in order to coincide with the heat treatment applied to the sandstones. The gas flow rate was set at 100 mL/min.

3. Results and Analysis

3.1. X-ray Diffraction (XRD) Pattern Results

The mineralogical composition of the sandstone is presented in Figure 1. The influence of temperature on minerals can be explored by observing the changes of lattice parameters and the reactions of mineral [31,34,35]. Based on the disappearance of peaks in the XRD patterns, two reactions happened:
(1) Calcite. A significant crystal surface peak (1 0 1 ¯ 4) disappeared at the temperature of 900 °C. The decomposition of calcite has been studied broadly and a commonly accepted viewpoint is that calcite will react between 700 °C and 800 °C [36,37]. This (1 0 1 ¯ 4) crystal peak became weaker at 800 °C and disappeared at 900 °C;
(2) Laumontite. Three visible crystal surface peaks (namely, (1 1 0), (2 0 0) and (1 3 0)) are observed to disappear when the temperature reached 500 °C. This can be explained as follows: laumontite should decompose in a temperature range of around 360–370 °C [38,39]. Because the three peaks tended to be weaker at 400 °C than the previous low temperature states it reveals that the decomposition of laumontite indeed happened but was not finished. We can find that a typical peak appears at 400 °C at about 10.3° due to the decomposition product of laumontite [40]. As the temperature increases, the intensity of this product peak firstly tends to display an increase from 400 °C to 600 °C, and then a decrease from 600 °C to 800 °C until it totally disappears at 900 °C.

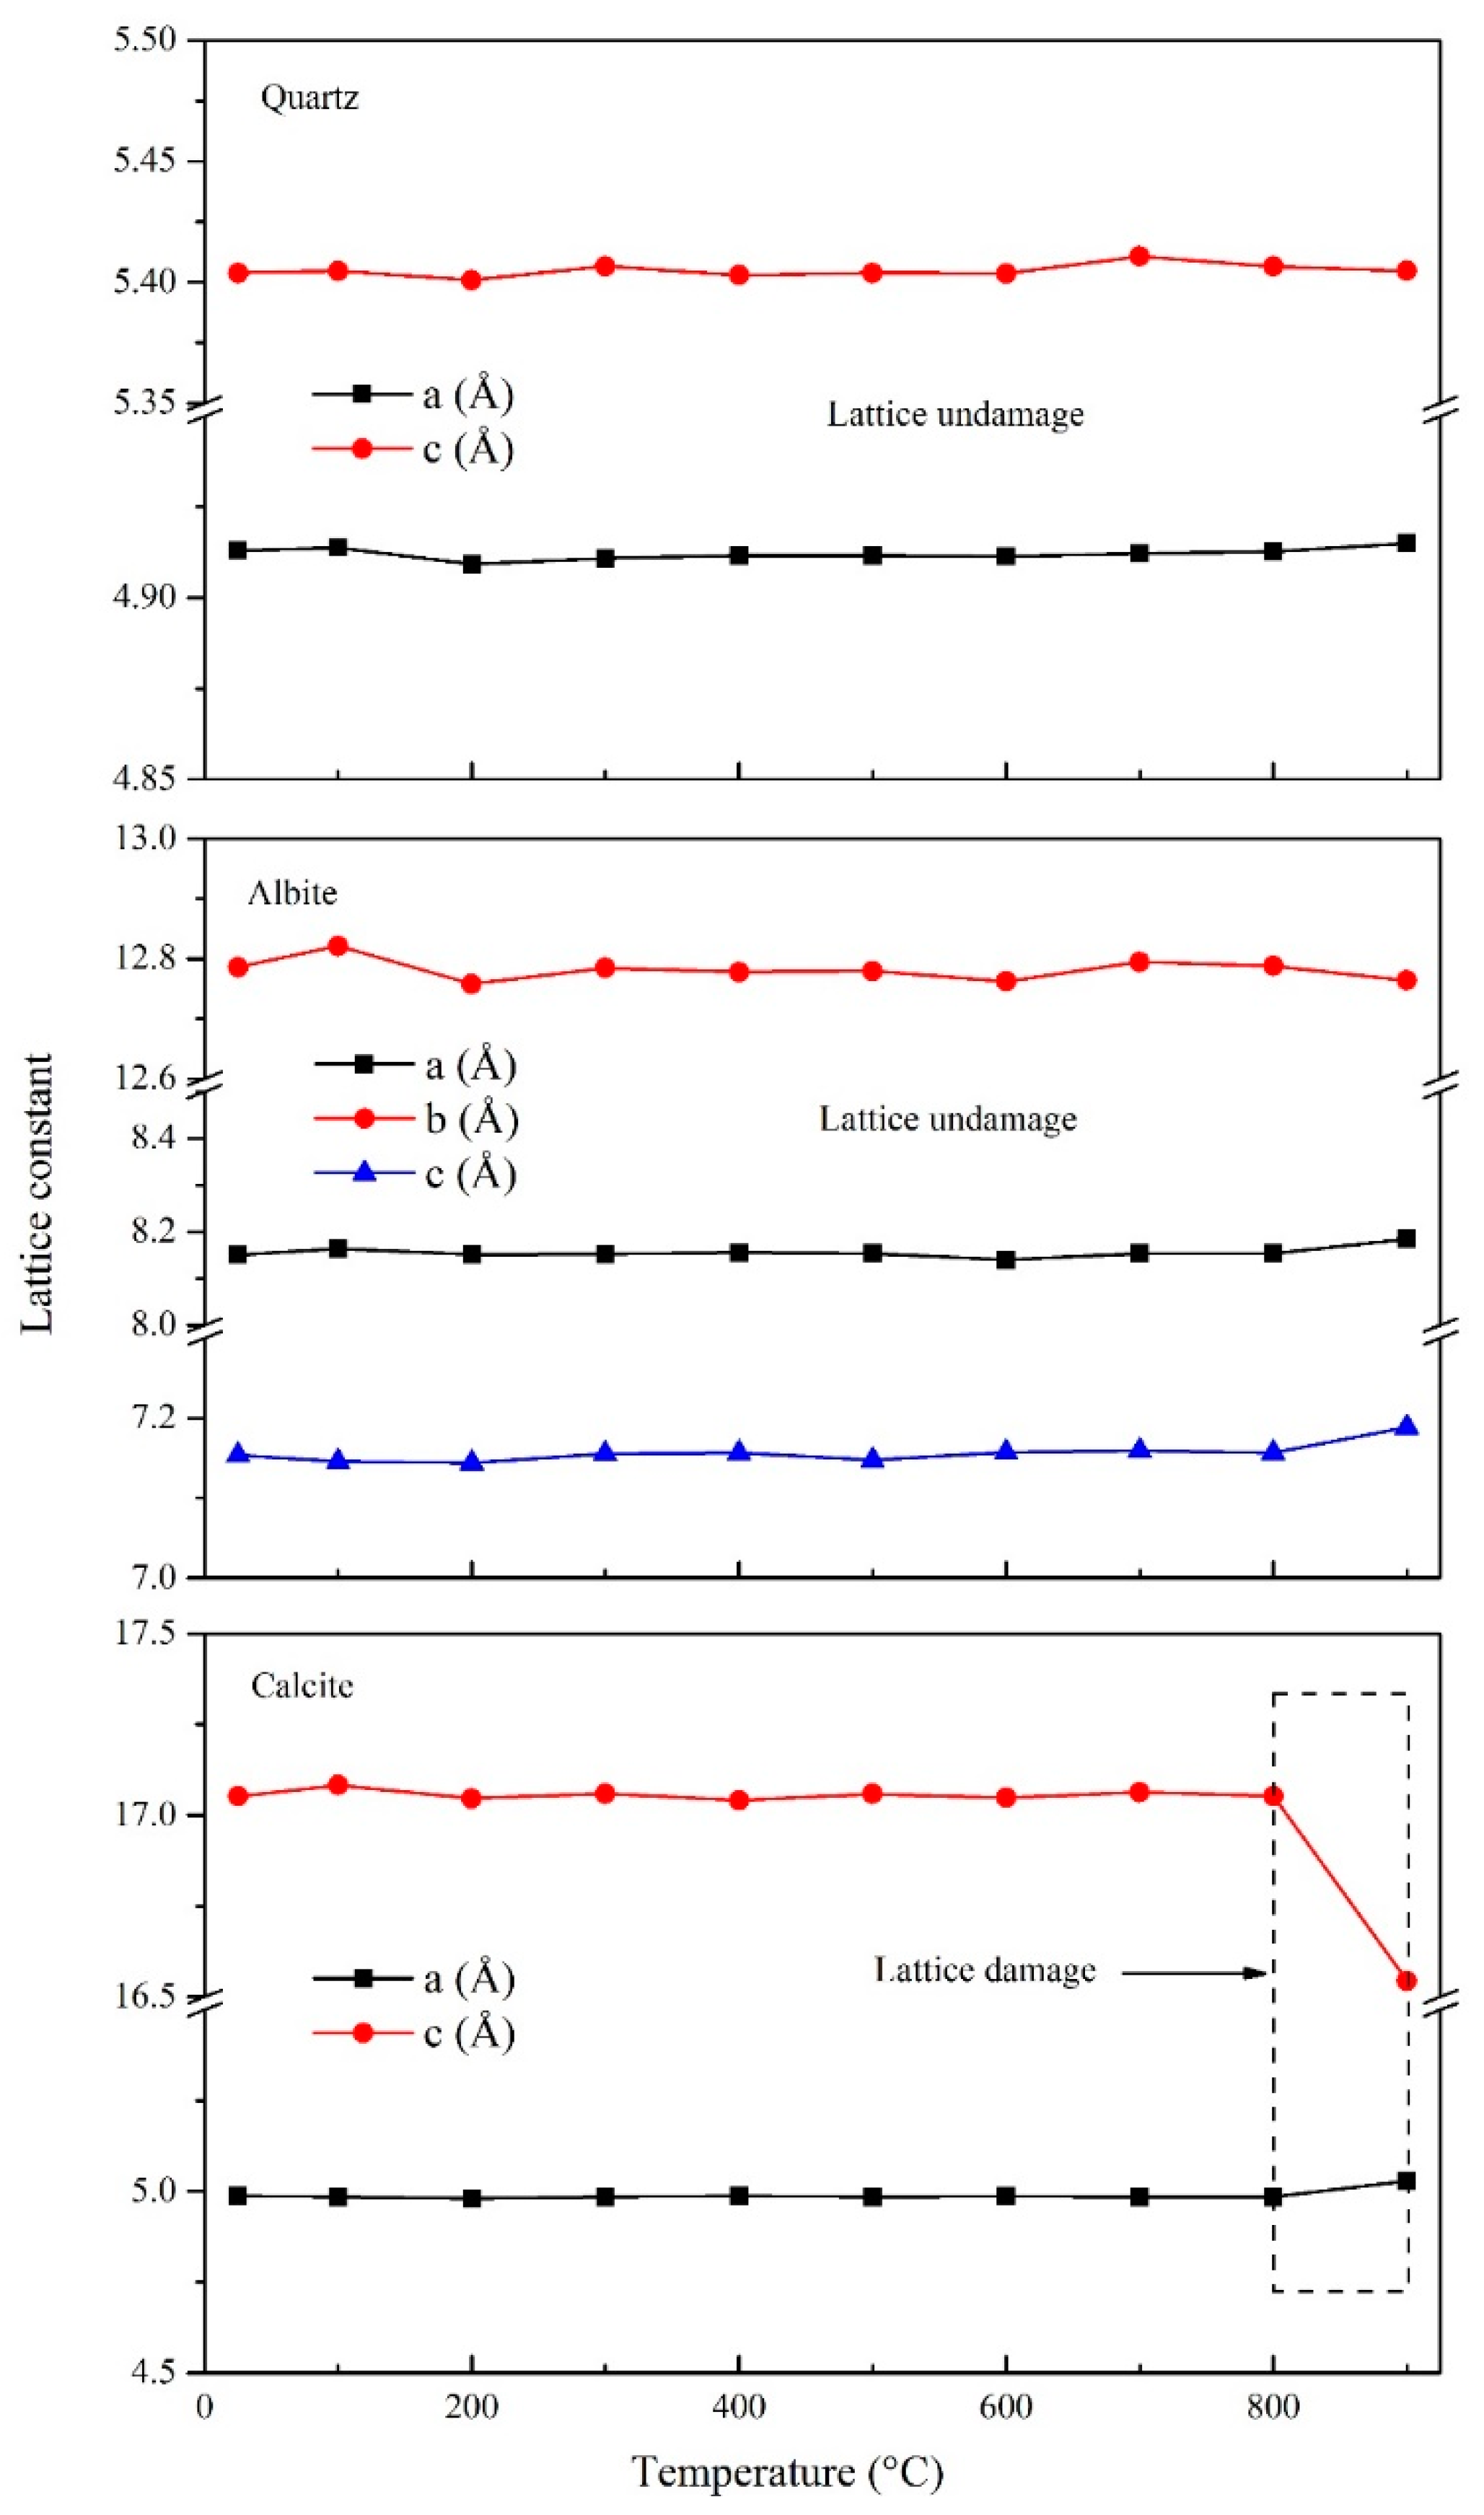
3.2. Lattice Constant Results

Sandstone, as a typical sedimentary rock, is generally formed by sedimentation, compaction and digenesis. Therefore, the mineralogical composition of sandstone is determined dominantly by the original minerals of its mother rock. Once the crystal structure is formed, the lattice structure barely changes regardless of the subsequent geological evolution [41]. However, in this case, the lattice structure will undergo a great change after the mineral decomposition. Usually, the lattice constant, which is composed of the indexes a, b, c, α, β, γ, is a comprehensive parameter used to express the distance and angle among all of atoms in these minerals [41,42]. Herein, some typical lattice a, b and c constant indexes of quartz, albite and calcite can be obtained from the comparison between the software test results and the standard crystal diffraction pattern [43]. The detailed changes of a, b and c with temperature are presented in Figure 2.
It can be observed that the processes of expansion and rotation among mineral particles under changing temperatures caused significant changes in the lattice constants. According to previous work [23], the lattice constant a, b and c commonly increase during high temperature processes, but in this experiment, the lattice constants of quartz and albite remained at the same level regardless of the different temperatures. Moreover, the lattice constants of calcite even displayed some remarkable decreases in the range from 800 °C to 900 °C. A reasonable explanation could be that the decomposition of calcite destroyed the crystal structure and this resulted in a drastic decrease of parameter a [36]. However, the lattice constants of quartz and albite do not change even though the quartz has undergone a phase transition around 573 °C [44]. Therefore, it is concluded that the crystal structures of most minerals are not only commonly destroyed by high temperature conditions, but this also causes the lattice constants to change, but there always tends to be a significant decrease once the phenomenon of mineral decomposition happens.

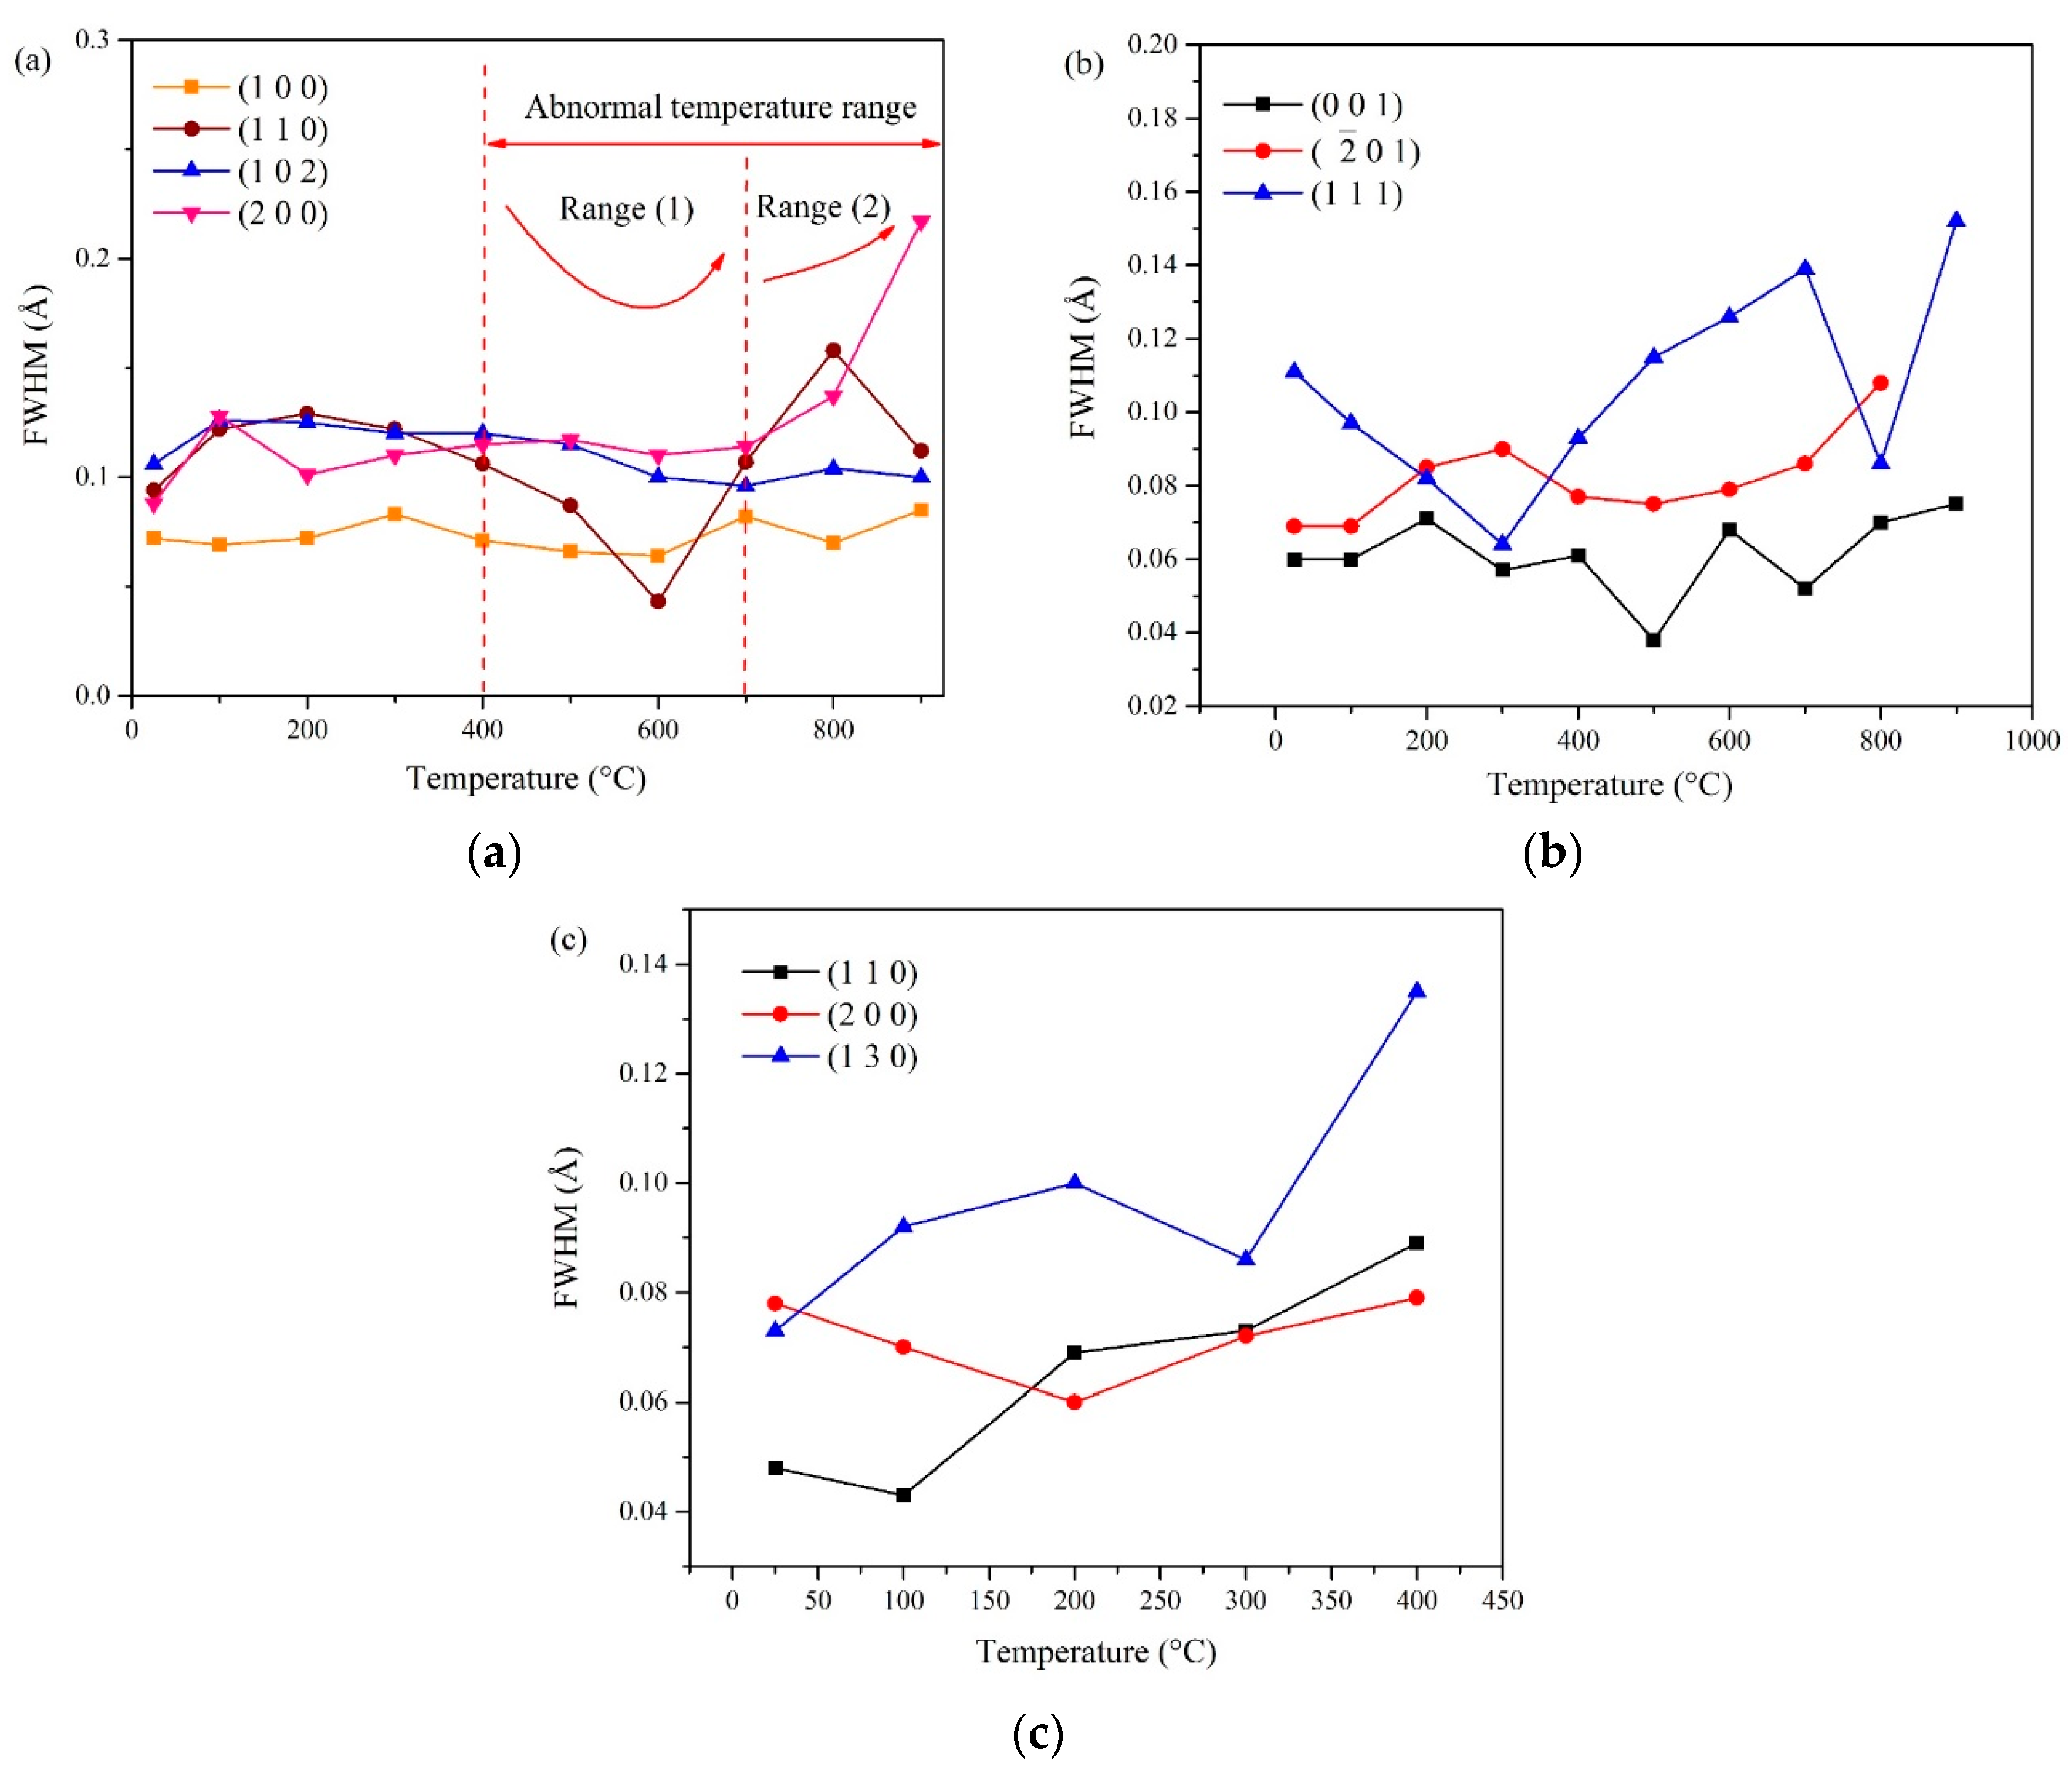
3.3. Diffraction Widening Results

It is also notable that the XRD pattern diagrams are composed of most smooth lines and bits of leap peaks. In order to express the extent of the function given by the difference between the extreme peak points of two crystal lattices, the Rietveld-RIR method was adopted to analyse the quantitative parameters of the XRD patterns [45,46]. Firstly, a parameter, full width at half maximum (FWHM), is adopted to reflect its respective diffraction widening of these minerals by the software that came with the XRD instrument. The FWHM of each peak is usually influenced by the instrument, subgrain size and microstrain [47]. In this work, the diffraction widening caused by the instrument can be eliminated automatically by the XRD software. Thus, the influencing factors due to the sample itself can be analyzed in the next process. Figure 3 shows the FWHM of quartz, albite and laumontite at different temperatures.
As shown in Figure 3a, the FWHM of quartz changes significantly in the (1 1 0) and (2 0 0) directions, but remains the same in the (1 0 0) and (1 0 2) ones. Especially, the FWHM of quartz is relatively low in (1 1 0) at the temperature range from 400 °C to 700 °C, but increases in the (2 0 0) orientation from 700 °C to 900 °C. Meanwhile, the FWHM of albite displays a minor change, with only slight increases in the (0 0 1), ( 2 ¯ 0 1) and (1 1 1) directions as the temperature increases, as shown in Figure 3b. Relatively speaking, the FWHM of laumontite tends to increase slightly in the two points (1 1 0) and (1 3 0) as seen in Figure 3c. In general, the FWHM values of the quartz, albite and laumontite exhibit either no change or increases with increasing temperature. Therefore, the diffraction widening of the kind of sandstone samples possesses anisotropy characteristics during the heating treatment.
Furthermore, different from strain, microstrains reveals the strain in crystals caused by the stress inside the material due to inhomogeneous plastic deformation. The existence of micro-strain usually results in the widening of these XRD peaks. The micro-strain ε is given by [48]:
ε = β G f 4 tan θ
wherein β denotes the integral breadth, the subscript G denotes the Gaussian components, the superscript f denotes the structurally broadened profile and θ is the Bragg angle of the diffraction peak.
Figure 4 shows the microstrain curves of quartz, calcite and albite. In the case that the minerals do not transform or decompose, the microstrain increases with increasing temperature and exhibits the so-called “memory” of the crystal form [49], i.e., it remains at the highest level even with decreasing temperature, but in other cases where the mineral transforms or decomposes, the microstrain decreases drastically, as demonstrated in quartz and calcite. It is well known that 573 °C is the phase transition temperature at which quartz transforms into β-quartz [50,51,52,53]. Therefore, the microstrain of quartz decreases drastically in the temperature range of 400–600 °C, which is an essential reason for the FWHM value decrease observed in Figure 3a. Calcite decomposes in the temperature range of 700–800 °C, under which the microstrain of calcite drops [36].

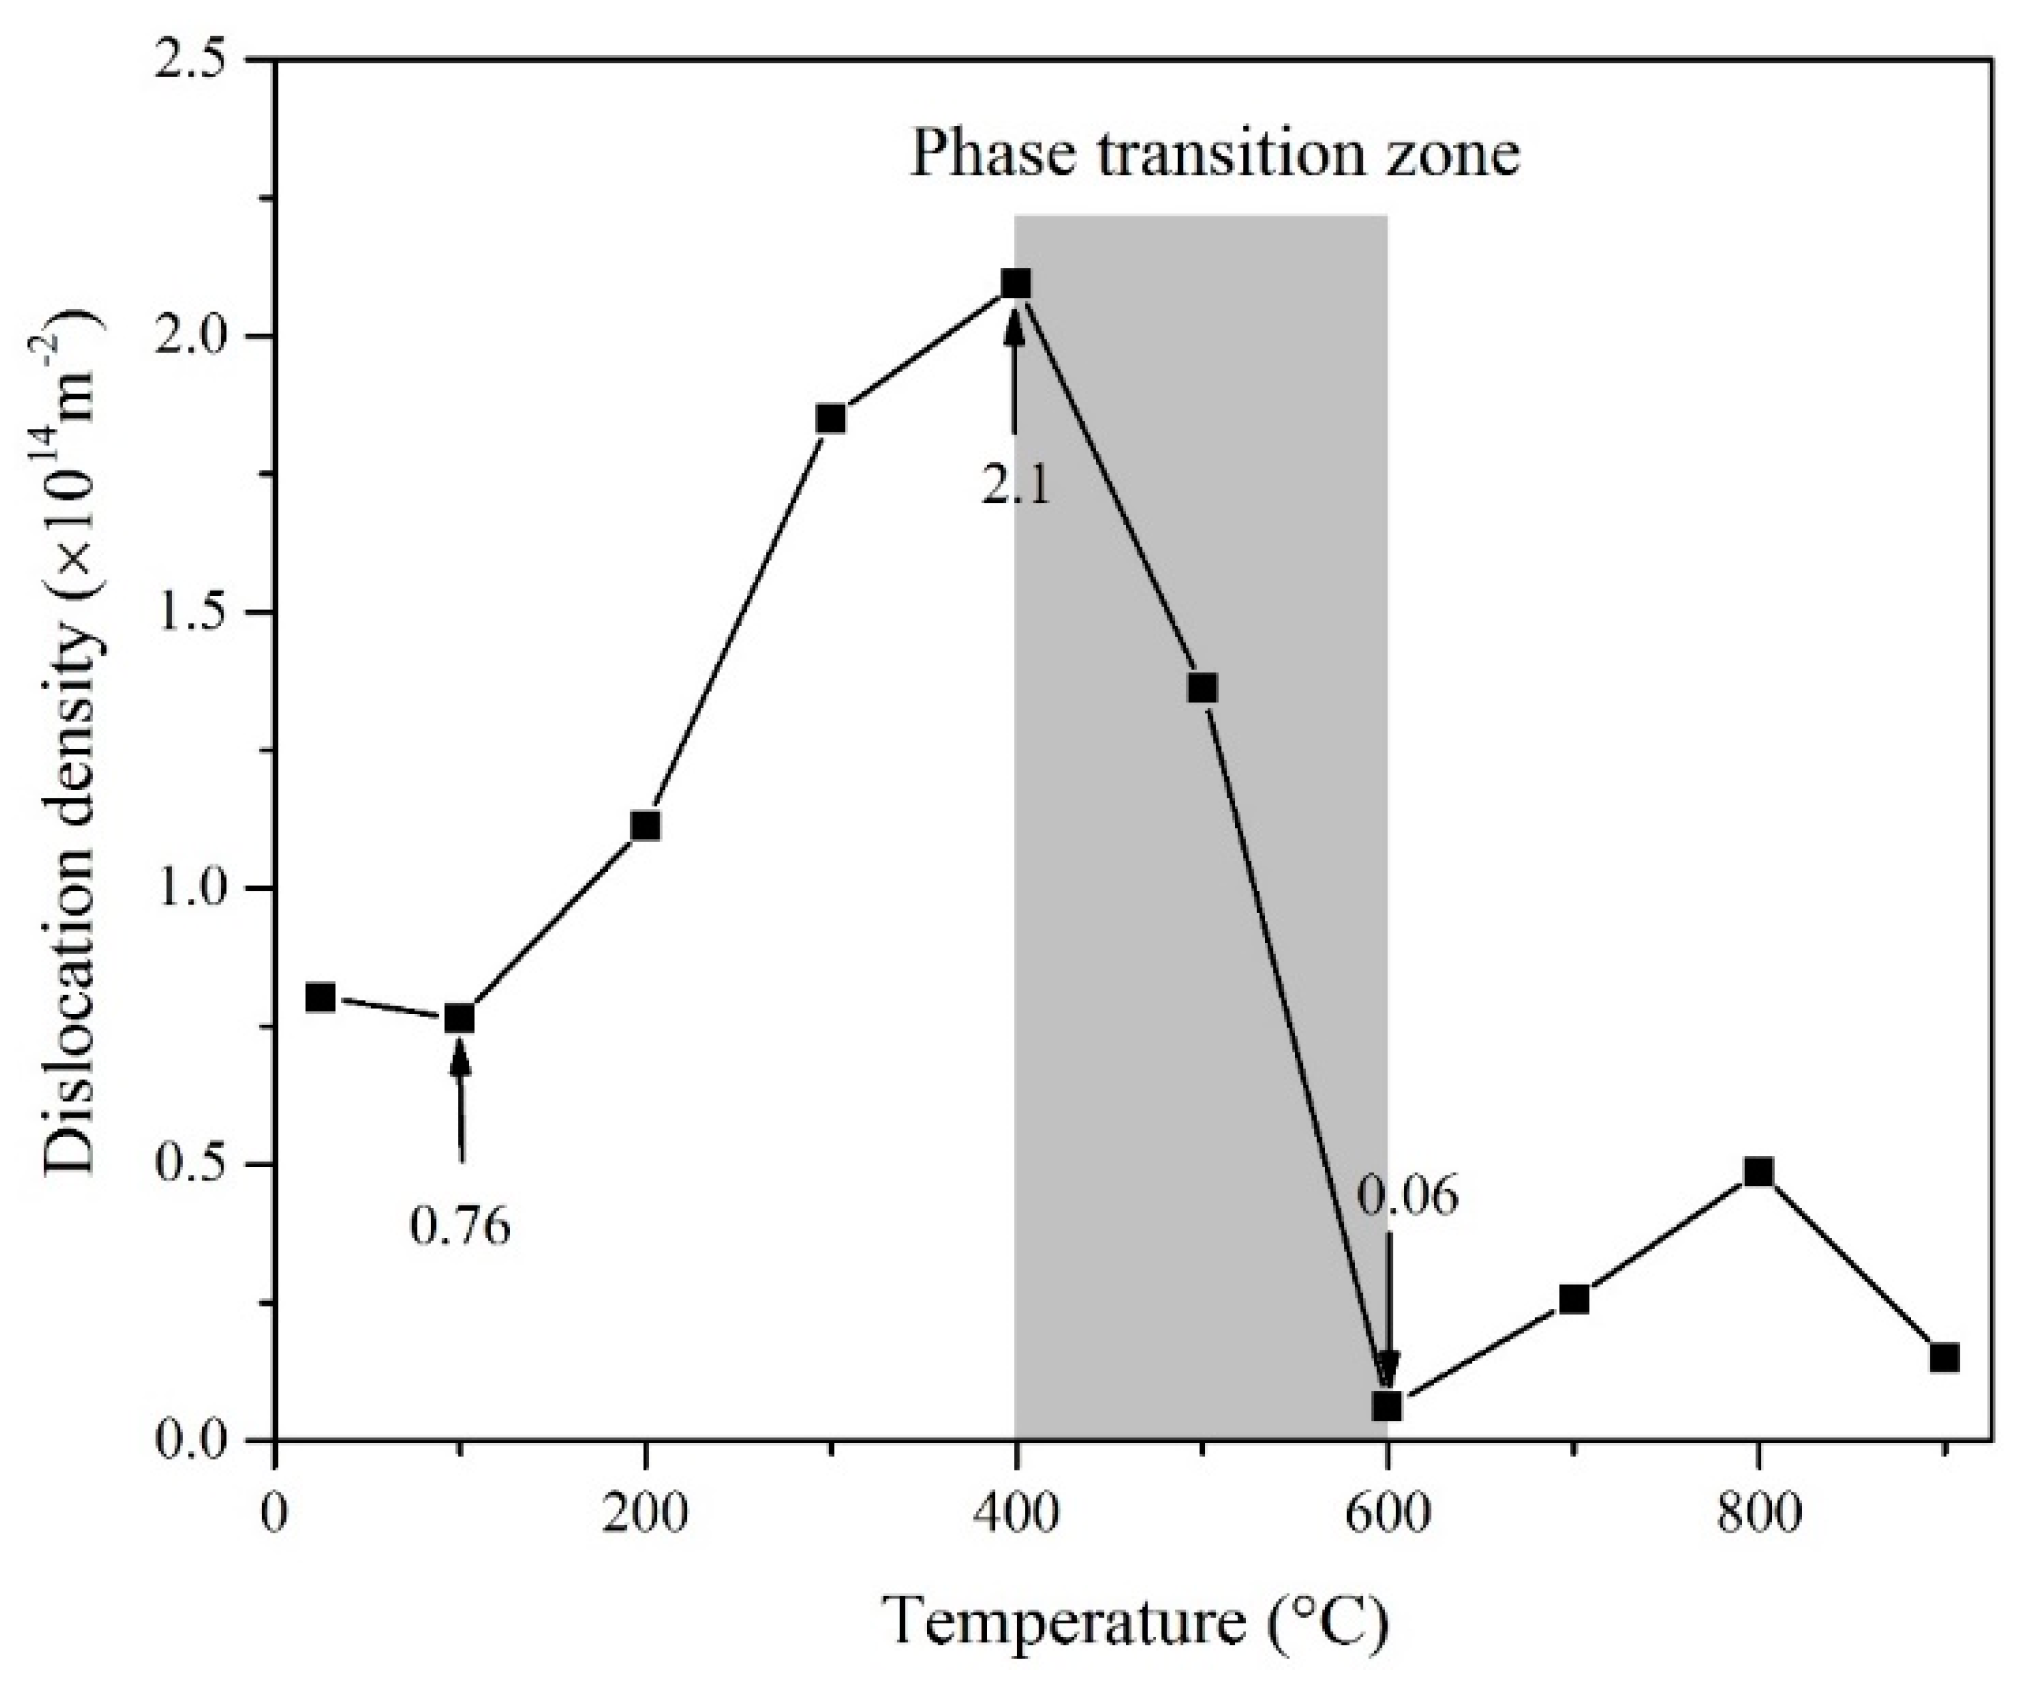
3.4. Dislocation Density Results

Dislocation density is defined as the total dislocation length per unit volume of material, which expresses the degree of crystal lattice distortion. Commonly, dislocation density is calculated by Williamson’s method [54]:
ρ = 3 2 π ε 2 0.5 D b
where, ε 2 0.5 is the average micro-strain value, and b is the Burgess vector of dislocation. D is the average domain size of these XRD peaks, it can be calculated by the recommendation formula from Langford’s study [49] as:
D = λ β C f cos θ
wherein, λ is the X-ray wave-length and C is the Cauchy component.
Figure 5 shows the dislocation density changes of quartz with increasing temperature. The dislocation density barely changes at low temperatures below 100 °C, while it shows a significant increase from 0.76 × 10¹⁴ m−2 at 100 °C to 2.1 × 10¹⁴ m−2 at 400 °C, which reflects the bonding strength of quartz crystals with other minerals generally decreases and leads to the plastic behavior of degraded sandstone. The sandstone samples gradually become fragile from plastic with the increase of temperature during this period. However, when the temperature increases beyond 400 °C, the dislocation density presents a remarkable drop from 2.1 × 10¹⁴ m−2 to 0.06 × 10¹⁴ m−2 until the heating temperature reaches 600 °C. The temperature interval is consistent with the phase transition zone of quartz from α- to β-form [50,51,52,53]. The phenomenon reveals that the phase transition of quartz can cause the dislocation density to decrease and lead to the hardness and strength of sandstone falling rapidly.

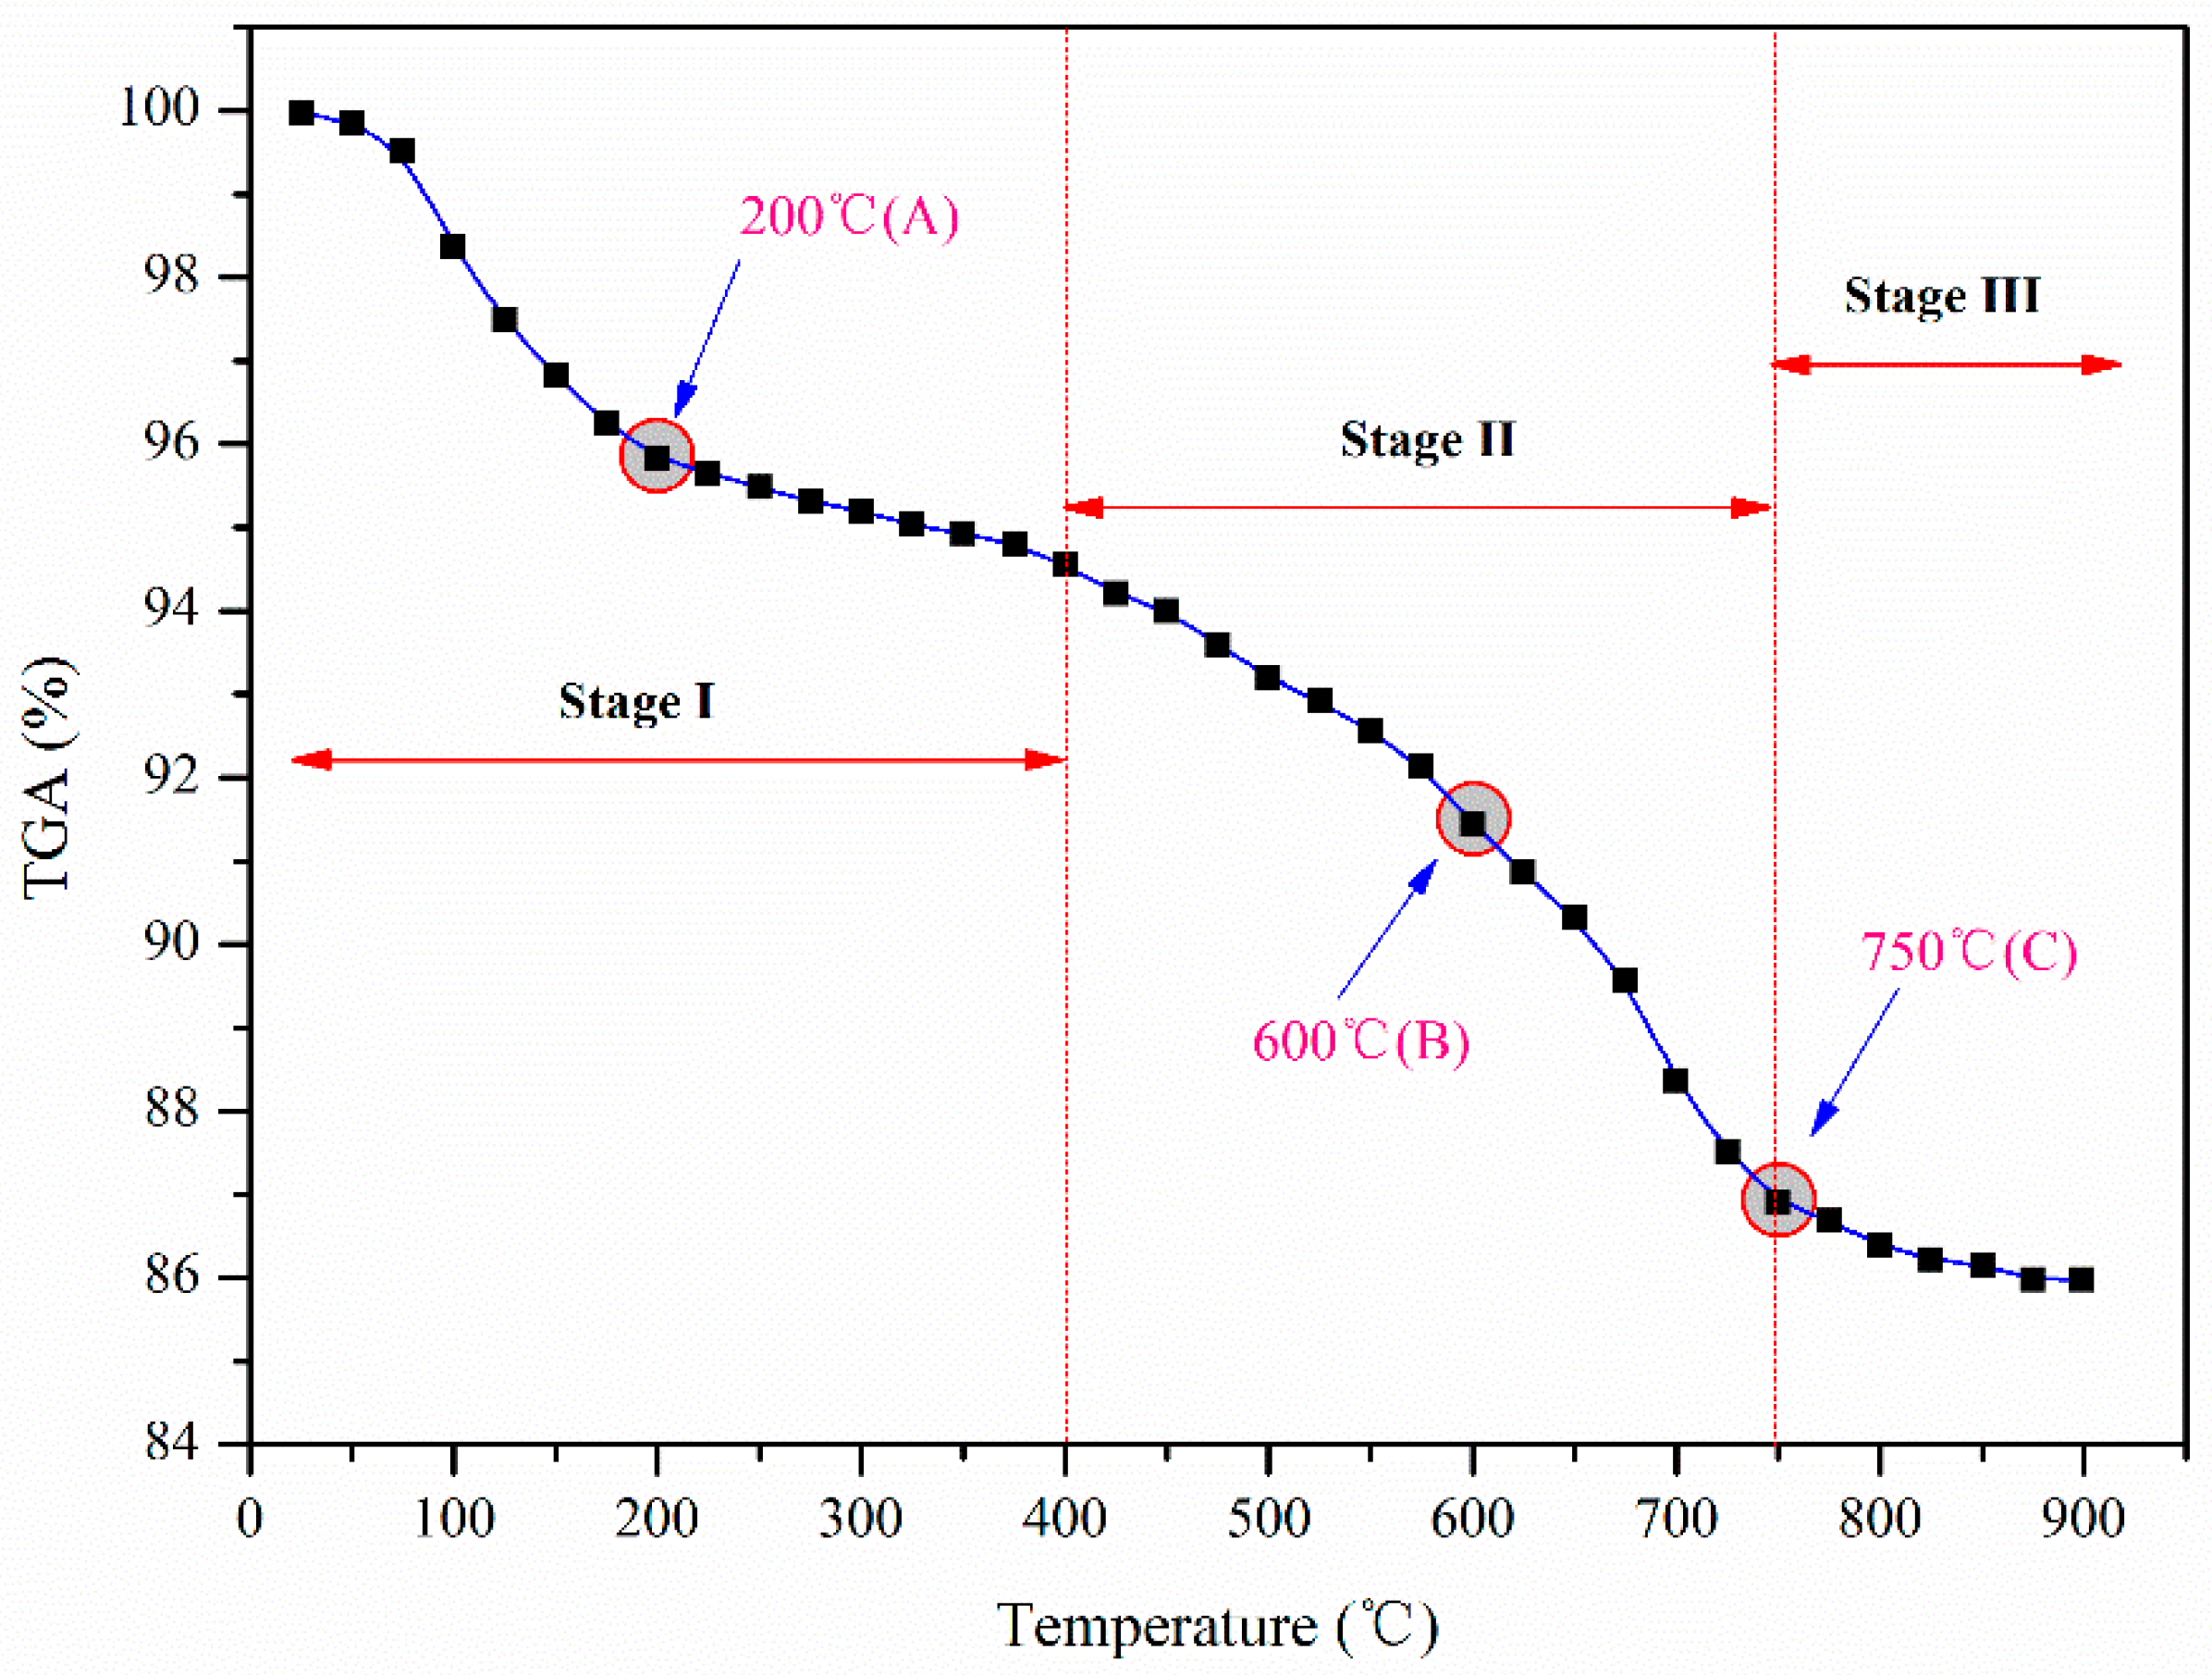
3.5. TGA Curve Analysis

The TGA curve variation was examined to observe the influence of temperature on mass loss during heating treatment (Figure 6). Three stages can be identified as the TGA curve changes:
Stage I: During the heating from room temperature to 400 °C, the mass loss can be attributed to the pore-water evaporation and hydration reactions. The absorbed water, bounded water, and a little mineral water existing in the voids or original defects would generally escape during this period [55]. According to Figure 6, free water would escape at around 80–200 °C (point A), and the TGA curve presents a remarkable decrease of about 4%. Meanwhile, the bounded water and structural water should escape between 200 °C and 400 °C. The loss of structural water of mineral would cause the loss of hydroxyl bonding (–OH), and led to the damage of the mineral lattice skeleton [56]. However, the amount of hydration product water loss (about 2%) is much less than the free water evaporation.
Stage II (400 °C to 750 °C): Carbonates and organic materials of sandstone are decomposed to oxides, carbon dioxide and water when the temperature exceeds 400 °C, and the resulting TGA curve shows a sharp decline of about 8%. Thermal decomposition reactions of minerals such as dolomite/ankerite, magnetite, illite and kaolinite would occur at the range of 500 °C to 600 °C [57]. Mackenzie [57] also found that the mass loss had a great decrease due to CO2 loss from the decomposition of calcium carbonate. Furthermore, quartz suffers a phase transformation from the α- to the β-form, which would result in a severe TGA curve decline of sandstone after the threshold temperature reaches about 600 °C (point B).
Stage III (above 750 °C): The TGA curve changed to show a slow decrease ratio of 1% after 750 °C (point C). It means the mass loss of sandstone does not undergo a continuous decrease although chemical reactions still occur.

3.6. Temperature-Dependent Failure Characteristics

In order to study the effects of microstructures on the fracture mechanism of the initial flaws of sandstone at different high temperatures, some typical SEM images of sandstone samples after different temperature treatment such as 25 °C, 200 °C, 400 °C, 600 °C, 800 °C were collected under a magnification of 500× (Figure 7). In addition, morphological sketches of the SEM images were obtained by using an image manipulation software named Pores and Cracks Analysis System (PCAS) [58]. The PCAS is a professional software used to quantify pore and crack systems in SEM images, and it can automatically identify various pores and cracks. The extracted sketches of cracks’ aggravation with temperature can be illustrated as seen in Figure 8.
Some change rules can be observed from Figure 7 and Figure 8: (1) the surfaces of minerals generally tend to become rough with rising temperature. The boundaries of mineral crystals are apparent and the adhesive behaviors among these particles seem to be good till to 200 °C. However, the surfaces then become bumpy and even cause the crystals to be broken. Many fragments stripped from the matrix begin to appear on the surface or the boundary around big crystals when the temperature exceeds 400 °C. The grain size changed to become small and fractures between particles are apparent till 800 °C. This means that a debonding process of mineral particles has happened as the temperature ranges from 400 °C to 800 °C; (2) The number of surface cracks tends to increase along with temperature increases and especially over 400 °C (Figure 8). Meanwhile, The cracks change not only in number but also in connectivity and length once the temperature reaches to 400 °C. The cracks connect each other mainly along with the boundaries of particles and as a result the crystals separate at the early stage (400 °C → 600 °C). All of these inter-granular fractures can be attributed to thermal stress differences among different kinds of minerals. However, more and more cracks appear throughout the internal crystal structure and this leads to an increasing matrix breakage with temperature. The phenomenon of microstructure deterioration seems to be more significant under the elevated temperature conditions beyond 600 °C. These trans-crystalline cracks result from thermal deformation of crystals, and their failure surfaces always appear to be relatively smooth. Essentially, their propagation mechanism represents mainly a shear rupture along the slip plane, which is much different from the inter-granular cracks occurring at the early heating stage below 600 °C.
In order to demonstrate the significant influence of the crack extension process on the microscopic strength, the total length of cracks developed in the SEM image surface as a function of temperature was calculated, while the peak strengths of sandstone samples were also tested at the same temperature points. Figure 9 exhibits the comparison results between the peak strength and the total length of cracks. There exists a good negative correlation for the both parameters with temperature. In other words, the peak strength tends to show a remarkable decrease during the stage of rapid generation of cracks. In particular, the decreasing amplitude of the peak strength is most obvious during the phase transition zone of quartz from α- to β-form ranging from 400 °C to 600 °C. However, the overall crack length seems to not increase rapidly in the range of 500 °C to 600 °C although the peak strength still drops quickly.

4. Discussion

It is obvious that sandstone samples undergo microstructure deterioration during the heating process from 25 °C to 900 °C. It is worthy to understand the background reasons why this microstructure deterioration can cause a strength decrease at elevated temperature, and it is also meaningful to control the hazards in high-temperature deep mines and exploit the geothermal energy of hot dry rocks. However, the background reasons causing the thermal damage at different temperature intervals are very different. In the further discussion, the underlying mechanism is analyzed based on the above microscopic experiments. In total, three reasons can be concluded for different temperature intervals based on the XRD, SEM and TGA experiments.
(1)
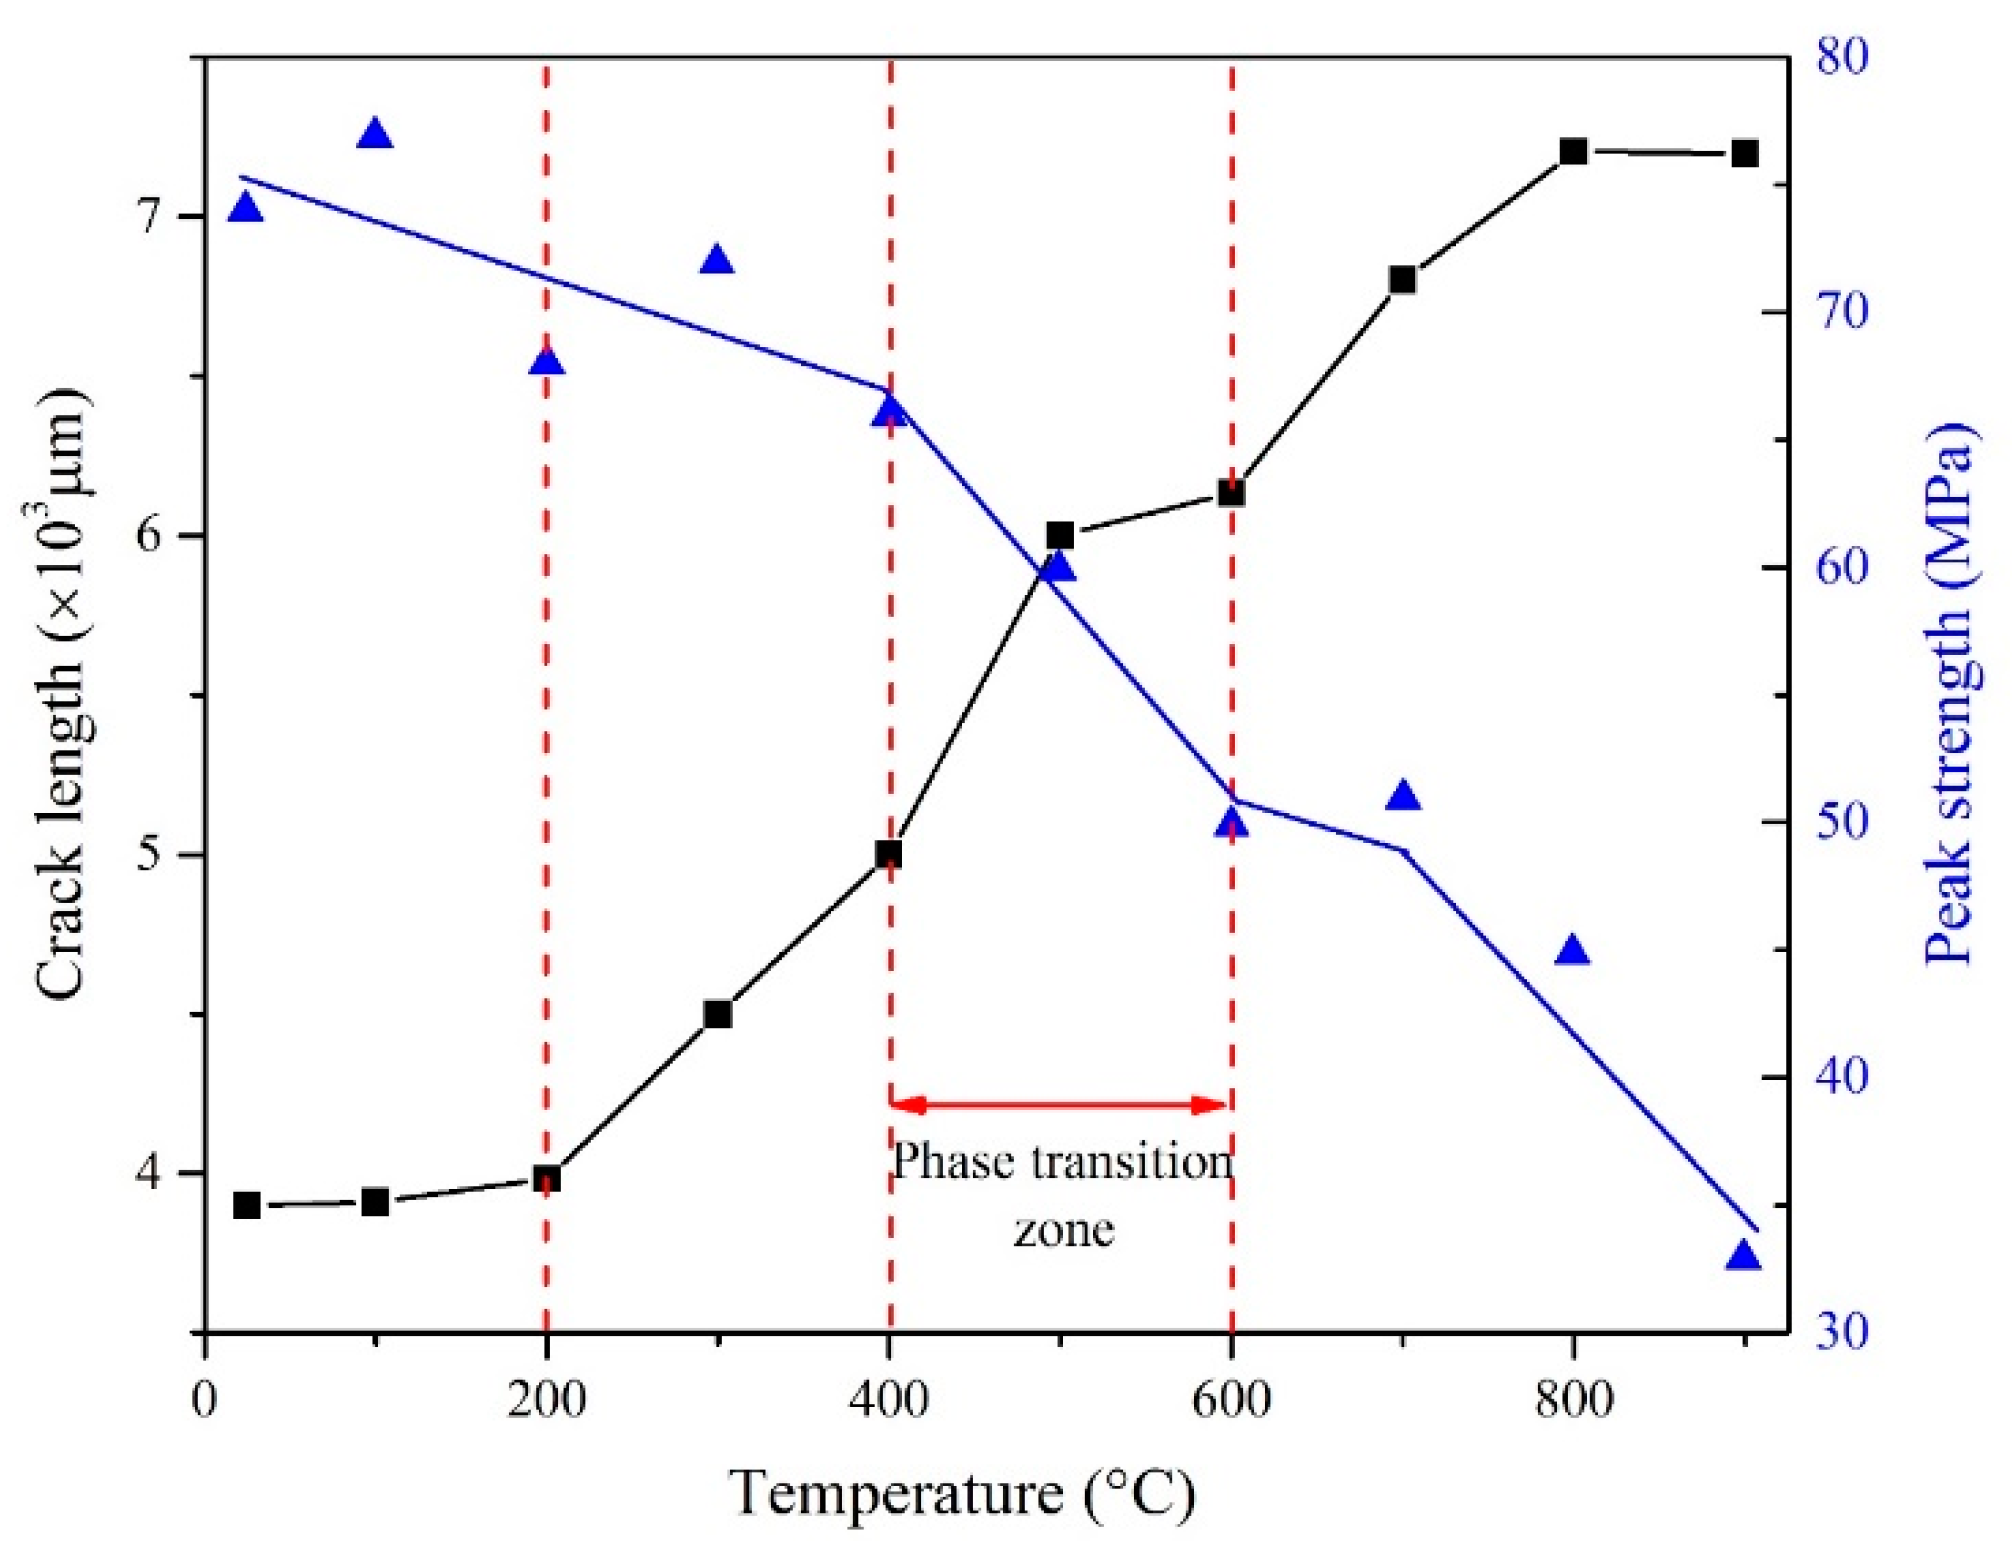
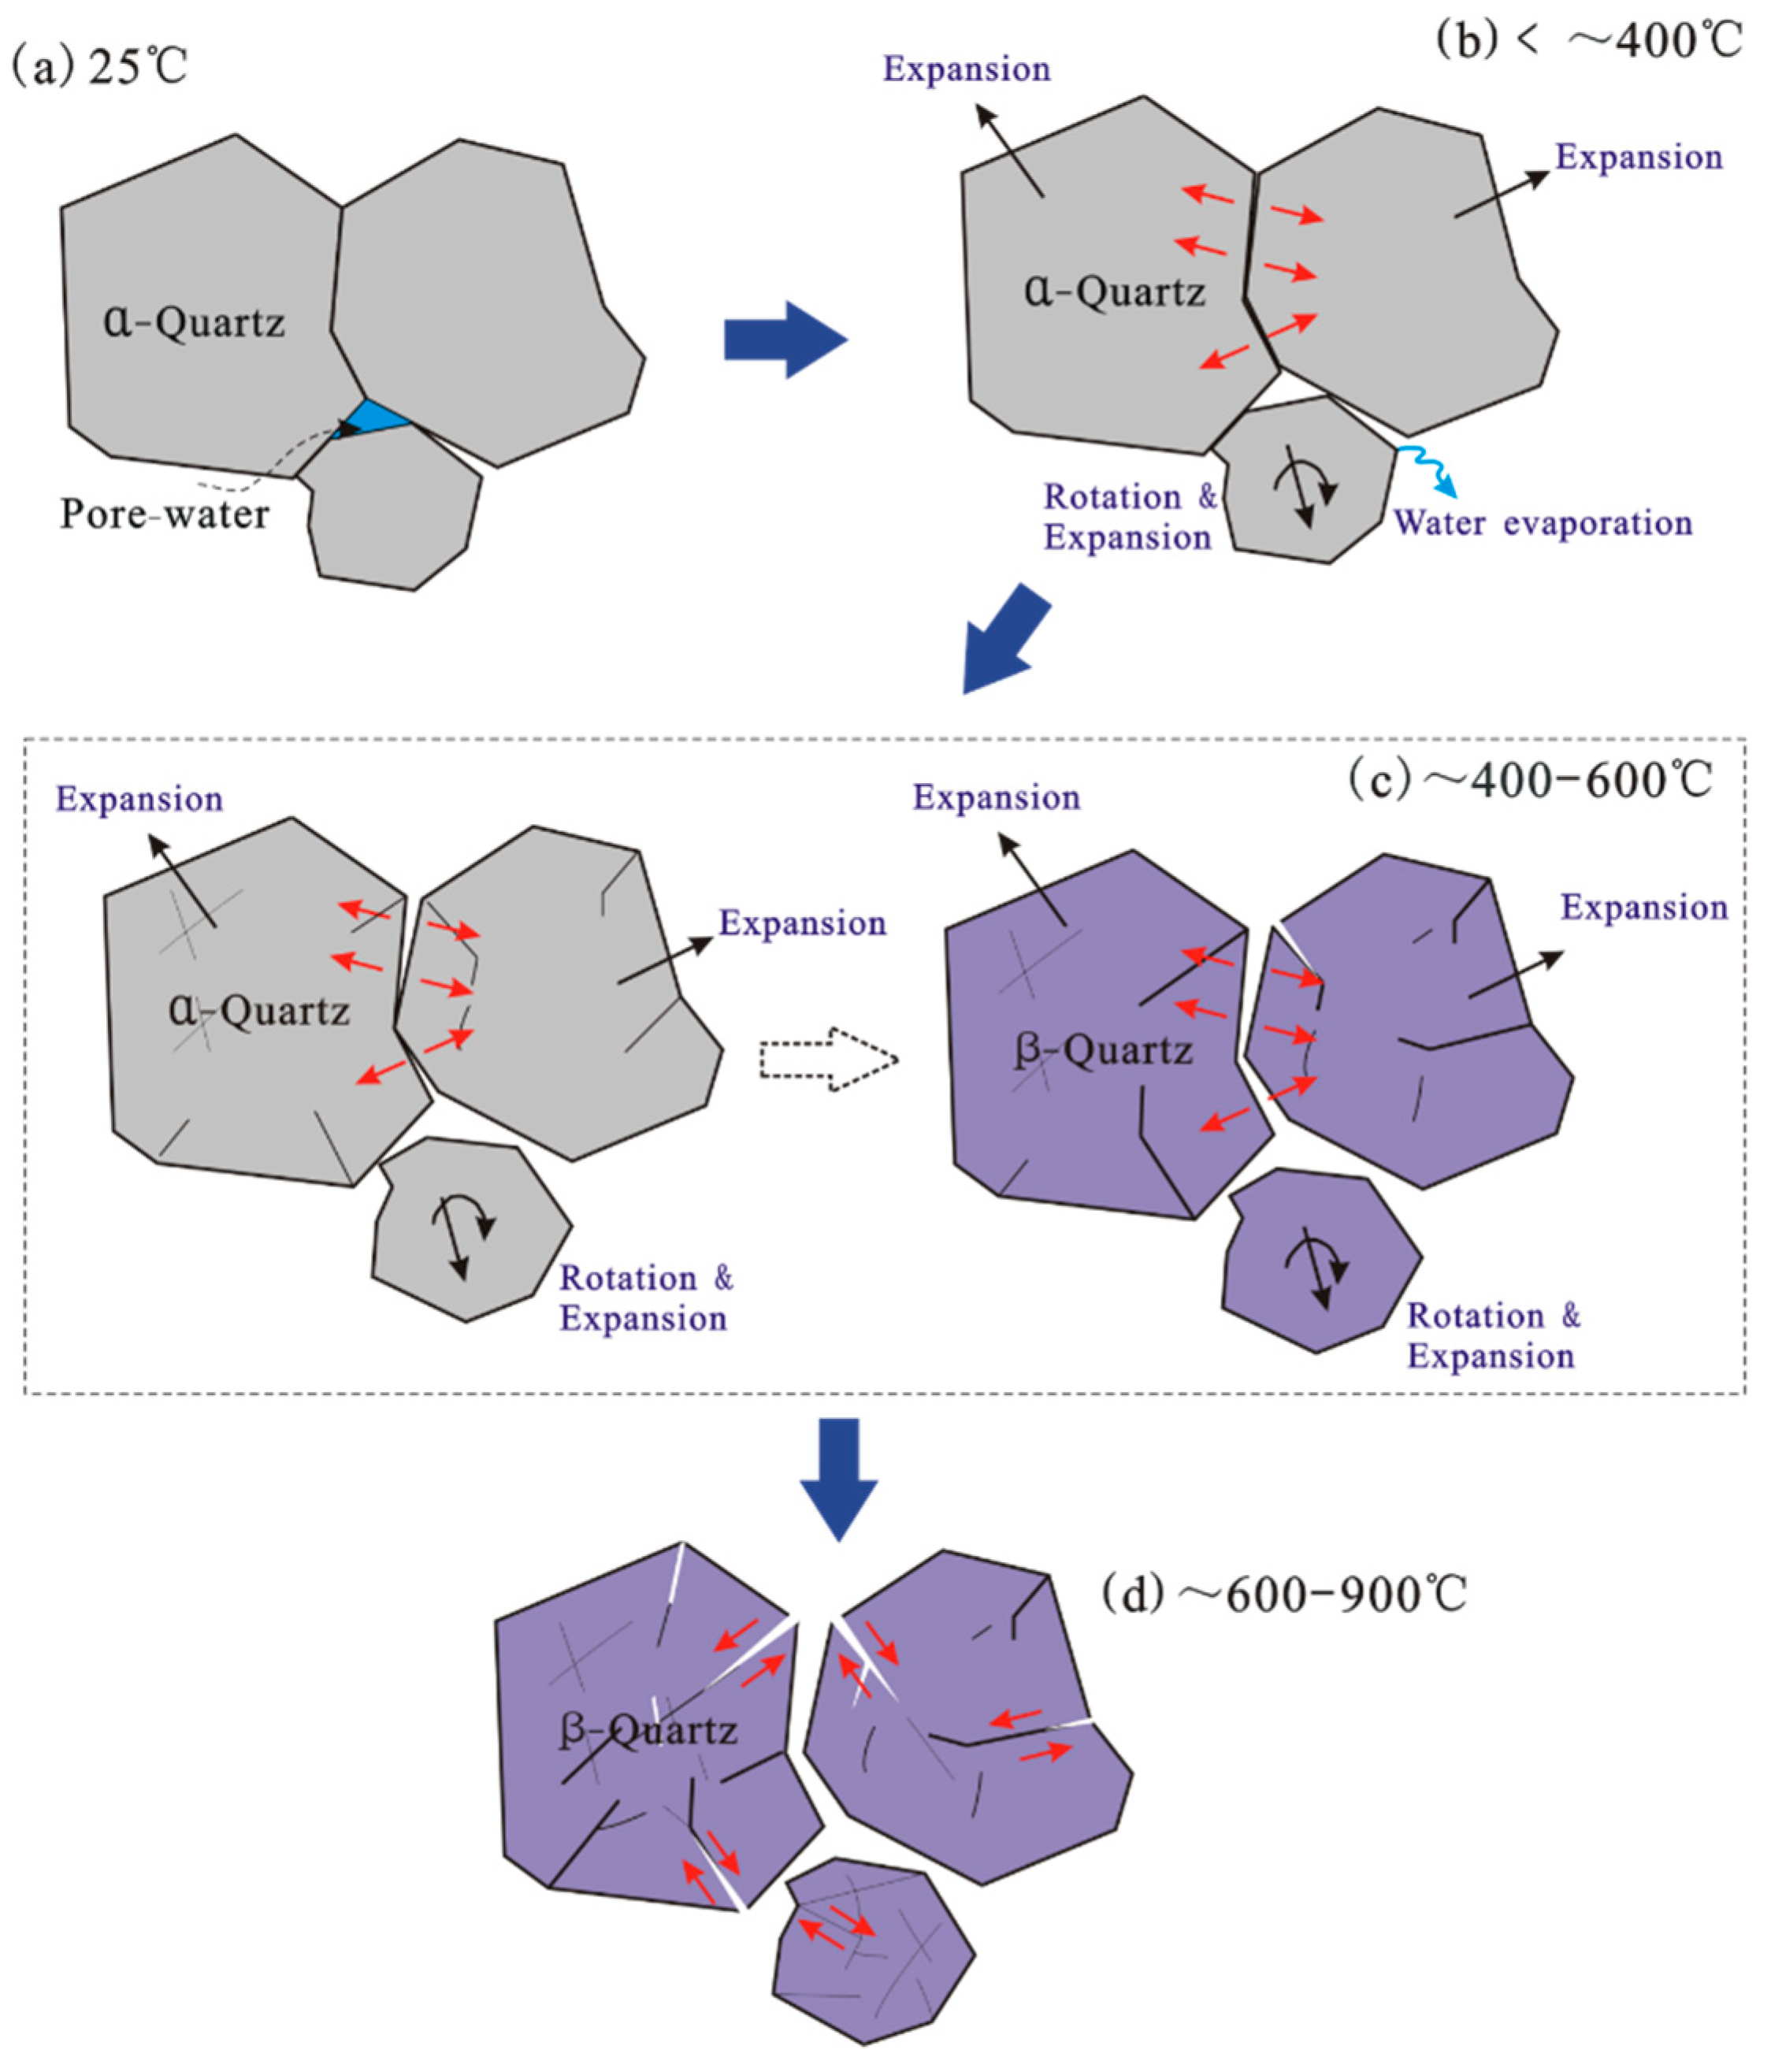
Thermal stress. The mineral particles would undergo a volumetric expansion as the temperature rises [32,33]. Due to the volumetric change and anisotropic expansion or rotation characteristic of different minerals, the interface of particles would suffer thermal stress, which may cause a debonding failure when the stress exceeds the interface yield stress at certain temperature points. For the sandstone samples tested in this work, the threshold temperature can be regarded as 400 °C. We can observe the microstructure began to degenerate obviously at this temperature point no matter what parameters from XRD patterns, lattice constants, diffraction widening, microstrain, dislocation density, or even TGA curves and failure characteristics of SEM images are considered (Figure 1, Figure 2, Figure 3, Figure 4, Figure 5, Figure 6, Figure 7 and Figure 8). Meanwhile, Figure 9 also verifies the conclusion that the total length increase of cracks tends to be more remarkable when the temperature rises beyond the threshold 400 °C. Of course, during the early stage from 400 °C to 600 °C, the fractures can be classified as inter-granular splitting cracks. The influence of thermal stress in the periphery of crystals is well-explained by means of Griffith’s initial fracturing criterion [59]. Commonly, crack propagation deviates from the boundary of crystals, and then turns to the direction of the maximum of thermal stress rapidly, which causes the fracture surface to be rough for these Griffith’s cracks [60]. In addition, the evaporation process of free water, bounded water and structural water existing in the original defects (pores or voids) mainly occurs below the threshold temperature point 400 °C [61]. The water evaporation (seen in Figure 6), happened in the original defects, and provides enough deformation space and aggravates the thermal expansion of mineral particles to be persistent.
(2)
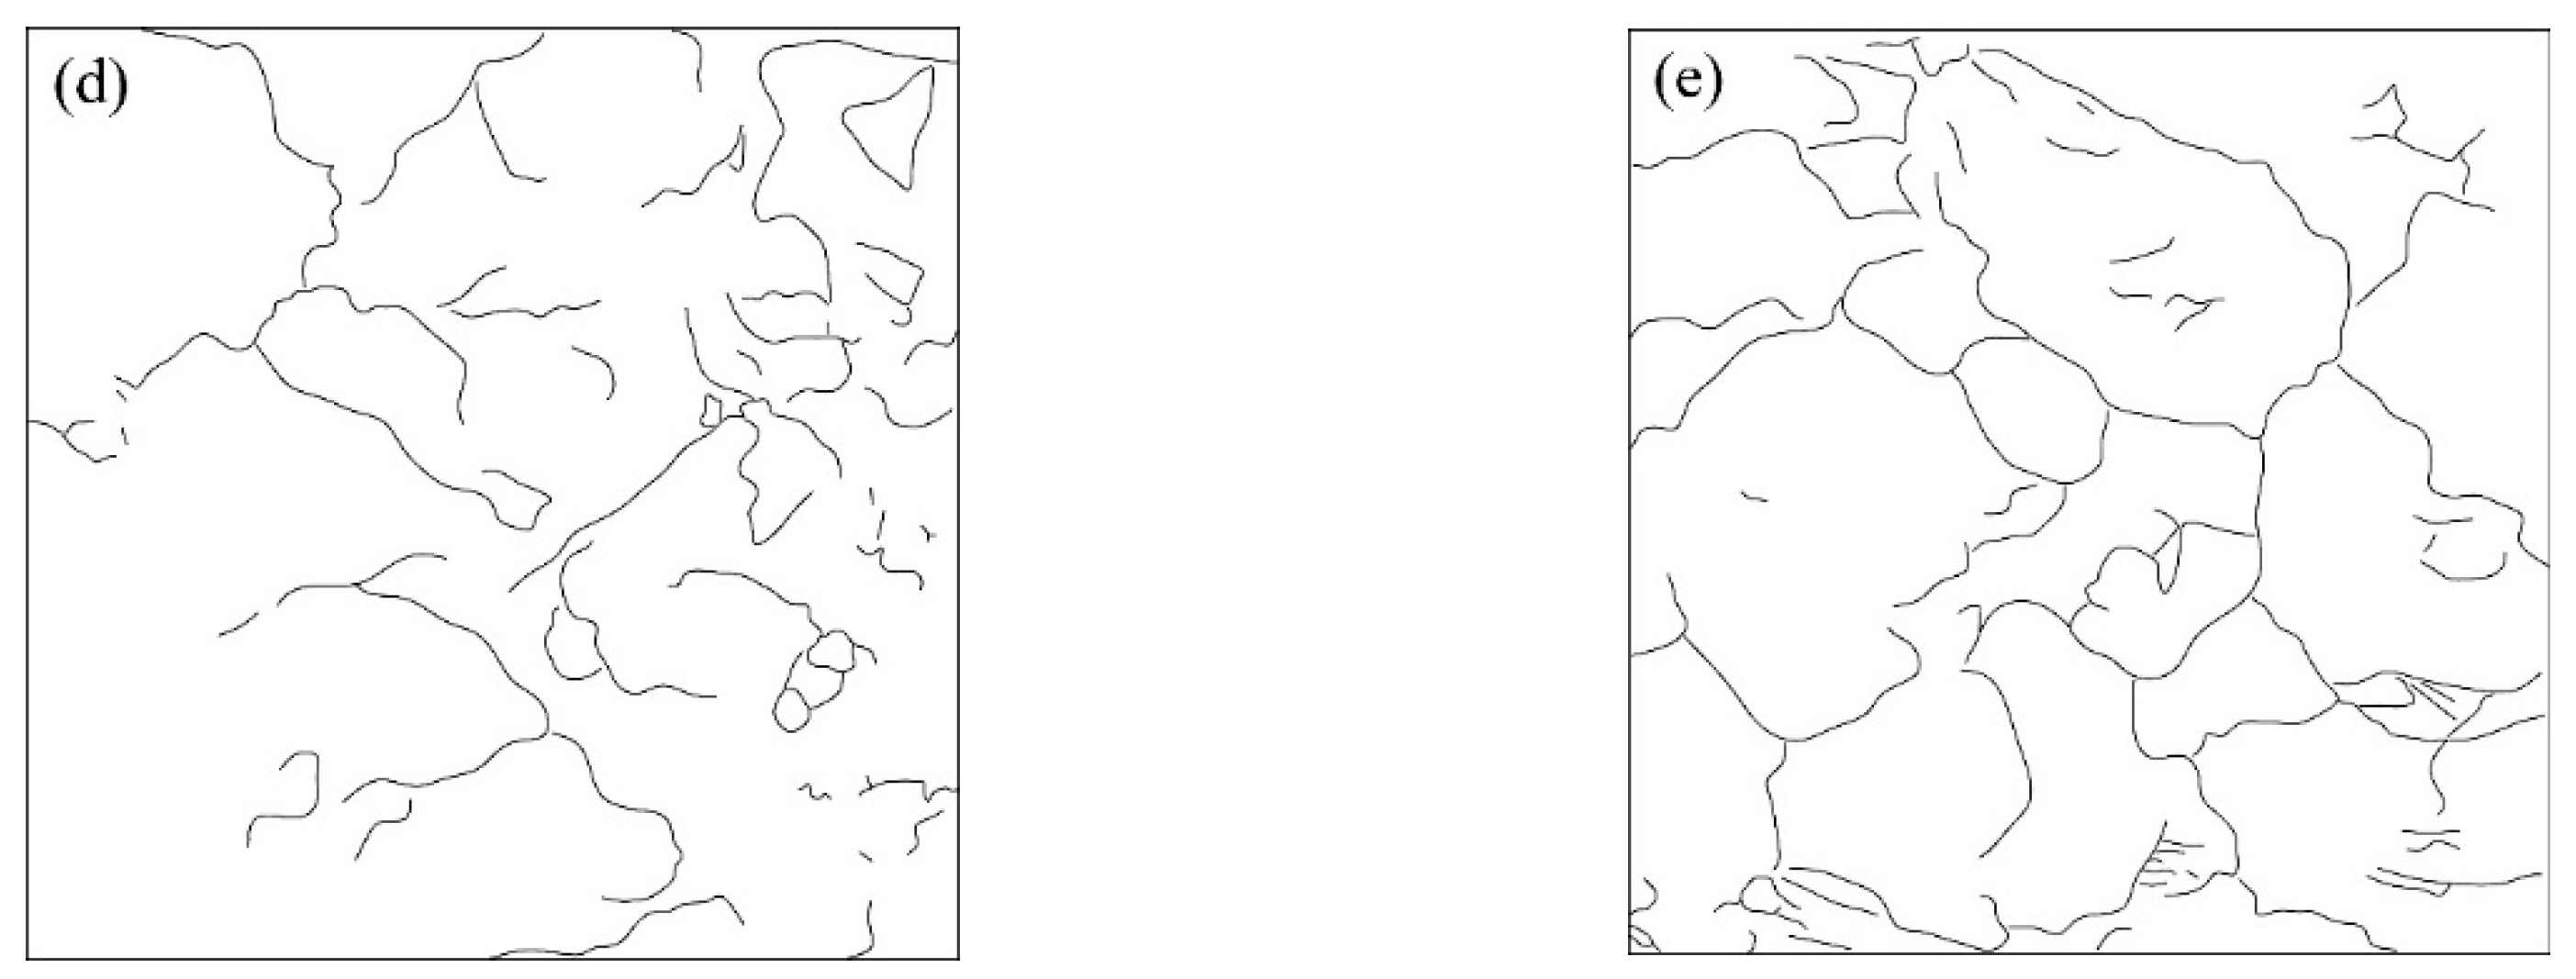
Thermal fracturing of minerals. When the temperature exceeds the limit state of the internal thermal expansion stress for crystal fracture, mineral particles may suffer thermal fractures and this results in a stress redistribution, thus further causing the microstructure of crystals to be broken. According to Figure 7 and Figure 8, a significant increase is observed in both the number and the persistence of cracks after thermal treatment beyond 600 °C. Specially, more cracks break through the internal crystal structure and cause their sizes to decrease remarkably till the temperature rises up to 800 °C. The TGA curve changes also verify the conclusion that the Moss loss ratio is very large during the interval of 600 °C to 750 °C (Figure 6). These newly-produced cracks would destroy the original microfissure system located in the crystal, and cause the persistence of separate micro-cracks to increase, and then result in a more significant decomposition. Thus, the total number of transcrystalline cracks would be increasing faster as the temperature rises continuously. Besides, the shape of mineral crystals has an obvious influence on the thermal fracturing of minerals. Commonly, the maximum thermal stress is concentrated in the edges or corners of crystals, which leads to tip-cracks happening during the early stage [62]. For the same mineral particle under the same temperature conditions, the trans-crystalline cracks may happen sooner if the boundary of such a crystal seems to be more coarse. It can be observed in Figure 7d,e that the thermal fractures seemed to be more serious for the quartz crystals with more rough boundary surfaces. Similar viewpoints were also reported by some previous studies [62,63] where thermal fractures happened easier along the short axis direction of crystals, the dominant crystal orientation and singular interfaces of crystals.
(3)
Thermal reaction. Some physical and chemical reactions of mineral particles also happen during the thermal treatment process. The most significant reaction of sandstone is the shift of quartz, the foundational mineral of sandstone in this study, from α- to β-condition during the phase change period [57,64]. This would cause some microphysical parameters such as lattice constants, diffraction widening, microstrains, and dislocation density to change significantly during this period (Figure 1, Figure 2, Figure 3, Figure 4 and Figure 5), while also causing the microstructure to be more fragile and easier to fracture. The sharp breaking phenomenon of β-quartz is also observed according to the failure characteristics seen in the TGA curves and SEM images (Figure 6, Figure 7 and Figure 8). Meanwhile, in the high-temperatures range (>650 °C), β-quartz also presents a dominant slip and plastic softening appearance [65]. The characteristics of β-quartz makes many trans-crystalline cracks appear and causes the overall strength to fall quickly (Figure 9). The TGA curve change presents a sharpest decline at the range of 600 °C to 750 °C (Figure 6). Furthermore, some hard decomposed minerals such as calcite and albite would begin to compose and even melt under elevated temperature conditions beyond 600 °C. In addition, metallic bonds such as Al–O, Na–O, K–O, and Ca–O generally fracture when the temperature increases to 600 °C because of the influence of solid mineral expansion [61].
In general, the generation of cracks for sandstone is caused mainly by three factors—mineral crystal thermal expansion and rotation, quartz phase transition and mineral particle decomposition. However, these three phenomena don’t happen simultaneously during the thermal treatment process. More specifically, mineral crystal thermal expansion and rotation caused the generation of trans-crystalline cracks leads to the appearance of inter-particle cracks during the early stages below 600 °C. Then, quartz phase transition and mineral particle decomposition play an more significant role in the microstructure deterioration during the later heating stage from 600 °C to 900 °C. Amounts of trans-crystalline cracks appeared and this resulted in the microstructure being fractured and the strength to be very low. Detailed diagrams of microstructure development process of quartz crystals are illustrated in Figure 10.

5. Conclusions

The influences of temperature on the microstructure deterioration of sandstone were explored and analyzed using the XRD, SEM and TGA techniques. Changes of microparameters including lattice constant, FWHM, microstrains, dislocation density, TGA curve change, failure characteristics of the mineral particles were comprehensively observed. Some main conclusions can be presented according to these comprehensive measurements and our further discussion:
(1)
According to the XRD patterns and lattice constant results, the influence of temperature on mineral crystals mainly affected the change of lattice parameters and the reactions and decomposition of minerals. Commonly, the disappearance and deviation of XRD peaks was related with the decomposition of minerals.
(2)
According to our XRD analyses the diffraction widening and microstrain of sandstone present anisotropic characteristics due to the different sensitivity of minerals to temperature. Meanwhile, the phase transition of quartz from α- to β-form at about 573 °C is the core reason why the dislocation density decreases rapidly, which leads to the hardness and strength of sandstone decaying.
(3)
Three stages can be classified based on the changes of the TGA curves: (1) Stage I is from room temperature to 400 °C, which is strongly related with the pore-water evaporation and hydration reaction; (2) Stage II is at the range of 400 °C to 750 °C, where a sharp decline ratio of mass loss occurs due to thermal decomposition reactions of the minerals, especially quartz; (3) Stage III is the range of above 750 °C. The curve displays a slow decrease although the decomposition is still continuous.
(4)
According to the SEM images of sandstone and statistical results of crack lengths, the surfaces of minerals generally tended to be rough, and the number of surface cracks increased along with increasing temperature, especially above 400 °C. In addition, the cracks appearing in the period below 600 °C can be regarded as inter-granular fractures, which were attributed to thermal stress differences among minerals. Meanwhile, trans-crystalline cracks resulted from thermal deformation of crystal grains when the temperature exceeds 600 °C.
(5)
Three reasons can be summarized to explain the microstructure deterioration of sandstone during the heating process from 25 °C to 900 °C, that is, thermal stress, thermal fracturing of minerals, and thermal reactions. All of these reasons lead to these phenomena of mineral crystal thermal expansion and rotation, quartz phase transition and mineral particle decomposition in different temperature intervals.

Author Contributions

Y.-J.S. and F.G. conceived and designed the experiments; Y.-L.Z. performed the experiments; Y.-J.S. and Y.-L.Z. analyzed the data; Y.-J.S., G.-S.Y. and X.-P.L. contributed funding supports; Y.-J.S. wrote the paper. G.-S.Y. revised the English of this paper.

Funding

This research was funded by the National Natural Science Foundation of China (Grant No. 41772333, 51774231), the National Key Basic Research and Development Program of China (973 Program) (Grant No. 2015CB251600) and the Foundation from State Key Laboratory for Geo-Mechanics and Deep Underground Engineering, China University of Mining & Technology (Grant No. SKLGDUEK1813).

Acknowledgments

We thanks for the supports from the National Natural Science Foundation of China (Grant No. 41772333, 51774231), the National Key Basic Research and Development Program of China (973 Program) (Grant No. 2015CB251600) and the Foundation from State Key Laboratory for Geo-Mechanics and Deep Underground Engineering, China University of Mining & Technology (Grant No. SKLGDUEK1813). We would also like to acknowledge the editor and two anonymous reviewers for their valuable comments, which have greatly improved this paper.

Conflicts of Interest

The authors declare no conflicts of interest.

References

  1. Dhansay, T.; Navabpour, P.; Wit, M.D.; Ustaszewski, K. Assessing the reactivation potential of pre-existing fractures in the southern Karoo, South Africa: Evaluating the potential for sustainable exploration across its Critical Zone. J. Afr. Earth Sci. 2017, 134, 504–515. [Google Scholar] [CrossRef]
  2. He, M.C.; Guo, P.Y. Deep rock mass thermodynamic effect and temperature control measures. Chin. J. Rock Mech. Eng. 2013, 32, 2377–2393. [Google Scholar]
  3. Yang, S.Q.; Tian, W.L.; Ranjith, P.G. Failure Mechanical Behavior of Australian Strathbogie Granite at High Temperatures: Insights from Particle Flow Modeling. Energies 2017, 10, 756. [Google Scholar] [CrossRef]
  4. Yang, S.Q.; Ranjith, P.G.; Jing, H.W.; Tian, W.L.; Ju, Y. An experimental investigation on thermal damage and failure mechanical behavior of granite after exposure to different high temperature treatments. Geothermics 2017, 65, 180–197. [Google Scholar] [CrossRef]
  5. Shao, S.; Ranjith, P.G.; Wasantha, P.L.P.; Chen, B.K. Experimental and numerical studies on the mechanical behaviour of Australian Strathbogie granite at high temperatures: An application to geothermal energy. Geothermics 2015, 54, 96–108. [Google Scholar] [CrossRef]
  6. Lankford, J. Temperature-strain rate dependence of compressive strength and damage mechanisms in aluminium oxide. J. Mater. Sci. 1981, 16, 1567–1578. [Google Scholar] [CrossRef]
  7. Yavuz, H.; Demirdag, S.; Caran, S. Thermal effect on the physical properties of carbonate rocks. Int. J. Rock Mech. Min. 2010, 47, 94–103. [Google Scholar] [CrossRef]
  8. Brotóns, V.; Tomás, R.; Ivorra, S.; Alarcón, J.C. Temperature influence on the physical and mechanical properties of a porous rock: San Julian’s calcarenite. Eng. Geol. 2013, 167, 117–127. [Google Scholar] [CrossRef]
  9. Kong, B.; Wang, E.; Li, Z.; Wang, X.; Liu, X.; Li, N.; Yang, Y. Electromagnetic radiation characteristics and mechanical properties of deformed and fractured sandstone after high temperature treatment. Eng. Geol. 2016, 209, 82–92. [Google Scholar] [CrossRef]
  10. Lü, C.; Sun, Q.; Zhang, W.; Gen, J.; Qi, Y.; Lu, L. The effect of high temperature on tensile strength of sandstone. Appl. Therm. Eng. 2017, 111, 573–579. [Google Scholar] [CrossRef]
  11. Wang, Z.; Luan, W.; Huang, J.; Jiang, C. XRD investigation of microstructure strengthening mechanism of shot peening on laser hardened 17-4PH. Mater. Sci. Eng. A 2011, 528, 6417–6425. [Google Scholar] [CrossRef]
  12. Rosas-Casarez, C.A.; Arredondo-Rea, S.P.; Cruz-Enríquez, A.; Corral-Higuera, R.; Gómez-Soberón, J.M.; Medina-Serna, T.D.J. Influence of size reduction of fly ash particles by grinding on the chemical properties of geopolymers. Appl. Sci. 2018, 8, 365. [Google Scholar] [CrossRef]
  13. Zhang, W.; Qian, H.; Sun, Q.; Chen, Y. Experimental study of the effect of high temperature on primary wave velocity and microstructure of limestone. Environ. Earth Sci. 2015, 74, 5739–5748. [Google Scholar] [CrossRef]
  14. Zhang, Y.; Sun, Q.; Geng, J. Microstructural characterization of limestone exposed to heat with XRD, SEM and TG-DSC. Mater. Charact. 2017, 134, 285–295. [Google Scholar] [CrossRef]
  15. Holmboe, M.; Wold, S.; Jonsson, M. Porosity investigation of compacted bentonite using XRD profile modeling. J. Contam. Hydrol. 2012, 128, 19–32. [Google Scholar] [CrossRef] [PubMed]
  16. Vázquez, M.; Nieto, F.; Morata, D.; Droguett, D.; Carrillo-Rosua, F.J.; Morales, S. Evolution of clay mineral assemblages in the Tinguiririca geothermal field, Andean Cordillera of central Chile: An XRD and HRTEM-AEM study. J. Volcanol. Geotherm. Res. 2014, 282, 43–59. [Google Scholar] [CrossRef]
  17. Gibeaux, S.; Vázquez, P.; Kock, T.D.; Veerle, C.; Céline, T.-S. Weathering assessment under X-ray tomography of building stones exposed to acid atmospheres at current pollution rate. Constr. Build. Mater. 2018, 168, 187–198. [Google Scholar] [CrossRef]
  18. De, A.V.; Susini, J.; Salomé, M.; Beraldin, O.; Rigault, C.; Heymes, T. Submicrometer hyperspectral X-ray imaging of heterogeneous rocks and geomaterials: Applications at the Fe K-edge. Anal. Chem. 2012, 83, 4220–4227. [Google Scholar] [CrossRef]
  19. Li, H.; Li, H.; Gao, B.; Wang, W.; Liu, C. Study on pore characteristics and microstructure of sandstones with different grain sizes. J. Appl. Geophys. 2017, 136, 364–371. [Google Scholar] [CrossRef]
  20. Sun, H.; Sun, Q.; Deng, W.; Zhang, R.; Wang, Q. Temperature effect on microstructure and P-wave propagation in Linyi sandstone. Appl. Therm. Eng. 2017, 115, 913–922. [Google Scholar] [CrossRef]
  21. Shao, S.S.; Wasantha, P.L.P.; Ranjith, P.G.; Chen, B.K. Effect of cooling rate on the mechanical behavior of heated Strathbogie granite with different grain sizes. Int. J. Rock Mech. Min. 2014, 70, 381–387. [Google Scholar] [CrossRef]
  22. Badulla, L.A.I.; Ranjith, P.G.; Tharaka, D.R.; Mandadige, S.A.P.; Dornadula, C.; Wanniarachchige, G.P.K. An influence of thermally-induced micro-cracking under cooling treatments: Mechanical characteristics of Australian granite. Energies 2018, 11, 1338. [Google Scholar] [CrossRef]
  23. Kihara, K. Molecular dynamics interpretation of structural changes in quartz. Phys. Chem. Miner. 2001, 28, 365–376. [Google Scholar] [CrossRef]
  24. Arredondo Rea, S.P.; Corral Higuera, R.; Almaral Sánchez, J.L.; Gómez Soberón, J.M.V.; Portillo Pérez, A.D. Physico-Chemical Properties, Porosity and Microstructure of Sustainable Concretes. American Concrete Institute, 2012. Available online: https://upcommons.upc.edu/handle/2117/16924 (accessed on 12 May 2018).
  25. Aguilar-Penagos, A.; Gómez-Soberón, J.M.; Rojas-Valencia, M.N. Physicochemical, mineralogical and microscopic evaluation of sustainable bricks manufactured with construction wastes. Appl. Sci. 2017, 7, 1012. [Google Scholar] [CrossRef]
  26. El-Naas, M.H.; Zekri, A.Y. A novel plasma technique to stimulate tight carbonate rocks. Energy Source Part 2002, 24, 181–194. [Google Scholar] [CrossRef]
  27. Sanjurjo Sánchez, J.; Vidal Romaní, J.R.; Fernández Mosquera, D.; Alves, C.A. Study of origin and composition of coatings in a monument built with granitic rocks, by SEM, XRD, XRF and DTA-TGA. X-Ray Spectrom. 2010, 37, 346–354. [Google Scholar] [CrossRef]
  28. Sammaljärvi, J.; Rama, M.S.; Ikonen, J.; Muuri, E.; Hellmuth, K.H.; Siitari-Kauppi, M. Free radical polymerisation of methacrylates with thermal initiator in clay rock. Eng. Geol. 2016, 210, 70–83. [Google Scholar] [CrossRef] [Green Version]
  29. International Society for Rock Mechanics (ISRM). The ISRM Suggested Methods for Rock Characterization, Testing and Monitoring: 2007–2014; Ulusay, R., Ed.; Springer International Publishing: Berlin, Germany, 2015; pp. 35–44. [Google Scholar] [CrossRef]
  30. Sun, Q.; Geng, J.; Zhang, W.; Chao, L. Variation of wave velocity and thermal conductivity of concrete after high-temperature treatment. Environ. Earth Sci. 2017, 76, 88. [Google Scholar] [CrossRef]
  31. Sirdesai, N.N.; Mahanta, B.; Ranjith, P.G.; Singh, T.N. Effects of thermal treatment on physico-morphological properties of Indian fine-grained sandstone. Bull. Eng. Geol. Environ. 2017, 1–15. [Google Scholar] [CrossRef]
  32. Zhu, S.; Zhang, W.; Sun, Q.; Deng, S.; Geng, J.; Li, C. Thermally induced variation of primary wave velocity in granite from Yantai: Experimental and modeling results. Int. J. Therm. Sci. 2017, 114, 320–326. [Google Scholar] [CrossRef]
  33. Zhang, W.; Sun, Q.; Zhu, S.; Hao, S. The effect of thermal damage on the electrical resistivity of sandstone. J. Geophys. Eng. 2017, 14, 255–261. [Google Scholar] [CrossRef]
  34. Rahfeld, A.; Kleeberg, R.; Möckel, R.; Gutzmer, J. Quantitative mineralogical analysis of European Kupferschiefer ore. Miner. Eng. 2018, 115, 21–32. [Google Scholar] [CrossRef]
  35. Jozanikohan, G.; Sahabi, F.; Norouzi, G.H.; Memarian, H.; Moshiri, B. Quantitative analysis of the clay minerals in the Shurijeh reservoir formation using combined X-ray analytical techniques. Russ. Geol. Geophys. 2016, 57, 1048–1063. [Google Scholar] [CrossRef]
  36. Valverde, J.M.; Perejon, A.; Medina, S.; PerezMaqueda, L.A. Thermal decomposition of dolomite under CO2: Insights from TGA and in situ XRD analysis. Phys. Chem. Phys. 2015, 17, 30162–30176. [Google Scholar] [CrossRef] [PubMed]
  37. Rodriguez-Navarro, C.; Kudlacz, K.; Ruiz-Agudo, E. The mechanism of thermal decomposition of dolomite: New insights from 2D-XRD and TEM analyses. Am. Mineral. 2012, 97, 38–51. [Google Scholar] [CrossRef]
  38. Treacy, M.M.J.; Higgins, J.B.; Higgins, J.B. Laumontite. In Collection of Simulated XRD Powder Patterns for Zeolites, 5th ed.; Elsevier: Allentown, PA, USA, 2007; pp. 196–197. ISBN 978-0-444-53067-7. [Google Scholar]
  39. Fridriksson, T.; Bish, T.; Bird, D.L.; Dennis, K. Hydrogen-bonded water in laumontite: X-ray powder diffraction study of water site occupancy and structural changes in laumontite during room-temperature isothermal hydration/dehydration. Am. Mineral. 2003, 88, 277–287. [Google Scholar] [CrossRef]
  40. Ståhl, K.; Artioli, G.; Hanson, J.C. The dehydration process in the Zeolite laumontite: A real-time synchrotron X-ray powder diffraction study. Phys. Chem. Miner. 1996, 23, 328–336. [Google Scholar] [CrossRef]
  41. Valcke, S.L.A.; Casey, M.; Lloyd, G.E.; Kendall, J.M.; Fisher, Q.J. Lattice preferred orientation and seismic anisotropy in sedimentary rocks. Geophys. J. R. Astron. Soc. 2010, 166, 652–666. [Google Scholar] [CrossRef]
  42. Breivik, M.; Nilsen, T.A.; Fimland, B.O. Temperature dependent lattice constant of InSb above room temperature. J. Cryst. Growth 2013, 381, 165–168. [Google Scholar] [CrossRef]
  43. Taylor, J.C.; Pecover, S.R. Quantitative analysis of phases in zeolite bearing rocks from full X-ray diffraction profiles. Aust. J. Phys. 1988, 41, 323–336. [Google Scholar] [CrossRef]
  44. Branlund, J.M.; Hofmeister, A.M. Effects of hydrogen impurities on the lattice thermal diffusivity of quartz and quartzites up to 1000 °C. In AGU Fall Meeting Abstracts; American Geophysical Union: Washington, DC, USA, 2004; Volume 12. [Google Scholar]
  45. Gualtieri, A.F.; Zanni, M. Quantitative determination of crystalline and amorphous phase in traditional ceramics by combined Rietveld–RIR method. Mater. Sci. Forum 1998, 278–281, 834–839. [Google Scholar] [CrossRef]
  46. Gualtieri, A.F. Accuracy of XRPD QPA using the combined Rietveld–RIR method. J. Appl. Crystallogr. 2000, 33, 267–278. [Google Scholar] [CrossRef] [Green Version]
  47. Shim, S.H.; Kim, S.J.; Ahn, J.H. Quantitative analysis of alkali feldspar minerals using rietveld refinement of X-ray diffraction data. Am. Mineral. 1996, 81, 1133–1140. [Google Scholar] [CrossRef]
  48. Langford, J.I. A rapid method for analysing the breadths of diffraction and spectral lines using the Voigt function. J. Appl. Crystallogr. 1978, 11, 10–14. [Google Scholar] [CrossRef] [Green Version]
  49. Guo, L.; Huang, M.; Zhang, X. Effects of sintering temperature on structure of hydroxyapatite studied with rietveld method. J. Mater. Sci. Mater. Med. 2003, 14, 817–822. [Google Scholar] [CrossRef] [PubMed]
  50. Barbish, A.B.; Gardner, G.H.F. The effect of heat on some mechanical properties of igneous rocks. Soc. Pet. Eng. J. 1969, 9, 395–402. [Google Scholar] [CrossRef]
  51. Kern, H. The effect of high temperature and high confining pressure on compressional wave velocities in quartz bearing and quartz free igneous and metamorphic rocks. Tectonophysics 1978, 44, 185–203. [Google Scholar] [CrossRef]
  52. Homand-Etienne, F.; Houpert, R. Thermally induced microcracking in granite: Characterization and analysis. Int. J. Mech. Min. Sci. Geomech. Abstr. 1989, 26, 125–134. [Google Scholar] [CrossRef]
  53. David, C.; Menendez, B.; Darot, M. Influence of stress-induced and thermal cracking on physical properties and microstructures of La Peyratte granite. Int. J. Rock Mech. Min. 1999, 36, 433–488. [Google Scholar] [CrossRef]
  54. Williamson, G.K.; Smallman, R.E. III. Dislocation densities in some annealed and cold-worked metals from measurements on the X-ray debye-scherrer spectrum. Philos. Mag. 1956, 1, 34–46. [Google Scholar] [CrossRef]
  55. Dong, J.; Wang, L.; Zhang, T. Study on the strength development, hydration process and carbonation process of NaOH-activated Pisha Sandstone. Constr. Build. Mater. 2014, 66, 154–162. [Google Scholar] [CrossRef]
  56. Sun, Q.; Lü, C.; Cao, L.; Li, W.; Geng, J.; Zhang, W. Thermal properties of sandstone after treatment at high temperature. Int. J. Rock Mech. Min. 2016, 85, 60–66. [Google Scholar] [CrossRef]
  57. Mackenzie, R.C.; Berg, L.G.; Berggren, G. Differential Thermal Analysis Vol. 2: Application; Academic Press: London, UK, 1972; pp. 135–142. ISBN 0124644023. [Google Scholar]
  58. Jiao, K.; Yao, S.; Liu, C.; Gao, Y.Q.; Wu, H.; Li, M.C.; Tang, Z.Y. The characterization and quantitative analysis of nanopores in unconventional gas reservoirs utilizing FESEM–FIB and image processing: An example from the lower Silurian Longmaxi shale, Upper Yangtze region, China. Int. J. Coal Geol. 2014, 128–129, 1–11. [Google Scholar] [CrossRef]
  59. Griffith, A.A. The Phenomena of Rupture and Flow in Solids. Philos. Trans. R. Soc. Lond. 1921, 221, 163–198. [Google Scholar] [CrossRef]
  60. Han, L.; He, Y.; Zhang, H. Study of rock splitting failure based on Griffith strength theory. Int. J. Rock Mech. Min. 2016, 83, 116–121. [Google Scholar] [CrossRef]
  61. Shen, Y.; Yang, Y.; Yang, G.; Hou, X.; Ye, W.; You, Z.; Xi, J. Damage characteristics and thermo-physical properties changes of limestone and sandstone during thermal treatment from −30 °C to 1000 °C. Heat Mass Transf. 2018, 5, 1–19. [Google Scholar] [CrossRef]
  62. Xu, X. Research on the Mechanical Characteristics and Micro-Mechanism of Granite under Temperature Loads. Ph.D. Thesis, China University of Mining and Technology, Xuzhou, China, 2008. [Google Scholar]
  63. Chen, Y.L.; Wang, S.R.; Ni, J.; Rafig, A.; Tomás, M.F. An experimental study of the mechanical properties of granite after high temperature exposure based on mineral characteristics. Eng. Geol. 2017, 220, 234–242. [Google Scholar] [CrossRef]
  64. Seipold, U. Temperature dependence of thermal transport properties of crystalline rocks—A general law. Tectonophysics 1998, 291, 161–171. [Google Scholar] [CrossRef]
  65. Mainprice, D.; Bouchez, J.L.; Blumenfeld, P.; Tubià, J.M. Dominant c slip in naturally deformed quartz: Implications for dramatic plastic softening at high temperature. Geology 1986, 14, 819–822. [Google Scholar] [CrossRef]
Figure 1. X-ray diffraction (XRD) patterns with different heating temperatures from 25 °C to 900 °C.
Energies 11 01753 g001
Figure 2. Changes of lattice constants of quartz, albite and calcite from 25 °C to 900 °C.
Energies 11 01753 g002
Figure 3. The FWHM curves of crystal surface of (a) quartz; (b) albite; and (c) laumontite.
Energies 11 01753 g003
Figure 4. Microstrain curves as a function of temperature for quartz, calcite and albite.
Energies 11 01753 g004
Figure 5. Dislocation density of quartz as a function of temperature.
Energies 11 01753 g005
Figure 6. TGA curve changes of sandstone during heating treatment.
Energies 11 01753 g006
Figure 7. SEM images of sandstone samples after different temperature treatments. (a) 25 °C; (b) 200 °C; (c) 400 °C; (d) 600 °C; (e) 800 °C.
Energies 11 01753 g007
Figure 8. Morphological sketches of crack aggravation with temperature. (a) 25 °C; (b) 200 °C; (c) 400 °C; (d) 600 °C; (e) 800 °C.
Energies 11 01753 g008aEnergies 11 01753 g008b
Figure 9. Comparison results between the peak strength and the total length of cracks with temperature.
Energies 11 01753 g009
Figure 10. Diagrams of the microstructure development process of quartz crystals.
Energies 11 01753 g010
Table 1. The main parameters of the X-ray diffraction instrument and test condition.
VersionVoltage and CurrentAnodeRadius of Measuring InstrumentDSSS
D8 Advance40 kV, 30 mACu250 mm0.6 mm8 mm
FilterDetector OpeningPrimary and Secondary Soller SlitScanning SpeedSampling Interval
Ni2.82°2.5°0.2 s/step0.01945°

