Article

Feature Extraction and Comprehension of Partial Discharge Characteristics in Transformer Oil from Rated AC Frequency to Very Low Frequency

1
State Key Lab of Electrical Power System, Department of Electrical Engineering, Tsinghua University, Beijing 100084, China
2
School of Electrical Engineering, Xinjiang University, Urumqi 830047, China
3
State Grid Jibei Electric Economic Research Institute, Beijing 100045, China
4
North China Electric Power Research Institute Co., Ltd., Beijing 100045, China
*
Author to whom correspondence should be addressed.
Energies 2018, 11(7), 1702; https://doi.org/10.3390/en11071702
Submission received: 30 May 2018 / Revised: 23 June 2018 / Accepted: 26 June 2018 / Published: 1 July 2018
(This article belongs to the Section F: Electrical Engineering)

Abstract

:
The reactive current can be reduced effectively by decreasing the frequency of the voltage in partial discharge (PD) test, especially for equipment with large capacitance. Thus, the cost and volume of the test power supply can be economized. To figure out the difference of PD characteristics in transformer oil between rated alternating-current (AC) frequency (50 Hz) and low frequency, tests are conducted from rated AC frequency to very low frequency (0.1 Hz) based on impulse current method. The results show that with the decrease of frequency, the inception voltage increases. The maximum and mean magnitude of discharge and pulse repetition rate first increase slightly, then decrease obviously. The main features of the variation of phase resolved PD (PRPD) patterns, discharge statistical patterns (phase distribution of maximum and mean discharge magnitude, pulse repetition rate qmaxφ, qmeanφ, nφ; and number distribution of discharge magnitude nq), and their characteristic parameters (skewness Sk+, Sk; kurtosis Ku+, Ku; asymmetry Asy; and correlation coefficient Cc) are depicted in detail, which should be paid attention to when using low frequency voltage. The inner mechanism for these variations is discussed from the aspects of the influence on electric field distribution and discharge process of frequency. Additionally, the variation trend of PD characteristics with the decrease of frequency can provide more information about insulation defect, which can be the supplement for discharge mode recognition.

1. Introduction

To detect the defect in time and correctly avoid the serious faults of electrical equipment and interruption of power supply. One category of defect recognition methods is based on the operation condition, for example, the armature current of the direct-current (DC) generator [1], the current signal of three phase induction motor [2], sweep frequency response analysis to check the deformation [3], a simplified frequency-domain Volterra model to detect inter-turn faults [4], and so on. Another category of methods is based on the discharge information. Partial discharge is a kind of discharge that is restricted in the insulation defect region and does not form a complete breakdown damage. It is always accompanied by detectable phenomena such as electrical current [5], ultrasound [6], and light [7], which makes it an important indicator to check the insulation reliability of electrical equipment and discover early insulation hazards. Generally, PD detection is performed during a withstand test under the rated operating voltage even multiplied by a certain margin factor. Under the relatively high voltage defined by test standards, the demand for reactive power can be reduced by decreasing the voltage frequency as the equation depicts Q = U2ωC [8], where Q (Var) is the reactive power, U (V) is the applied voltage, ω (1/s) is the angular frequency, and C (F) is the capacitance. Taking 0.1 Hz as an example, the reactive power can be reduced to 1/500 of that under rated alternating-current (AC) frequency. Thus, the volume, production cost, and transportation expense of test power supply can be economized, especially for the equipment with large capacitance. Also, there is consideration about substituting DC voltage for rated AC frequency voltage as the reactive current will be reduced to zero. However, the electric field under direct-current (DC) voltage obeys resistive distribution, which is far different from the capacitive distribution under actual operation conditions. Moreover, the waveform of DC voltage is not sinusoidal alternative and does not go across the zero point, which has a different influence on charge transportation after previous discharge from that of rated AC frequency [9]. Additionally, the space charge accumulated may cause unexpected damage to insulation during a DC withstand test. Above all, low frequency voltage is an appropriate option [10].
The first obstacle before the substitution of low frequency for rated AC frequency is how to evaluate the effectiveness of test results under low frequency, in other words, how to comprehend the test results because the traditional judging methods are not suitable. In 1961, Bhimani from the General Electric corporation proposed to use low frequency voltage to conduct a withstand test for reducing the capacity demand for test power supply, as the rotating machine to be checked has a large capacitance to the ground. His research shows that for PD in the void embedded in polyethylene sheets, the number of pulses under 0.1 Hz has the same order as that under 60 Hz. However, the difference becomes larger when the voltage decreases [11]. R. Miller points out that with the decrease of frequency, the magnitude of discharge in the void in epoxy resin decreases [12]. Because of the limitation of measurement technology, early research mainly focuses on whether there is a significant difference of discharge characteristics between rated AC frequency and low frequency, only for evaluating the effectiveness of a withstand test under low frequency [13,14,15]. With the increasing requirement for diagnosis accuracy, recent research begins to examine the details of the difference [16,17], for example, how the frequency affects the dissipation of discharge deposited from the previous half voltage cycle [18,19,20]. The existence of a statistical delay may lead to the difference of inception phase under different frequencies [21]. These studies, on the one hand, are necessary to grasp the discharge characteristics under low frequencies. On the other hand, they provide a new way to deepen the understanding of discharge mechanisms.
The electrical strength of insulating oil is superior to that of compressed gas, which is equivalent to sulfur hexafluoride (SF6) at 0.3 MPa. For the electrode consisting of a sphere with the diameter of 12.5 mm, a plate with a diameter of 75 mm and a gap of 12.5 mm, the peak value of the breakdown voltage is about 90 kV [22]. Its heat dissipation capacity and substitutability are better than those of solid insulation. Thus, insulating oil is widely used in electrical equipment [23]. Because of the incorrect action during assembly of the transformers, protrusion of the metal may appear, which causes the inhomogeneous electric field and may lead to corona discharge in the insulating oil. For the ultra-high-voltage (UHV) AC transformers and converter transformers with large volumes, as shown in Figure 1, small deformation may occur during the load impact and the long journey from the manufactory to the substation, which may bring the protrusion of the metal. There have been some studies on the characteristics of corona discharge in oil under rated frequency AC and DC voltage, providing detailed information for insulation defect diagnosis and understanding discharge mechanism under the corresponding voltage [24,25,26,27]. However, research about the corona discharge in oil under low frequency is rarely reported. Analysis of the variation of discharge characteristics from rated AC frequency to low frequency has three main meanings. The first is to provide reference for insulation diagnosis under low frequency voltage, such as the PRPD in Section 3.2 and statistical patterns in Section 3.3.1. The second is to promote the understanding of corona discharge in insulating oil, such as the discussion in Section 4. The third is to obtain the variation trend of discharge characteristics, which can be supplement for discharge mode recognition, such as the variation trend of statistical parameters in Section 3.1 and characteristic parameters in Section 3.3.2.
The main framework and approach of this research is shown in Figure 2. Firstly, a PD test and analysis system suitable for the applied voltage from rated AC frequency to very low frequency is set up. Then, experiments are conducted under a series of frequencies to measure statistical parameters of discharge. Third, PRPD, statistical patterns, and their characteristic parameters are obtained from the data acquired in the second step. Finally, we discuss the influence on discharge of frequency from the aspects of the electric field distribution and discharge process.

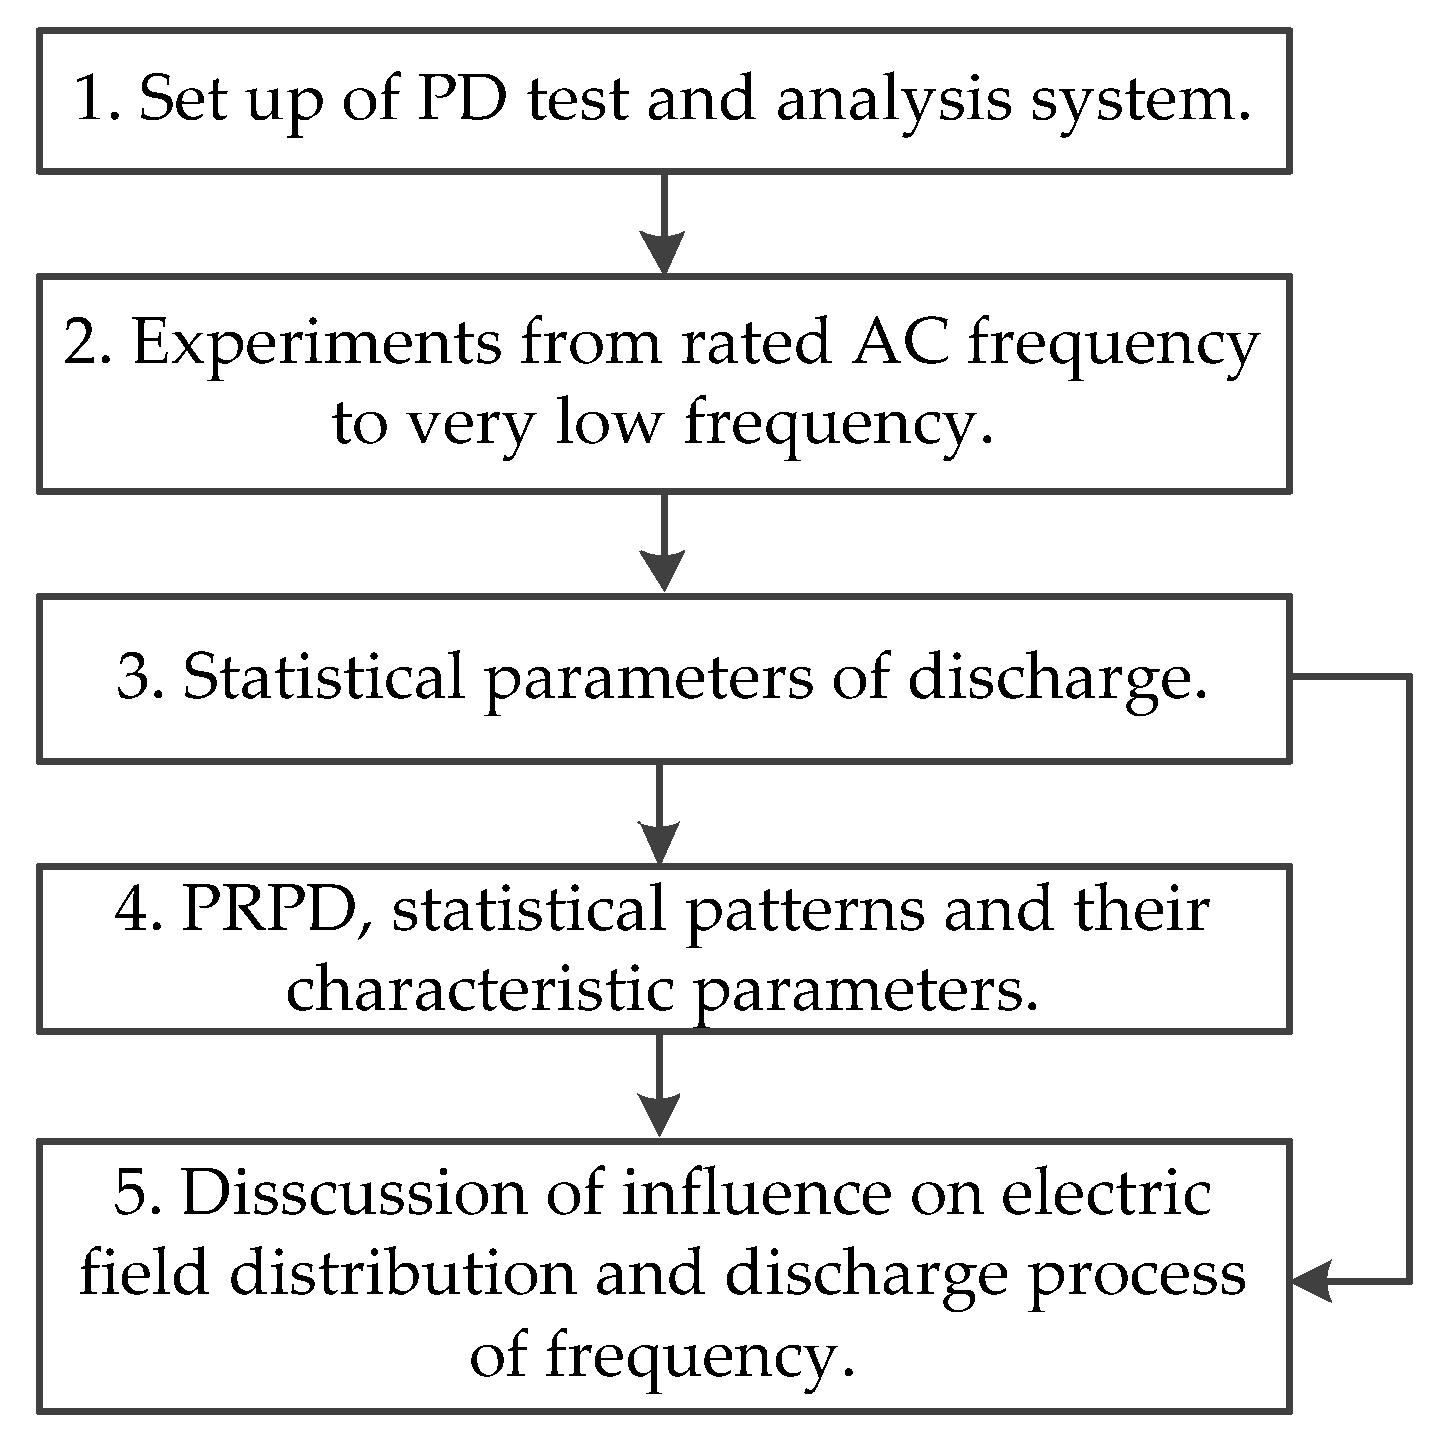
2. Experimental Setup and Analysis Method

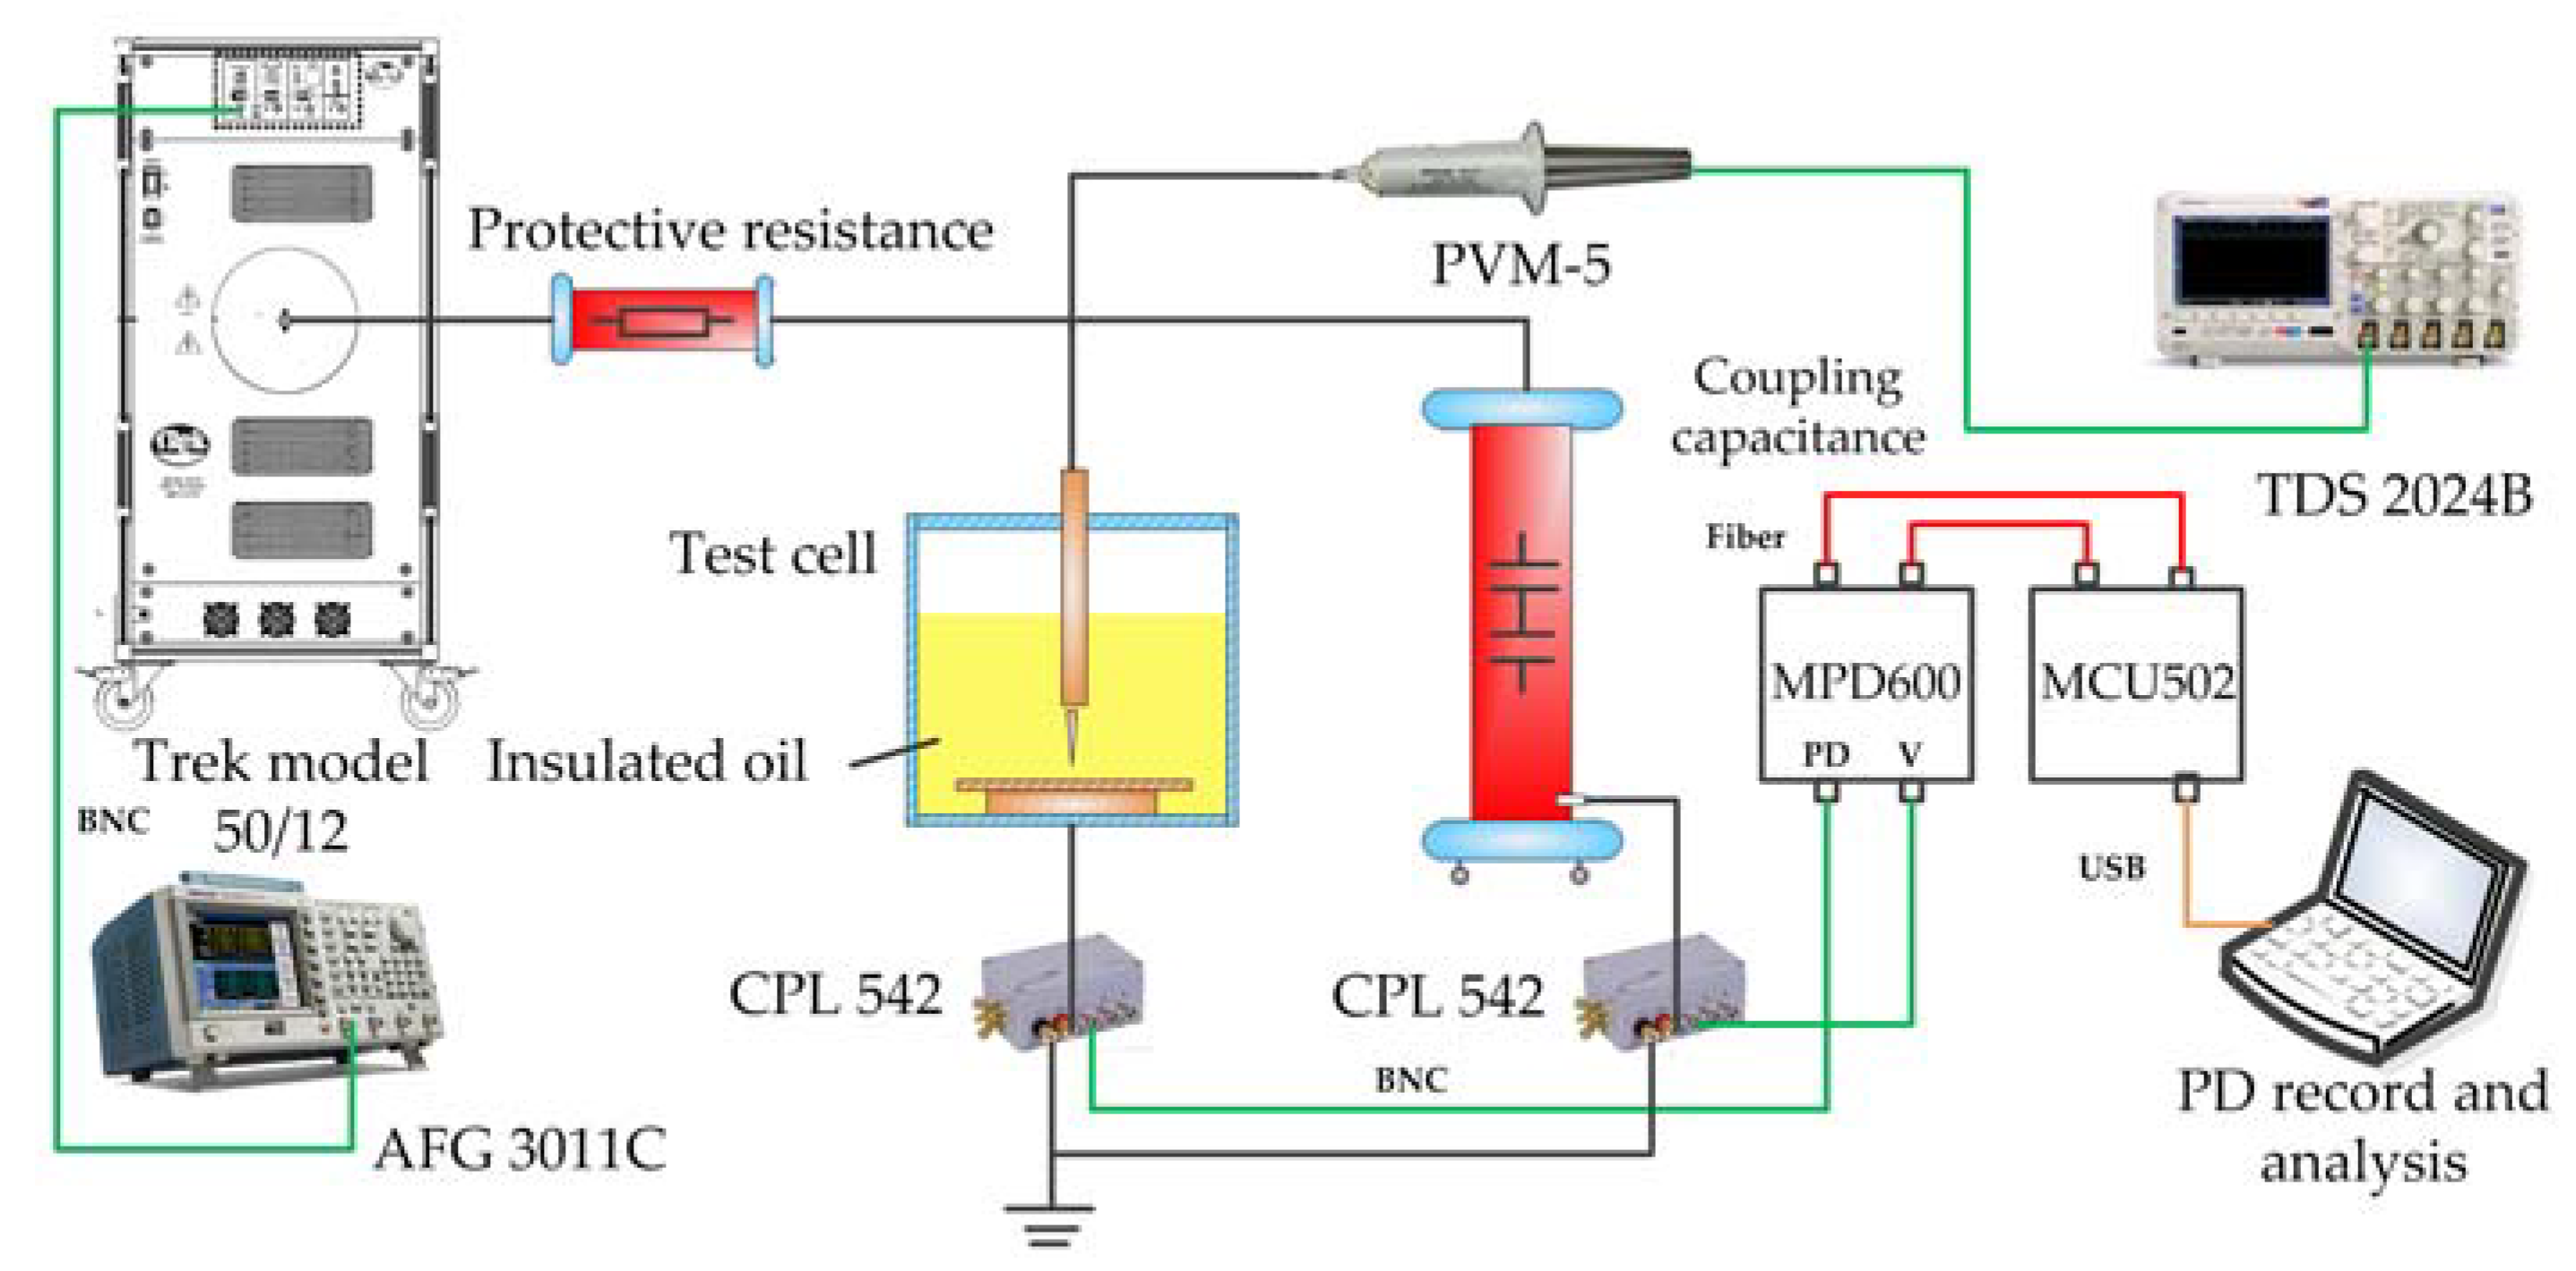
2.1. Test System, Procedure, and Sample Preparation

The PD test system consists of three parts, as shown in Figure 3. The first part is a low frequency voltage generator. The power amplifier Trek model 50/12 amplifies the small signal from the output of the arbitrary waveform generator AFG 3011C to obtain the voltage required [28]. The frequency of the applied voltage can be adjusted from 50 Hz to very low frequency (0.1 Hz) [8,11], and the amplitude can be adjusted from 0 to 35 kV. The second part is the circuit of test electrode and measurement system. The radius of curvature of the needle electrode is about 3 μm, of which the tip is 2 mm away from the earth electrode. The earth electrode is a round plate with a diameter of 75 mm and covered by a piece of oil-paper with thickness of 1 mm. One measurement impedance connected to the electrode is to acquire the discharge signals, another connected to the coupling capacitance is to acquire the applied voltage signal. The third part is for data processing and analysis. The oscilloscope TDS 2024B is to monitor the applied voltage accompanied with the high-voltage (HV) measuring probe PVM-5. The PD analyzer MPD 600 transports the discharge signals to the control unit MCU 500 by optical fiber cable, which effectively reduces the interference. Some other actions are taken to avoid the unexpected discharge in the test circuit, making the noise below 5 pC when the amplitude of applied voltage is 35 kV.
The electrode and its container were washed in the order of clean water, alcohol, and deionized water, and then dried at 100 °C for 48 h [29]. The insulating oil was filtered, dried, and the gas in it was removed to ensure that its electrical strength, moisture content, gas content, and acid value meet the corresponding standards. The insulating paper is dried at 105 °C for 48 h and then impregnated with insulating oil slowly at 40 °C in a vacuum oven.
The rising speed of the applied voltage in the experiments is 0.1 kV/step. PD inception voltage (PDIV) is defined as the continuous and stable discharge pulses are firstly observed. The frequency selected is 50 Hz, 40 Hz, 30 Hz, 20 Hz, 10 Hz, 5 Hz, 1 Hz, and 0.1 Hz. Discharge signals are recorded and analyzed under constant voltage amplitude, that is, 16 kV, 20 kV, 24 kV, 26 kV, 30 kV, and 32 kV. The tests under each frequency and amplitude are repeated more than five times. The interval of each test for the platform to be static is more than 15 min.

2.2. Analysis Method

The influence of frequency on PDIV, magnitude of discharge, and pulse repetition rate is demonstrated, which are direct indicators of the severity of discharge. Additionally, the influence on PRPD, discharge statistical patterns, and their characteristic parameters shown in Table 1 is also depicted as reference for mode recognition under low frequency voltage. All the variations mentioned above are in nature because of the influence on discharge process of frequency.
In Table 1, qmax and qmean is the maximum and mean magnitude of discharge in the corresponding phase window with the width of 1°. The unit of qmax and qmean is pC, and the unit of φ is phase degree “°”. The skewness Sk > 0 indicates that the distribution of discharge pattern is to the left of normal distribution, and to the right on the contrary. The kurtosis Ku > 0 indicates the distribution is sharper than normal distribution, and smoother on the contrary. The asymmetry Asy > 1 indicates the distribution of discharge pattern in negative half cycle is higher than that in a positive half cycle. The closer the correlation coefficient Cc is to 1, the more similar the outlines of the patterns in a positive and negative half cycle [30,31,32]. The superscripts “+” and “−” correspond to a positive and negative half cycle, respectively. The detailed calculation methods of each characteristic parameter can be found in our previous research [33].

3. Experimental Results

3.1. Statistical Parameters of Discharge
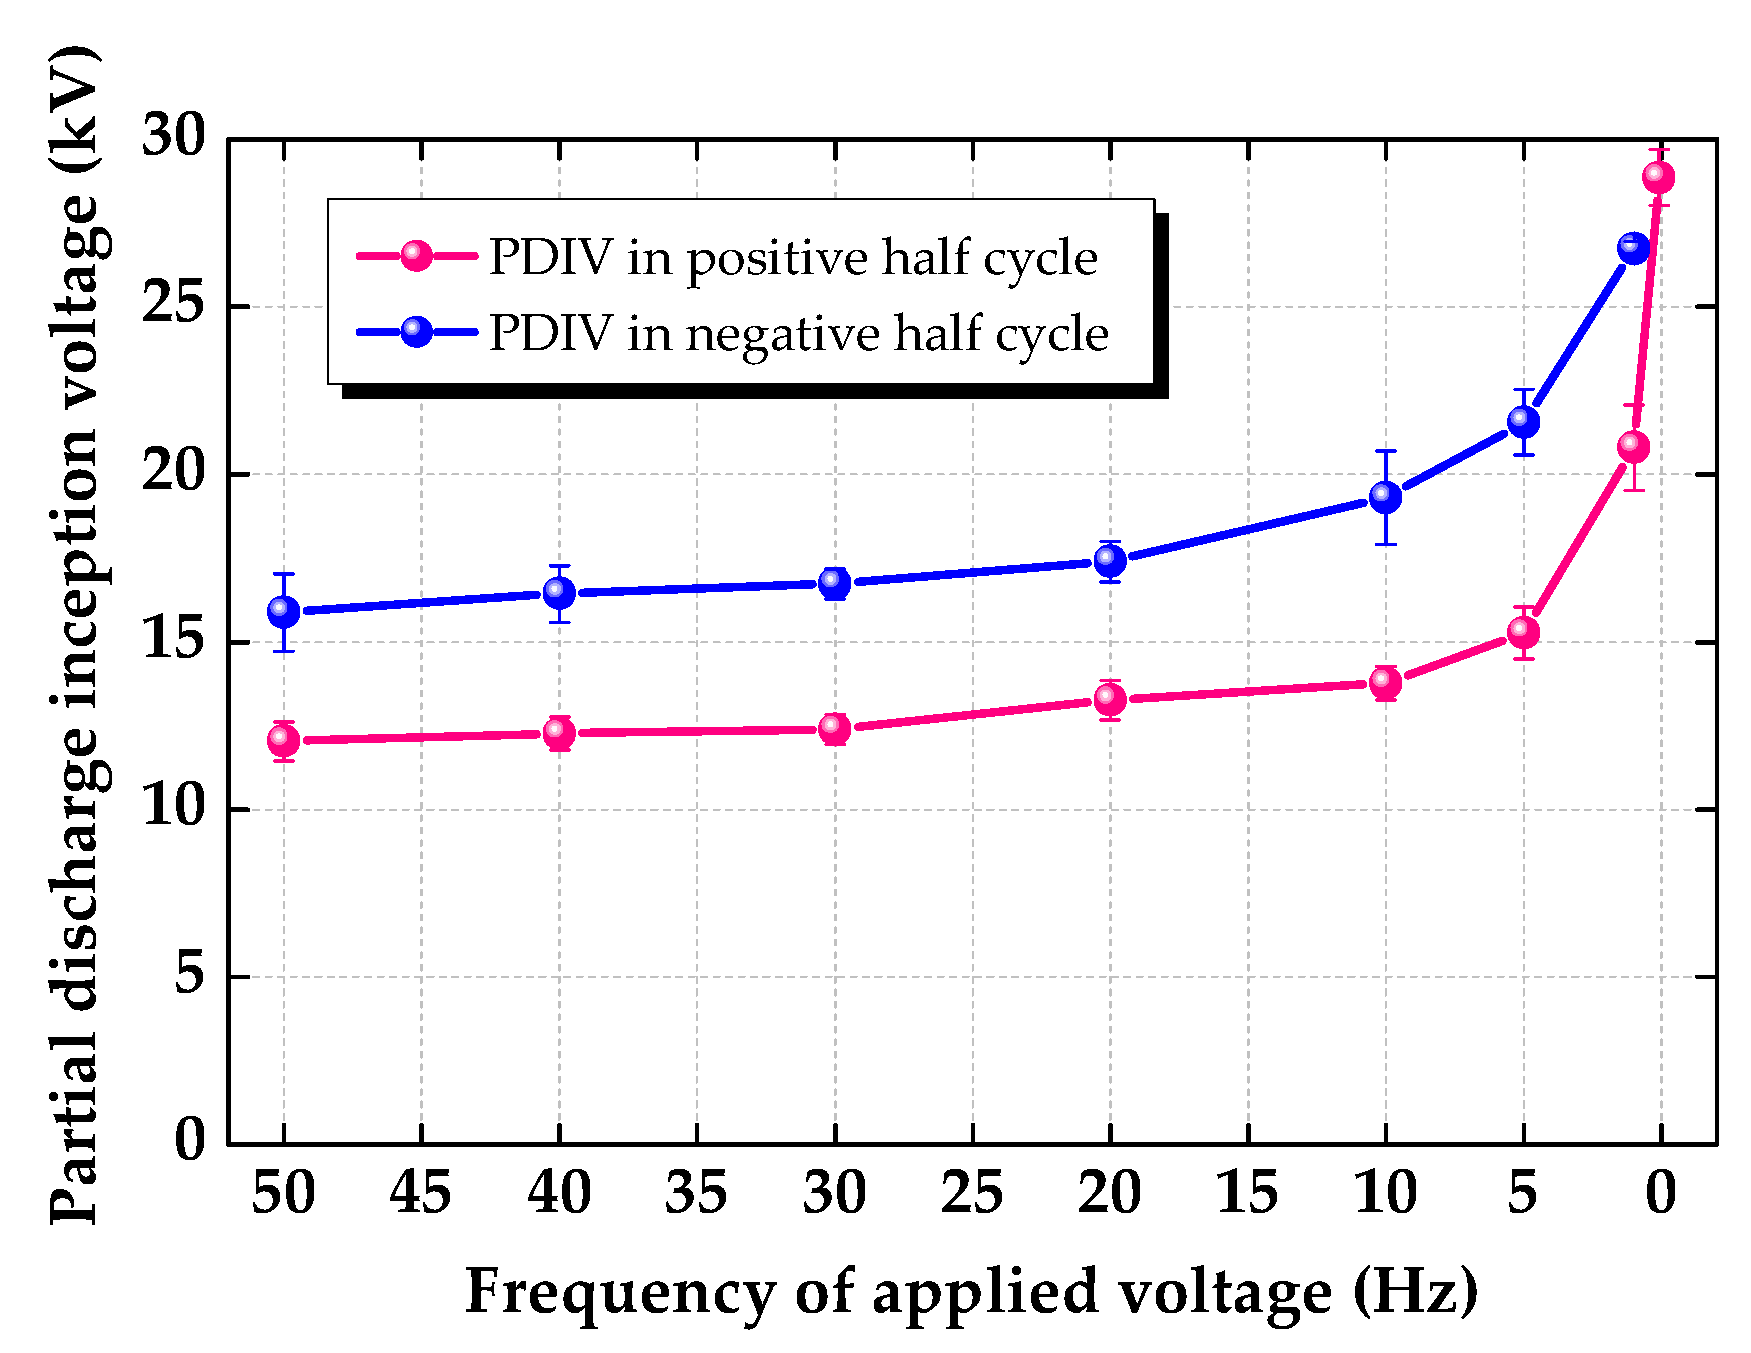
3.1.1. PDIV

With the decrease of frequency, PDIV in positive and negative half cycle both increases with a faster rising rate below 5 Hz, as shown in Figure 4. Compared with that under rated AC frequency, PDIV increases by 26.93% under 5 Hz and by 139.82% under 0.1 Hz. PDIV in negative half cycle is higher than that in positive half cycle under each frequency involved. The difference between PDIV in negative and positive half cycle increases, from 3.85 kV under 50 Hz to 5.93 kV under 1 Hz.

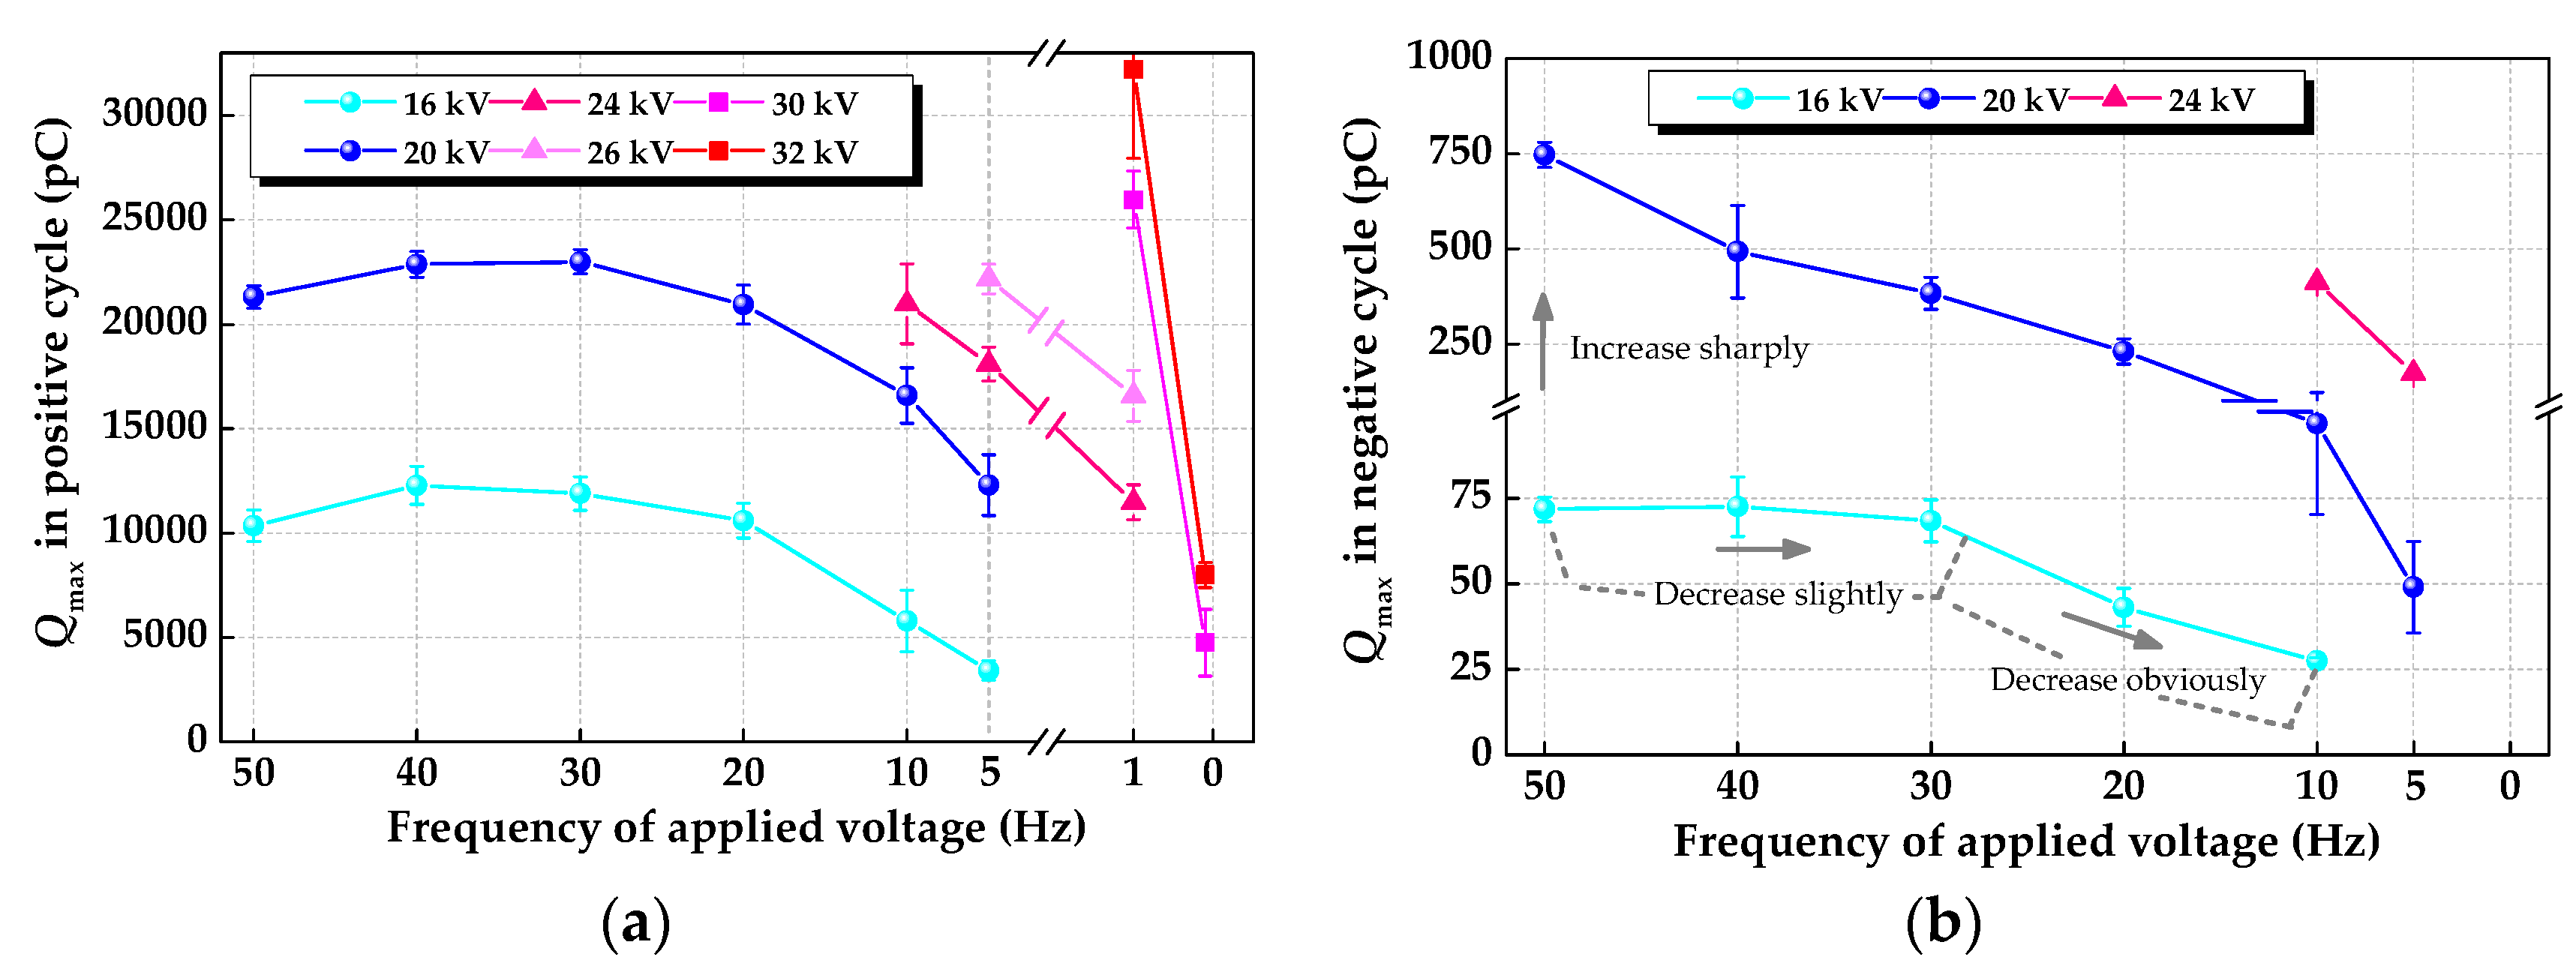
3.1.2. Maximum Magnitude of Discharge

Under voltage with relatively low amplitude, discharge below 5 Hz does not initiate. Under voltage with relatively high amplitude, discharge above 5 Hz is so severe that the disperse noise from large discharge sometimes overlaps small discharge. Thus, the voltage amplitude and frequency is selected appropriately, as shown in Figure 5a. Discharge in positive cycle is more severe than that in negative one, which is consistent with the results in previous research [34]. The reason is that the positive streamer has a faster speed and is easier to develop than the negative streamer [35].
With the decrease of frequency, the maximum magnitude of discharge in positive cycle Qmax+ first increases slightly, and then decreases obviously with a faster descending rate under lower frequency. When the amplitude is 20 kV, Qmax+ under 5 Hz decreases by 42.26% compared with 50 Hz. When the amplitude is 32 kV, Qmax+ under 1 Hz decreases by 75.17% compared with 0.1 Hz. The maximum magnitude of discharge in negative cycle Qmax shows a continuous decreasing trend. When the amplitude is 20 kV, Qmax under 5 Hz decreases by 93.44% compared with 50 Hz.
With the increase of amplitude of applied voltage, Qmax+ and Qmax under each frequency both increase. The increasing rate decreases with the increase of amplitude. Taking 5 Hz as an example, Qmax+ under 20 kV and 24 kV increases by 260.04% and 429.48% compared with 16 kV.

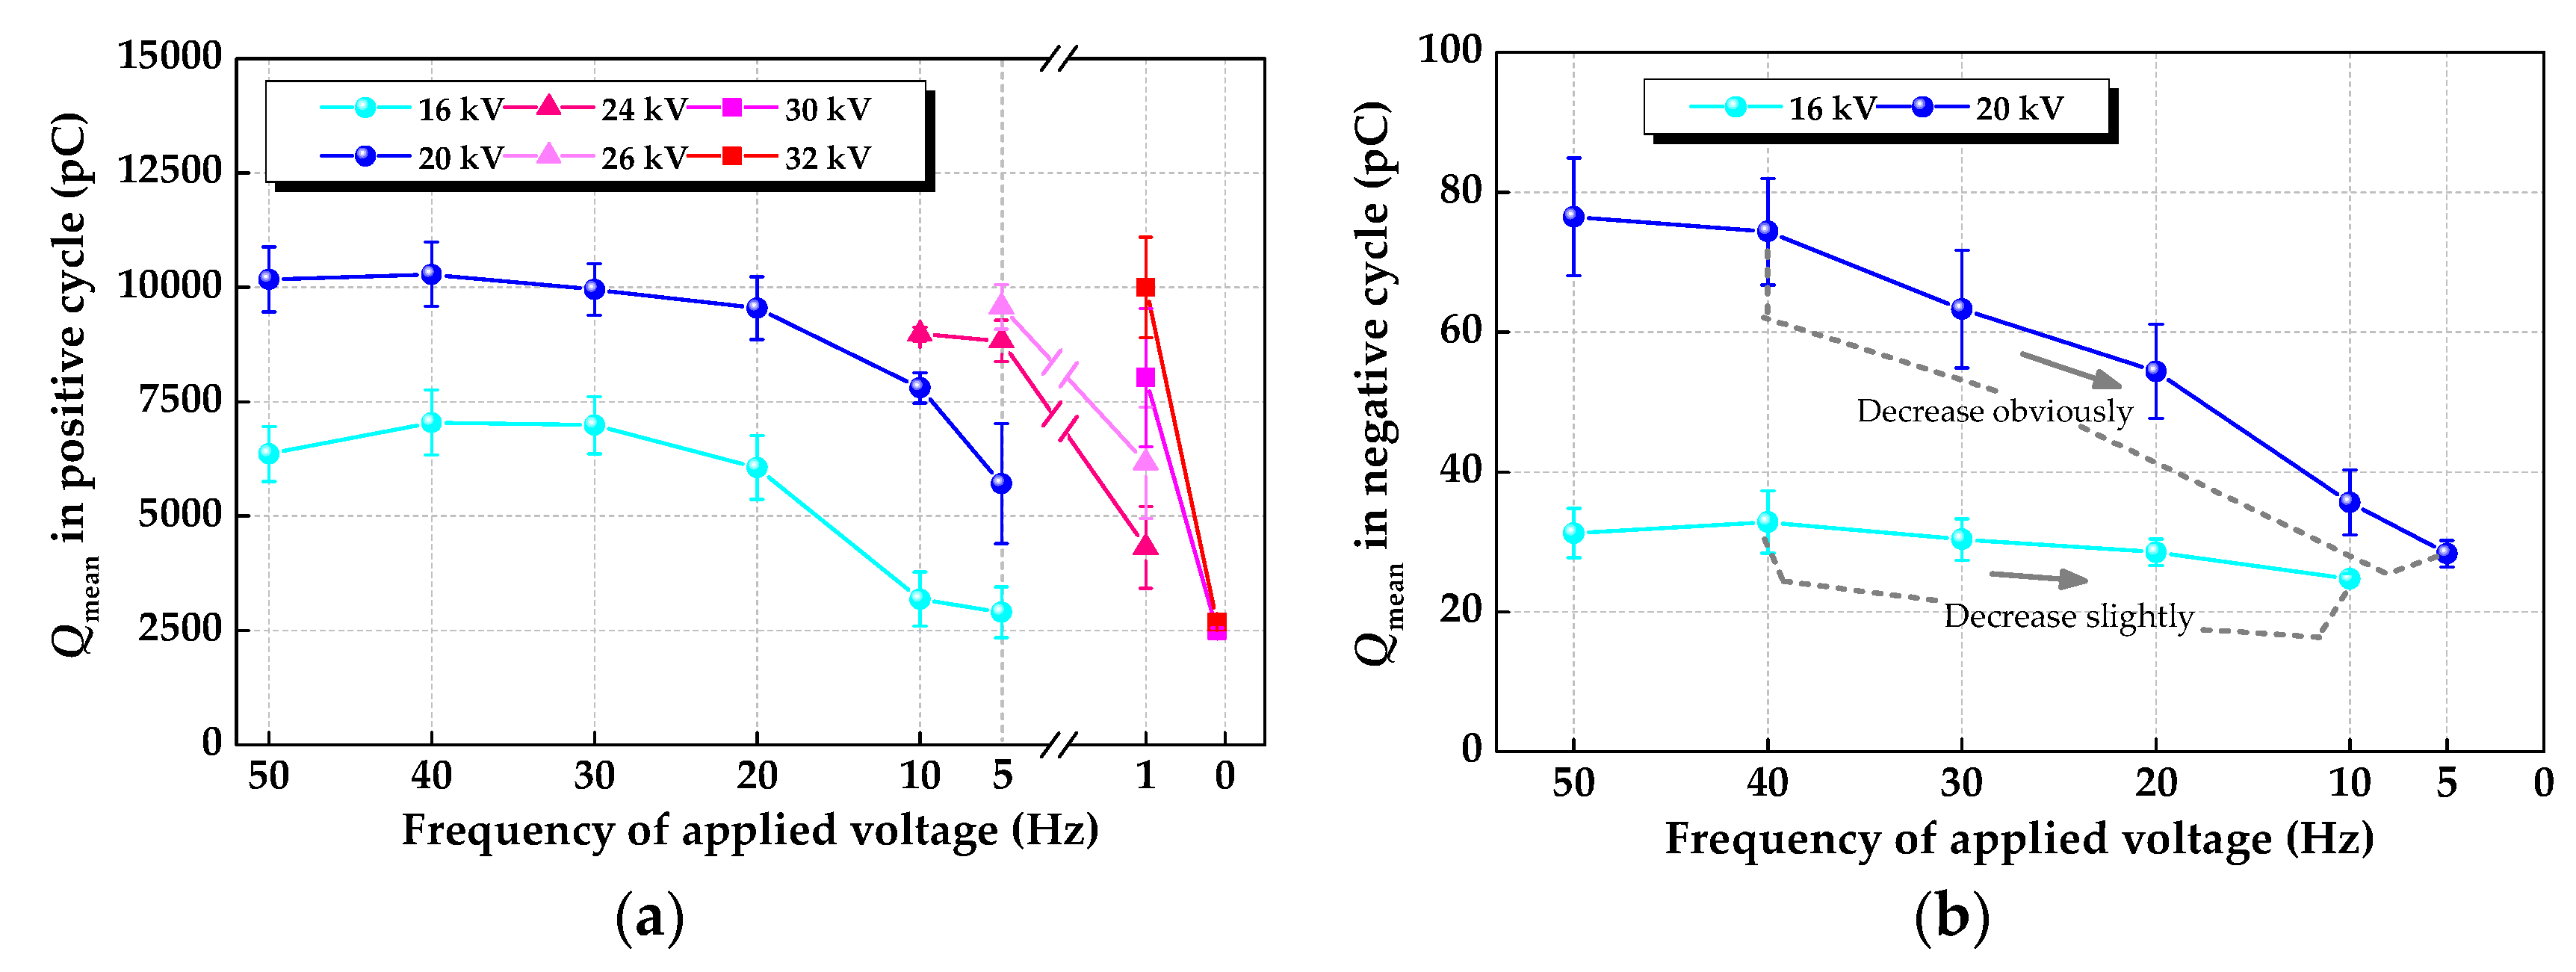
3.1.3. Mean Magnitude of Discharge

With the decrease of frequency, Qmean+ shows a decreasing trend with a faster descending rate under lower frequency, as shown in Figure 6a. When the amplitude is 20 kV, Qmean+ under 5 Hz decreases by 43.88% compared with 50 Hz. Qmean decreases slightly under relatively low voltage, while it decreases obviously under relatively high voltage. When the amplitude is 20 kV, Qmean under 5 Hz decreases by 62.98% compared with 50 Hz.
With the increase of amplitude, Qmean+ and Qmean under each frequency both increase. Taking 1 Hz as an example, Qmean+ under 26 kV, 30 kV, and 32 kV increases by 42.91%, 86.16%, and 131.90% compared with 24 kV.

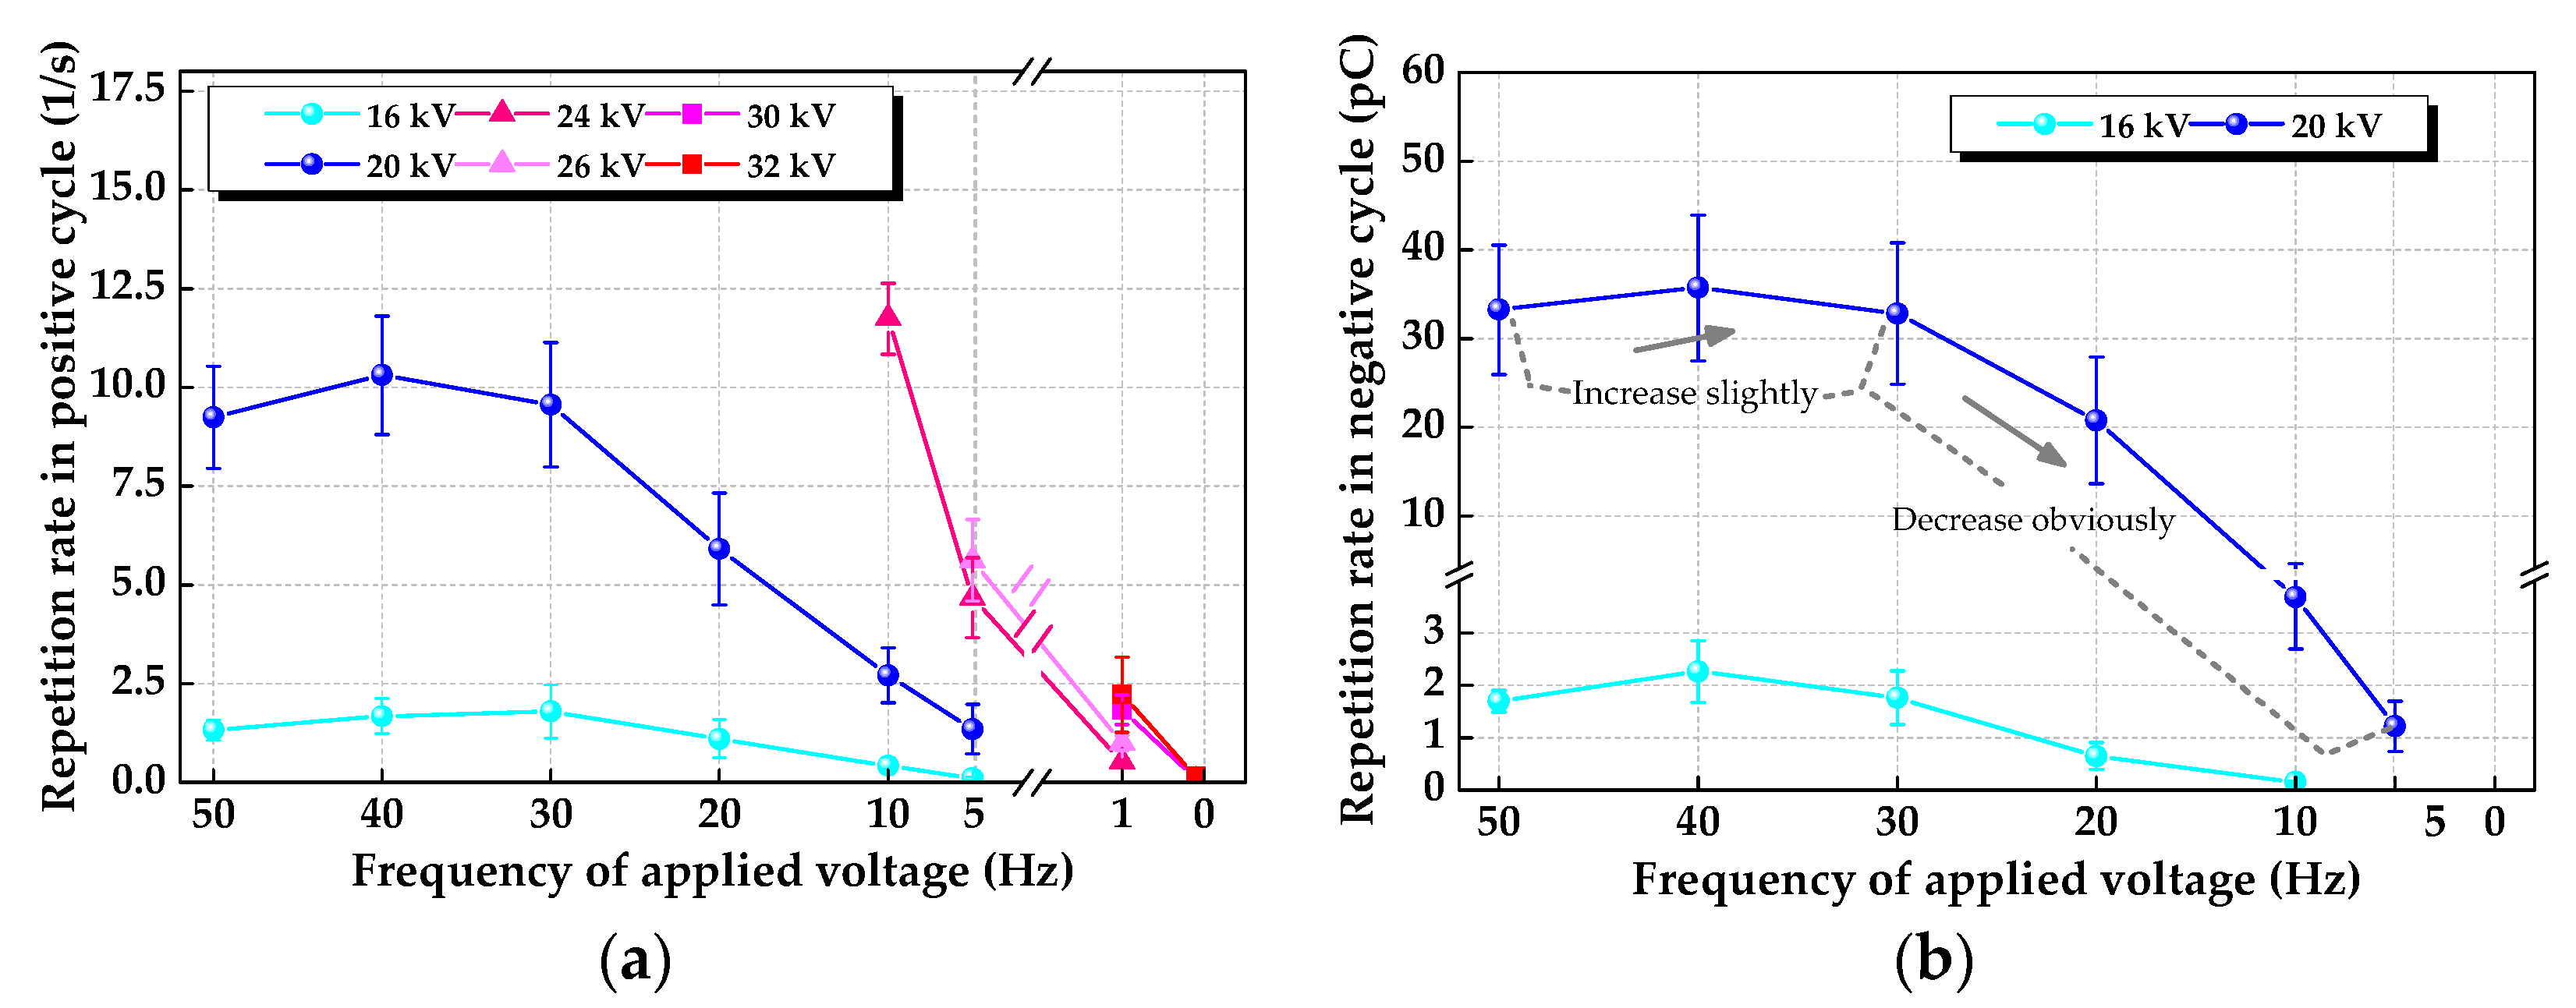
3.1.4. Pulse Repetition Rate
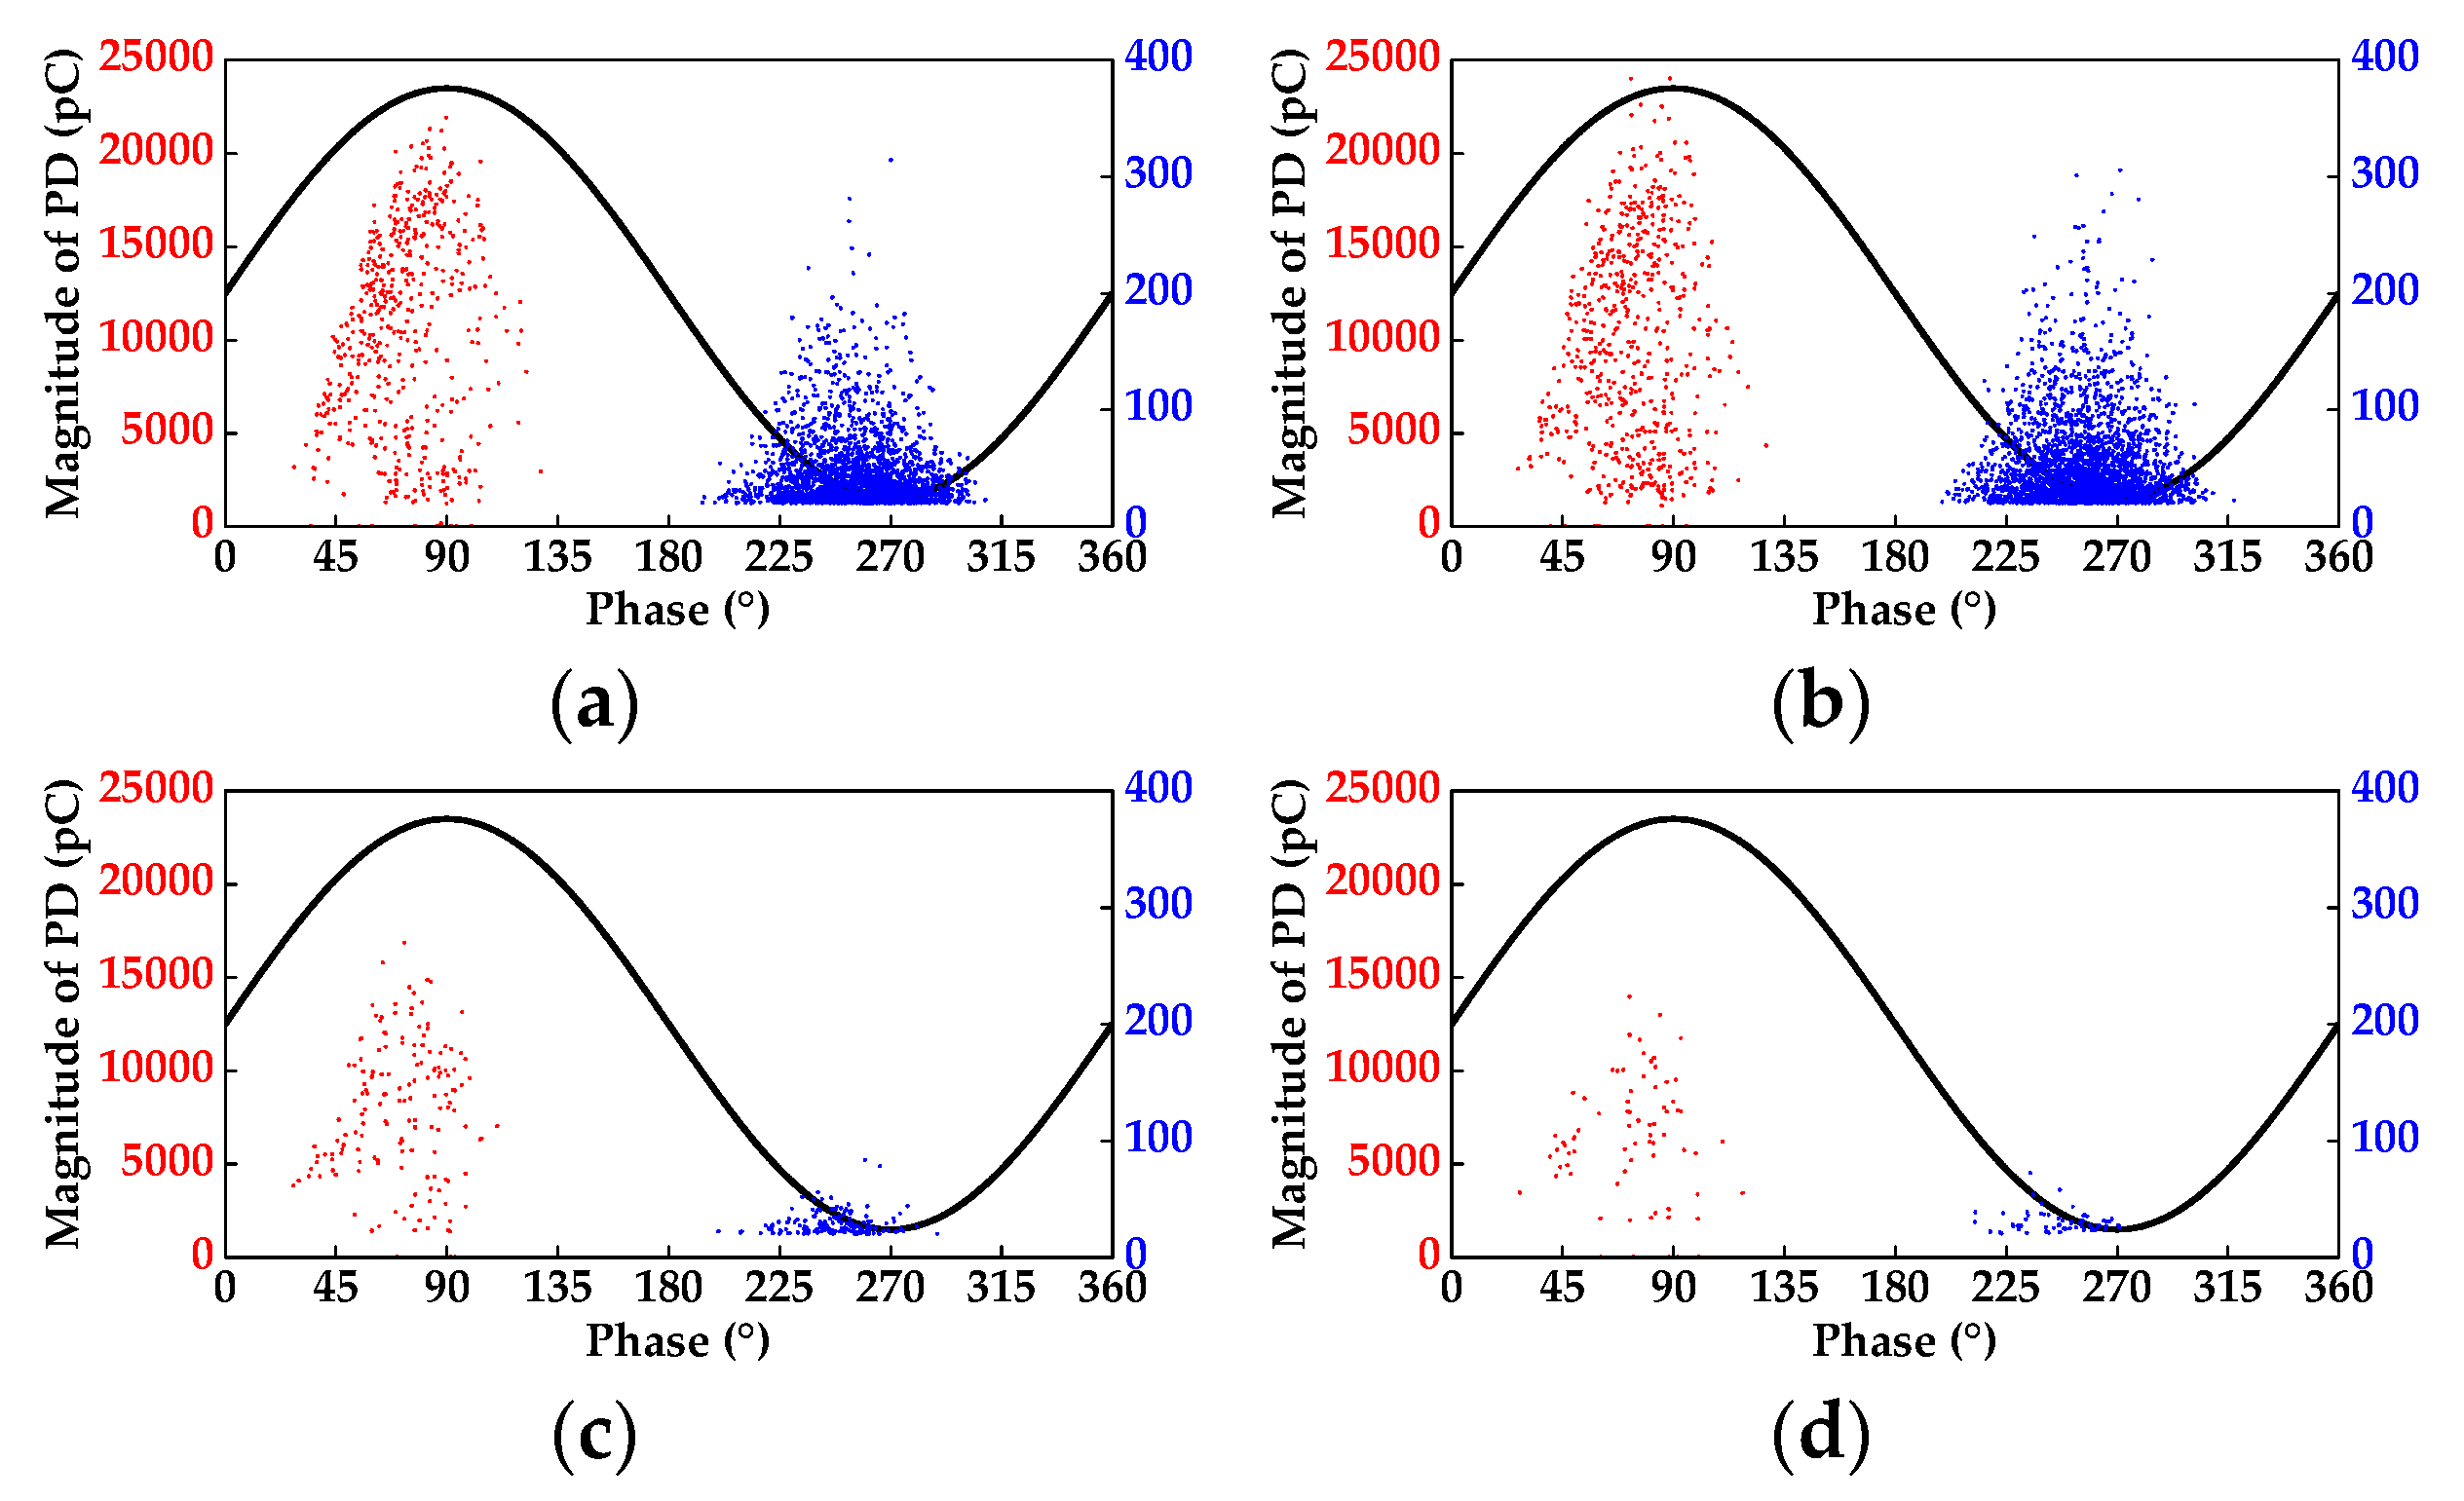
With the decrease of frequency, the pulse repetition rate in positive and negative half cycle (R+ and R) both first increase slightly, and then decrease obviously, with a faster descending rate under lower frequency, as shown in Figure 7. When the amplitude is 20 kV, R+ under 5 Hz decreases by 85.39% compared with 50 Hz. R under 5 Hz decreases by 96.33% compared with 50 Hz.
With the increase of amplitude, R+ and R under each frequency both increase. Taking 1 Hz as an example, R+ under 26 kV, 30 kV, and 32 kV increases by 93.68%, 257.13%, and 331.67% compared with 24 kV.

3.2. PRPD

PRPD is an intuitive indicator for mode recognition of insulation defect. PRPD of the defect in this research from rated AC frequency to 5 Hz is shown in Figure 8. The amplitude of applied voltage is 20 kV. There are some common features under each frequency. Discharge in positive half cycle is more severe than that in negative half cycle. Discharge is distributed around the voltage peaks and appears like a mountain shape. With the decrease of frequency, the discharge magnitude, the range of the discharge magnitude, and repetition rate all decrease, which makes the mountain shape become vague, as shown in Figure 8a–d.
Because discharger under 1 Hz and 0.1 Hz does not initiate under 20 kV, the amplitude selected for them is 32 kV. Under 1 Hz, the pattern in positive half cycle changes to closer to a half mountain shape with only the left part, because the discharge termination phase is put forward, as shown in Figure 9a. More charge of the same polarity with high voltage electrode is produced during the left part of the mountain under lower frequency, which weakens the electric field intensity during the right part and suppresses the discharge there. The initial phase under lower frequency is put forward, which will be discussed in the following text.

3.3. Statistical Patterns and Characteristic Parameters

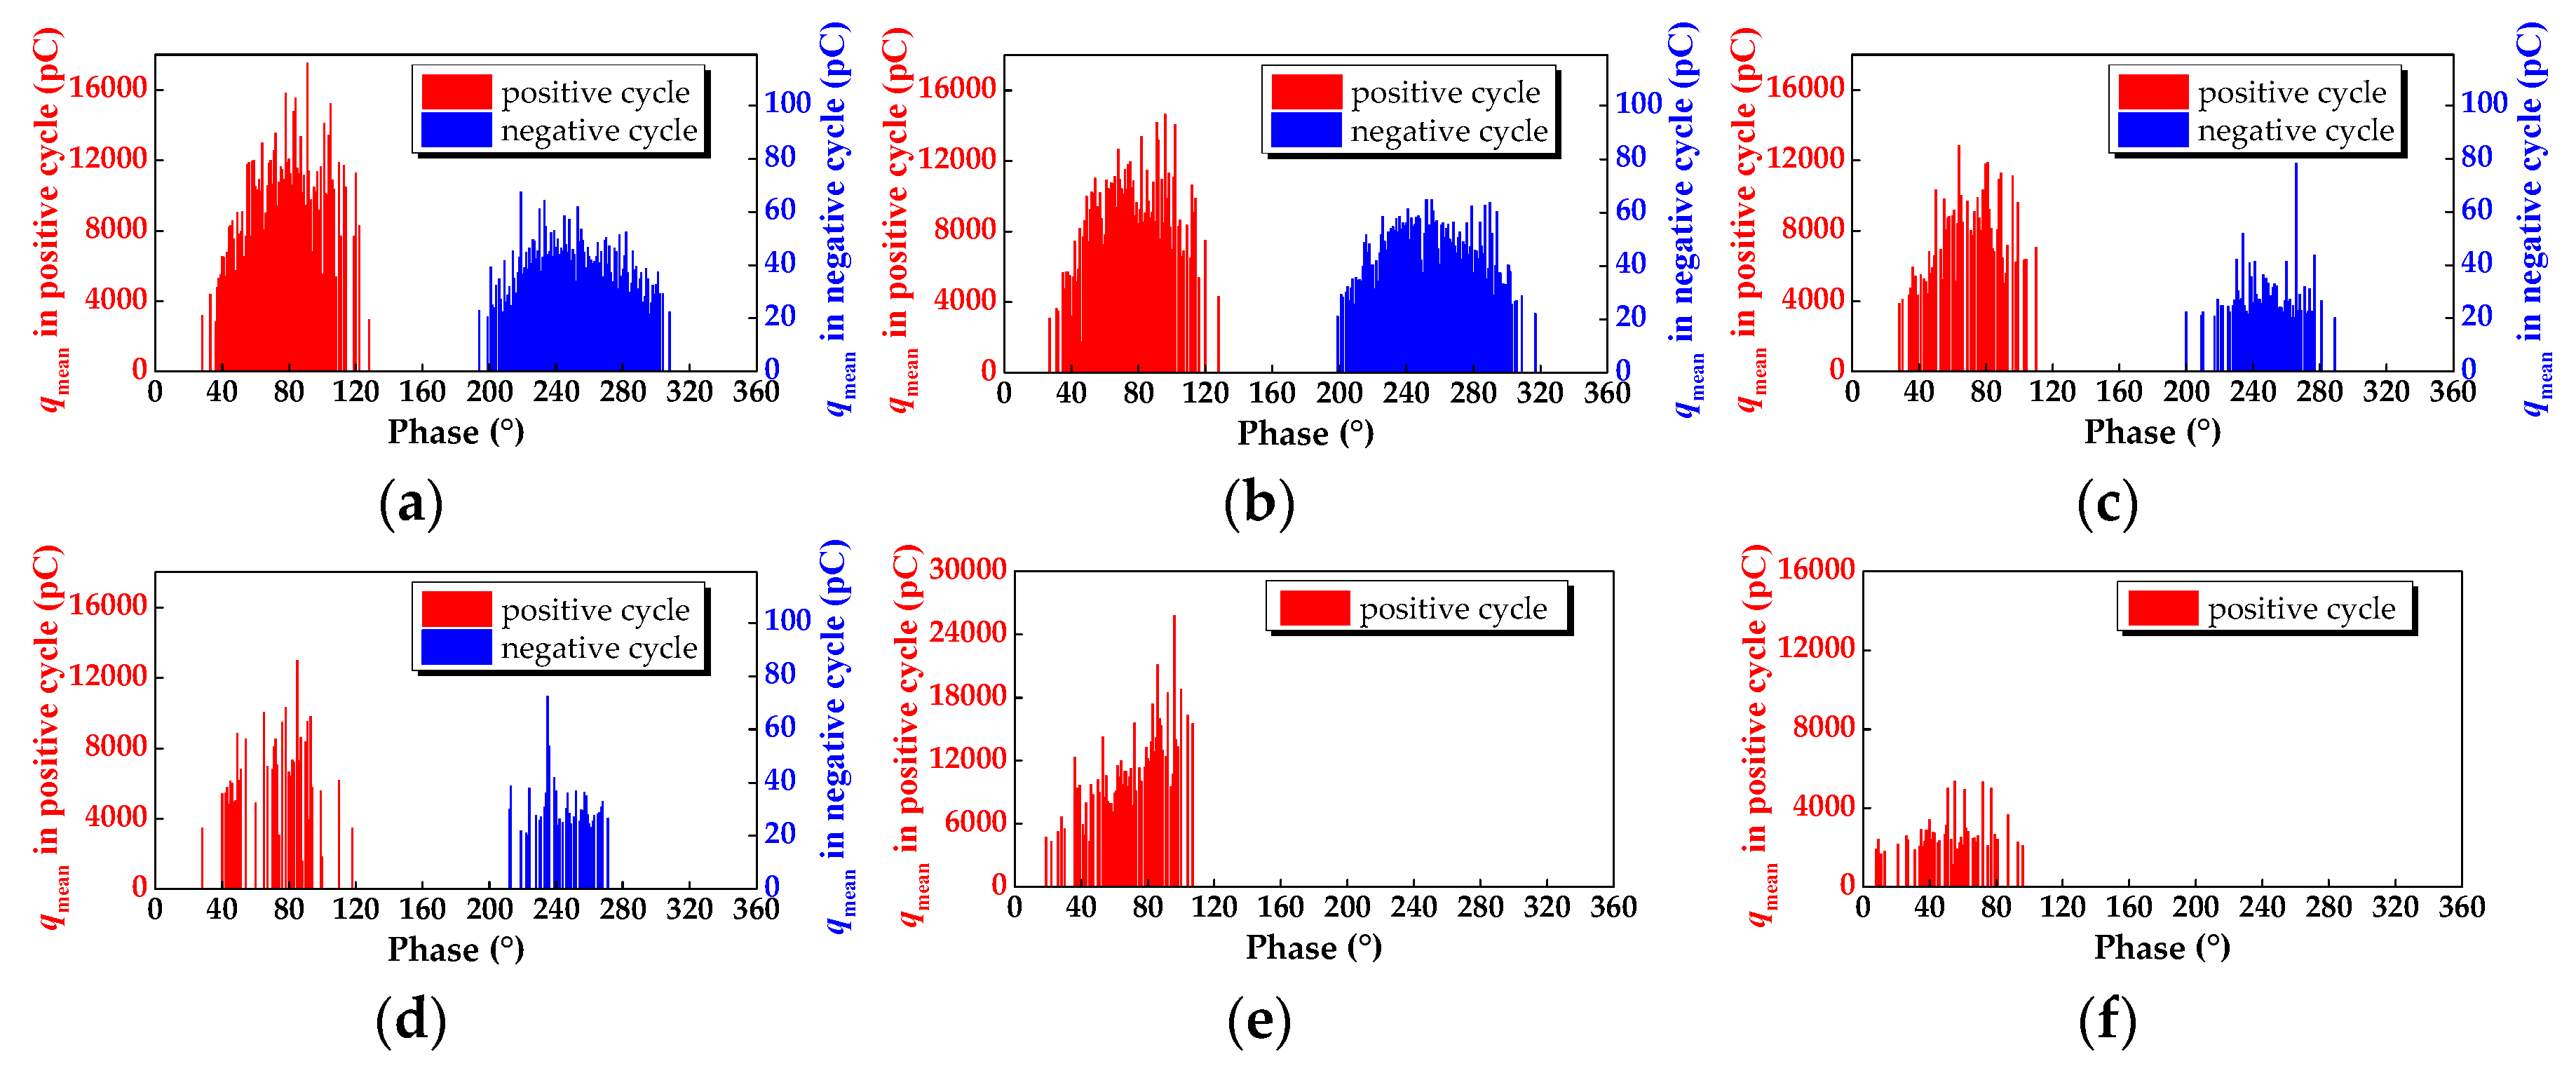
3.3.1. Statistical Patterns

qmeanφ pattern under 50 Hz in positive and negative half cycle both appear like a rectangular shape superimposed by a triangle shape on the top, as shown in Figure 10a. With the decrease of frequency, the peak value of the patterns decreases, from 17 nC under 50 Hz to 13 nC under 5 Hz in positive half cycle. Discharge in negative half cycle does not initiate below 1 Hz. Only the left part of the triangle shape remains under 1 Hz. Several peaks appear in the pattern under 0.1 Hz.
nφ pattern under 50 Hz in positive and negative half cycle both appear like a mountain shape, as shown in Figure 11a. The peak value of positive half cycle is less than that of negative half cycle. With the decrease of frequency, the peak value decreases, from about 21 PDs/s under 50 Hz to 6 PDs/s under 5 Hz in positive half cycle. The pattern in negative cycle disappears below 1 Hz. The pattern appears several peaks under 0.1 Hz.
In nq pattern, discharge is divided into two parts, the small discharge and large discharge part. The boundary of the two parts is 100 pC. The small discharge part is mainly from the negative cycle and the large discharge part is mainly from the positive cycle. Under 50 Hz, the small discharge part decreases rapidly like a right-angled triangle. The large discharge part distributed widely like a turtle back. It indicates the different mechanism of the development of a positive and negative streamer. The positive streamer has a faster speed, more complex structures, and more modes of development stage [35], resulting in a wide spread nq pattern. Additionally, the small branches of the negative steamer may be suppressed by the main branch, resulting in a regular nq pattern.
With the decrease of frequency, the range of vertical and horizontal axis of two parts both decreases, as shown in Figure 12a–d. It is because of the aggravation of the weakening of the electric field by residual space charge under lower frequencies. When the frequency continues to decrease, the left part of large discharge turns to be like a right-angled triangle rather than a turtle back, as shown in Figure 12e. Under 0.1 Hz, the horizontal range of pattern shortens, as shown in Figure 12f. The reason is that with the decrease of dU/dt, the randomness and difference of discharge in positive cycle tends to be smaller.

3.3.2. Characteristic Parameters

The variation trend of characteristic parameters is shown in Figure 13. With the decrease of frequency, the skewness of all the statistical patterns decreases and then increases under 0.1 Hz. Sk+(qmeanφ) decreases from −0.0232 under 50 Hz to −0.4283 under 1 Hz, which indicates the qmeanφ pattern in positive half cycle shifts from a near normal distribution to a right bias distribution. However, it increases to −0.1525 under 0.1 Hz. With the same variation trend, Sk+(nφ) first decreases from 0.1706 under 50 Hz to −0.315 under 5 Hz, and then slightly increases to −0.04417 under 0.1 Hz, approaching the normal distribution. The reason for the decrease is that more charge of the same polarity with high voltage electrode accumulates under lower frequency and suppresses the discharge on the right of the peak, as shown in Figure 10e. The reason for the slight increase under 0.1 Hz is that the variation rate of voltage decreases and the voltage waveform tends to be flat, which makes the difference of each discharge smaller.
Sk(qmeanφ) decreases from 0.04764 under 50 Hz to −0.1859 under 10 Hz, shifting from a near normal distribution to a slightly right bias distribution. Sk(nq) decreases from 2.5402 under 50 Hz to 0.7842 under 10 Hz, which means the degree of left bias decreases.
Ku+(qmaxφ), Ku(qmaxφ), Ku+(qmeanφ) and Ku(qmeanφ) all show an increasing trend. Among them, Ku+(qmeanφ) increases from −0.8699 under 50 Hz to −0.3583 under 0.1 Hz, indicating the pattern gets sharper but is always flatter than normal distribution. Under lower frequencies, with the decrease of dU/dt, the magnitude of more discharge tends to be close, which causes some large discharge to be distinct and finally makes the pattern sharper. Ku+(nφ) does not show an obvious frequency dependence and is always smaller than zero. Ku(nq) first increases from 5.2148 under 50 Hz to 6.1808 under 30 Hz, and then decreases to −0.7924 under 10 Hz. Under lower frequencies, it is more difficult for the discharge in negative cycle to develop. Thus, the small discharge part tends to be lower, which makes the nq pattern become flatter, as shown in Figure 12a–d.
The value of Asy(qmaxφ) and Asy(qmeanφ) under each frequency is near zero. Among them, Asy(qmeanφ) is less than 0.007, which indicates the discharge in negative half cycle is far smaller than that in positive half cycle. The reason is that the negative streamer has a lower speed and is more difficult to develop than the positive streamer.
Asy(nφ) decreases from 4.9765 under 50 Hz to 1.0506 under 10 Hz, indicating the difference between the distribution of nφ in positive and negative cycle descends. This is because the decrease of pulse repletion rate in negative cycle is faster than that in positive cycle, as shown in Section 3.1.4. Discharge in negative cycle is more sensitive to the decrease of frequency.
Cc(qmaxφ), Cc(qmeanφ), and Cc(nφ) all decrease. Cc(qmeanφ) decreases from 0.7913 under 50 Hz to 0.5634 under 10 Hz, indicating the outlines of the qmeanφ pattern in positive and negative cycle become more different.

4. Discussion and Analysis

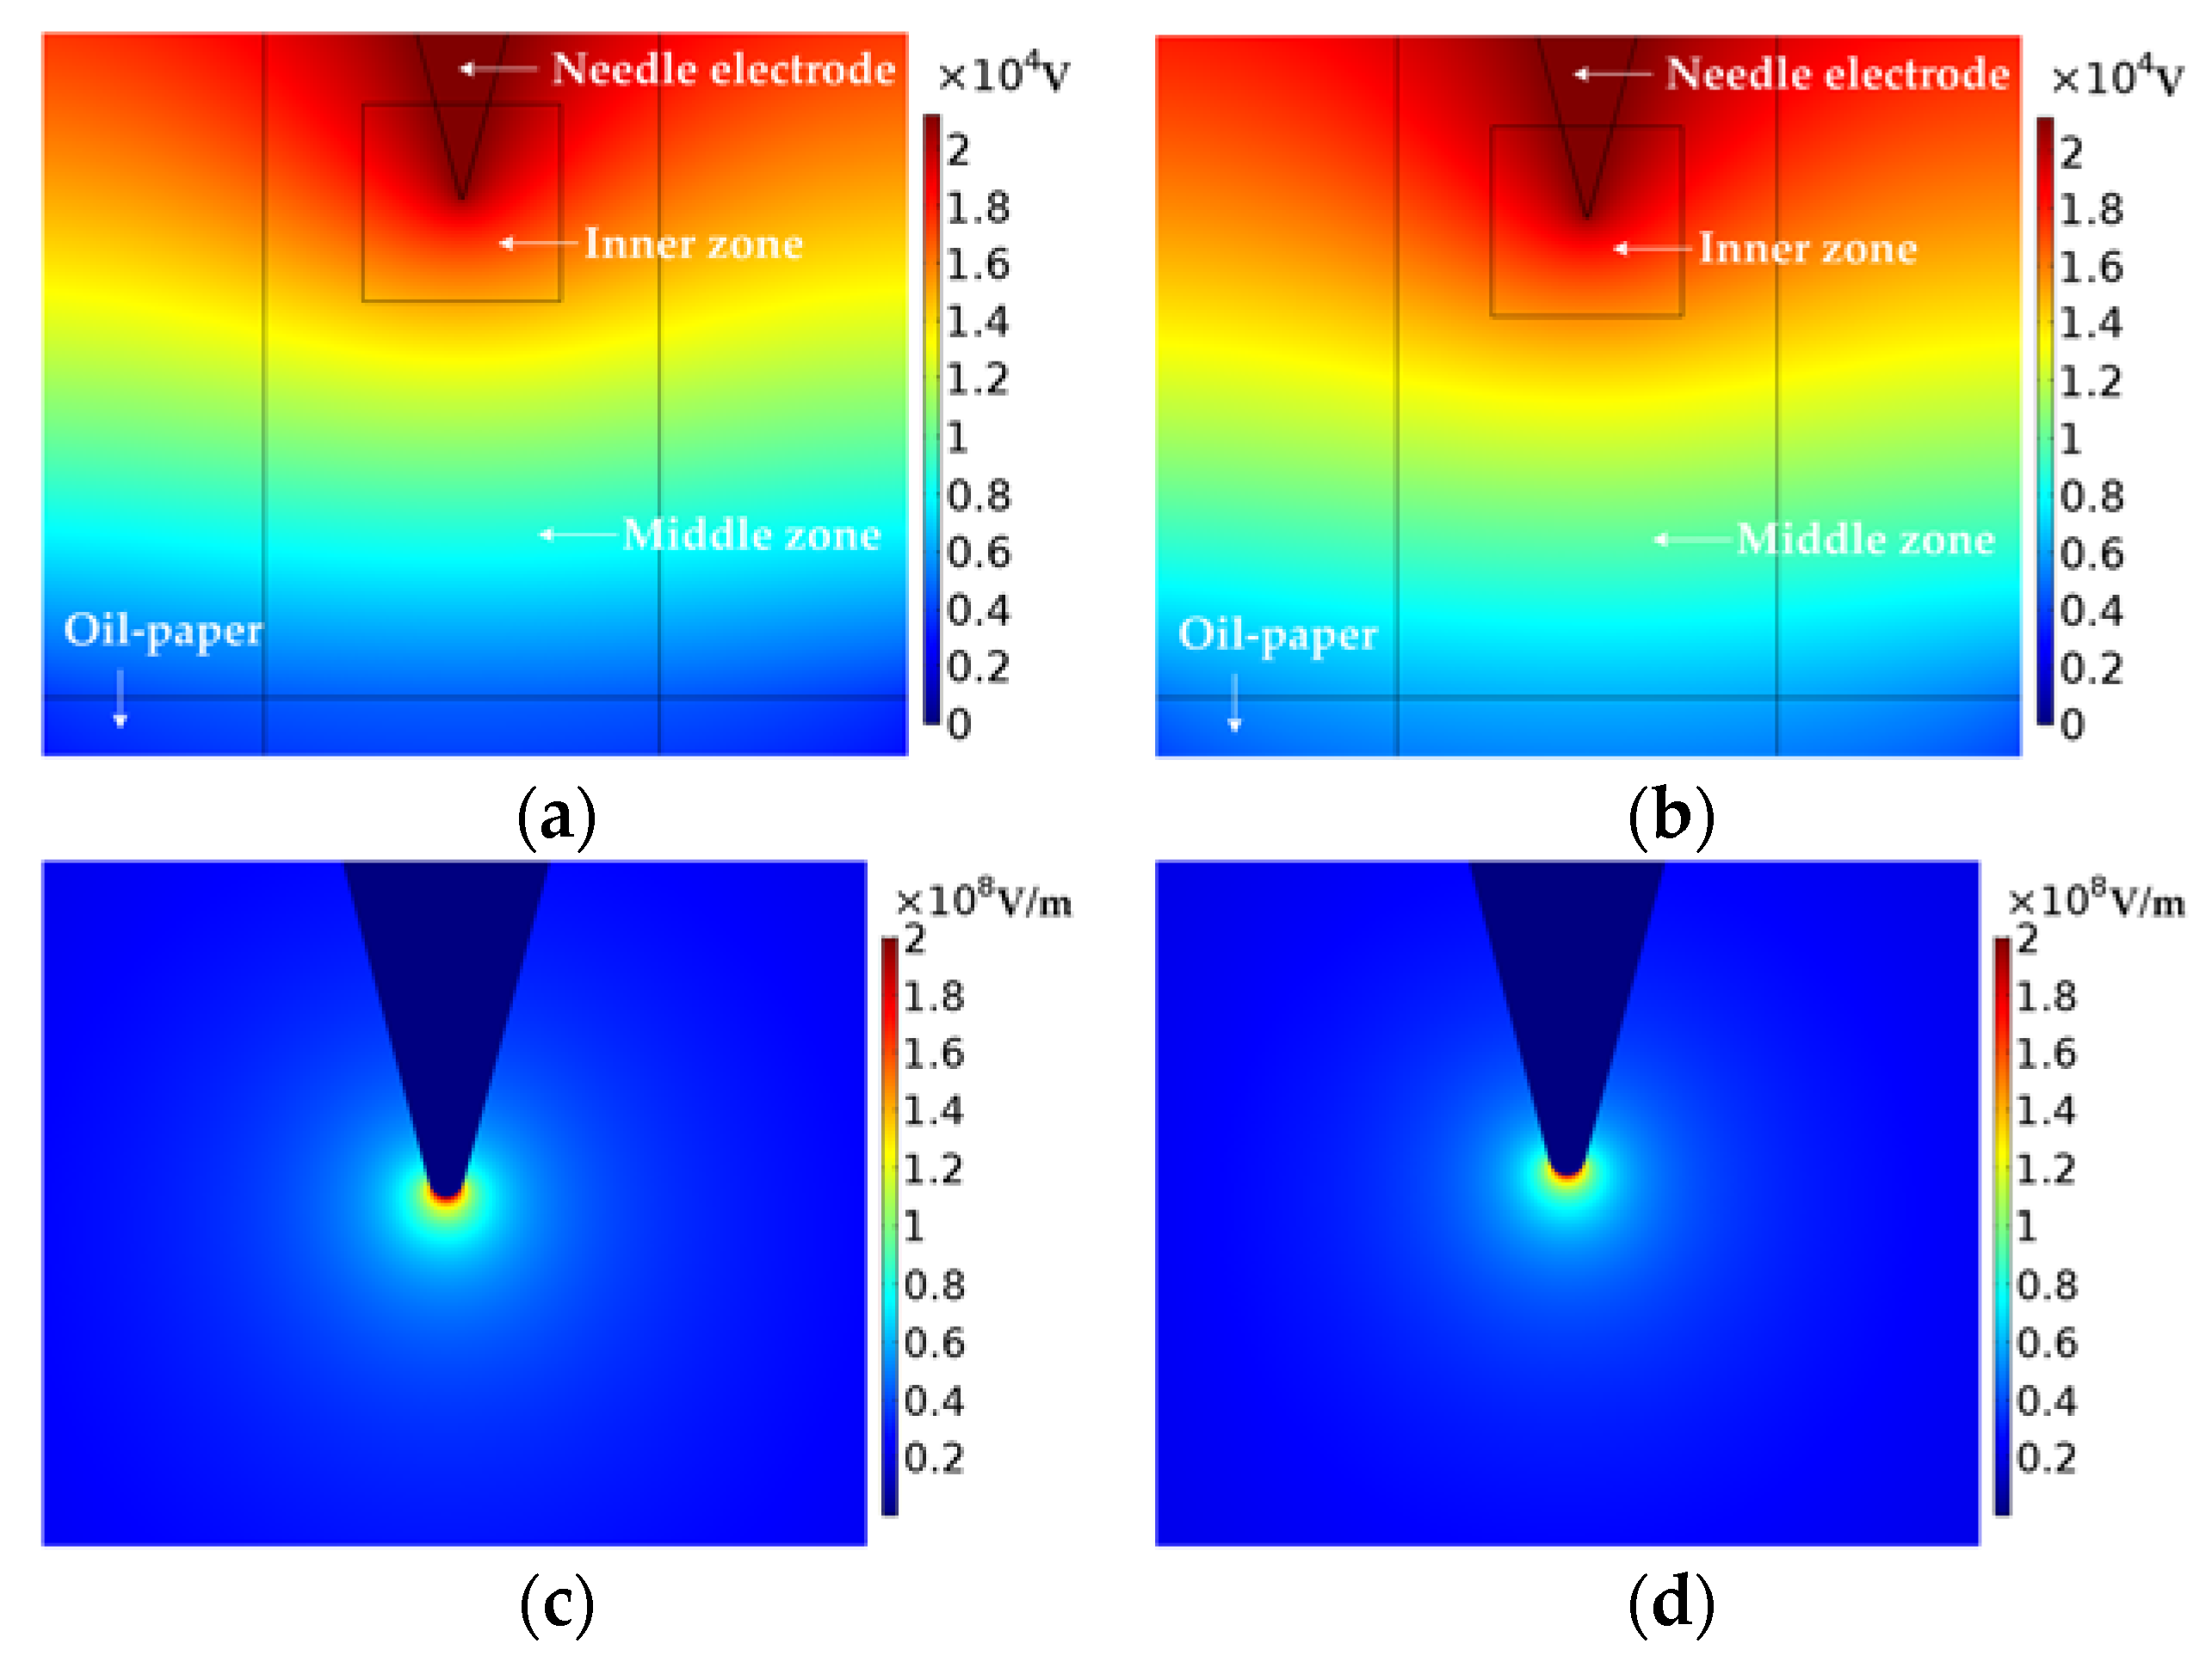
4.1. Influence on Electric Field Distribution of Frequency

The insulating oil is weakly polar dielectric, and the fibre that makes up the insulating paper is polar dielectric. The capacitive property of them is mainly formed by dipole relaxation polarization. When the frequency of applied voltage decreases, the speed of the polar molecules turning its direction with the change of electric field becomes slower. Finally, the degree of polarization increases and the dielectric constant increases [36]. The distribution of the electric field will be affected by the variation of dielectric constant, which is simulated with the software Comsol Multiphysics. The governing equation of electric field is as follows, including the current continuity equation as Equation (1), the full current equation as Equation (2), and the relation equation of electric field intensity and potential as Equation (3) [37]. In the equations, J is the current density, σ is the conductivity, E is the electric field intensity, ω is the angular frequency of applied voltage, D is the displacement current, and V is the potential.
J = 0
J = σ E + j ω D
E = V
Besides the dimensions of the components given in Section 2.1, other dimensions are all defined according to the experimental electrode. The diameter of the insulating paper is 90 mm. The thickness of the plate electrode is 15 mm. The upper part of the needle is a cylinder with the diameter of 0.25 mm and the length of 10 mm. The angle of the needle tip is 60°. The diameter of the cylindrical conducting rod that connected to the needle is 9 mm and its length is 30 mm. To obtain a relatively accurate result, the part near the needle tip is divided into three refined meshing regions. The smallest unit size of the inner region is 0.0005 mm, which is 0.002 mm in the middle region and 0.02 mm in the outer region. The smallest unit size of other parts of the model is 0.1 mm. The dielectric constant of insulating oil and oil impregnated paper under different frequencies is shown in Table 2, which is measured by the Novolcontrol dielectric and impedance measurement system. The conductivity of insulating oil and oil-paper is σ1 = 8.0 × 10⁻¹³ S/m and σ2 = 8.6 × 10⁻¹⁵ S/m. Figure 14 demonstrates the distribution of potential and electric field under 50 Hz and 0.1 Hz. A comparison of the electric field intensity along the gap under 50 Hz and 0.1 Hz is shown as Figure 15. Table 3 gives the electric field intensity at the point 0.1 mm from the needle tip in the vertical direction toward the plate electrode from rated AC frequency to very low frequency.
The electric field intensity under each frequency decreases rapidly near the needle tip. The further from the tip, the slower the decline rate. The electric field is concentrated in the vicinity of the tip of about two to four times the radius of curvature, which is consistent with the hottest spot demonstrated in research [38]. The decrease of potential in the oil gap under 50 Hz is slightly faster than that under 0.1 Hz, which indicates a higher electric field intensity under 50 Hz. With the decrease of frequency, the dielectric constant of insulating oil and oil-paper both increase. Firstly, the rising rate of oil-paper is larger than that of oil, then inversely, the latter is larger. Thus, the ratio of the dielectric constant of oil-paper to oil first increases and then decreases, which dominates the electric field in the oil gap. The variation trend of electric field in the oil gap is consistent with the variation trend of maximum and mean magnitude of discharge and pulse repetition rate given in Section 3.1. The descending rare of the electric field becomes larger with the decrease of frequency, with the same characteristic of the descending rare of discharge statistical parameters. However, the deviation ratio of electric field intensity to 50 Hz under different frequencies is relatively small expect 0.1 Hz. There are still other factors that lead to the influence on discharge of frequency, which will be discussed in Section 4.2.

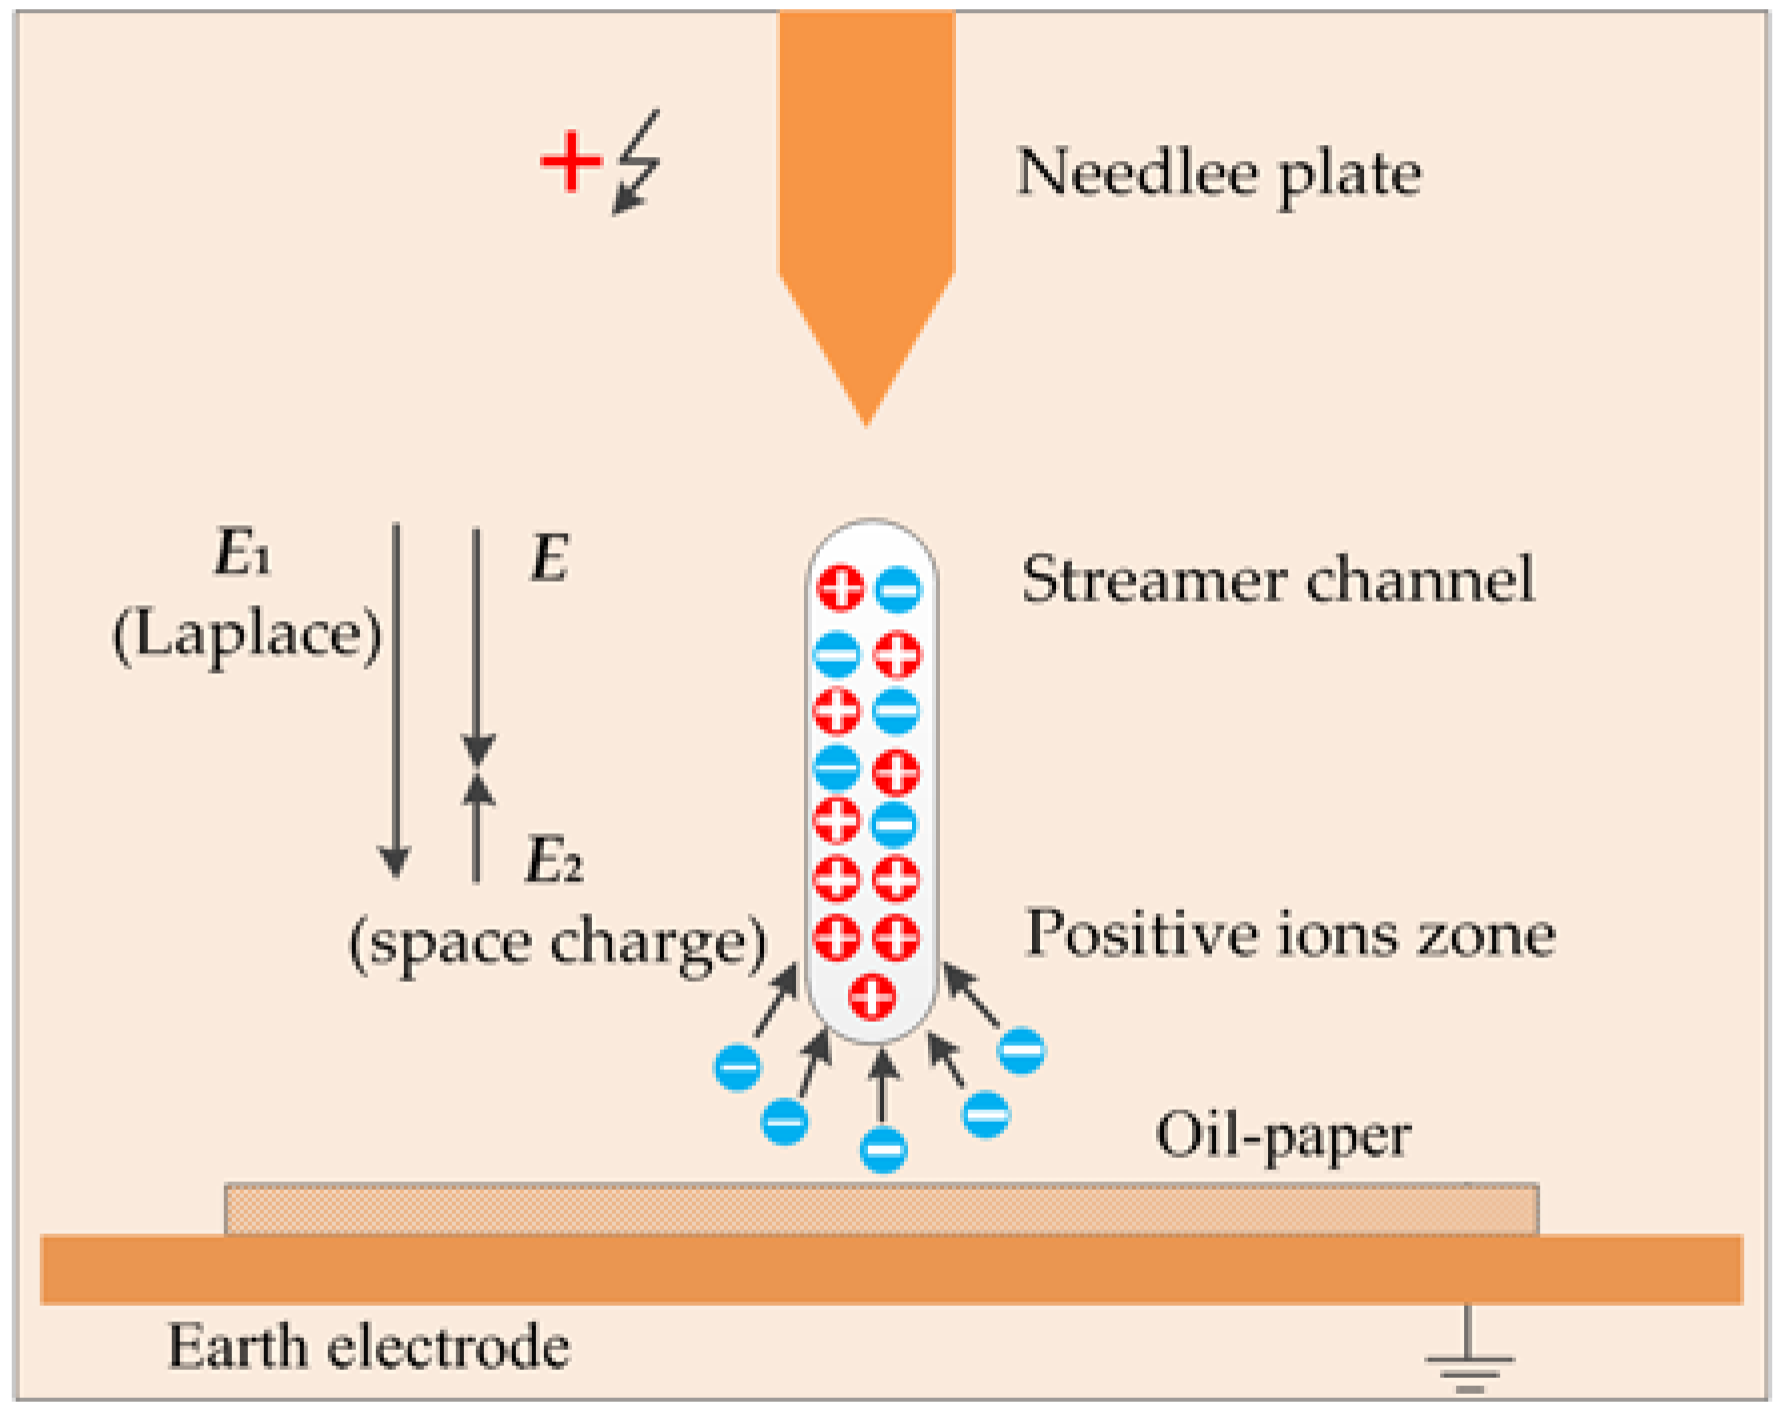
4.2. Influence on Discharge Process of Frequency

The electric field intensity increases with the increase of applied voltage. When it exceeds the withstand strength of the micro bubble near the tip, micro discharge occurs [39]. Energy produced by the discharge accelerates the ionization of liquid molecule. The charge generated enhances the electric field intensity at the head of discharge region, which leads the discharge to develop and form a streamer channel. As shown in Figure 16, the electrons are attracted by the positive ions with high density in front of the streamer channel and flow into it, which develops towards the opposite electrode. The electric field in the gap E is the combination of the Laplace electric field from applied voltage E1 and the electric field from space charge E2. The space charge is of the same polarity of high voltage electrode and weakens the electric field. The frequency affects the generation and dissipation of space charge, resulting in influence on the discharge process.
As shown in Figure 17, discharge occurs after a discharge delay τdelay when the applied voltage exceeds the theoretical discharge value. For u(t) = Umsin(2πft), where u(t) is the applied voltage and Um is its peak value with the unit of kV, the initial time is shown in Equation (4). Under lower frequency, the voltage phase that τdelay occupies decreases, causing the initial phase to be put forward, as shown in Figure 8.
t 1 = 1 2 π f arcsin U cr U m + τ delay
The effective discharge time teffect is proposed to demonstrate the time when the applied voltage meets the discharge condition. teffect in a half cycle is shown as Equation (5). Although τdelay varies statistically, its order of magnitude is smaller than that of the first part of Equation (5). Thus, with the decrease of frequency, teffect increases. On the one hand, more time will be available for discharge, which promotes the development of discharge. As shown in Section 3.1, the discharge statistical parameters first increase in some frequencies. On the other hand, more space charge will accumulate in a half cycle, which aggravates the weakening of the electric field and suppresses the development of discharge. The final decision of the two effects is a result of which one plays a dominant role. It can be inferred from the experimental results that the second effect dominates below 10 Hz. The termination phase is put forward under lower frequency, which is more evidence to show the aggravation of the weakening of electric field by space charge.
t effect = 1 f ( 1 2 1 π arcsin U cr U m ) τ delay
The time interval between the termination of the previous half cycle and the inception of the successive half cycle is shown as Equation (6). With the decrease of frequency, tinterval increases. More time is available for the space charge from the previous half cycle to dissipate, which reduces the enhancement of the electric field in the successive half cycle. Also, less seed electrons will remain for the successive half cycle. This is consistent with the increasing trend of PDIV.
t interval = 1 f 1 π arcsin U cr U m + τ delay

5. Conclusions

The characteristics of corona discharge in insulating oil are studied from rated AC frequency to very low frequency (0.1 Hz) based on the impulse current method. The main conclusions are as follows.
(1)
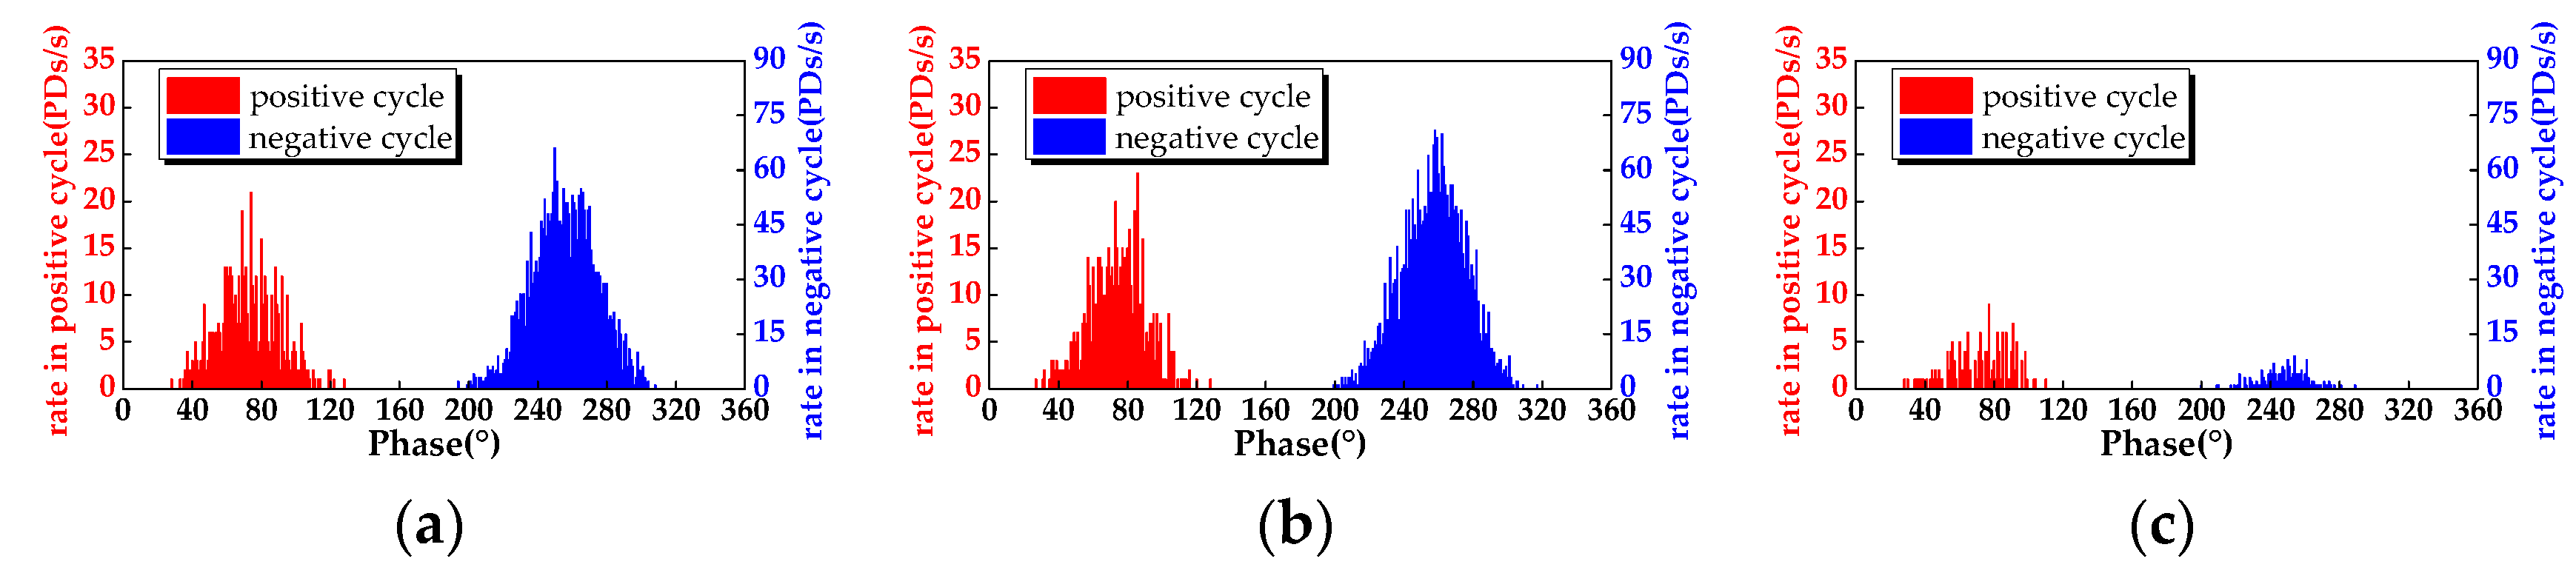
Some fundamental characteristics remained, even the frequency decreases. Discharge in positive half cycle initiates earlier than that in negative half cycle. The magnitude of discharge in positive half cycle is obviously larger than that in negative half cycle. Discharge in both cycle distributes in the vicinity of voltage peak.
(2)
With the decrease of frequency, the inception voltage increases, which, under 0.1 Hz, is 2.4 times of that under rated AC frequency. The maximum and average magnitude of discharge and pulse repetition rate first increase slightly and then decrease obviously. For the voltage amplitude of 20 kV, Qmax+ under 5 Hz decreases by about 40% compared with 50 Hz. Qmean+ decreases by about 45%. R+ decreases by about 85%.
(3)
The range of the qmeanφ, nφ, and nq patterns shortens. The right side of the mountain shape of qmeanφ pattern gradually disappears. The range of the vertical axis in positive cycle under 5 Hz decreases by about 25%. The nφ pattern appears several peaks in positive cycle under 0.1 Hz. The range of the vertical axis in positive cycle under 5 Hz decreases by about 75%. The part of the large discharge in nq pattern changes from a turtle back shape to a right-angled triangle. The range of horizontal axis under 5 Hz decreases by about 50%.
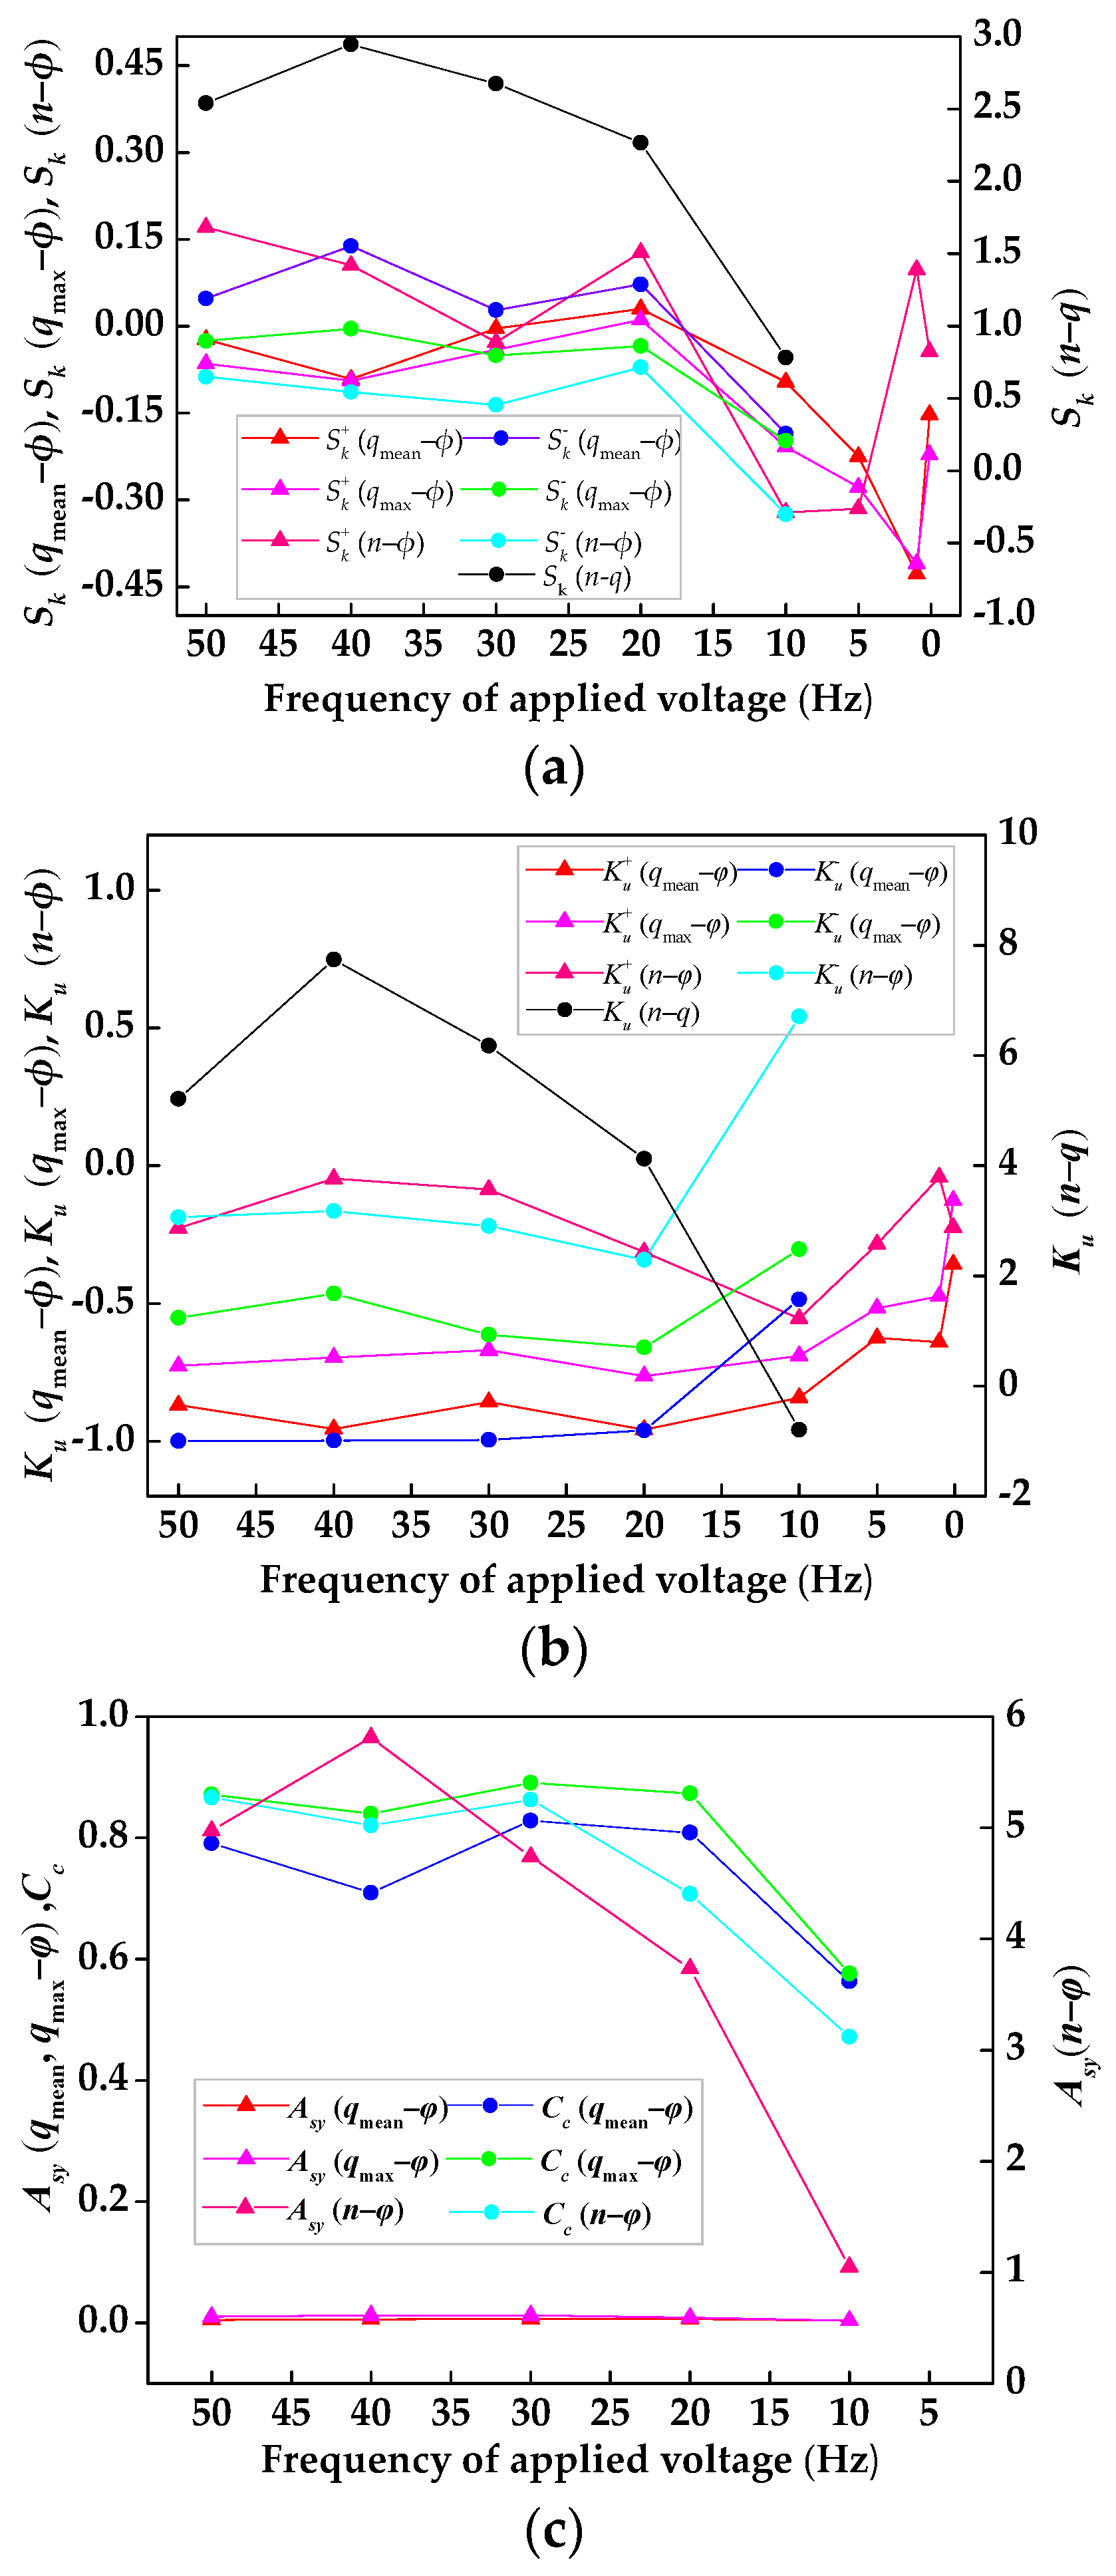
(4)
The skewness of all of the statistical patterns decreases and then increases under 0.1 Hz. Sk+(qmeanφ) decreases from −0.0232 under 50 Hz to −0.4283 under 1 Hz, and then increases to −0.1525 under 0.1 Hz. Ku(qmaxφ) and Ku(qmeanφ) increase. The value of Asy(qmaxφ) and Asy(qmeanφ) under each frequency is near zero. Cc(qmaxφ), Cc(qmeanφ), and Cc(nφ) decrease, indicating the similarity of the outlines of statistical patterns decrease.
The common features, as shown in (1), can still be the reference for mode recognition under low frequency. However, the differences of statistical parameters, statistical patterns, and characteristic parameters from that under rated AC frequency should be paid attention to in insulation defect diagnosis when using low frequency voltage, as shown in (2)–(4). If conditions permit, to measure the discharge information of equipment to be tested under multiple frequencies, rather than under a single frequency, and obtain the variation trends is beneficial to consolidate the insulation defect diagnosis.
The variation trends above are caused by the combination of the influence on electric field and discharge process of frequency. Future research may concentrate on discharge information of insulating oil with different aging time under low frequency. Also, it is interesting to examine the discharge characteristics of other kinds of insulation defects under low frequency. Further, the simulation model proposed calculates the intrinsic electric field of applied voltage, some efforts are needed to consider the electric field of the space charge in future analysis [40].

Author Contributions

Z.Z. and Y.Z. conceived and designed the experiments. Z.Z., X.H., and Y.Z. performed the experiments. Z.Z. analyzed the data and prepared the manuscript. Y.Z., M.W., and S.G. helped to analyze the data and gave some valuable suggestions.

Funding

This work is funded by the National Key R&D Program of China (2017YFB0902704) and the Science and Technology Project of SGCC (52018K160018).

Acknowledgments

This work is supported by the National Key R&D Program of China (2017YFB0902704) and the Science and Technology Project of SGCC (52018K160018).

Conflicts of Interest

The authors declare no conflict of interest.

References

  1. Glowacz, A.; Glowacz, W.; Glowacz, Z. Recognition of armature current of DC generator depending on rotor speed using FFT, MSAF-1 and LDA. Eksploat. Niezawodn. Maint. Reliab. 2015, 17, 64–69. [Google Scholar] [CrossRef]
  2. Glowacz, A.; Glowacz, W.; Glowacz, Z.; Kozik, J.; Gutten, M.; Korenciak, D.; Khan, Z.F.; Irfan, M.; Carletti, E. Fault diagnosis of three phase induction motor using current signal, MSAF-Ratio15 and selected classifiers. Arch. Metall. Mater. 2017, 62, 2413–2419. [Google Scholar] [CrossRef]
  3. Gutten, M.; Korenciak, D.; Kucera, M.; Sebok, M.; Opielak, M.; Zukowski, P.; Koltunowicz, T.N. Maintenance diagnostics of transformers considering the influence of short-circuit currents during operation. Eksploat. Niezawodn. Maint. Reliab. 2017, 19, 459–466. [Google Scholar] [CrossRef]
  4. Lei, T.; Faifer, M.; Ottoboni, R.; Toscani, S. On-line fault detection technique for voltage transformers. Measurement 2017, 108, 193–200. [Google Scholar] [CrossRef]
  5. Zhu, L.; Feng, H.; Ji, S.; Rehman, H.; Wu, X. Primary Differential pulse method for partial discharge detection of oil-immersed inverted current transformers. IEEE Trans. Power Deliv. 2018, 33, 1492–1494. [Google Scholar] [CrossRef]
  6. Saravanakumar, N.; Sathiyasekar, K. Efficient method for location and detection of partial discharge in transformer oil by DOA estimation of circular array of ultrasonic sensors. J. Instrum. 2018, 13, P01026. [Google Scholar] [CrossRef]
  7. Ma, G.; Zhou, H.; Shi, C.; Li, Y.; Zhang, Q. Distributed partial discharge detection in a power transformer based on phase-shifted FBG. IEEE Sens. J. 2018, 18, 2788–2795. [Google Scholar] [CrossRef]
  8. Bhimani, B.V. Resistance and capacitance measurement on high-voltage insulation at very-low frequencies. Trans. Am. Inst. Electr. Eng. 1961, 80, 155–163. [Google Scholar]
  9. Fard, M.A.; Reid, A.J.; Hepburn, D.M. Analysis of HVDC superimposed harmonic voltage effects on partial discharge behavior in solid dielectric media. IEEE Trans. Dielectr. Electr. Insul. 2017, 24, 7–16. [Google Scholar] [CrossRef]
  10. Eager, G.S.; Katz, C.; Fryszczyn, B.; Densley, J.; Bernstein, B.S. High voltage VLF testing of power cables. IEEE Trans. Power Deliv. 1997, 12, 565–570. [Google Scholar] [CrossRef]
  11. Bhimani, B.V. Very-low-frequency high-potential testing. IEEE Trans. Power App. Syst. 1961, 80, 148–155. [Google Scholar] [CrossRef]
  12. Miller, R.; Black, I.A. Partial discharge measurements over the frequency range 0.1 Hz to 50 Hz. IEEE Trans. Electr. Insul. 1977, 12, 224–233. [Google Scholar] [CrossRef]
  13. Haga, K.; Yoneyama, M. Breakdown strength and dielectric characteristics of oil-impregnated paper cable insulation at very-low-frequencies. Electr. Eng. Jpn. 1968, 88, 39–48. [Google Scholar]
  14. Miller, R.; Black, I.A.; Gray, V.N. A variable low frequency high voltage generator using valves with fibre optic light guide control. J. Phys. E Sci. Instrum. 1975, 8, 748–750. [Google Scholar] [CrossRef]
  15. Miller, R.; Black, I.A. Partial discharge energy measurements on electrical machine insulation when energized at frequencies between 0.1 Hz and power frequency. IEEE Trans. Electr. Insul. 1979, 14, 127–135. [Google Scholar] [CrossRef]
  16. Bodega, R.; Morshuis, P.H.F.; Lazzaroni, M.; Wester, F.J. PD recurrence in cavities at different energizing methods. IEEE Trans. Instrum. Meas. 2004, 53, 251–258. [Google Scholar] [CrossRef] [Green Version]
  17. Wester, F.J.; Guilski, E.; Smit, J.J. Detection of partial discharges at different AC voltage stresses in power cables. IEEE Electr. Insul. Mag. 2007, 23, 28–43. [Google Scholar] [CrossRef]
  18. Illias, H.; Chen, G.; Lewin, P.L. Partial discharge behavior within a spherical cavity in a solid dielectric material as a function of frequency and amplitude of the applied voltage. IEEE Trans. Dielectr. Electr. Insul. 2011, 18, 432–443. [Google Scholar] [CrossRef]
  19. Forssen, C.; Edin, H. Partial discharges in a cavity at variable applied frequency part 1: Measurements. IEEE Trans. Dielectr. Electr. Insul. 2008, 15, 1601–1609. [Google Scholar] [CrossRef]
  20. Forssen, C.; Edin, H. Partial discharges in a cavity at variable applied frequency Part 2: Measurements and Modeling. IEEE Trans. Dielectr. Electr. Insul. 2008, 15, 1610–1616. [Google Scholar] [CrossRef]
  21. Fynes-Clinton, D.; Nyamupangedengu, C. Partial discharge characterization of cross-linked polyethylene medium voltage power cable termination defects at very low frequency (0.1 Hz) and power frequency test voltages. IEEE Electr. Insul. Mag. 2016, 32, 15–23. [Google Scholar] [CrossRef]
  22. Yang, Z.; Zhu, D. High Voltage and Insulation Technology, 2nd ed.; China Electric Power Press: Beijing, China, 2007. [Google Scholar]
  23. Zhang, L.; Zhao, L. Modeling of the partial discharge process in a liquid dielectric: Effect of applied voltage, gap distance, and electrode type. Energies 2013, 6, 934–952. [Google Scholar]
  24. Pompili, M.; Mazzetti, C.; Bartnikas, R. Phase relationship of PD pulses in dielectric liquids under ac conditions. IEEE Trans. Dielectr. Electr. Insul. 2000, 7, 113–117. [Google Scholar] [CrossRef]
  25. Swati, K.; Yadav, K.S.; Sarathi, R.; Vinu, R.; Danikas, M.G. Understanding corona discharge activity in titania nanoparticles dispersed in transformer oil under AC and DC voltages. IEEE Trans. Dielectr. Electr. Insul. 2017, 24, 2325–2336. [Google Scholar] [CrossRef]
  26. Beroual, A.; Khaled, U.; Noah, P.S.M.; Sitorus, H. Comparative study of breakdown voltage of mineral, synthetic and natural oils and based mineral oil mixtures under AC and DC voltages. Energies 2017, 10, 511. [Google Scholar] [CrossRef]
  27. Korobeynikov, S.M.; Bychkov, A.L.; Chimitova, E.V.; Demin, V.A. Statistical analysis of partial discharge characteristics in transformer oil at the “point-plane” electrode at alternating voltage. Probl. Reg. Energ. 2017, 2, 36–44. [Google Scholar]
  28. Florkowski, M.; Florkowska, B.; Furgal, J.; Zydron, P. Impact of high voltage harmonics on interpretation of partial discharge patterns. IEEE Trans. Dielectr. Electr. Insul. 2013, 20, 2009–2016. [Google Scholar] [CrossRef]
  29. Deng, J.; Wang, M.; Zhou, Y.; Zhou, Z.; Zhang, Y.; Zhang, L.; Liu, X. Partial discharge characteristics of uniform gap in oil-impregnated paper insulation under switching impulse voltage. IEEE Trans. Dielectr. Electr. Insul. 2017, 23, 3584–3592. [Google Scholar] [CrossRef]
  30. Tang, J.; Wang, J.; Li, J.; Tan, Z. Statistical parameter method for PD pattern recognition. High Volt. Eng. 2002, 28, 4–6. [Google Scholar]
  31. Gulski, E.; Kreuger, F.H. Computer aided recognition of discharge sources. IEEE Trans. Dielectr. Electr. Insul. 1992, 27, 82–92. [Google Scholar] [CrossRef]
  32. Candela, R.; Mirelli, G.; Schifani, R. PD recognition by means of statistical and fractal parameters and a neural network. IEEE Trans. Dielectr. Electr. Insul. 2000, 7, 87–94. [Google Scholar] [CrossRef]
  33. Zhou, Y.; Zhou, Z.; Zhang, L.; Zhang, Y.; Mo, Y.; Sun, J. Characterization and comprehension of corona partial discharge in air under power frequency to very low frequency voltage. Plasma Sci. Technol. 2017, 20, 054016. [Google Scholar] [CrossRef]
  34. Liao, R.; Duan, L.; Wang, K.; Yang, L.; Yuan, L.; Guo, C. Partial discharge characteristics of point-plane model in oil-paper insulation under AC voltage. High Volt. Eng. 2014, 40, 648–654. [Google Scholar]
  35. Beroual, A.; Zahn, M.; Badent, A.; Kist, K.; Schwabhe, A.J.; Yamashitica, H.; Yamashitica, K.; Danikas, M.; Chadband, W.G.; Torshin, Y. Propagation and structure of streamers in liquid dielectrics. IEEE Electr. Insul. Mag. 1998, 14, 6–17. [Google Scholar] [CrossRef]
  36. Liang, X.; Zhou, Y.; Zeng, R. High Voltage Engineering, 3rd ed.; Tsinghua University Press: Beijing, China, 2015. [Google Scholar]
  37. Feng, C.; Ma, X. Introduction of Engineering Electromagnetic Field; Higher Education Press: Beijing, China, 2000. [Google Scholar]
  38. Schmidt, W.F. Electronic conduction processes in dielectric liquid. IEEE Trans. Electr. Insul. 1984, EI-19, 389–418. [Google Scholar] [CrossRef]
  39. Borsi, H.; Gockenbach, E.; Schroder, U.; Schilier, G. Contribution to the clarification of partial discharge behaviour in insulating liquids using the schlieren technique. Int. Trans. Electr. Energy Syst. 1991, 1, 271–279. [Google Scholar] [CrossRef]
  40. Velasco, J.; Frascella, R.; Albarracín, R.; Burgos, J.C.; Dong, M.; Ren, M.; Yang, L. Comparison of positive streamers in liquid dielectrics with and without nanoparticles simulated with finite-element software. Energies 2018, 11, 361. [Google Scholar] [CrossRef]
Figure 1. Ultra-high-voltage (UHV) alternating-current (AC) transformer and converter transformer. (a) UHV AC transformer; (b) UHV converter transformer.
Energies 11 01702 g001
Figure 2. Main framework and approach of this research. PD—partial discharge; PRPD—phase resolved PD.
Energies 11 01702 g002
Figure 3. PD test and analysis system from rated AC frequency to very low frequency.
Energies 11 01702 g003
Figure 4. PD inception voltage from rated AC frequency to very low frequency. PDIV—PD inception voltage.
Energies 11 01702 g004
Figure 5. Maximum magnitude of discharge from rated AC frequency to very low frequency. (a) Qmax in positive half cycle; (b) Qmax in negative half cycle.
Energies 11 01702 g005
Figure 6. Mean magnitude of discharge from rated AC frequency to very low frequency. (a) Qmean in positive cycle; (b) Qmean in negative cycle.
Energies 11 01702 g006
Figure 7. Pulse repetition rate of discharge from rated AC frequency to very low frequency. (a) Repetition rate in positive half cycle; (b) Repetition rate in negative half cycle.
Energies 11 01702 g007
Figure 8. PRPD from rated AC frequency to very 5 Hz with the voltage magnitude of 20 kV. (a) 50 Hz, (b) 30 Hz, (c) 10 Hz, and (d) 5 Hz.
Energies 11 01702 g008
Figure 9. PRPD under 1 Hz and 0.1 Hz with the voltage magnitude of 32 kV. (a) 1 Hz and (b) 0.1 Hz.
Energies 11 01702 g009
Figure 10. qmeanφ pattern from rated AC frequency to very low frequency. (a) 50 Hz, 20 kV; (b) 30 Hz, 20 kV; (c) 10 Hz, 20 kV; (d) 5 Hz, 20 kV; (e) 1 Hz, 32 kV; and (f) 0.1 Hz, 32 kV.
Energies 11 01702 g010
Figure 11. nφ pattern from rated AC frequency to very low frequency. (a) 50 Hz, 20 kV; (b) 30 Hz, 20 kV; (c) 10 Hz, 20 kV; (d) 5 Hz, 20 kV; (e) 1 Hz, 32 kV; and (f) 0.1 Hz, 32 kV.
Energies 11 01702 g011aEnergies 11 01702 g011b
Figure 12. nq pattern from rated AC frequency to very low frequency. (a) 50 Hz, 20 kV; (b) 30 Hz, 20 kV; (c) 10 Hz, 20 kV; (d) 5 Hz, 20 kV; (e) 1 Hz, 32 kV; and (f) 0.1 Hz, 32 kV.
Energies 11 01702 g012
Figure 13. Characteristics parameters of statistical patterns from rated AC frequency to very low frequency. (a) Skewness Sk of statistical patterns from rated AC frequency to very low frequency, (b) kurtosis Ku of statistical patterns from rated AC frequency to very low frequency, and (c) asymmetry Asy and correlation coefficient Cc of statistical patterns from rated AC frequency to very low frequency.
Energies 11 01702 g013
Figure 14. Comparison of the potential and electric field distribution under 50 Hz and 0.1 Hz. (a) Potential distribution (50 Hz), (b) potential distribution (0.1 Hz), (c) electric field distribution (50 Hz), and (d) electric field distribution (0.1 Hz).
Energies 11 01702 g014
Figure 15. Comparison of the electric field intensity along the gap under 50 Hz and 0.1 Hz.
Energies 11 01702 g015
Figure 16. Process of development of positive streamer in the insulating oil.
Energies 11 01702 g016
Figure 17. Demonstration of the effective discharge time under different frequencies.
Energies 11 01702 g017
Table 1. Partial discharge (PD) statistical patterns and their characteristic parameters.
Discharge PatternSymbolCharacteristic Parameters
Phase distribution of maximum magnitude of dischargeqmaxφSk+, Sk, Ku+, Ku, Asy, Cc
Phase distribution of mean magnitude of dischargeqmeanφSk+, Sk, Ku+, Ku, Asy, Cc
Phase distribution of numbers of dischargenφSk+, Sk, Ku+, Ku, Asy, Cc
Number distribution of discharge magnitudenqSk, Ku
Table 2. Dielectric constant of insulating oil and oil impregnated paper under different frequencies.
Frequency50 Hz30 Hz10 Hz5 Hz1 Hz0.1 Hz
Insulating oil2.1822.1832.1972.2302.3653.782
Oil-paper4.5664.5744.5964.6164.7155.137
Ratio of dielectric constant2.09262.09532.09192.07001.99371.3581
Table 3. Electric field intensity at the point 0.1 mm from the needle tip under different frequencies.
Frequency50 Hz30 Hz10 Hz5 Hz1 Hz0.1 Hz
Electric field intensity (kV/mm)25.407825.414025.406825.359225.188623.2400
Deviation ratio to 50 Hz-+0.0247%−0.0038%−0.1911%−0.8622%−8.5297%

