Article

Analysis of Carbon Storage and Its Contributing Factors—A Case Study in the Loess Plateau (China)

1
State Key Laboratory of Resources and Environmental Information System, Institute of Geographic Sciences and Natural Resources Research, Chinese Academy of Sciences, Beijing 100101, China
2
University of Chinese Academy of Sciences, Beijing 100049, China
*
Author to whom correspondence should be addressed.
Energies 2018, 11(6), 1596; https://doi.org/10.3390/en11061596
Submission received: 14 May 2018 / Revised: 31 May 2018 / Accepted: 12 June 2018 / Published: 19 June 2018
(This article belongs to the Special Issue Carbon Capture and Storage)

Abstract

:
The Chinese Loess Plateau is an ecologically fragile and sensitive area. The carbon storage dynamics in this region and the contributions from land use/land cover change (LUCC) and carbon density from 2000 to 2010 were analyzed in this paper. Normalized difference vegetation index (NDVI), biomass and soil carbon data in 2000 were used for regression analysis of biomass and soil carbon, and an inversion analysis was used to estimate biomass and soil carbon in 2005 and 2010. Quadrat data, including aboveground biomass and soil organic carbon, were used to calibrate the model output. Carbon storage and sequestration were calculated by the InVEST toolset with four carbon pools, including aboveground biomass, belowground biomass, dead wood and soil carbon. The results showed that carbon storage increased steadily from 2000 to 2010, increasing by 0.260 billion tons, and that woodland area increased and arable land decreased; the overall trend in land cover improved, but the improvement was not pronounced. Carbon storage in the Loess Plateau was correlated with geographical factors. We found that when assuming a constant carbon density, carbon storage decreased, accounting for −1% of the carbon storage dynamics. When assuming no land conversion, carbon storage increased, accounting for 101% of the carbon storage dynamics.

Graphical Abstract

1. Introduction

Land use/land cover change (LUCC) has prominent impacts on carbon storage and sequestration dynamics in ecosystems [1,2,3,4,5]. LUCC influences carbon storage in two ways: via land conversion and land modification. Several studies have focused on land conversion, whereas studies on land modification are scarce. LUCC has been a popular research topic in resource-related and environmental disciplines and is the core program for three international organizations, namely, the International Geosphere-Biosphere Programme (IGBP), the International Human Dimensions Programme (IHDP), and the World Climate Research Program (WCRP) [1,2,3]. If we cannot quickly and accurately understand LUCC information, we cannot correctly evaluate LUCC effects, such as soil erosion, on the ecological environment, making it impossible to accurately estimate the capacity of the ecosystem carbon cycle [4]. China has adopted a variety of ecological restoration projects to improve the ecological environment; these projects include the Natural Forest Protection Project and the Grain for Green Program (GGP). The GGP is the largest reforestation project in China [5]. According to domestic and foreign scholars, since the implementation of this project, which returned farmland to forest from 1990 to 2010, China has had the largest afforestation area in the world [6]. The Kyoto Protocol went into effect on 16 February 2005, and clearly stated that humans could increase carbon sequestration through the effective management of LUCC, for example, by reducing deforestation, increasing afforestation and effectively managing terrestrial ecosystem services [7].
Global carbon change has become a popular research topic [8], with many scholars having estimated carbon storage and sequestration, and estimation accuracy has gradually improved [9,10]. Most carbon is stored in the soil, terrestrial vegetation and atmosphere; approximately 1400–1500 Gt of carbon exists in the soil, approximately 500 Gt of carbon exists in terrestrial vegetation, and approximately 750 Gt of carbon exists in the atmosphere [11].
The ecological system of the Loess Plateau is fragile and sensitive, in recent decades, China has implemented several major ecological construction projects, including GGP, Ecological Construction Program, Sand Source Improvement Project, Small Watershed-Based Management Program, etc. The implementation of the abovementioned national level program greatly changed the land use and land cover. These changes have induced a big change in carbon storage. With the continuous efforts in ecological protections, the crop land reduced and natural vegetation area increased, especially the forest area increased which immensely improved ecological quality, and the carbon sequestration capacity increased. Study of carbon storage change induced mainly by LUCC and other factors can enhance the understanding of the process of carbon storage change. Thus, developing a carbon sink in Loess Plateau based on the previous development of carbon sequestration in forests, grasslands and wetlands to form a multilevel and multidimensional carbon trading market. It also can enhance economic and social development in Loess Plateau to achieve green development while sharing development goals. This study can therefore provide references for making decisions about ecological conservation and regional development.

2. Materials and Methods
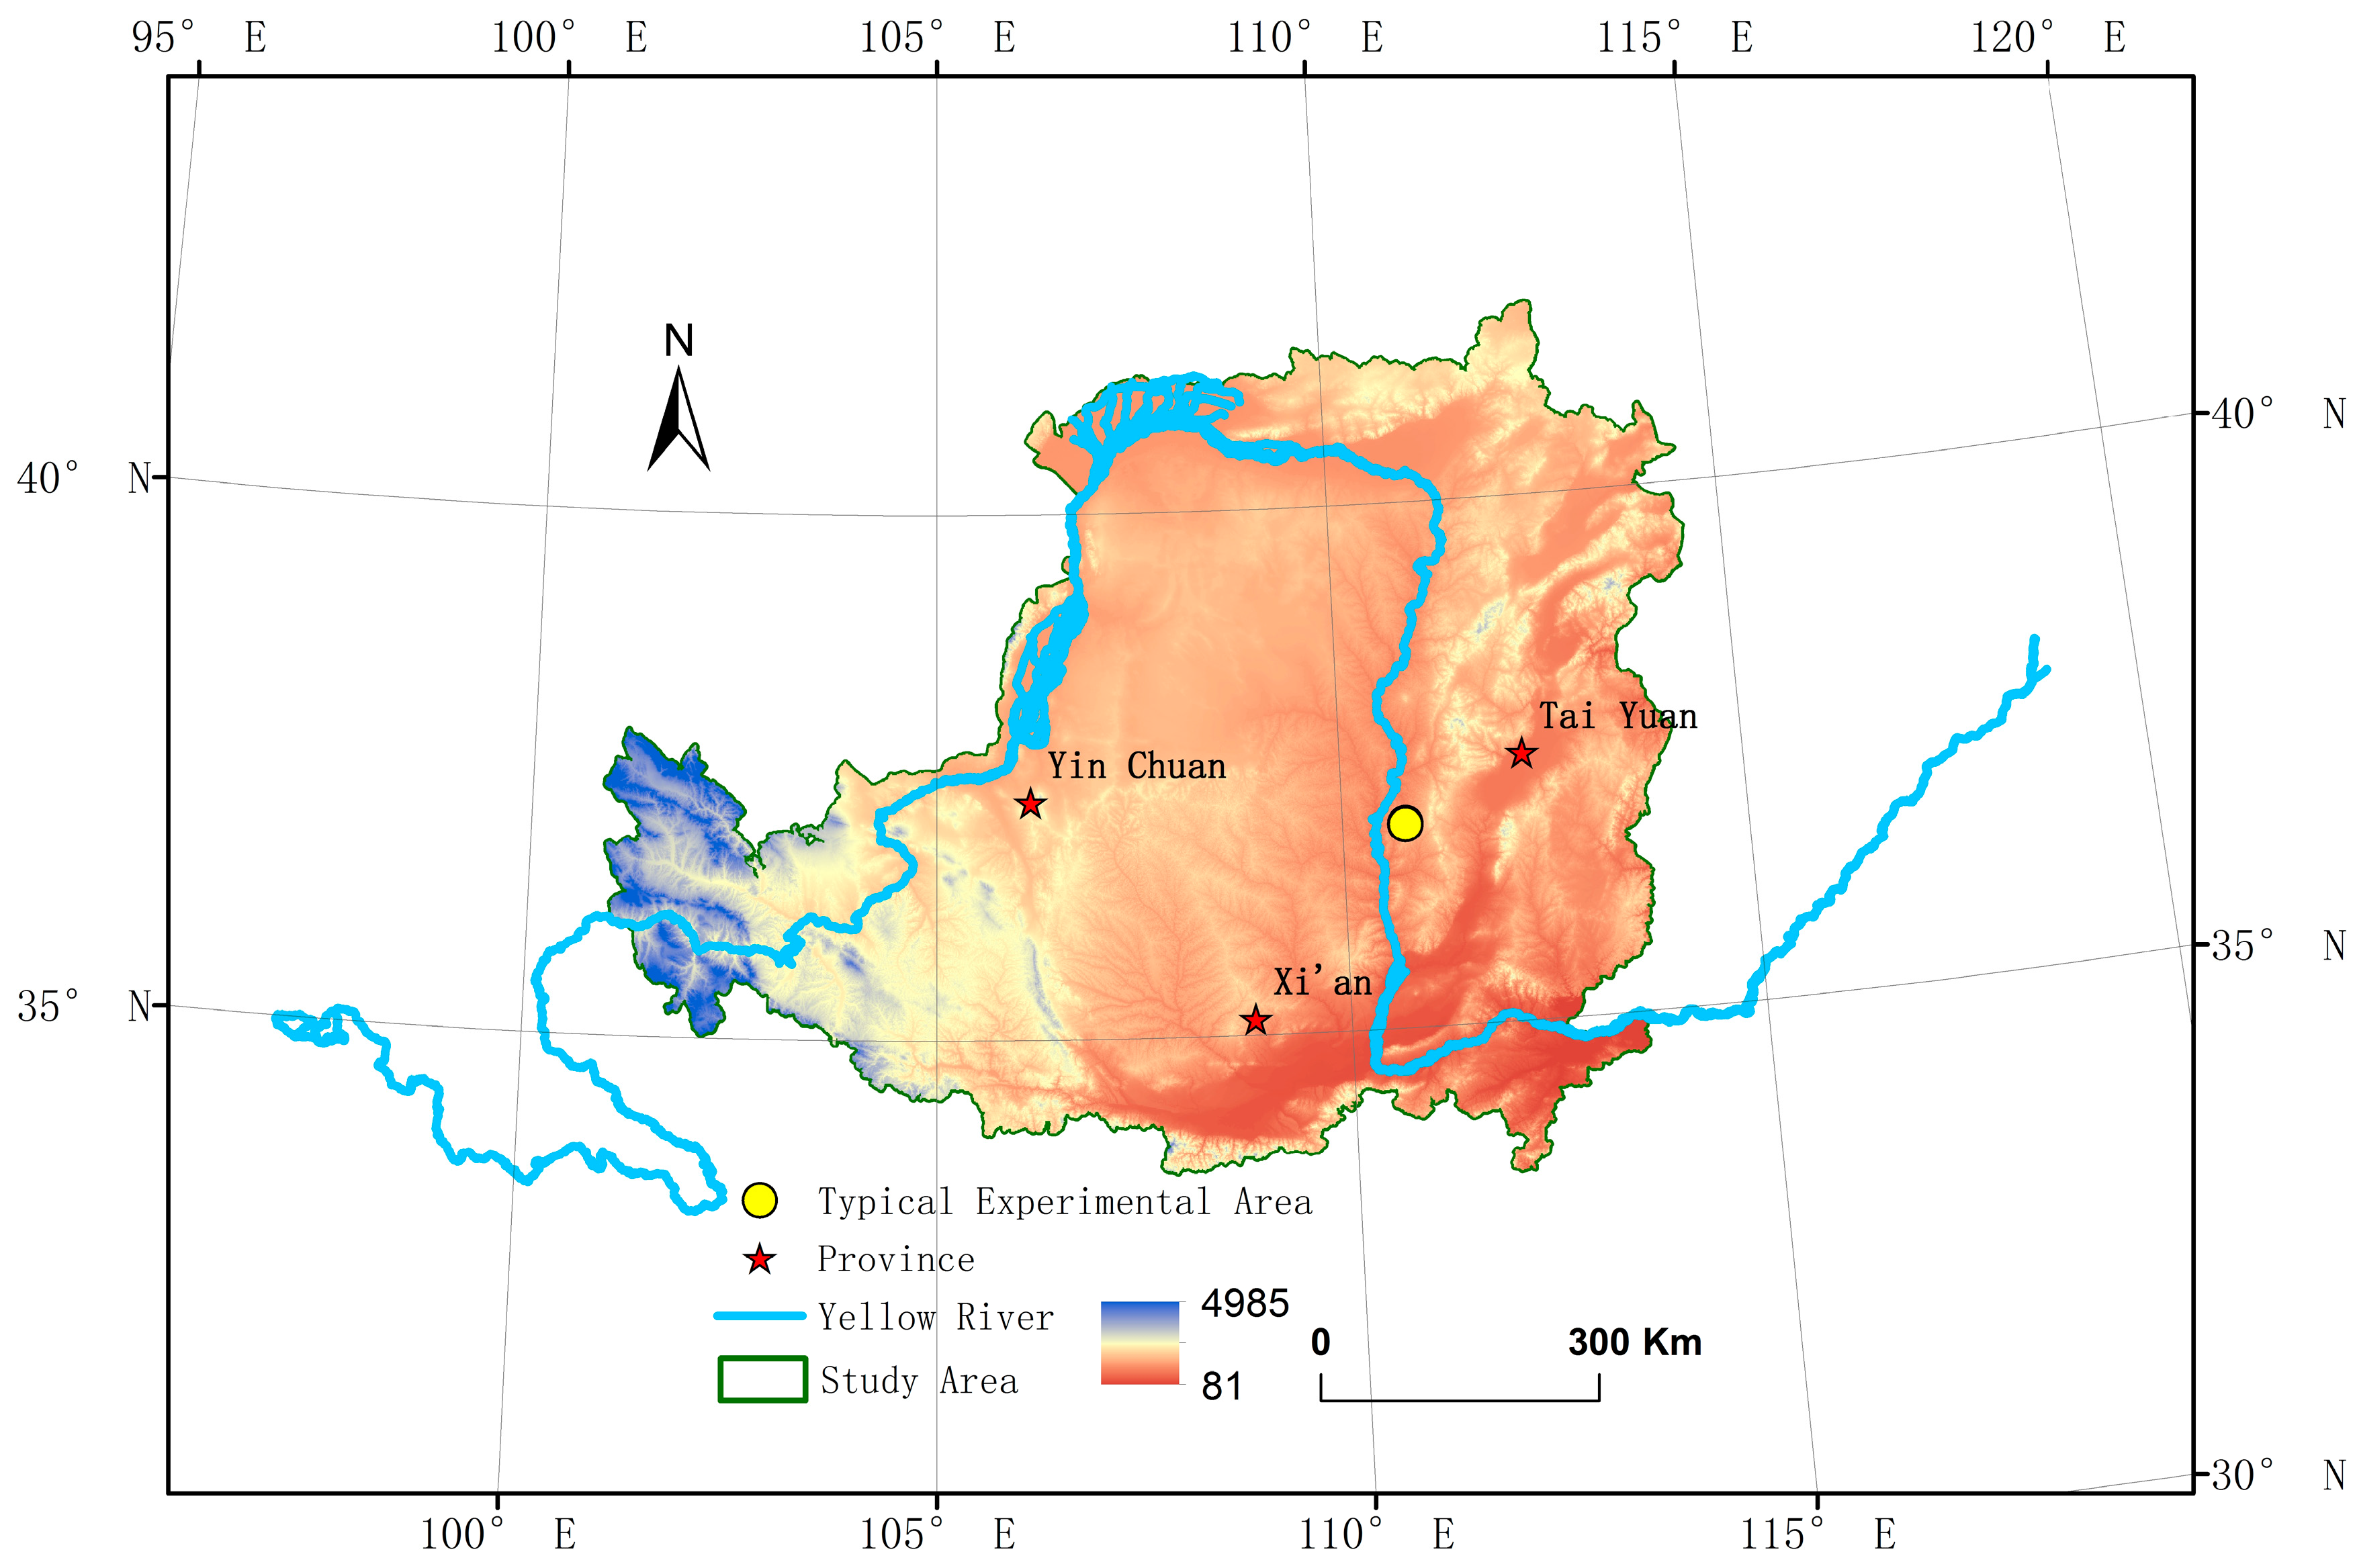
2.1. Study Area

The Loess Plateau (34~40° N, 103~114° E) is the largest loess deposition area in the world with an elevation of 1000~1500 m. It spans seven provinces, namely, Qinghai, Gansu, Ningxia, Inner Mongolia, Shaanxi, Shanxi and Henan, 50 prefectural-level divisions and 284 county-level divisions [12]. The Loess Plateau is in a semiarid, subhumid area that is has a continental monsoon climate; the annual average temperature is 6~14 °C, and the average rainfall is 200~700 mm. The Loess Plateau has attracted the attention of domestic and foreign scholars for many years due to the complex relationships between humans and the Earth, the deteriorating ecological environment and serious soil erosion. To date, research on the ecosystem services of the Loess Plateau has been focused at the river-basin and single-forest (mostly locust forest) scales, and functional analyses of the ecosystem services in the entire region of the Loess Plateau are lacking [13,14,15,16].
Large-scale soil and water conservation projects have been implemented in Loess Plateau since the 1970s. China also implemented a restoration project to return farmland to forest and grassland after 1999, and the Loess Plateau was the regional focus of the implementation. Over the past few decades, many artificial forests have been planted in the area, which account for 59.8% of the total forest area in the Loess Plateau. Locust is the primary tree species that has been planted in Loess Plateau because it has a rapidly growing, drought-resistant, infertile root system. Locusts account for 90% of the artificial forest area.

2.2. Data Sources

2.2.1. LUCC Data

Land use in China at the 1:100,000 scale from remote sensing monitoring data sets represents the land use monitoring data product with the highest precision in China. In this study, three years were considered: 2000, 2005 and 2010. Remote sensing images from Landsat TM/ETM were the main data source and were analyzed through artificial visual interpretation. Six primary types of land use data were used, namely, data for cultivated land, forestland, grassland, water area, building area (urban land and rural land) and unused land, and 25 secondary types were used. During the process of analyzing carbon storage, five primary land use types were used: cultivated land, forestland, grassland, building land and unused land. Mountain paddy fields and hilly paddy fields, plain paddy fields and 18 other land use types were also analyzed. Water, sand and other area types were not included. The data set was provided by the Data Center for Resources and Environmental Sciences, Chinese Academy of Sciences (RESDC) (http://www.resdc.cn).

2.2.2. NDVI

The NDVI data were from MOD13Q1, which has a temporal resolution of 16 days and a spatial resolution of 250 m. The current study used the average NDVI during the growing season from June to August in 2000, 2005, and 2010. The data set was provided by the International Scientific & Technical Data Mirror Site, Computer Network Information Center, Chinese Academy of Sciences (http://www.gscloud.cn).

2.2.3. Digital Elevation Model (DEM)

The DEM data were from SRTMDEMUTM, which has a spatial resolution of 90 m. The data set was provided by the International Scientific & Technical Data Mirror Site, Computer Network Information Center, Chinese Academy of Sciences (http://www.gscloud.cn).

2.2.4. Slope

The DEM data were processed using the slope function in ArcGIS Spatial Analyst. The slope data at 90-m spatial resolution were obtained from the slope calculated from the DEM data in the study area.

2.2.5. Precision-Test Data

Precision-test data were acquired from MYD17A2 and MOD17A2, which each have a spatial resolution of 1000 m and a temporal resolution of 8 days. The data set was provided by the International Scientific & Technical Data Mirror Site, Computer Network Information Center, Chinese Academy of Sciences (http://www.gscloud.cn). In addition, survey data, 146 soil samples, 12 tree plots, and three grassland surveys were used.

2.2.6. Carbon Density Parameters of 2000

Biomass carbon density data were acquired from the Carbon Dioxide Information Analysis Center (CDIAC) [17] and were based on the biomass carbon density from the Intergovernmental Panel on Climate Change (IPCC). Then, 1 km global biological carbon density raster data were generated from the land use and vegetation flora data. Soil carbon density data were acquired from the Joint Research Center (JRC) of the European Union in Brussels along with surface soil organic carbon (0–30 cm) data [18]. Humus carbon data and root-to-shoot ratios were determined from the IPCC 2006 national greenhouse gas emissions [19].

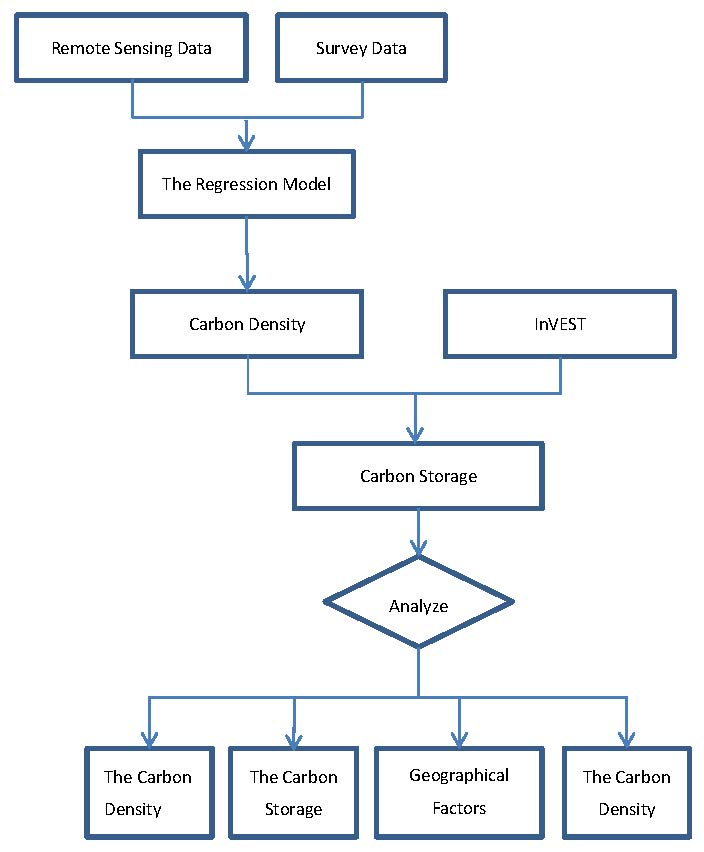
2.3. Research Methods

We used the data set in 2000 to construct two regression models: an NDVI and biomass regression model and a biomass and soil organic carbon regression model. Then, the biomass and soil organic carbon data in 2005 and 2010 were modeled based on model inversion. Biomass was converted into aboveground biomass and underground biomass based on the root-to-shoot ratio. Because the humus carbon pool is small and stable, the humus carbon density data in this paper represent the data collected in 2000. Then, the land cover and carbon density parameters were input into Integrated Valuation of Ecosystem Services and Trade (InVEST) to determine the carbon storage in 2005 and 2010 in the Loess Plateau.
(1) The key carbon library parameter inversion
GIS spatial analysis was used to acquire the mean NDVI, biomass and soil organic carbon values of the 18 land use types. Then, a statistical analysis was conducted in SPSS 21.0. NDVI, biomass, and soil organic carbon (SOC) exhibit a normal distribution. NDVI and biomass were significantly related to SOC (alpha = 0.05), yielding correlation coefficients of R2 = 0.883 and R2 = 0.716, respectively. Biomass was significantly related to SOC (alpha = 0.05), with a correlation coefficient of R2 = 0.900, according to the regression analysis. In accordance with the requirement of a strong correlation, a high biomass-NDVI quadratic curve model and an SOC-biomass quadratic curve model were constructed (Figure 1). The equation was derived from an analysis of variance and a regression coefficient t-test (p < 0.01). The regression equation was based on NDVI, biomass and SOC as well as the inversion of the key parameters measured in 2005 and 2010, such as biomass and SOC.
(2) Ecosystem carbon storage simulation
InVEST, developed at Stanford University, is a comprehensive ecosystem service evaluation model that can assess various ecosystem services, provide comprehensive analysis for planning ecological restoration, pay ecosystem services (PES), and assess developmental effects and space permits. Cooperation risk management plays an increasingly important role in promoting biodiversity conservation, and the coordinated development of human well-being is of great significance [20]. Land cover and biomass data as well as soil carbon and humus carbon data collected in the study area in 2000, 2005, and 2010 were used as InVEST input data to simulate carbon storage during the corresponding years. Then, the behavior and spatial differentiation of carbon storage in Loess Plateau from 2000–2010 was analyzed. The carbon computation formula in the carbon module of the InVEST model is described as follows:
C z o n e = C i × A i
C = C a b o v e + C b e l o w + C d e a d + C s o i l
where Czone is the carbon of the zone, C is the total carbon, Ai is the area of class I, Ci is the carbon density of class I (t C/ha), Cabove represents aboveground biomass, Cbelow represents root biomass, Cdead represents humus carbon, and Csoil represents soil organic carbon.
(3) Carbon storage function change analysis of contributing factors
In general, changes in land use can be divided into changes in land cover type (land conversion) and changes in the internal quality of a specific land cover type (land modification). Accordingly, changes in the regional carbon storage function involve changes in land cover type and carbon density and the contributions of different factors that affect the carbon storage function. The model of this process is described as follows:
(1) Changes in regional carbon storage function based on two carbon available libraries using theΔC characteristic:
Δ C = i = 1 n A i 2 D i 2 A i 1 D i 1
where ΔC is regional carbon storage change; Ai1 and Ai2 are the areas of class i before and after the change, respectively; and Di1 and Di2 are the carbon densities of class i before and after the change, respectively.
(2) Assuming that the carbon density of each land use/land cover type is constant and that the carbon storage changes are caused only by changes in land use/land cover, the carbon storage change can be represented as follows:
Δ C 1 = i = 1 n ( A i 2 A i 1 ) D i 1
where ΔC1 is the carbon storage change due only to changes in land use/land cover.
(3) Assuming that land use/land cover is constant and that the carbon storage changes are caused only by carbon density changes, the carbon storage change can be represented as follows:
Δ C d = i = 1 n A i 1 ( D i 2 D i 1 )
where ΔCd is the carbon storage change due only to C carbon density changes.
(4) The contribution rate of the change in land use/land cover types to carbon storage (Rl) and the contribution rate of the change in carbon density to carbon storage (Rd) can be calculated using the following formulas:
R l = Δ C l / ( Δ C l + Δ C d ) × 100 %
R d = Δ C d / ( Δ C l + Δ C d ) × 100 %
where Rl is the contribution rate of the change in land use/land cover types to carbon storage and Rd is the contribution rate of the change in carbon density to carbon storage.

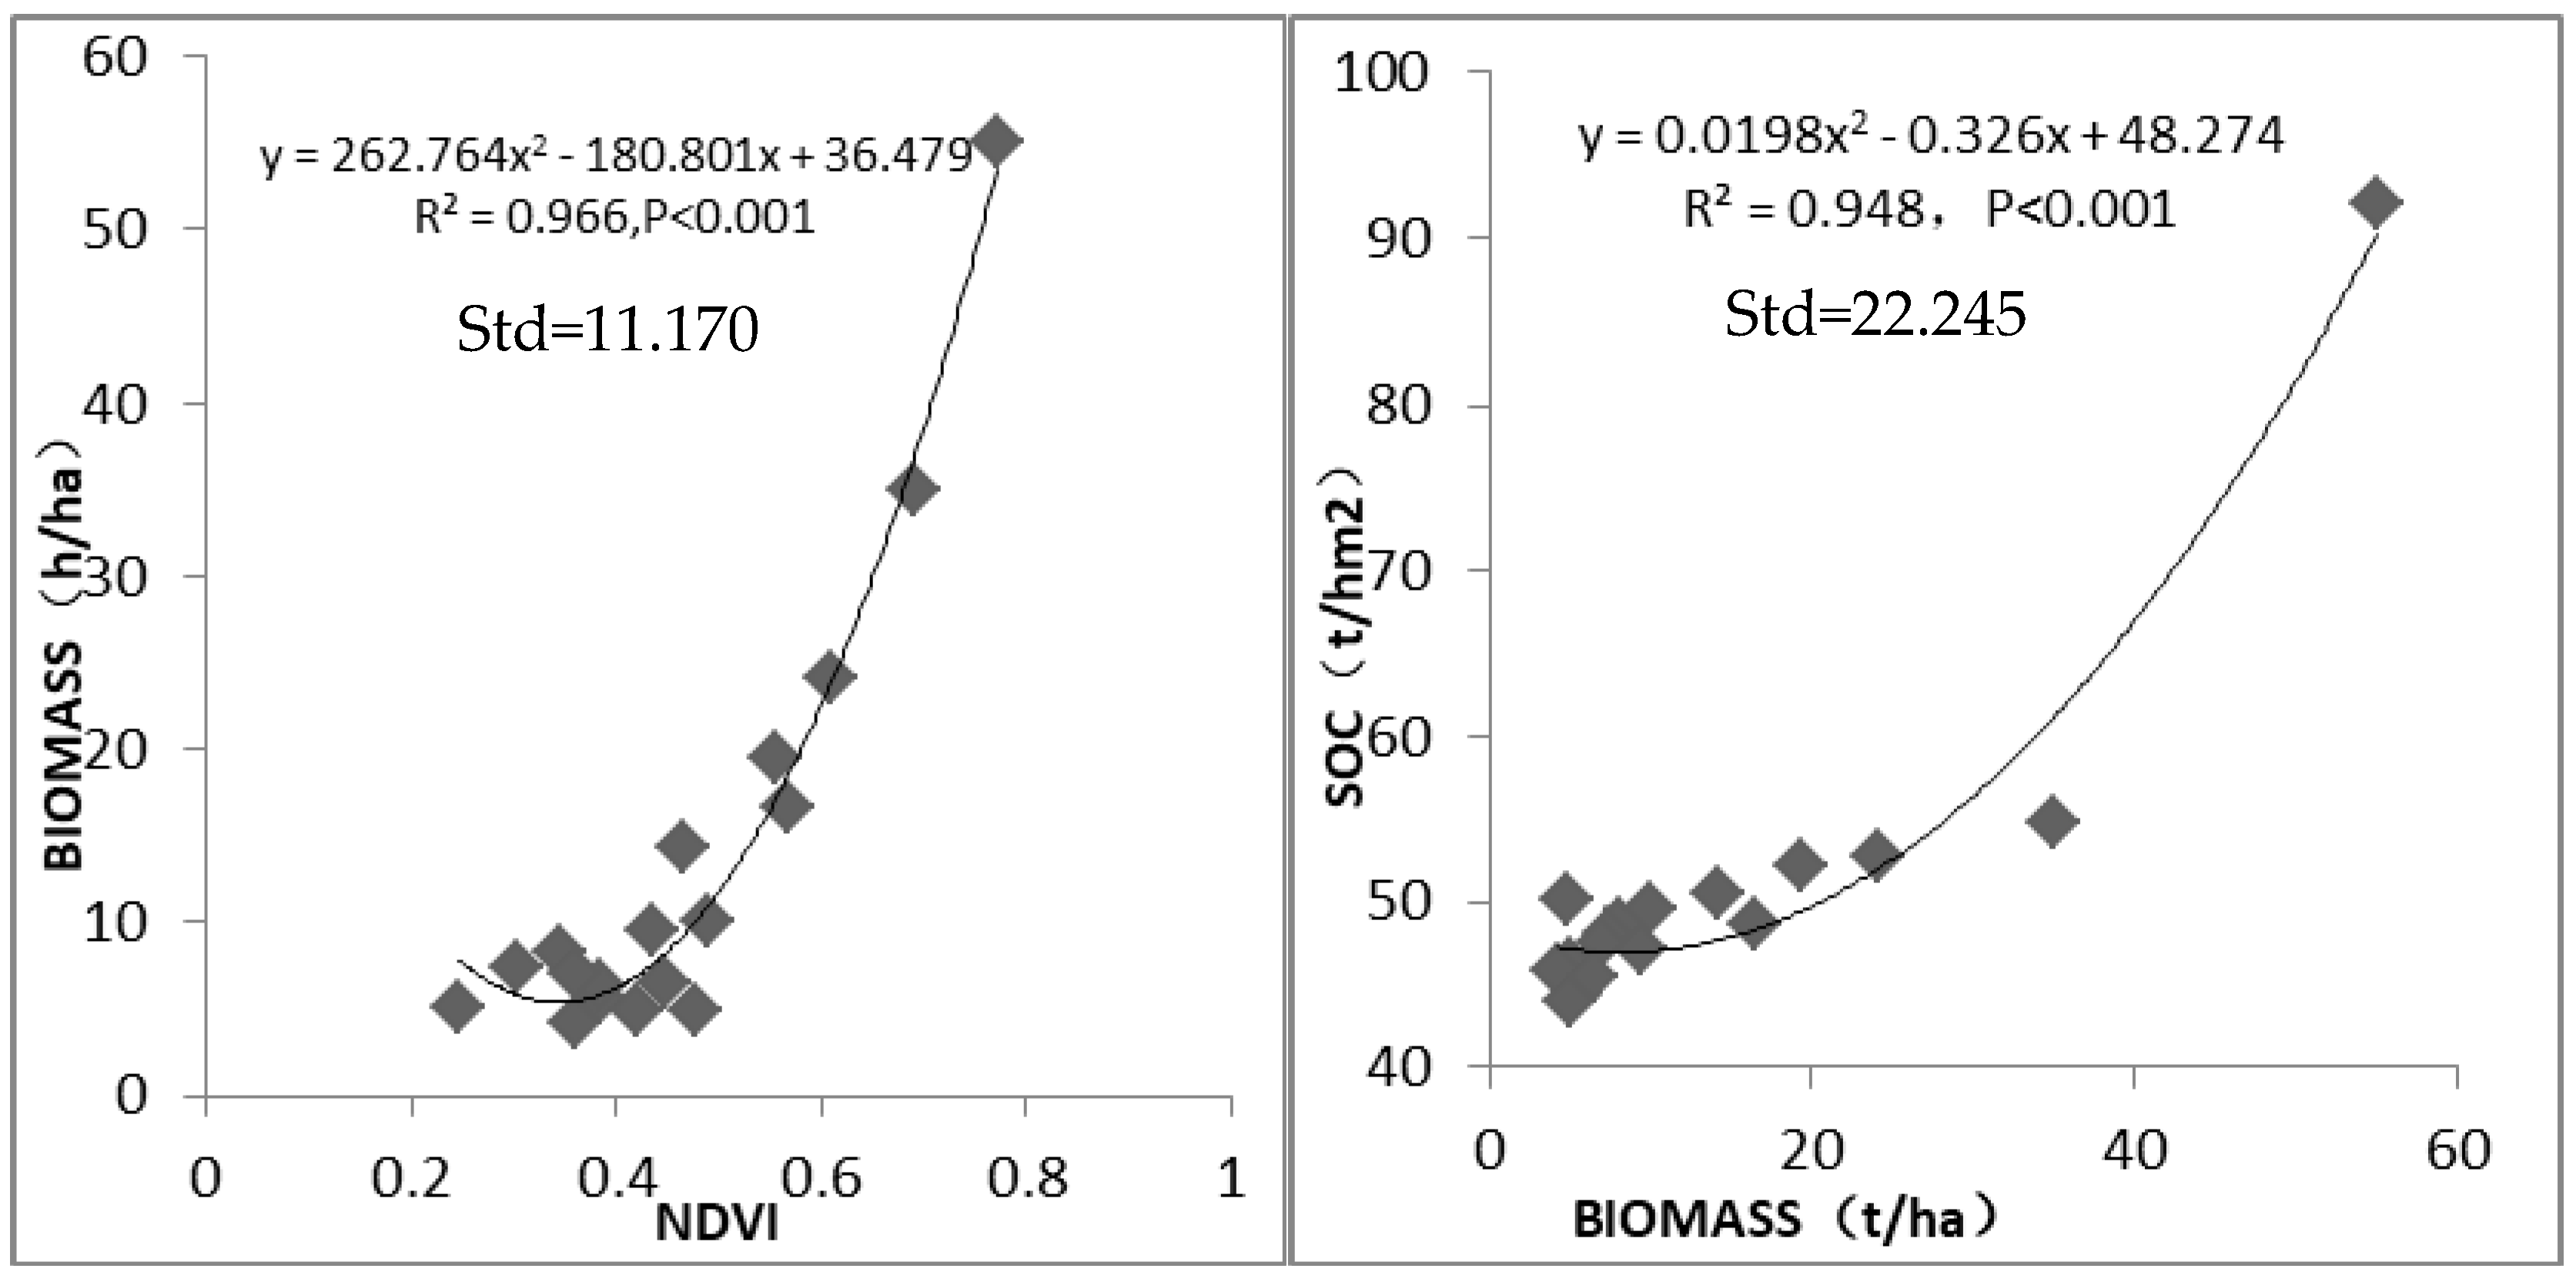
2.4. Precision Testing and Sample Analysis

Remote sensing images and sampling point data were used to verify the accuracy of the models. The entire Loess Plateau area and the individual land areas and points were tested to determine if this method was reliable.
The area of the Loess Plateau is vast, and the terrain is complex. Thus, carbon storage in the Loess Plateau was simulated and analyzed over a large scale, and the accuracy of the simulation was assessed over the entire surface area and at a typical area. The accuracy over the surface area in this study was verified by the MODIS MOD17A2 and MYD17A2 data products for 2010. The vegetation biomass data and the soil organic matter data were used to verify the accuracy over the typical area.
The MODIS total primary productivity products, MYD17A2 and MOD17A2, depict the cumulative biological (mainly green plants) organic carbon fixed through the photosynthetic pathway, which is same as the biomass (total of aboveground biomass and belowground biomass) parameters in the InVEST model. In this study, the total primary productivity of the Loess Plateau in 2010 was 8.61 × 10⁸ t C, which was calculated by the carbon parameter inversion. The total primary productivity estimated from the MYD17A2 data product in the Loess Plateau in 2010 was 8.16 × 10⁸ t C; the relative error was 5.2%. The total productivity estimated from the MOD17A2 data product in the Loess Plateau in 2010 was 8.95 × 10⁸ t C; the relative error was −3.9%. Therefore, the simulation results of this study can be used for further dynamic change analysis.
The typical area (Figure 2) considered in this study is in Shilou County, Shanxi Province, which is an experimental area where farmland was converted to forest (36°56′ N, 110°46′ E). The study area is near the east bank of the Yellow River. The terrain is high in the east and low in the west, and there are rolling mountains, crisscrossed gullies, and broken terrain. The study area is located along the middle reaches of the Yellow River, where soil erosion is very serious. The landform type is typical of the loess hilly and gully region of the Loess Plateau, and the total area of the district is 2.02 km2. The terrain is undulating, with a relative height difference of more than 200 m. Most trenches have been cut to bedrock. The soil in this area mainly comprises yellow and gray-brown soils, which are characterized as silty clay loam, and the parent material is loess.
The area has a warm temperate continental monsoon climate. The meteorological data of the area for 1981–2010 are as follows: mean temperature of 9.8 °C; average monthly rainfall of 38.7 mm mainly concentrated from July to September; and monthly average humidity of 55.3%. From 2011 to 2015, the average monthly temperature was 10.7 °C; the average monthly rainfall was 45.6 mm, which was also mostly concentrated from July to September, accounting for more than 60% of the annual rainfall; and the average monthly humidity was 53%.
The main land cover/land use types in the typical area are locust forest, hill dryland, low-coverage grassland, and low human interference. In recent years, the Hong Kong Forces Planted Charitable Foundation improved the ecological environment of the typical experimental area by continuously growing artificial forest over 130 hectares of the area. Locusts were the primary trees planted, accounting for more than 98% of the tree planting area, followed by Armeniaca sibirica, Sophora japonica, and Rhus typhina. The main plantation model involved digging equal pits (2 m long, 50 cm wide, and 50 cm deep) in a “triangle”-shaped arrangement, with the center of the pit 3 m from the column and 1.5 m from the row, and there were approximately 2250 pits per ha.
The survival rate of the plants in this typical area is greater than 80%, which is much higher than the local afforestation survival rate. The forest development is good, which is conducive to improving soil conditions and conserving water. The area has been cultivated for more than 30 years, and the crop plants are grown once per year. The main crops are corn and millet. Cirsium setosum, Artemisia annua, Setaria viridis and other plants are the more common in weeds in the area.
Twelve forest plots were randomly selected in the typical experimental area, and the size of each plot was 10 × 10 m. The survey indicators mainly included planting density, tree height, branch height, basal diameter, diameter at breast height (DBH), crown width and biomass. The heights of the trees were measured using a TruPulse200 rangefinder (Laser Technology, Inc., Centennial, CO, USA), and the diameter at breast height was measured in feet. The crown width was measured using a steel tape; then, the biomass was calculated using the relationships between Robinia pseudoacacia growth parameters (tree height, DBH) and biomass. In addition, forest-herb samples were randomly selected under the trees in each locust sample. Each 1 × 1 m forest-herb sample was selected randomly. After the grass was mowed, cleaned, and dried, the ground biomass was weighed to the nearest 0.01 g (Guangzheng YP-B electronic scale, Shanghai, China), and its carbon content was converted by a ratio of 0.47. In the typical experimental area, we randomly selected grassland samples, and the size and treatment methods were the same as those applied to the forest-herb samples.
The soil in the typical experimental area was sampled in May 2016. Four layers of soil were surveyed at each sample point: 0–10 cm, 10–20 cm, 20–40 cm, and 40–60 cm. After sampling, the samples were taken to the laboratory for physical and chemical analyses. The SOC and bulk density were analyzed. There was a total of 140 forest soil samples, 12 grassland samples, and 12 cultivated land samples, yielding an overall total of 164 samples. The SOC was measured by potassium dichromate oxidation spectrophotometry (HJ615-2011).
(1) Calculation of the carbon density of the forest
The planting distance and seedling growth of the acacia forest are the same, which is consistent with individual nutrition space. Outside these growing conditions, reproductive success is difficult without human interference. Therefore, when the survey found sparsely scattered biomass in the forest, the forest aboveground biomass depended on the density of the living trees, the biomass per tree and the biomass of the understory plants. Locust forest biomass included the biomass of five parts: trunks, branches, leaves, bark and roots. The locust biomass was calculated using the allometric equations published by the SFA (State Forestry Administration) [21] as follows:
W T = 0.02583 × ( D 2 H ) 0.6841
W B = 0.00464 × D 3.2181
W L = 0.02340 × D 1.9277
W p = 0.00763 × ( D 2 H ) 0.0447
W R = 0.01779 × D 2.6148
where WT, WB, WL, WP, and WR represent the biomass of trunks, branches, leaves, bark and roots per tree (kg), respectively; D represents the breast diameter (cm); and H represents the height of the tree (m).
The biomass of each part was calculated and then multiplied by the carbon content coefficient and the corresponding stand density to obtain the aboveground carbon density. According to the survey, the stand density was 330 trees per ha, and the carbon contents coefficient of the trunks, branches, leaves, bark and roots were 0.497, 0.481, 0.465, 0.458 and 0.460, respectively.
(2) Calculation of the carbon density of understory plants or grassland
The chemical substance return rate and the biomass reduction rate of understory plants are higher than those of the upper layer of the forest, and the effect of ecosystem circulation cannot be underestimated. The carbon storage of the forest-herb under the trees was calculated using the aboveground biomass, which was then converted to carbon content. In addition, the method used to calculate the carbon content of the grassland was the same as that used to calculate the carbon content of the understory plants:
C g = B I O g × T g
where Cg represents the carbon content of the forest-herb under the trees (t C/ha), BIOg represents the dry weight of the aboveground biomass per ha (t), and Tg represents the conversion of carbon-containing herbs (%). In addition, grassland carbon was calculated in the same manner as the carbon of the understory plants, and the carbon-containing herb conversion [19].
According to the allometric growth equation, the carbon density of the locust trees in the typical experimental area was 12.54 t C/ha, and the carbon density of understory plants was 0.89 t C/ha. Thus, the carbon density of the forest was 13.43 t C/ha, whereas the carbon density in the model was 13.07 t C/ha in 2010, representing an accuracy of 97.3%. The amount of aboveground biomass per year is directly related to climate, rainfall, light and other parameters. The aboveground biomass fluctuates over time and is not a steadily increasing or fixed value. However, woodlands are different from cultivated lands, as trees continue to grow and the biomass continues to increase. The accuracy is within the allowable range of error, indicating that the model could be used for further simulation and analysis.
In the survey, the grassland carbon density was 1.38 t C/ha. The corresponding density in the model was 1.54 t C/ha due to drought in the typical experimental area that year and the influences of vegetation growth, thus resulting in the low accuracy of 88.4%. Because of the special climate conditions in the typical experimental area during that year, the model precision is adaptable when considering the Loess Plateau.
(3) Calculation of soil carbon density
Regional differences in soil carbon density are obvious, but the values are largely stable over time. Changes in soil carbon density are closely related to land use/land cover. The soil carbon density calculation method is as follows:
S O C i = 0.1 × C i × D i × E i × ( 1 G ) / 100
where SOCi represents the soil carbon storage (Mg/ha), Ci represents the soil carbon organic content of the i-th layer (g/kg), Di represents the soil bulk density (g/cm3), Ei represents the thickness of the i-th layer of soil (cm); and Gi represents the volume content, which is the gravel in the soil greater than 2 mm in the i-th layer (%). As the loess, hilly and gully region is developed from loess parental material, the gravel content is low, so Gi = 0.5.
Based on the calculation of soil carbon density of the 164 soil samples, the soil carbon density of the locust forest was 51.66 t C/ha. The coverage of weeds in the typical experimental area was low, and the carbon density was 62.18 t C/ha. The soil carbon density of the hilly dryland was 56.17 t C/ha. According to the regression curve of the model, the soil carbon density of the shrubwood was 53.85 t C/ha and 51.66 t C/ha in 2005 and 2010, respectively, and the accuracy was 95.76% and 97.06%, respectively. The soil carbon density of the hilly dryland was 54.91 t C/ha and 58.13 t C/ha in 2005 and 2010, respectively, and the accuracy was 97.76% and 96.51%, respectively. The soil carbon density of the low-coverage grassland was 62.51 t C/ha and 62.94 t C/ha, and the accuracy was 99.47% and 98.78%. Therefore, the regression curve and model could be used for further analysis.

3. Results

The land use/land cover data and the corresponding types of carbon densities were input into the InVEST model, and carbon storage and sequestration were simulated in the Loess Plateau for the three years of 2000, 2005, and 2010. In addition, the contribution of land use change to carbon sequestration, the contribution of carbon footprint change to carbon storage, and the relationships between carbon storage change and geographical factors (elevation, slope) were analyzed.

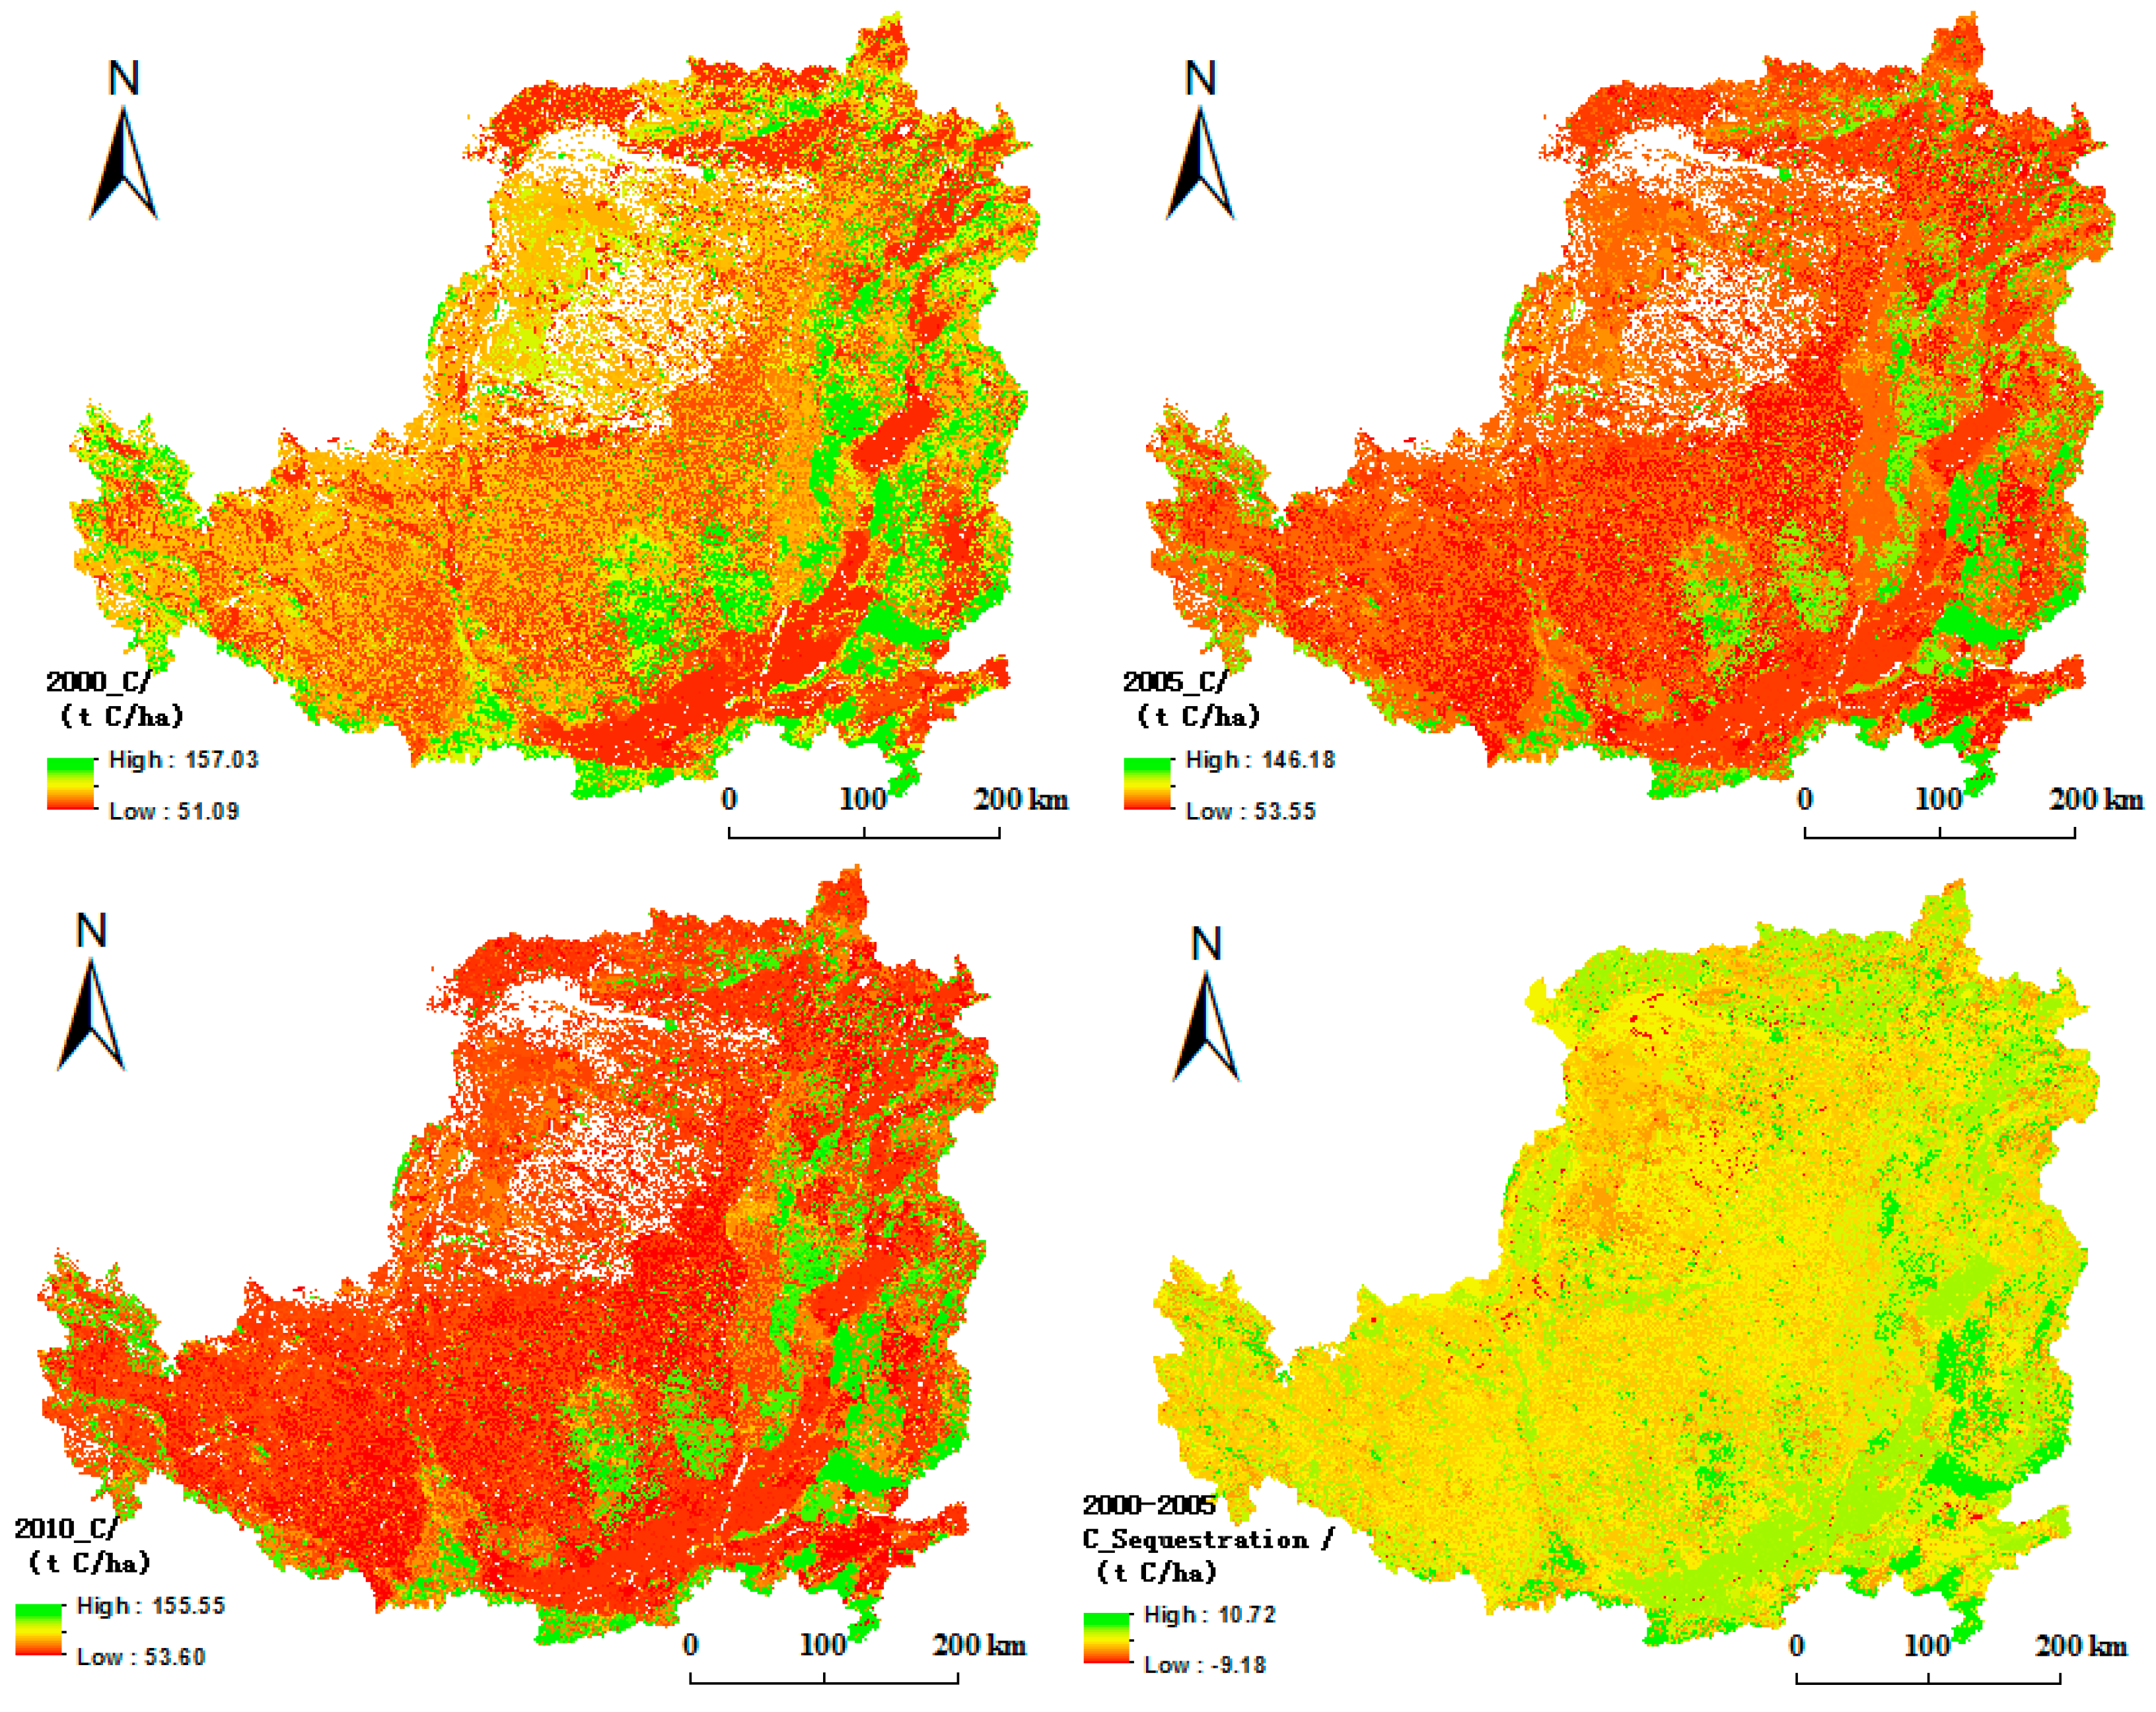
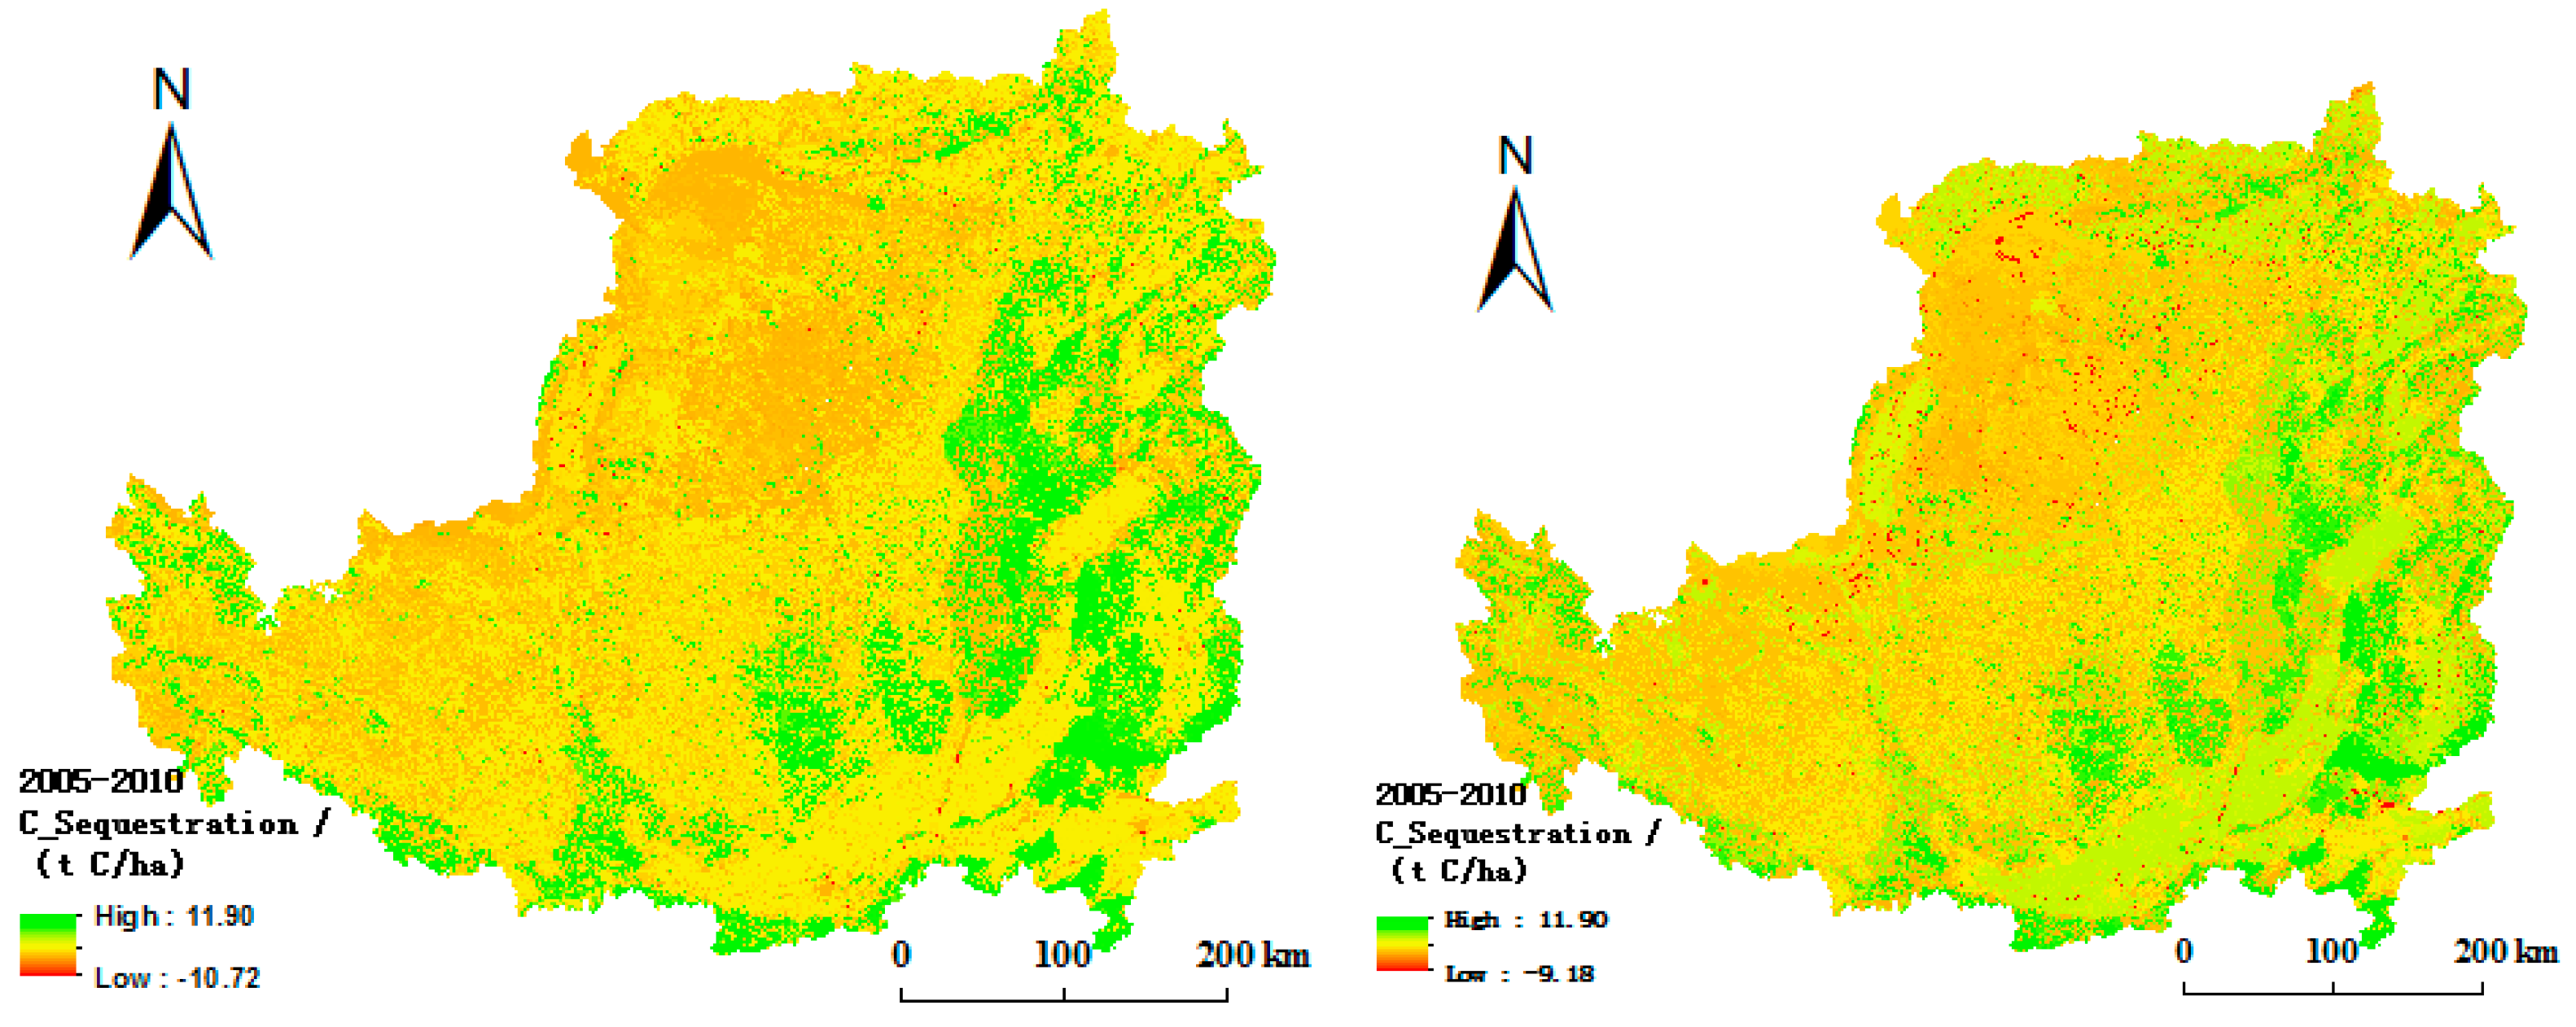
3.1. Carbon Storage Patterns

From 2000 to 2010, carbon storage increased steadily in the Loess Plateau. Carbon storage in 2000, 2005 and 2010 was 3.95, 3.96, and 4.21 billion tons, respectively. Total carbon storage increased by 0.26 billion tons, and carbon storage showed steady growth. The land cover types distributed from the northwest to the southeast were grassland, forest and cultivated land. Vegetation coverage increased gradually across the Loess Plateau. Due to measures such as the return of farmland to forest, afforestation, the planting of grass, the construction of horizontal terraces, the implementation of water conservancy projects and the comprehensive management of small watersheds in Loess Plateau, the vegetation area of the Loess Plateau is gradually increasing, and vegetation growth is improving. The distribution pattern of carbon storage is consistent with that of natural zonation, and carbon storage in the ecosystem gradually increased from the northwest to the southeast (Figure 3).

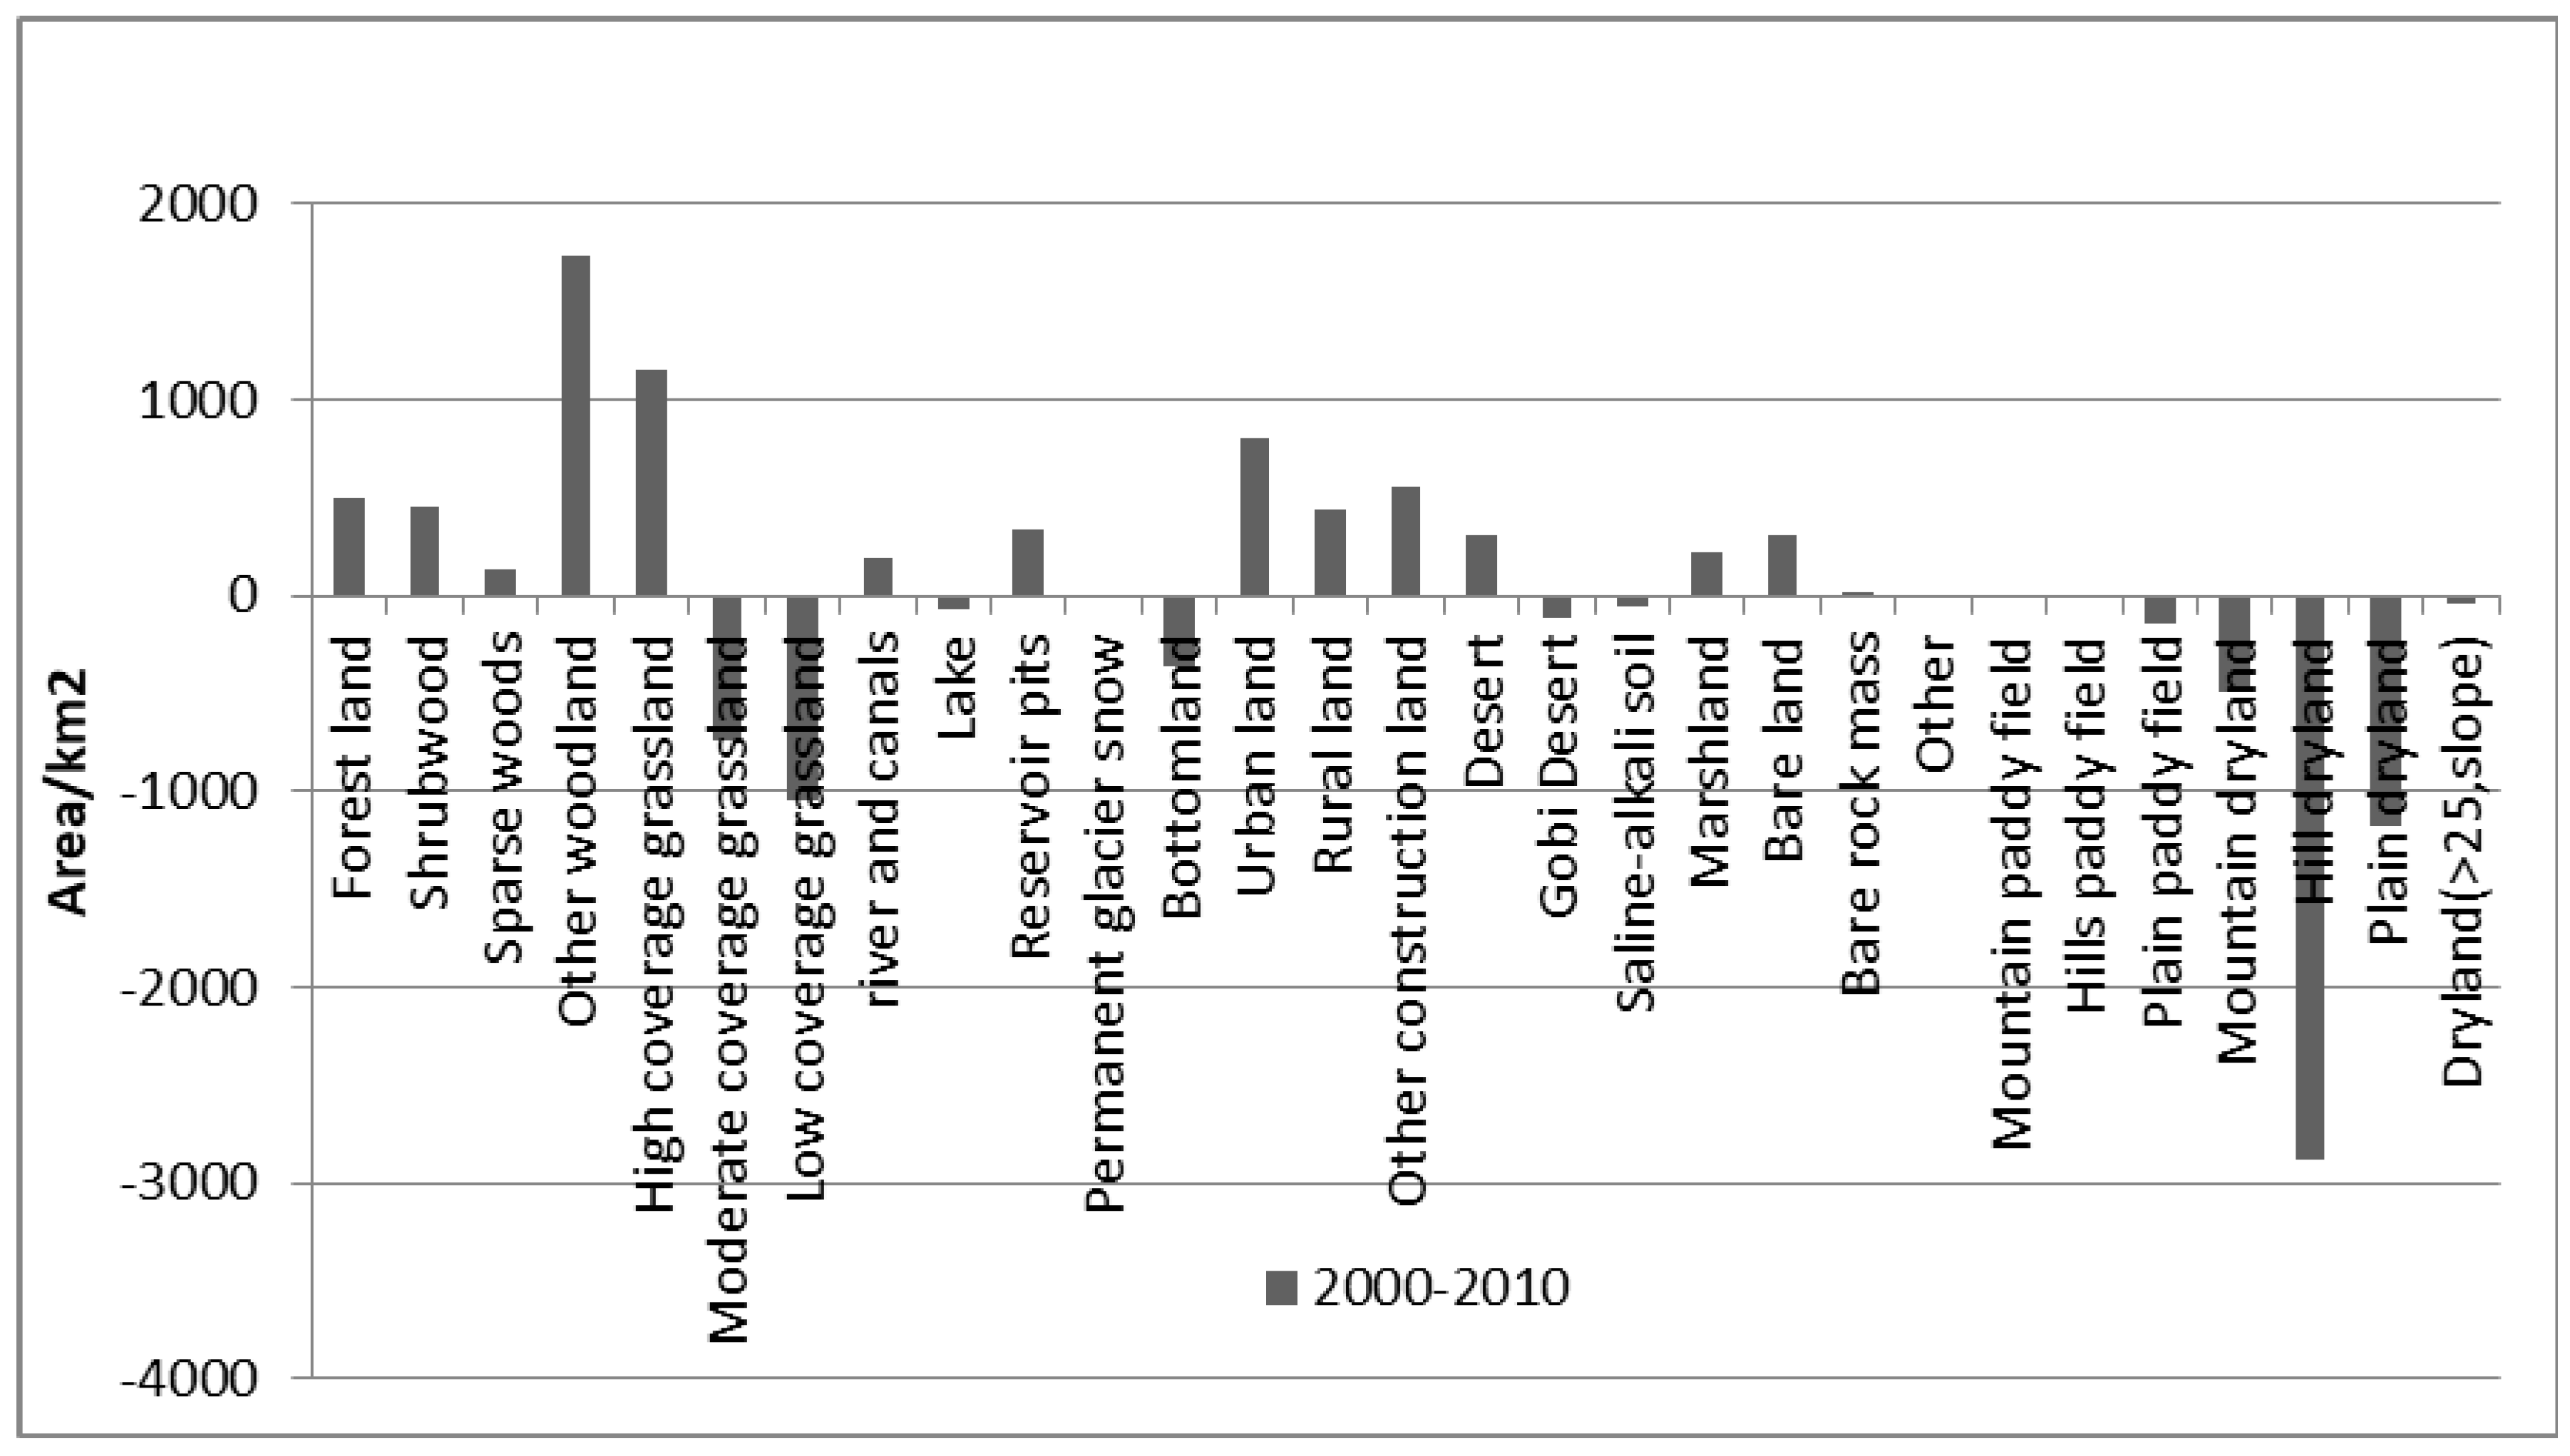
3.2. The Contribution of Changes in Land Use Type to Carbon Storage

The climate of the Loess Plateau shifts from warm subhumid to semiarid climate to arid from the southeast to the northwest. The natural vegetation corresponds to the climate type and is forest-grassland, grassland, and sand-grassland. The difference in the terrain of the land use type and vegetation coverage is obvious. The growth rate of vegetation is significant, and reconstruction and conservation occurred in the major areas of vegetation restoration on the sloping fields between 2000 and 2005.
The effect of LUCC on vegetation coverage increased, and the growth rate of vegetation coverage in the LUCC area was significantly higher than that in the unchanged area. From 2000 to 2010, the growth rates of the areas where farmland was returned to forest and grassland were especially prominent. Grassland areas first decreased and then increased. The area with high grassland coverage increased to approximately 1153 km2, and the area with moderate or low grassland coverage decreased to 1789 km2. The areas of all types of forest increased markedly. The forest area increased by 503 km2, the shrubwood area increased by 449 km2, the sparse-woods area increased by 134 km2, and other woodlands increased by 1723 km2. The area with zero carbon increased by 1159 km2, representing a percentage increase of 0.2%. The areas of rivers and canals, reservoir pits, other construction lands, desert, bare lands and bare rock mass all increased. The areas of lakes, bottomland and the Gobi Desert all decreased. The areas of urban and rural land increased, the saline-alkali soil area decreased, and the marshland area increased. The total area of cultivated land, such as mountain paddy fields, hill paddy fields, plain paddy fields, mountain dryland, hilly dryland, plain dryland and dryland (>25 slope), decreased from 216,476 km2 to 211,736 km2 (Figure 4).
Assuming that the carbon density is constant, the carbon storage changes caused only by the changes in land use/land cover type were considered. From 2000 to 2010, the carbon storage in Loess Plateau decreased by 0.3 million tons, accounting for −1% of the carbon storage dynamics (Figure 5).

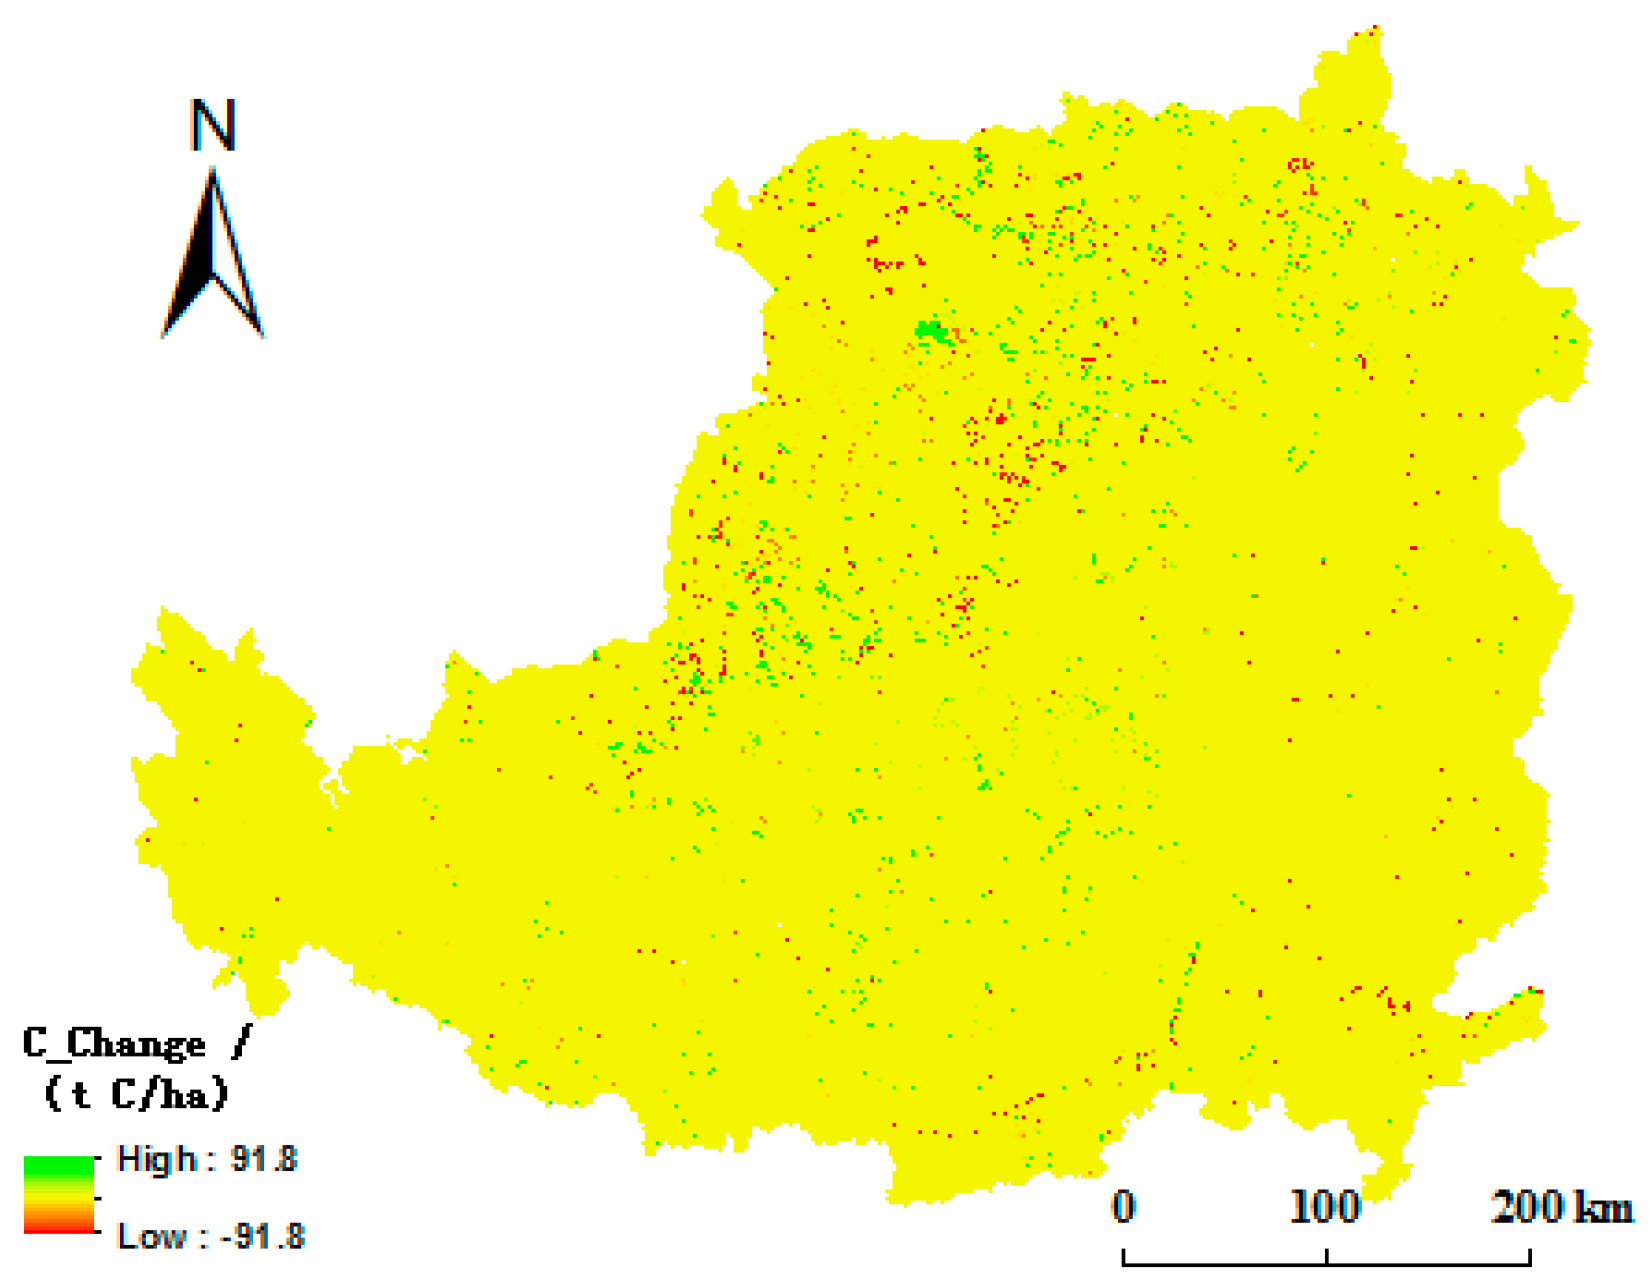
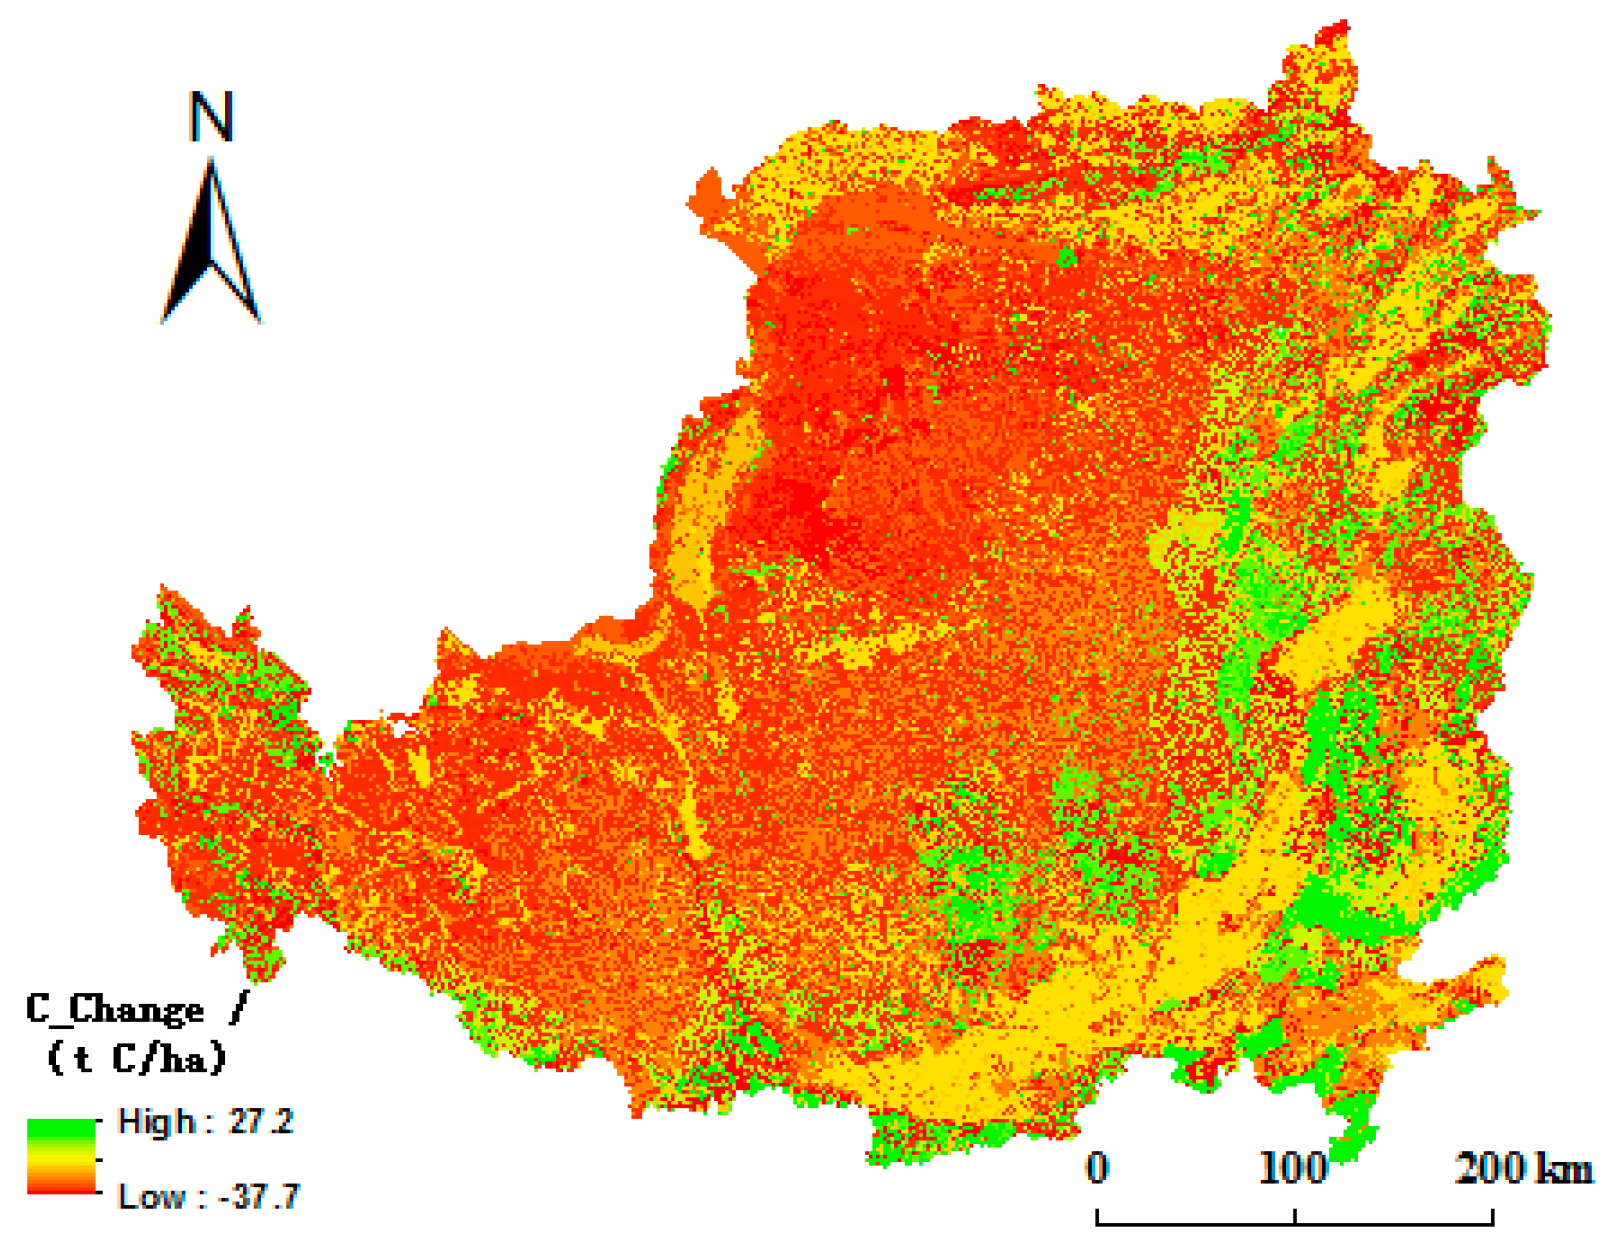
3.3. The Contribution of Carbon Density to Carbon Storage

From 2000 to 2010, the carbon densities of the areas with high carbon densities increased; these areas included forestland, shrubwood, sparse woods, and cultivated land. The carbon densities of most types of land increased. The carbon density slightly decreased in only four types of land, namely, high-coverage grassland, moderate-coverage grassland, low-coverage grassland and mountain paddy fields. The carbon densities of sparse woods and hilly drylands first decreased and then increased, and the overall trend was one of increase. The carbon density of the saline-alkali soil first increased and then decreased, and the overall trend was one of increase. The carbon densities of the other land use types, such as forestland, shrubwood, other woodlands, urban land, rural land, marshland, hilly paddy fields, plain paddy fields, mountain dryland, plain dryland and dryland (>15 slope), steadily increased (Table 1).
In total, the average carbon density steadily increased from 69.01 t/ha in 2000 to 70.46 t/ha in 2005 and to 76.05 in 2010, and the average increase was 7.04 t/ha. Assuming no land conversion, the carbon storage changes due only to the changes in carbon density were considered. The Loess Plateau carbon storage increased by 26.2 million tons, accounting for 100.1% of the carbon storage dynamics (Figure 6).

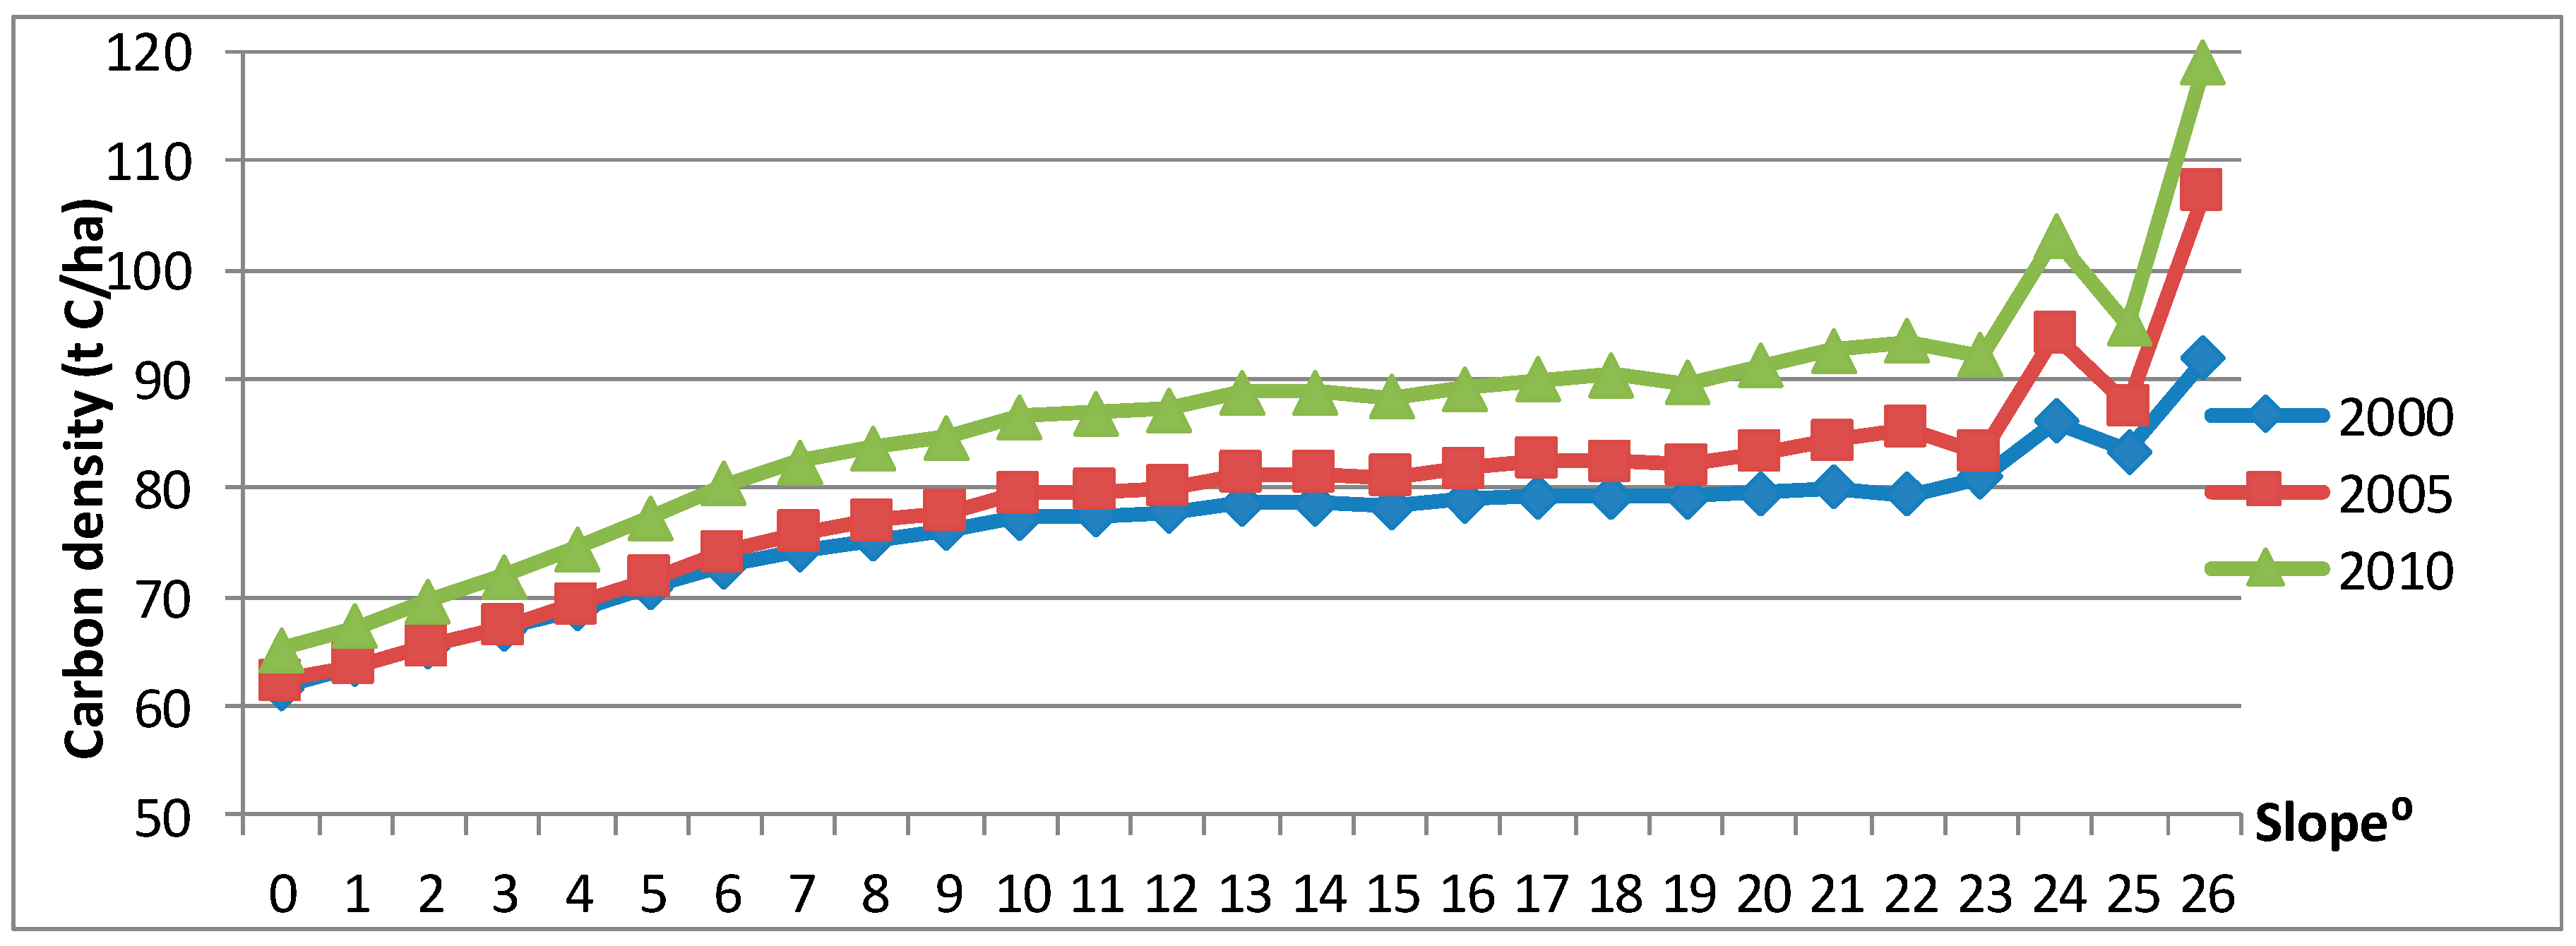
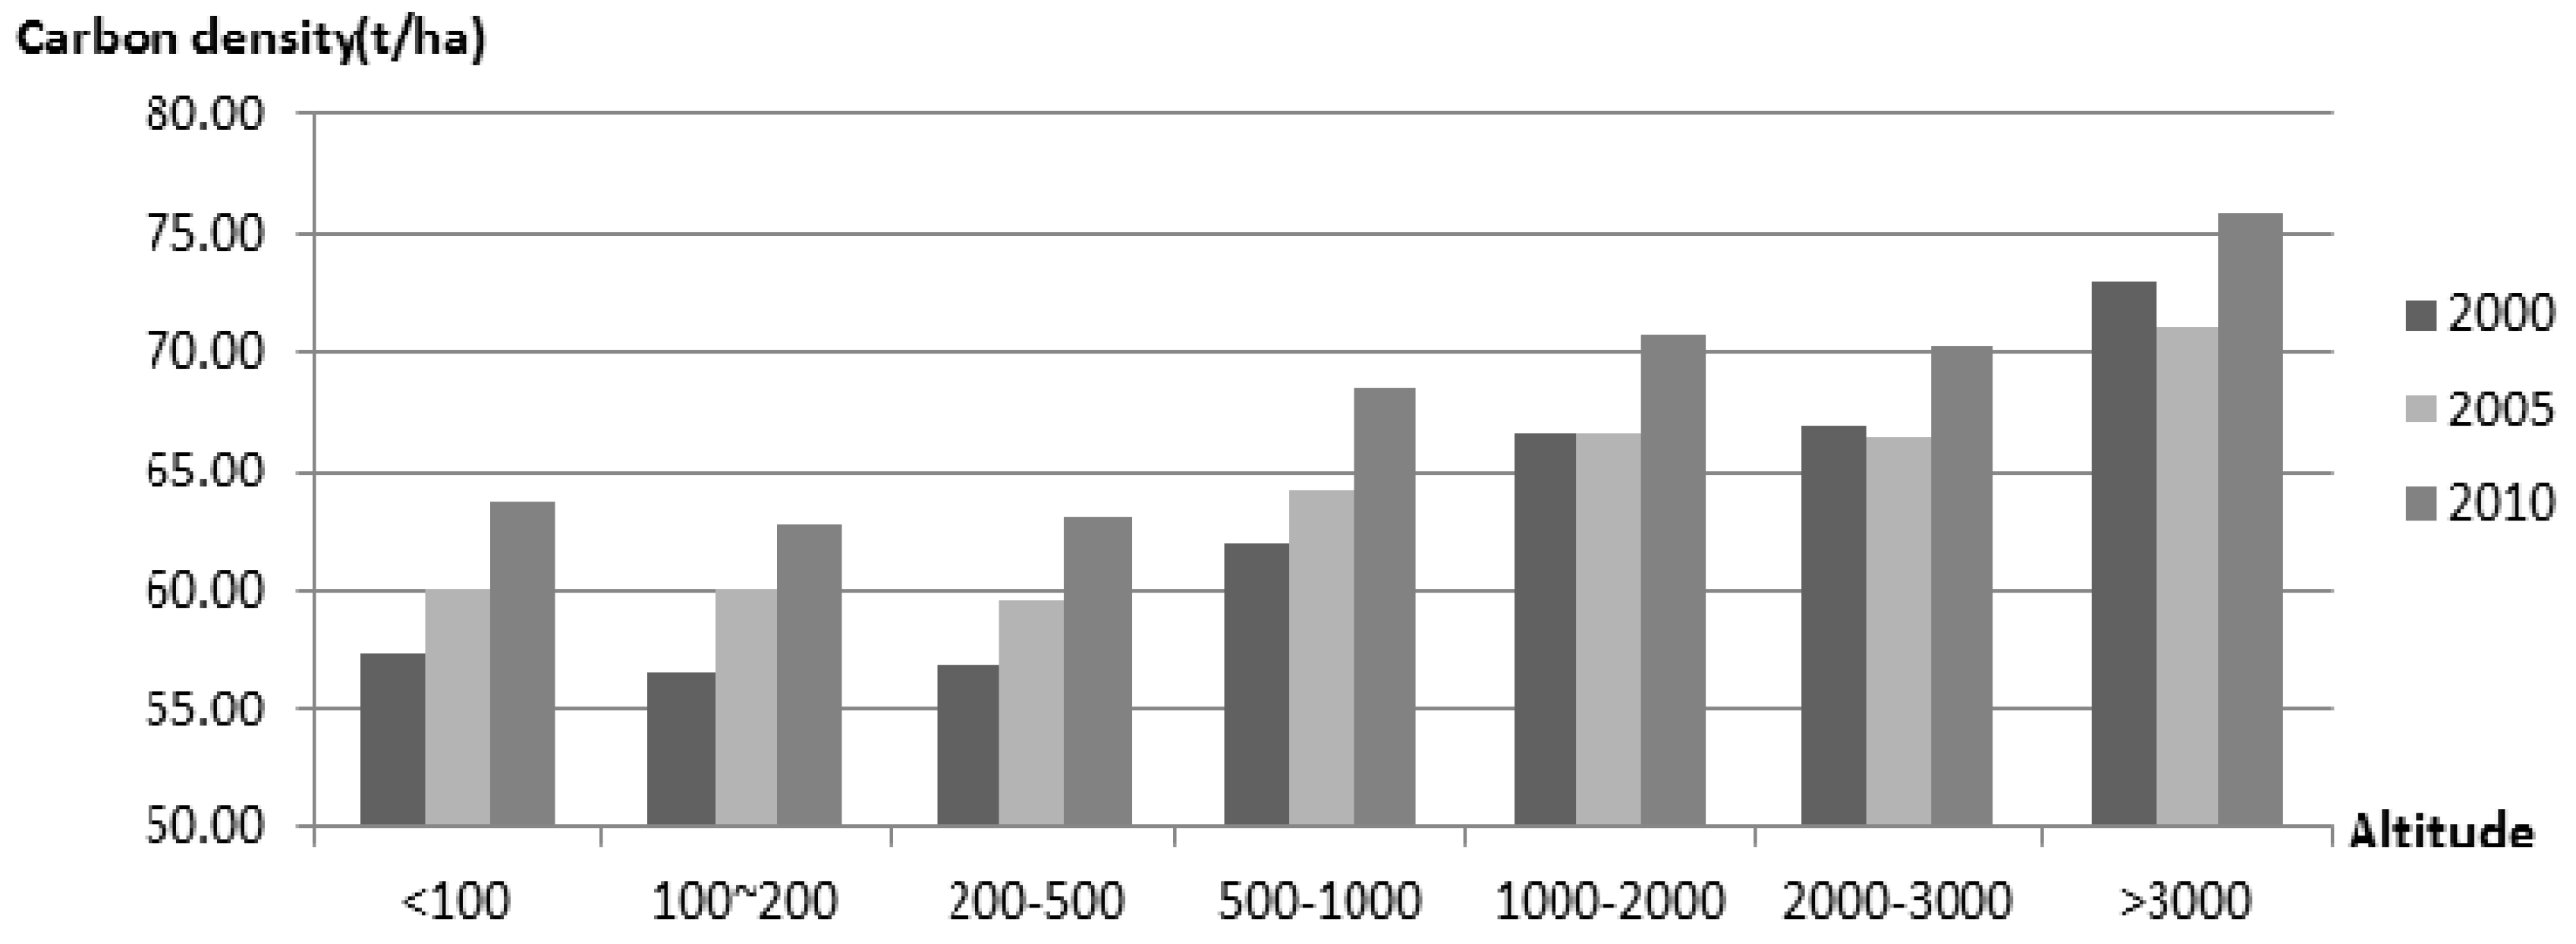
3.4. The Relationships between Carbon Storage and Geographical Factors

A DEM, a discrete digital representation of the surface topography of the earth [11], can be used to extract terrain factors, such as slope, aspect and slope position, and is widely used in geoanalysis [22]. In this study, the differences in carbon storage among different slope conditions were analyzed based on a DEM. Slope is a terrain factor derived from the DEM and not only represents the degree of tilt but also affects the redistribution of materials, such as soil, water, heat, and nutrients [23].
Carbon storage significantly differed among different slopes (Table 2). The vegetation on the Loess Plateau was mainly distributed in the areas with slopes of 0~26°. The vegetation area decreased with increasing slope. The 0°, flat region along both sides of the Yellow River is mostly cultivated land, and the Mausu Desert is in the northwest region of the Loess Plateau. As the slope increased, the land use type transitioned to woodland and grassland, the vegetation coverage improved, human disturbance decreased, and the average carbon density steadily increased (Figure 7).
The slope of the Loess Plateau was positively correlated with the mean carbon density (p = 0.01), with correlation coefficients of 0.923 in 2000, 0.905 in 2005, and 0.907 in 2010. In addition, the carbon density exhibited three curve relations with slope, with a fitting degree of 0.963. The vegetation coverage in the area with a slope of 0~1° first decreased and then increased, and the total reduction was 887 km2 from 2000 to 2010. The vegetation coverage in the area with a slope of 3~13° declined throughout the study period; from 2000–2005, it decreased by 210 km2, and from 2005–2010, it decreased by 61 km2. The vegetation coverage in the area with a slope of 14~26° remained stable over time. Furthermore, as the slope increased, the vegetation area decreased. Total carbon storage was negatively correlated with slope, with correlation coefficients of −0.718 in 2000, −0.719 in 2005, and −0.723 in 2010.
A change in altitude causes a change in climate factors, which impacts vegetation growth, development and physiological metabolism [24,25]. Accordingly, vegetation biomass and SOC were affected by altitude [21,26]. This study found that altitude in the Loess Plateau was significantly correlated with the average carbon density (p < 0.01), and the correlation coefficients were 0.747 in 2000, 0.543 in 2005, and 0.457 in 2010. However, total carbon storage was negatively correlated with altitude, with correlation coefficients of −0.481 in 2000, −0.487 in 2005, and −0.487 in 2010.
As altitude increased, land area decreased. Altitude and land area were significantly negatively correlated, with correlation coefficients of −0.498 in 2000, −0.498 in 2005, and −0.497 in 2010. Correspondingly, as altitude increased, forest area increased, and carbon density gradually increased (Figure 8). The Loess Plateau area is divided into seven grades according to altitude, <100 m, 100–200 m, 200–500 m, 500–1000 m, 1000–2000 m, 2000–3000 m and >3000 m, and the average carbon densities were 60.34, 59.79, 59.83, 64.92, 67.94, 67.85 and 73.32 t C/ha, respectively (Table 3).

4. Discussion

This study used raster data of global biomass and SOC along with sampling data to inversely calculate the aboveground biomass, belowground biomass, and SOC in the Loess Plateau. Then, the aboveground biomass, belowground biomass, SOC and humus carbon were determined. In addition, the accuracies of the inversion parameters were evaluated using the field-measured data, which indicated that the parameters were appropriate for further simulation and analysis. The InVEST model was used to simulate carbon storage, and the relationships between geographical factors and carbon storage, carbon density and land use/land cover type were analyzed. The accuracies of the results were verified using MYD17A2 and MOD17A2 products and soil and biomass survey data in the study area.
In this study, we found that the overall average value of carbon density ranged from 69.01 t/ha to 76.05 t/ha. The values are very different from those in other regions of China and global averages. This difference may be due to several factors. First, study differences in the number of data sets and sampling methods might be responsible. The Loess Plateau is a typical area and cannot reflect the world carbon distribution; its spatial heterogeneity might have contributed to the subtle differences between the woodlands of the study area and woodlands around the world. Second, the measurement accuracy of the NDVI data might have affected the uncertainties of the biomass estimates. Third, differences might be caused by natural selection expressed through plant morphology [27,28,29,30].
The spatial resolution of the simulated data in the Loess Plateau was 1 km, which is low, leading to uncertainty in the accuracy of the simulation result. The spatial resolution of the data used in the analysis of the geographical factors, such as elevation and slope, was 1 km, and there will be differences in the analyses of small terrain features or areas, which supports the view that differences in data sets and sampling methods may affect the results. Furthermore, the spatial resolution of the NDVI data and the processing methods affect the precision.
In addition, as reported in this study, not surprisingly, we found that carbon density or carbon storage was strongly related to geographical driving factors, thus supporting our hypothesis that carbon density is influenced by abiotic driving factors. Here, we explore and illustrate the relative contributions of geographical driving factors on carbon density.
Biomass is directly affected by plant traits and indirectly affected by soil properties [31,32]. In the present study, biomass was affected by slope and altitude because slope and elevation affect moisture and temperature, which affect plant growth. Geographical factors have direct effects on biomass owing to resource competition (e.g., light capture), and biomass is controlled more by land cover type and plant height, resulting in carbon storage [33,34]. In addition, soil properties have effects on biomass owing to the contribution of soil nutrients to the decomposition and mineralization of organic matter. In addition, SOC has strong effects on biomass through its effects on belowground biomass, which acts as a large nutrition source for root biomass storage [35,36,37,38].
There are a number of factors, such as light, temperature, rainfall, and plant species, that affect carbon sequestration. In this paper, the effects of only vegetation type, elevation and slope on carbon storage were evaluated. According to the carbon density analysis, the soil carbon density increased by 67.46 million tons of carbon, accounting for 25.94% of the total increase in carbon storage, over the ten-year study period. Soil carbon sequestration not only is a strategy to achieve food security through the improvement of soil quality but can also increase the global carbon reserves and improve the environment. Furthermore, soil carbon is a vitally important secondary product of increasing crop yield or enhancing the biomass of land cover. When carbon dioxide emissions into the air are reduced, soil carbon can improve and sustain biomass productivity. SOC is a very valuable natural resource. Regardless of climate change, soil carbon must be restored and improved. However, the close links between soil carbon sequestration and global food security or production and climate change cannot be overemphasized or ignored.
In addition, biomass increases have a major impact on carbon storage. Our results provide evidence to support the proposal in the Kyoto Protocol that carbon sequestration by afforestation or reforestation has the potential to partly offset carbon dioxide emissions from fossil fuel consumption, even though the increased carbon uptake is viewed as temporary. The Kyoto Protocol does not require commitments from developing countries, including China, but recent decreases in the rate of deforestation in China have already contributed to reduced carbon dioxide emissions. We believe that continuing the practice of nationwide afforestation and reforestation projects can contribute significantly to global carbon storage.

5. Conclusions

Carbon accumulation in the Loess Plateau region was simulated based on the InVEST model. The attribution analysis of the change of carbon storage identified the contributions of changes in carbon density and land cover to carbon storage. Moreover, the analyses of slope, elevation and other geographical factors revealed that these factors also affect carbon storage. This study found that the vegetation in the Loess Plateau gradually improved between 2000 and 2010. During this time, the biomass increased, and carbon storage slowly increased by 0.26 billion tons.
The overall change in land cover in the Loess Plateau was not large. The increases in the carbon densities of cultivated land and grassland were the most prominent. The carbon densities of areas with high carbon densities, such as woodland, shrubwood, forest and arable land, all increased. The carbon density of grassland decreased slightly, and the carbon densities of saline-alkali land and bog increased.
The study of carbon density and land cover change revealed that the contribution of land cover change to carbon storage was −1.0%. The effect of carbon density on carbon storage was 100.1%, which was mainly due to the implementation of the policy of returning farmland to forest (grassland) in the late 1990s [8]. This policy effectively promoted the restoration and reconstruction of vegetation in the Loess Plateau, including the existing vegetation area. In addition, it promoted the conservation and restoration of cropland and grassland and the restoration and reconstruction of low-vegetation-cover areas. These policies improved both the vegetation cover and the ecosystem carbon storage function. In addition, these factors are subject to climate change, which affects vegetation growth. Elevation and slope are also significantly correlated with carbon storage, which is directly related to meteorological and environmental factors, such as temperature, light, and water.
These findings reveal the driving factors influencing carbon storage and raise interesting questions: How is carbon storage regulated by vegetation growth and distribution in the Loess Plateau? Do plant biomass distribution, ecological environment and geographical factors drive carbon storage, and if so, what is the mechanism of interaction between these environmental driving factors and the storage of carbon? Future research will answer these questions.

Author Contributions

G.H. conceived and designed the experiments; Z.H. performed the experiments; Z.H. and G.H. analyzed the data; G.H. wrote the paper.

Acknowledgments

This research was supported in part by the National Natural Science Foundation of China under grants “Impact of Climate and Landuse Change on Water Quantity and Water Quality in the Mun River Basin (No. 41661144030)” and “Study on Water Resources Change and Adaptive Management in the Great Mekong River Basin (No. 41561144012)”.

Conflicts of Interest

The authors declare no conflicts of interest. The founding sponsors had no role in the design of the study; in the collection, analyses, or interpretation of data; in the writing of the manuscript; or in the decision to publish the results.

References

  1. Jorgensen, L. Newsletter of the Global Land Project International Project Office GLP News GLP Nodal Offices Newsletter of the Global Land Project International Project Office G Pn New E WS; GLP: Taipei, Taiwan, 2010. [Google Scholar]
  2. Foley, J.A.; DeFries, R.; Asner, G.P.; Barford, C.; Bonan, G.; Carpenter, S.R.; Chapin, F.S.; Coe, M.T.; Daily, G.C.; Gibbs, H.K.; et al. Global Consequences of Land Use. Science 2005, 309, 570–574. [Google Scholar] [CrossRef] [PubMed] [Green Version]
  3. Rindfuss, R.R.; Walsh, S.J.; Turner, B.L.; Fox, J.; Mishra, V. Developing a science of land change: Challenges and methodological issues. Proc. Natl. Acad. Sci. USA 2004, 101, 13976–13981. [Google Scholar] [CrossRef] [PubMed] [Green Version]
  4. Zhao, S.Q.; Liu, S.; Li, Z.; Sohl, T.L. Ignoring detailed fast-changing dynamics of land use overestimates regional terrestrial carbon sequestration. Biogeosciences 2009, 6, 1647–1654. [Google Scholar] [CrossRef] [Green Version]
  5. Bennett, M.T. China’s sloping land conversion program: Institutional innovation or business as usual? Ecol. Econ. 2008, 65, 699–711. [Google Scholar] [CrossRef]
  6. Food and Agriculture Organization (FAO). Global Forest Resources Assessment 2000 Main Report; FAO Forestry Paper; FAO: Rome, Italy, 2010. [Google Scholar]
  7. Breidenich, C.; Magraw, D.; Rowley, A.; Rubin, J.W. The Kyoto Protocol to the United Nations Framework Convention on Climate Change. Am. J. Int. Law 1998, 92, 315–331. [Google Scholar] [CrossRef]
  8. Bohn, H.L. Estimate of Organic Carbon in World Soils. Soil Sci. Soc. Am. J. 1982, 40, 468–470. [Google Scholar] [CrossRef]
  9. Eswaran, H.; Berg, E.V.D.; Reich, P. Organic Carbon in Soils of the World. Soil Sci. Soc. Am. J. 1993, 90, 269–273. [Google Scholar] [CrossRef]
  10. Feng, J.; Hao, Y.; Qiguo, Z. Soil organic carbon and its influencing factors. Soils 2000, 32, 11–17. [Google Scholar]
  11. Post, W.M.; Emanuel, W.R.; Zinke, P.J.; Stangenberger, A.G. Soil carbon pools and world life zones. Nature 1982, 298, 156–159. [Google Scholar] [CrossRef]
  12. Qing, T.; Yong, X.; Yi, L. Spatial difference of land use change in Loess Plateau region. J. Arid Land Resour. Environ. 2010, 24, 15–21. [Google Scholar]
  13. Ai, Z.; Chen, Y.; Cao, Y. Storage and allocation of carbon and nitrogen in Robinia pseudoacacia plantation at different ages in the loess hilly region, China. Chin. J. Appl. Ecol. 2014, 25, 333–341. [Google Scholar]
  14. Li, J.; Wang, X.; Shao, M.; Zhao, Y.; Li, X. Simulation of biomass and soil desiccation of Robinia pseudoacacia forestlands on semi-arid and semi-humid regions of China’s Loess Plateau. Chin. J. Plant Ecol. 2010, 34, 330–339. [Google Scholar]
  15. Chen, X.; Ma, Q.; Kang, F.; Cao, W.; Zhang, G.; Chen, Z. Studies on the Biomass and Productivity of Typical Shrubs in Taiyue Mountain, Shanxi Province. For. Res. 2002, 15, 304–309. [Google Scholar]
  16. Zhang, B.; Chen, C. Biomass and Production of Robinia Pseudoacacia Plantation in Hongxing Tree Farm of Changwu Country, Shaanxi Province. Shaanxi For. Sci. Technol. 1992, 3, 13–17. [Google Scholar]
  17. Ruesch, A.; Gibbs, H.K. New IPCC Tier-1 Global Biomass Carbon Map for the year 2000 [DB/OL]; The Carbon Dioxide Information Analysis Center, Oak Ridge National Laboratory: Oak Ridge, TN, USA, 2008. [Google Scholar]
  18. Carré, F.; Hiederer, R.; Blujdea, V.; Koeble, R. Background Guide for the Calculation of Land Carbon Stocks in the Biofuels Sustainability Scheme Drawing on the 2006 IPCC Guidelines for National Greenhouse Gas Inventories; Joint Research Center, European Commission: Luxembourg, 2010. [Google Scholar]
  19. Paustian, K.; Ravindranath, N.H.; Amstel, A.V. 2006 IPCC Guidelines for National Greenhouse Gas Inventories; Agriculture, Forestry and Other Land Use; IPCC: Geneva, Switzerland, 2006; Volume 4. [Google Scholar]
  20. Sharp, R.; Tallis, H.; Ricketts, T.; Guerry, A.; Wood, S.; Chaplin-Kramer, R.; Nelson, E.; Ennaanay, D.; Wolny, S.; Olwero, N.; et al. InVEST 3.1.2 User’s Guide; The Natural Capital Project: Stanford, CA, USA, 2015. [Google Scholar]
  21. Li, J.; Ma, Y.L.; Luo, J.; Li, H.; Luo, Z.B. Nutrients and Biomass of Different-Aged Robinia Pseudoacacia Plantations in the Loess Hilly Region. Available online: http://www.cqvip.com/qk/97059x/201303/45949088.html (accessed on 14 May 2018).
  22. Parton, W.J.; Schimel, D.S.; Cole, C.V.; Ojima, D.S. Analysis of Factors Controlling Soil Organic Matter Levels in Great Plains Grasslands1. Soil Sci. Soc. Am. J. 1987, 51, 1173–1179. [Google Scholar] [CrossRef]
  23. Oren, R.; Ellsworth, D.S.; Johnsen, K.H.; Phillips, N.; Ewers, B.E.; Maier, C.; Schäfer, K.V.; McCarthy, H.; Hendrey, G.; McNulty, S.G.; et al. Soil fertility limits carbon sequestration by forest ecosystems in a CO2-enriched atmosphere. Nature 2001, 411, 469–472. [Google Scholar] [CrossRef] [PubMed]
  24. Chen, C.; Peng, H. Standing Crops and Productivity of the Major Forest-types at the Huoditang Forest Region of the Qingling Mountains. J. Northwest For. Coll. 1996, 11, 92–102. [Google Scholar]
  25. Chen, Q.; Shen, C.; Yi, W.; Peng, S.; Li, Z. Progresses in soil carbon cycle researches. Adv. Earth Sci. 1998, 13, 555–563. [Google Scholar]
  26. Huang, G.S.; Xia, C. MODIS-Based Estimation of Forest Biomass in Northeast China. For. Resour. Manag. 2005, 4, 40–44. [Google Scholar]
  27. Mittelbach, G.G.; Steiner, C.F.; Scheiner, S.M.; Gross, K.L.; Reynolds, H.L.; Waide, R.B.; Willig, M.R.; Dodson, S.I.; Gough, L. What is the observed relationshio between species richness and productivity. Ecology 2001, 82, 2381–2396. [Google Scholar] [CrossRef]
  28. Mccarthy, M.C.; Enquist, B.J. Consistency between an allometric approach and optimal partitioning theory in global patterns of plant biomass allocation. Funct. Ecol. 2007, 21, 713–720. [Google Scholar] [CrossRef] [Green Version]
  29. Sun, J.; Cheng, G.W.; Li, W.P. Meta-analysis of relationships between environmental factors and aboveground biomass in the alpine grassland on the Tibetan Plateau. Biogeosciences 2013, 10, 1707–1715. [Google Scholar] [CrossRef]
  30. Yan, L.; Zhou, G.; Zhang, F. Effects of different grazing intensities on grassland production in China: A meta-analysis. PLoS ONE 2013, 8, e81466. [Google Scholar] [CrossRef] [PubMed]
  31. Xue, Z.; An, S.; Cheng, M.; Wang, W. Plant functional traits and soil microbial biomass in different vegetation zones on the Loess Plateau. J. Plant Interact. 2014, 9, 889–900. [Google Scholar] [CrossRef] [Green Version]
  32. Yang, Y.; Dou, Y.; An, S. Environmental driving factors affecting plant biomass in natural grassland in the Loess Plateau, China. Ecol. Indic. 2017, 82, 250–259. [Google Scholar] [CrossRef]
  33. Zuppinger-Dingley, D.; Schmid, B.; Petermann, J.S.; Yadav, V.; De Deyn, G.B.; Flynn, D.F. Selection for niche differentiation in plant communities increases biodiversity effects. Nature 2014, 515, 108–111. [Google Scholar] [CrossRef] [PubMed]
  34. Kunstler, G.; Falster, D.; Coomes, D.A.; Hui, F.; Kooyman, R.M.; Laughlin, D.C.; Poorter, L.; Vanderwel, M.; Vieilledent, G.; Wright, S.J.; et al. Plant functional traits have globally consistent effects on competition. Nature 2016, 529, 204. [Google Scholar] [CrossRef] [PubMed]
  35. Wang, Z.; Luo, T.; Li, R.; Tang, Y.; Du, M. Causes for the unimodal pattern of biomass and productivity in alpine grasslands along a large altitudinal gradient in semi-arid regions. J. Veget. Sci. 2013, 24, 189–201. [Google Scholar] [CrossRef]
  36. Peña, M.A.; Duque, A. Patterns of stocks of aboveground tree biomass, dynamics, and their determinants in secondary Andean forests. For. Ecol. Manag. 2013, 302, 54–61. [Google Scholar] [CrossRef]
  37. Goodness, J.; Andersson, E.; Anderson, P.M.; Elmqvist, T. Exploring the links between functional traits and cultural ecosystem services to enhance urban ecosystem management. Ecol. Indic. 2016, 70, 597–605. [Google Scholar] [CrossRef]
  38. Li, N.; He, N.; Yu, G.; Wang, Q.; Sun, J. Leaf non-structural carbohydrates regulated by plant functional groups and climate: Evidences from a tropical to cold-temperate forest transect. Ecol. Indic. 2016, 62, 22–31. [Google Scholar] [CrossRef] [Green Version]
Figure 1. Biomass-NDVI and SOC-NDVI regression analyses.
Energies 11 01596 g001
Figure 2. Location of the typical experimental area.
Energies 11 01596 g002
Figure 3. Temporal and spatial patterns of carbon storage in Loess Plateau from 2000 to 2010.
Energies 11 01596 g003aEnergies 11 01596 g003b
Figure 4. Land use structure changes from 2000 to 2010.
Energies 11 01596 g004
Figure 5. Changes in carbon storage due to LUCC from 2000 to 2010.
Energies 11 01596 g005
Figure 6. Changes in carbon storage due to changes in carbon density from 2000 to 2010
Energies 11 01596 g006
Figure 7. Relationship between slope and carbon density on the Loess Plateau.
Energies 11 01596 g007
Figure 8. Relationship between altitude and carbon density.
Energies 11 01596 g008
Table 1. The carbon density of different land use types and changes in carbon density during 2000–2010.
Land Type2000/(t/ha)2005/(t/ha)2010/(t/ha)2010–2000/(t/ha)2005–2000/(t/ha)2010–2005/(t/ha)
Forest land91.79107.17118.9915.3811.8327.2
Shrubwood86.9190.77104.043.8613.2717.13
Sparse woods73.6871.6681.26−2.029.67.58
Other woodland58.7956.7360.18−2.063.451.39
High-coverage grassland74.8567.7671.07−7.083.31−3.77
Moderate-coverage grassland66.8062.9464.41−3.861.47−2.39
Low-coverage grassland65.4262.5162.94−2.910.43−2.48
Urban land51.3853.5553.602.170.062.23
Rural land52.8658.0360.275.182.237.41
Saline-alkali soil52.3054.6953.772.39−0.921.47
Marshland51.0954.4855.563.391.084.47
Mountain paddy field157.03146.18155.55−10.859.37−1.48
Hills paddy field59.0062.9275.613.9212.716.61
Plain paddy field64.9269.0271.794.12.776.87
Mountain dryland60.6463.0573.4212.782.4110.38
Hill dryland55.5354.9158.132.60−0.623.22
Plain dryland52.8658.4861.728.865.623.24
Dryland (>25 slope)66.3273.4486.6120.297.1213.17
Table 2. Carbon density of areas with different slopes in the Loess Plateau.
Slope (°)2000 (t/ha)2005 (t/ha)2010 (t/ha)
061.7062.3765.14
163.7963.6867.29
265.5265.4169.62
367.1667.2171.84
468.9269.2974.39
570.9771.7177.28
672.8774.1780.28
774.2875.8582.34
875.2777.0583.70
976.1677.8584.67
1077.2779.5186.61
1177.4779.7286.81
1277.7479.9787.13
1378.5881.3388.75
1478.5981.3388.79
1578.2680.9388.33
1678.8281.7489.05
1779.2082.5389.92
1879.2682.4590.40
1979.1982.0889.54
2079.5183.2491.18
2180.0884.2992.62
2279.4185.5093.34
2381.0383.1992.12
2486.1494.03103.02
2583.3287.4795.03
2691.79107.17118.99
Table 3. Carbon densities at different altitudes.
Altitude (m)2000 (t/ha)2005 (t/ha)2010 (t/ha)Average (t/ha)
<10057.3159.9763.7360.34
100~20056.5660.0862.7459.79
200–50056.9059.5963.0159.83
500–100062.0264.1768.5764.92
1000–200066.5366.6170.6867.94
2000–300066.9466.4170.2167.85
>300072.9471.1175.9273.32

