


Abstract
The ongoing industrialization and modernization period has increased the demand for energy in Viet Nam. This has led to over-exploitation and exhausts fossil fuel sources. Nowadays, Viet Nam’s energy mix is primarily based on thermal and hydro power. The Vietnamese government is trying to increase the proportion of renewable energy. The plan will raise the total solar power capacity from nearly 0 to 12,000 MW, equivalent to about 12 nuclear reactors, by 2030. Therefore, the construction of solar power plants is needed in Viet Nam. In this study, the authors present a multi-criteria decision making (MCDM) model by combining three methodologies, including fuzzy analytical hierarchy process (FAHP), data envelopment analysis (DEA), and the technique for order of preference by similarity to ideal solution (TOPSIS) to find the best location for building a solar power plant based on both quantitative and qualitative criteria. Initially, the potential locations from 46 sites in Viet Nam were selected by several DEA models. Then, AHP with fuzzy logic is employed to determine the weight of the factors. The TOPSIS approach is then applied to rank the locations in the final step. The results show that Binh Thuan is the optimal location to build a solar power plant because it has the highest ranking score in the final phase of this study. The contribution of this study is the proposal of a MCDM model for solar plant location selection in Viet Nam under fuzzy environment conditions. This paper also is part of the evolution of a new approach that is flexible and practical for decision makers. Furthermore, this research provides useful guidelines for solar power plant location selection in many countries as well as a guideline for location selection of other industries.
1. Introduction
The Earth is facing global warming and climate change challenges. Many studies have been done to find solutions by exploiting renewable energy. This is the best way of reducing fossil fuel use, reducing greenhouse gas emissions and maintaining the Earth’s temperature increase under 2 °C [1].
Solar energies, including solar energy, photovoltaic, and solar thermal, have many positive effects on the environment, contributing to the sustainable development of society and improving the quality of human life [2]. Nowadays, building solar power plants is becoming easier because the price of solar panels is decreasing [3,4]. The advantages of solar energies are increased CO2 mitigation, they do not make noise, they minimize toxic wastes and they do not require environmental remediation treatments [5]. In this study, we introduced a MCDM approach including DEA, Fuzzy AHP and TOPSIS to select the best location for building a solar power plant.
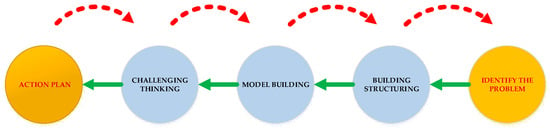
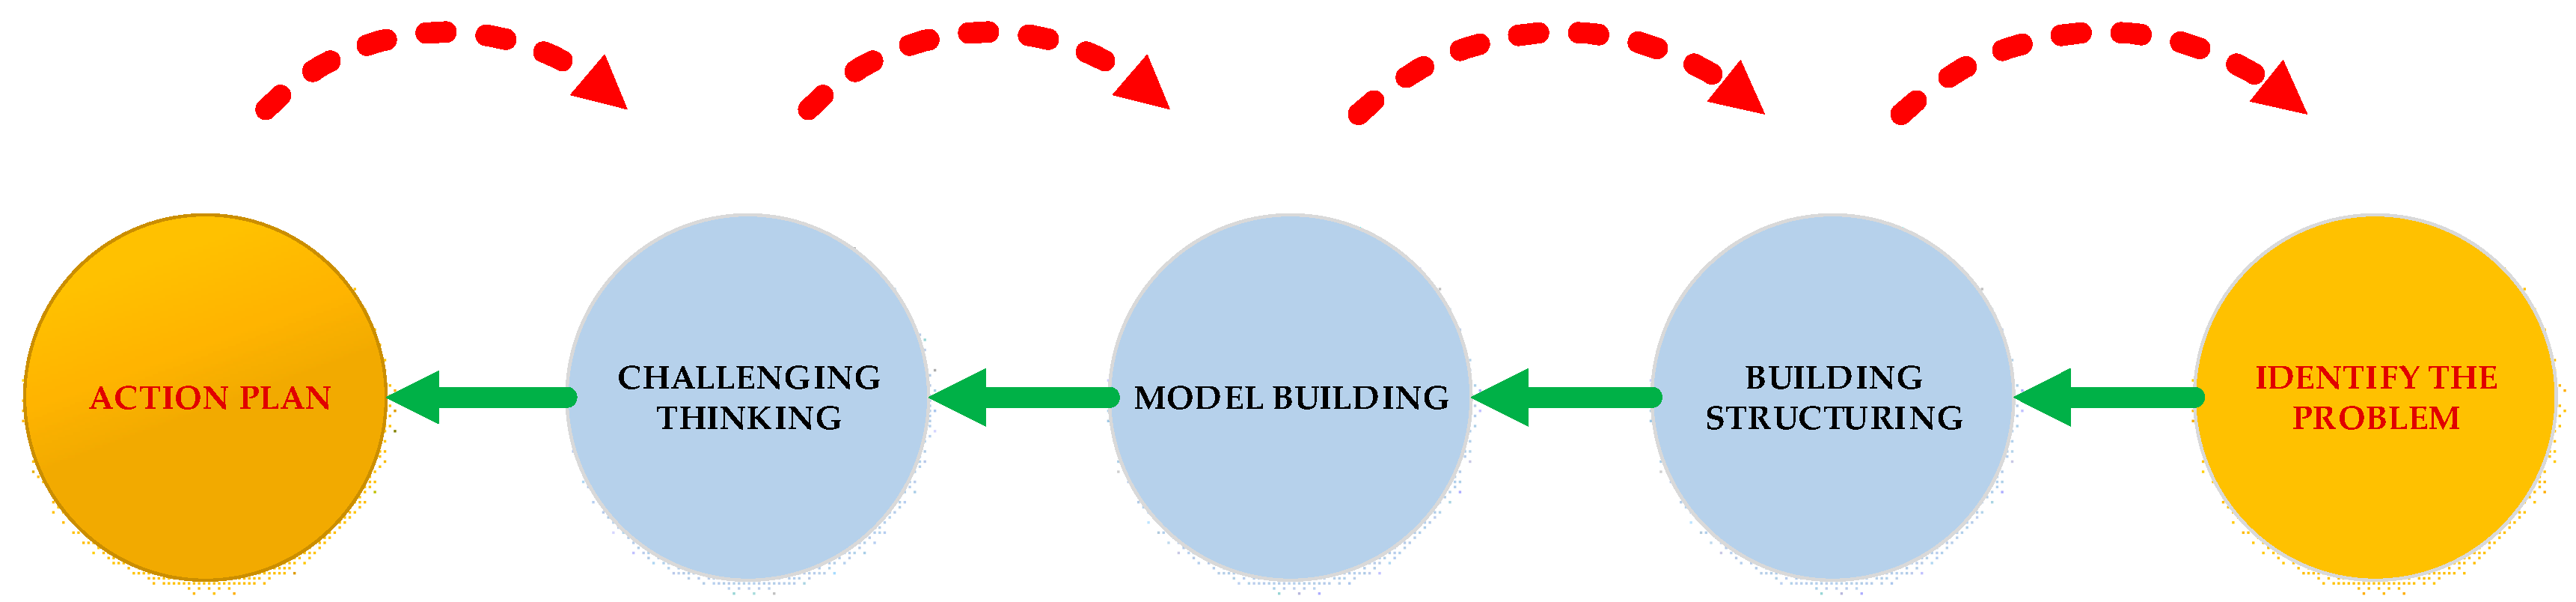
Many studies have applied the MCDM approach to various fields of science and engineering and their number has been increasing over the past years. One of the fields where the MCDM model has been employed is the location selection problem. Location selection is an important use of MCDM models. Huang et al. [6], Loken [7] used MCDM models for selecting construction locations in the energy sector. The general procedure of MCDM is shown in Figure 1 [8].
Figure 1.
General methodology of MCDM procedure.
The AHP model was proposed by Saaty [9] in the 1980s.There are six steps in the AHP procedure as follows:
- (1)
- Specifying the problem;
- (2)
- Constructing the AHP hierarchy;
- (3)
- Building a pairwise comparison matrix
- (4)
- Defining the weight of factors.
- (5)
- Checking Consistency Index.
- (6)
- Obtaining the overall rating and making decision
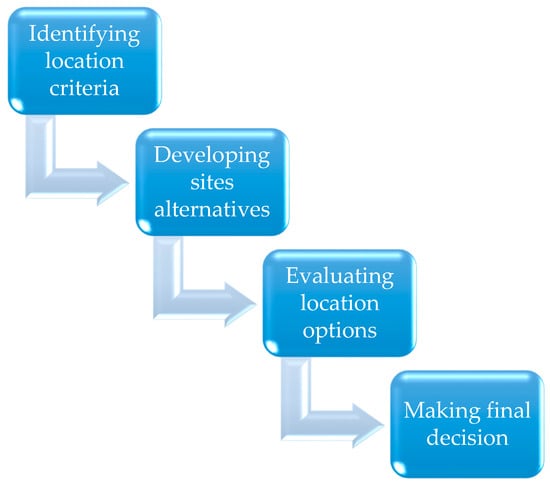
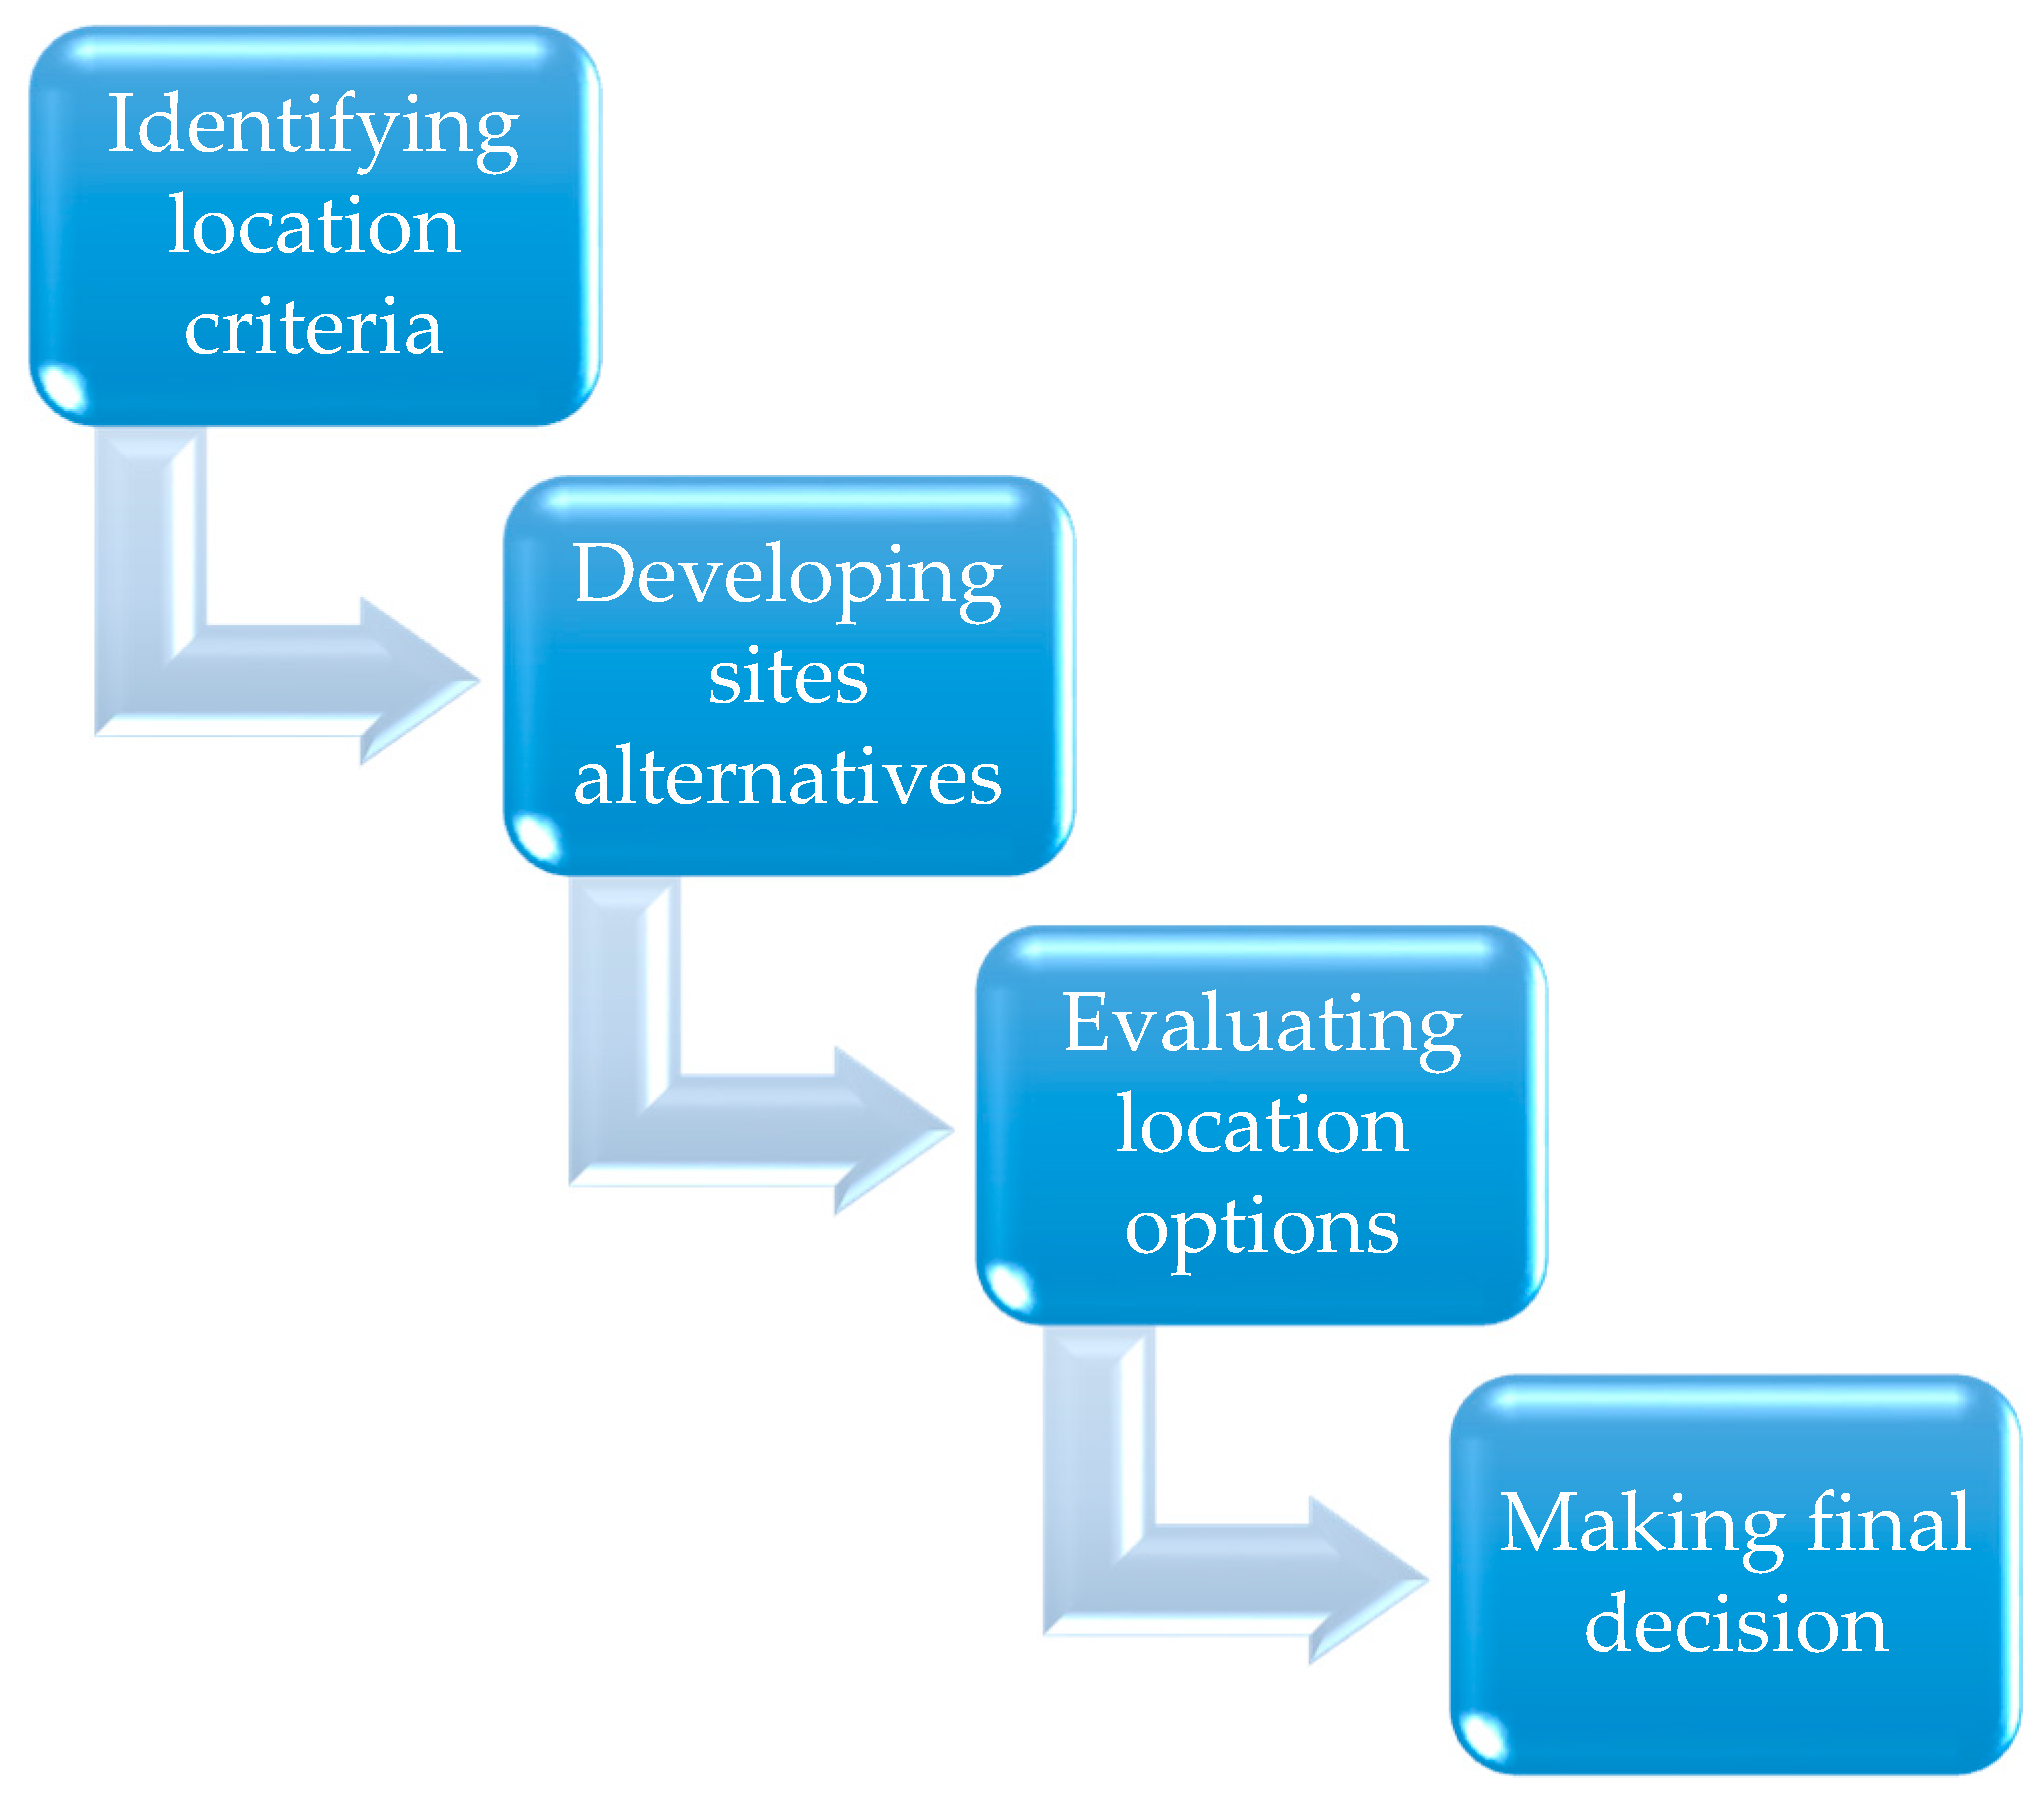
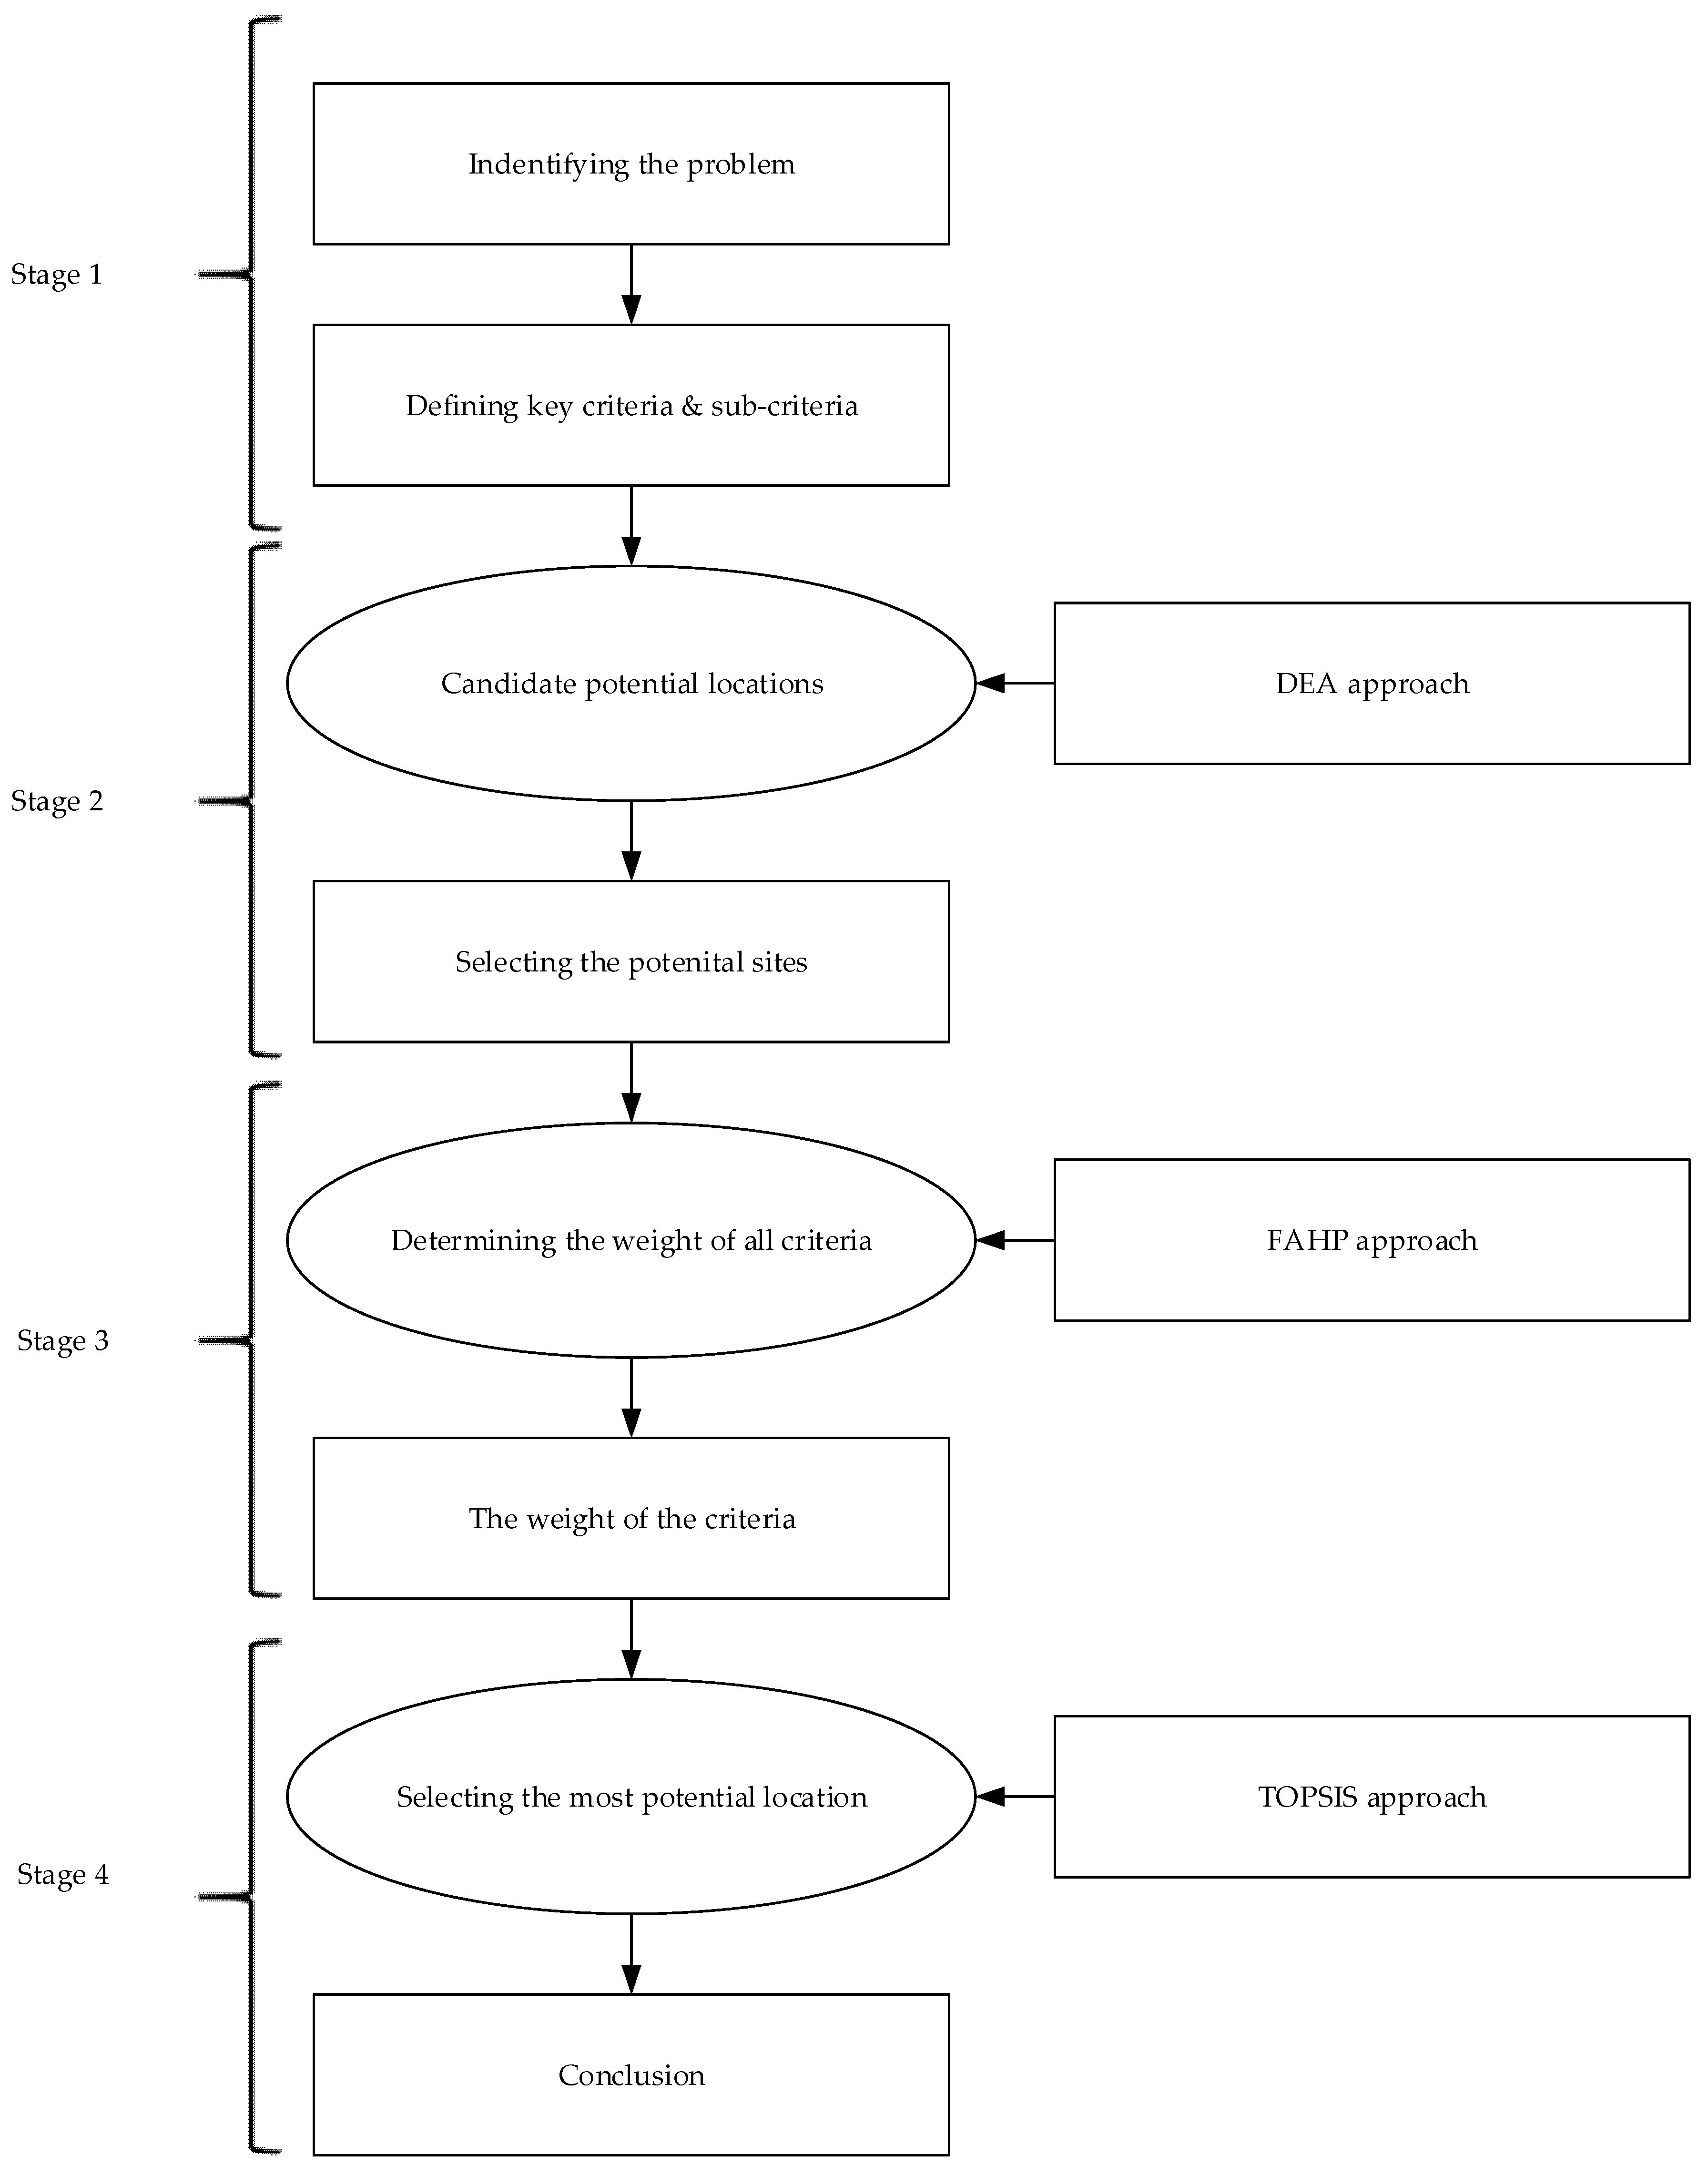
The AHP model has many advantages, however, the AHP model cannot accommodate uncertainty and inaccuracies between the perceptions and judgment of the decision makers. Thus, the AHP model with fuzzy logic is proposed to address this problem. In the FAHP model, decision makers can approximate input data by using fuzzy numbers. As with capacity planning, decision makers need to follow a four step procedure when making location selection. These steps are as shown in the following Figure 2 [10,11]:
Figure 2.
General methodology of location selection problem.
Stage 1. Identifying location criteria. In this stage, all criteria that affect a business will be defined.
Stage 2. Developing site alternatives. Once decision makers know what criteria affect a business, they can identify location options that satisfy the selected criteria.
Stage 3. Evaluating location options. After a set of location options are defined, decision makers will evaluate and rank options by quantitative or qualitative methods.
Stage 4: Making final decisions. The best location with the highest ranking score will be selected.
Azadeh et al. [12] proposed a hybrid MCDM model including DEA, PCA and NT for selecting solar power plant sites. A. Azadeh et al. [13] also presented a hybrid ANN and fuzzy DEA approach to select solar power plant locations. Lee et al. [14] introduced a MCDM model to select PV solar plant locations. Ali et al. combined GIS and MCDM approaches to determine the best place for wind farm location [15].
Gao et al. [16] determined the best enterprise location by using AHP and DEA models. Yang and Kuo [17] proposed an analytic hierarchy process and data envelopment analysis model for location selection. Kabir and Hasin [18] proposed a hybrid fuzzy analytic hierarchy process (FAHP) and PROMEETHE for locating power substation sites. Lee, Kang and Liou [19] proposed a hybrid model including ISM, FANP and VIKOR to select the most suitable PV solar plant site. Suh and Brownson applied GISFS and AHP approaches to select PV solar plant locations [20].
Noorollahi et al. [21] used GIS and FAHP for land analyses in solar farm location. Gan et al. [22] analyzed economic feasibility for renewable energy projects by using integrated TFN-AHP-DEA approaches. Liu et al. proposed a hybrid MCDM model for evaluating the total factor energy efficiency by combining DEA and the Malmquist index in the thermal power industry [23].
Samanlioglu and Ayag˘ [24] used the FAHP and F-PROMETHEE II for solar power plant location selection. Nazari, Aslani and Ghasempour [25] proposed TOPSIS approaches for analysising of solar farm site selection options. Al Garni and Awasthi [26] selected the best location for utility scale solar PV projects by using GIS and an MCDM approach. Merrouni et al. [27] used GIS and the AHP to assess the capacity of Eastern Morocco to host large-scale PV farms. Lozano, García-Cascales and Lamata [28] proposed a comparative TOPSIS-ELECTRE TRI method for photovoltaic solar farm site selection. Beltran et al. [29] used ANP for selection of photovoltaic solar power project sites.
The remainder of the paper provides background materials to assist in developing the MCDM model. Then, a hybrid DEA-FAHP-TOPSIS approach is proposed to select the best location for construction of a solar power plant from among 46 potential locations in Viet Nam. Discussions and the main contributions of this research are presented at the end of this article.
2. Material and Methodology
2.1. Research Development
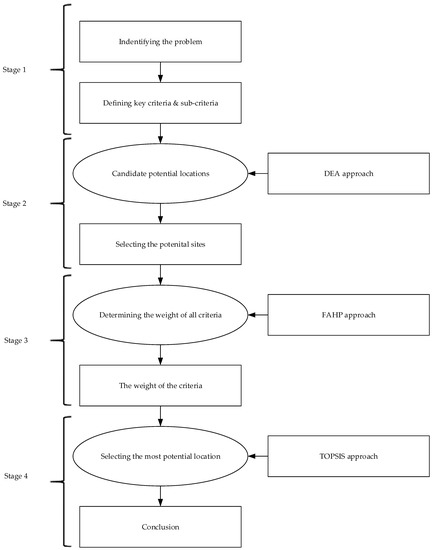
In this study, the authors present a MCDM model including DEA, Fuzzy AHP and TOPSIS to select the best location for building a solar power plant in Viet Nam. There are four steps in our research, as shown in Figure 2:
Step 1: Determining evaluate criteria. In this step, the criteria for selecting the best location will be defined. The key criteria and sub-criteria have built through expert interviews and the results from others’ research. All of the criteria are shown in Figure 3.
Figure 3.
Research methodologies.
Step 2: Employing the DEA model. There are 46 location options that can be highly effective for a solar power plant construction. In this step, several DEA methods including the CCR model, BCC model, and SBM model are applied to rank all options. The options that reach EFF = 1 in all models are potential locations and will be considered in the next step.
Step 3: Applying FAHP model. The FAHP model is the most effective tool for addressing complex problems of decision making with a connection to various qualitative criteria. The weight of criteria will be defined in this step.
Step 4: Implementing the TOPSIS model. The TOPSIS model is employed to rank potential locations. The optimal options have the shortest geometric distance from the positive ideal solution (PIS) and the longest geometric distance from the negative ideal solution (NIS). The best potential site will be presented in this stage.
2.2. Methodology
2.2.1. Data Envelopment Analysis Model
(1) Charnes-Cooper-Rhodes model (CCR model)
The basis DEA model is CCR model [30], CCR model is defined as follows:
Constraints mean that the ratio of virtual output to virtual input cannot exceed 1 per DMU. The goal is obtain a rate of weighted output for weighted inputs. Due to constraints, the optimal goal value ξ* is at most 1.
DMU0 is CCR efficient if and the result must have at least 1 optima a* > 0 and c* > 0. In addition, the fractional program can be described as a linear program (LP) as follows [31]:
The fractional program (1) is equal to the linear program (2) [32]. The Farrell model of linear program (2) with variable ξ and a nonnegative vector as [31]:
The model (3) has a feasible solution, ξ optimal value when is not greater than 1. The optimal solution, provides an effective point for a specific DMU. The process will be repeated for each DMUe, e = 1, 2,…, n. DMUs are inefficient when < 1, while DMUs are boundary points if . We can avoid weakly efficient frontier points by invoking a linear program as follows [31]:
In this case, we note that the choices of and do not affect the optimal .
DMU0 achieves 100% efficiency if and only if both (1) ξ and (2) = The performance of DMU0 is weakly efficient if and only if both (1) and (2) and for i or r in optimal options. Thus, the preceding development amounts to solving the problem as follows [31]:
In this case, and variables will be used to convert the inequalities into equivalent equations. This is similar to solving (3) by minimizing in first stage and then fixing 𝜉 as in (4), where the slacks variables achieve a maximum value but do not affect to previously determined value of . The objective will be converted from max to min, as in (1), to obtain [31]:
If the ε > 0 and the non-Archimedean element is defined, the input models are similar to model (2) and (5) as follows [31]:
and:
The CCR input-oriented (CCR-I) has the dual multiplier model of is expressed as [31]:
The CCR output-oriented (CCR-O) has the dual multiplier model of is expressed as [31]:
(2) Banker Charnes Cooper model (BCC Model)
Banker et al. introduced input-oriented BBC model (BCC-I) [30], which is able to assess the efficiency of DMU0 by solving the following linear program (11) [31]:
We can avoid the weakly efficient frontier points by invoking a linear program as follows [31]:
Therefore, this is the first multiplier form to the solve problem as follows [31]:
The linear program (12) gives us the second multiplier form, which is expressed as [31]:
In this case v and u, which are mentioned in the Formula (14), are vectors, and the scalar may be positive or negative or zero. Thus, the equivalent BCC fractional program is got from the dual program (14) as [31]:
The DMU0 can be called BCC efficient if an optimal solution claimed in this two phase processes for model (9) satisfies and has no slack = 0. On the other hand, it is BCC inefficient.
The improved activity also can be illustrated as BCC efficient [31]. A DMU, which has a minimum input value for any input item, or a maximum output value for any output item, is BCC-efficient.
The output-oriented BCC model (BCC-O) is:
From the linear program (16), we have the associate multiplier form, which is expressed as [31]:
In the envelopment model, the v0 is the scalar combined with . In conclusion, the authors achieve the equivalent (BCC) fractional programming formulation for model (17) [31]:
(3) Slacks Based Measure model (SBM Model)
The SBM model is developed by Tone [33,34]. It has three elements, i.e., input-oriented, output-oriented, and non-oriented.
Input-Oriented SBM (SBM-I-C)
Input-oriented SBM under constant-returns-to-scale-assumption [31]:
is called the SBM input efficiency.
Output-Oriented SBM (SBM-O-C)
The output-oriented SBM efficiency of DMUz = (xz, yz) is defined by [SBM-O-C] [32]:
2.2.2. Fuzzy Analytic Hierarchy Process (FAHP)
(1) Fuzzy sets and fuzzy number
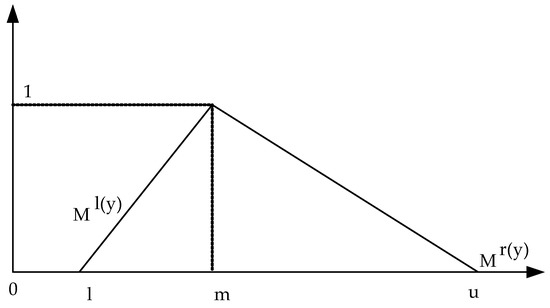
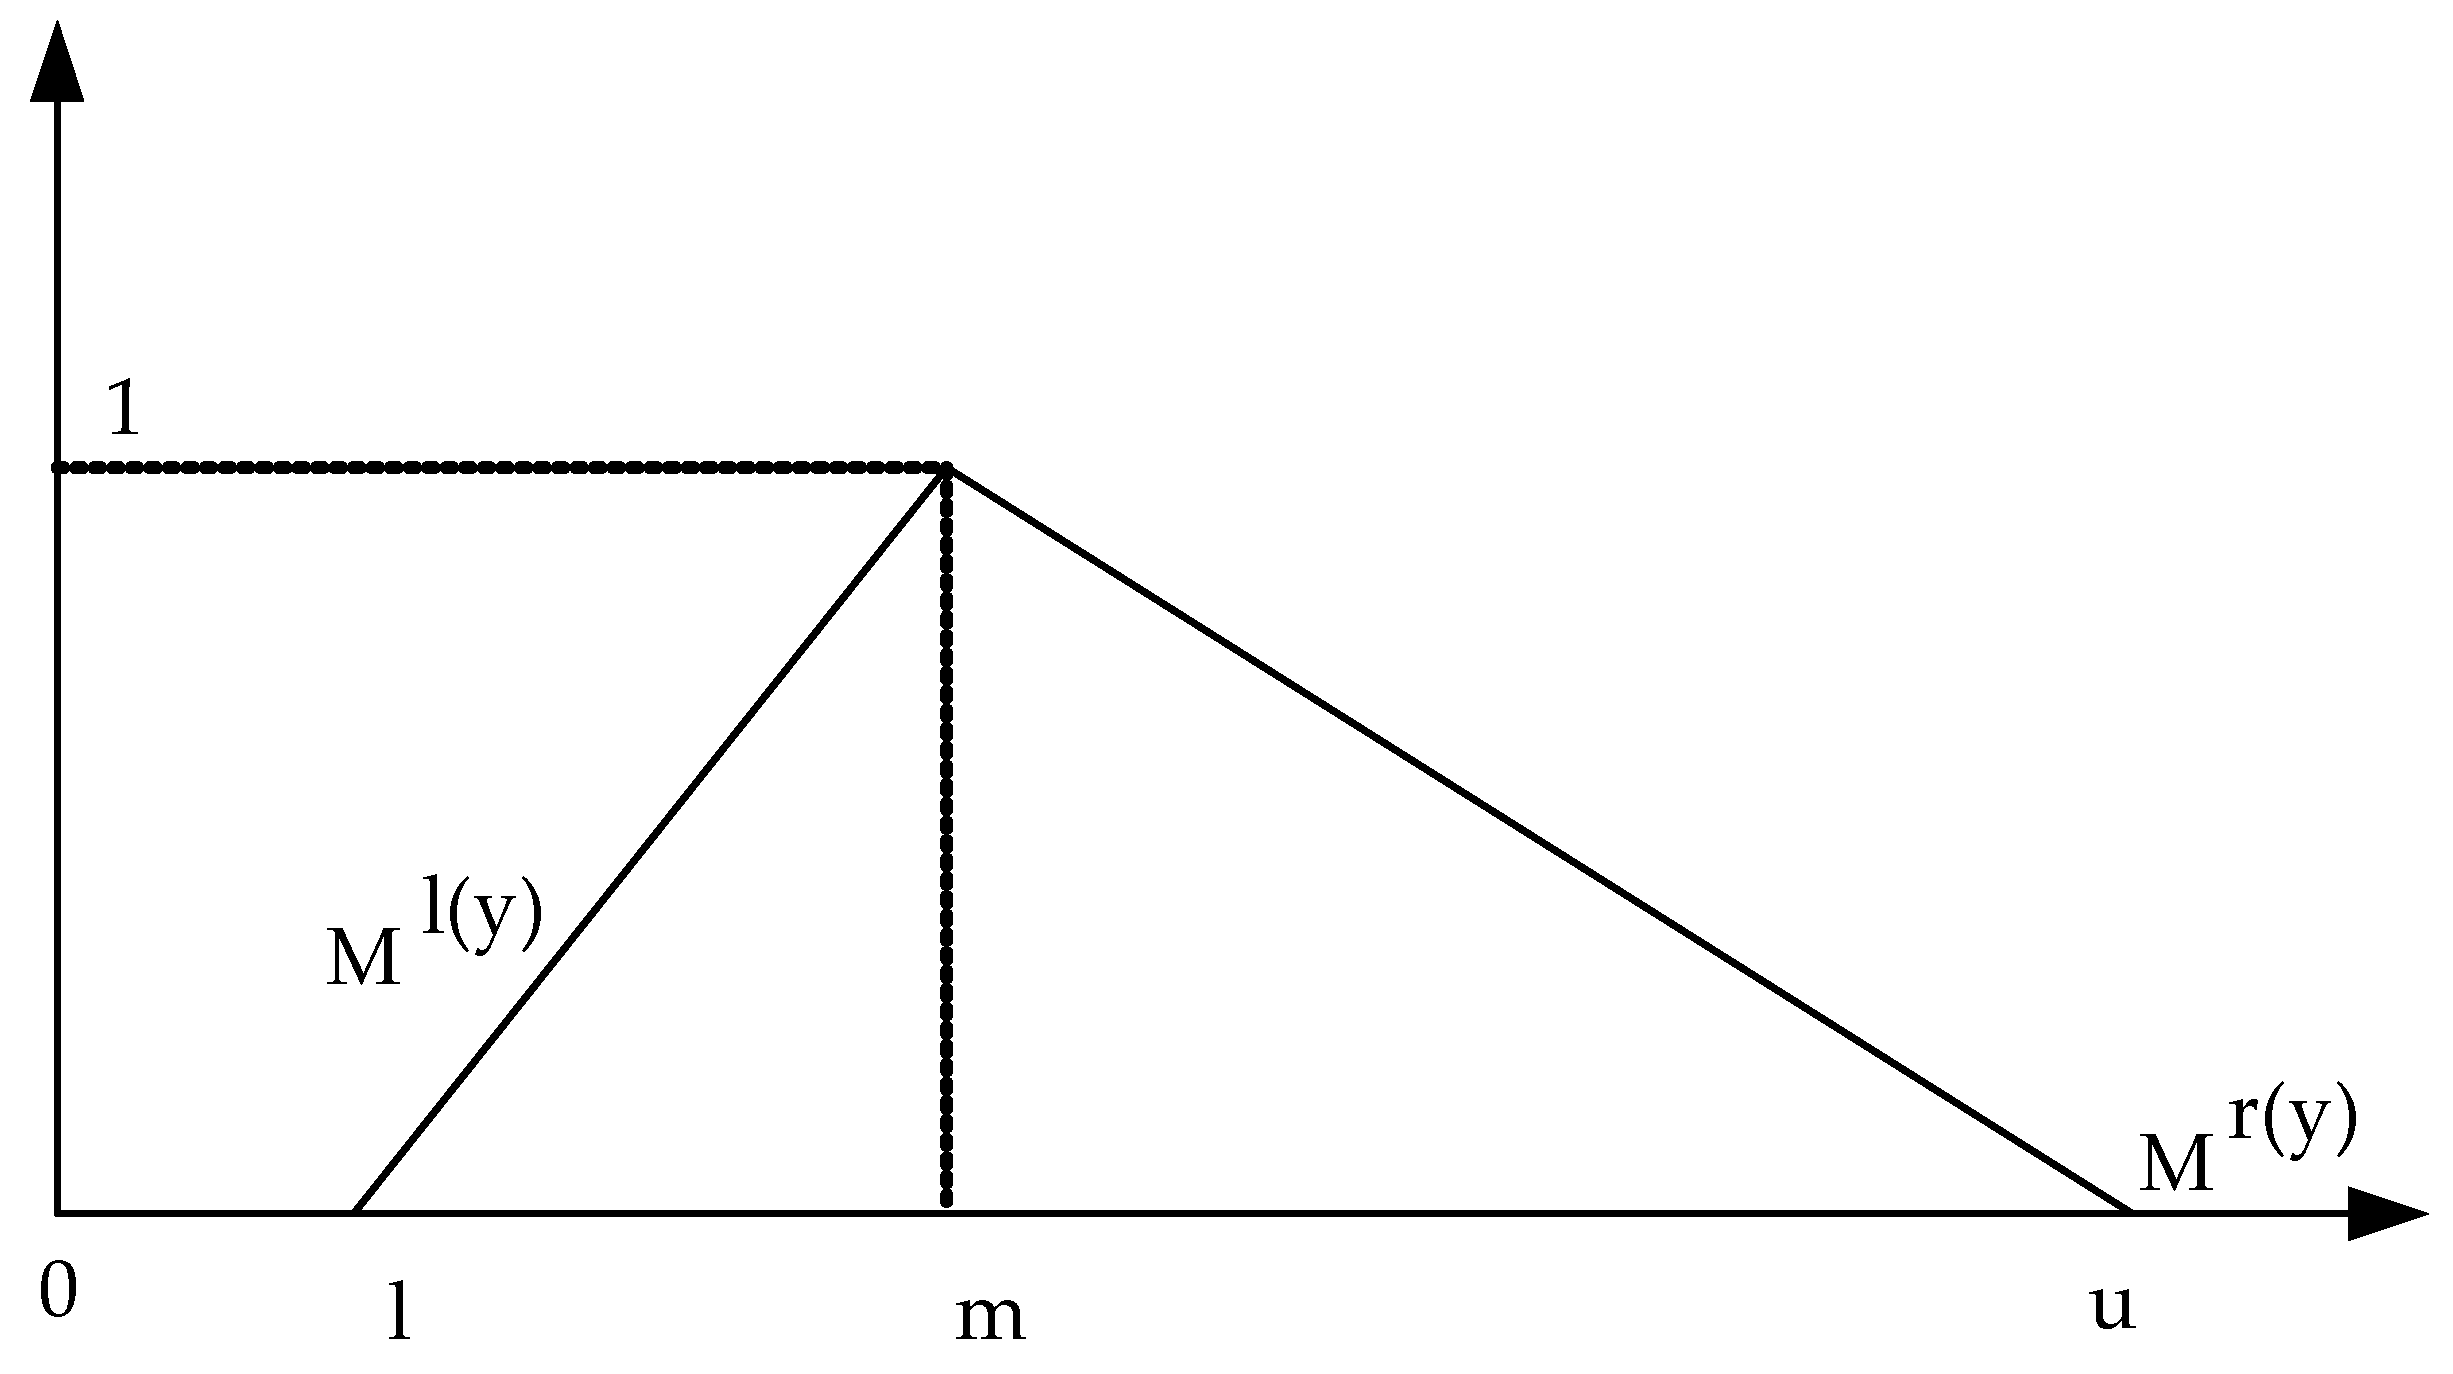
Fuzzy sets were proposed by Zadeh in 1965 [35] for solving problems existing in uncertain environments. A fuzzy set is a function that shows a degree of dependence of one fuzzy number on a set number, where each value of the membership function is between [0, 1] [36,37]. The triangular fuzzy number (TFN) can be defined as (l, m, u). The parameters l, m and u (l ≤ m ≤ u), indicate the smallest, the promising and the largest value. A triangular fuzzy number are shown in Figure 4.
Figure 4.
Triangular Fuzzy Number.
TFN can be defined as:
A fuzzy number is given by the representatives of each level of membership are the following:
l(y), r(y) indicates both the left side and the right side of a NF. Two positive triangular fuzzy numbers (l1, m1, u1) and (l1, m2, u2) are introduced as below:
(2) Analytical hierarchy process (AHP)
The AHP method uses a pairwise comparisons maxtrix for determing priorities on each level of the hierarchy that are quantified using a 1–9 scale are shown in Table 1.
Table 1.
1–9 Saaty Scale.
(3) Fuzzy AHP
In this section, the weight of criteria are dedined by fuzzy AHP. There are eight steps in this process, as follows:
Step 1: Calculation of TFNs
A pairwise comparison of the criteria will be performed. Instead of a numerical value, the fuzzy analytical hierarchy process is a range of values that are combined for evaluating criteria in this step [38]. This scale is applied in Parkash’s [39] fuzzy prioritization method. The fuzzy conversion scales are shown in Table 2.
Table 2.
The fuzzy conversion scale.
Step 2: Calculation of
A pairwise comparison and relative scores as (24):
Step 3: Calculation of
The geometric fuzzy mean was established by (28):
Step 4: Calculation of
The fuzzy geometric mean was determined as:
Step 5: Calculation of
The criteria depending on cut values are defined for the calculated β. The fuzzy priorities will apply for lower and upper bounds for each value:
Step 6: Calculation of Wal, Wau
Values of Wal, Wau are calculated by combining the lower and the upper values, and dividing them by the total β values:
Step 7: Calculation of Xad
Combining the upper and the lower bounds values by using the optimism index () to order to defuzzify:
Step 8: Calculation of Waz
The defuzzification values priorities are normalization by:
2.2.3. Technique for Order Preference by Similarity to Ideal Solution (TOPSIS)
Hwang and Yoon [40] is presented the TOPSIS approach in 1981. The main concept of TOPSIS is that the best options should have the shortest geometric distance from the positive ideal solution (PIS) and the longest geometric distance from the negative ideal solution (NIS) [41]. There are m alternatives and n criteria and the result of TOPSIS model shows the score of each option [42]. The method is illustrated below:
Step 1: Determine the normalized decision matrix, raw values (xij) are converted to normalized values (nij) by:
Step 2: Calculate the weight normalized value (vij), by:
where Pj is the weight of the criterion and .
Step 3: Calculate the PIS () and PIS (), where indicate the maximum values of and indicates the minimum value :
where A is related with profit criteria, and B is related with cost criteria.
Step 4: Determine a distance of the PIS separately by:
Similarly, the separation from the NIS is given as:
Step 5: Determine the relationship proximal to the problem solving approaches, proximal relationship from option to option :
Step 6: Rank alternatives to determine the best option with the maximum value of
3. Case Study
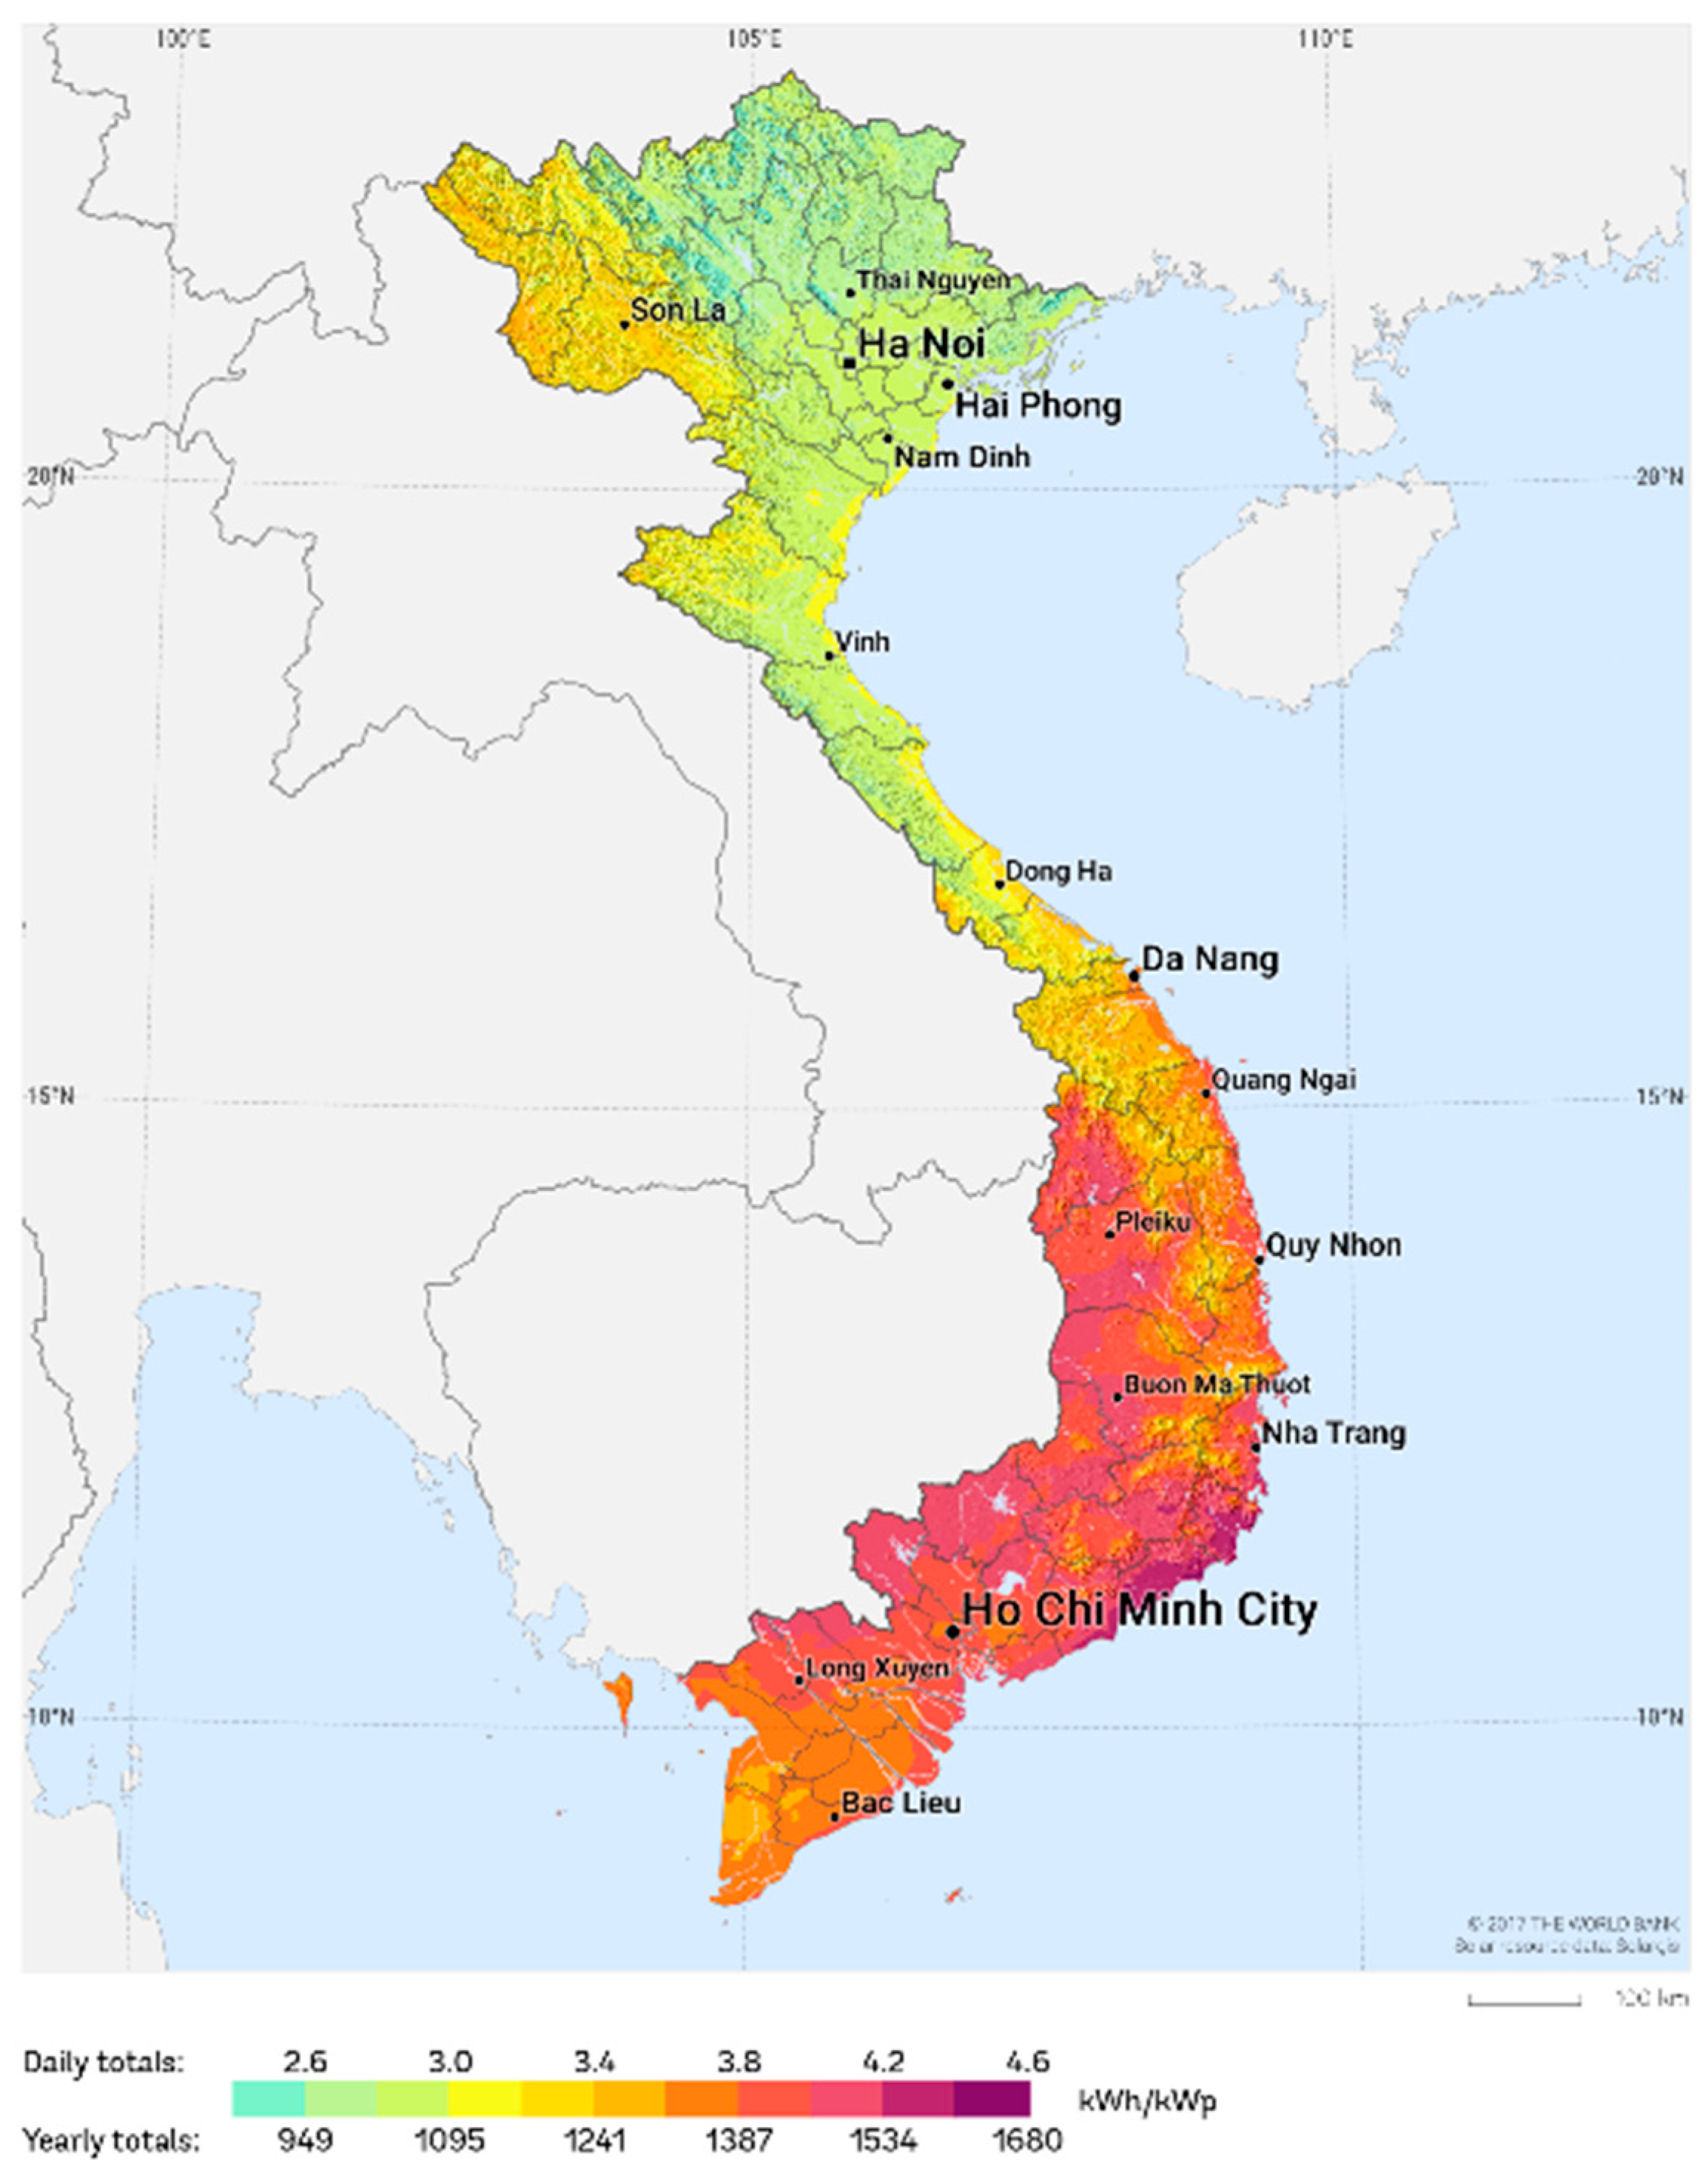
According to the research results of many scientists, Viet Nam is the best place with natural conditions and favorable terrain to develop renewable energy. Viet Nam is located in the tropical monsoon region, the average number of sunshine hours in the year ranges from 2500 to 3000 h and the average temperature of over 21 °C. In addition, Viet Nam has abundant solar radiation sources. Viet Nam’s solar map is shown in Figure 5.
Figure 5.
Viet Nam’s solar resources map. (Source: The World Bank).
The authors collected data from 46 potential sites, which are able to invest in solar power plants as shown in Table 3.
Table 3.
List of the 46 locations identified in Viet Nam.
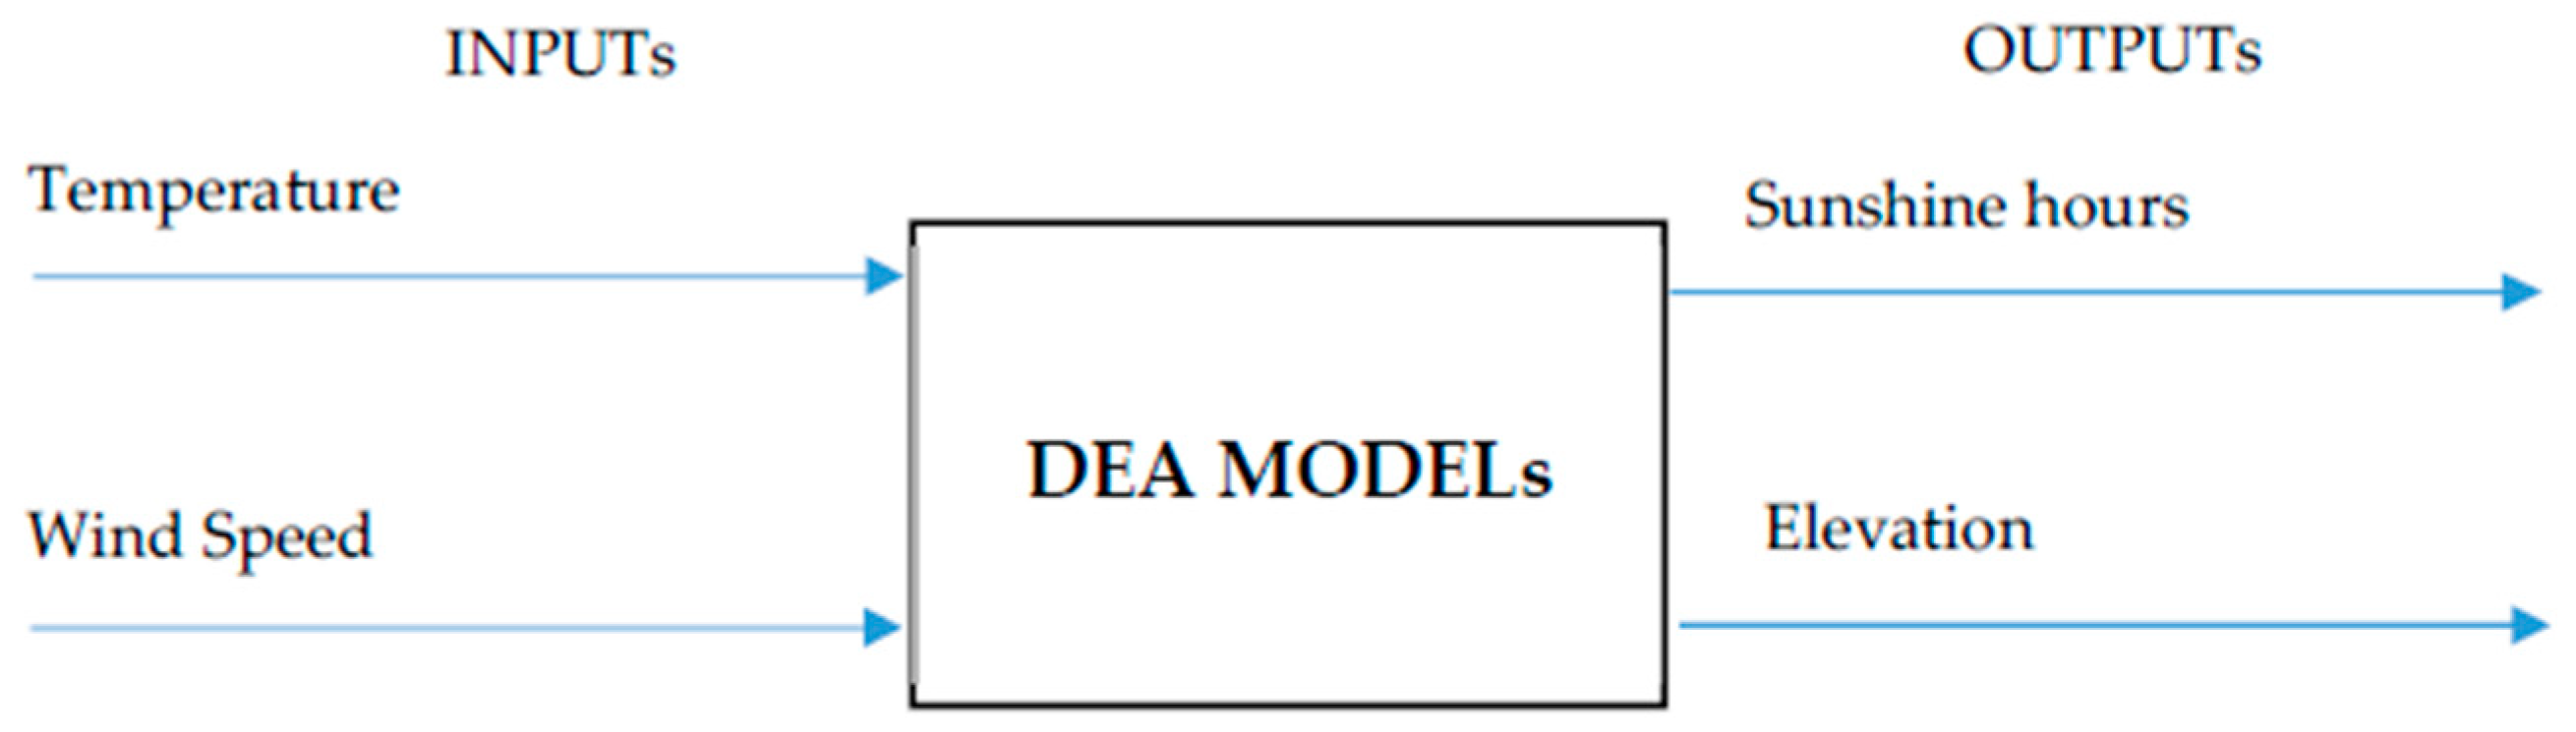
DEA is a mathematical programming technique that determines the relative effectiveness of multiple input and output decision makers (DMUs) [43]. There are two inputs, two outputs in including Temperature, Wind Speed, Sunshine hours, Elevation [14]. Inputs and Outputs of DMUs are shown in Figure 6.
Figure 6.
Inputs and Output of DEA Models.
Some additional data about the 46 locations are shown in Table 4.
Table 4.
Data set of the 46 DMUs.
For selecting the best potential location, several DEA models including CCR-I; CCR-O; BCC-I; BCC-O and SBM-I-C are applied in this step. The results of the DEA models are shown in Table 5.
Table 5.
The results of the DEA models.
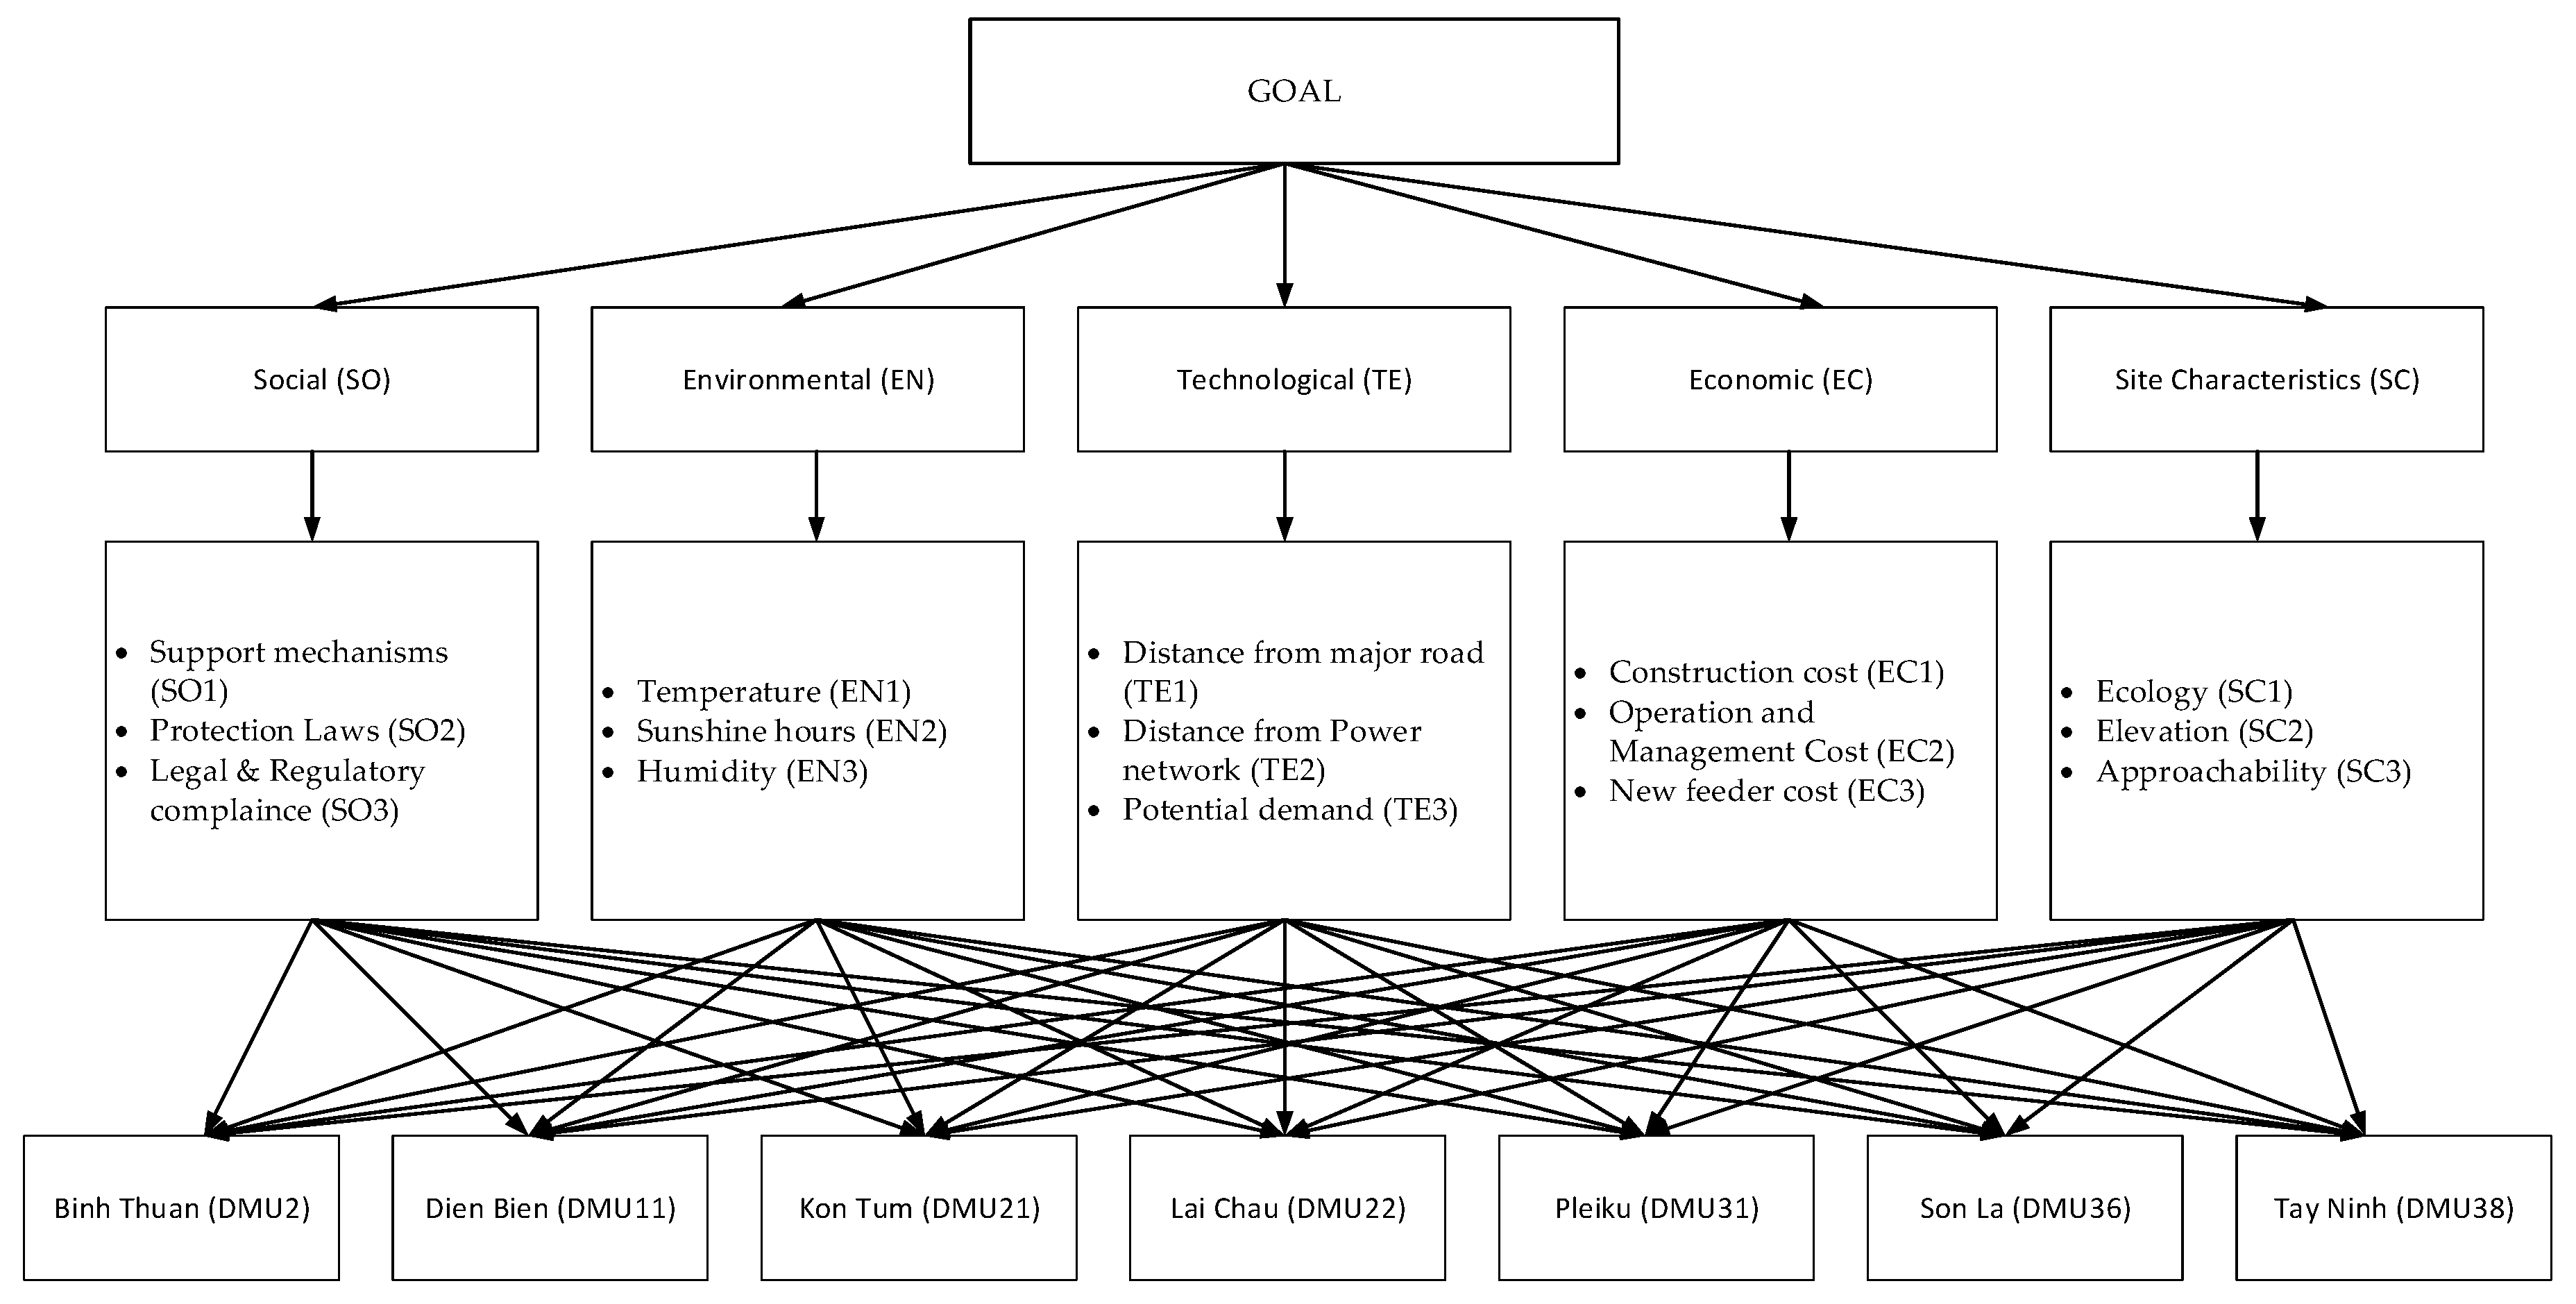
As the results in Table 5 show, there are seven DMUs that are potential locations, including DMU 2, DMU 11, DMU 21, DMU 22, DMU 31, DMU 36 and DMU 38. These DMUs will be evaluated in next step of this research. The FAHP model is applied in this stage. The weight of criteria are defined by the comparison matrix. Criteria structures are built based on qualitative and quantitative factors. The Hierarchical structures for the FAHP approach are shown in Figure 7.
Figure 7.
The Hierarchical structures for the FAHP approach.
A fuzzy comparison matrix for all criteria are shown in Table 6, Table 7, Table 8, Table 9, Table 10, Table 11, Table 12, Table 13, Table 14, Table 15, Table 16, Table 17, Table 18, Table 19, Table 20, Table 21, Table 22, Table 23, Table 24 and Table 25:
Table 6.
Fuzzy comparison matrix for criteria.
Table 7.
Real number priority.
Table 8.
Fuzzy comparison matrices for criteria.
Table 9.
Comparison matrix for environmental criteria.
Table 10.
Comparison matrix for site characteristics criteria.
Table 11.
Comparison matrix for social criteria.
Table 12.
Comparison matrix for economic criteria.
Table 13.
Comparison matrix for technological criteria.
Table 14.
Comparison matrix for TE1 based on the alternatives.
Table 15.
Comparison matrix for TE2 based on the alternatives.
Table 16.
Comparison matrix for TE3 based on the alternatives.
Table 17.
Comparison matrix for SC1 based on the alternatives.
Table 18.
Comparison matrix for SC2 based on the alternatives.
Table 19.
Comparison matrix for SC3 based on the alternatives.
Table 20.
Comparison matrix for SO1 based on the alternatives.
Table 21.
Comparison matrix for SO2 based on the alternatives.
Table 22.
Comparison matrix for SO3 based on the alternatives.
Table 23.
Comparison matrix for EN1 based on the alternatives.
Table 24.
Comparison matrix for EN2 based on the alternatives.
Table 25.
Comparison matrix for EN3 based on the alternatives.
To convert the fuzzy numbers to real numbers we proceed to solve the fuzzy clusters using the triangular fuzzy method. During the defuzzification we obtain the coefficients α = 0.5 and β = 0.5 (Tang and Beynon) [44]. In it, α represents the uncertain environment, β represents the attitude of the evaluator is fair:
The remaining calculations are similar to the above, as well as the fuzzy number priority points. The real number priorities when comparing the main criteria pairs are presented in Table 7.
To calculate the maximum individual values as follows:
GM1 = (1 × 1/3 × 2 × 2 × 1/2)1/5 = 0.92
GM2 = (3 × 1 × 3 × 2 × 1)1/5 = 1.78
GM3 = (1/2 × 1/3 × 1 × 3 × 1)1/5 = 0.87
GM4 = (1/2 × 1/2 × 1/3 × 1 × 1/2)1/5 = 0.53
GM5 = (2 × 1 × 1 × 2 × 1)1/5 = 1.32
∑GM = GM1 + GM2 + GM3 + GM4 + GM5 = 5.42
With the number of criteria is 5, we get n = 5, λmax and CI are calculated as follows:
For CR, with n = 5 we get RI = 1.12:
We have CR = 0.09598 ≤ 0.1, so the pairwise comparison data is consistent and does not need to be re-evaluated. The results of the pair comparison between the main criteria are presented in Table 8.
The comparison matrix of sub-criteria based on the alternatives is shown below:
The final weight of the criteria are shown in Table 26.
Table 26.
The weight of criteria.
The weights of alternative locations with respect to all sub criteria and the Normalized Decision Matrix of sub criteria are shown in Table 27, Table 28 and Table 29.
Table 27.
The weights of alternative locations with respect to sub criteria.
Table 28.
Normalized Decision Matrix.
Table 29.
The weighted Normalized Decision Matrix.
In the final stage, all the potential locations will be ranked by the TOPSIS model. The weight of sub-criteria can be used from the result of the fuzzy AHP approach. The normalized weight matrix values are shown in Table 30.
Table 30.
Normalized Weight Matrix.
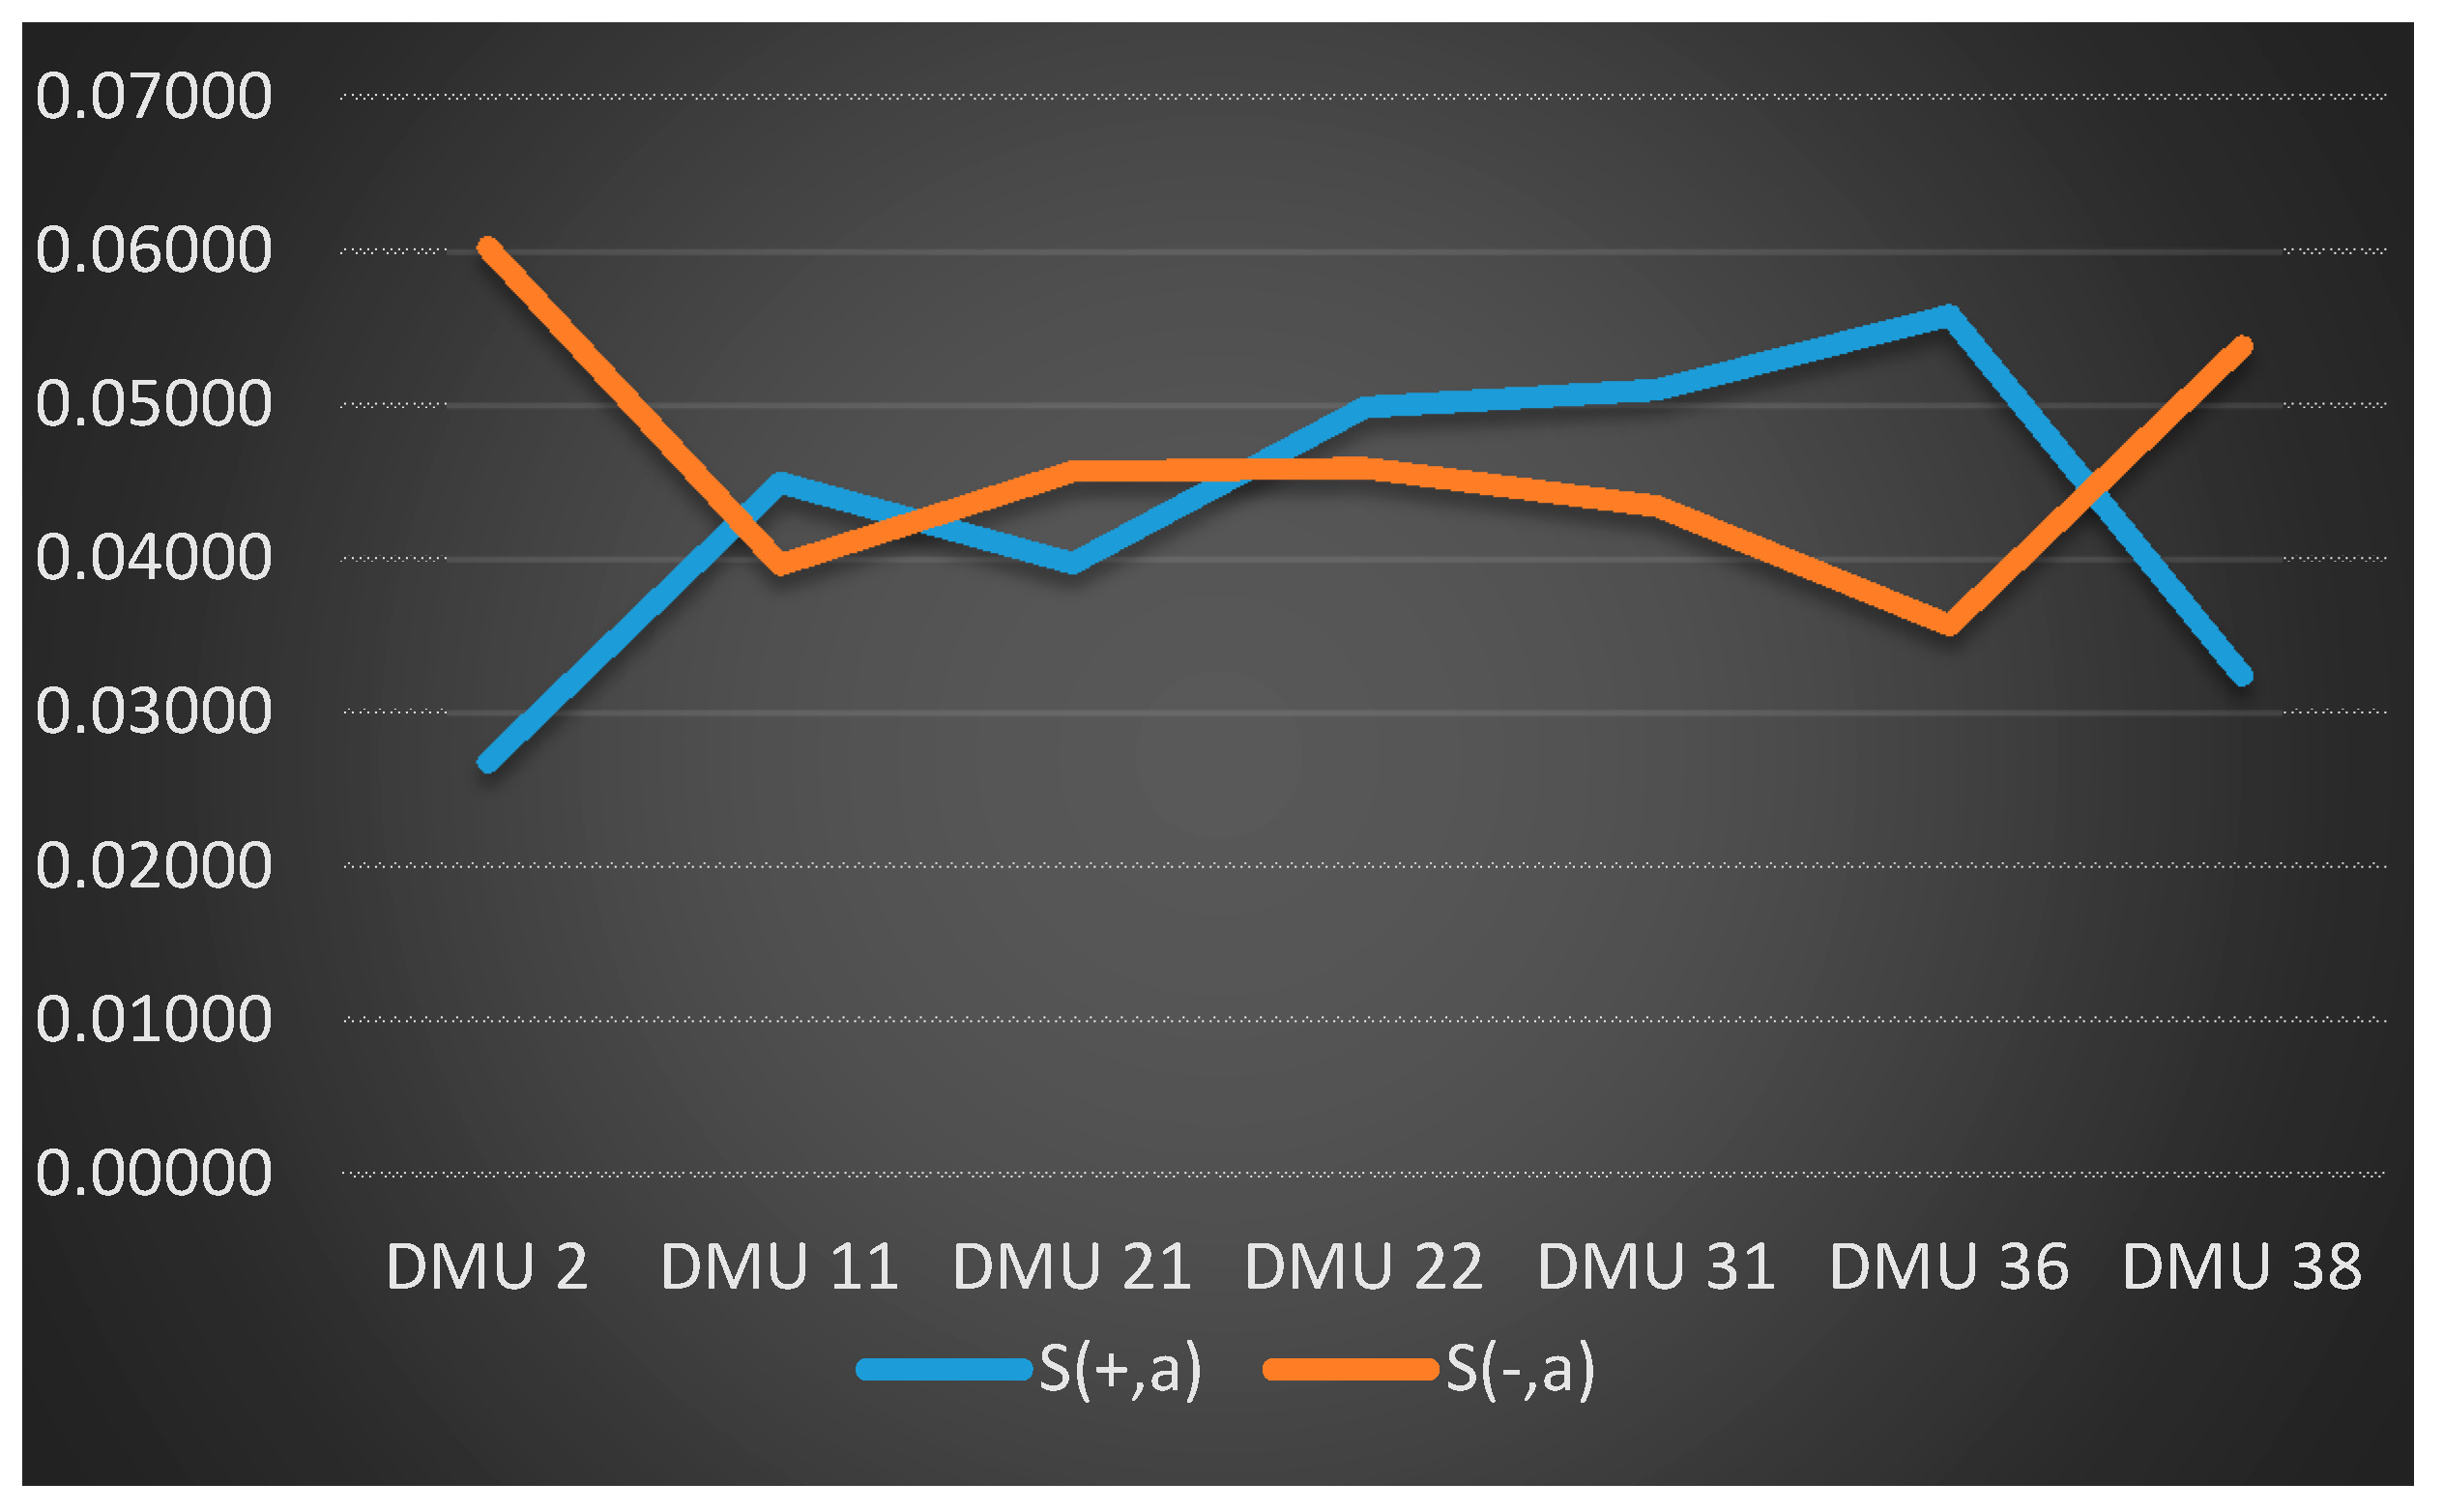
In Figure 8, DMU 2 has shortest geometric distance from the PIS and the longest geometric distance from the NIS.
Figure 8.
Geometric distance from PIS and NIS.
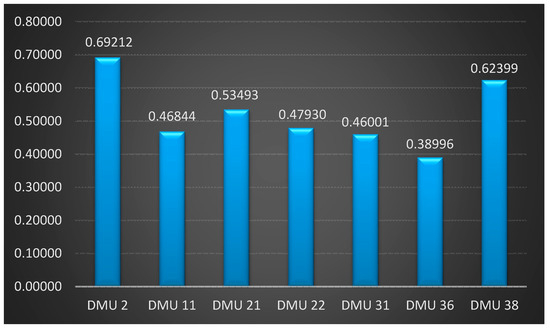
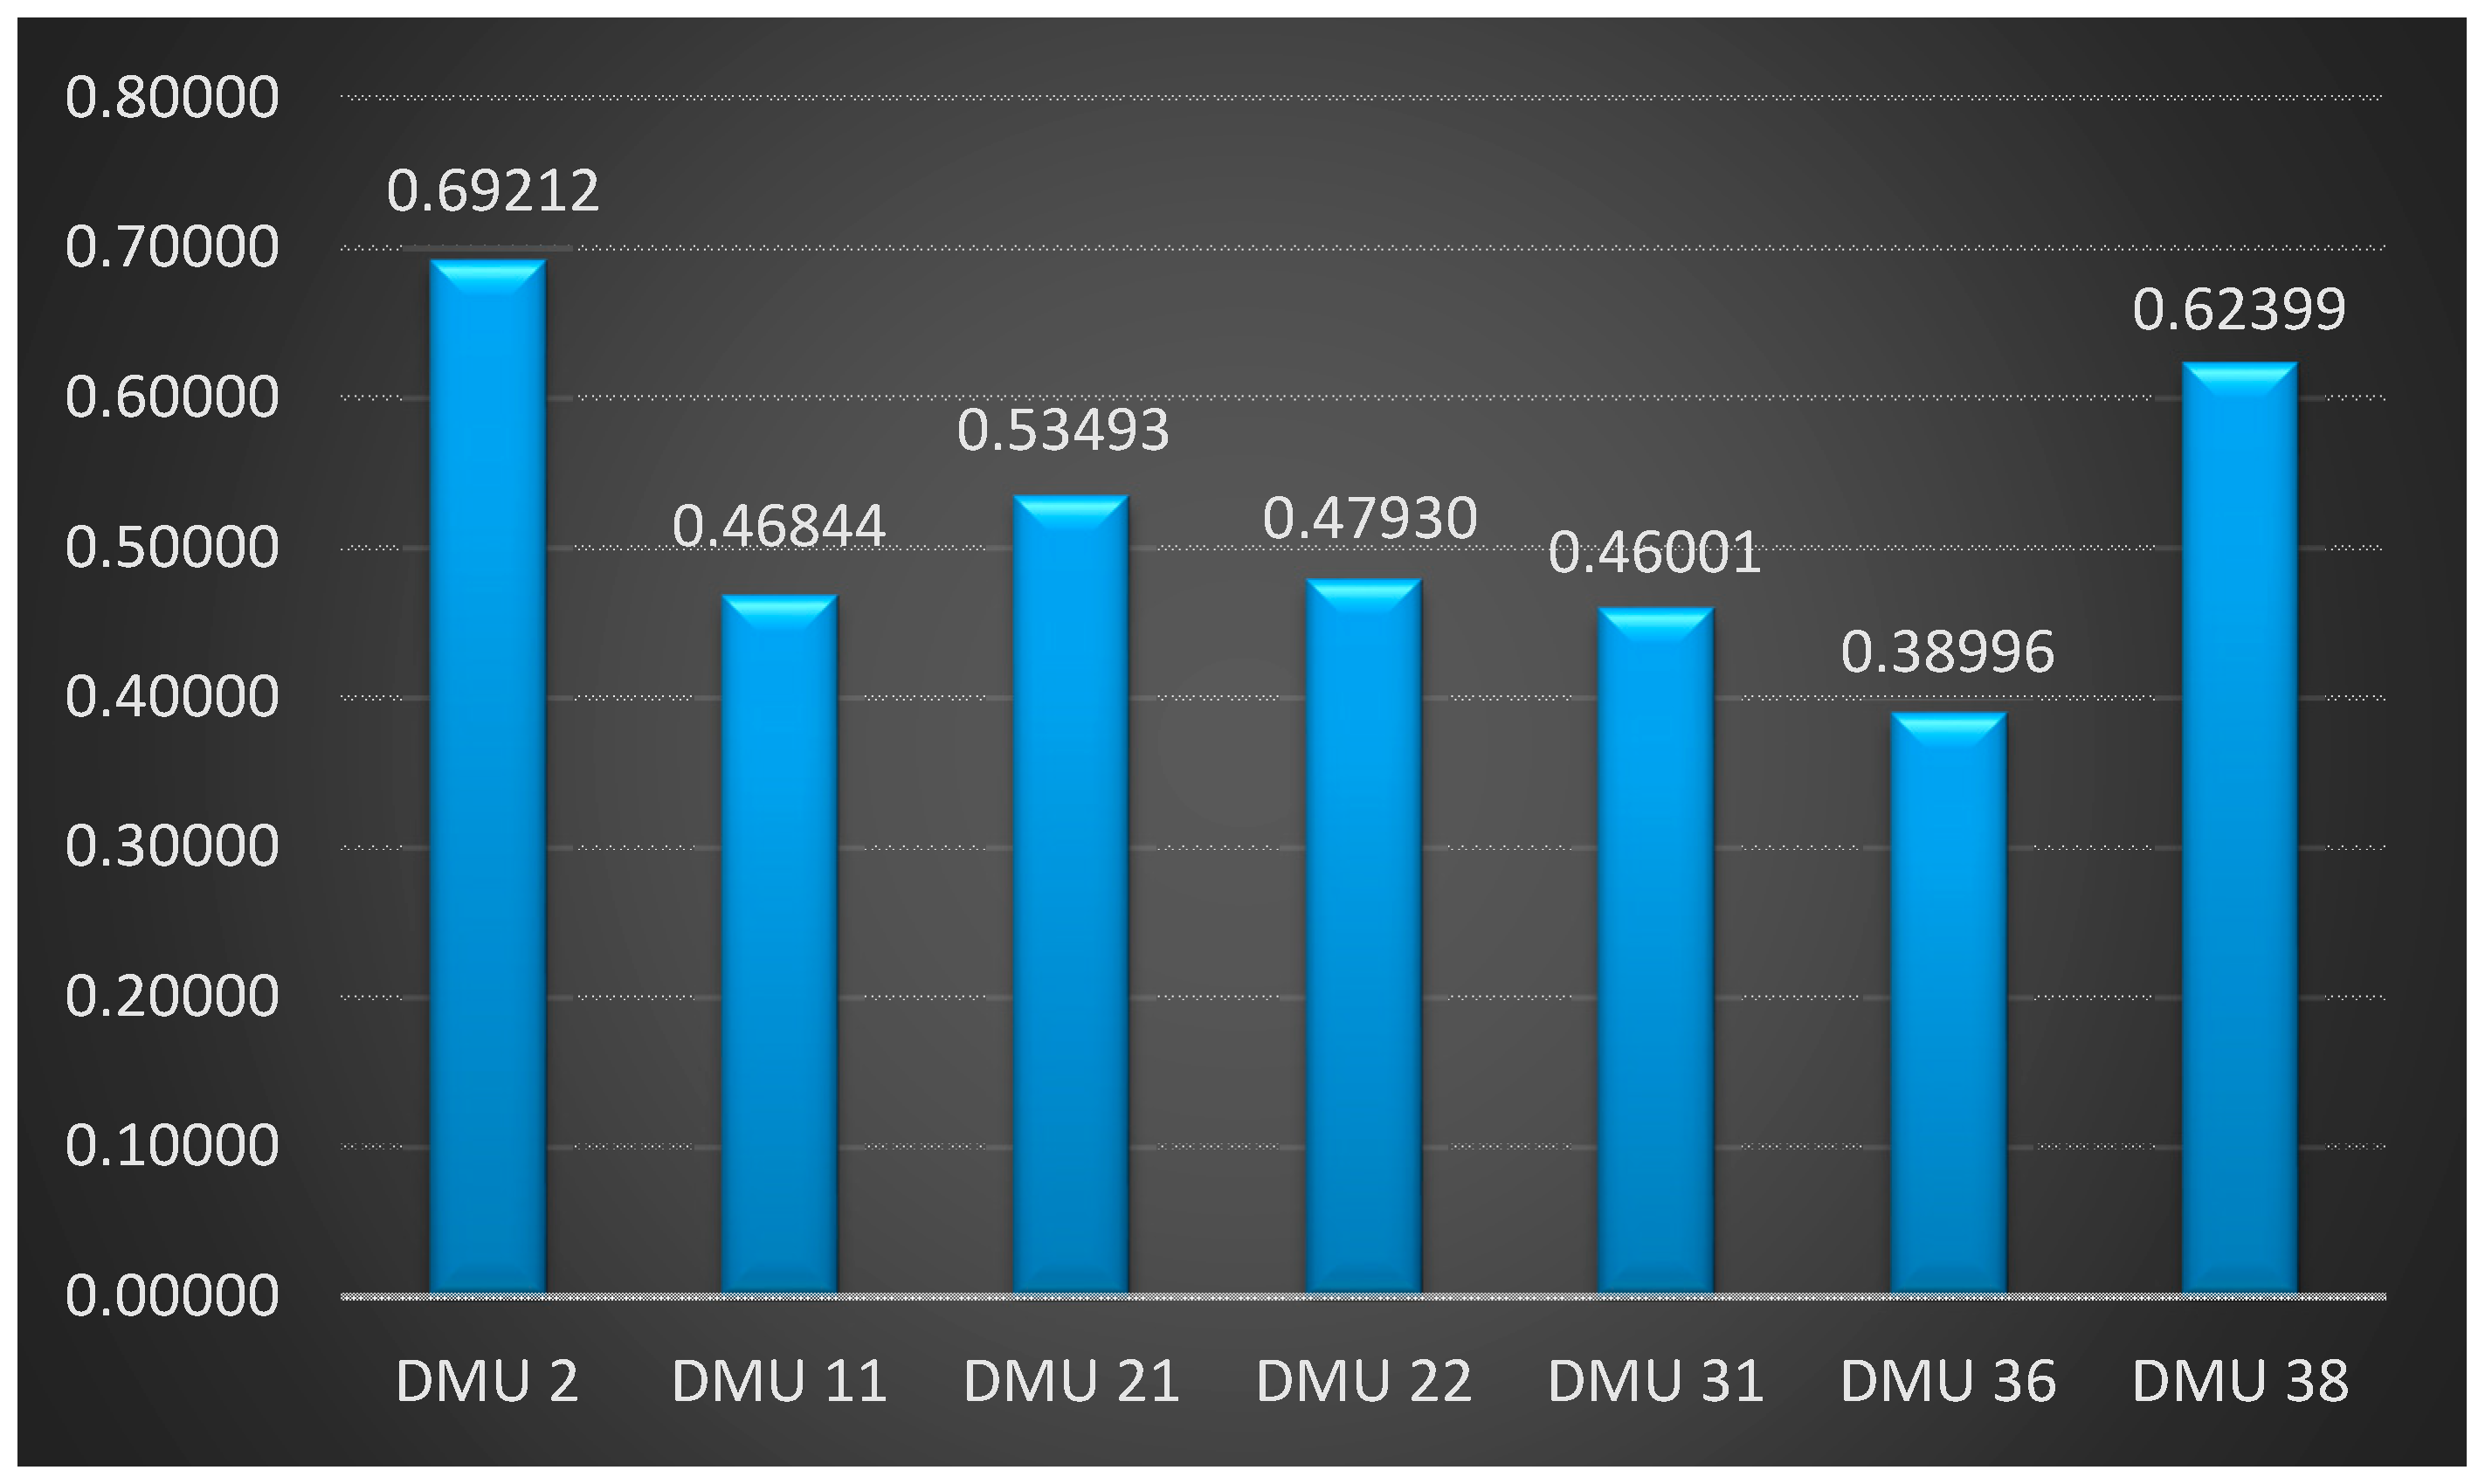
The results of TOPSIS model are shown in Figure 9, based on the final performance score , the final location ranking list are DMU 2, DMU 38, DMU 21, DMU 22, DMU 11, DMU 31 and DMU 36. The results show that DMU 2 (Binh Thuan) is the most optimal location for building a solar plant in Viet Nam.
Figure 9.
The result from TOPSIS model.
4. Conclusions
Studies applying the MCDM approach to various fields of science and engineering have been increasing in number over the past years. One of the fields where the MCDM model has been employed ii in location selection problems. Especially in the renewable energy sector, decision makers have to evaluate both qualitative and quantitative factors. Although some studies have reviewed applications of MCDM approaches in solar power plant location selection, very few works has focused on this problem in a fuzzy environment. This is a reason why in this work MCDM model including AHP with fuzzy logic, DEA and TOPSIS is proposed for solar power plant location selection in Viet Nam. The goal of this study was to design a MCDM approach for building solar power plants based on natural and social factors. In the first step of the research, proper areas are defined by using several DEA models, then a fuzzy analytical hierarchy process is proposed for evaluating the weight of criteria. The FAHP can be applied for ranking alternatives but the number of sites selected is practically limited because of the number of pairwise comparisons that need to be made, and a disadvantage of the FAHP approach is that the input data, expressed in linguistic terms, depend on the experience of decision makers and thus involves subjectivity. This is a reason why we proposed the TOPSIS model for ranking alternatives in the final stage. Also, TOPSIS is presented to reaffirm it as a systematic method and solve the disadvantages of the FAHP model as mentioned above. As a results, the site with the best potential DMU 2 (Binh Thuan) because it has the highest ranking score in the final stage.
The contribution of this study is the presentation of a multi-criteria decision making model (MCDM) for solar plant site selection in Viet Nam under fuzzy environment conditions. This paper also represents the evolution of a new approach that is flexible and practical for the decision maker. This research also provides a useful guideline for solar power plant location selection in other countries as well as a guideline for location selection in other industries.
In future research, this MCDM model also can be applied to many different countries. In addition, different methods, such as FANP or PROMETHEE, etc., could also be combined for different scenarios.
Author Contributions
In this research, C.N.-W. built the research ideas, designed the theoretical verifications, and reviewed manuscript. V.T.N. contributed the research ideas, designed the frameworks, collected data, analyzed the data, summarized and wrote the manuscript. H.T.N.T. collected data, write a manuscript, D.H.D. collected data, wrote and format manuscript.
Conflicts of Interest
The authors declare no conflict of interest.
References
- United Nations. Adoption of the Paris Agreement. In Proceedings of the Conference of the Parties, Paris, France, 30 November–11 December 2015. [Google Scholar]
- Tsoutsos, T.; Frantzeskaki, N.; Gekas, V. Environmental impacts from the solar energy technologies. Energy Policy 2005, 33, 289–296. [Google Scholar] [CrossRef] [Scilit]
- Candelise, C.; Winskel, M.; Gross, R.J. The dynamics of solar PV costs and prices as a challenge. Renew. Sustain. Energy Rev. 2013, 26, 96–107. [Google Scholar] [CrossRef] [Scilit]
- Honrubia-Escribano, A.; Javier Ramirez, F.; Gómez-Lázaro, E.; Garcia-Villaverde, P.M.; Ruiz-Ortega, M.J.; Parra-Requena, G. Influence of solar technology in the economic performance of PV power. Renew. Sustain. Energy Rev. 2018, 82, 488–501. [Google Scholar] [CrossRef] [Scilit]
- Alsema, E.A. Energy requirements and CO2 mitigation potential of PV systems. In Proceedings of the BNL/NREL Workshop, Colorado, CO, USA, 23–24 July 1998. [Google Scholar]
- Huang, J.P.; Poh, K.L.; Ang, B.W. Decision analysis in energy and environmental modeling. Energy 1995, 20, 843–855. [Google Scholar] [CrossRef] [Scilit]
- Løken, E. Use of multicriteria decision analysis methods for energy planning problems. Renew. Sustain. Energy Rev. 2007, 11, 1584–1595. [Google Scholar] [CrossRef] [Scilit]
- Belton, V.; Stewart, T. Multiple Criteria Decision Analysis: An Integrated Approach; Kluwer Acedemic: Norwell, MA, USA, 2002. [Google Scholar]
- Saaty, T.L. The Analytic Hierarchy Process: Planning, Priority Setting, Resources Allocation; McGraw-Hill: New York, NY, USA, 1980. [Google Scholar]
- Stevenson, W.J. Operations Management; McGraw-Hill: New York, NY, USA, 2002. [Google Scholar]
- Sanders, R.D.R.a.N.R. Operations Management, 4th ed.; Wiley: Hoboken, NJ, USA, 2009. [Google Scholar]
- Azadeh, A.; Ghaderi, S.; Maghsoudi, A. Location optimization of solar plants by an integrated hierarchical. Energy Policy 2008, 36, 3993–4004. [Google Scholar] [CrossRef] [Scilit]
- Azadeh, A.; Sheikhalishahi, M.; Asadzadeh, S. A flexible neural network-fuzzy data envelopment analysis approach for location optimization of solar plants with uncertainty and complexity. In Proceedings of the 2015 International Conference on Industrial Engineering and Operations Management, Dubai, UAE, 3–5 March 2015. [Google Scholar]
- Lee, A.H.I.; Kang, H.-Y.; Lin, C.-Y.; Shen, K.-C. An Integrated Decision-Making Model for the Location of a PV. Sustainability 2015, 7, 13522–13541. [Google Scholar] [CrossRef] [Scilit]
- Ali, S.; Lee, S.-M.; Jang, C.-M. Determination of the Most Optimal On-Shore Wind Farm Site Location Using a GIS-MCDM Methodology: Evaluating the Case of South Korea. Energies 2017, 10, 2072. [Google Scholar] [CrossRef] [Scilit]
- Gao, Z.; Yoshimoto, K.; Ohmori, S. Application of AHP/DEA to Facility Layout Selection. In Proceedings of the Third International Joint Conference on Computational Science and Optimization, Huangshan, China, 28–31 May 2010. [Google Scholar]
- Yang, T.; Kuo, C. A hierarchical AHP/DEA methodology for the facilities layout design problem. Eur. J. Oper. Res. 2003, 147, 128–136. [Google Scholar] [CrossRef] [Scilit]
- Kabir, G.; Hasin, M.A.A. Integrating fuzzy AHP with TOPSIS method for optimal power substation location selection. Int. J. Logist. Econ. Glob. 2013, 5, 312–331. [Google Scholar] [CrossRef] [Scilit]
- Lee, A.H.I.; Kang, H.-Y.; Liou, Y.-J. A Hybrid Multiple-Criteria Decision-Making Approach for Photovoltaic Solar Plant Location Selection. Sustainability 2017, 9, 184. [Google Scholar] [CrossRef] [Scilit]
- Suh, J.; Brownson, J. Solar Farm Suitability Using Geographic Information System Fuzzy Sets and Analytic Hierarchy Processes: Case Study of Ulleung Island, Korea. Energies 2016, 9, 648. [Google Scholar] [CrossRef] [Scilit]
- Noorollahi, E.; Fadai, D.; Shirazi, M.A.; Ghodsipour, S.H. Land Suitability Analysis for Solar Farms Exploitation Using GIS and Fuzzy Analytic Hierarchy Process (FAHP)—A Case Study of Iran. Energies 2016, 9, 643. [Google Scholar] [CrossRef] [Scilit]
- Gan, L.; Xu, D.; Hu, L.; Wang, L. Economic Feasibility Analysis for Renewable Energy Project Using an Integrated TFN–AHP–DEA Approach on the Basis of Consumer Utility. Energies 2017, 10, 2089. [Google Scholar] [CrossRef] [Scilit]
- Liu, J.-P.; Yang, Q.-R.; He, L. Total-Factor Energy Efficiency (TFEE) Evaluation on Thermal Power Industry with DEA, Malmquist and Multiple Regression Techniques. Energies 2017, 10, 1039. [Google Scholar] [CrossRef] [Scilit]
- Samanlioglu, F.; Ayag, Z. A fuzzy AHP-PROMETHEE II approach for evaluation of solar power plant location alternatives in Turkey. J. Intell. Fuzzy Syst. 2017, 33, 859–871. [Google Scholar] [CrossRef] [Scilit]
- Nazari, M.A.; Aslani, A.; Ghasempour, R. Analysis of Solar Farm Site Selection Based on TOPSIS Approach. Int. J. Soc. Ecol. Sustain. Dev. 2018, 9, doi–10. [Google Scholar] [CrossRef] [Scilit]
- Garni, H.Z.A.; Awasthi, A. Solar PV power plant site selection using a GIS-AHP based approach with application in Saudi Arabia. Appl. Energy 2017, 206, 1225–1240. [Google Scholar] [CrossRef] [Scilit]
- Merrouni, A.A.; Elalaoui, F.E.; Mezrhab, A.; Mezrhab, A.; Ghennioui, A. Large scale PV sites selection by combining GIS and Analytical Hierarchy Process. Case study: Eastern Morocco. Renew. Energy 2018, 119, 863–873. [Google Scholar] [CrossRef] [Scilit]
- Sanchez-Lozano, J.; García-Cascales, M.; Lamata, M. Comparative TOPSIS-ELECTRE TRI methods for optimal sites for photovoltaic solar farms. Case study in Spain. J. Clean. Prod. 2016, 127, 387–398. [Google Scholar] [CrossRef] [Scilit]
- Beltran, P.A.; Gonzalez, F.C.; Ferrando, J.P.; Pozo, F.R. An ANP-based approach for the selection of photovoltaic solar power plant investment projects. Renew. Sustain. Energy Rev. 2010, 14, 249–264. [Google Scholar] [CrossRef] [Scilit]
- Charnes, A.; Cooper, W.; Rhodes, E. Measuring the efficiency of decision making units. Eur. J. Oper. Res. 1978, 2, 429–444. [Google Scholar] [CrossRef] [Scilit]
- Wen, M. Uncertain Data Envelopment Analysis. In Uncertainty and Operations Research; Springer: Heidelberg, Berlin, 2015. [Google Scholar]
- Farrell, M.J. The Measurement of Productive Efficiency. J. R. Stat. Soc. 1957, 120, 253–281. [Google Scholar] [CrossRef] [Scilit]
- Tone, K. A slacks-based measure of efficiency in data envelopment analysis. Eur. J. Oper. Res. 2001, 130, 498–509. [Google Scholar] [CrossRef] [Scilit]
- Pastor, J.T.; Ruiz, J.L.; Sirvent, I. An enhanced DEA Russell graph efficiency measure. Eur. J. Oper. Res. 1999, 115, 596–607. [Google Scholar] [CrossRef] [Scilit]
- Zadeh, L. Fuzzy sets. Inf. Control 1965, 8, 338–353. [Google Scholar] [CrossRef] [Scilit]
- Shu, M.S.; Cheng, C.H.; Chang, J.R. Using intuitionistic fuzzy set for fault-tree analysis on printed circuit board assembly. Microelectron. Reliab. 2006, 46, 2139–2148. [Google Scholar] [CrossRef] [Scilit]
- Kahraman, Ç.; Ruan, D.; Ethem, T. Capital budgeting techniques using discounted fuzzy versus probabilistic cash. Inf. Sci. 2002, 42, 57–76. [Google Scholar] [CrossRef] [Scilit]
- Kuswandari, R. Assessment of Different Methods for Measuring the Sustainability of Forest Management Retno Kuswandari. Master’s Thesis, University of Twente, Enschede, The Netherlands, December 2004. [Google Scholar]
- Prakash, T.N. Land Suitability Analysis for Agricultural Crops: A Fuzzy Multi Criteria Decision Making Approach. Master’s Thesis, University of Twente, Enschede, The Netherlands, December 2003. [Google Scholar]
- Hwang, C.L.; Yoon, K.; Hwang, C.L.; Yoon, K. Multiple Attribute Decision Making: Method and Applications; Springer: New York, NY, USA, 1981. [Google Scholar]
- Assari, A.; Maheshand, T.; Assari, E. Role of public participation in sustainability of historical city: Usage of TOPSIS method. Indian J. Sci. Technol. 2012, 5, 2289–2294. [Google Scholar]
- Jahanshahloo, G.R.; Lotfi, F.H.; Izadikhah, M. Extension of the TOPSIS Method for Decision-Making Problems with Fuzzy Data. Appl. Math. Comput. 2006, 181, 1544–1551. [Google Scholar] [CrossRef] [Scilit]
- Liu, J.; Ding, F.-Y.; Lall, V. Using data envelopment analysis to compare suppliers for supplier selection and performance improvement. Supply Chain Manag. Int. J. 2000, 5, 143–150. [Google Scholar] [CrossRef] [Scilit]
- Tang, Y.-C.; Beynon, M.J. Application and Development of a Fuzzy Analytic Hierarchy Process within a Capital Investment Study. J. Econ. Manag. 2005, 1, 207–230. [Google Scholar]

© 2018 by the authors. Licensee MDPI, Basel, Switzerland. This article is an open access article distributed under the terms and conditions of the Creative Commons Attribution (CC BY) license (http://creativecommons.org/licenses/by/4.0/).