Article

An Efficient Controlled Islanding Strategy for Large-Scale AC/DC Power Systems

1
Key Laboratory of Power System Intelligent Dispatch and Control of Ministry of Education, Shandong University, 17923 Jingshi Road, Jinan 250061, China
2
Shandong Electric Power Dispatching and Control Center, Jinan 250001, China
*
Author to whom correspondence should be addressed.
Energies 2018, 11(6), 1483; https://doi.org/10.3390/en11061483
Submission received: 18 May 2018 / Revised: 2 June 2018 / Accepted: 4 June 2018 / Published: 6 June 2018
(This article belongs to the Section F: Electrical Engineering)

Abstract

:
A controlled islanding strategy should be carefully designed to prevent power systems from overall collapse caused by extremely serious faults, which is of high computational complexity for large-scale AC/DC power systems. An efficient controlled islanding strategy for large-scale AC/DC power systems is proposed in this paper. The original power system is first reduced to decrease the computational complexity. The reduced power system is then partitioned into a number of dispatch areas by using the breadth-first search algorithm. Next, the reduced power system is recovered to obtain the detailed information of the dispatch areas. The spectral clustering algorithm is used to cluster the large number of dispatch areas into a small number of islanding areas. Finally, the controlled islanding strategy is verified by assessing the steady and dynamic performance of the power system. The feasibility, efficacy, and adaptability of the controlled islanding strategy are demonstrated by the case study of a large-scale multi-infeed AC/DC power system in China.

1. Introduction

Structural integrity is the fundamental requirement for the secure operations of power systems. However, controlled islanding (or controlled splitting) should be implemented to prevent power systems from overall collapse when extremely serious faults occur and propagate with the structural integrity jeopardized. Modern power systems are evolving into large-scale interconnected networks with a highly complicated structure, multiple voltage levels, and a large number of elements [1]. Complex interactions between AC and DC systems will be witnessed since more high voltage direct current (HVDC) transmission lines are being put into operation. With serious faults occurring, e.g., short circuits on the backbone network, the voltage drop of AC buses can cause commutation failures and even blocking of DC transmission lines [2]. Frequency collapse and/or power angle instability will be triggered by the enormous power loss along with the blocking of DC lines [3]. The controlled islanding strategy should be appropriately designed, which constitutes the defense scheme for large-scale AC/DC power systems [4].
The computational complexity of a power system increases exponentially with the system scale [5]. Additionally, characteristics of the AC/DC hybrid power system are even more complicated with an increasing number of HVDC links [6]. System reduction is necessarily required to reduce the computational complexity for the success of a controlled islanding strategy. In [7], a segment substitution approach for distribution system model simplification is introduced. A novel methodology is proposed in [8] to identify the π-equivalent model of the external part of the distribution network, which does not require system linearization or priori information about the system under study. The methodology can be auto-adaptive to any changes in the system operating conditions. A network reduction method is proposed in [9] to level down the system structure to an acceptable scale, which comprehensively accounts for the topological characteristics of the original power system, electrical distances between buses, and loading conditions of transmission lines. A network partitioning algorithm based on the electrical distances between pairs of buses is proposed in [10]; however, this is only applicable to small and medium-scale power systems. Few existing works on power system reduction involve multi-infeed HVDC links.
Various methods are proposed to work out the controlled islanding scheme. In [4], a slow- coherency-based approach for adaptive controlled islanding is presented, which aims to design a controlled islanding scheme applicable to AC/DC power systems. The ordered binary decision diagram (OBDD)-based method is used to search for the controlled splitting points in [11,12,13]. The methodologies proposed in [14,15] aim to split the system into two islands by using real-time measurements from phasor measurement units (PMUs). An ant search algorithm is applied to intentional islanding in [16]. The taboo search algorithm for controlled islanding is proposed in [17]. A decision-tree-based approach is used to localize islanding points in [18]. A branch potential energy-based islanding method is proposed in [19]. A controlled islanding strategy based on slow coherency and the k-way partitioning method is proposed in [20]. Controlled islanding strategies for large-scale interconnected power systems are proposed in [21,22,23]. Nevertheless, these mentioned methods are not necessarily of a sufficient efficacy and adaptability to cope with extremely serious faults of large-scale AC/DC power systems.
The feasibility, efficacy, and adaptability of a controlled islanding strategy should be verified by assessing the steady-state and dynamic characteristics of the power system to be islanded. Several criteria are introduced in [4] to assess the feasibility of the controlled islanding strategy for the AC/DC power system, which include conditions of multiple time scales, topologic significance, and pattern significance. In [24,25,26], the multi-infeed short circuit ratio (MSCR) is used to weigh the structural strength of a power system with multi-infeed HVDC links. Time-domain simulations are conducted to evaluate the efficacy of the controlled islanding scheme in [23].
An efficient controlled islanding strategy for large-scale AC/DC power systems is proposed in this paper. First, the structure of the power system is reduced to decrease the computational complexity. Second, the breadth-first search (BFS) algorithm is used to partition the reduced power system into a quantity of dispatch areas. Third, the reduced power system is recovered to obtain the detailed information of the dispatch areas with the BFS algorithm. Fourth, the spectral clustering algorithm is used to cluster the large number of dispatch areas into a relatively small number of controlled islanding areas. Finally, certain indices describing steady-state characteristics of the system are computed while a series of time-domain simulations are conducted to assess the dynamic performance of the system after controlled islanding.
The remainder of this paper is organized as follows. Section 2 proposes a three-stage method to obtain dispatch areas, which includes the reduction, partition, and recovery of large-scale AC/DC power systems. Section 3 employs the spectral clustering algorithm to cluster the dispatch areas into controlled islanding areas. The controlled islanding strategy is then verified by computing the index to reflect the steady-state characteristics and conducting time-domain simulations to assess the dynamic performance of the power systems. Section 4 presents the case study results of a large-scale AC/DC power system in China. Conclusions are drawn in Section 5.

2. Reduction, Partition and Recovery of Power System

Large-scale AC/DC power systems are usually composed of an extremely large number of generation and transmission elements. To address the issue of the curse of dimensionality, a three-stage method is proposed to reduce the search space of the controlled islanding strategy.

2.1. Reduction of Large-Scale Power System

The search of the controlled islanding boundary in a power system can be transformed into the search of cut-set in the topological structure. The topological structure of the power system can be described as an undirected weight graph G (V0, E0) with a vertex set V0 and an edge set E0, which represent the buses and transmission lines of the power system, respectively [11,12,13]. Since the number of vertexes or edges is usually very large, the structure of the power system should be reduced to facilitate the analysis.
The reduction of the structure is centered on generator buses and backbone transmission lines since they are the key elements in shaping the dynamic characteristics of the power system. Only generator buses, DC transmission lines, ultra high voltage (UHV) and extra high voltage (EHV), AC transmission lines, and the main high voltage (HV) AC transmission lines which link generator buses with the backbone network are retained in the process of reduction. The remaining electric elements, which have no significant impacts on the dynamic characteristics of the power system, such as buses and transmission lines of 220 kV, 110 kV, and lower voltage levels, are all replaced by an equivalent aggregated load. The equivalent aggregated load is calculated as (1) and (2):
P e l , m = i = 1 n P m , i
Q e l , m = i = 1 n Q m , i
where Pel,m and Qel,m are the active and reactive power of the equivalent load of the reserved bus m, respectively; and Pm,i and Qm,i are the active and reactive power injected into the bus m from the ith transmission line to be reduced, respectively.
The reduction process of the large-scale power system can be illustrated by Figure 1. As shown in Figure 1, the generator buses, extra-high voltage and ultra-high voltage buses, and transmission lines are retained as G3, Bus 1, and the transmission line between G3 and Bus 1. Besides, most of the low-voltage-level electric elements are omitted. The structure of the power system is dramatically reduced so that the computational burden decreases significantly.

2.2. Partition of Reduced Power System

An approach is proposed to partition the reduced power system into multiple dispatch areas. The structural complexity is further reduced for each dispatch area.
The BFS algorithm is used to partition the reduced power system and obtain the dispatch areas. The breadth-first search algorithm traverses all nodes of the tree along the breadth of the tree from the root [27]. The descendants of a current node are added in a random order to the array composed of nodes which have been searched. Newly added nodes of the array are assigned randomly as the current nodes for the following search step. The search will be stopped until the target node is found. As shown in Figure 2, the second-layer nodes will be searched until the search for the first-layer nodes has been completed. The advantage of the BFS algorithm is that the target node will always be found with the shortest path if it exists.
All of the power source buses, including generator buses and buses connecting AC or DC transmission lines from external networks, are treated as the root buses of their respective dispatch areas in the reduced power system. Starting from the root buses, the search for the outer buses will be extended layer by layer along with the corresponding transmission lines, as shown in Figure 2. The dispatch areas enlarge with the layer extension. The search on a path should be stopped if the dispatch area where the path is located has a boundary in common with another dispatch area. Buses on the boundaries among various dispatch areas are the target nodes, which should be assigned to the area providing the largest value of active power. By using the BFS algorithm, the reduced power system is partitioned into many dispatch areas.
Note that since the BFS algorithm is originally designed for trees, it should be modified to cope with multiple paths or loops. The shortest path principle is used to manage those complex situations. For multiple paths developed from various root buses, the traversed buses should be assigned to the dispatch area that is stemmed from the root bus forming the shortest path. As shown in Figure 2, two paths are developed respectively from Root 4 and Root 5 to Bus 1. Since Path 1 from Root 4 is the shortest path, Bus 1 should be assigned to Area 3 stemmed from Root 4. Similarly, the buses on a loop are assigned according to the shortest path principle. There exists the situation that all the buses are assigned to the same dispatch area, which can be illustrated by Loop 1 in Figure 2. For the situation where the buses are assigned to different dispatch areas, the loop is opened on the transmission lines where no shortest path passes through. As shown in Figure 2, Loop 2 is opened on Transmission Line 1 and Transmission Line 2.
The HV AC transmission lines linking generator buses with the backbone network are retained in the reduction stage as described in Section 2.1. Even though there may be more than one line section, they should be treated as only one line section when implementing the BFS algorithm. As shown in Figure 3, there are two line sections between G1 and Bus 1, i.e., the line section between G1 and Bus 01 and section between Bus 01 and Bus 1. The two line sections should be treated as just one section between G1 and Bus 1, while Bus 1 is the first-layer bus of the root bus G1. Since Bus 1 is the first-layer bus that G1, G2 and G3 have in common, these buses should be assigned to the same dispatch area. As shown in Figure 3, the two paths are developed respectively from two root buses of G3 and G12 to Bus 3. Since the path of G3-Bus 3 is the shortest path, Bus 3 is assigned to the dispatch area stemmed from G3. There are two loops in Figure 3, which are the loops of [G3, Bus 1, Bus 3, G3] and [G3, Bus 3, Bus 5, Bus 4, Bus 2, G3]. Buses on the former loop are assigned to one dispatch area, while buses on the latter loop are assigned to two dispatch areas. The converter station buses of DC transmission lines from other networks are defined as Set A, while the buses connecting AC transmission lines from external networks with a large amount of power transferred are defined as Set B. Any two elements of A and B should not be assigned to the same dispatch area to avoid losing too much power when the power system is under controlled islanding after extremely serious faults.

2.3. Recovery of Reduced Power System

There is the risk of information loss after the power system is reduced. Although a trade-off is made between the reduction of computational complexity and the information loss, efforts should be devoted to limiting the negative effects of the system reduction. A recovery step is applied to recover certain detailed information in the dispatch areas.
The BFS algorithm is used to recover the power system. In the reduced power system, all of the generator buses, the buses connecting AC or DC transmission lines from external networks, and the buses in the backbone network are treated as the root buses. The 220 kV-voltage-level buses and transmission lines are the main power system elements which should be recovered. The 110 kV and lower-voltage-level buses and lines belong to the distribution network, which is mainly of a radial structure. A distribution network is naturally affiliated in a dispatch area in which its upper 220 kV bus is recovered. The common kth layer bus extended from different root buses belonging to various dispatch areas should be assigned to the dispatch area providing the largest value of active power.
In the search process, boundaries among different dispatch areas will be generated, which separate search paths extended from the root buses of the respective dispatch areas.
The recovery approach to the reduced power system can be illustrated by Figure 4, which shows the dispatch areas of Figure 3 in detail after recovery. Bus 1 and Bus 2 are the first-layer buses of G1 and G2, respectively, which belong to Area 1. As the common third-layer bus of G2 and G3, Bus 4 belongs to Area 2, which provides more active power than Area 1. Bus 7 and Bus 10 are two root buses of Area 1 and Area 2, respectively, from which various search paths form. The line between Bus 8 and Bus 9 is just on the cut-set along the common boundary of two search paths extended respectively from Bus 7 and Bus 10. Finally, the boundaries among Area 1–3 are generated.

3. Controlled Islanding Strategy

3.1. Controlled Islanding Using Spectral Clustering Algorithm

Dispatch areas obtained in Section 2 are candidates of controlled islanding areas. Nevertheless, the number of dispatch areas is too large, which will pose a great monitoring and control burden for the system operator. Besides, the coverage of each islanding area should be appropriately set to limit the impact of extremely serious faults. Therefore, the total number of islanding areas cannot be too small. The appropriate number of controlled islanding areas should be determined in accordance with the structural scale of the actual system.
Spectral clustering is a widely used clustering algorithm which is more adaptive to the distribution of data than the traditional K-means algorithm [28]. Spectral clustering is used to partition volt/VAR control areas in bulk power systems in [29]. The power system is partitioned to solve distributed optimal power flow by employing the spectral clustering algorithm in [30]. The spectral clustering algorithm has been applied to the out-of-step islanding in [31,32,33,34]. In this paper, controlled islanding areas are obtained through clustering dispatch areas by using the spectral clustering algorithm.
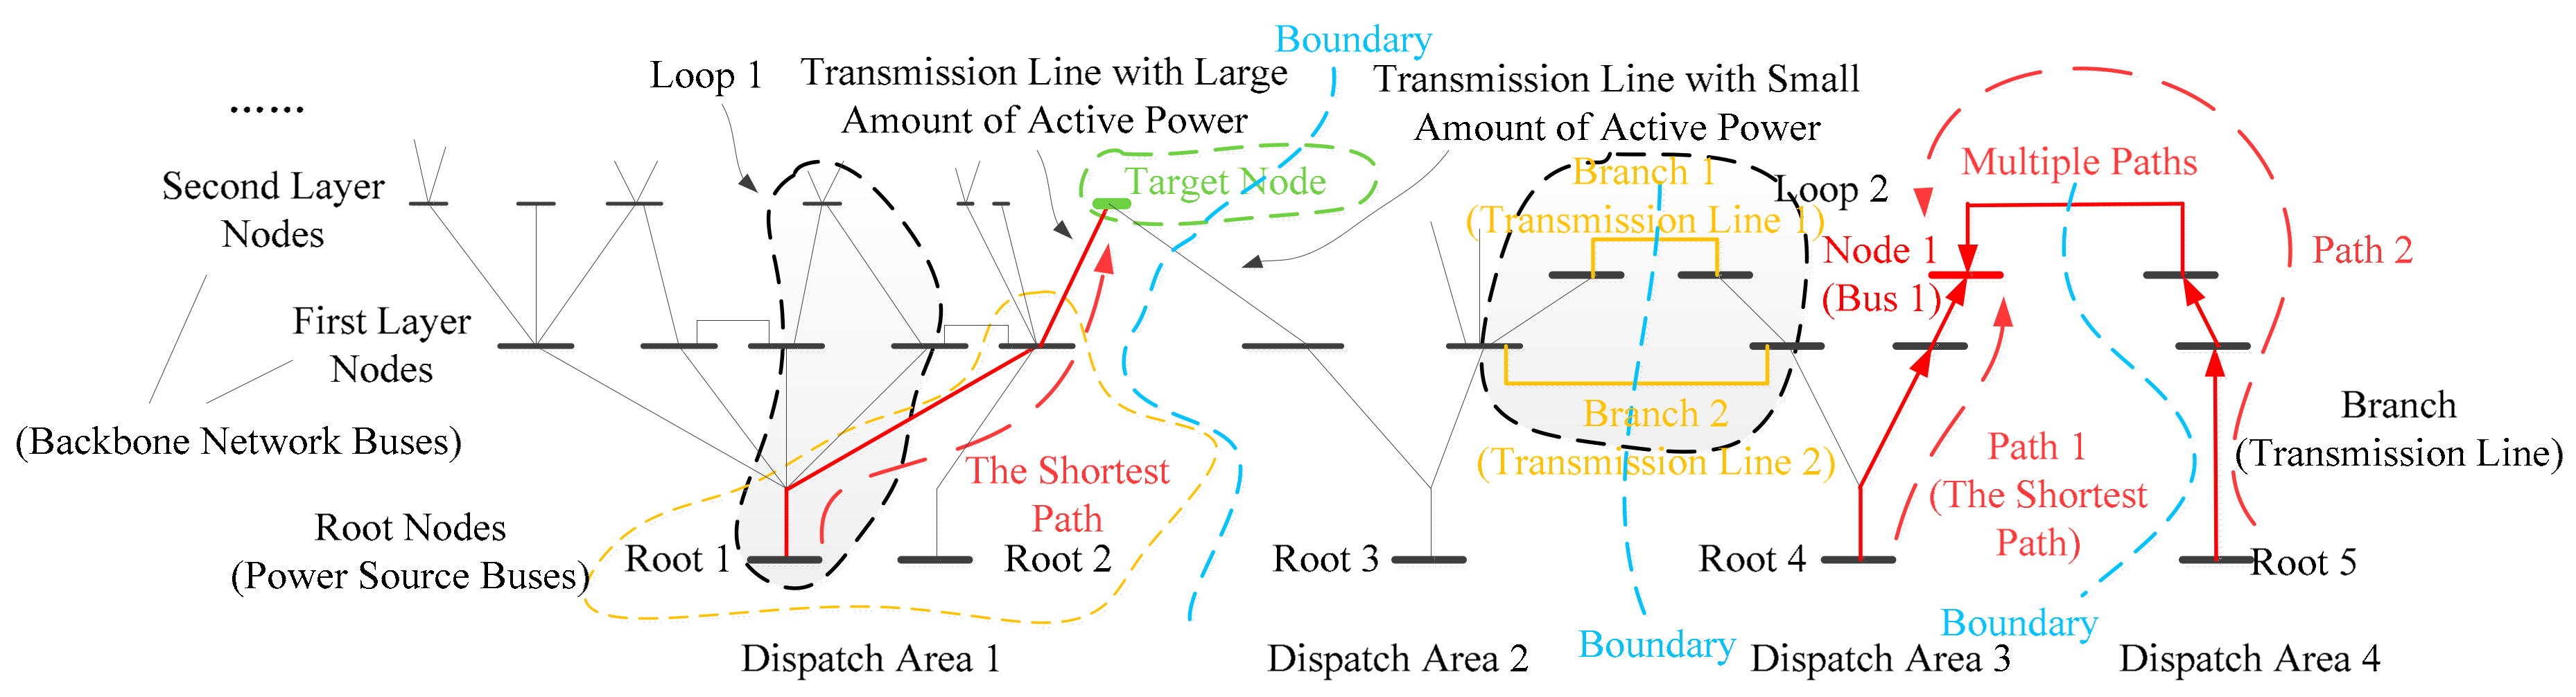
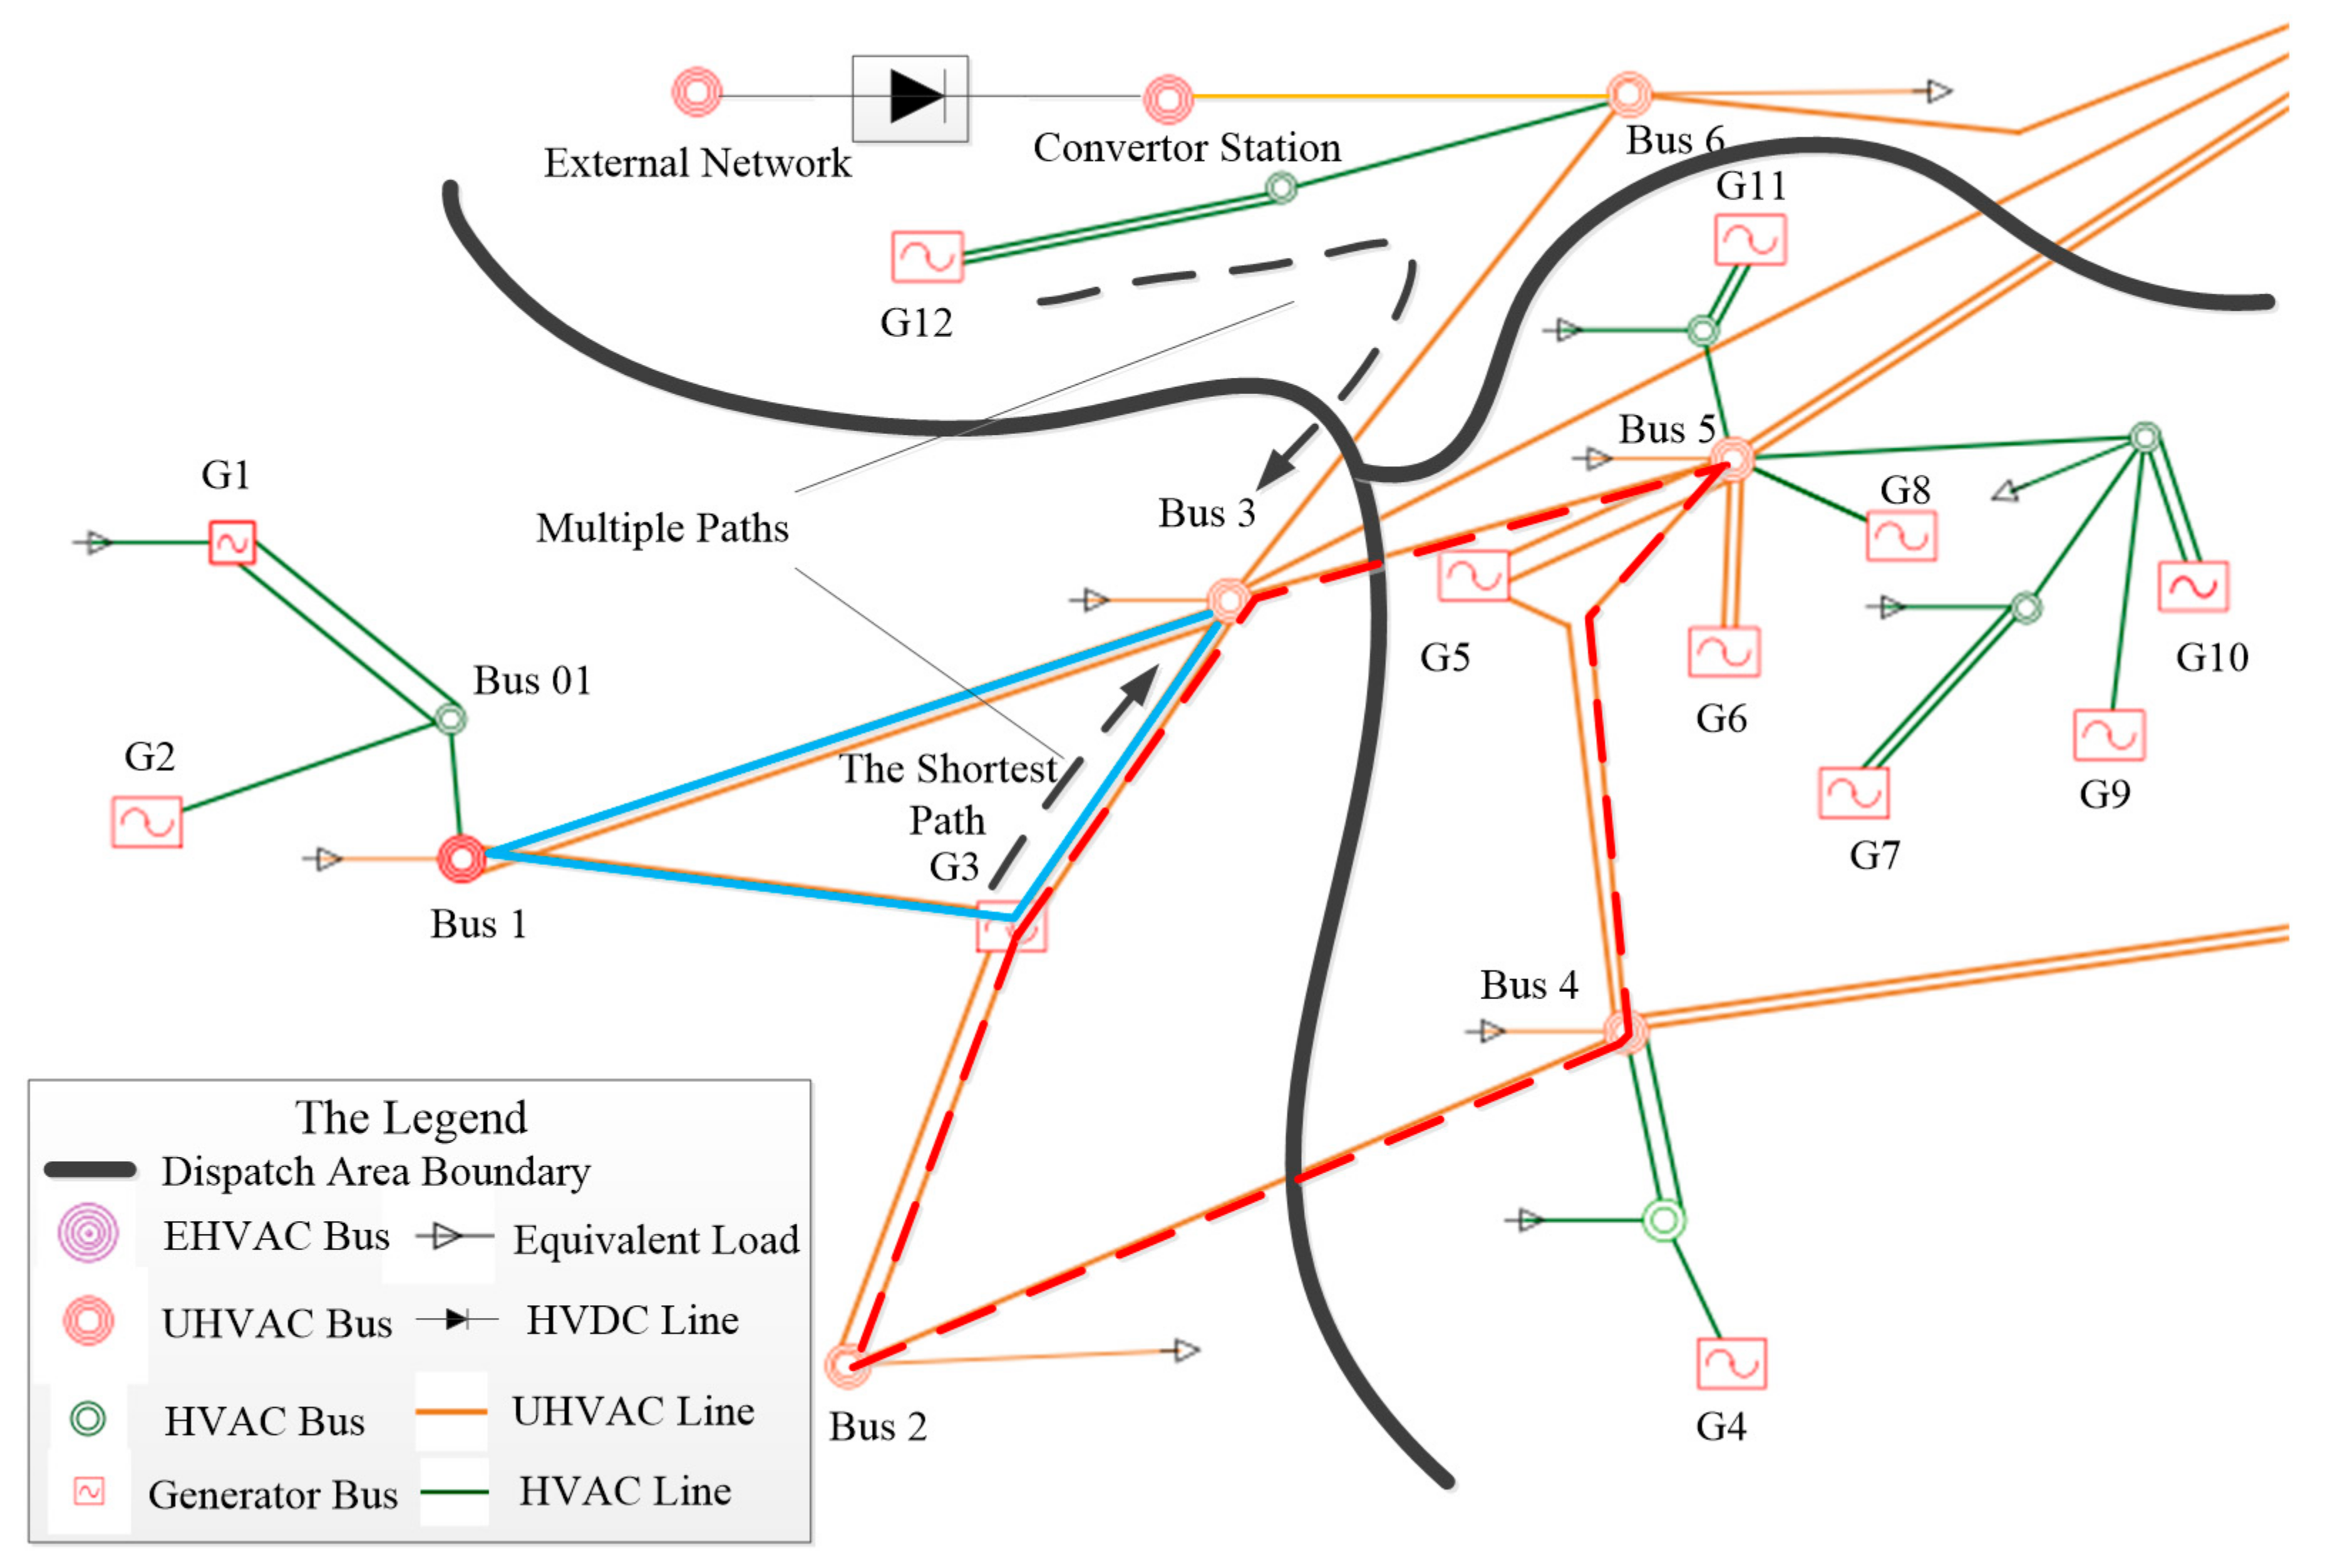
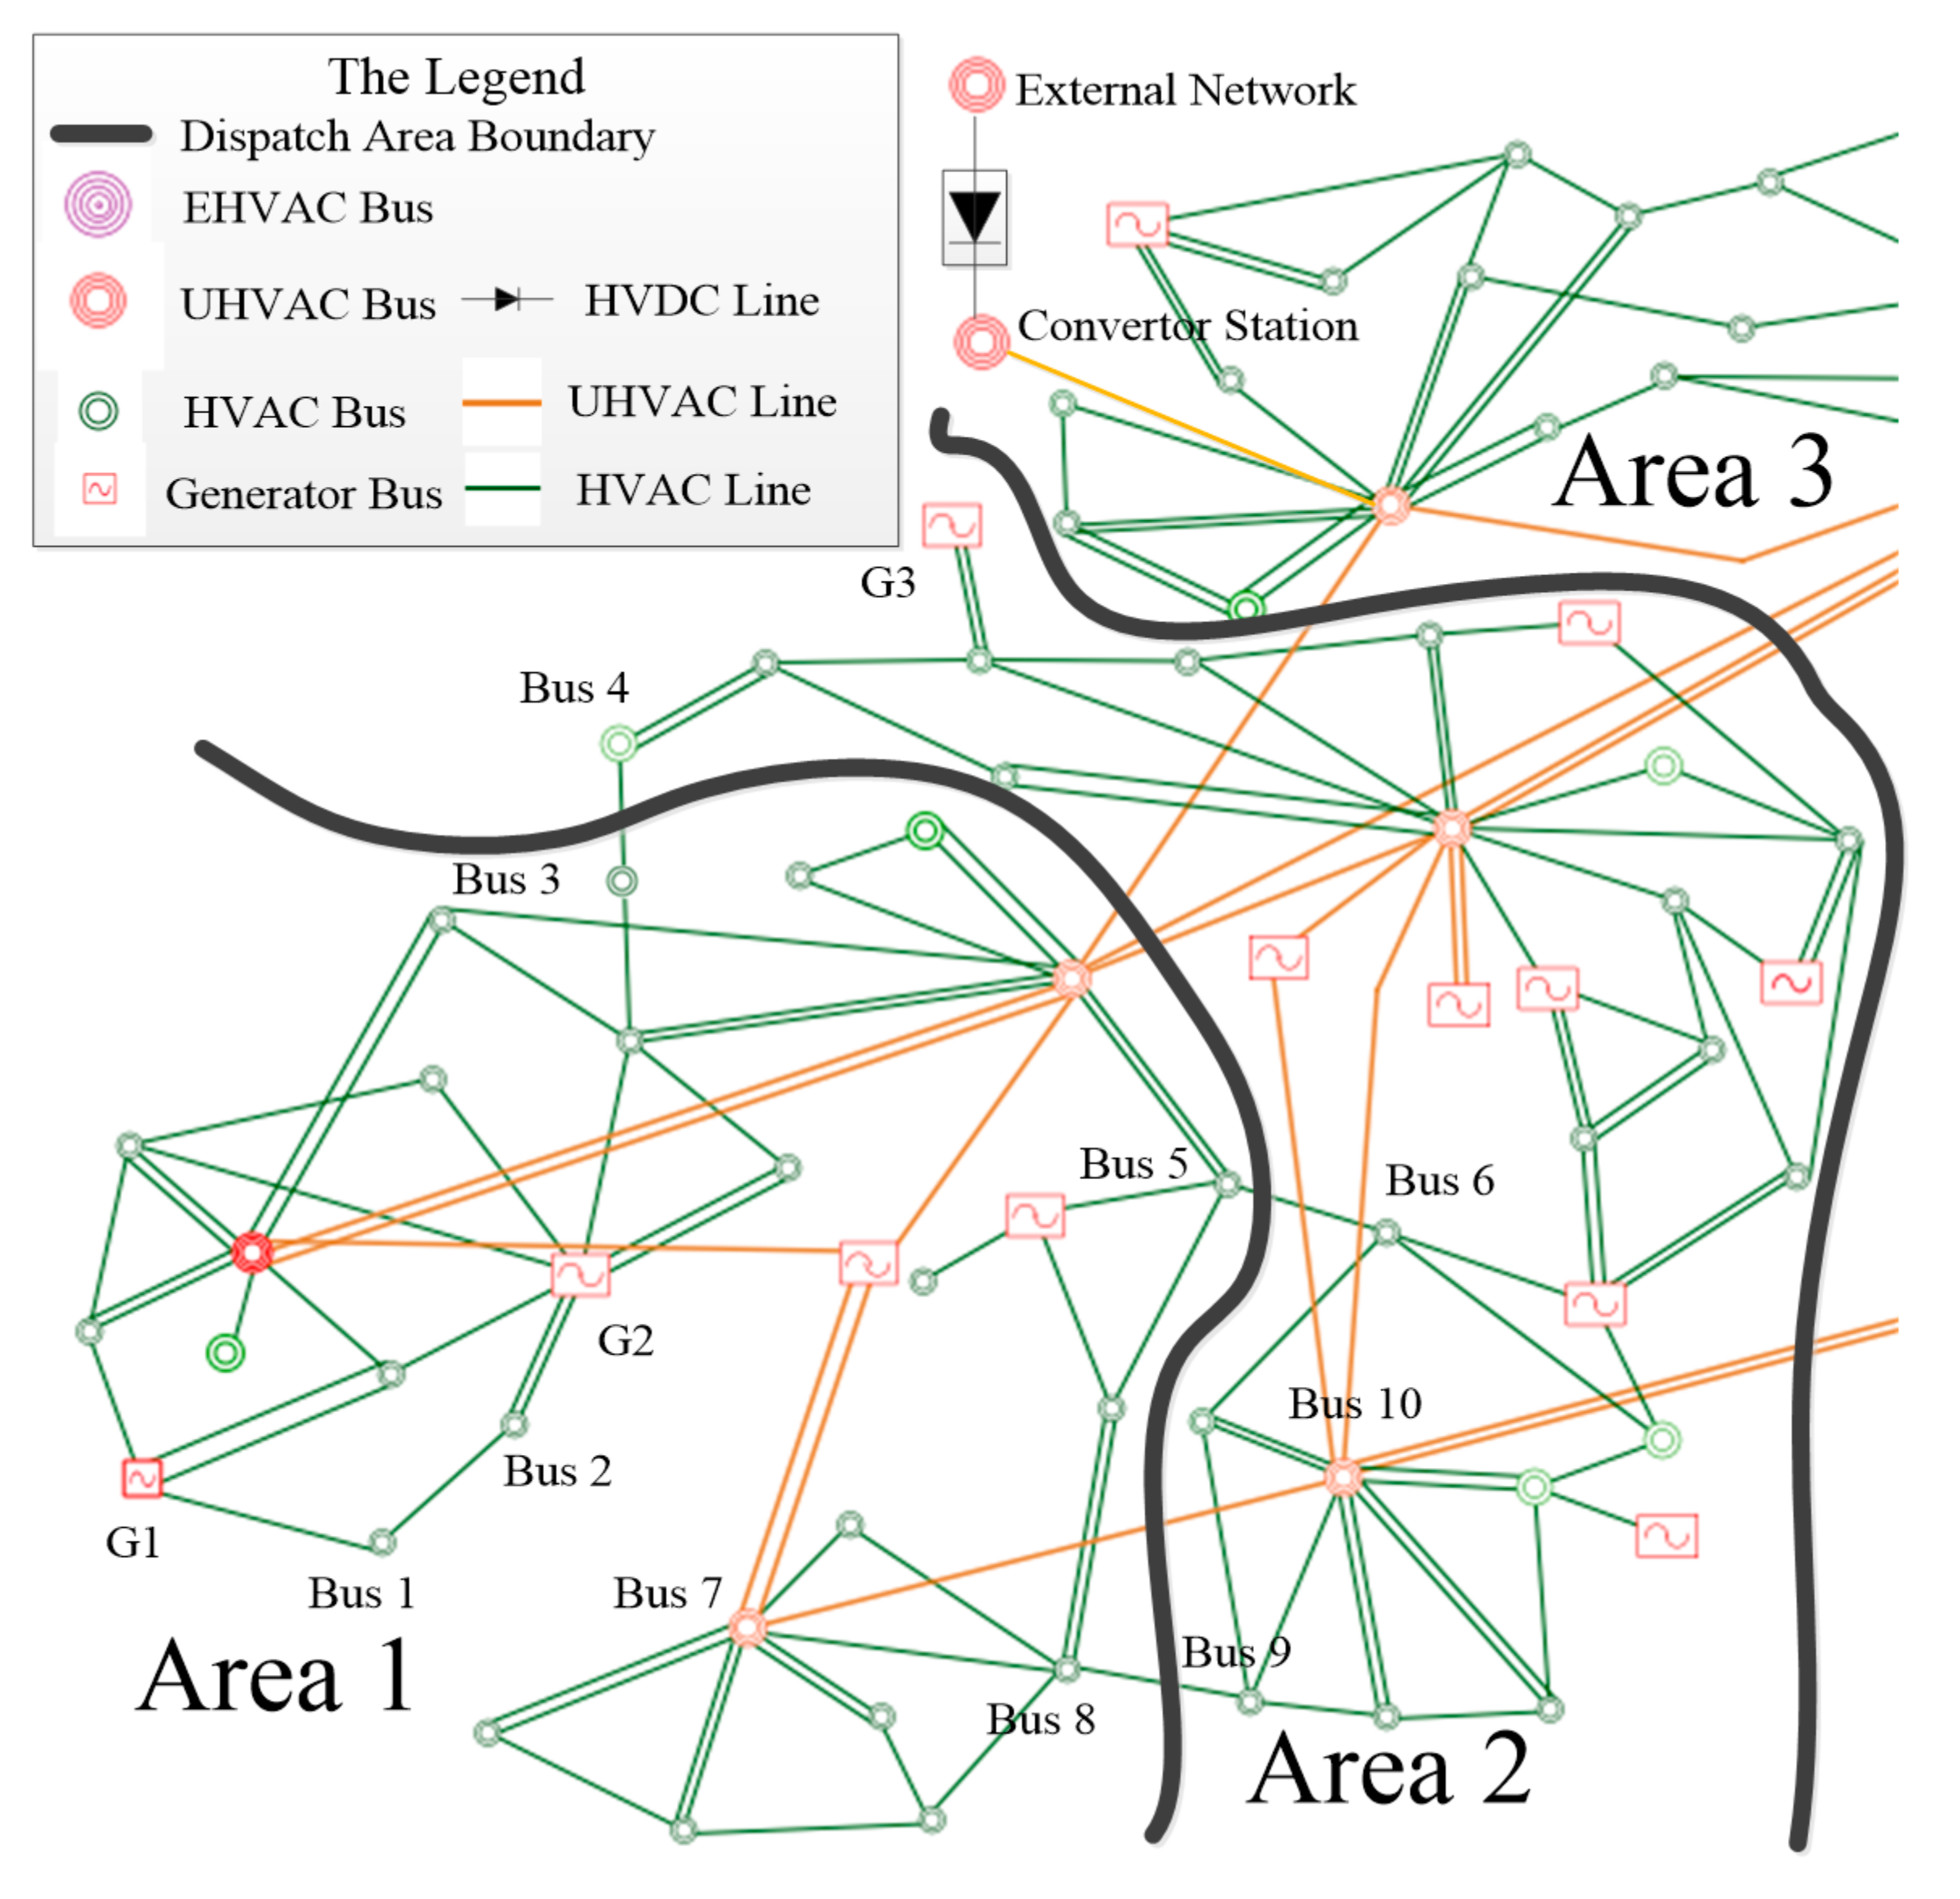
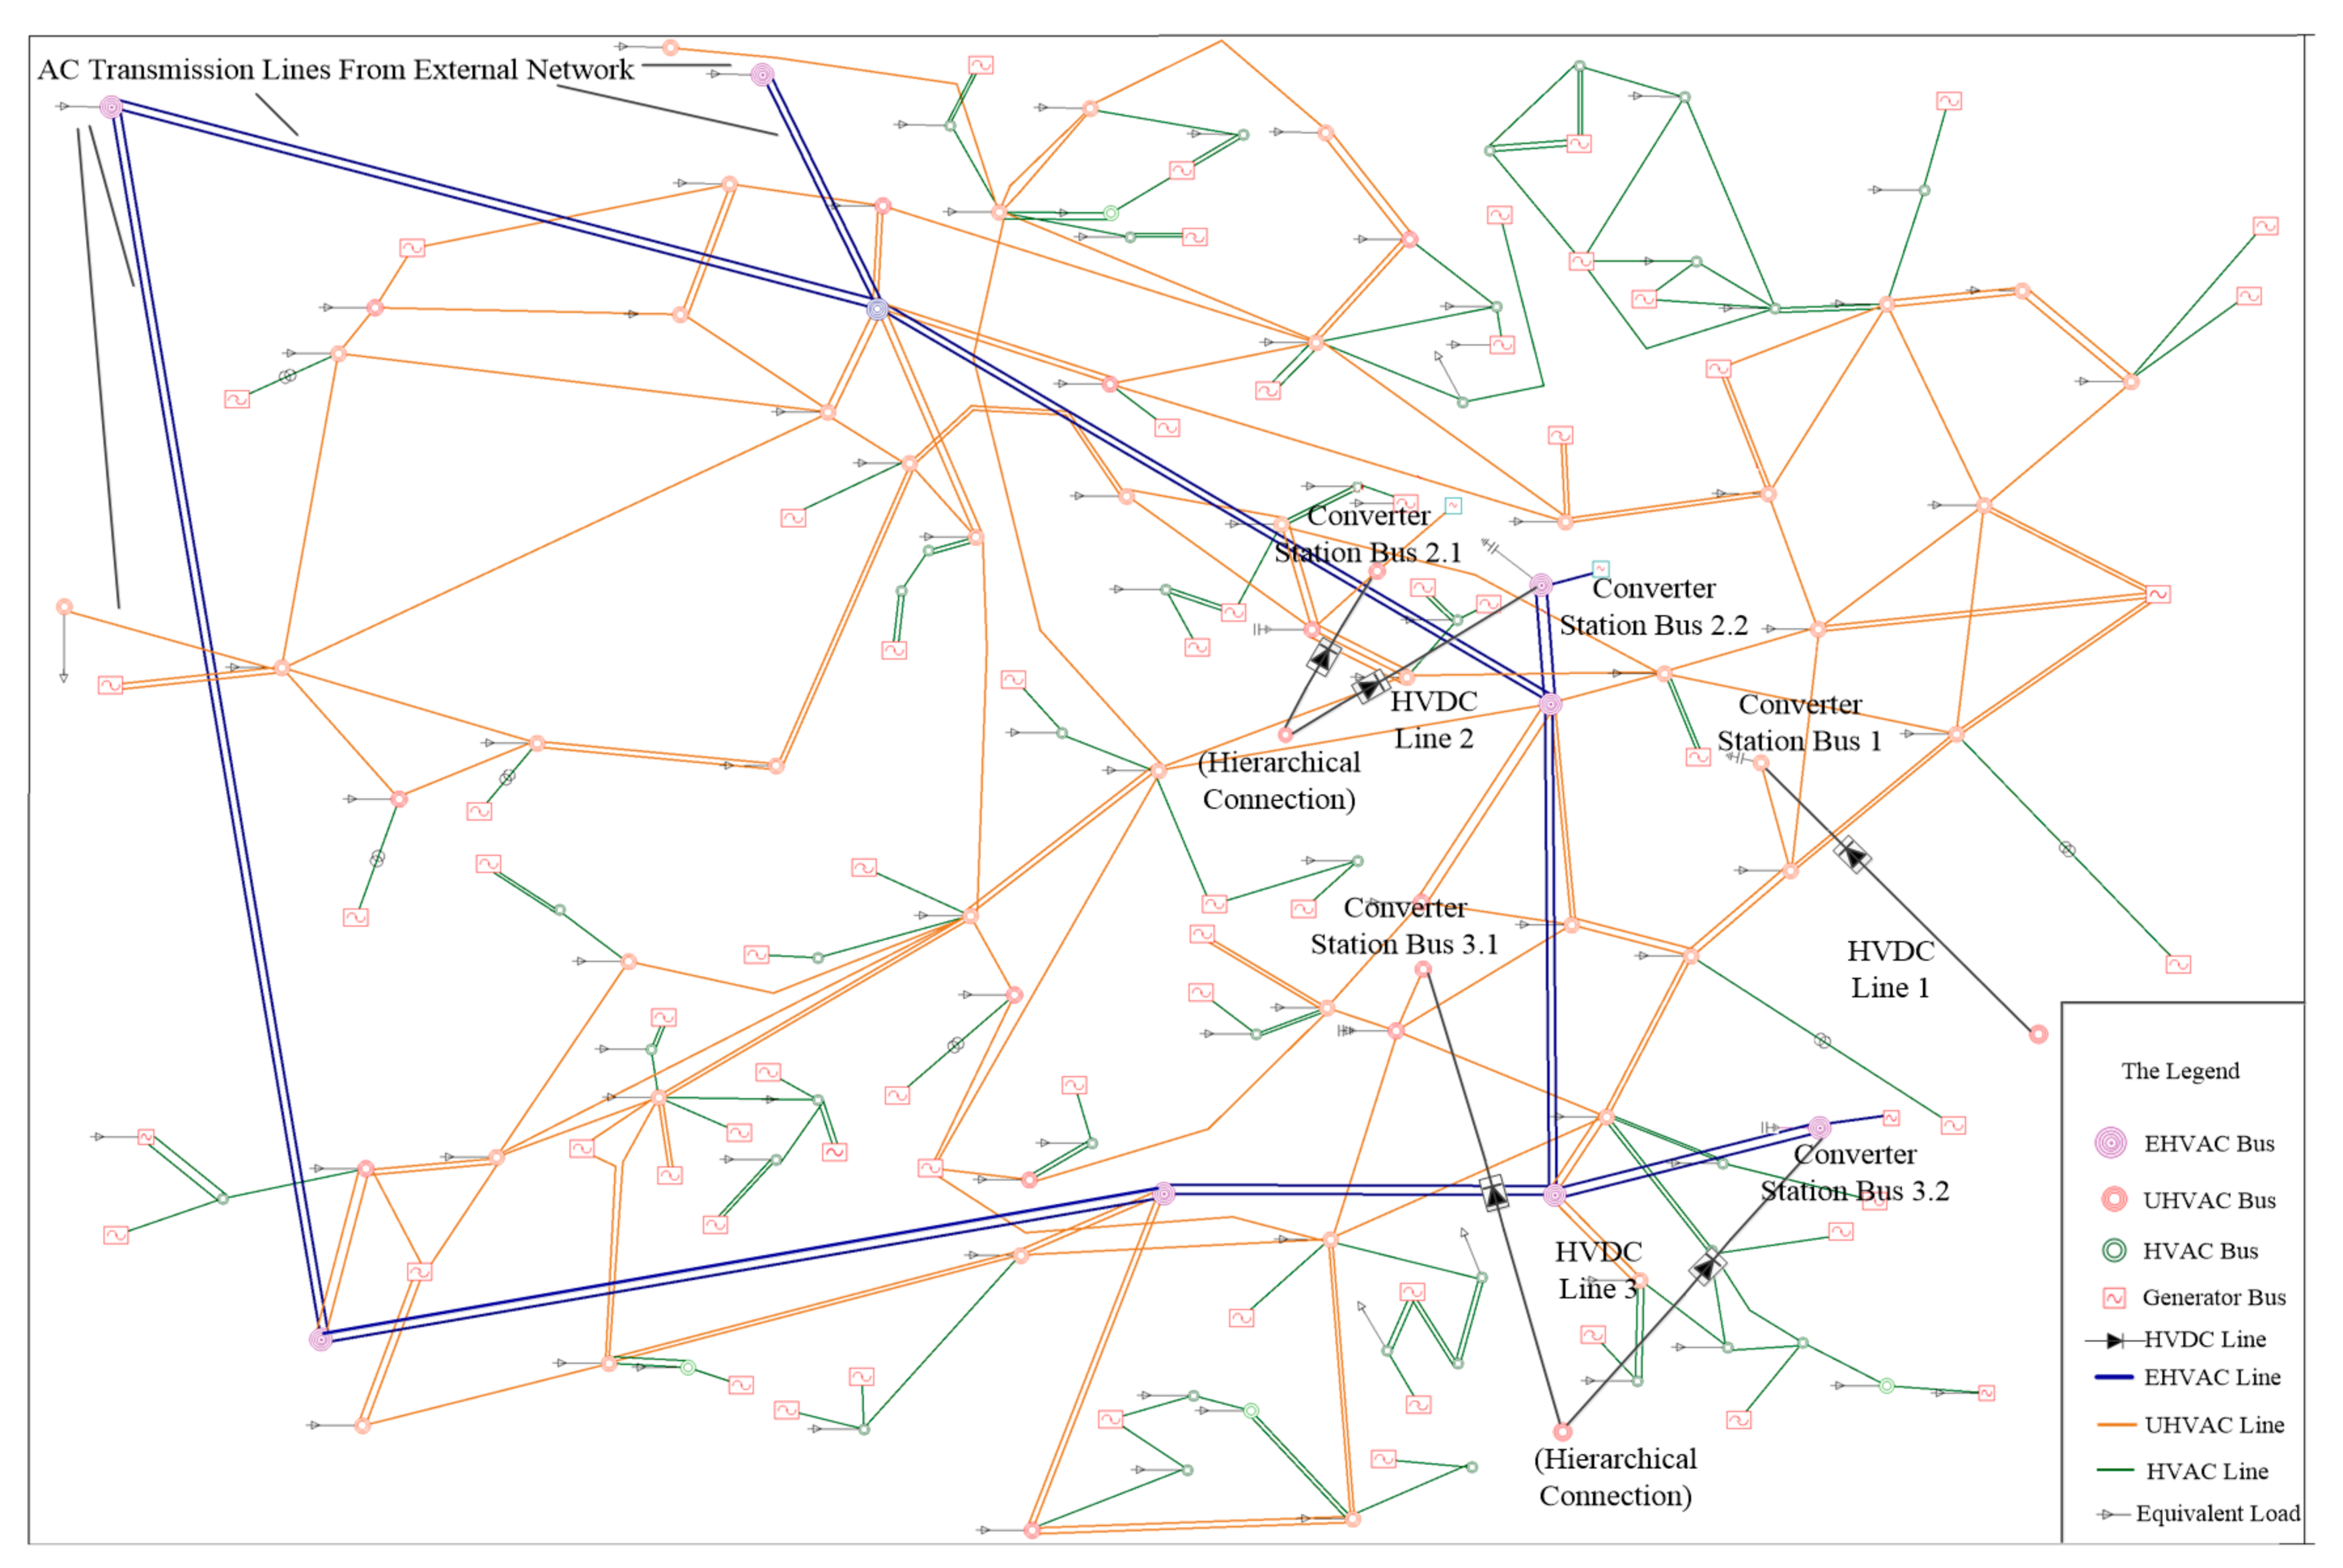
The dispatch areas are treated as vertexes while the transmission lines between any two dispatch areas are treated as undirected edges. Thus, the power system is expressed with an undirected weight graph G (V0, E0) with vertex set V0 and edge set E0. The search of islanding areas can be transformed into the search of the appropriate cut-sets of the undirected weight graph. The elements in the neighboring weights matrix W of G (V0, E0) are:
W i j = { w i j , ( i , j ) E 0 0 , ( i , j ) E 0
where wij is the weight of the edge (i, j); the larger wij is, the higher the similarity between i and j, and the closer the connection between these two vertexes.
The weight of wij is determined by the number of and active power transferred on the transmission lines of the boundary between dispatch areas i and j as:
w i j = { 0 , i = j l i j l m i n l m a x l m i n + P i j P m i n P m a x P m i n , i j
where lij is the number of transmission lines between dispatch area i and j, lmax is the biggest number of transmission lines of the boundary between any two dispatch areas, Pij is the active power transferred on transmission lines between dispatch area i and j, and Pmax is the largest active power on transmission lines of the boundary between any two dispatch areas. Note that any two dispatch areas which contain the buses from sets A and B (as mentioned in Section 2.2) should not be clustered into the same islanding area. Hence, the weight of wij should be set to 0 for the corresponding dispatch areas i and j.
As shown in (5), the degree matrix D is generated based on W. The Laplacian matrix is calculated based on D and W, as in (6). The standardized Laplacian matrix is expressed as in (7).
d i j = { 0 , i j j = 1 n w i j , i = j
L = D W
L = D 1 2 L D 1 2
The eigenvectors corresponding to the smallest K eigenvalues of L′ are used to compose the matrix V as:
V = [ v 1 , v 2 , , v K ]
where K is the number of clusters. Each row of V is treated as a sample for clustering.
K samples are chosen as the original cluster centers. In each iteration, the Euclidean distances between the cluster centers and the other samples are calculated. Each sample is assigned to the cluster that is of the shortest distance between its center and the sample compared with other clusters. Each cluster center is updated by averaging samples of the cluster. The iteration process will repeat until it converges or reaches the preset maximum number.
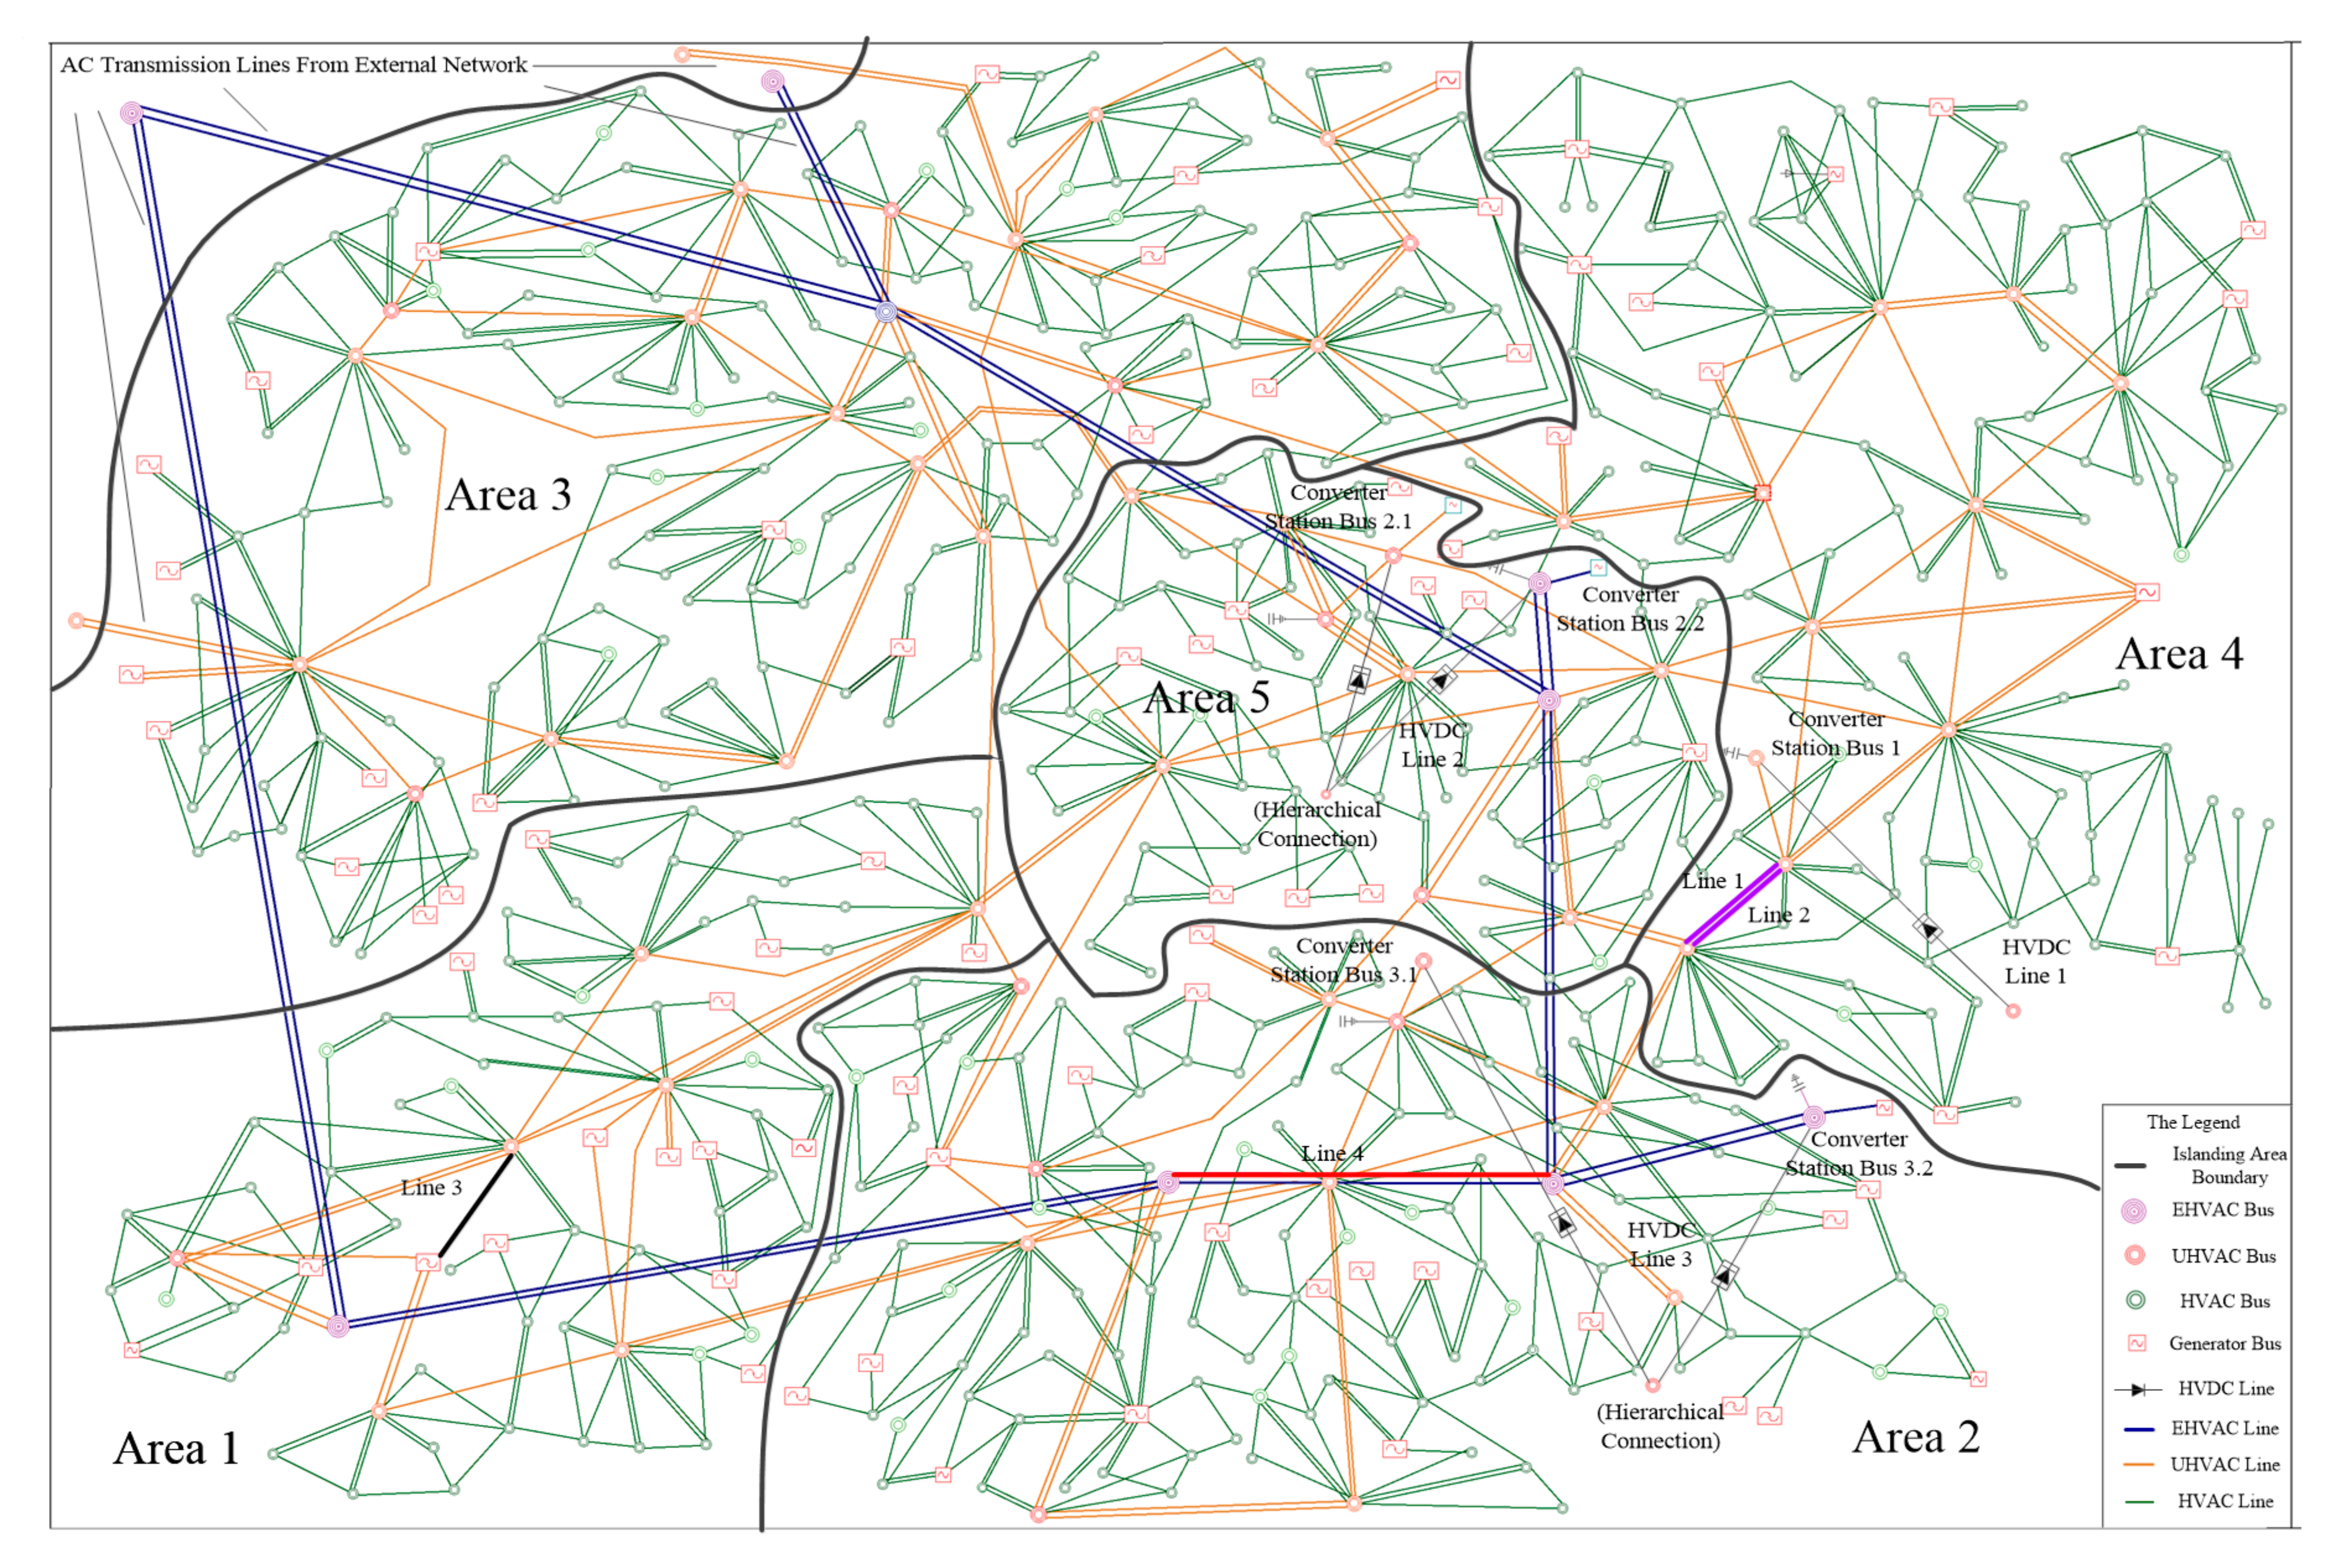
By using the spectral clustering algorithm, the controlled islanding areas are obtained through clustering the dispatch areas. The dispatch areas connecting closely with each other are gathered into an islanding area. Transmission lines intersecting the islanding boundaries, i.e., the cut-sets among islanding areas, should be equipped with devices for controlled islanding.
Once the integrity of the power system cannot be maintained with extremely serious faults occurring and propagating, cut-sets between the emergent areas that are most greatly impacted by the faults and the other areas will be tripped to isolate the emergent areas. Supplementary measures should be implemented to complement the controlled islanding, which include generator tripping, under frequency load shedding (UFLS), under voltage load shedding (UVLS), etc. The controlled islanding is usually followed by the restoration procedure.
Note that the controlled islanding strategy proposed is implemented in a centralized way, which is compatible with the operating practices of a synchronous power system. The AC/DC power systems are operated synchronously with the structural integrity maintained in normal conditions. Whenever the controlled islanding strategy is actuated, the islanding areas are to be centrally monitored and controlled by the system operator. The islanding areas will be re-synchronized when the synchronism conditions can be met.

3.2. Verification of Controlled Islanding Strategy

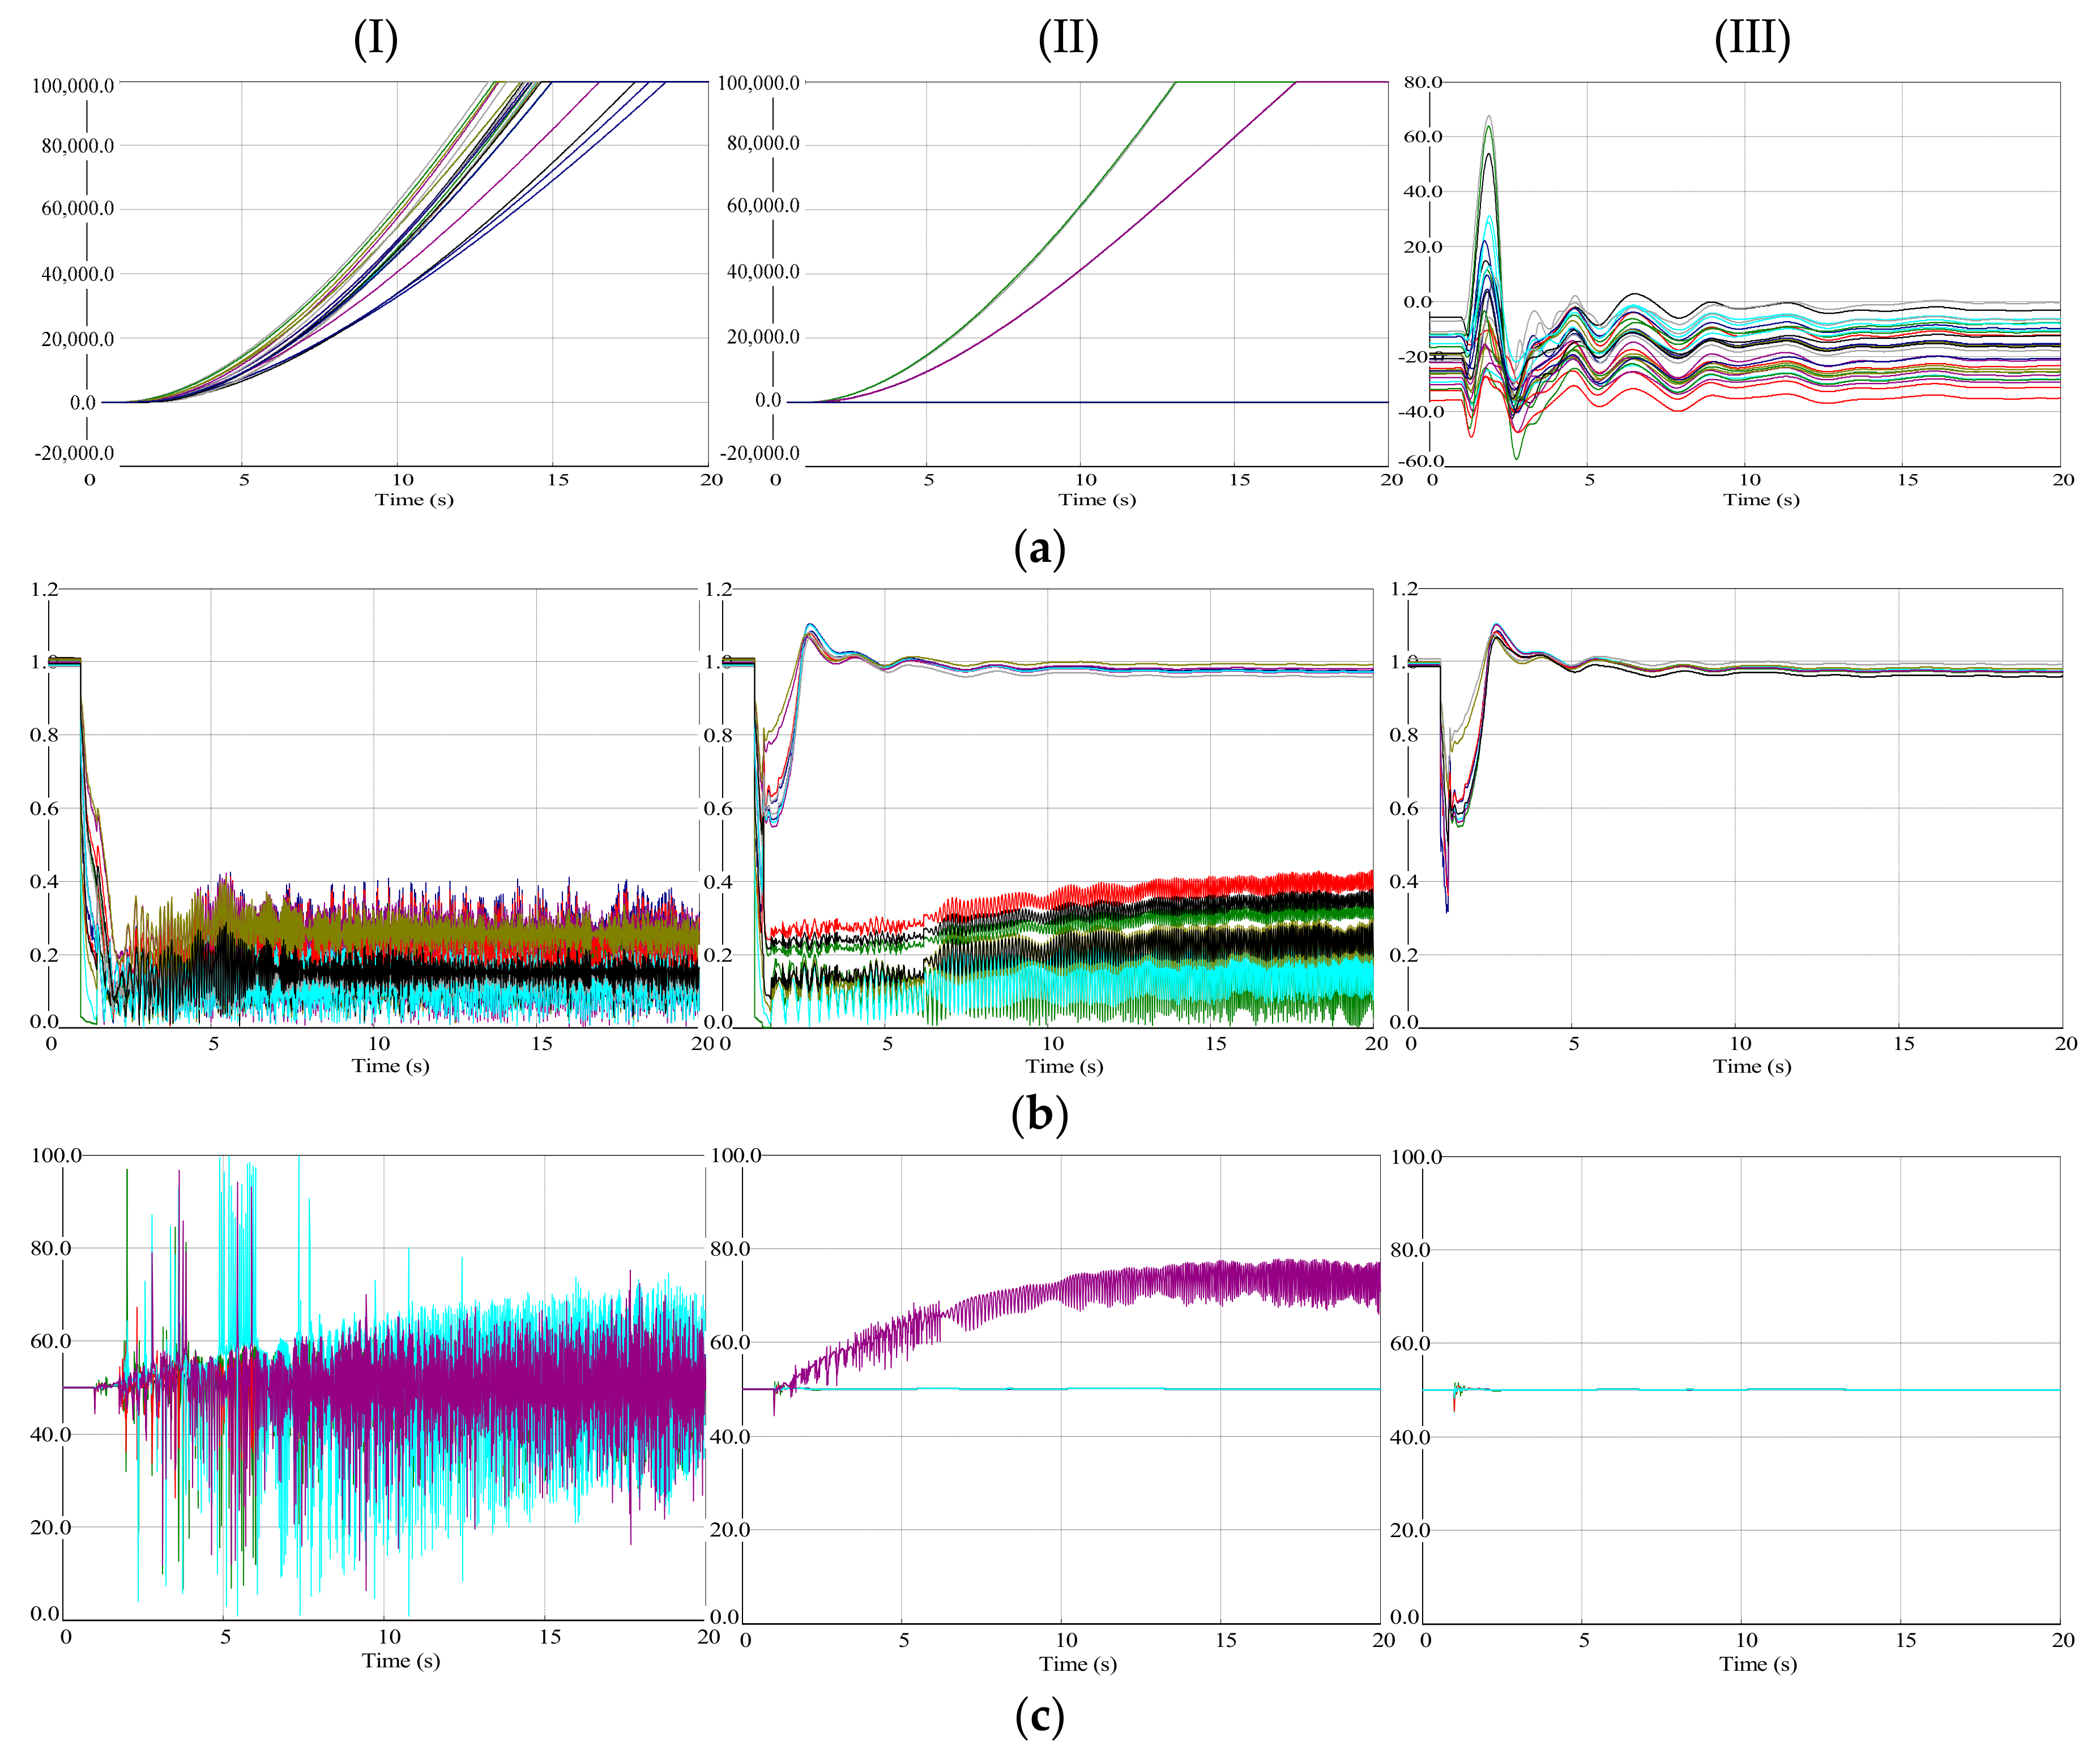
Verification of the controlled islanding strategy is required to test its feasibility, efficacy, and adaptability for the power system on which the islanding strategy is to be implemented. Certain indices describing steady-state characteristics of the system are computed to verify the feasibility of the islanding strategy, e.g., whether the structural strength of the system after islanding is sufficient to tolerate the complicated interactions between AC and DC subsystems. A series of simulations accounting for various operating conditions are conducted to assess the dynamic performance of the system, which demonstrate the efficacy and adaptability of the islanding strategy to prevent the system from further deterioration and stabilize it.
It is of great importance to evaluate the structural strength of the power system since it reflects the capability of the AC system to support the normal operation of DC lines. Various indices have been proposed to depict the structural strength of a power system. The multi-infeed short circuit ratio (MSCR) is usually used to evaluate the strength of a system with multi-infeed DC lines [24,25,26]. The multi-infeed effective short circuit ratio (MESCR) is proposed as the modification of the MSCR, which accounts for the reactive power compensation at converter station buses. The MESCR is defined as:
M E S C R i = S i Q i | P d c i | + j = 1 , j i n M I I F j i · | P d c j | = S i Q i | P d c i | + j = 1 , j i n Δ U j Δ U i · | P d c j |
where Si is the short-circuit capacity at the converter station bus i; |Pdi| and |Pdj| are the rated power of the ith and jth DC lines, respectively; MIIFji is the multi-infeed interaction factor depicting the impact of the jth DC line on the ith one; and Qi is the capacity of reactive compensation at bus i.
The larger the value of the MESCR index is, the stronger the structural strength of the power system is. A commonly used criterion is as follows. For a strong system, MESCR ≥ 2.5; for a weak system, 1.5 ≤ MESCR < 2.5; for an extremely weak system, MESCR < 1.5. According to the criterion, the MESCR value of each converter station bus should be at least greater than or equal to 1.5 after controlled islanding. If not, the strength of the system should be enhanced through effective measures including the implementation of dynamic reactive power compensation such as the synchronous compensator (SC), static Var compensator (SVC), static synchronous compensator (STATCOM), etc.
The dynamic performance of the power system should be assessed by running time-domain simulations to verify that the system is capable of surviving the extremely serious faults through implementing the controlled islanding strategy. Although the original power system is first reduced to decrease the computational complexity, the time-domain simulations are actually conducted for the whole detailed system. Dynamics of vital variables are monitored, which depict the evolving states of the system. Rotor angles of major generators are extracted to reflect the synchronization of the system. Voltages of end buses on cut-sets of islanding areas are used to assess the voltage stability. The system frequency is monitored to depict the real-time active power balance between generation and load. Dynamic variables of DC lines are employed to reflect their operating states.
The fault of DC lines will usually pose great impacts on the hybrid AC/DC system since a large amount of power is transferred through the DC lines. For the applicability of the controlled islanding strategy, extra control measures including UFLS and UVLS should be activated to maintain the power balance. In very rare cases, if the evolvement of extremely serious faults cannot even be halted by the controlled islanding, other more aggressive measures should be taken.

3.3. Overall Process of Controlled Islanding Strategy

The overall process of the controlled islanding strategy can be illustrated by the flowchart in Figure 5. First, a three-stage method is implemented to reduce the search space of the controlled islanding strategy, which includes the reduction, partition, and recovery of the power system. Then, islanding areas of the system are obtained by using the spectral clustering algorithm. Finally, verification of the controlled islanding strategy is done to test its feasibility, efficacy, and adaptability for the system. The static structural strength and dynamic performance of the power system after obtaining the controlled islanding areas should be verified by computing the MESCR index and running time-domain simulation, respectively.

4. Case Study

A practical power system in China is chosen as the test power system. The network structure of the system is illustrated by Figure 6. The total load of the system is about 53 GW under the typical operation condition, while the transmission loss of the system is about 1 GW. Thus, the total generated and received active power is about 54 GW, including about 28 GW provided by the generators within the system, 24 GW transmitted through three-infeed HVDC lines in the bipolar operation mode, and about 2 GW transmitted through ten AC transmission lines from the external network. Two of the three HVDC lines are in the hierarchical connection mode, i.e., the converter stations are connected to two voltage-level buses. The DCs on the three HVDC lines are 4 GW, 10 GW, 10 GW, respectively. Thus, the test system is a typical large-scale multi-infeed AC/DC power system. The reduction, partition, and recovery steps for the system and the spectral clustering algorithm are programmed in MATLAB R2014a and the verification of the controlled islanding strategy is completed in PSASP 7.21, a power system modeling and analysis software widely used in China [35].

4.1. Controlled Islanding Strategy for Test System

About 100 generator buses and backbone network buses and 200 main transmission lines are reserved after the reduction. Most of other low-voltage-level elements are all replaced by equivalent aggregated loads. The reduced system is illustrated by Figure 7. It is clear that the structure of the system is reduced significantly.
The reduced system is partitioned into 23 dispatch areas by using the partition approach. The converter station buses of three DC transmission lines are assigned to the No. 5, No. 21, and No. 23 dispatch areas, respectively, while the buses connecting ten AC transmission lines from the external network are assigned to the No. 1, No. 8, No. 15, and No. 16 dispatch areas, respectively. The bus assigned to the No. 15 dispatch area receives a large amount of active power from the external network through the AC transmission lines it connects, about 2 GW. The dispatch areas of the system are illustrated by Figure 8.
The system is recovered with the recovery approach. All of the elements of 220 kV or higher voltage levels are recovered to obtain the detailed information of the dispatch areas, as shown in Figure 9. The simplified connection structure of the dispatch areas is shown in Figure 10. The green circle represents the external network which is not accounted for in the spectral clustering, while the red circles represent the dispatch areas which contain converter stations buses or buses connecting AC transmission lines with a large amount of active power transferred from the external network.
The system is partitioned into five controlled islanding areas by using the spectral clustering algorithm as shown in Figure 11 and Table 1. The bold and underlined numbers of the dispatch areas represent the dispatch areas which contain the buses from sets A and B (as mentioned in Section 2.2). The dispatch areas of No. 5, No. 21 and No. 23 containing the converter station buses of DC transmission lines are assigned to the islanding areas of Area 2, Area 4 and Area 5, respectively. The dispatch area of No. 15 containing the buses connecting AC transmission lines from the external network is assigned to Area 3. Assigning these dispatch areas to different islanding areas can avoid losing too much active power after controlled islanding since they contain buses connecting large active power sources from the external system.

4.2. Evaluation of Structural Strength of Test System

The MESCR index is computed to evaluate the structural strength of the test system after the controlled islanding. As shown in Table 2, five islanding scenarios are evaluated for each of which just one islanding area is isolated, while the normal operating condition is also analyzed. The MIIF data required to compute the MESCR are shown in Appendix A.
The MESCR index for each converter station bus under the normal operating condition is larger than 2.5, which indicates that the test system has a strong structural strength. Nevertheless, the structural strength will be weakened under the controlled islanding conditions. For instance, the smallest value of the MESCR index for the converter station bus 3.1 is 1.50 with the islanding Area 1 isolated, which is the boundary value between the weak and extremely weak categories. Since all of the MESCR values are larger than or equal to 1.50 under various controlled islanding conditions, the system is of a sufficient structural strength to tolerate the interactions between AC and DC subsystems, which verifies the feasibility of the controlled islanding strategy.
The root cause of the weakening strength after the controlled islanding is the structural characteristics of the test system. The system is of even stronger electrical connections by building the UHV AC network within it, from which the isolation of any part will pose certain structural deterioration. Since various islanding areas are of distinct electrical distances relative to the UHV AC network, the impact of isolating each of them on the system is quite different. For instance, Area 1 is just located at the core of the UHV AC network, while Area 4 is of a large electrical distance from the UHV AC network. It is clear that the MESCR values drop most when Area 1 is isolated, while the MESCR index has the smallest reduction degree for the isolation of Area 4, as shown in Table 2.

4.3. Assessment of Dynamic Performance of Test System

Dynamic performance of the test system after controlled islanding is assessed through time-domain simulations. As highlighted in Figure 11, three extremely serious faults occurring in various islanding areas are mimicked, respectively, which are the three-phase short circuit on a 500 kV double-circuit transmission line of Line 1 in Area 4, three-phase short circuit on a 500 kV transmission line of Line 3 in Area 1, and three-phase short circuit on a 1000 kV transmission line of Line 4 in Area 2. Scenarios are simulated where the main protection steps for each of the above lines refuse to operate and the faults are cleared by tripping the respective lines through the backup protection with a time delay of 0.5 s.
Dynamics of vital variables are monitored for each fault, which include voltages of end buses on cut-sets between the area to be isolated and other islanding areas, the frequency of all islanding areas, rotor angles of major generators with a rated power larger than or equal to 300 MW, and the DC power on three HVDC lines. Dynamics of the test system are shown in Figure 12 and Figure 13, which is under the scenario that the three-phase short circuit occurs on Line 1 in Area 4.
The evolving dynamic trajectories of the system are shown in Figure 12. The column (I) represents the trajectories without controlled islanding, the column (II) represents the trajectories of all islanding areas with controlled islanding, and the column (III) represents the trajectories of the remaining areas except Area 4 with controlled islanding. The system will experience transient instability, voltage collapse, and frequency collapse without controlled islanding. Compared to this situation, the remaining areas of the system with Area 4 isolated can be stabilized by using the controlled islanding strategy.
Operating states of three HVDC lines of the system are monitored. DC power on one polar of the HVDC lines is shown in Figure 13. The lines are of the rated DC power before the fault. The lines are all blocked for protection after the fault without controlled islanding, which is triggered by the deep voltage dropping at the buses of converter stations. DC power on the lines drops to zero after blocking. With the controlled islanding strategy actuated, HVDC line 2 and line 3 are operated normally and DC power on them can maintain the rated value. Nevertheless, HVDC line 1 is blocked since it is sited in Area 4.
Dynamics of the test system under the other two scenarios where the three-phase short circuit occurs on Line 3 in Area 1 and on Line 4 in Area 2 are shown in Appendix B. For each scenario, the test system can be prevented from further deterioration and stabilized after controlled islanding, which verifies the efficacy and adaptability of the controlled islanding strategy.

5. Conclusions

An efficient controlled islanding strategy for large-scale AC/DC power systems is proposed in this paper. The three-stage method including reduction, partition, and recovery can significantly reduce the structural complexity of the power system while preserving the detailed data of dispatch areas. The controlled islanding areas can then be efficiently obtained through clustering the dispatch areas by using the spectral clustering algorithm. Verification of the controlled islanding strategy is necessary to ensure the steady-state characteristics and dynamic performance of the power system. Case study results demonstrate the feasibility, efficacy, and adaptability of the controlled islanding strategy.

Author Contributions

C.S. and X.C. proposed the controlled islanding strategy; C.S. and X.C. conducted the experiments and simulations; C.S. and X.C. analyzed the data; C.S. and X.C. wrote the manuscript; L.M., X.W., X.L., L.W., B.Z. and C.W. provided the test system data and helped revise the manuscript.

Funding

This work was supported in part by the Science and Technology Projects of State Grid Shandong Electric Power Company (SGSDWF00FCJS1600449) and National Key Research and Development Program of China (2017YFB0902600).

Acknowledgments

The authors would like to thank the anonymous reviewers for the valuable comments.

Conflicts of Interest

The authors declare no conflict of interest.

Abbreviations

The following abbreviations are used in this manuscript:
UFLSUnder Frequency Load Shedding
UVLSUnder Voltage Load Shedding
HVDCHigh Voltage Direct Current
EHVExtra High Voltage
UHVUltra High Voltage
BFSBreadth First Search
MESCRMulti-infeed Effective Short Circuit Ratio
MSCRMulti-infeed Short Circuit Ratio
MIIFMulti-infeed Interaction Factor
SCSynchronous Compensator
SVCStatic Var Compensator
STATCOMStatic Synchronous Compensator

Appendix A

The MIIF calculation result of a variety of conditions in Section 4.2 is given in Table A1, Table A2, Table A3, Table A4, Table A5 and Table A6.
Table A1. The multi-infeed interaction factor (MIIF) of converter station buses in the normal condition.
Converter Station BusConverter Station Bus 1Converter Station Bus 2.1Converter Station Bus 2.2Converter Station Bus 3.1Converter Station Bus 3.2
Converter station bus 110.4030.3850.3270.376
Converter station bus 2.10.34510.2860.1960.267
Converter station bus 2.20.3960.34510.3340.665
Converter station bus 3.10.3980.3280.39810.416
Converter station bus 3.20.3870.3280.6670.3461
Table A2. The MIIF of converter station buses with Area 1 to be isolated.
Converter Station BusConverter Station Bus 1Converter Station Bus 2.1Converter Station Bus 2.2Converter Station Bus 3.1Converter Station Bus 3.2
Converter station bus 110.6810.7750.5700.785
Converter station bus 2.10.53210.5840.3850.558
Converter station bus 2.20.5730.56210.5200.836
Converter station bus 3.10.6490.5510.74210.809
Converter station bus 3.20.5480.5010.7780.5321
Table A3. The MIIF of converter station buses with Area 2 to be isolated.
Converter Station BusConverter Station Bus 1Converter Station Bus 2.1Converter Station Bus 2.2
Converter station bus 110.5530.509
Converter station bus 2.10.61510.654
Converter station bus 2.20.4970.7181
Table A4. The MIIF of converter station buses with Area 3 to be isolated.
Converter Station Bus Converter Station Bus 1Converter Station Bus 2.1Converter Station Bus 2.2Converter Station Bus 3.1Converter Station Bus 3.2
Converter station bus 110.6700.7600.5950.691
Converter station bus 2.10.57310.4610.3800.476
Converter station bus 2.20.5980.57710.5800.859
Converter station bus 3.10.7910.5840.77310.770
Converter station bus 3.20.6420.5150.7830.5431
Table A5. The MIIF of converter station buses with Area 4 to be isolated.
Converter Station Bus Converter Station Bus 2.1Converter Station Bus 2.2Converter Station Bus 3.1Converter Station Bus 3.2
Converter station bus 2.110.3890.2300.332
Converter station bus 2.20.47110.4060.695
Converter station bus 3.10.3160.47810.522
Converter station bus 3.20.4060.7080.4521
Table A6. The MIIF of converter station buses with Area 5 to be isolated.
Converter Station BusConverter Station Bus 1Converter Station Bus 3.1Converter Station Bus 3.2
Converter station bus 110.4390.756
Converter station bus 2.10.63810.576
Converter station bus 2.20.5820.5481

Appendix B

Dynamics of the test system are shown in Figure A1 and Figure A2, which is under the scenario that the three-phase short circuit occurs on Line 3 in Area 1.
Figure A1. Dynamic trajectories of the test system. (a) Rotor angles of major generators (°); (b) Voltages of end buses on cut-sets (p.u.); (c) System frequency (Hz).
Energies 11 01483 g0a1aEnergies 11 01483 g0a1b
Figure A2. DC power on HVDC lines. (a) HVDC Line 1; (b). HVDC Line 2; (c) HVDC Line 3.
Energies 11 01483 g0a2
Dynamics of the test system are shown in Figure A3 and Figure A4, which is under the scenario that the three-phase short circuit occurs on Line 3 in Area 2.
Figure A3. Dynamic trajectories of the test system. (a) Rotor angles of major generators (°); (b) Voltages of end buses on cut-sets (p.u.); (c) System frequency (Hz).
Energies 11 01483 g0a3
Figure A4. DC power on HVDC lines. (a) HVDC Line 1; (b) HVDC Line 2; (c) HVDC Line 3.
Energies 11 01483 g0a4

References

  1. Gungor, V.C.; Sahin, D.; Kocak, T.; Ergut, S.; Buccella, C.; Cecati, C.; Hancke, G.P. Smart grid technologies: Communication technologies and standards. IEEE Trans. Ind. Inform. 2011, 7, 529–539. [Google Scholar] [CrossRef]
  2. Kristmundsson, G.M.; Carroll, D.P. The effect of AC systems frequency spectrum on commutation failure in HVDC inverters. IEEE Trans. Power Deliv. 1990, 5, 1121–1128. [Google Scholar] [CrossRef]
  3. Lefebvre, C.S.; Gole, A.M.; Reeve, J.; Pilotto, L.; Martins, N.; Bhattacharya, S. Working group on dynamic performance and modeling of dc systems and power electronics for transmission systems report on test systems for AC/DC interaction studies. IEEE Trans. Power Deliv. 1995, 10, 2027–2034. [Google Scholar] [CrossRef]
  4. Yang, Y.; Duan, Q.; Wu, G.; Chen, R.; Li, L.; An, Z.; Ni, J.; Shen, C. Slow coherency based adaptive controlled islanding scheme of the China southern power grid. In Proceedings of the 2015 IEEE PES Asia-Pacific Power and Energy Engineering Conference (APPEEC), Beijing, China, 12–14 April 2015; pp. 1–5. [Google Scholar]
  5. Sun, K.; Zheng, D.; Lu, Q. Searching for feasible splitting strategies of controlled system islanding. IET Gener. Transm. Distrib. 2006, 153, 89–98. [Google Scholar] [CrossRef]
  6. CIGRE Working Group B4 41. Systems with Multiple DC Infeed; CIGRE: Paris, France, 2008. [Google Scholar]
  7. Reiman, A.P.; McDermott, T.E.; Akcakaya, M.; Reed, G.F. Electric power distribution system model simplification using segment substitution. IEEE Trans. Power Syst. 2017, 10, 1–8. [Google Scholar] [CrossRef]
  8. Tugliea, E.; Cagnanob, A.; Torelli, F. Dynamic identification of external equivalents in distribution networks. Electr. Power Syst. Res. 2011, 81, 1197–1205. [Google Scholar] [CrossRef]
  9. Shen, C.; Wu, X.; Wu, J.; Qiao, Y.; Lu, Q. An efficient method of network simplification for islanding control studies of power systems. In Proceedings of the 2006 International Conference on Power System Technology, Chongqing, China, 22–26 October 2006; pp. 1–6. [Google Scholar]
  10. Quintana, V.H.; Muller, N. Partitioning of power networks and applications to security control. IET Gener. Transm. Distrib. 1991, 138, 535–545. [Google Scholar] [CrossRef]
  11. Sun, K.; Zheng, D.; Lu, Q. Splitting strategies for islanding operation of large-scale power systems using OBDD-based methods. IEEE Trans. Power Syst. 2003, 18, 912–923. [Google Scholar] [CrossRef]
  12. Zhao, Q.; Sun, K.; Zheng, D.; Ma, J.; Lu, Q. A study of system splitting strategies for island operation of power system: A two-phase method based on OBDD. IEEE Trans. Power Syst. 2003, 18, 1556–1565. [Google Scholar] [CrossRef]
  13. Sun, K.; Zheng, D.; Lu, Q. A simulation study of OBDD-based proper splitting strategies for power systems under consideration of transient stability. IEEE Trans. Power Syst. 2005, 20, 389–399. [Google Scholar] [CrossRef]
  14. Faucon, O.; Dousset, L. Coordinated defense plan protects against transient instabilities. IEEE Comput. Appl. Power. 1997, 10, 22–26. [Google Scholar] [CrossRef]
  15. Awadalla, M.; Papadopoulos, P.N.; Milanović, J.V. An approach to controlled islanding based on PMU measurements. In Proceedings of the 2017 IEEE Manchester PowerTech, Manchester, UK, 18–22 June 2017; pp. 1–6. [Google Scholar]
  16. Aghamohammadi, M.R.; Shahmohammadi, A. Intentional islanding using a new algorithm based on ant search mechanism. Int. J. Elect. Power Energy Syst. 2012, 35, 138–147. [Google Scholar] [CrossRef]
  17. Tang, F.; Zhou, H.; Wu, Q.; Qin, H.; Jia, J.; Guo, K. A tabu search algorithm for the power system islanding problem. Energies 2015, 8, 11315–11341. [Google Scholar] [CrossRef]
  18. Senroy, N.; Heydt, G.T.; Vittal, V. Decision tree assisted controlled islanding. IEEE Tran. Power Syst. 2006, 21, 1790–1797. [Google Scholar] [CrossRef]
  19. Shao, D.; Xu, Y.; Xi, J.; Zhang, S.; Wang, Y.; He, C. Controlled islanding strategy of central China power grid based on branch potential energy. In Proceedings of the 2016 IEEE PES Asia-Pacific Power and Energy Conference, Xi’an, China, 25–28 October 2016; pp. 1792–1796. [Google Scholar]
  20. Song, H.; Wu, J.; Wu, L. Controlled islanding based on slow-coherency and KWP theory. In Proceedings of the 2012 Innovative Smart Grid Technologies–Asia, Tianjin, China, 21–24 May 2012; pp. 1–6. [Google Scholar]
  21. Jabari, F.; Seyedi, H.; Ravadanegh, S.N. Large-scale power system controlled islanding based on Backward Elimination Method and Primary Maximum Expansion Areas considering static voltage stability. Int. J. Elect. Power Energy Syst. 2015, 67, 368–380. [Google Scholar] [CrossRef]
  22. Kyriacou, A.; Demetriou, P.; Panayiotou, C.; Kyriakides, E. Controlled islanding solution for large-scale power systems. IEEE Trans. Power Syst. 2018, 33, 1591–1602. [Google Scholar] [CrossRef]
  23. Isazadeh, G.; Khodabakhshian, A.; Gholipour, E. New intelligent controlled islanding scheme in large interconnected power systems. IET Gener. Transm. Distrib. 2015, 9, 2686–2696. [Google Scholar] [CrossRef]
  24. Lin, W.; Tang, Y. Analysis of influencing factors of short circuit ratio of multi-infeed AC/DC power systems. In Proceedings of the 5th International Conference on Electric Utility Deregulation and Restructuring and Power Technologies, Changsha, China, 26–29 November 2015; pp. 1–3. [Google Scholar]
  25. Lin, W.; Tang, Y.; Bu, G.; Shao, Y. Voltage stability analysis of multi-infeed AC/DC power system based on multi-infeed short circuit ratio. In Proceedings of the 2010 International Conference on Power System Technology, Hangzhou, China, 24–28 October 2010; pp. 1–6. [Google Scholar]
  26. Li, E.; Chu, X.; Wang, M. Static voltage stability analysis for multi-infeed HVDC systems based on multivariate regression. In Proceedings of the 2016 IEEE PES Asia-Pacific Power and Energy Conference, Xi’an China, 25–28 October 2016; pp. 130–134. [Google Scholar]
  27. Acar, U.A.; Charguéraud, A.; Rainey, M. A work-efficient algorithm for parallel unordered depth-first search. In Proceedings of the International Conference for High Performance Computing, Networking, Storage and Analysis, Austin, TX, USA, 15–20 November 2015; pp. 1–12. [Google Scholar]
  28. Lin, Z.; Wen, F.; Ding, Y.; Xue, Y. Data-driven coherency identification for generators based on spectral clustering. IEEE Trans. Ind. Inform. 2017, 14, 1275–1285. [Google Scholar] [CrossRef]
  29. Jiang, T.; Bai, L.; Jia, H.; Li, F. Spectral clustering-based partitioning of volt/VAR control areas in bulk power systems. IET Gener. Transm. Distrib. 2017, 11, 1126–1133. [Google Scholar] [CrossRef]
  30. Guo, J.; Tonguz, O.; Hug, G. Impact of power system partitioning on the efficiency of distributed multi-step optimization. In Proceedings of the 2017 IEEE Manchester PowerTech, Manchester, UK, 18–22 June 2017; pp. 1–6. [Google Scholar]
  31. Demetriou, P.; Quirós-Tortó, J.; Kyriakides, E.; Terzija, V. On implementing a spectral clustering controlled islanding algorithm in real power systems. In Proceedings of the 2013 IEEE Grenoble Powertech, Grenoble, France, 16–20 June 2013; pp. 1–6. [Google Scholar]
  32. Quirós-Tortós, J.; Sánchez-García, R.; Brodzki, J.; Janusz, B.; Terzija, V. Constrained spectral clustering-based methodology for intentional controlled islanding of large-scale power systems. IET Gener. Transm. Distrib. 2015, 9, 31–42. [Google Scholar] [CrossRef] [Green Version]
  33. Esmaeilian, A.; Kezunovic, M. Controlled islanding to prevent cascade outages using constrained spectral k-embedded clustering. In Proceedings of the 2016 Power Systems Computation Conference, Genoa, Italy, 20–24 June 2016; pp. 1–6. [Google Scholar]
  34. Yang, J.; Tang, F.; Wang, Y.; Chen, E.; Liu, F. An optimal controlled partitioning scheme based on semi-supervised spectral clustering algorithm. Power Syst. Technol. 2015, 39, 242–249. [Google Scholar]
  35. Wu, Z.; Zhou, X. Power system analysis software package (PSASP)—An integrated power system analysis tool. In Proceedings of the 1998 Power System Technology International Conference, Beijing, China, 18–21 August 1998; pp. 7–11. [Google Scholar]
Figure 1. Reduction of power system. (a) Original power system; (b) Reduced power system.
Energies 11 01483 g001
Figure 2. Schematic diagram of the breadth-first search (BFS) algorithm.
Energies 11 01483 g002
Figure 3. Dispatch areas of the partial power system.
Energies 11 01483 g003
Figure 4. Detailed dispatch areas of a partial power system.
Energies 11 01483 g004
Figure 5. Flowchart of the controlled islanding strategy.
Energies 11 01483 g005
Figure 6. Network structure of the test system.
Energies 11 01483 g006
Figure 7. Network structure of the reduced system.
Energies 11 01483 g007
Figure 8. Dispatch areas of the test system.
Energies 11 01483 g008
Figure 9. Recovered dispatch areas of the test system.
Energies 11 01483 g009
Figure 10. Connection structure of the dispatch areas.
Energies 11 01483 g010
Figure 11. Controlled islanding areas of the test system.
Energies 11 01483 g011
Figure 12. Dynamic trajectories of the test system. (a) Rotor angles of major generators (°); (b) Voltages of end buses on cut-sets (p.u.); (c) System frequency (Hz).
Energies 11 01483 g012
Figure 13. DC power on high voltage direct current (HVDC) lines. (a) HVDC Line 1; (b) HVDC Line 2; (c) HVDC Line 3.
Energies 11 01483 g013
Table 1. Controlled islanding areas.
Islanding AreaDispatch Areas Assigned into It
11, 2, 3, 4
25, 6, 7
38, 9, 10, 11, 12, 13, 14, 15, 16, 17, 18
419, 20, 21, 22
523
Table 2. Multi-infeed effective short circuit ratio (MESCR) of converter stations in various conditions.
Power System ConditionConverter Station Bus 1Converter Station Bus 2.1Converter Station Bus 2.2Converter Station Bus 3.1Converter Station Bus 3.2
Normal condition3.332.912.642.702.62
Area 1 to be isolated1.761.651.671.501.56
Area 2 to be isolated2.231.911.69N/AN/A
Area 3 to be isolated1.771.671.641.511.61
Area 4 to be isolatedN/A2.442.492.372.49
Area 5 to be isolated2.23N/AN/A1.911.69

