Day Ahead Real Time Pricing and Critical Peak Pricing Based Power Scheduling for Smart Homes with Different Duty Cycles


Abstract
:1. Introduction
- The reduction of electricity cost and minimization of PAR based on the consumer defined priorities for each appliance.
- A hybrid meta-heuristic technique is developed to optimize the schedule of shift-able appliances for achieving less electricity cost along with minimum waiting time for maximum user comfort.
- HT, TLBO and EDE are implemented for multiple homes to analyze the performance of each algorithm against for different number of appliances.
- Extensive simulations in MATLAB are performed to check the performance of HT, TLBO and EDE against electricity consumption cost, PAR, and waiting time.
2. Related Work
3. Problem Description
4. Problem Formulation
- = Cost of ith appliance at time slot t
- = Waiting time of ith appliance at time slot t
- s.t.
5. System Model
5.1. Day-Ahead Real Time Pricing
5.2. Critical Peak Pricing
6. Proposed Solution
6.1. Teacher Learning Based Optimization
6.2. Enhanced Differential Evolution
6.3. Hybrid Technique
| Algorithm 1: HT |
|
7. Results and Discussion
7.1. Performance Comparison
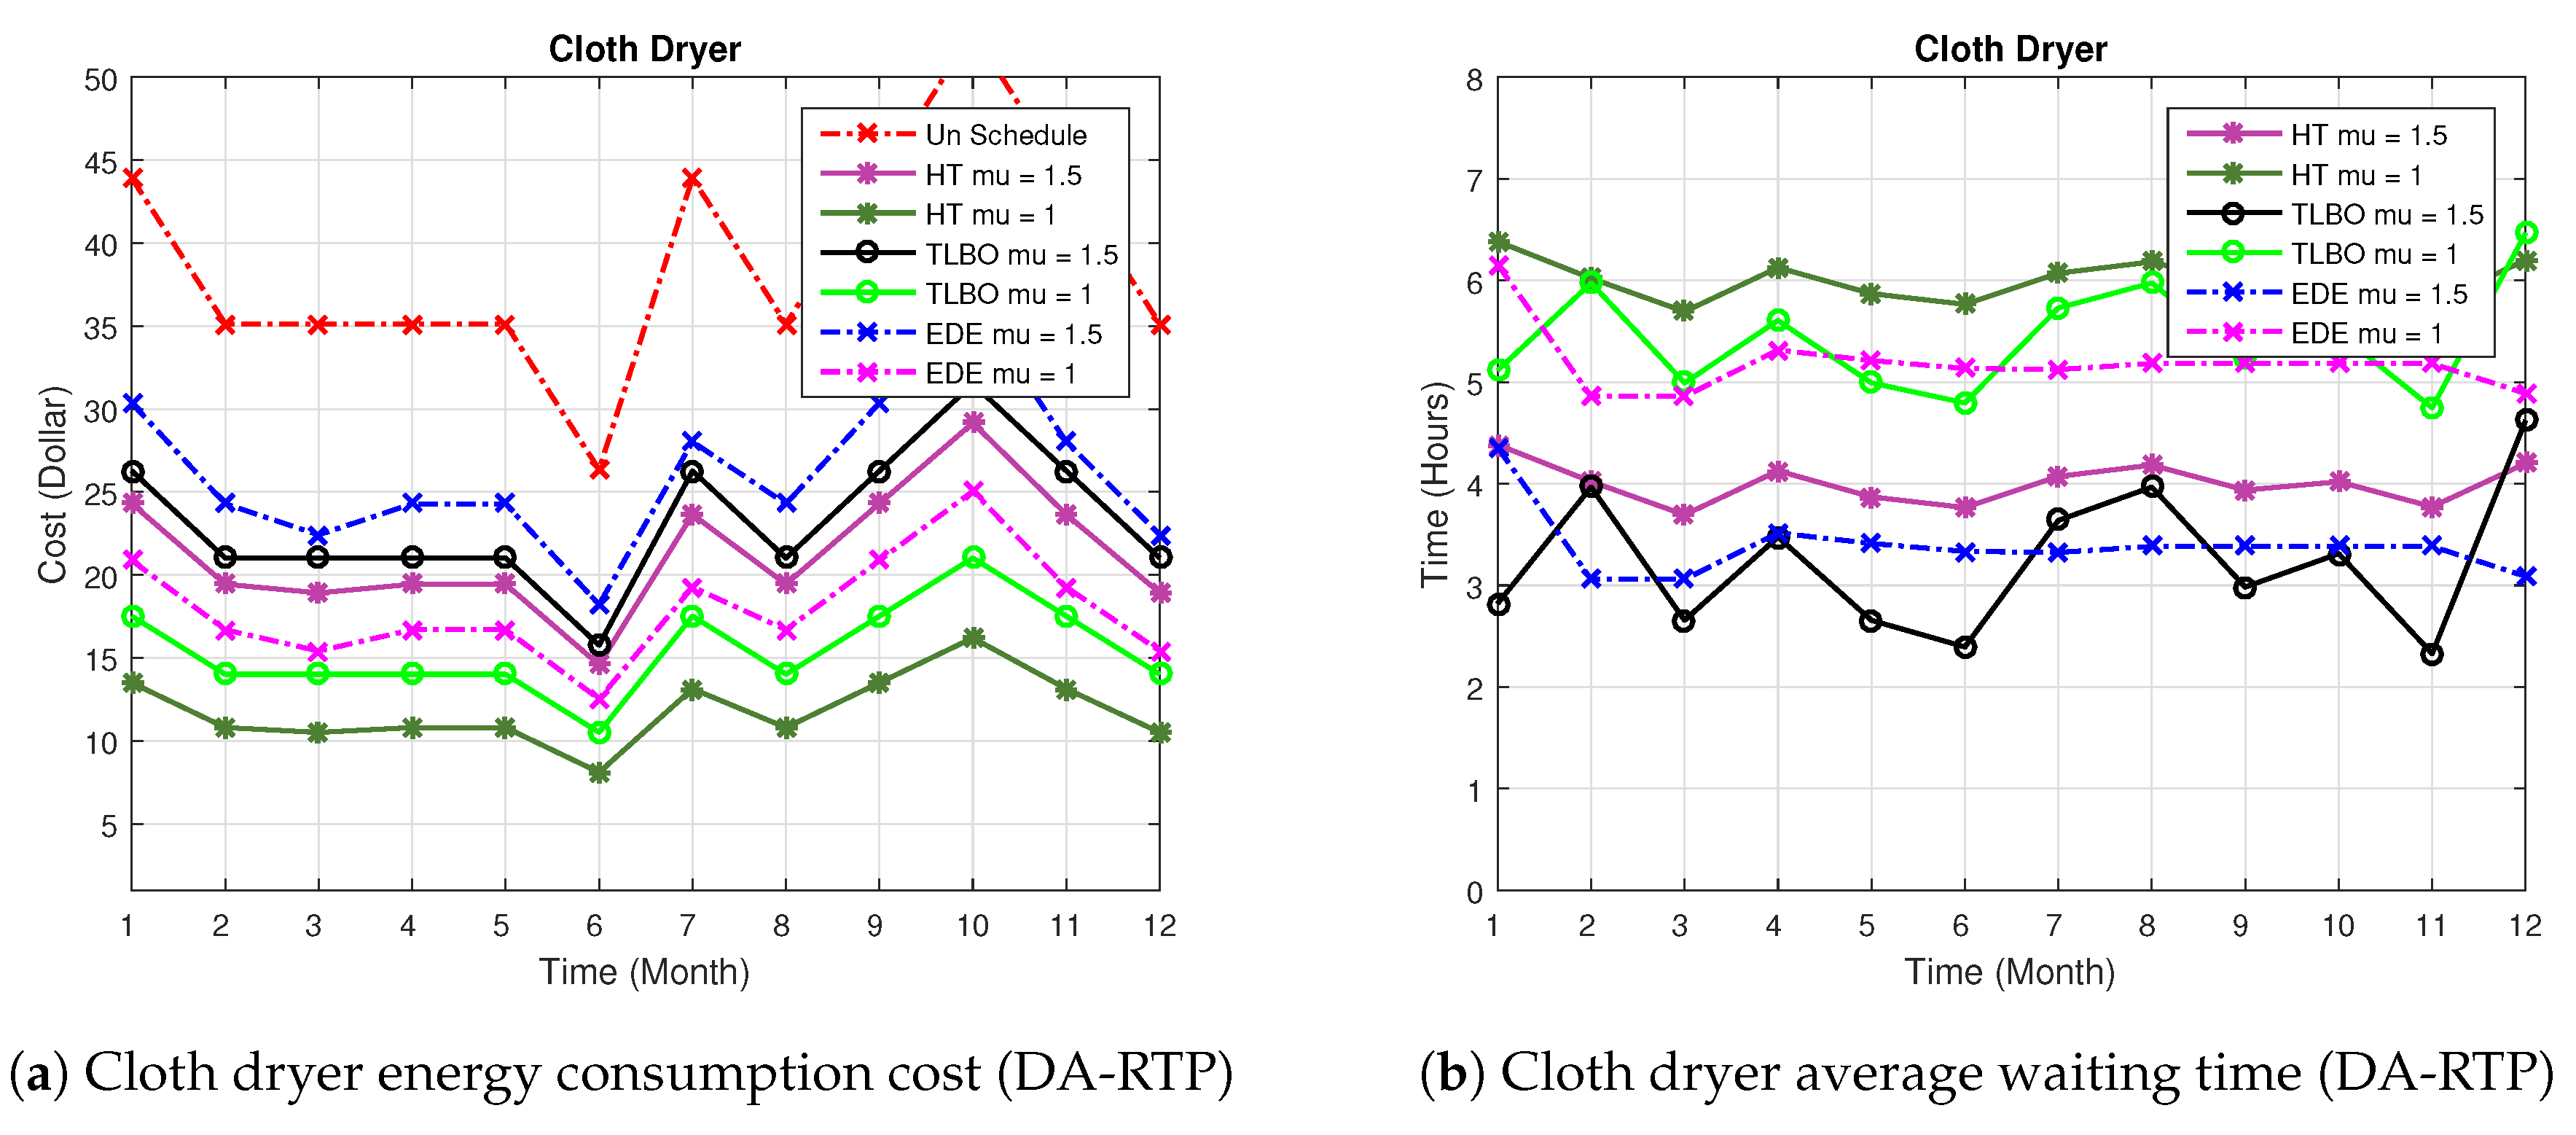
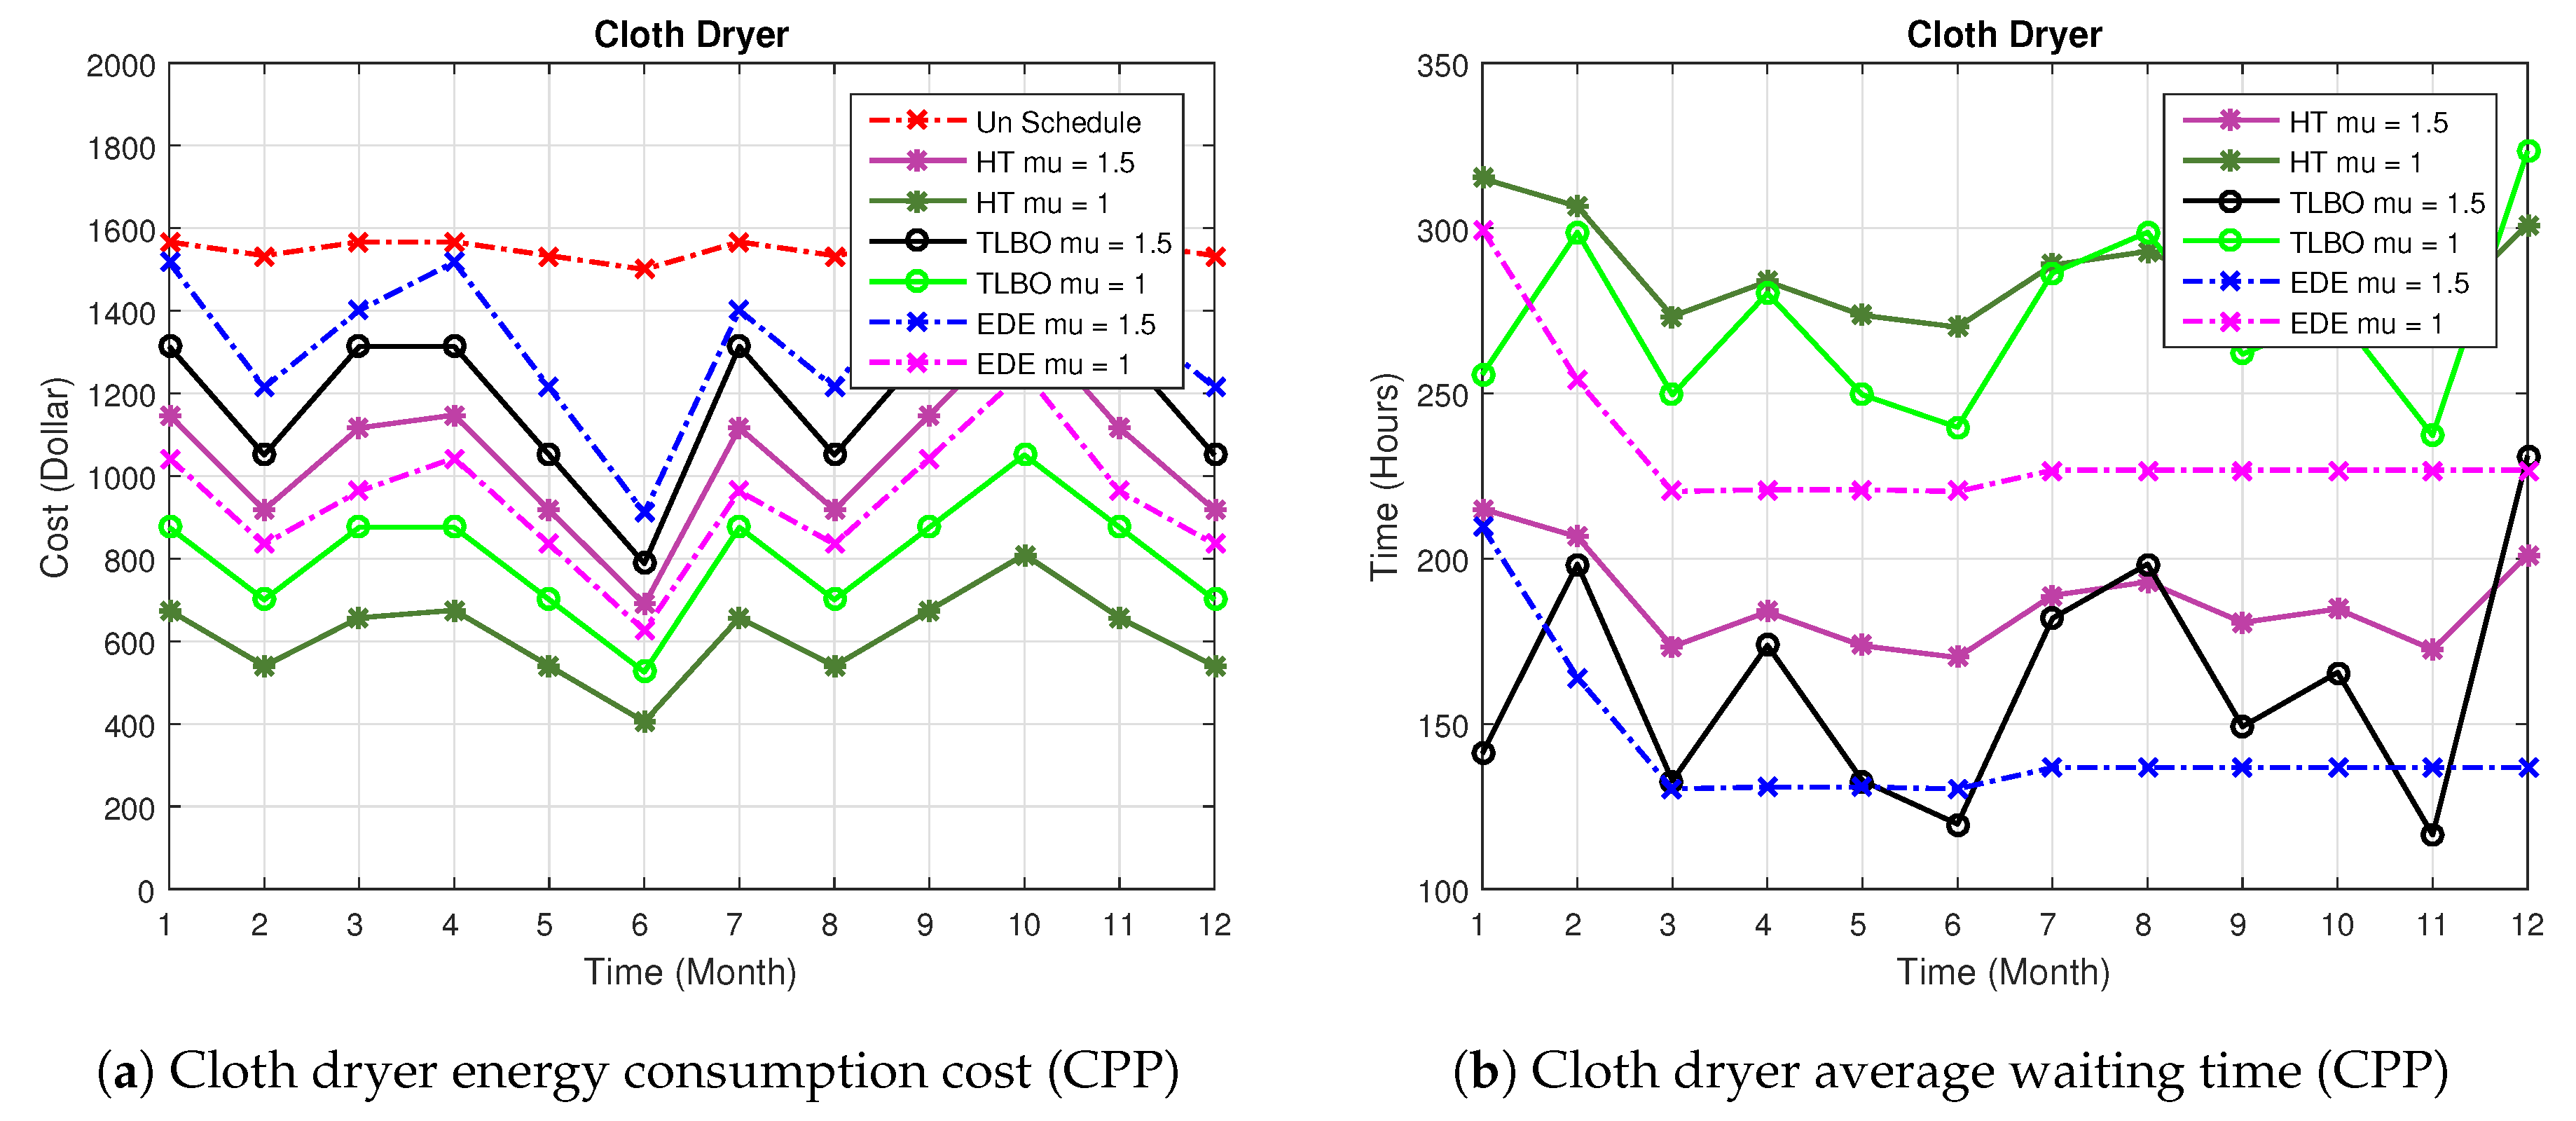
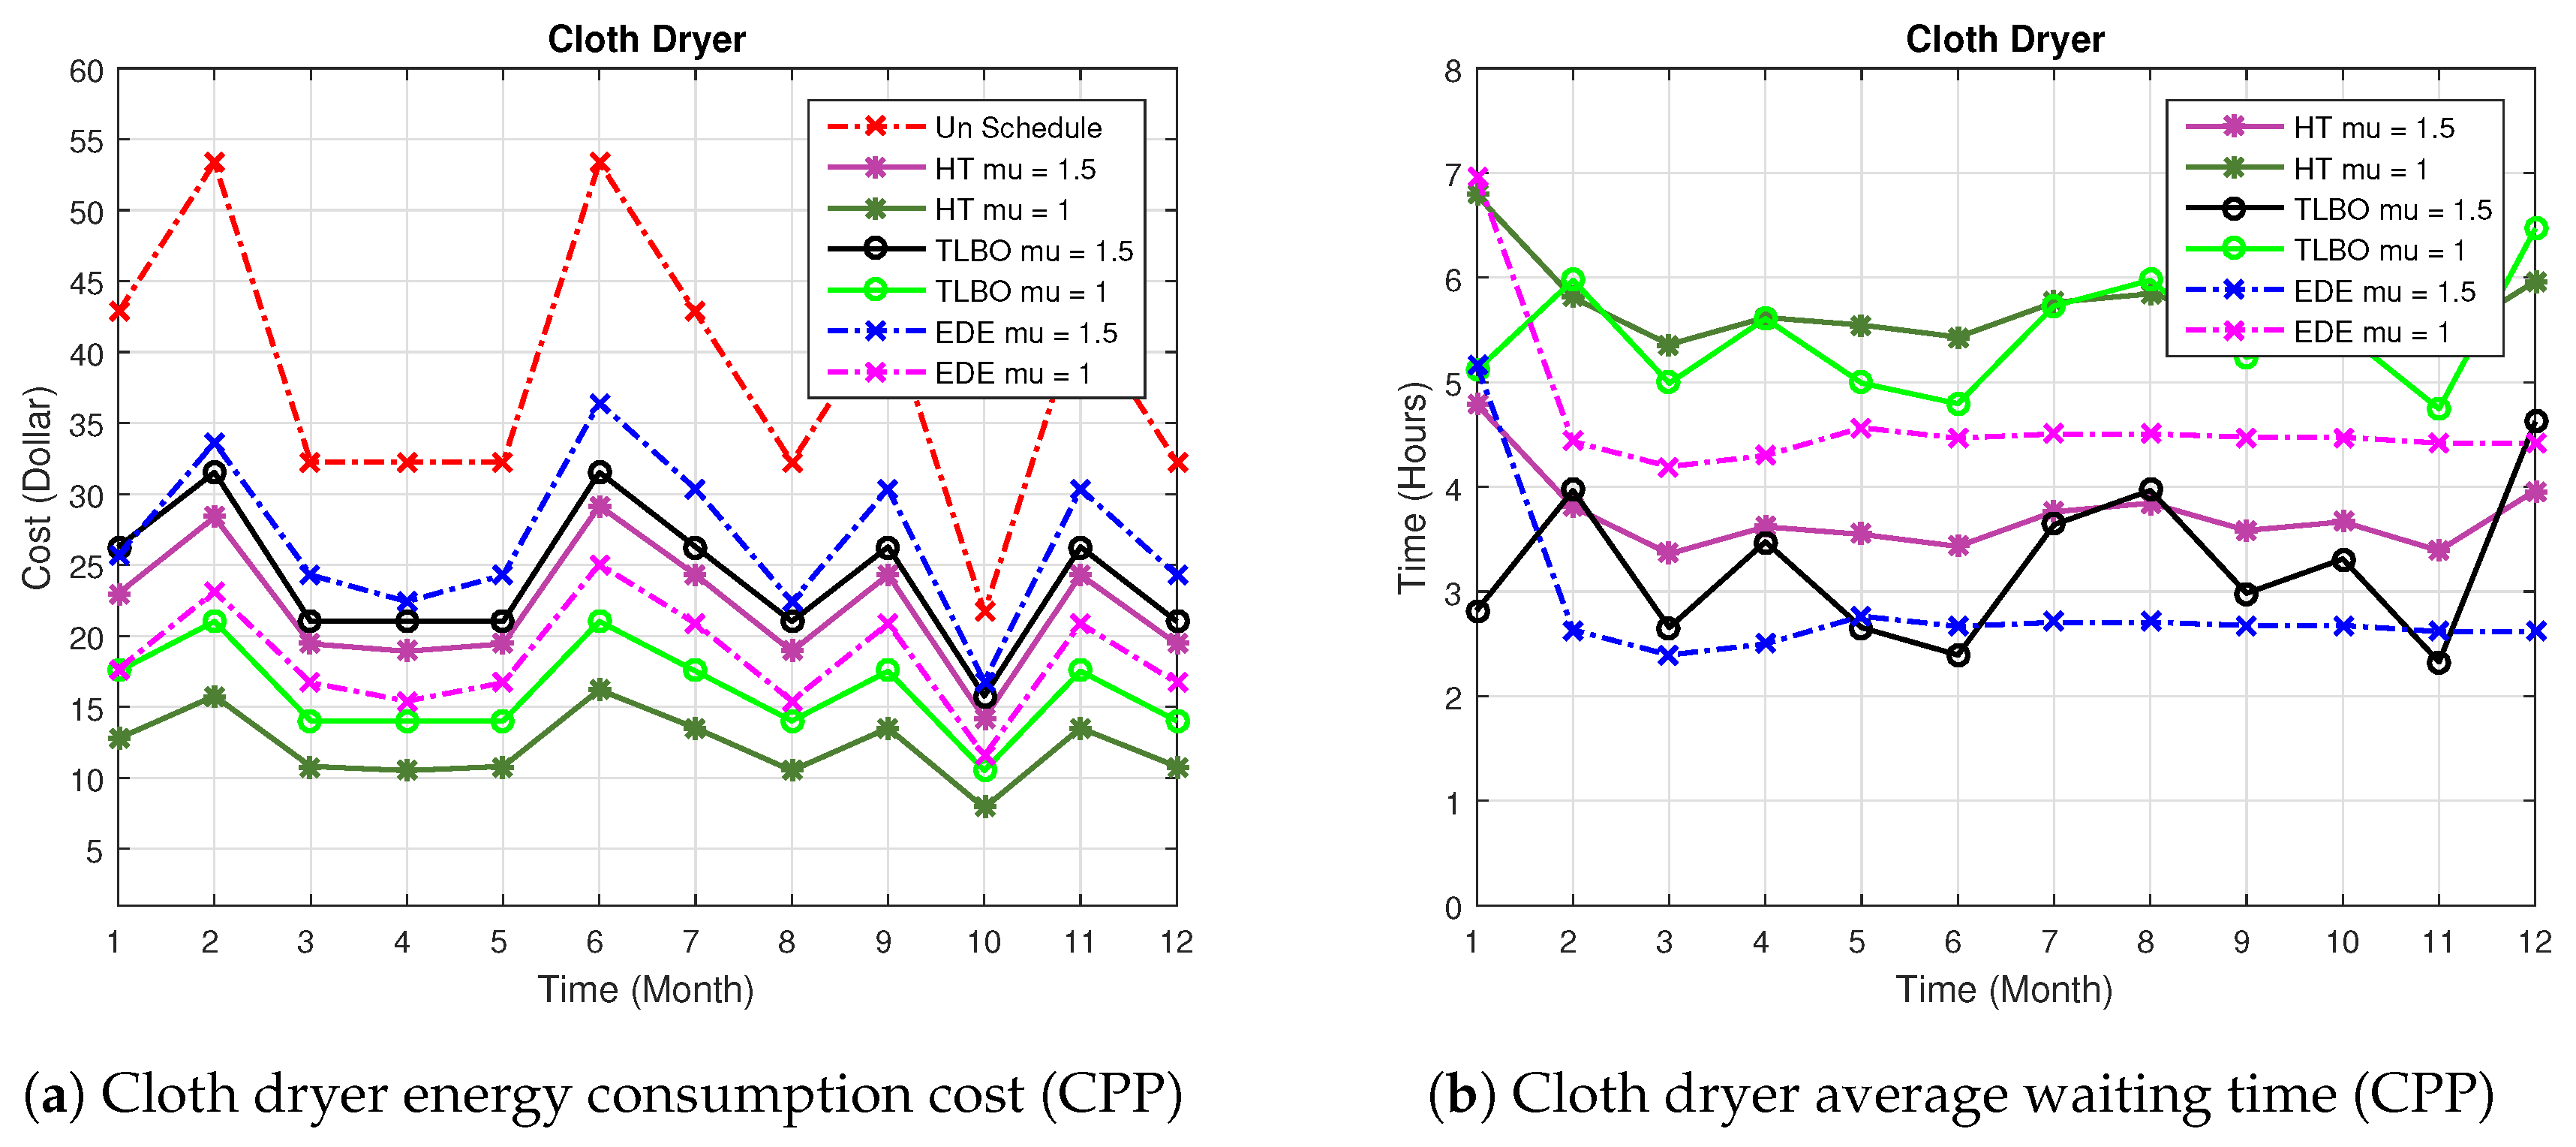
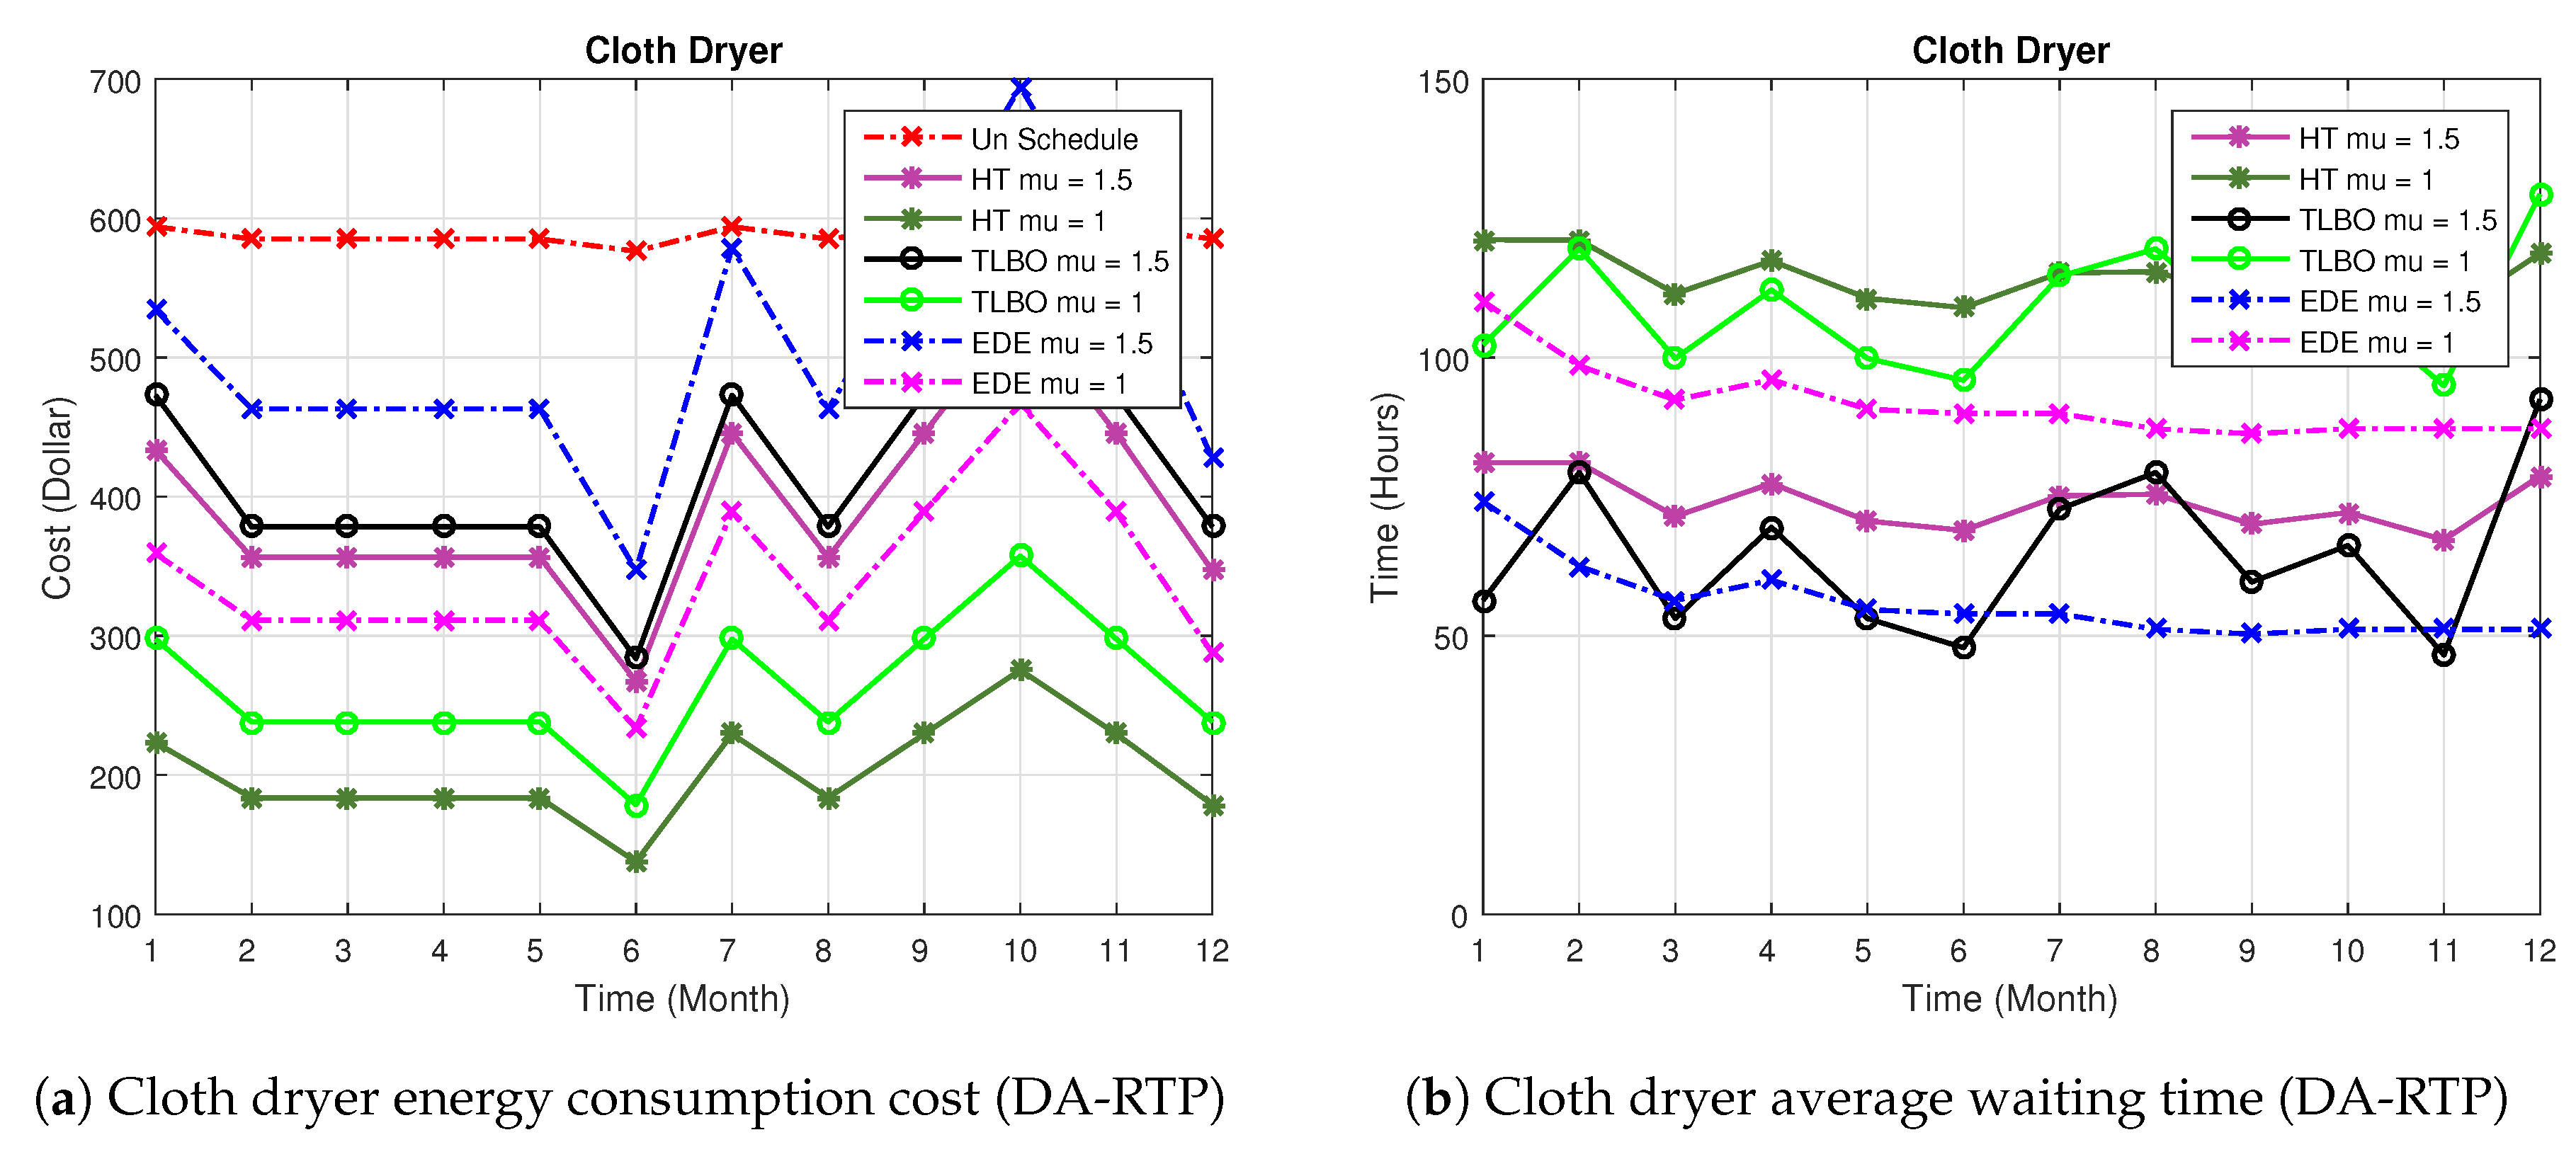
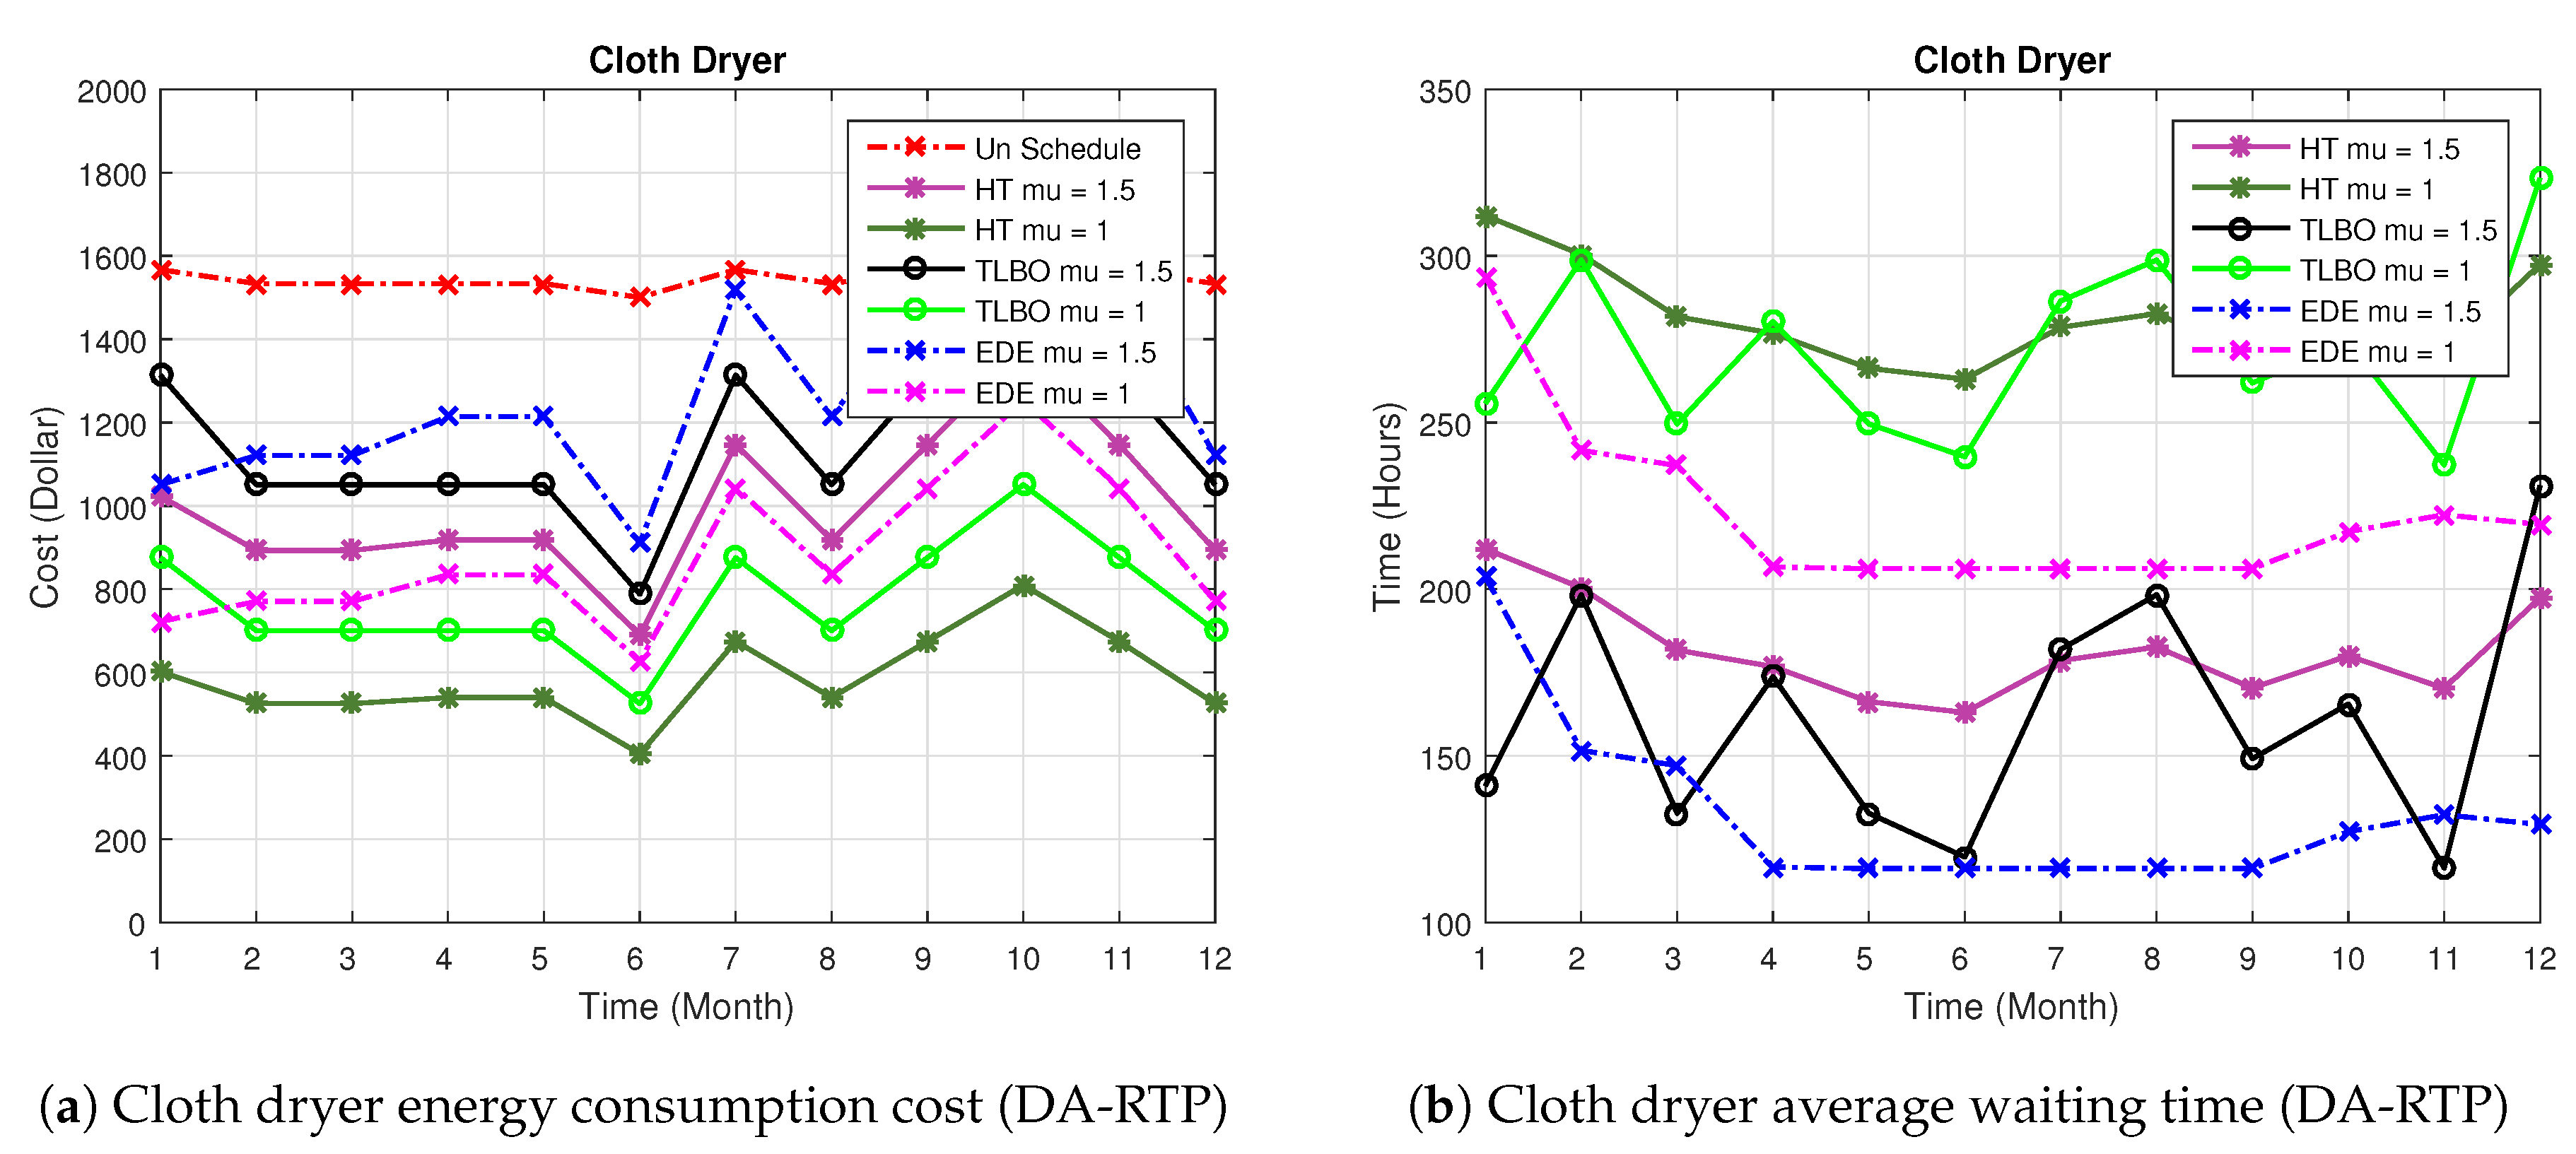
- Cloth DryerWe consider cloth dryer for scheduling due to its higher flexibility. The performance of cloth dryer is presented in Figure 2a,b. Simulation results for cloth dryer are summarized in Table 2 and Table 3. In the case of HT, cost is 45% reduced as compared to the unscheduled cost with priority 1.5. By decreasing the appliance priority to 1.0, the cost is further reduced up to 60%. We compare EDE and TLBO with the unscheduled cost; results show that reduction in cost is 33% and 40% with priority 1.5 and show 53% and 60% reduction in the cost when priority is 1.0. However, EDE and TLBO avarage waiting time is 2.83 and 3.25 h, respectively when the priority is 1.0, which is less than the delay time of HT.In the second scenario, the same number of appliances is considered with CPP. It reduces the risk of high price in RTP. Simulation results for cost and average waiting time are shown in Figure 3a,b. When CPP signal is used, cloth dryer shows 42% and 65% reduction in cost using HT. TLBO and EDE show 37% and 28% decrease in cost, respectively with the priority of 1.5. When the priority of appliances is reduced to 1.0, TLBO and EDE show reduction in cost 58% and 50%, respectively.
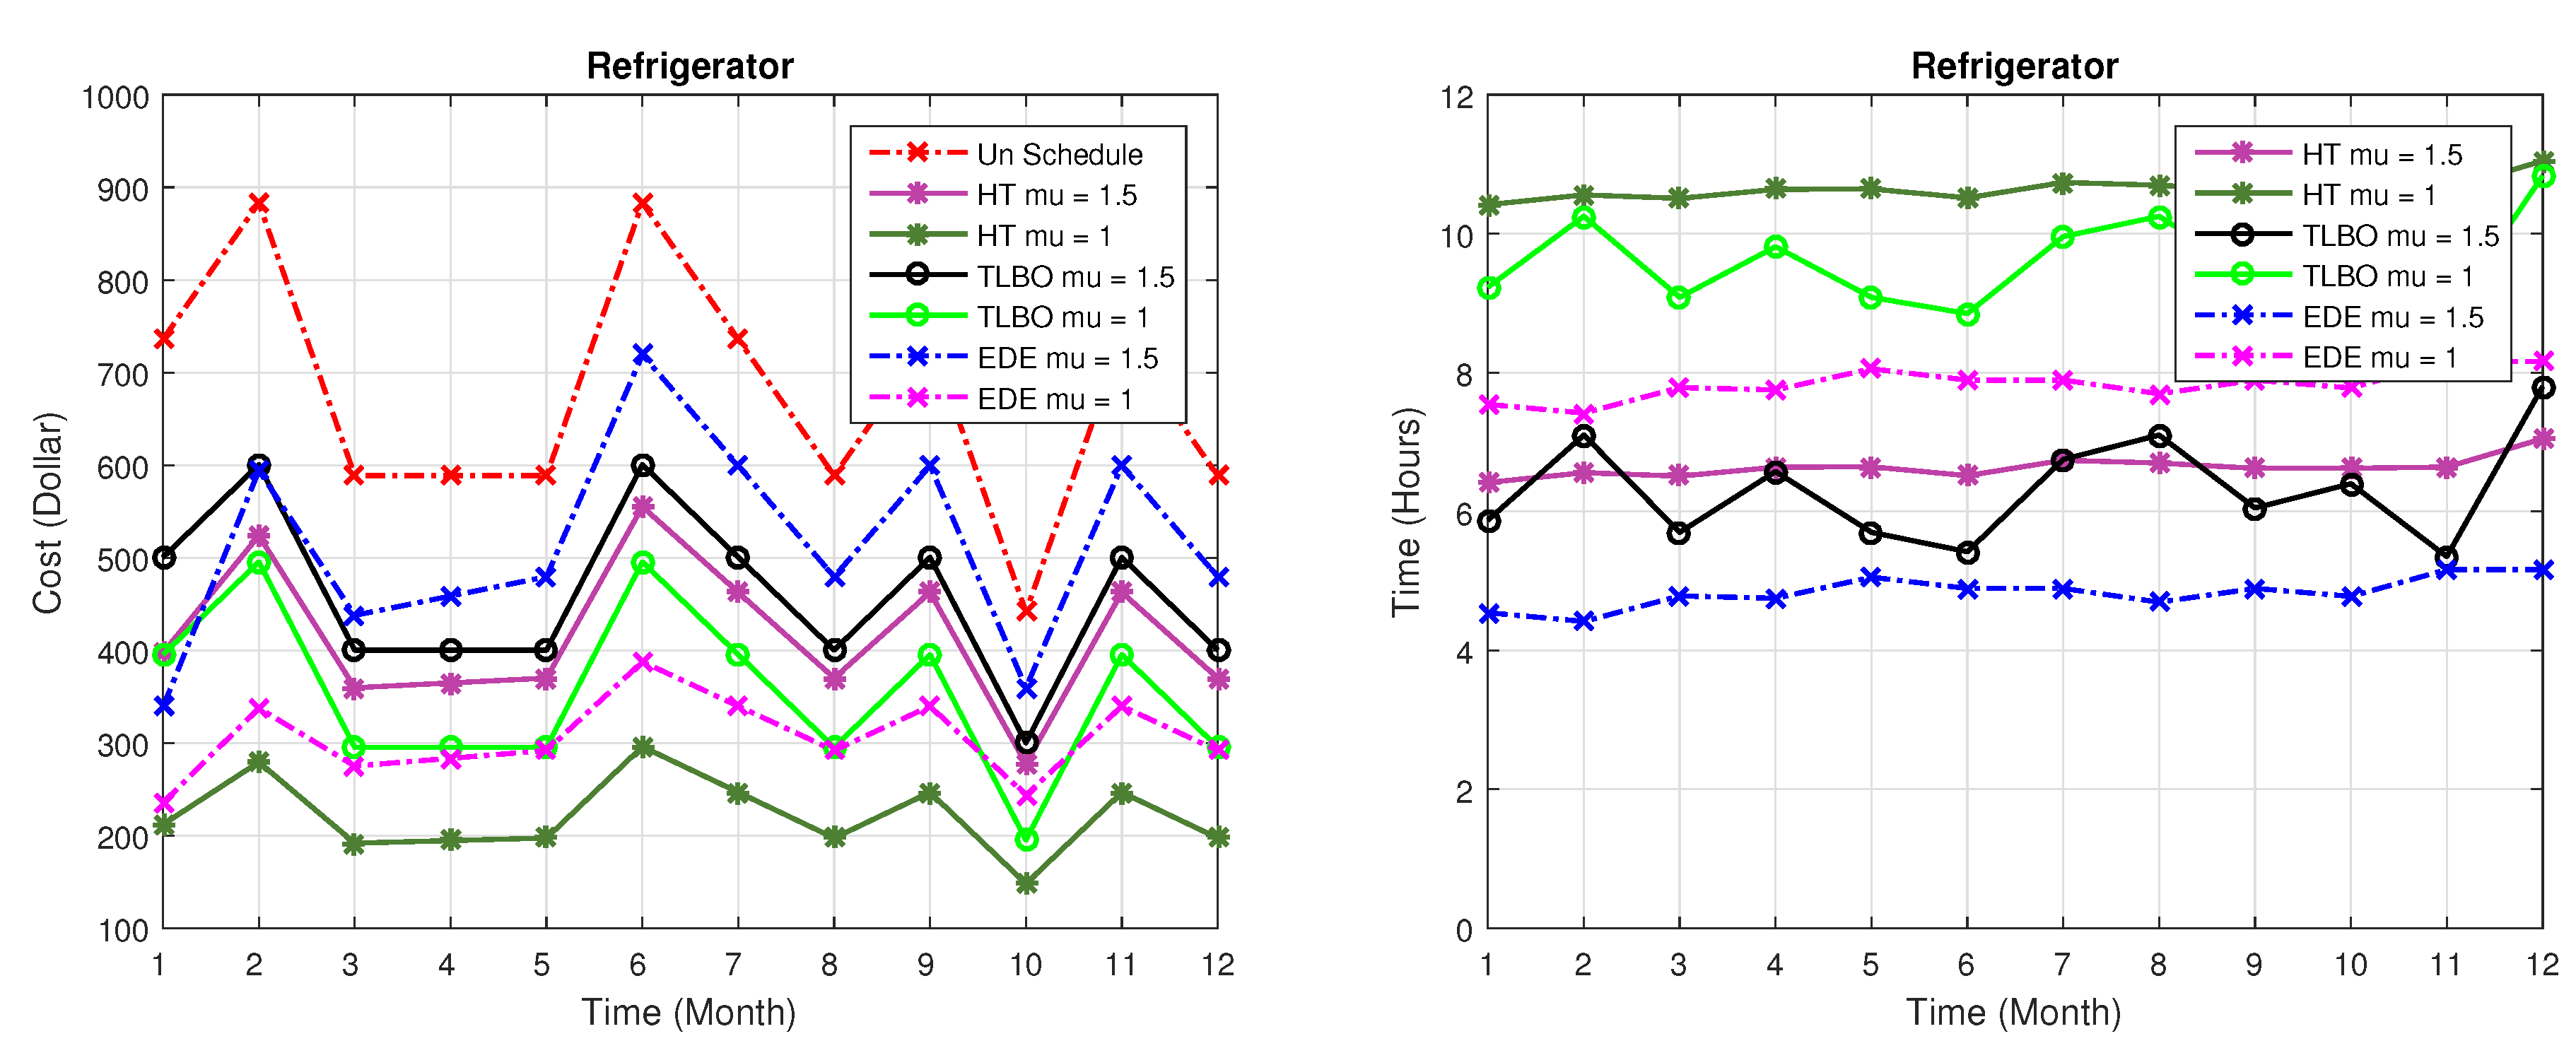
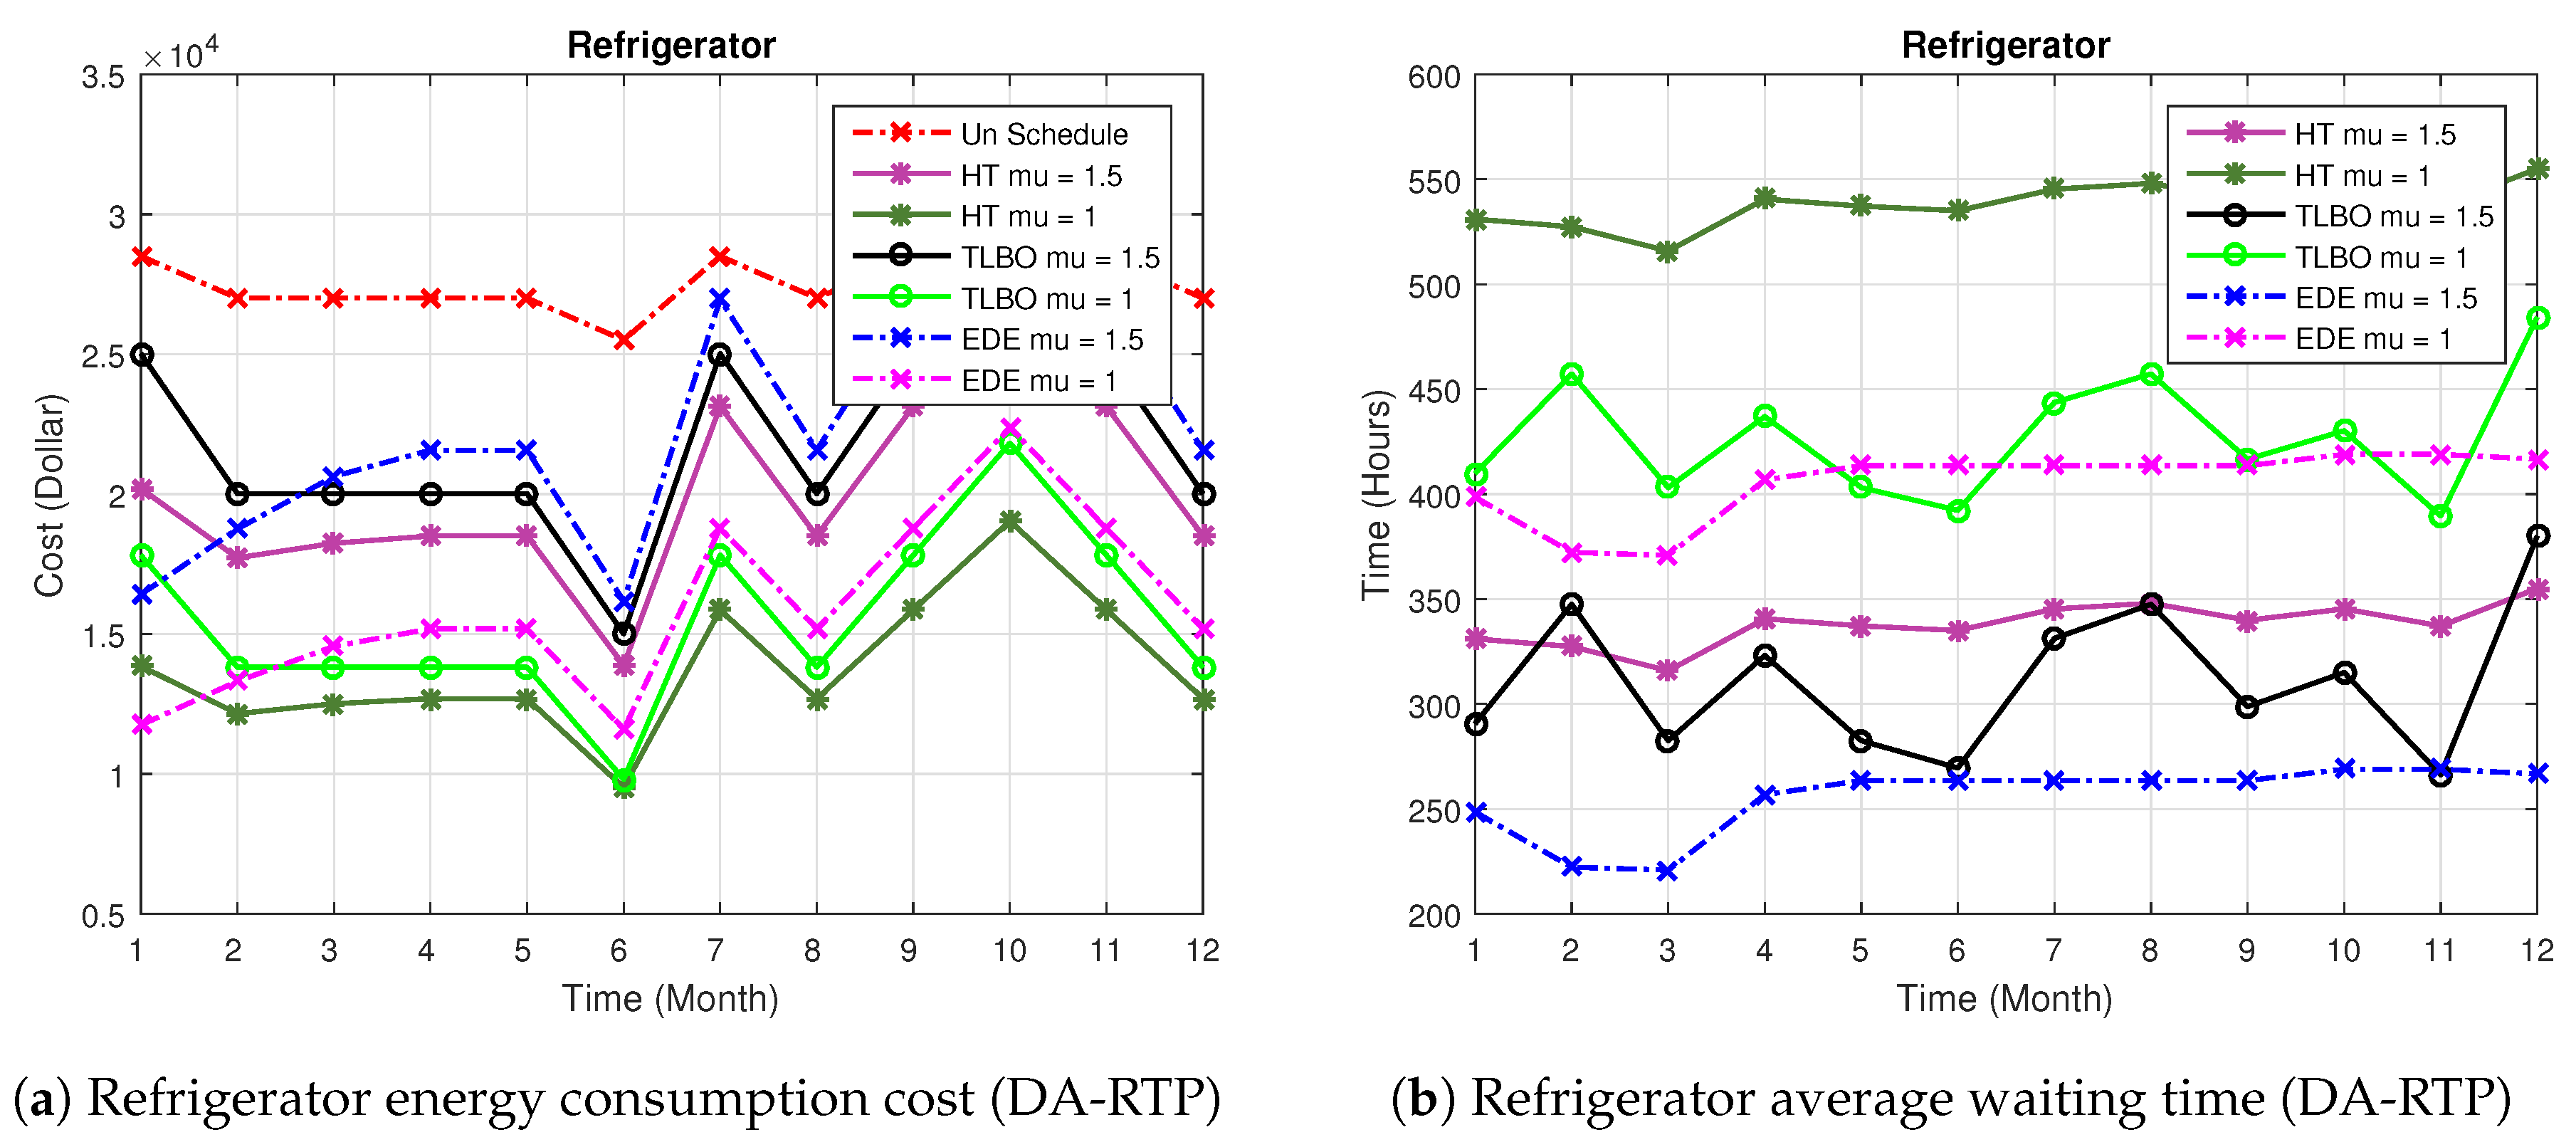
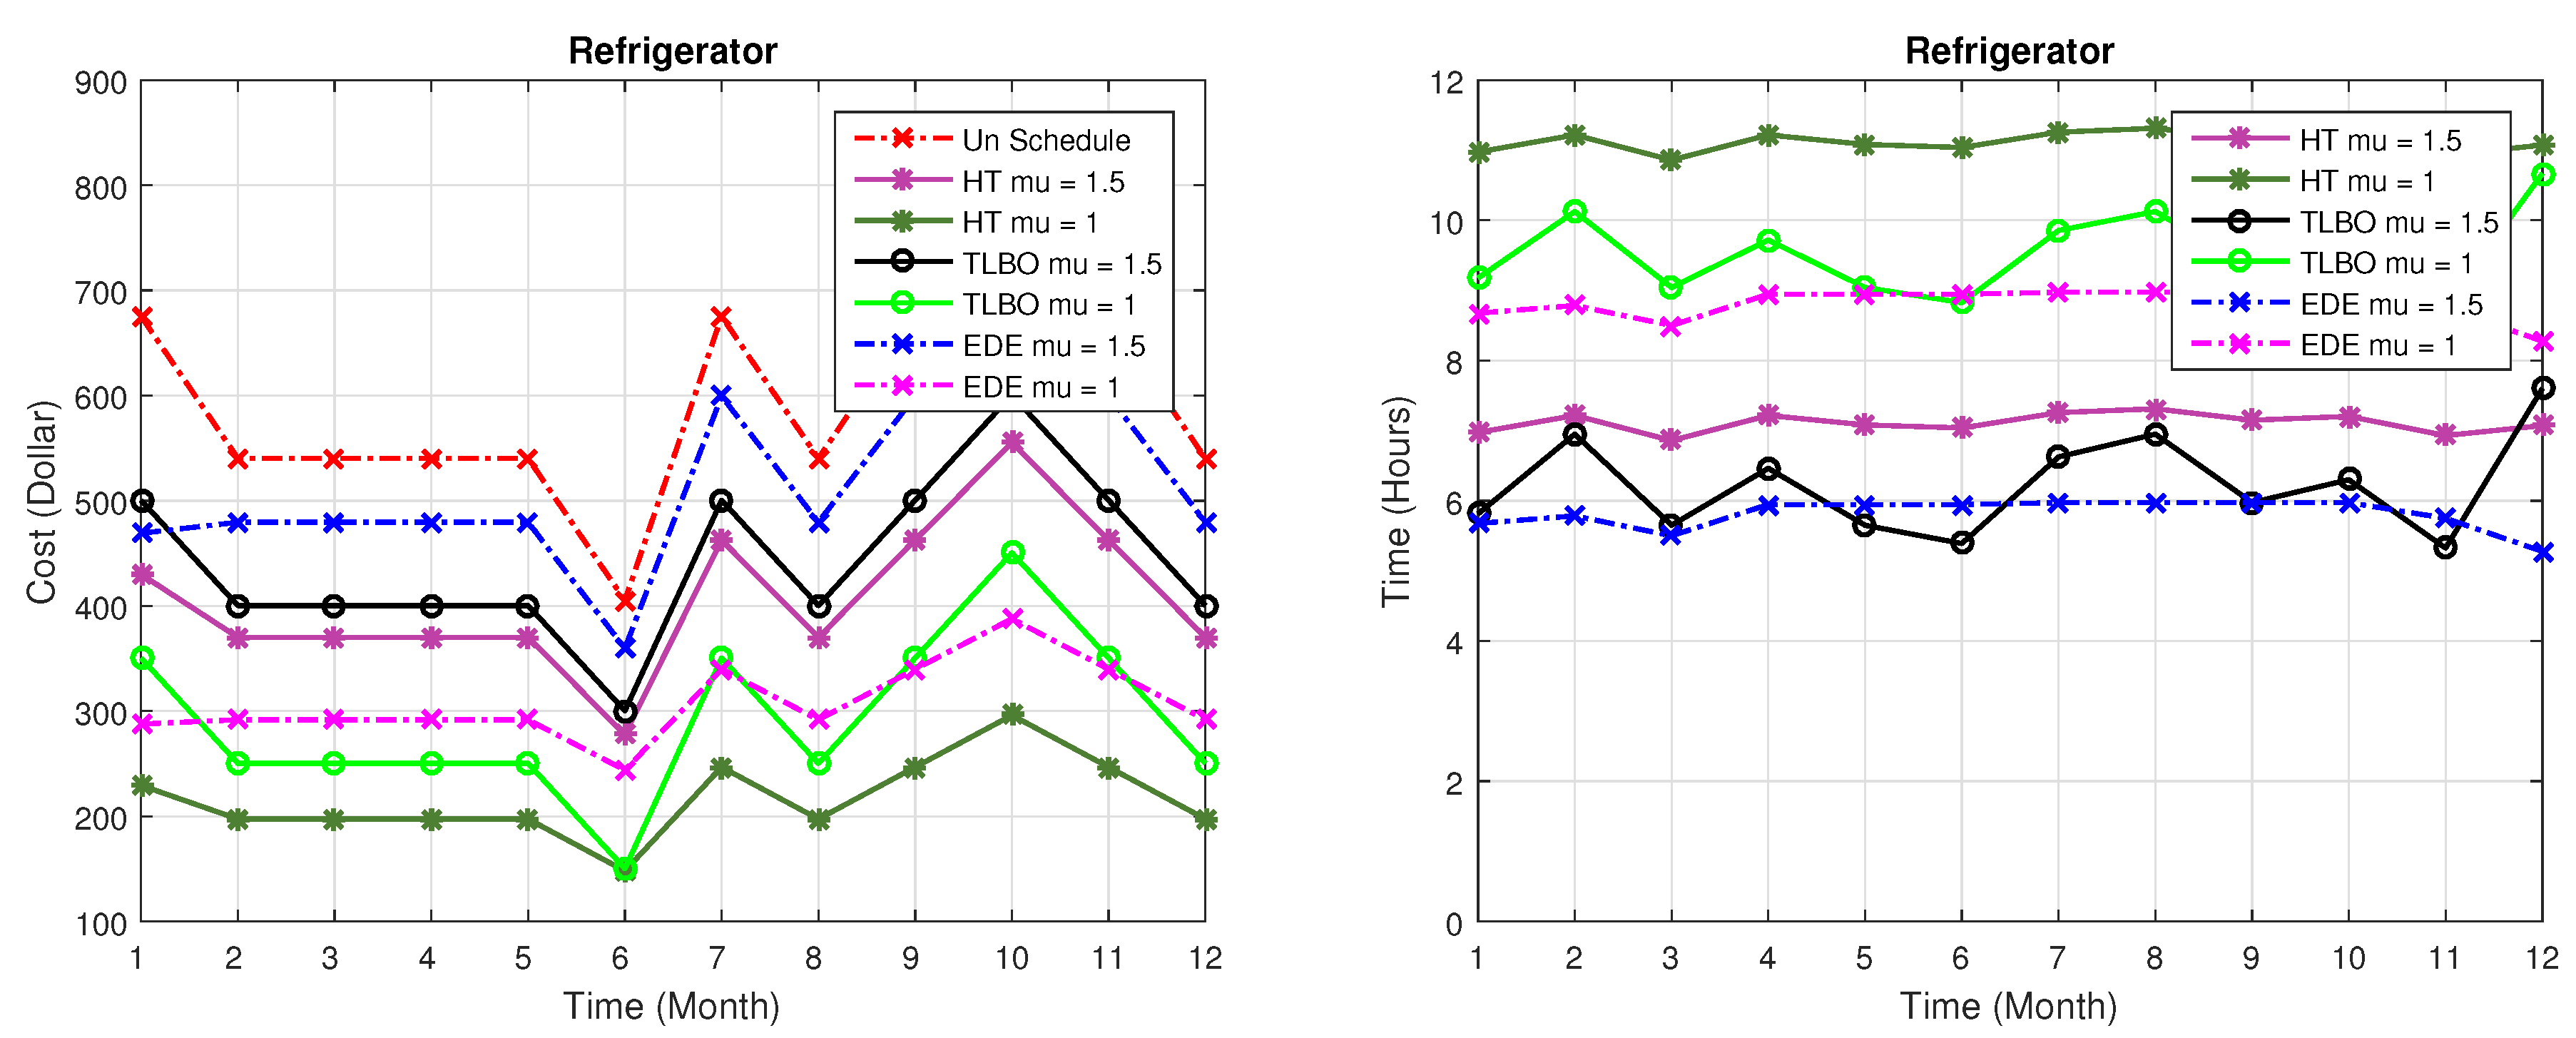
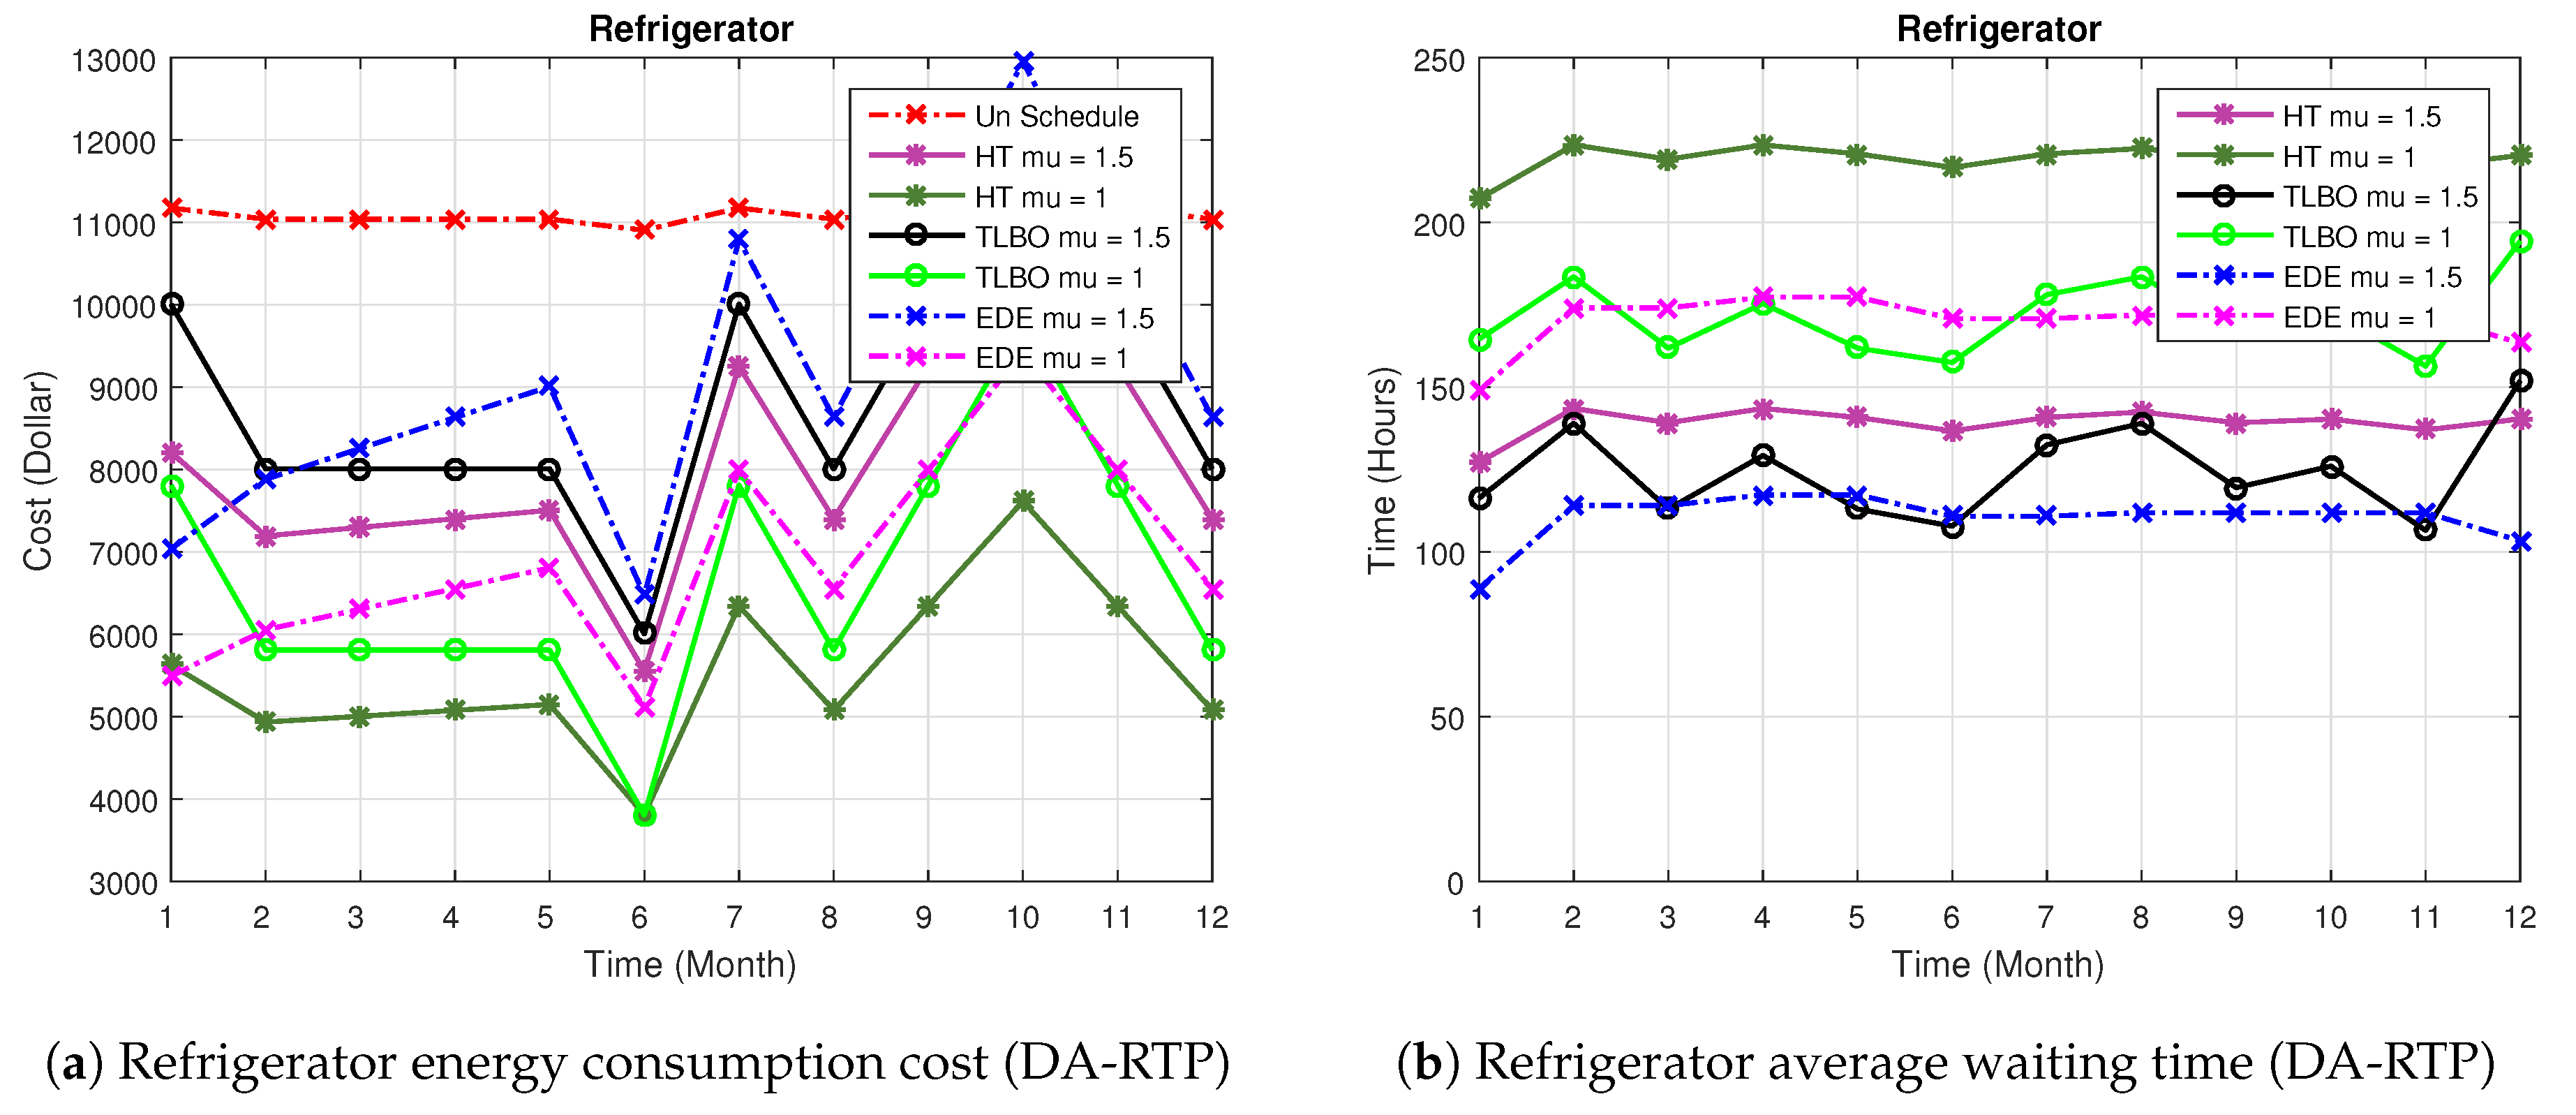
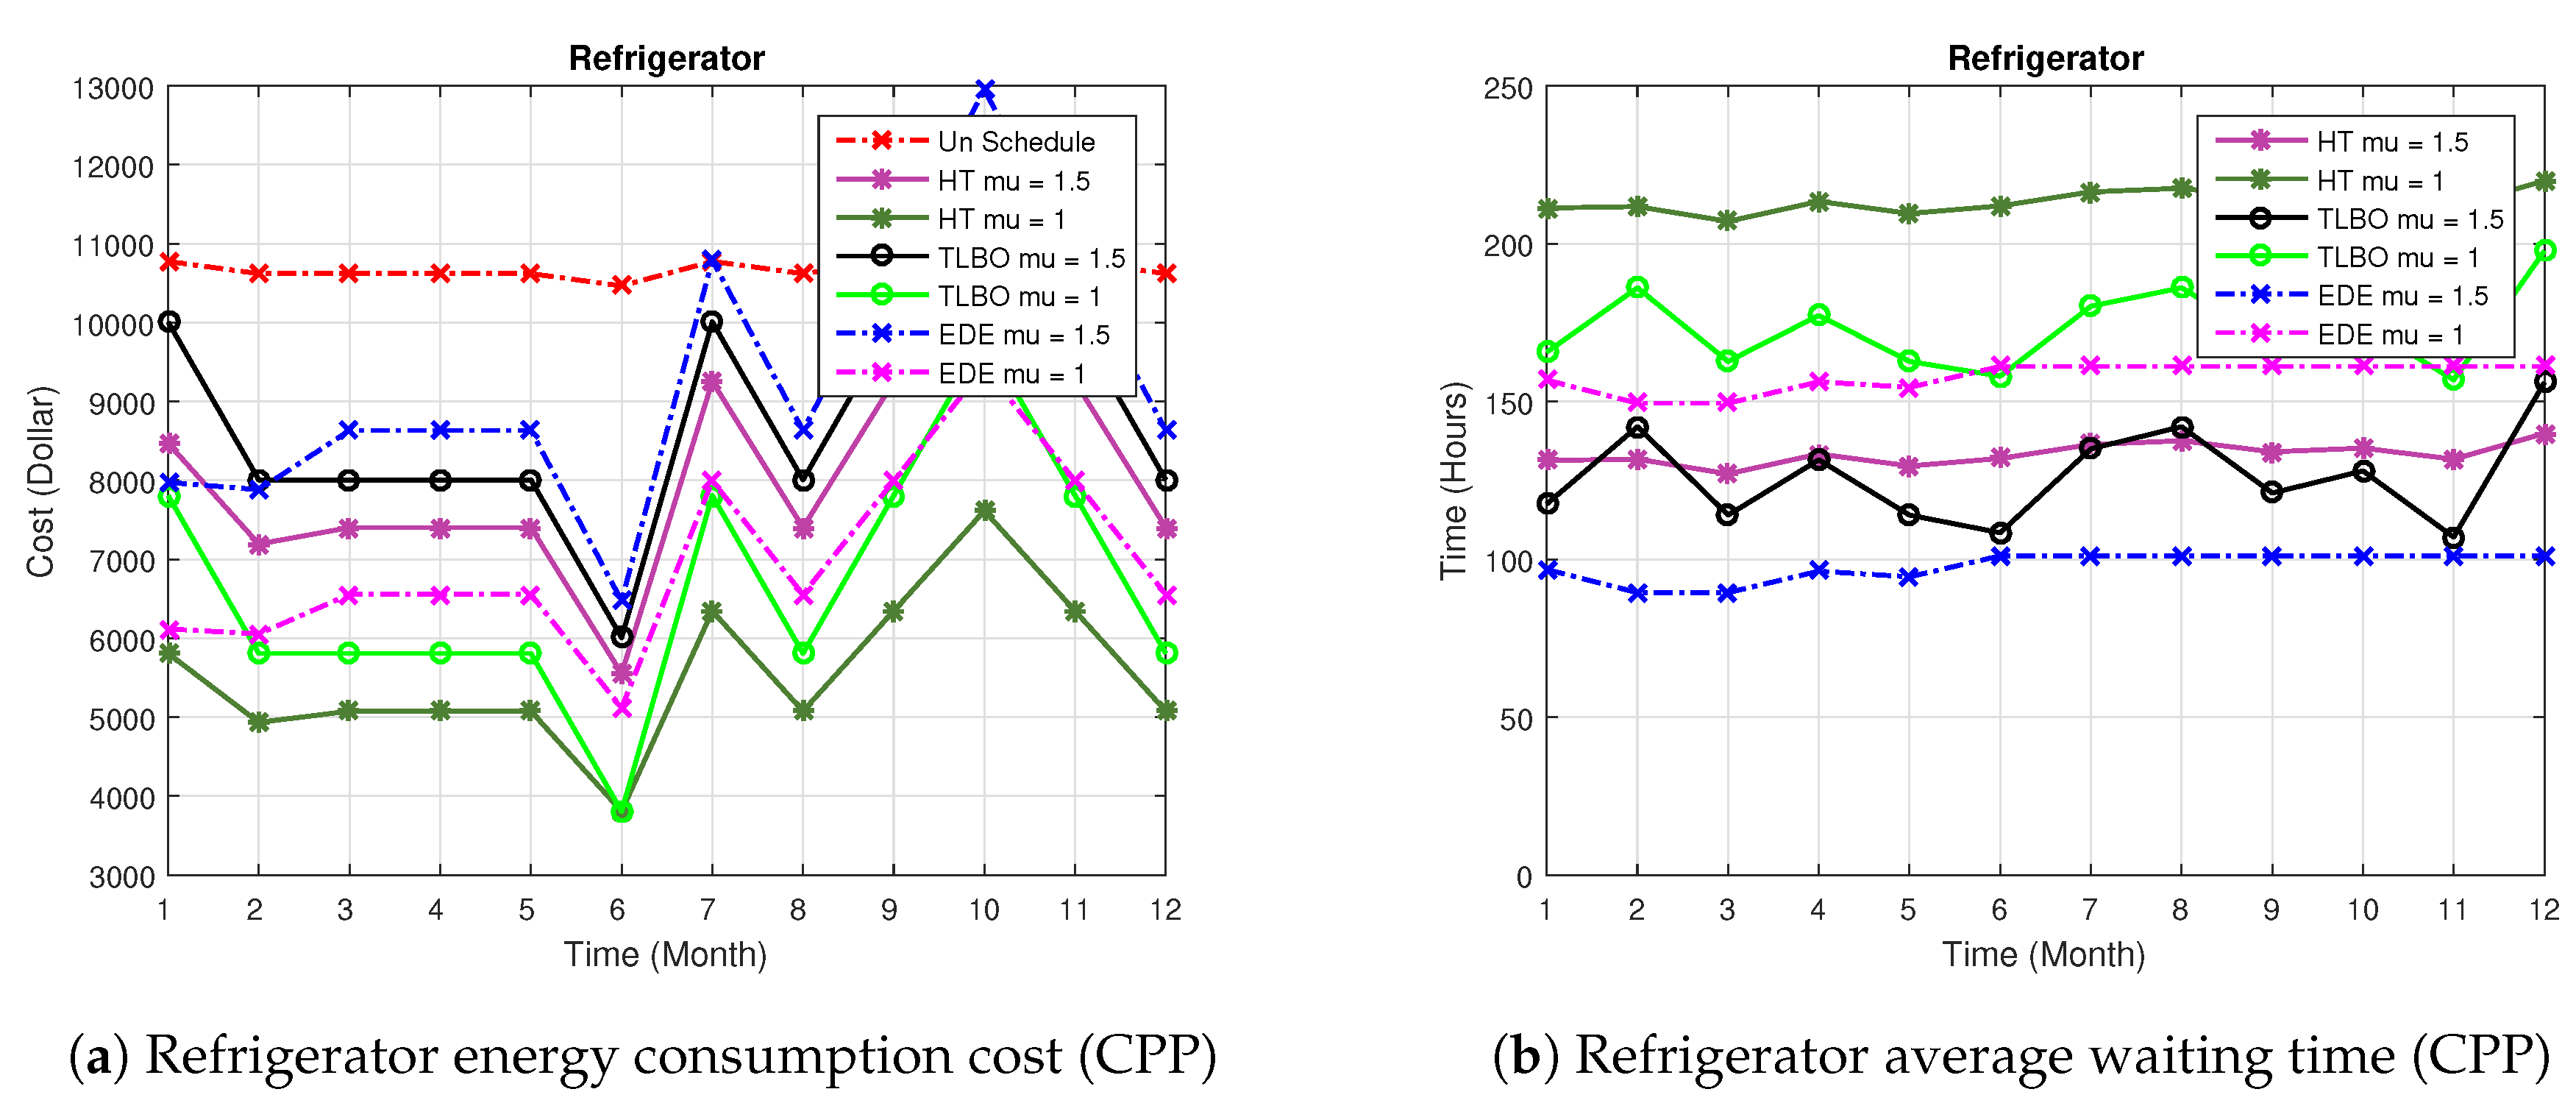
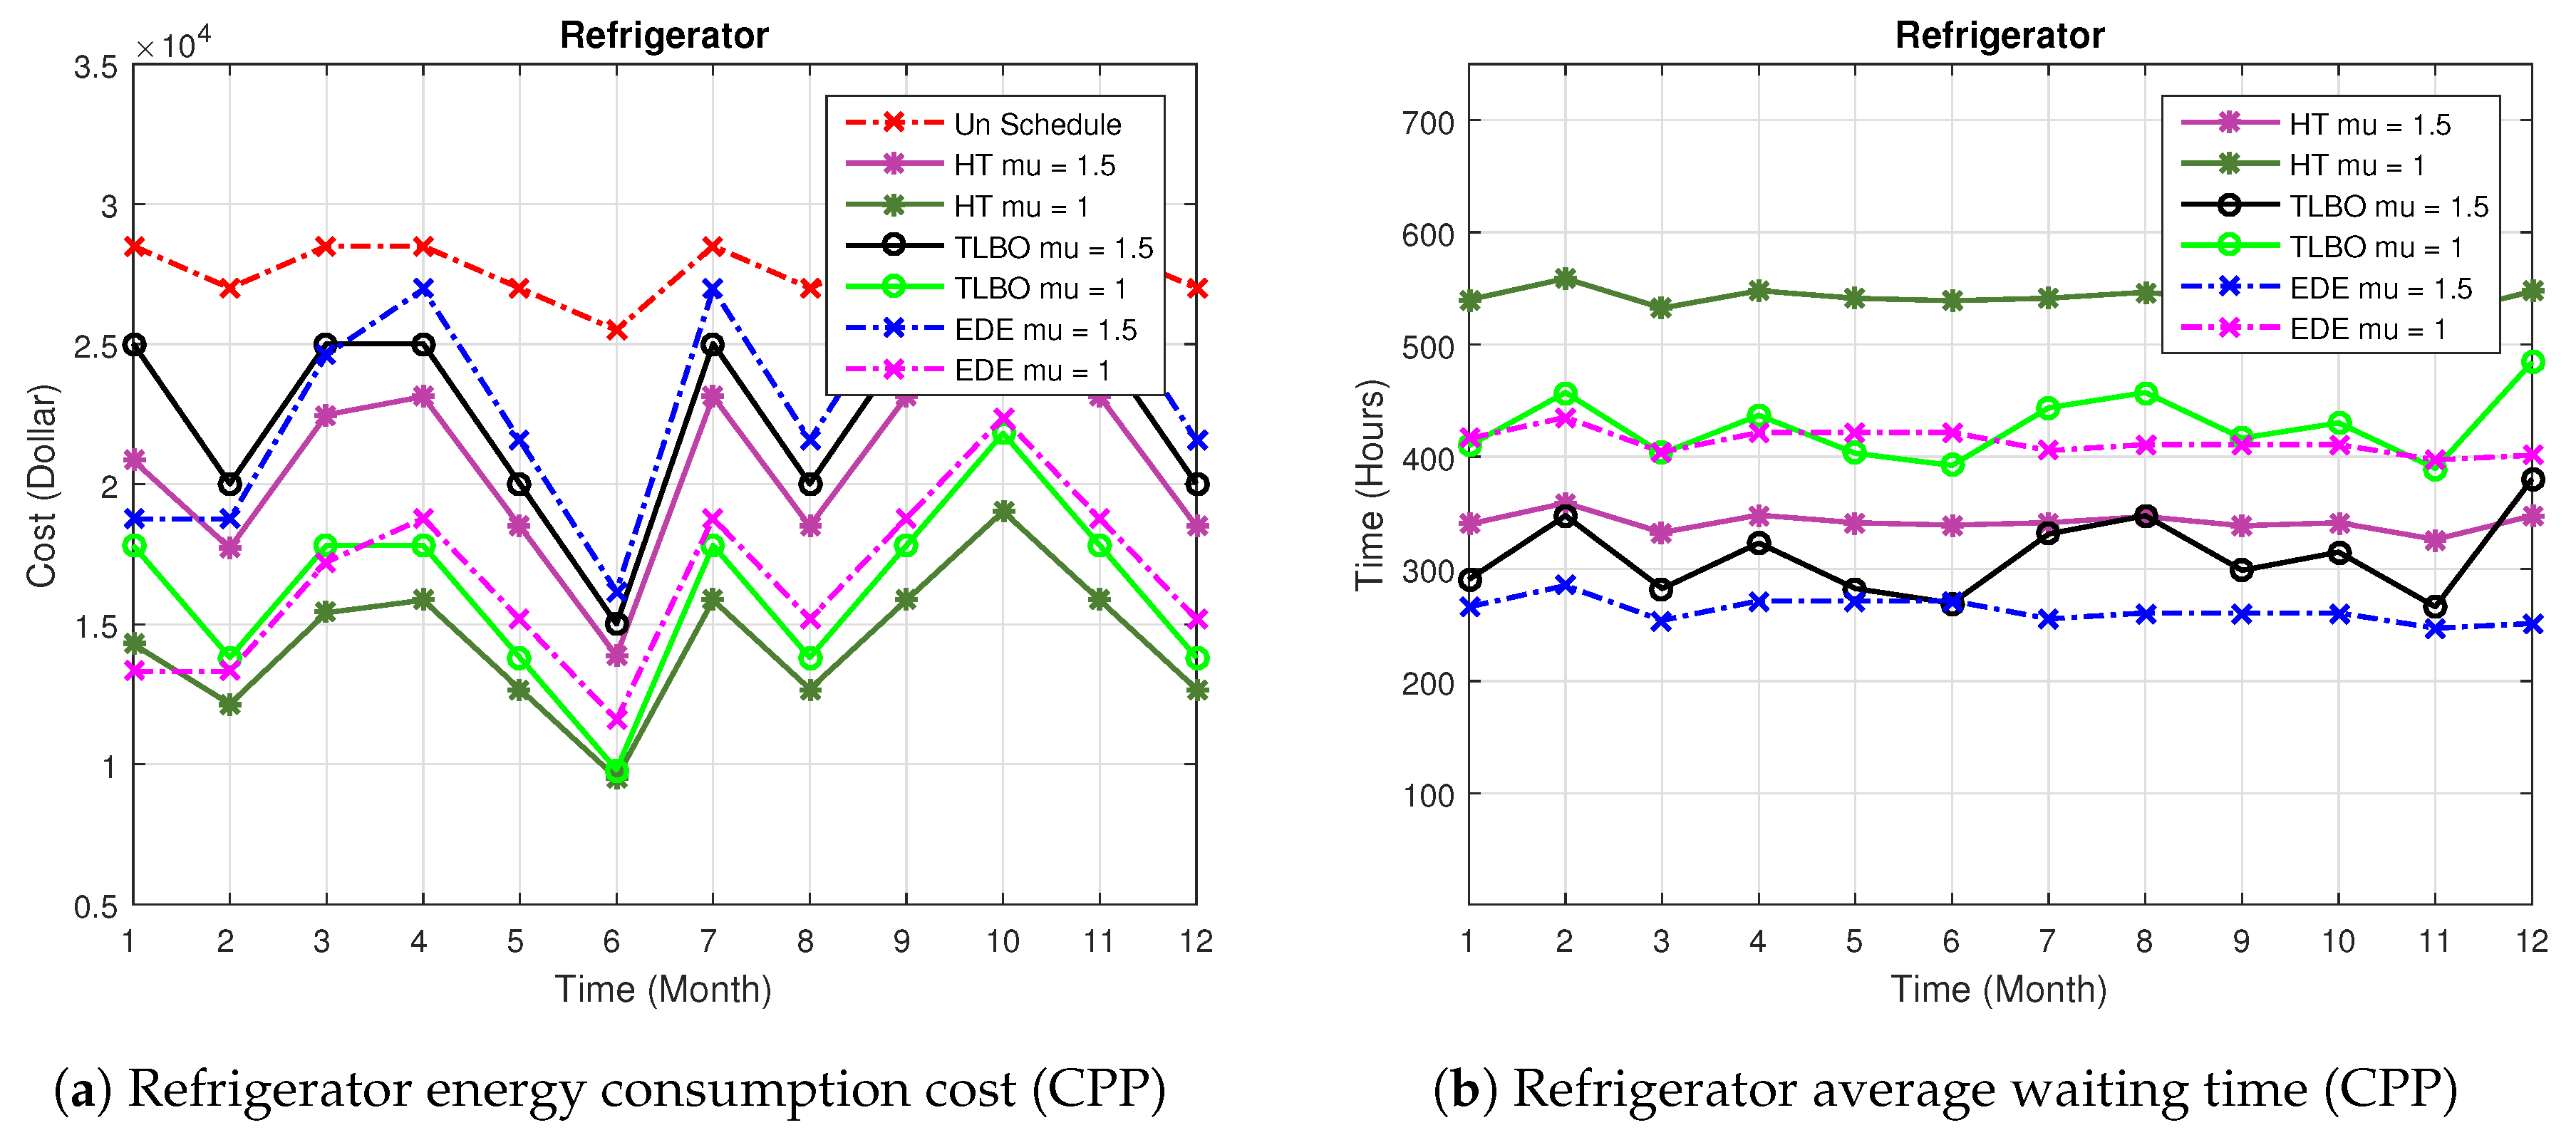
- RefrigeratorThe execution cost and waiting time of refrigerator are illustrated in Figure 4a,b. Simulation results demonstrate that, HT with priority 1.5 reduces cost up to 33% with the average delay of 3.71 h. However, when priority of the refrigerator is 1.0, 62% of cost is reduced with an average delay of 7.71 h.Simulation results are summarized in Table 4 and Table 5, which shows that when the priority of refrigerator is 1.5, the TLBO and EDE reduce cost 26% and 12%, respectively.If refrigerator is switched ON with the priority of 1.0 then TLBO and EDE reduce the cost up to 51% and 48%, respectively.From comparative analysis, it is observed that HT performs better as compared to TLBO and EDE in terms of cost. However, HT have maximum delay as compared to the other heuristic techniques. CPP plays a vital role in demand response electricity markets. Simulation results for cost and average waiting time with cpp are shown in Figure 5a,b, respectively. In RTP, high prices risk can be reduced by utilizing CPP. In the scenario of CPP, the refrigerator shows 30% and 58% reduction in the cost using HT. TLBO and EDE show 25% and 11% reduction in the cost, respectively, with the priority of 1.5.
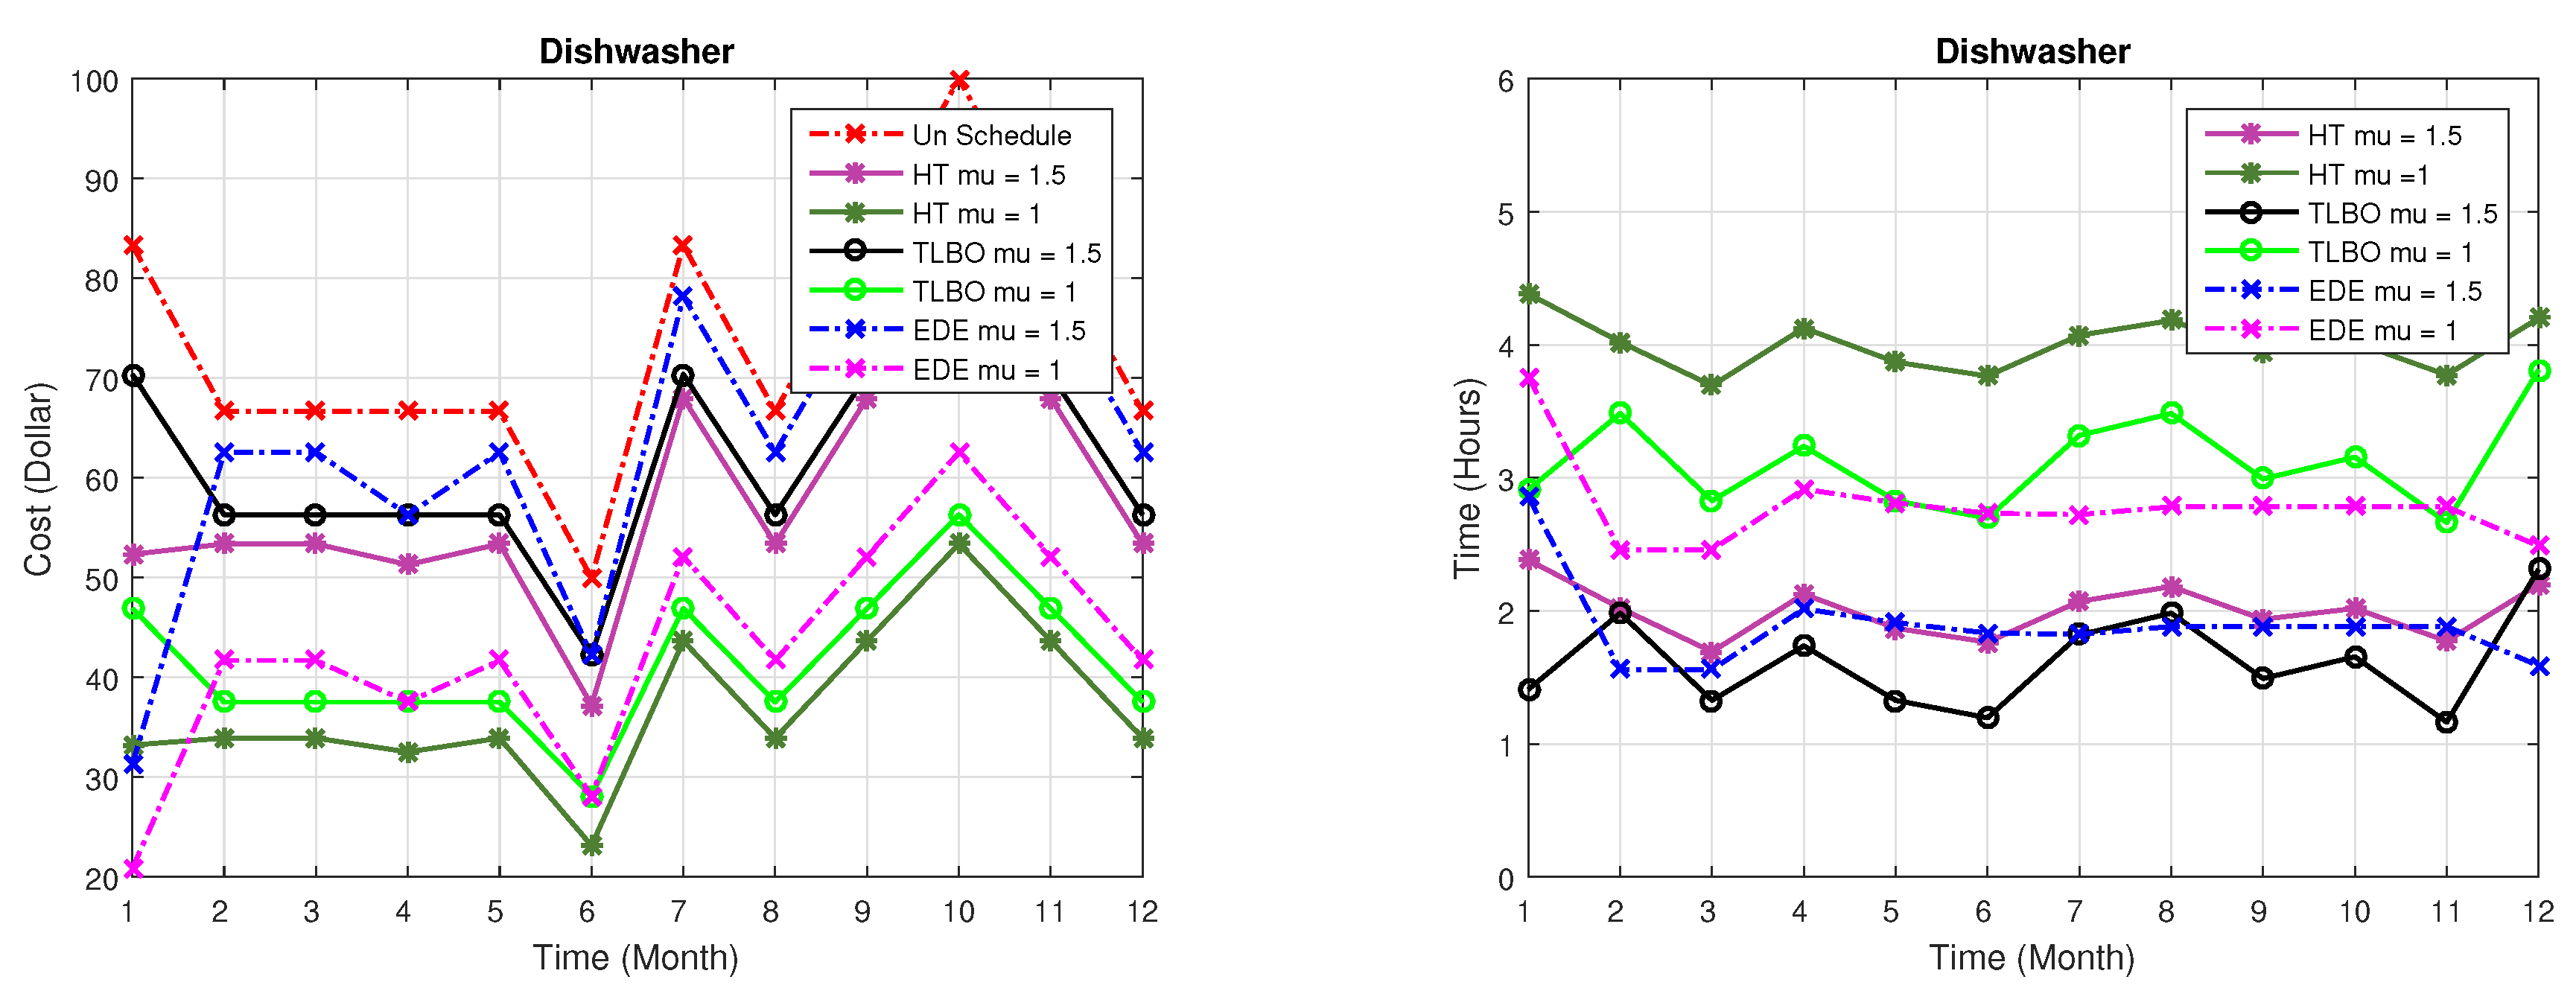
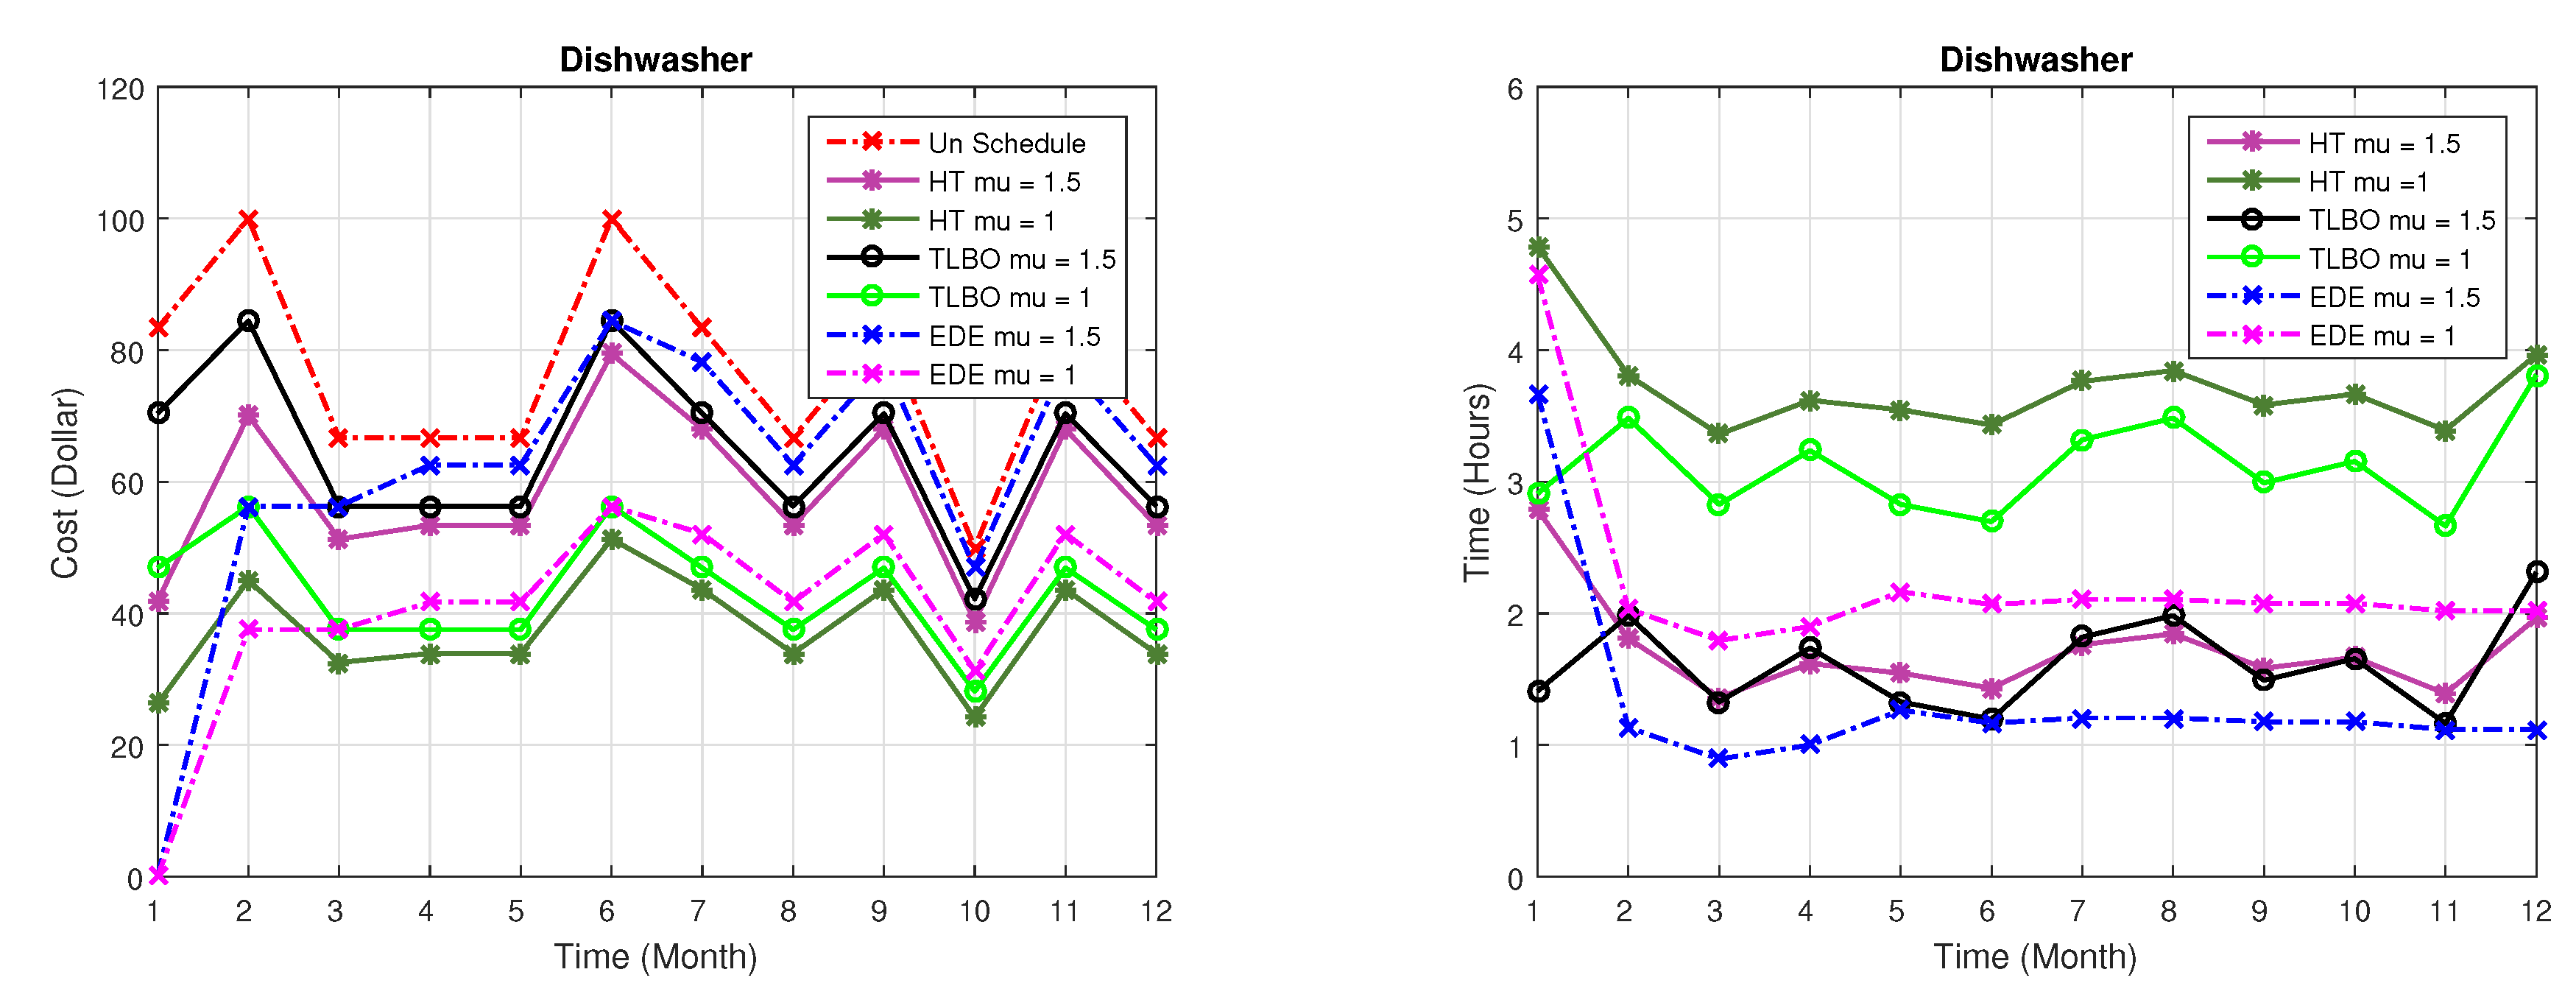
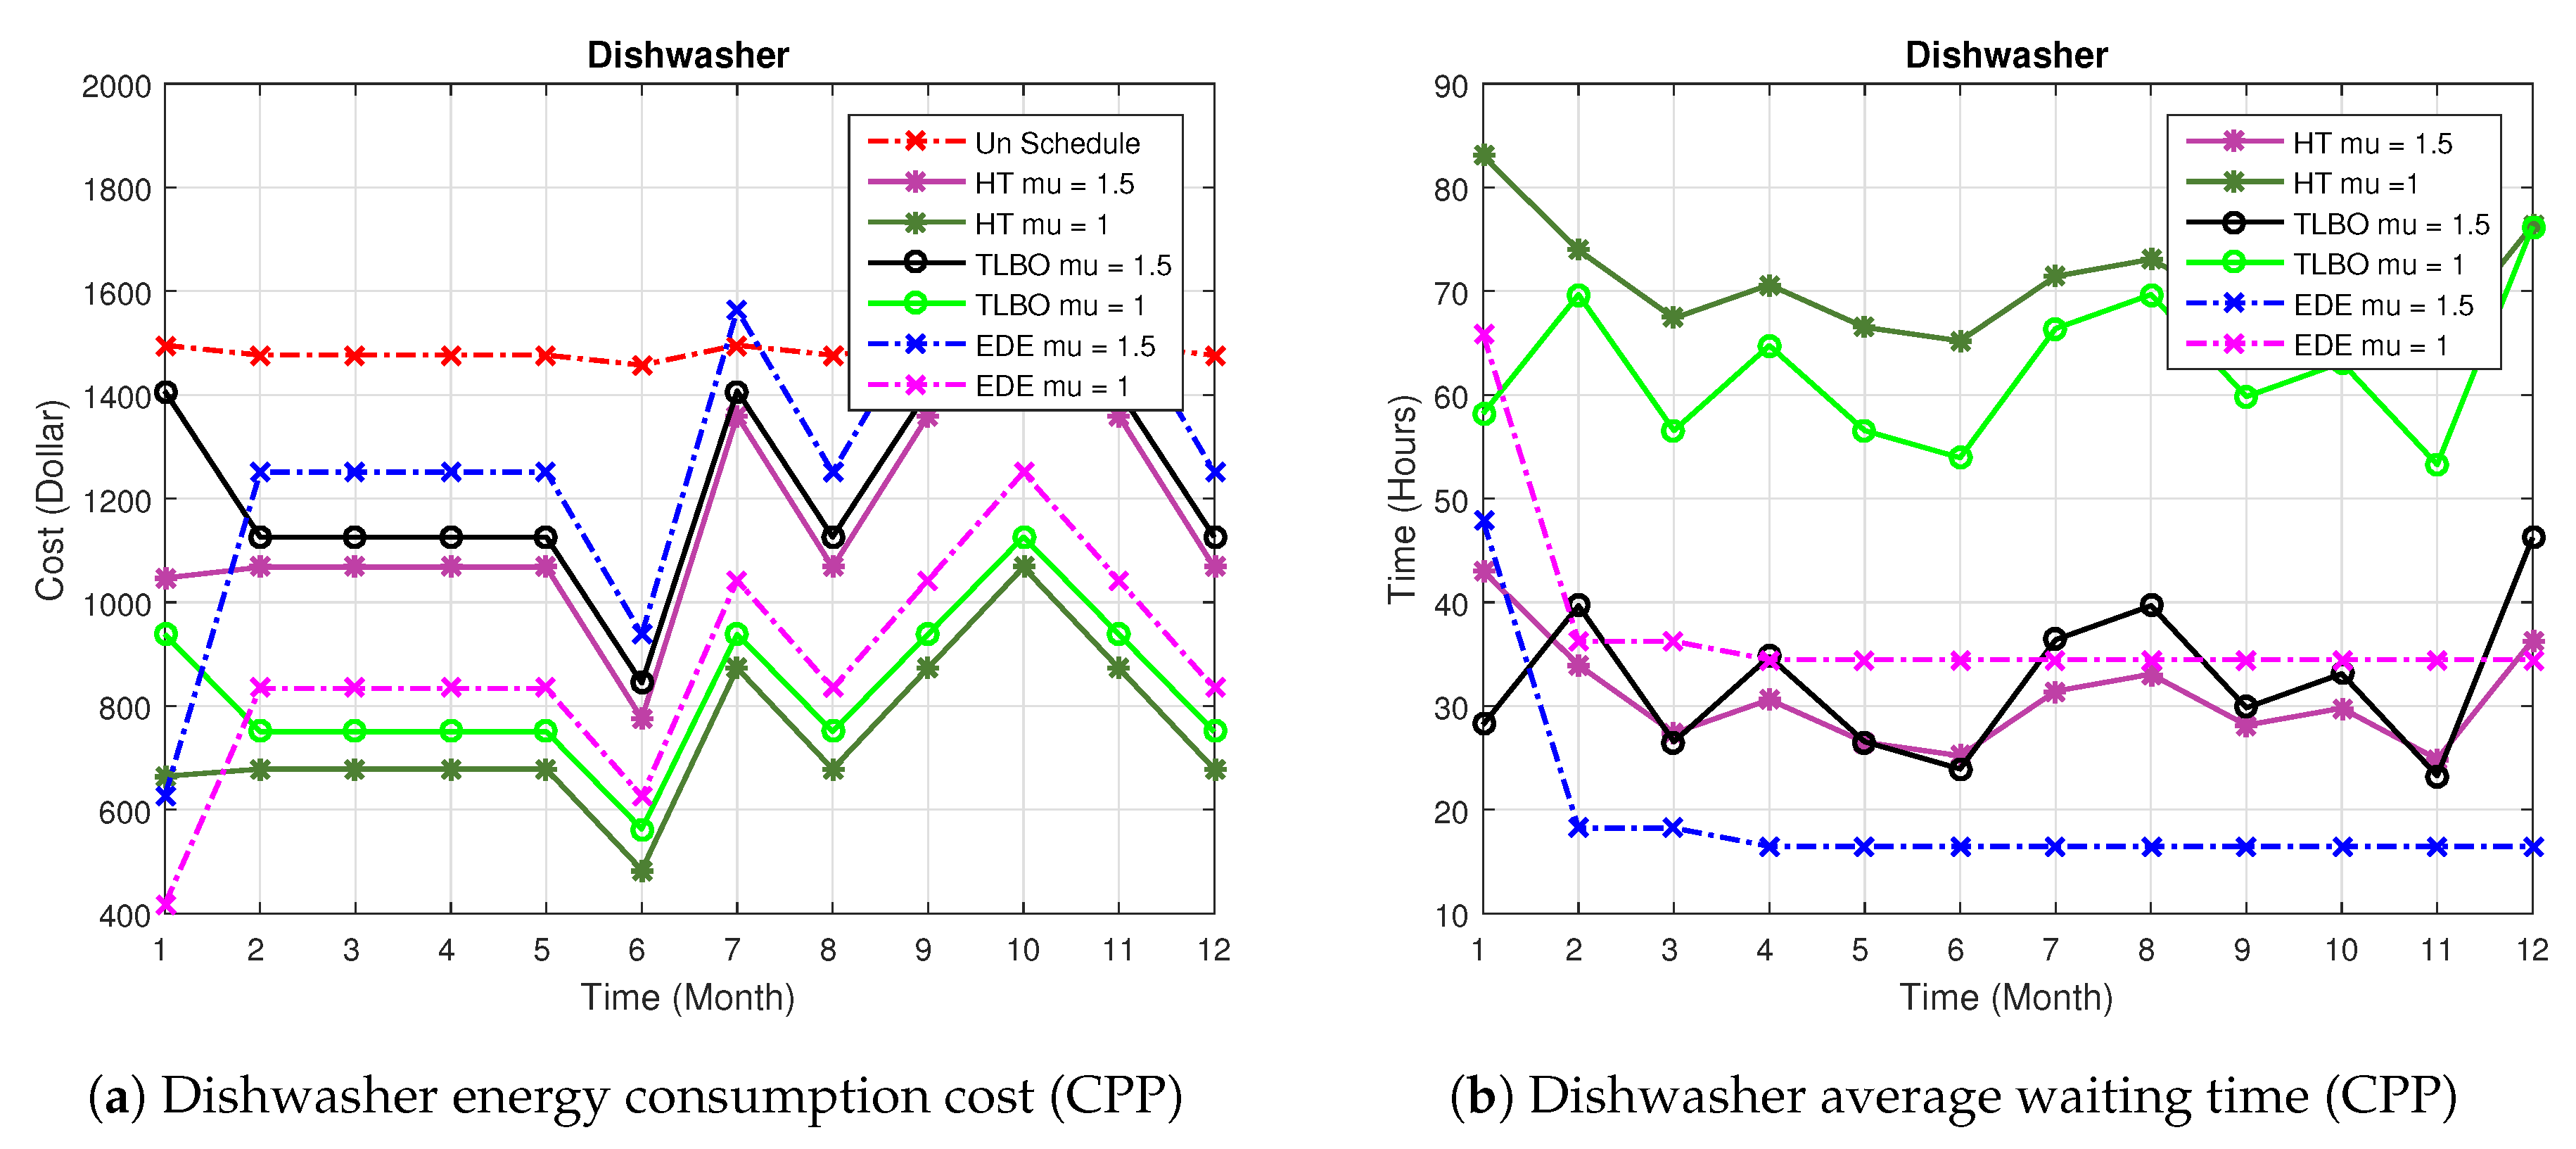
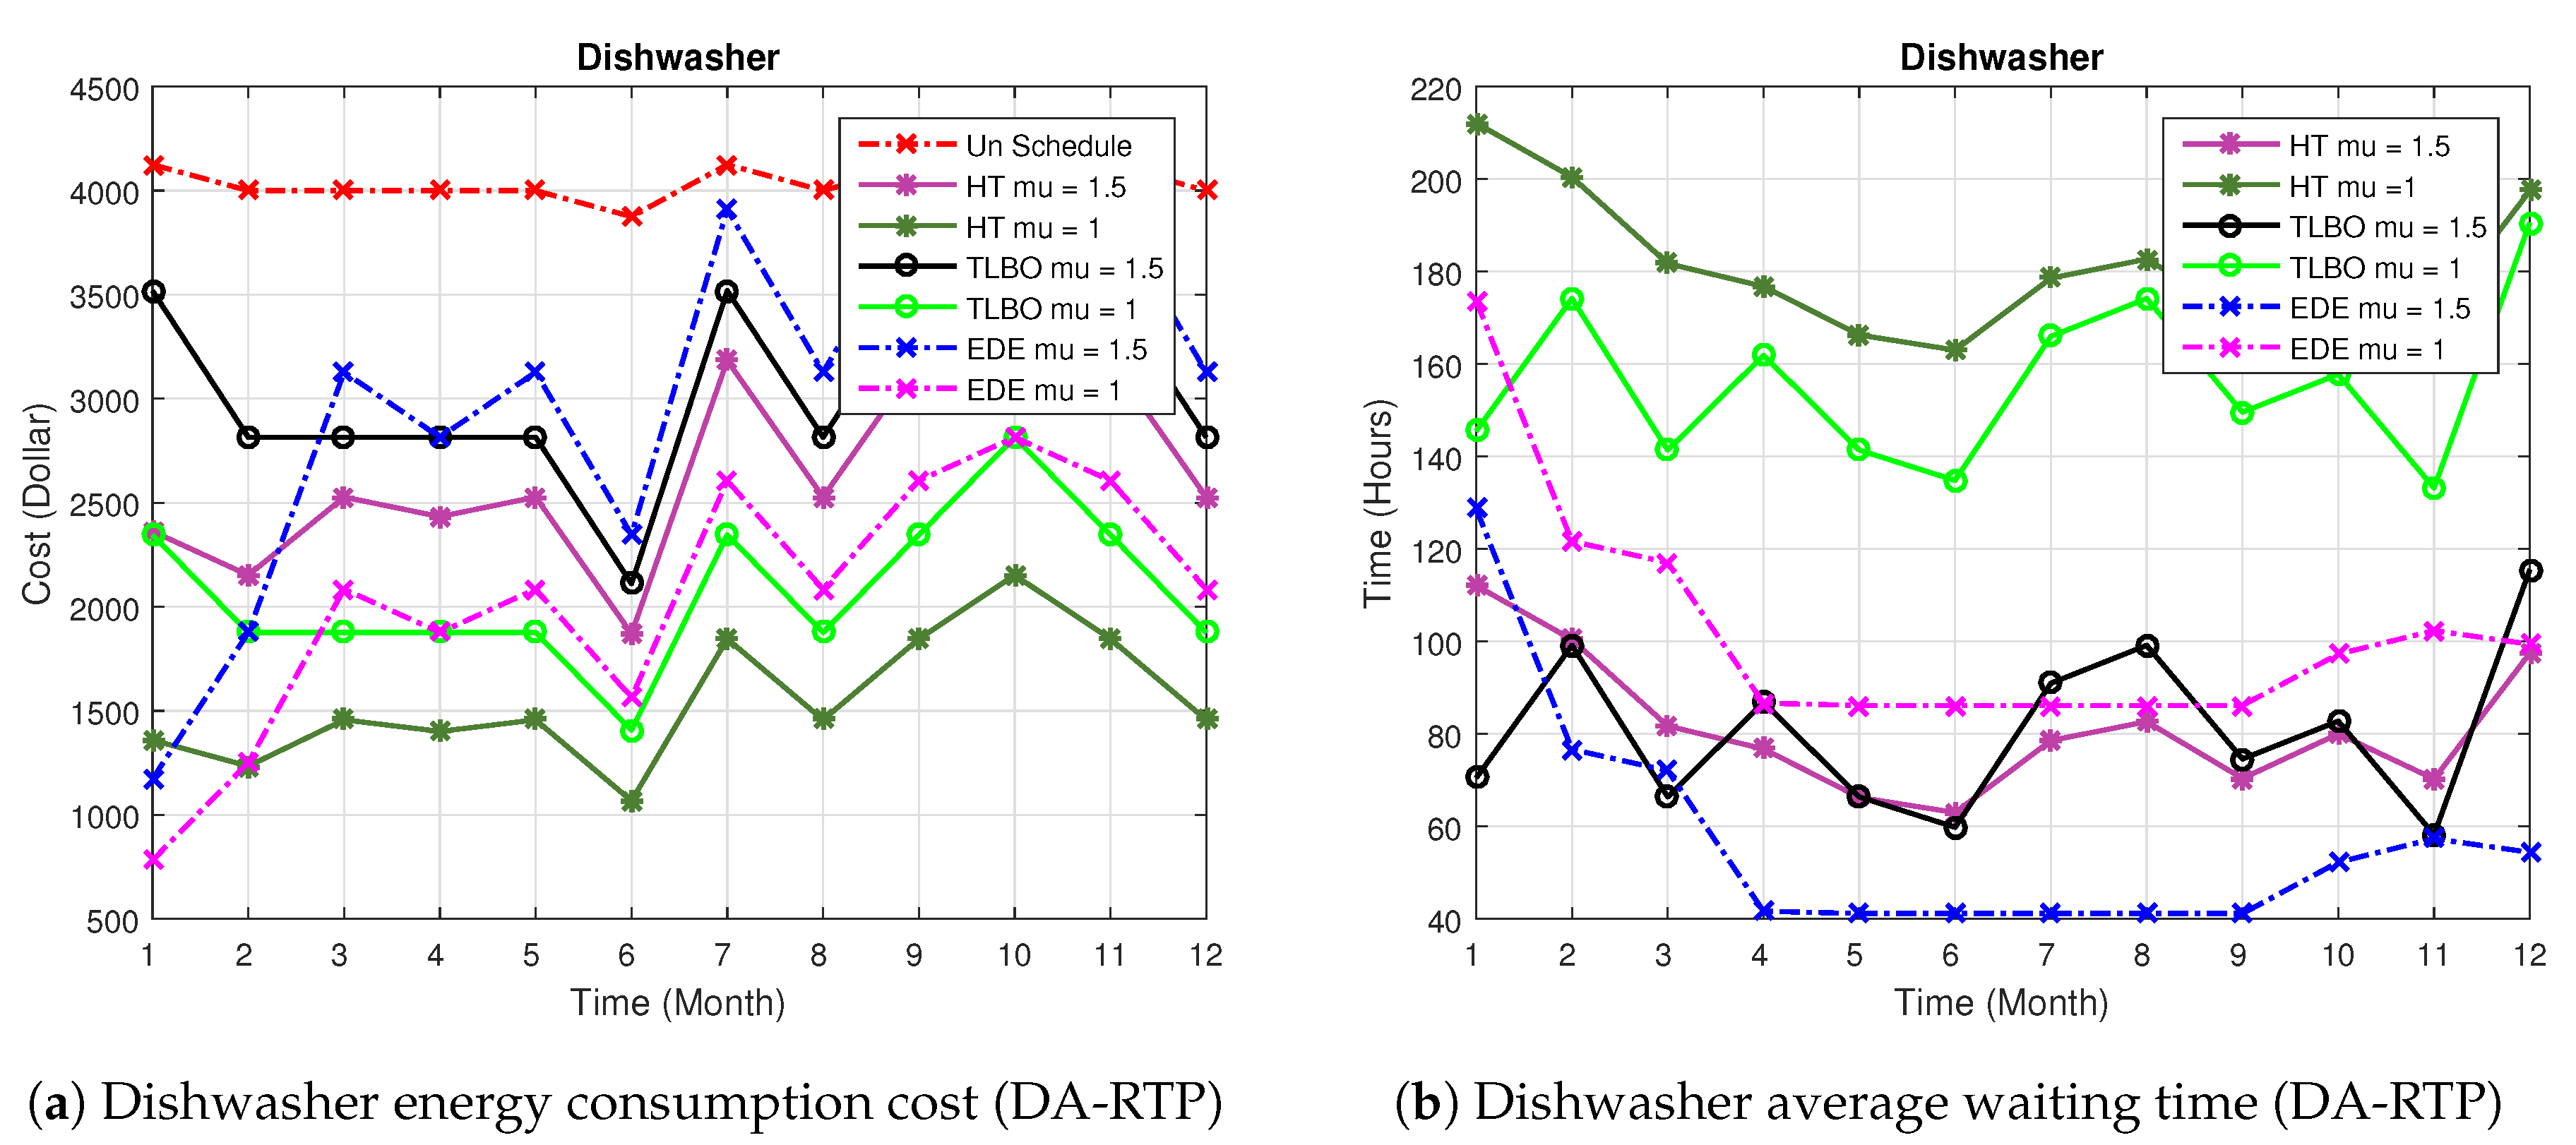
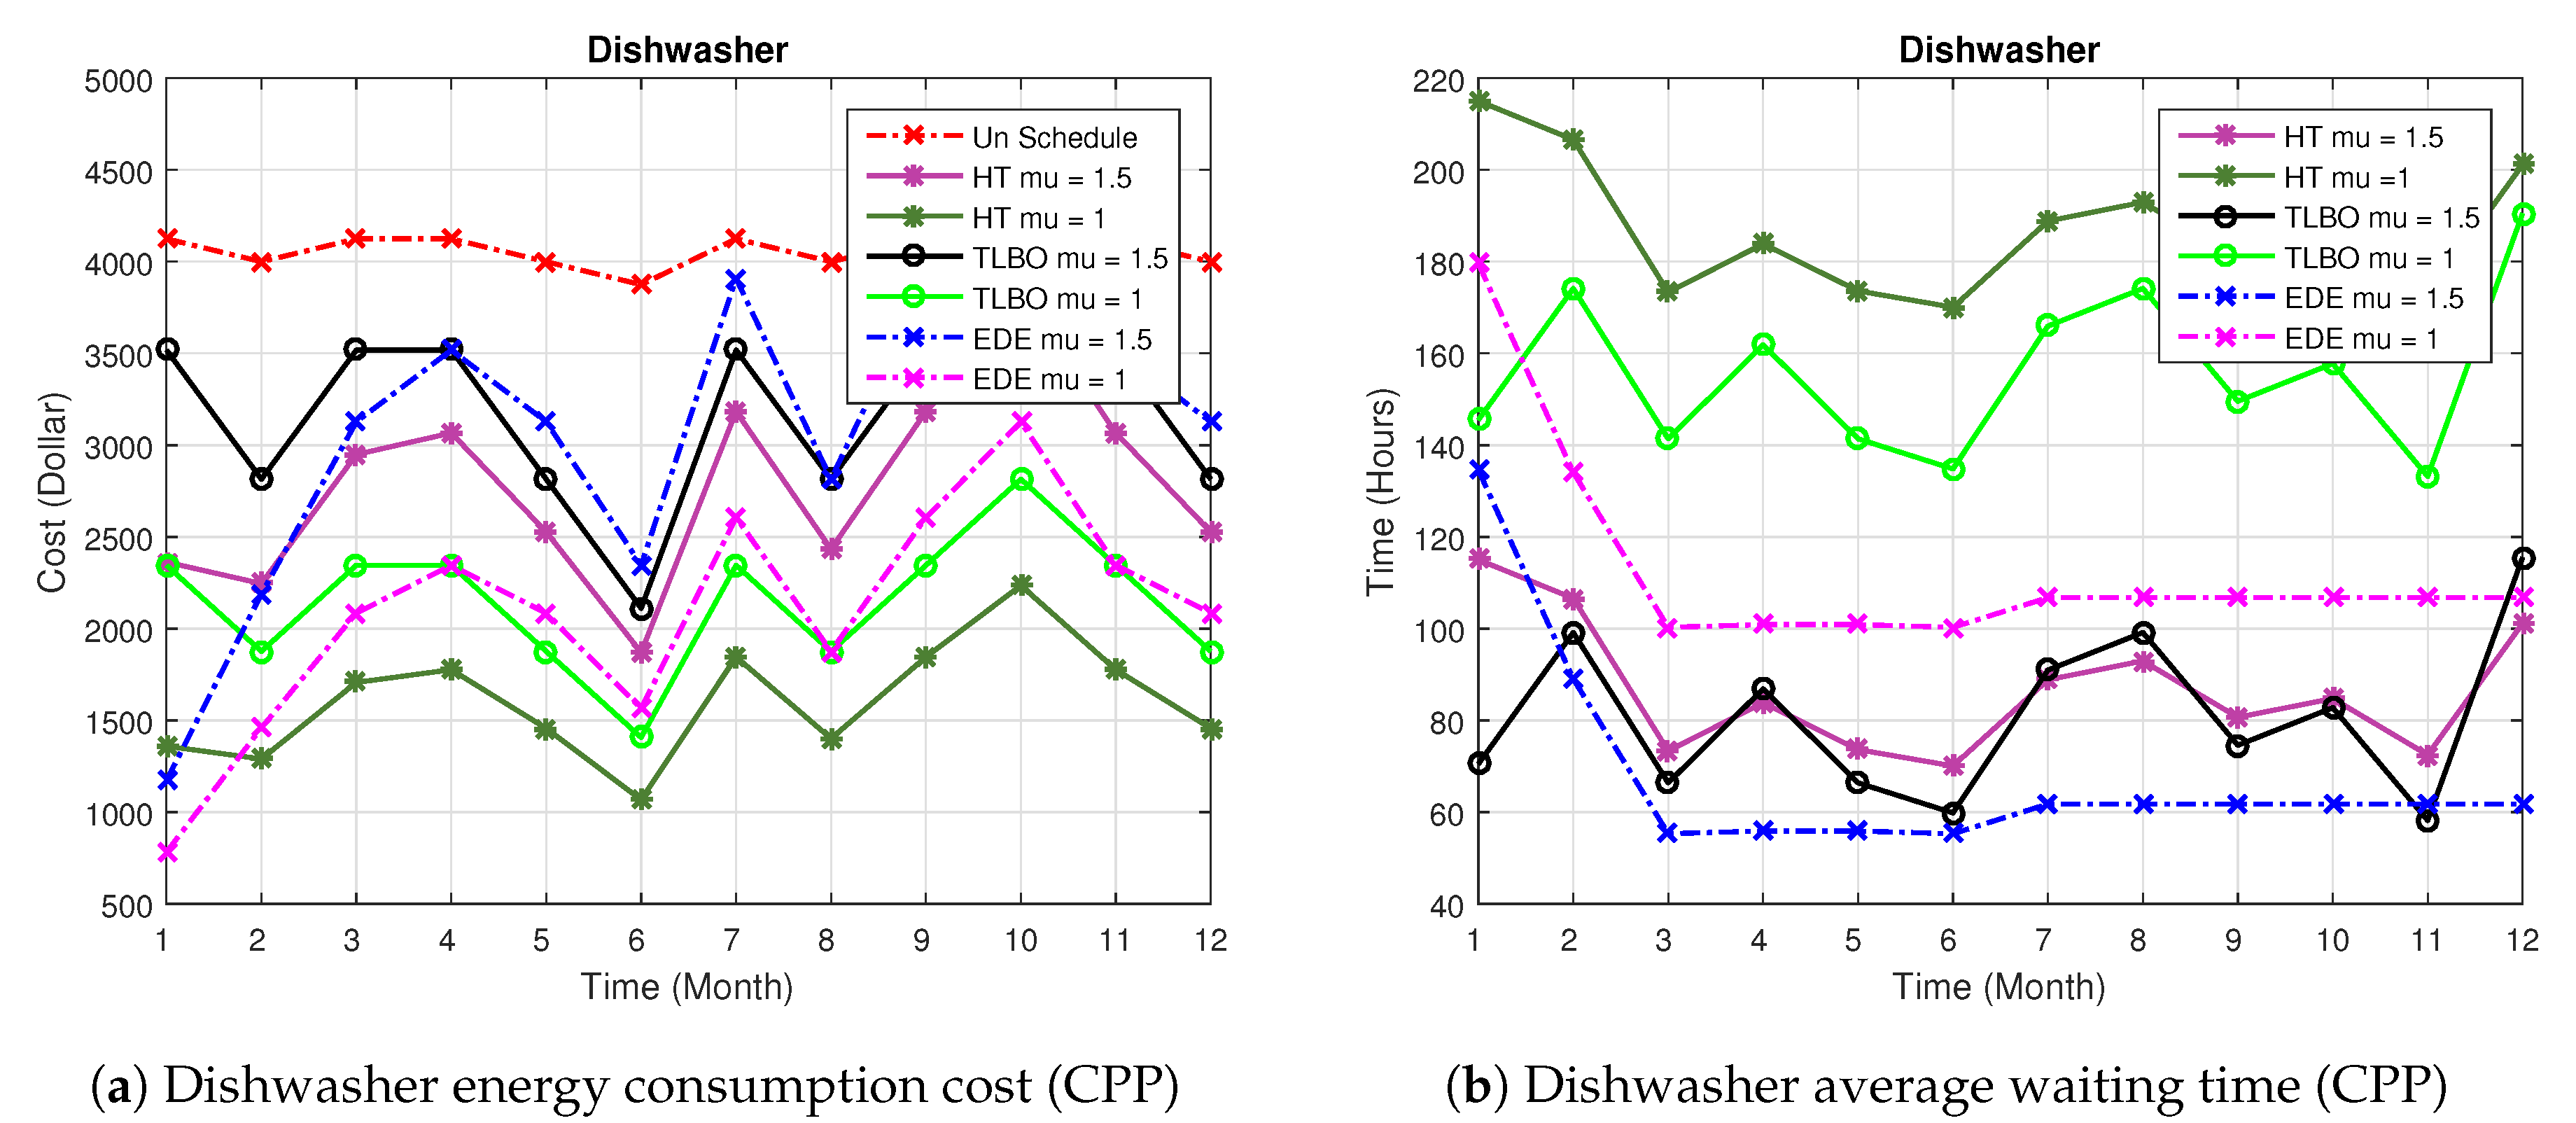
- DishwasherA dishwasher is an ideal appliance for DSM due to short duty cycles and high energy consumption. Figure 6a,b demonstrate the average waiting time and cost of dishwasher for one month. Simulation results for dishwasher are summarized in Table 6 and Table 7. Two-time factors are used for dishwasher, where the large time factor means higher priority and it leads to shorter time. We use four heuristic techniques to find out the best time schedule for a dishwasher at the minimum cost. Simulation results illustrate that HT, TLBO, EDE show 19%, 15% and 10% reduction in cost, with the priority of 1.5. If dishwasher is switched ON at a priority of 1.0 then HT, TLBO, EDE achieve 48%, 40%, 37% reduction in the cost with average delay of 3.72, 3.11, 2.35. By comparing results, we find that the performance of HT is the best in terms of cost and waiting time. If we comparatively see the simulation results then HT shows maximum delay.We check the performance of optimization techniques on different appliances by using the CPP signal. Simulation results for dishwasher average waiting time and cost are shown in Figure 7a,b. Simulation results illustrate that HT, TLBO, EDE show 14%, 7%, 5% with an average delay of 2.11, 2.02 and 1.45 h respectively with the priority of 1.5. If priority of the appliance is reduced to 1.0, simulation results illustrate that HT, TLBO and EDE achieved 45%, 38% and 36% reduction in the cost with average delay of 4.11, 3.77 and 2.75 h respectively. HT obtained the best performance in terms of cost; however, the delay is maximized.
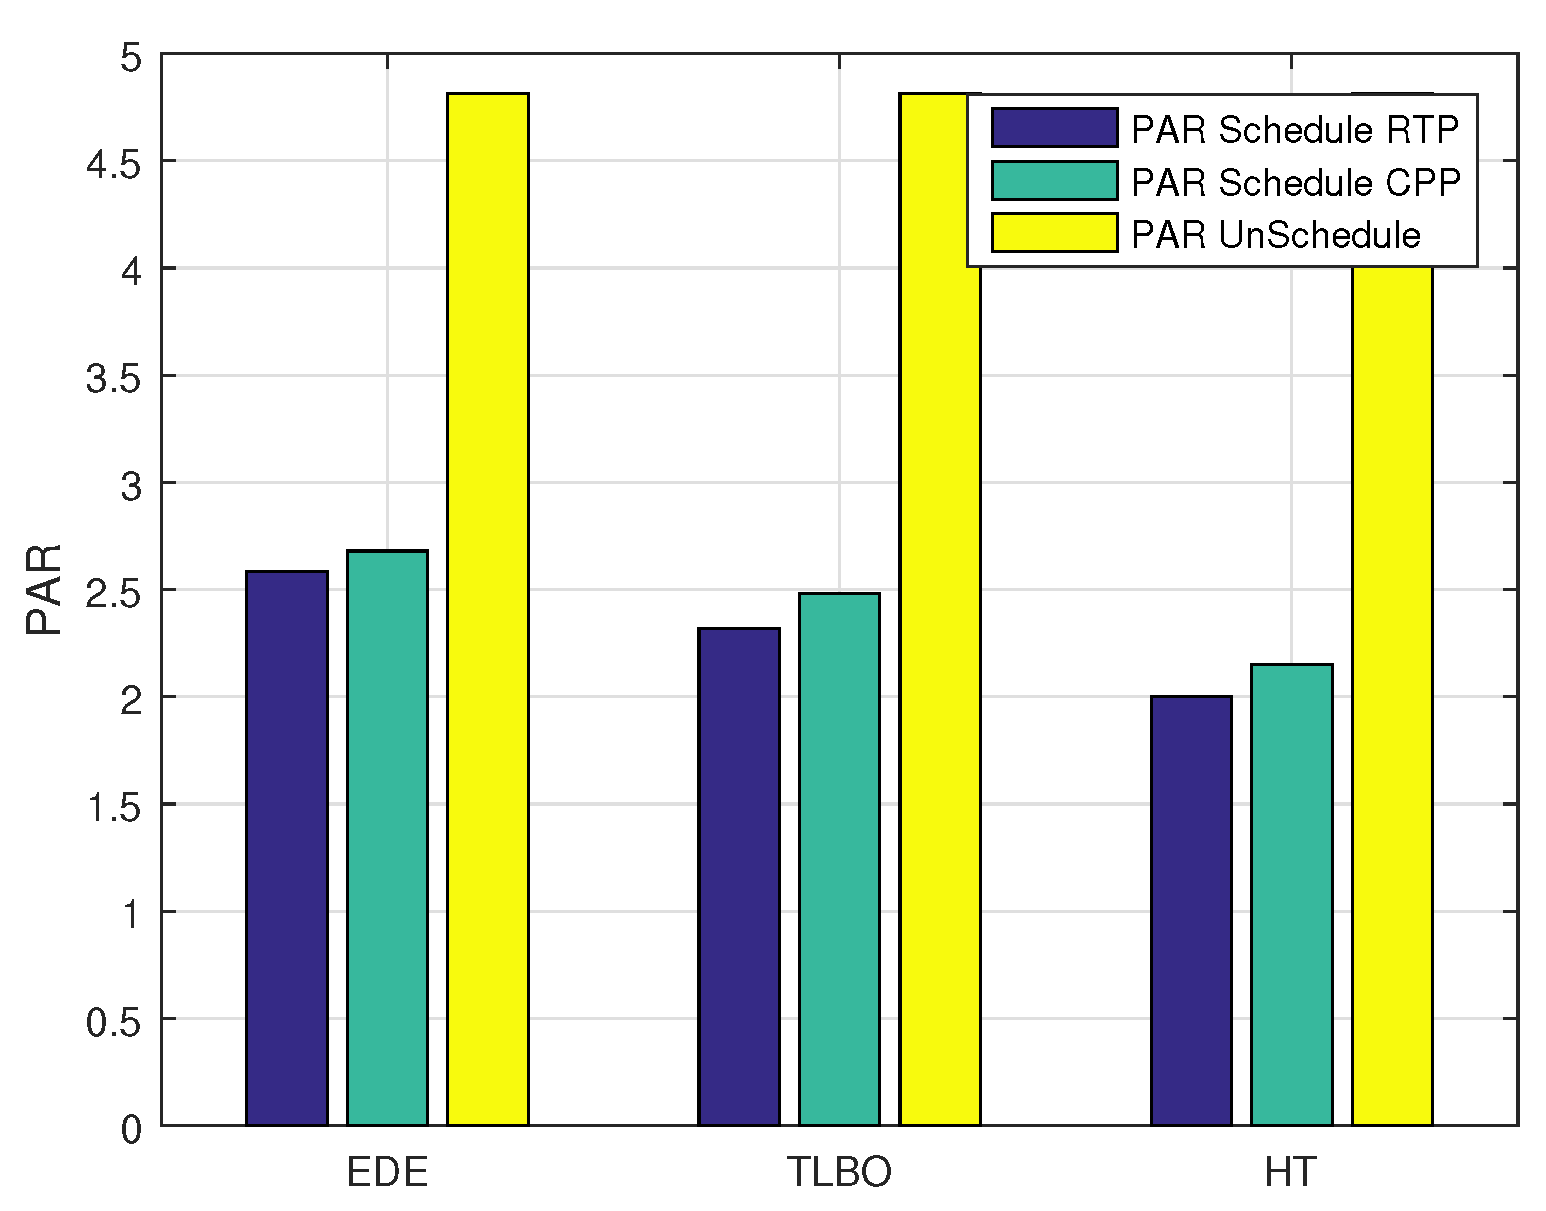
7.2. PAR
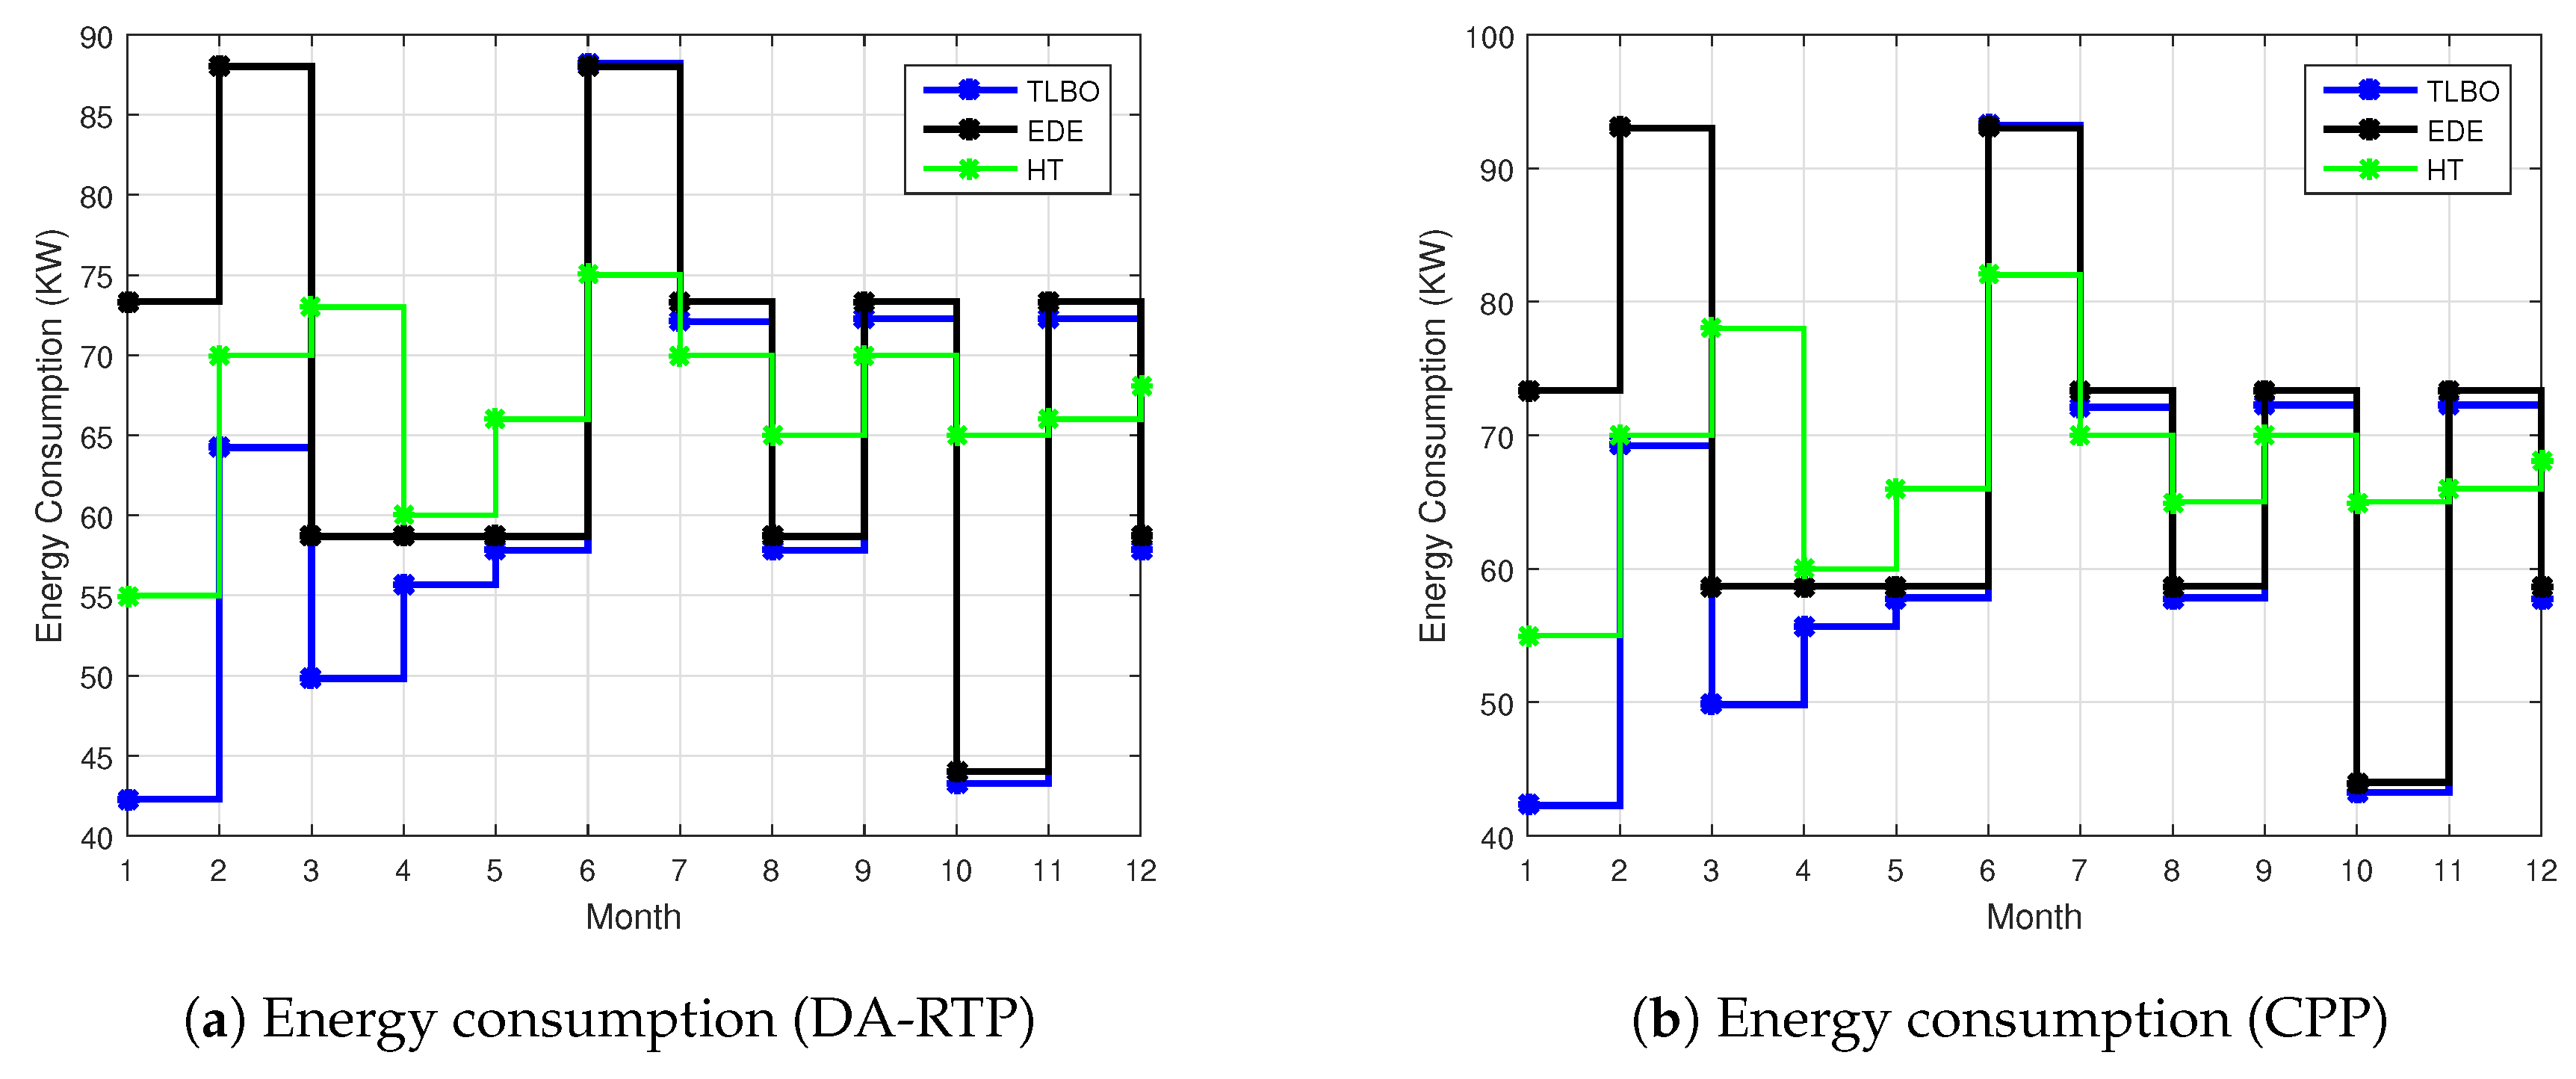
7.3. Electricity Consumption
7.4. Scenario 1: Twenty Homes
- Cloth DryerWe consider the cloth dryer along with both pricing signals (DA-RTP and CPP) and analyze the performance of cloth dryer on the basis of cost and delay of appliance. We measure the performance of cloth dryer for a year and calculate the average for a month. Simulations for cloths dryer energy consumption cost and delay of appliances are shown in Figure 10a,b. By utilizing the DA-RTP signal, optimization techniques HT, TLBO and EDE achieve 33%, 29% and 13% reduction in cost respectively with a priority of 1.5. If we decrease the priority to 1.0 then HT, TLBO and EDE show 65%, 55% and 42% reduction in cost respectively. In the same scenario HT, TLBO and EDE show an average delay of per month respectively with a priority of 1.5. When the priority of appliances is reduced to 1.0 then HT, TLBO and EDE show 114 h, 109 h and 92 h delay of appliances respectively.Simulation results show that there is a tradeoff between the delay of appliances and cost.We also conducted simulation by implemented the CPP signal. Simulations result are shown in Figure 11a,b. Simulation results show that HT, TLBO and EDE show 29%, 23% and 12% reduction in cost respectively with a priority of 1.5. When priority is reduced to 1.0 the performance of HT, TLBO and EDE show 60%, 49% and 39% reduction in cost respectively. In our scenario, the critical events occur twice in a year. If we consider the delay of appliances then HT, TLBO and EDE show 93 h, 75 h and 64 h respectively with a priority of 1.5. If the priority is reduced to 1.0 then average delay per month is 122 h, 188 h and 100 h respectively.
- RefrigeratorWe consider refrigerator as a SA because we schedule ice making stage and defrost stage of refrigerator. Scheduling is done for both pricing signal (DA-RTP and CPP). Simulations are shown in Figure 12a,b. When we utilized DA-RTP signal then HT, TLBO and EDE achieve 24%, 17% and 14% reduction in cost respectively with a priority of 1.5 respectively. When the priority of appliance is reduced to 1.0 then HT, TLBO and EDE show 48%, 38% and 35% reduction in cost respectively. In the same scenario HT, TLBO, EDE show an average delay of 217 h, 171 h and 166 h respectively with a priority of 1.0. If these algorithms are considered with a priority of 1.5 then HT, TLBO, EDE show 137 h, 124 h and 106 h respectively. The results show that there is a tradeoff between appliances delay and energy consumption cost.In the scenario of CPP, the performance of optimization techniques are different as compared to DA-RTP. Simulations for refrigerator energy consumption cost and delay of appliances are shown in Figure 13a,b. The performance of HT, TLBO and EDE show 24%, 16%, and 13% respectively. If we calculate the delay of refrigerator under the same priority of 1.5 then HT, TLBO and EDE show 145h, 136h, 110h, 90h respectively. when priority is reduced to 1.0 the performance of HT, TLBO and EDE show 47%, 36% and 34% respectively. By reducing the priority we can further save the energy consumption cost.
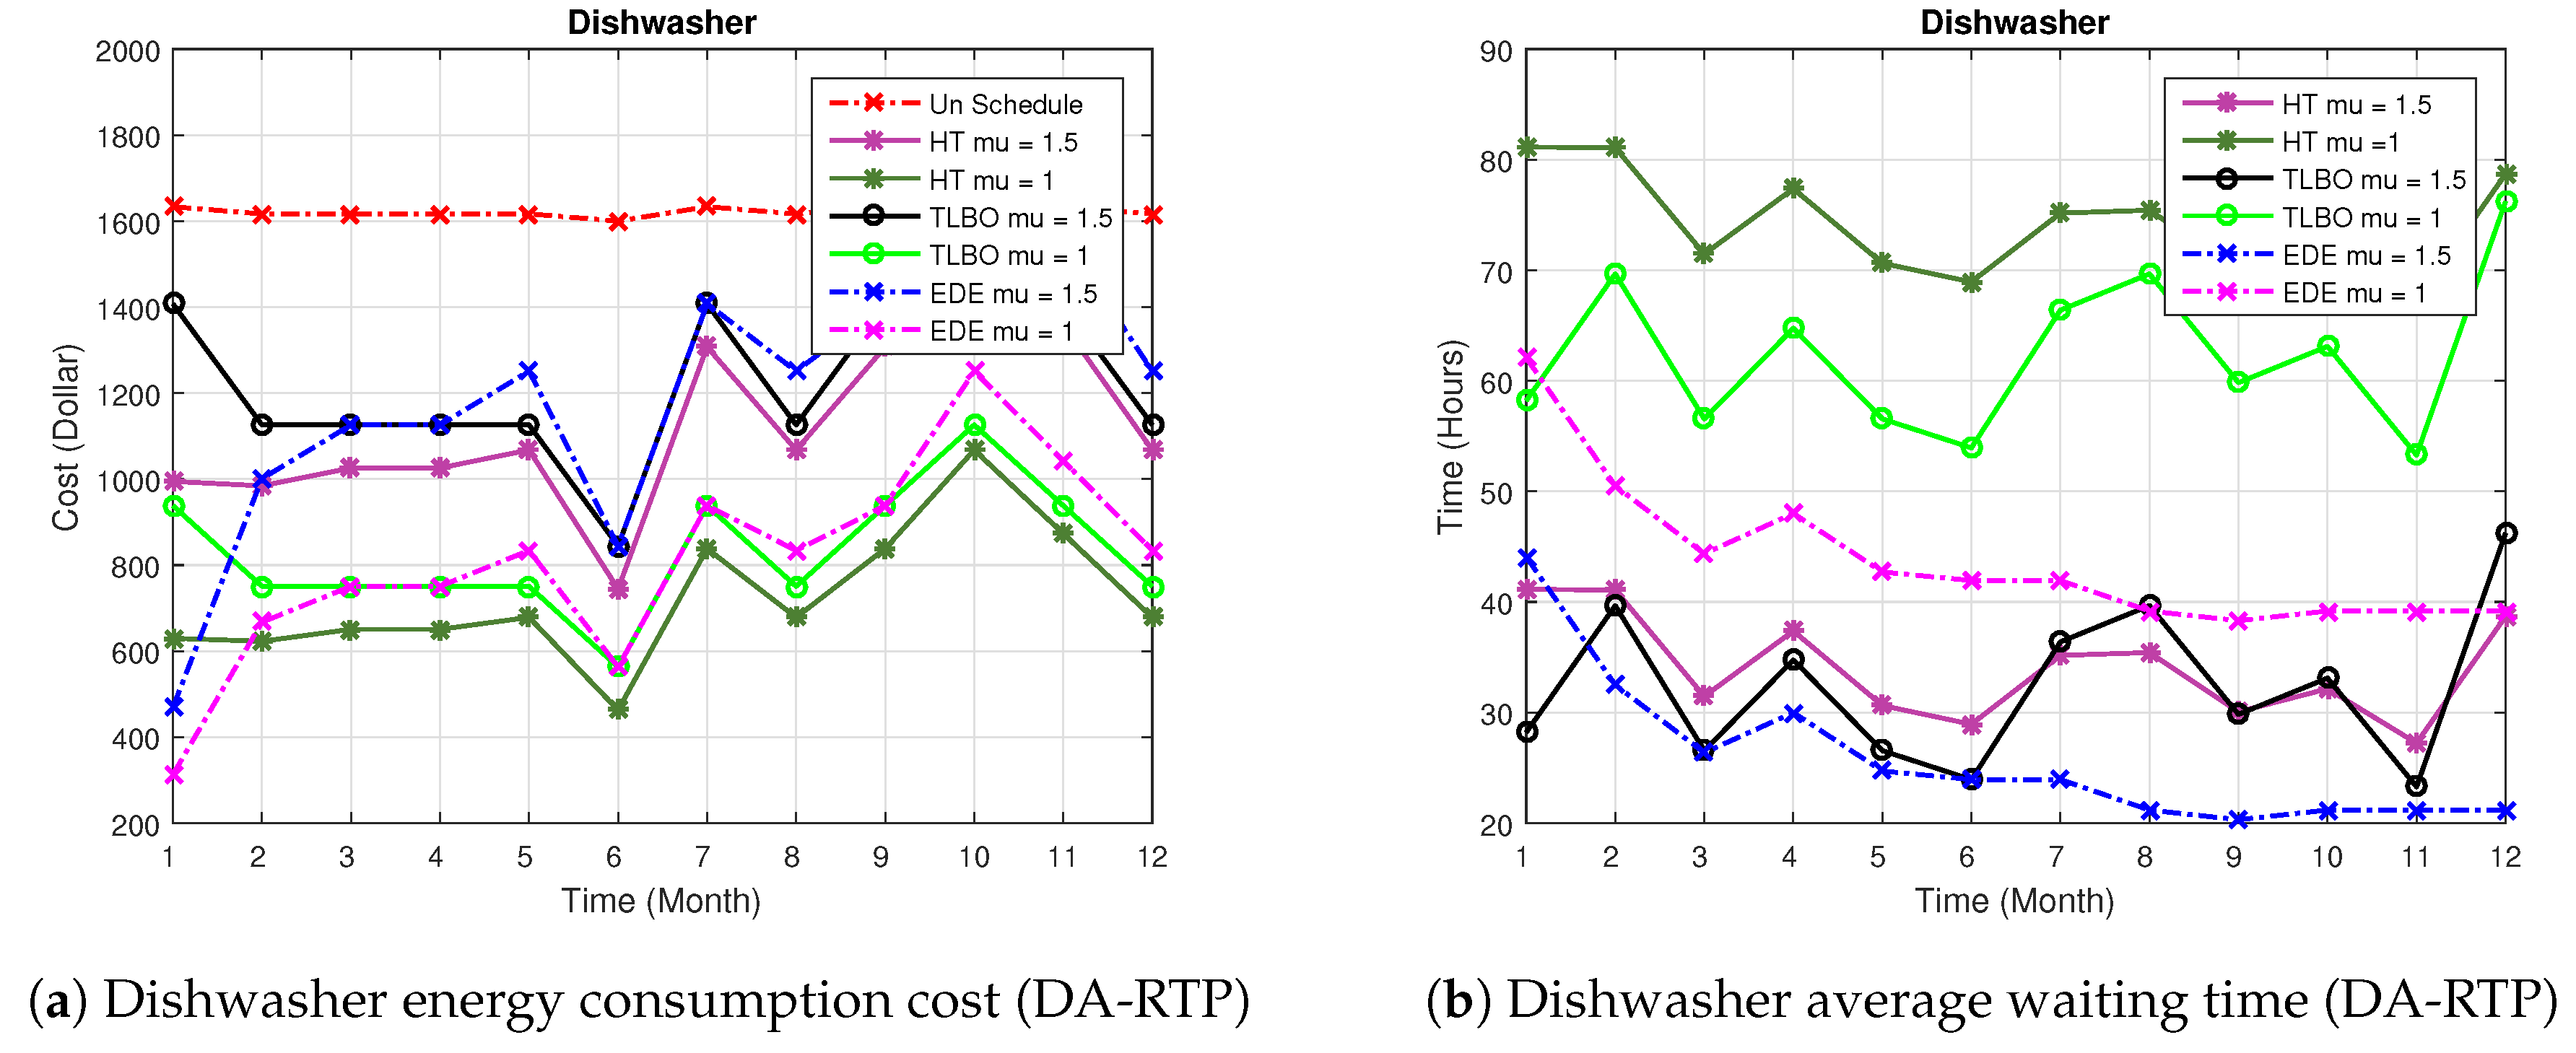
- DishwasherWe divided the energy consumption stages of dishwasher into three parts heated dry, main wash and final rinse. We schedule load among these energy consumption stages in such a way that the consumer will pay the minimum cost. Simulations for dishwasher energy consumption cost and delay of appliances are shown in Figure 14a,b. DA-RTP signal is utilized to find the energy consumption cost by using optimization technique HT, TLBO and EDE show 28%, 21%, 17% reduction in cost respectively with a priority of 1.5. When the priority is reduced to 1.0 then HT, TLBO and EDE show 54%, 48% and 44% reduction in cost respectively. If we consider the dishwasher delay then HT, TLBO and EDE show 35 h, 33 h and 27 h respectively with a priority of 1.5. when the priority of appliances is reduced to 1.0 then HT, TLBO and EDE show 75 h, 63 h and 44 h respectively. CPP signal is also utilized for dishwasher energy consumption scheduling, simulation results for CPP are shown in Figure 15a,b, which show that HT, TLBO and EDE show 43%, 41% and 34% reduction in cost respectively with a priority of 1.5. While priority is reduced to 1.0 the performance of HT, TLBO and EDE is increased up to 83%, 72% and 51%. In our scenario, the critical event occur twice in a year. If we consider the delay of dishwasher then HT, TLBO and EDE show 43 h, 41 h and 34 h respectively with a priority of 1.5. If the priority is reduced to 1.0 then average delay per month increase up to 83 h, 72 h and 51 h respectively.
7.5. Scenario 2: Fifty Homes
- Cloth DryerThe clothes dryer is one of the most energy consuming appliances in the residential sector, but a little work need to be done to schedule its energy consumption stages of clothes dryer in such a way that the consumer will pay the minimum cost. We consider both pricing signal (DA-RTP and CPP) and evaluate the performance of cloth dryer on the basis of cost and delay of appliances. We measure the performance of cloths dryer for a year and calculate the average for a month. Simulations for cloths dryer energy consumption cost and delay of appliances are shown in Figure 16a,b. By utilizing the DA-RTP signal, optimization techniques HT, TLBO and EDE show 45%, 37% and 31% reduction in cost respectively with a priority of 1.5. If we decrease the priority to 1.0 then HT, TLBO, EDE reduce cost up to 67%, 57% and 52% reduction in cost respectively. In the same scenario HT, TLBO and EDE show an average delay of 75 h, 65 h and 56 h per month respectively with a priority of 1.5. When the priority of appliances is reduced to 1.0 then HT, TLBO, EDE show delay of appliances 114 h, 109 h and 92 h respectively. Simulation results evaluation show that there is a tradeoff between the delay of appliances and cost.CPP signal is also implemented in our scenario and conducted the simulation, simulations are shown in Figure 17a,b. Results show that HT, TLBO and EDE obtained 43%, 34% and 25% reduction in cost respectively with a priority of 1.5. While priority is reduced to 1.0 the performance of HT, TLBO and EDE increase up till to 66%, 56% and 48% respectively. If we consider the delay of appliances then HT, TLBO and EDE show 93 h, 75 h and 64 h respectively with a priority of 1.5. If the priority is reduced to 1.0 then average delay per month is 122 h, 188 h and 100 h, respectively.
- Refrigerator Simulations of refrigerator with 50 homes are shown in Figure 18a,b. When we utilized DA-RTP signal then HT, TLBO and EDE show 28%, 21% and 20% reduction in cost respectively with a priority of 1.5 respectively. When the priority of appliance is reduced to 1.0 then HT, TLBO and EDE show 50%, 44% and 43% reduction in cost respectively. In the same scenario HT, TLBO and EDE show an average delay of 217 h, 171 h and 166 h respectively with a priority of 1.0. If these algorithms are considered with a priority of 1.5 then HT, TLBO and EDE show 137 h, 124 h and 106 h respectively. The results show that there is a tradeoff between appliances delay and energy consumption cost.When we implement the CPP, the performance of optimization technique is different as compared to DA-RTP. Simulations for Refrigerator energy consumption cost and delay of appliances are shown in Figure 19a,b. The performance of HT, TLBO and EDE show 25%, 18% and 15% reduction in cost respectively. In the case when priority is reduced to 1.0 the performance of HT, TLBO and EDE show 47%, 36% and 34% respectively. If we calculated the delay of refrigerator then HT, TLBO and EDE show 145 h, 136 h, 110 h respectively with a priority of 1.5. By reducing the priority we can further save the energy consumption cost.
- DishwasherA dishwasher act as an integrated more permanent kitchen appliances. It has large load capacity as compared to other most of the home appliances. Simulations for dishwasher electricity cost and delay of an appliance are shown in Figure 20a,b. In DA-RTP signal HT, TLBO and EDE show 35%, 24% and 27% reduction in cost respectively with a priority of 1.5. When the priority is reduced to 1.0, The optimization techniques HT, TLBO and EDE show 62%, 49% and 51% reduction in cost respectively. If we consider the dishwasher delay then HT, TLBO and EDE show 35 h, 33 h and 27 h respectively with a priority of 1.5. HT, TLBO, EDE show 75 h, 63 h and 44 h respectively, with reduced priority 1.0.Simulation are also conducted for CPP and simulation results are shown in Figure 21a,b, which show that HT, TLBO and EDE show 31%, 21% and 20% reduction in cost respectively with a priority of 1.5. While priority is reduced to 1.0 the performance of HT, TLBO and EDE show 60%, 48% and 45%. If we consider the delay of appliances then HT, TLBO and EDE show 43 h, 41 h and 34 h respectively with a priority of 1.5. If the priority is reduced to 1.0 then average delay per month is 83 h, 72 h and 51 h respectively.
7.6. Performance Tradeoff
8. Feasible Region
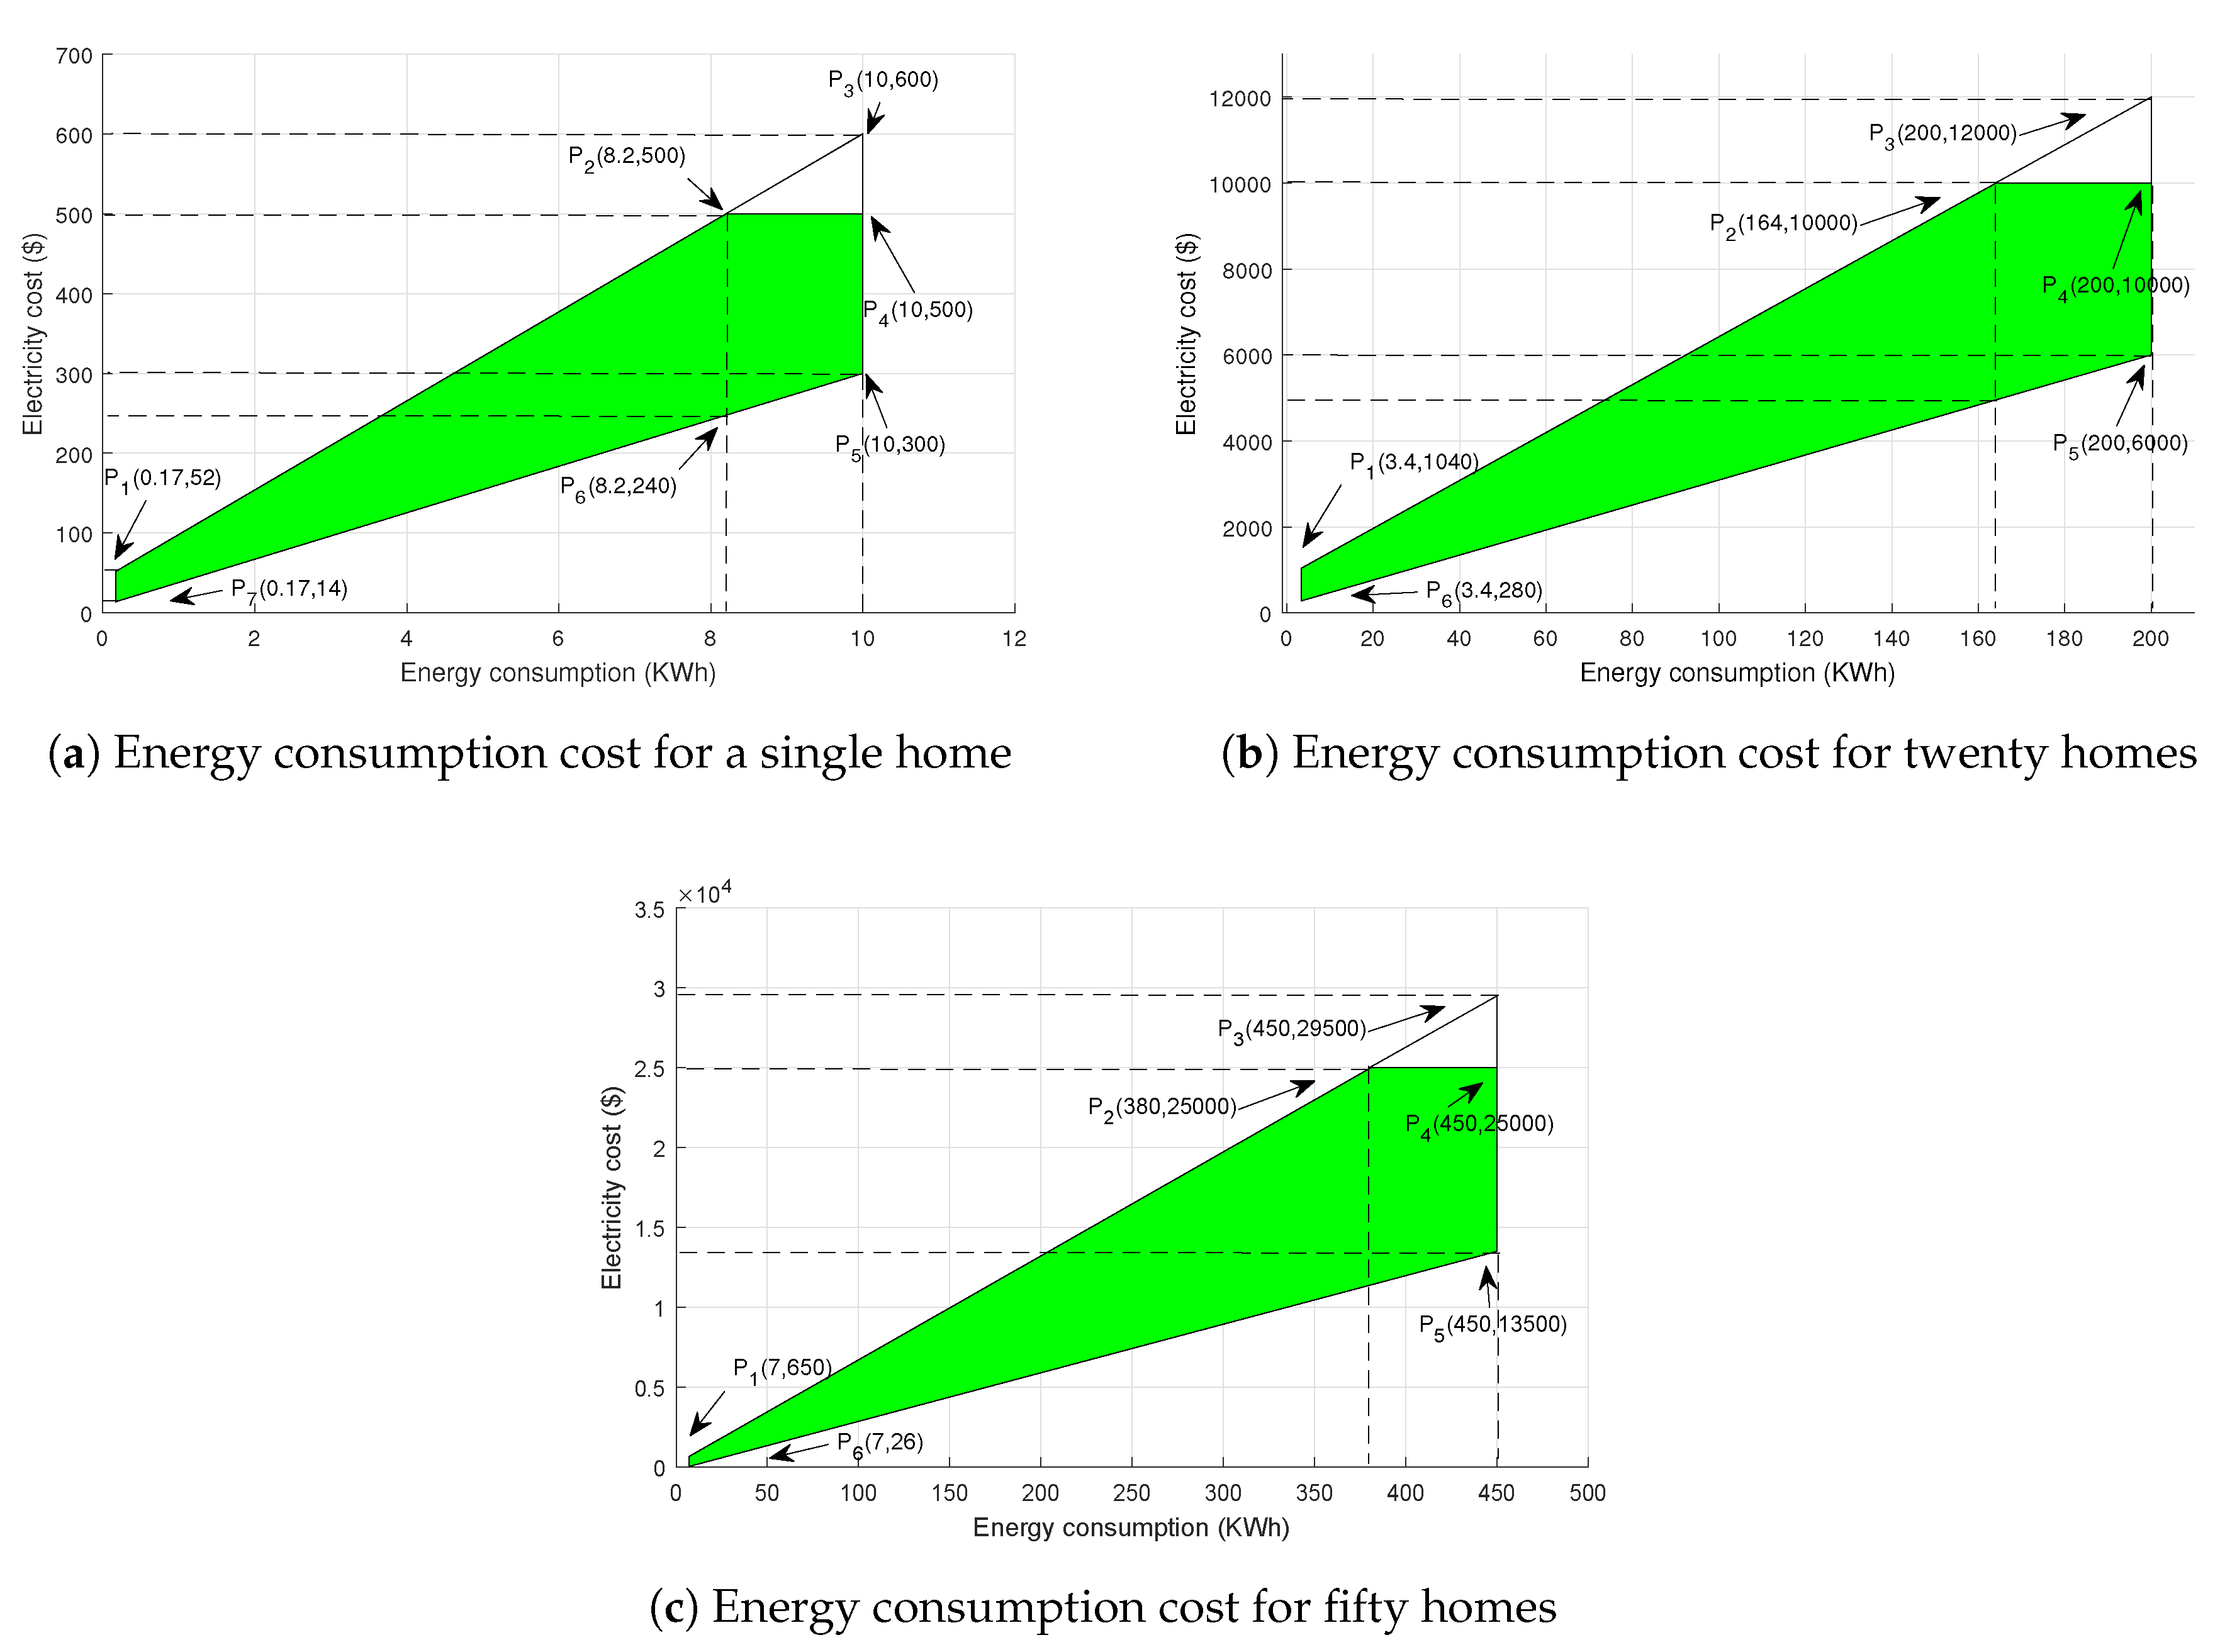
8.1. Feasible Region for Energy Consumption Cost
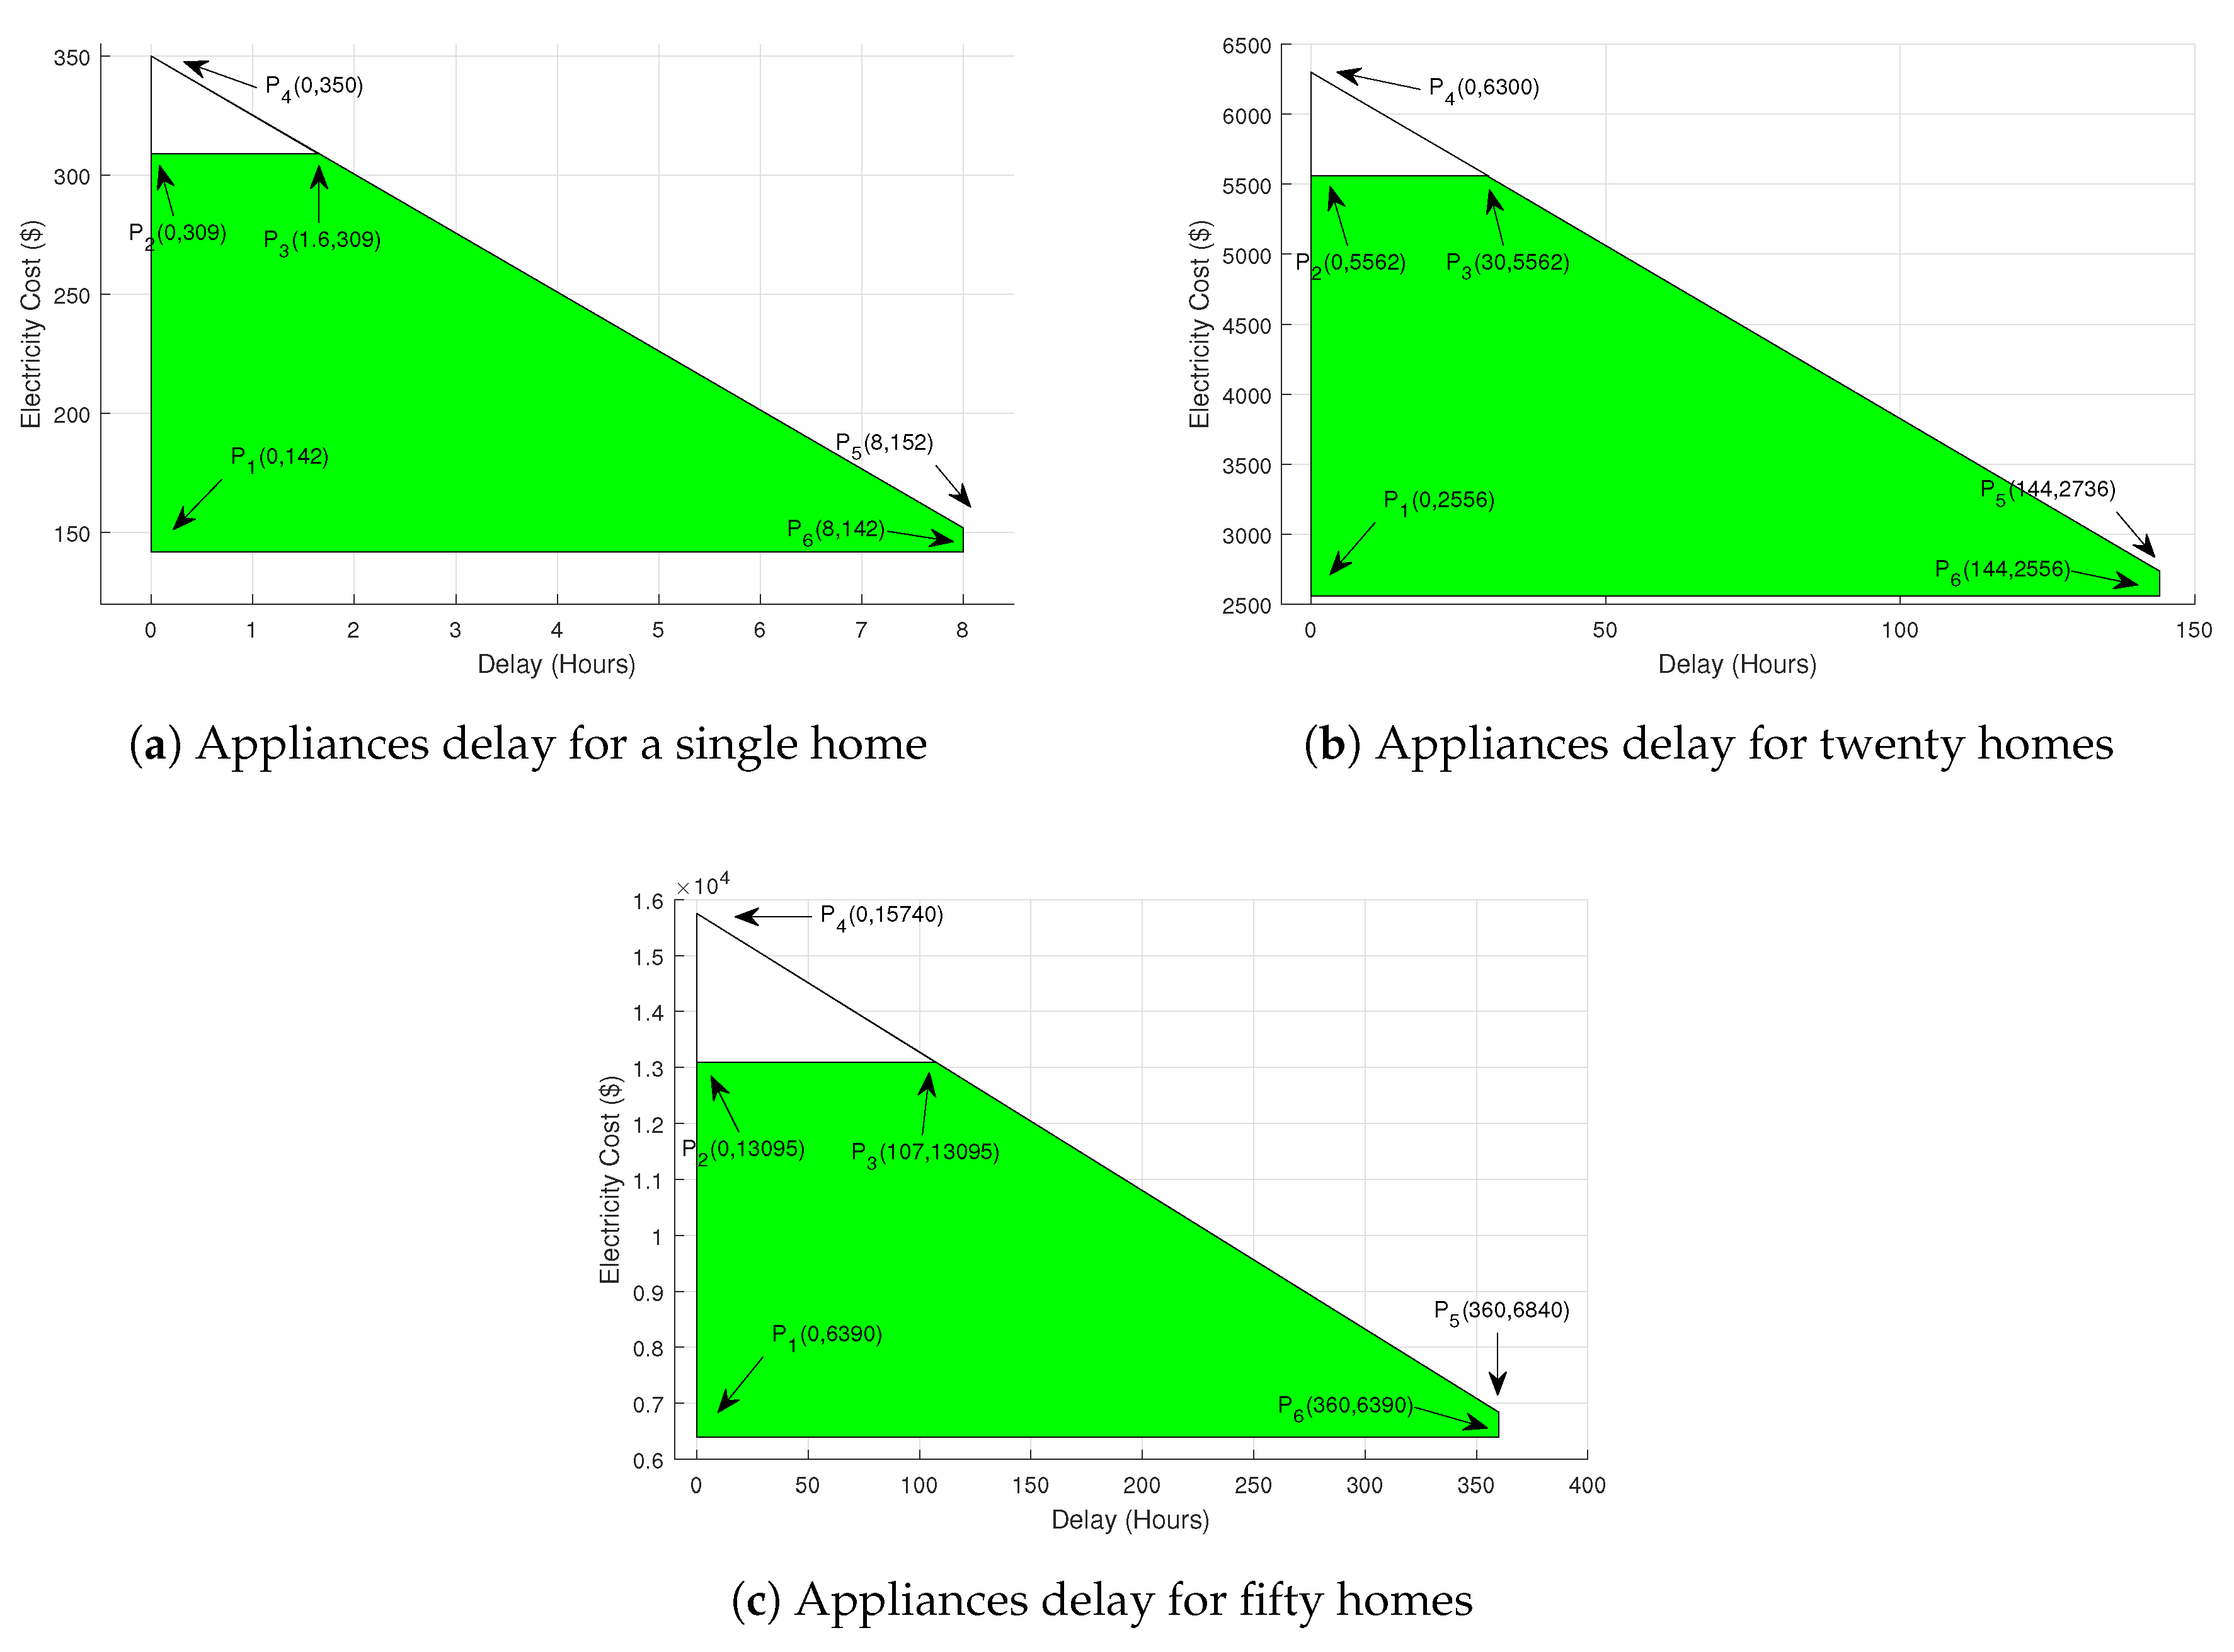
8.2. Feasible Region for Delay of Appliances
9. Conclusions
Author Contributions
Conflicts of Interest
References
- Howell, S.; Rezgui, Y.; Hippolyte, J.L.; Jayan, B.; Li, H. Towards the next generation of smart grids: Semantic and holonic multi-agent management of distributed energy resources. Renew. Sustain. Energy Rev. 2017, 77, 193–214. [Google Scholar] [CrossRef]
- Pasetti, M.; Rinaldi, S.; Manerba, D. A Virtual Power Plant Architecture for the Demand-Side Management of Smart Prosumers. Appl. Sci. 2018, 8, 432. [Google Scholar] [CrossRef]
- Gellings, C.W. The Concept of Demand-Side Management for Electric Utilities. Proc. IEEE 1985, 73, 1468–1470. [Google Scholar] [CrossRef]
- Ghazvini, M.A.F.; Soares, J.; Abrishambaf, O.; Castro, R.; Vale, Z. Demand response implementation in smart households. Energy Build. 2017, 143, 129–148. [Google Scholar] [CrossRef]
- Ahmed, A.; Manzoor, A.; Khan, A.; Zeb, A.; Madni, H.A.; Qasim, U.; Khan, Z.A.; Javaid, N. Performance Measurement of Energy Management Controller Using Heuristic Techniques. In Conference on Complex, Intelligent, and Software Intensive Systems; Springer: Cham, Switzerland, 2017; pp. 181–188. [Google Scholar]
- Zhang, Q.; Wang, X.; Fu, M. Optimal implementation strategies for critical peak pricing. In Proceedings of the 2009 6th International Conference on the European Energy Market (EEM 2009), Leuven, Belgium, 27–29 May 2009; pp. 1–6. [Google Scholar]
- Khan, A.R.; Mahmood, A.; Safdar, A.; Khan, Z.A.; Khan, N.A. Load forecasting, dynamic pricing and DSM in smart grid: A review. Renew. Sustain. Energy Rev. 2016, 54, 1311–1322. [Google Scholar] [CrossRef]
- Aslam, S.; Iqbal, Z.; Javaid, N.; Khan, Z.A.; Aurangzeb, K.; Haider, S.I. Towards Efficient Energy Management of Smart Buildings Exploiting Heuristic Optimization with Real Time and Critical Peak Pricing Schemes. Energies 2017, 10, 2065. [Google Scholar] [CrossRef]
- Mitra, K.; Dutta, G. Electricity Consumption Scheduling with Energy Storage, Home-Based Renewable Energy Production and A Customized Dynamic Pricing Scheme; No. WP 2016-11-01; Indian Institute of Management Ahmedabad, Research and Publication Department: Ahmedabad, India, 2016. [Google Scholar]
- Gupta, I.; Anandini, G.N.; Gupta, M. An hour wise device scheduling approach for demand side management in smart grid using particle swarm optimization. In Proceedings of the 2016 National Power Systems Conference (NPSC), Bhubaneswar, India, 19–21 December 2016; pp. 1–6. [Google Scholar]
- Ahmed, N.; Levorato, M.; Li, G.-P. Residential Consumer-Centric Demand Side Management. IEEE Trans. Smart Grid 2017. [Google Scholar] [CrossRef]
- Li, C.; Yu, X.; Yu, W.; Chen, G.; Wang, J. Efficient computation for sparse load shifting in demand side management. IEEE Trans. Smart Grid 2017, 8, 250–261. [Google Scholar] [CrossRef]
- Nguyen, H.K.; Song, J.B.; Han, Z. Distributed demand side management with energy storage in smart grid. IEEE Trans. Parallel Distrib. Syst. 2015, 26, 3346–3357. [Google Scholar] [CrossRef]
- Bharathi, C.; Rekha, D.; Vijayakumar, V. Genetic Algorithm Based Demand Side Management for Smart Grid. Wirel. Pers. Commun. 2017, 93, 481–502. [Google Scholar] [CrossRef]
- Arif, A.; Javed, F.; Arshad, N. Integrating renewables economic dispatch with demand side management in micro-grids: A genetic algorithm-based approach. Energy Effic. 2014, 7, 271–284. [Google Scholar] [CrossRef]
- Pampara, G.; Engelbrecht, A.P.; Franken, N. Binary differential evolution. In Proceedings of the 2016 IEEE Congress on Evolutionary Computation (CEC 2006), Vancouver, BC, Canada, 16–21 July 2006; pp. 1873–1879. [Google Scholar]
- Zazo, J.; Zazo, S.; Macua, S.V. Robust Worst-Case Analysis of Demand-Side Management in Smart Grids. IEEE Trans. Smart Grid 2017, 8, 662–673. [Google Scholar] [CrossRef]
- Atzeni, I.; Ordóñez, L.G.; Scutari, G.; Palomar, D.P.; Fonollosa, J.R. Demand-side management via distributed energy generation and storage optimization. IEEE Trans. Smart Grid 2013, 4, 866–876. [Google Scholar] [CrossRef]
- Moon, S.; Lee, J.-W. Multi-Residential Demand Response Scheduling with Multi-Class Appliances in Smart Grid. IEEE Trans. Smart Grid 2016. [Google Scholar] [CrossRef]
- Vardakas, J.S.; Zorba, N.; Verikoukis, C.V. Power demand control scenarios for smart grid applications with finite number of appliances. Appl. Energy 2016, 162, 83–98. [Google Scholar] [CrossRef] [Green Version]
- Brahman, F.; Honarmand, M.; Jadid, S. Optimal electrical and thermal energy management of a residential energy hub, integrating demand response and energy storage system. Energy Build. 2015, 90, 65–75. [Google Scholar] [CrossRef]
- Pedrasa, M.A.A.; Spooner, T.D.; MacGill, I.F. Coordinated scheduling of residential distributed energy resources to optimize smart home energy services. IEEE Trans. Smart Grid 2010, 1, 134–143. [Google Scholar] [CrossRef]
- Khomami, H.P.; Javidi, M.H. An efficient home energy management system for automated residential demand response. In Proceedings of the 2013 13th International Conference on Environment and Electrical Engineering (EEEIC), Wroclaw, Poland, 1–3 November 2013; pp. 307–312. [Google Scholar]
- Bozchalui, M.C.; Hashmi, A.A.; Hassen, H.; Cañizares, C.A.; Bhattacharya, K. Optimal operation of residential energy hubs in smart grids. IEEE Trans. Smart Grid 2012, 3, 1755–1766. [Google Scholar] [CrossRef]
- Hussain, H.M.; Javaid, N.; Iqbal, S.; Ul Hasan, Q.; Aurangzeb, K.; Alhussein, M. An Efficient Demand Side Management System with a New Optimized Home Energy Management Controller in Smart Grid. Energies 2018, 11, 190. [Google Scholar] [CrossRef]
- Ma, K.; Yao, T.; Yang, J.; Guan, X. Residential power scheduling for demand response in smart grid. Int. J. Electr. Power Energy Syst. 2016, 78, 320–325. [Google Scholar] [CrossRef]
- Depuru, S.S.S.R.; Wang, L.; Dev-abhaktuni, V. Smart meters for power grid: Challenges, issues, advantages and status. Renew. Sustain. Energy Rev. 2011, 15, 2736–2742. [Google Scholar] [CrossRef]
- Man, K.L.; Yue, Y.; Lu, C.; Huang, Q. System design, analysis and optimization of Li-Fi based energy harvesting embedded systems for “Internet of Things” applications. In Proceedings of the International Conference on Internet of Things and Convergence, Jeju Island, Korea, 28–30 October 2015; pp. 189–192. [Google Scholar]
- Huang, Q.; Li, X.; Shaurette, M.; Cox, R.F. Novel Sensor Network Architecture for Intelligent Building Environment Monitoring and Management. In Proceedings of the 2011 Computing in Civil Engineering, Miami, FL, USA, 19–22 June 2011; pp. 347–354. [Google Scholar]
- Ahmed, A.; Rahim, M.H.; Feroze, F.; Zafar, A.; Fatima, I.; Aslam, S.; Javaid, N. Swarm Intelligence Based Home Energy Management Controller Under Dynamic Pricing Scheme. In Proceedings of the International Conference on Broadband and Wireless Computing, Communication and Applications, Barcelona, Spain, 8–10 November 2017; Springer: Cham, Switzerland, 2017; pp. 256–266. [Google Scholar]
- Vardakas, J.S.; Zorba, N.; Verikoukis, C.V. A survey on demand response programs in smart grids: Pricing methods and optimization algorithms. IEEE Commun. Surv. Tutor. 2015, 17, 152–178. [Google Scholar] [CrossRef]
- Li, Z.; Huang, H.; Zang, C.; Yu, H. Day-ahead real-time pricing strategy based on the price-time-type elasticity of demand. In Proceedings of the 2013 15th IEEE International Conference on Communication Technology (ICCT), Guilin, China, 17–19 November 2013; pp. 449–455. [Google Scholar]
- Strengers, Y. Peak electricity demand and social practice theories: Reframing the role of change agents in the energy sector. Energy Policy 2012, 44, 226–234. [Google Scholar] [CrossRef]
- Su, W.; Huang, A.Q. Proposing a electricity market framework for the Energy Internet. In Proceedings of the Power and Energy Society General Meeting (PES), Vancouver, BC, Canada, 21–25 July 2013; pp. 1–5. [Google Scholar]
- Rao, R. Review of applications of TLBO algorithm and a tutorial for beginners to solve the unconstrained and constrained optimization problems. Decis. Sci. Lett. 2016, 5, 1–30. [Google Scholar]
- Arafa, M.; Sallam, E.A.; Fahmy, M.M. An enhanced differential evolution optimization algorithm. In Proceedings of the 2014 Fourth International Conference on Digital Information and Communication Technology and It’s Applications (DICTAP), Bangkok, Thailand, 6–8 May 2014; pp. 216–225. [Google Scholar]


| Appliance | Time Factor | Operational Time (Hour) |
|---|---|---|
| Cloth Dryer | 1.0 1.5 | 12 |
| Refrigerator | 1.0 1.5 | 24 |
| Dishwasher | 1.0 1.5 | 9 |
| Scheme | Priority | Monthly Cost ($) | Cost Reduction | Average Delay in Hours/Month |
|---|---|---|---|---|
| HT | 1.5 | 21.17 | 45% | 3.72 |
| 1.0 | 11.76 | 60% | 5.72 | |
| TLBO | 1.5 | 23.20 | 40% | 3.25 |
| 1.0 | 15.47 | 60% | 5.42 | |
| EDE | 1.5 | 25.76 | 33% | 2.83 |
| 1.0 | 17.71 | 53% | 4.63 |
| Scheme | Priority | Monthly Cost ($) | Cost Reductiom | Average Delay in Hours/Month |
|---|---|---|---|---|
| HT | 1.5 | 22 | 42% | 4.34 |
| 1.0 | 14 | 65% | 6.66 | |
| TLBO | 1.5 | 24 | 37% | 4.00 |
| 1.0 | 16 | 58% | 5.66 | |
| EDE | 1.5 | 31 | 28% | 3.41 |
| 1.0 | 19 | 50% | 5.41 |
| Scheme | Priority | Monthly cost ($) | Cost reduction | Average Delay in Hours/Month |
|---|---|---|---|---|
| HT | 1.5 | 402 | 33% | 3.71 |
| 1.0 | 225 | 62% | 7.71 | |
| TLBO | 1.5 | 442 | 26% | 3.22 |
| 1.0 | 292 | 51% | 6.52 | |
| EDE | 1.5 | 524 | 12% | 2.01 |
| 1.0 | 309 | 48% | 5.01 |
| Scheme | Priority | Monthly cost ($) | Cost reduction | Average Delay in Hours/Month |
|---|---|---|---|---|
| HT | 1.5 | 420 | 30% | 6.77 |
| 1.0 | 252 | 58% | 10.77 | |
| TLBO | 1.5 | 456 | 25% | 6.53 |
| 1.0 | 348 | 41% | 8.78 | |
| EDE | 1.5 | 528 | 11% | 5.04 |
| 1.0 | 312 | 47% | 8.00 |
| Scheme | Priority | Monthly cost ($) | Cost reductiom | Average Delay in Hours/Month |
|---|---|---|---|---|
| HT | 1.5 | 56 | 19% | 1.72 |
| 1.0 | 36 | 48% | 3.72 | |
| TLBO | 1.5 | 59 | 15% | 1.65 |
| 1.0 | 42 | 40% | 3.11 | |
| EDE | 1.5 | 63 | 10% | 1.33 |
| 1.0 | 44 | 37% | 2.35 |
| Scheme | Priority | Monthly cost ($) | Cost reductiom | Average Delay in Hours/Month |
|---|---|---|---|---|
| HT | 1.5 | 60 | 14% | 2.11 |
| 1.0 | 38 | 45% | 4.11 | |
| TLBO | 1.5 | 65 | 07% | 2.02 |
| 1.0 | 43 | 38% | 3.77 | |
| EDE | 1.5 | 66 | 05% | 1.45 |
| 1.0 | 44 | 36% | 2.75 |
| Scheme | Monthly cost ($) | Cost reduction | Average Delay in Hours/Month |
|---|---|---|---|
| HT | 21.17 | 45% | 3.72 |
| TLBO | 23.20 | 40% | 3.25 |
| EDE | 25.76 | 33% | 2.83 |
© 2018 by the authors. Licensee MDPI, Basel, Switzerland. This article is an open access article distributed under the terms and conditions of the Creative Commons Attribution (CC BY) license (http://creativecommons.org/licenses/by/4.0/).
Share and Cite
Javaid, N.; Ahmed, A.; Iqbal, S.; Ashraf, M. Day Ahead Real Time Pricing and Critical Peak Pricing Based Power Scheduling for Smart Homes with Different Duty Cycles. Energies 2018, 11, 1464. https://doi.org/10.3390/en11061464
Javaid N, Ahmed A, Iqbal S, Ashraf M. Day Ahead Real Time Pricing and Critical Peak Pricing Based Power Scheduling for Smart Homes with Different Duty Cycles. Energies. 2018; 11(6):1464. https://doi.org/10.3390/en11061464
Chicago/Turabian StyleJavaid, Nadeem, Adnan Ahmed, Sohail Iqbal, and Mahmood Ashraf. 2018. "Day Ahead Real Time Pricing and Critical Peak Pricing Based Power Scheduling for Smart Homes with Different Duty Cycles" Energies 11, no. 6: 1464. https://doi.org/10.3390/en11061464
APA StyleJavaid, N., Ahmed, A., Iqbal, S., & Ashraf, M. (2018). Day Ahead Real Time Pricing and Critical Peak Pricing Based Power Scheduling for Smart Homes with Different Duty Cycles. Energies, 11(6), 1464. https://doi.org/10.3390/en11061464