Article

Carbon Footprint of Electricity Generation in Brazil: An Analysis of the 2016–2026 Period

by
Murillo Vetroni Barros
*,
Cassiano Moro Piekarski
and
Antonio Carlos De Francisco
Sustainable Production Systems Laboratory (LESP), Postgraduate Program in Production Engineering (PPGEP), Federal University of Technology—Paraná (UTFPR), 84016-210 Ponta Grossa, Parana, Brazil
*
Author to whom correspondence should be addressed.
Energies 2018, 11(6), 1412; https://doi.org/10.3390/en11061412
Submission received: 23 February 2018 / Revised: 23 April 2018 / Accepted: 28 May 2018 / Published: 1 June 2018
(This article belongs to the Section L: Energy Sources)

Abstract

:
The present paper aims to evaluate the past and future environmental performance of the electricity generation in Brazil in terms of Global Warming Potential (GWP) and Global Temperature Potential (GTP). To that end, the Life Cycle Assessment (LCA) tool was used to evaluate the system’s environmental performance, based on ISO 14040 and ISO 14044, using the Ecoinvent v 3.3 database. This study provides data on global warming by the GWP and GTP 100 years impact category. The functional unit and reference flow is kWh. The model was applied to the electricity generation in Brazil for the years 2016–2026 using Umberto NXT Universal software. The results indicate that the greatest environmental impacts lie on generation sources such as oil, natural gas, hydropower and hard coal. Carbon dioxide was the main contributor to atmospheric emissions in the life cycle of the Brazilian electricity matrix in 2016 and 2026. The total potential impact (and per kWh) is expected to decrease until 2021. The Brazilian electricity matrix is expected to be less pollutant in terms of carbon footprint until 2021. The study can contribute to directing public policies, promoting development actions and encouraging different electricity matrices.

1. Introduction

1.1. Generation of Electricity in the Global Scenario

Over time, new means for electricity generation have been unveiled, whose obtainment and utilization has been demanded for the most diverse types of equipment—electronic, digital, domestic and industrial. Electricity can be obtained in a variety of ways from renewable and non-renewable sources. The electricity matrix stands out for the most varied sources [1].
There are non-renewable sources of electricity, which will likely be exhausted at a certain time, among them are the natural gas, oil and hard coal. At the same time, generating electricity from renewable sources is considered an attractive option for the environment [2]. Renewable energies or renewable sources are gaining prominence worldwide and providing clean electricity to the population through technological developments.
According to Montes-Romero et al. [3], the generation of solar power by photovoltaic cells is the renewable energy source that has grown the most in the last decade. Likewise, wind and sea water motion are other sources showing growth recently. In that sense, Lund et al. [4] pointed out two agreements made by the European Union to be achieved by 2020: a 20–30% increase in renewable energy and a 20% cut in CO2 emissions.

1.2. Production of Electricity in Brazil

In the Brazilian portfolio of electricity generation, hydroelectric plants have always been ahead due to the favorable terrain and numerous rivers and lakes in the country. This source received and still receives investments and shows development in the generation of electricity in Brazil. Brazilian electricity mix is undergoing some significant changes in recent years. Dale et al. [5] indicated that hydroelectric plants will continue to be the main source for electricity production in Brazil in the future, however, clean sources such as wind and solar have great growth potential.
Brazil is considered one of the countries that generates most of its consumed electricity from renewable sources. At the end of 2015, Brazil accounted for 74.0% of its grid being exclusively from renewable sources [1]. The electricity that reaches homes, companies and organizations, comes mostly from mixed sources [1].

1.3. Life Cycle Assessment

The search for knowledge on the potential impacts of each source that composes the Brazilian electricity matrix motivates the development of scientific research on the subject. In this sense, the Life Cycle Assessment (LCA) looms, which is a tool used in the assessment of potential environmental impacts.
Universities and research institutes mainly use the tool. In addition, it is a source of business opportunities that has been growing in recent years with life cycle environmental performance assessments. The structured LCA serves to estimate and evaluate the potential environmental impacts of a particular process, product or activity (ISO 14040 [6] and ISO 14044 [7]).
Some authors have attempted to explain the importance of LCA. According to Luz, Francisco and Piekarski [8], LCA is an important tool for environmental assessment. The LCA approach to the evaluation of electricity systems can be very useful, for it indicates areas that have a potential significant impact on the environment, considering relevant factors that allow comparison with different alternatives [9]. Such an approach can boost the technological progress that allows the energy system’s transition to a sustainable path in the medium and long terms.
Omwoma et al. [10] developed a literature review to show some technological tools, including LCA, to mitigate the environmental impacts of developing countries. Among the range of methodologies used to analyze environmental profiles, the most extensive method is the LCA [11]. According to Treyer, Bauer and Simons [12], only the use of LCA in accordance with the official standards of ISO (International Organization for Standardization) allows for a comprehensive and balanced comparative assessment of the environmental impacts.

1.4. Global Discussion on LCA of Electricity Systems

Several authors in different countries and universities have used LCA to conduct analyses of electricity matrices, such as Sengül et al. [13]; Atilgan and Azapagic [14]; Berrill et al. [15]; Garcia, Marques and Freire [16]; Lelek et al. [9]; Asdrubali et al. [17]; and Wolfram, Wiedmann and Diesendorf [18]. Different jurisdictions have addressed this issue, such as European countries, China, Australia, Canada, and Brazil. Thereupon, this study analyzed some studies to characterize the main advances and results found on the mentioned theme.
Sengül et al. [13] conducted a study on potential environmental impacts from the extraction of firewood for electricity generation in Turkey, which was assessed by means of LCA, based on data from 12 local mining sites. The authors used as Life Cycle Impact Assessment (LCIA) methods the CML (Center of Environmental Science of Leiden University), TRACI (Tool for the Reduction and Assessment of Chemical and Other Environmental Impacts) and ReCiPe; from that, it was possible to observe the local emissions and to quantify the environmental impacts. Moreover, as Turkey is a signatory to the Kyoto Protocol, the country’s sustainable energy technologies have been moving toward reducing Greenhouse Gas (GHG) emissions and environmental impacts related to electricity [14]. The search estimated the environmental impacts of electricity in Turkey for the first time based on the life cycle of the previous 25 years (1990–2014). Results suggest that the main impacts were related to eutrophication, destruction of the ozone layer and toxicity categories [14]. Kadiyala, Kommalapati and Huque [19] evaluated life cycle GHG emissions from the use of different biomass feedstock categories include electric power generation. The study by Berrill et al. [15] used a modeling framework integrated with hybrid LCA to examine 44 different scenarios for the supply of electricity in Europe in the year 2050. In Europe, Garcia, Marques and Freire [16] did a full LCA of electricity generation and supply in Portugal, which was conducted with the objective of analyzing the environmental effects of recent changes in the electricity system to understand future electricity demand and reduce potential environmental impacts.
For the first time, an LCA was carried out on the generation of electricity in Poland, with the objective of determining and comparing the potential impact of energy generation on the environment in the years 2007, 2010 and 2012 [9]. Those authors verified in the study that the highest GHG emissions were related to the production of electricity from hard coal. China is pursuing greener pathways for power generation; in this sense, a study was developed by Raj et al. [20] to quantify GHG emissions from shale gas imported from Canada.
Italy has developed a study to suggest a methodological approach to make a more viable comparison of the various renewable technologies, making better use of LCA results to inform politicians by conducting a review of more than 100 different case studies in solar, wind, hydropower and geothermal power generation technologies [17].
Australia developed, for the first time, a comprehensive LCA to analyze electricity generation scenarios. The approach was able to capture the carbon emissions embedded in the electricity supply chain. The study investigated how effective the large-scale application of renewable energy was, including the total emissions throughout the life cycle of different technologies. Australia enjoys the benefit of abundant fossil and renewable energy resources [18].

1.5. Brazilian Discussions on LCA of Electricity Systems

Studies on this subject in the Brazilian territory have been presenting interesting results, differing in applications and objective compared to the present work. Santos et al. [21] developed five scenarios for the Brazilian electricity sector for the year 2050, using multi-criteria evaluation that integrates four dimensions: economic, technical, environmental and social. Another study assessed the environmental impacts of construction operation and dismantling of hydroelectric power plants using the LCA [22]. Another piece of work, by Restrepo, Bazzo and Miyake [23], comprised an LCA in the southern region, on the generation of electricity through underground hard coal. Another resource was analyzed by Guerra et al. [24], comparing scenarios of cogeneration of electricity. The study assessed the production of sugar cane using the LCA and thermodynamic analysis [24]. In the same approach, Oebels and Pacca [25] carried out an LCA study of an on-shore wind farm for electricity generation from wind. In Brazil, Ribeiro and Silva [26] elaborated an LCIA on the electricity generation of a hydroelectric plant in the southern region.
One study in line with the present work was the one by Carvalho and Delgado [27]. Even so, some differences are noticed in their study and correspond to: the generation potential that was considered along with the stages of transmission, distribution and transformation; for the use of different software tools there might be differences in emissions; in the LCIA, the branches of the biomass source are considered jointly; and the period considered was 2001–2015 and there was only a projection for 2024 [27]. The similarities between the studies follow the use of the Intergovernmental Panel on Climate Change (IPCC) 2013 for Global Warming Potential (GWP 100 years) environmental impact assessment method. Another advance in the present paper refers to the projection for the period (2016–2026), while Carvalho and Delgado [27] used the projection for the year 2024 only.
Finally, this present paper calculated the GWP and Global Temperature Potential (GTP) for electricity consumption and therefore the present study is a pioneer in the calculation of GWP and GTP for electricity generation in Brazil (2016–2026).
The increase in the demand for electricity generation in Brazil requires studies like the present one to forecast potential environmental impacts in the electricity matrix up to 2026, providing data to stakeholders. Therefore, the present study responds to the need of assessing the GWP and GTP, comprehensively analyzing the electricity generation in Brazil, differing from other works already conducted in the country. In this study, nine different types of sources were evaluated. To the best of the authors’ knowledge, this work is unprecedented in the quantification of the carbon footprint for the electricity generation in Brazil in the period of 2016–2026 using LCA.
Furthermore, this work analyzed different types of sources (renewable and non-renewable) and this can help decision-makers in choosing sources which will be less impacting to the environment. Therefore, studies like this enrich national and global literature dealing with sustainable aspects.

1.6. Purpose and Scope of the Analysis

The aim of this study was to evaluate the past and future environmental performance of electricity generation in Brazil in terms of GWP and GTP.
This paper provides knowledge on the environmental evaluation of the electricity mix in Brazil (2016–2026). To guarantee consistency of the research, the performance indicators were calculated according to the same database (Ecoinvent) [28], supported by data from Brazil, such as the Ministry of Mines and Energy (MME) and Energy Research Company (EPE) in Brazil [29] and the National Agency of Electric Energy (ANEEL) [30]. In addition, the application of LCA to electrical systems is important to understand the future demand for electricity and to reduce the potential environmental impacts generated by electricity production. Similar to the study by Batista and Francisco [31], it is intended to support decision-making processes on sustainability aspects in the environmental dimension.
This paper is organized as follows. Section 1 presents the initial considerations and objective of the study. Section 2 presents the characterization of the Brazilian electricity mix. Section 3 shows the methods to build the study. Section 4 presents the results and discussion. Section 5 draws on this study’s main conclusions and further investigations.

2. Characterization of the Brazilian Electricity Matrix

Although this study analyzed the electricity generation in Brazil, this section presents data on installed capacity. In this way, we can understand the influence of installed capacity on generation.
The installed electricity capacity in Brazil is characterized by a high contribution of renewable sources [1]. Between 2014 and 2024, there will be an increase in the installed electricity capacity, as shown in Figure 1 for hydropower and Figure 2 for others sources.
In Figure 1, hydropower includes small hydro. In Figure 2, Import represents the installed capacity of energy that is imported into Brazil from four countries: Paraguay, Argentina, Venezuela and Uruguay. Non-renewable energy represents nuclear, natural gas, hard coal, oil, diesel oil and process gas.
The growth of the installed electricity capacity in Brazil is evident. The relative increase of the generation power for the electricity matrix in the period 2014–2024 is 64.19%. Hydropower represents the main source of electricity in the country. On this ground, Brazil has been the world leader in having one of the most renewable-sourced electricity matrices.
According to Figure 1, the hydroelectric sector showed installed power of 87,789 MW (megawatt) in 2014, which could reach 117,972 MW in 2024. Therefore, its relative participation in 2014 was 66.07% and could reach 56.99% of installed electricity capacity in 2024. This reduction in the relative participation occurs due to the increase of other sources in the Brazilian electricity scenario until 2024. Hydropower will continue receiving incentives in the next years for expanding the generation capacity in the country.
The installed capacity from wind power (a renewable and inexhaustible source) in 2014 presented the value of 5000 MW and 10 years later could rise to 24,000 MW. The capacity of producing wind power will more than quadruple by 2024, driven by investments that will occur with installation of turbines in wind farms. Another example of renewable energy is the solar one. It has constantly had technological and economical advances. Between 2014 and 2024, there will be an increase from 0.36% to 3.38% in the installed electricity capacity contribution to the total Brazilian energy mix by the use of photovoltaic panels, according to Figure 2.
Regarding natural gas, even though it is considered a non-renewable source, public policies will continue to invest in its growth in the coming years due to the raw material and generation plants already existing and installed in Brazil. Natural gas represents a considerable contribution to the installed electricity capacity in Brazil. In 2014, it achieved 11,043 MW and by 2024 it could reach 21,219 MW.
What is projected throughout this period is the beginning of a process of diversification of the country’s electricity matrix: even though there will still be predominance of hydropower, there will be a significant growth of other renewable sources. It is noted that up to 2024 the growth is oriented to renewable sources, mainly hydropower, wind and biomass.

3. Methodology

For a promising future in terms of reducing environmental impacts, reducing the carbon footprint is extremely necessary, since governments and organizations of the energy sector can use the results to support their decision on the energy sources in Brazil. In this sense, the use of LCA can bring valuable results to this research.
This section describes the steps for building this study: a context of what LCA means, followed by the impact category used, the system boundaries and software approaches. In addition, adaptations and assumptions considered and extraction of the secondary data and handling to structure the Life Cycle Inventory (LCI) are shown below.

3.1. LCA

The environmental impacts associated with the electricity generation in Brazil from 2016 to 2026 were evaluated using the LCA tool based on ISO 14040 [6] and ISO 14044 [7]. LCA allows considering the stages from the extraction of the primary raw materials that enter a productive process until their final disposal. Therefore, the tool was used in the present study due to its importance in the academic and business environments, as well as being linked to the area of sustainability, which is a major issue for the present and the future of the planet.

3.1.1. Purpose, Scope and Inventory Analysis

In terms of LCA, this study aimed to calculate the GWP and GTP of electricity generation in Brazil from 2016 to 2026 to analyze the country’s environmental profile. The study covered the life cycle of the installed electricity capacity in Brazil from cradle-to-gate (C2G).
The data to compose the electricity generation in Brazil and for the construction of the LCI were extracted from Brazil [29] and ANEEL [30]. The inventories used during modeling were from the Ecoinvent [28] database. The functional unit and reference flow for this assessment was the production of 1 kWh (kilowatt hour) of electricity generation in Brazil.
The system’s inputs represent the natural resources for the electricity generation and the outputs, depending on the source, comprise emissions to air, water and soil, based on Ecoinvent v.3.3. The analysis was developed using the Umberto NXT Universal software (version 7.1.13, ifu Hamburg, Hamburg, Germany).

3.1.2. Impact Assessment

The GWP and GWP impact category were evaluated using the IPCC 2013 method. The IPCC addresses the issue of climate change and GWP for 100 years considering GHG emissions (kg CO2equiv.). This is the main method used for environmental assessment of GHG emissions of electricity matrices. Furthermore, one of the main methods for assessing climate change is the IPCC. The data represent the conversion of GHG emissions (other than CO2) into CO2 equivalents so they can be compared. Each GHG has a different GWP and remains for a different length of time in the atmosphere. For instance, CO2 represents 1 kg CO2equiv. for 100-year GWP.
According to EFCTC [32], “GWP is defined as the increase in Radiative Forcing (RF) of the emission of one kilogram of the subject gas, relative to the increase in RF from release of one kilogram of carbon dioxide at the same time”. In addition, compared to GWP, the GTP goes one step further down the cause–effect chain and is defined as the change in global mean surface temperature at a chosen point in time in response to an emission pulse—relative to that of carbon dioxide. “While GWP is integrated in time, GTP is an end-point metric which is based on temperature change for a selected year” [32].

3.1.3. Adaptations, Assumptions and Cut Criteria

Some premises were adopted in the work. The data below were taken from the Ecoinvent [28] ready inventories to Brazil. Table 1 shows the process names and specific emissions (kg CO2equiv./kWh) for each technology for GWP.
  • All sources were considered high voltage; only the solar was adapted to low voltage, because it was the only option in the database.
  • The solar energy system presented photovoltaic panels with 570 kWp (kilowatt power) with open ground installation.
  • The only source for which data were not from Brazil was the solar, where the geography used was the “Rest of World” (RoW).
  • Process names and specific emissions for each technology are found in Table.
There were inventories under Brazilian conditions for all the electricity sources searched in the Ecoinvent database, except for solar.

3.2. Scenario Definition to Perform the LCA and Construction of the LCI

This section described the secondary data used in this paper. Therefore, Table 2 shows electricity generation in Brazil (TWh and percent) and at the same time represents the LCI of this study.
The scenarios involved data on electricity generation in Brazil between the years 2016 and 2026. Nine sources were analyzed in the country. It is possible to evaluate and discuss the main improvements and losses over the years. Through the results, the main advances and setbacks can be shown by means of renewable and non-renewable sources.
Thus, to obtain this study’s LCI data, it was necessary to make an adaptation from the data provided by Brazil [29]: “A”; ANEEL [30]: “B” (to follow the references in Table 2). The relationship among the secondary data was used to structure Table 2, which shows the dataset used for the system’s modeling in the Umberto NXT Universal software. Table 2 shows the electricity generation (TWh) and relative amount in Brazil.
The LCI data used were the centralized generation, auto producers of electric power and distributed generation. The electricity generation by sugar cane is the main contributor to the biomass source. In Table 2, “wood and others” (forest residues) represent small amounts in the generation by biomass.

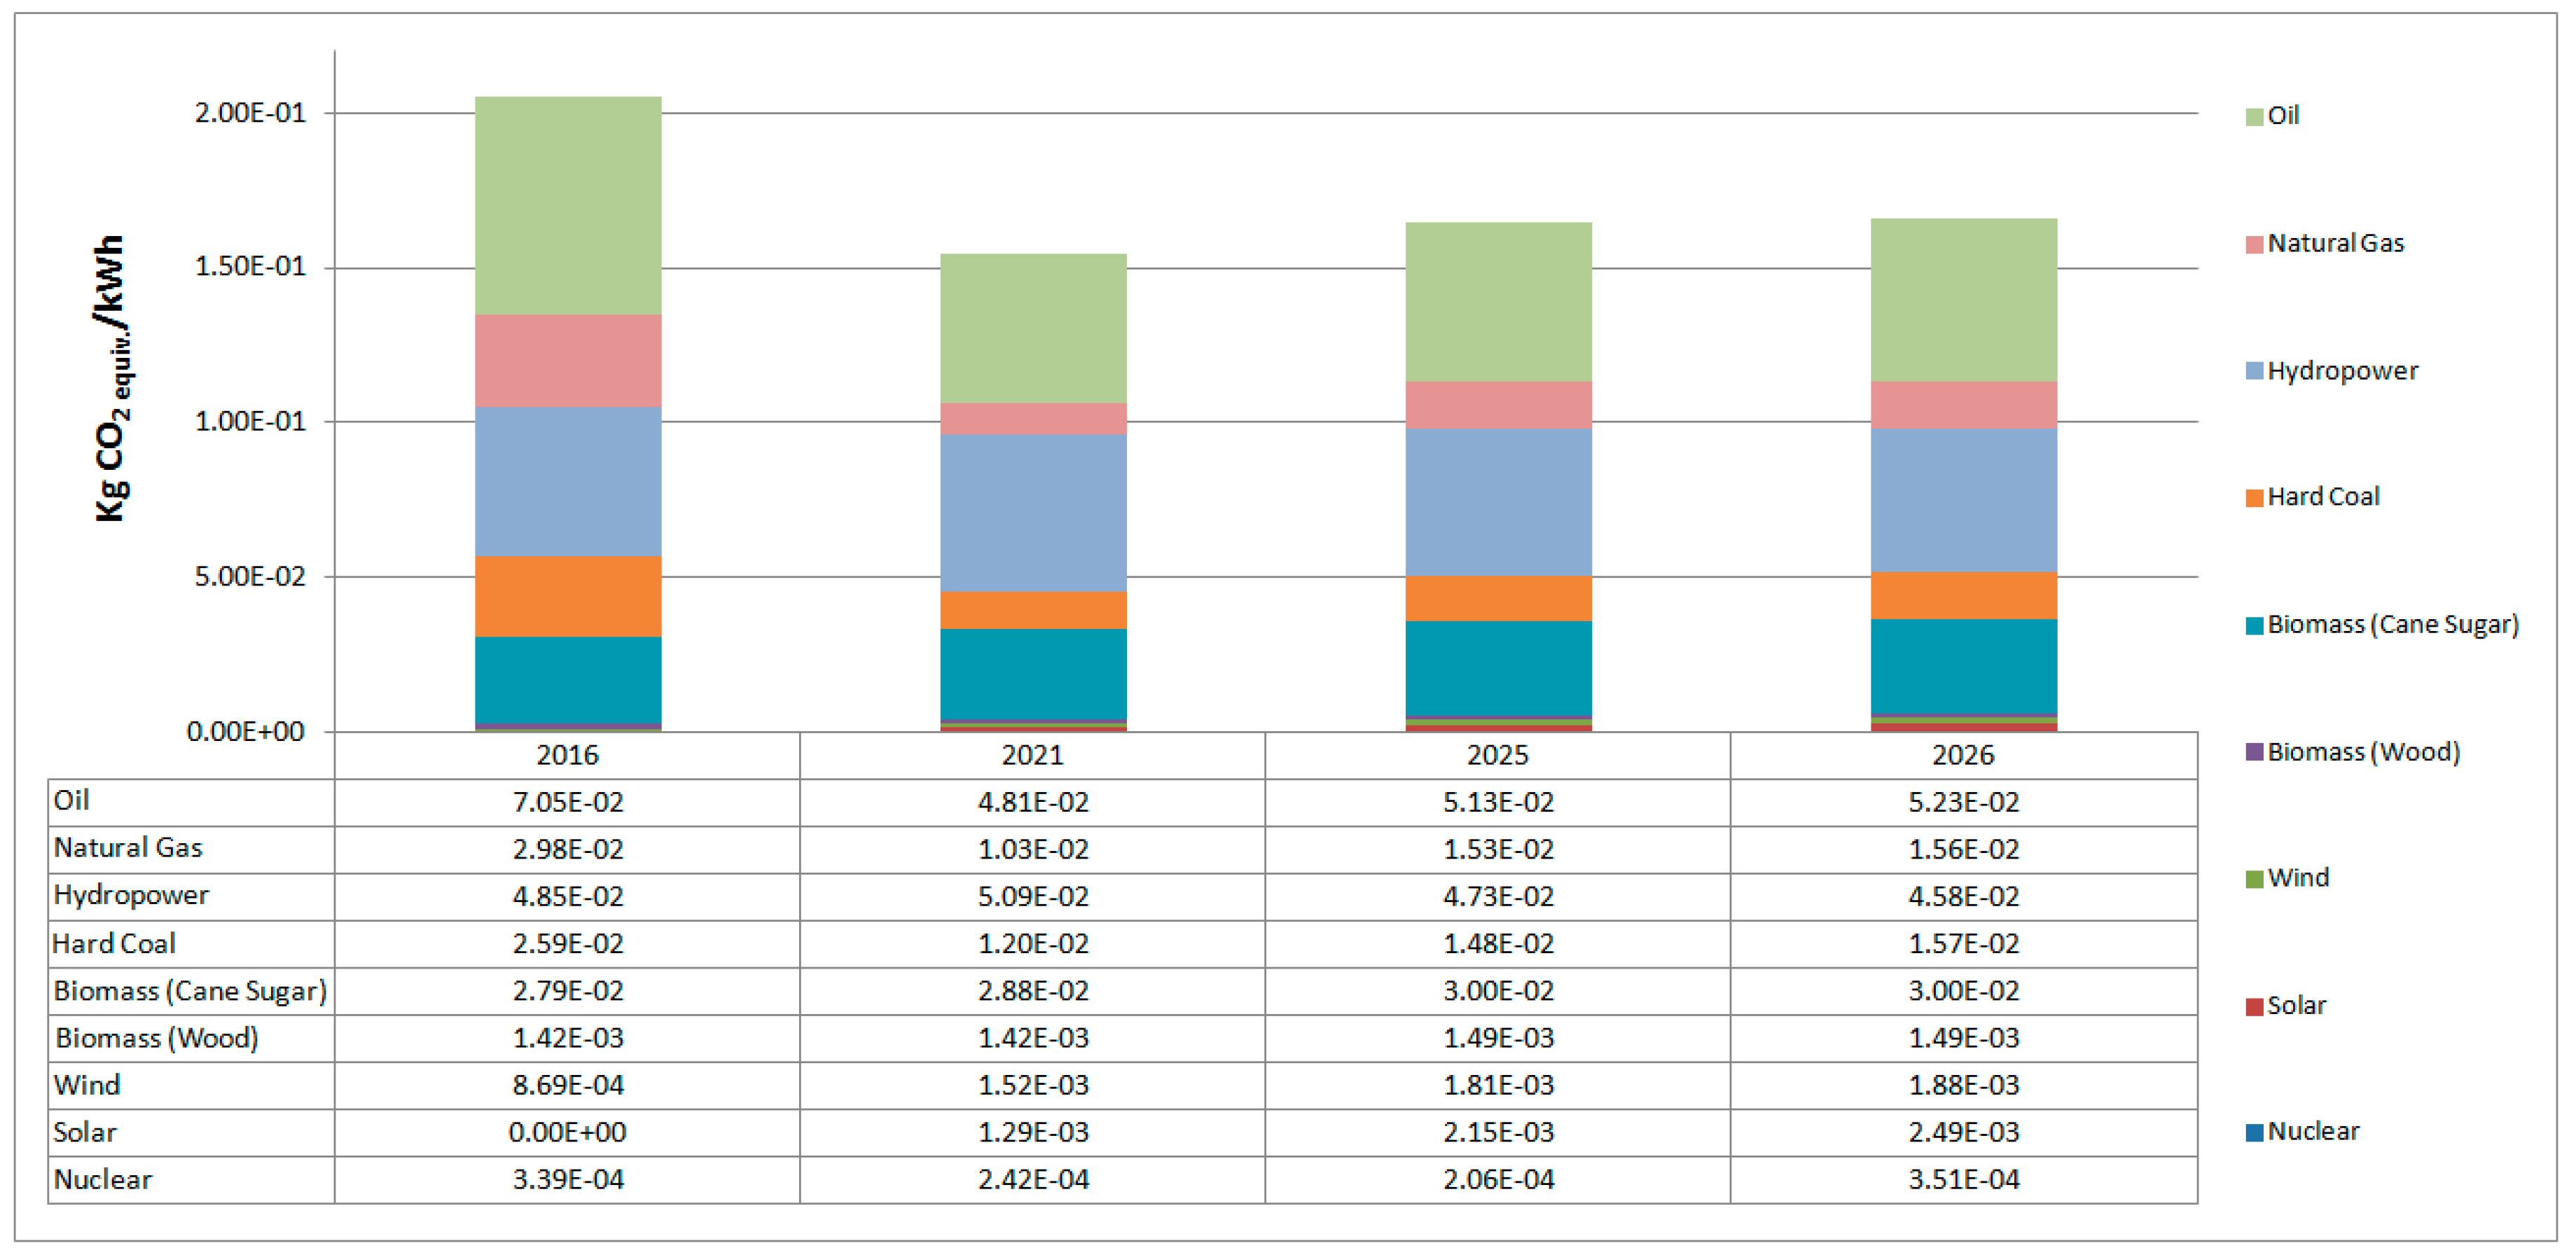
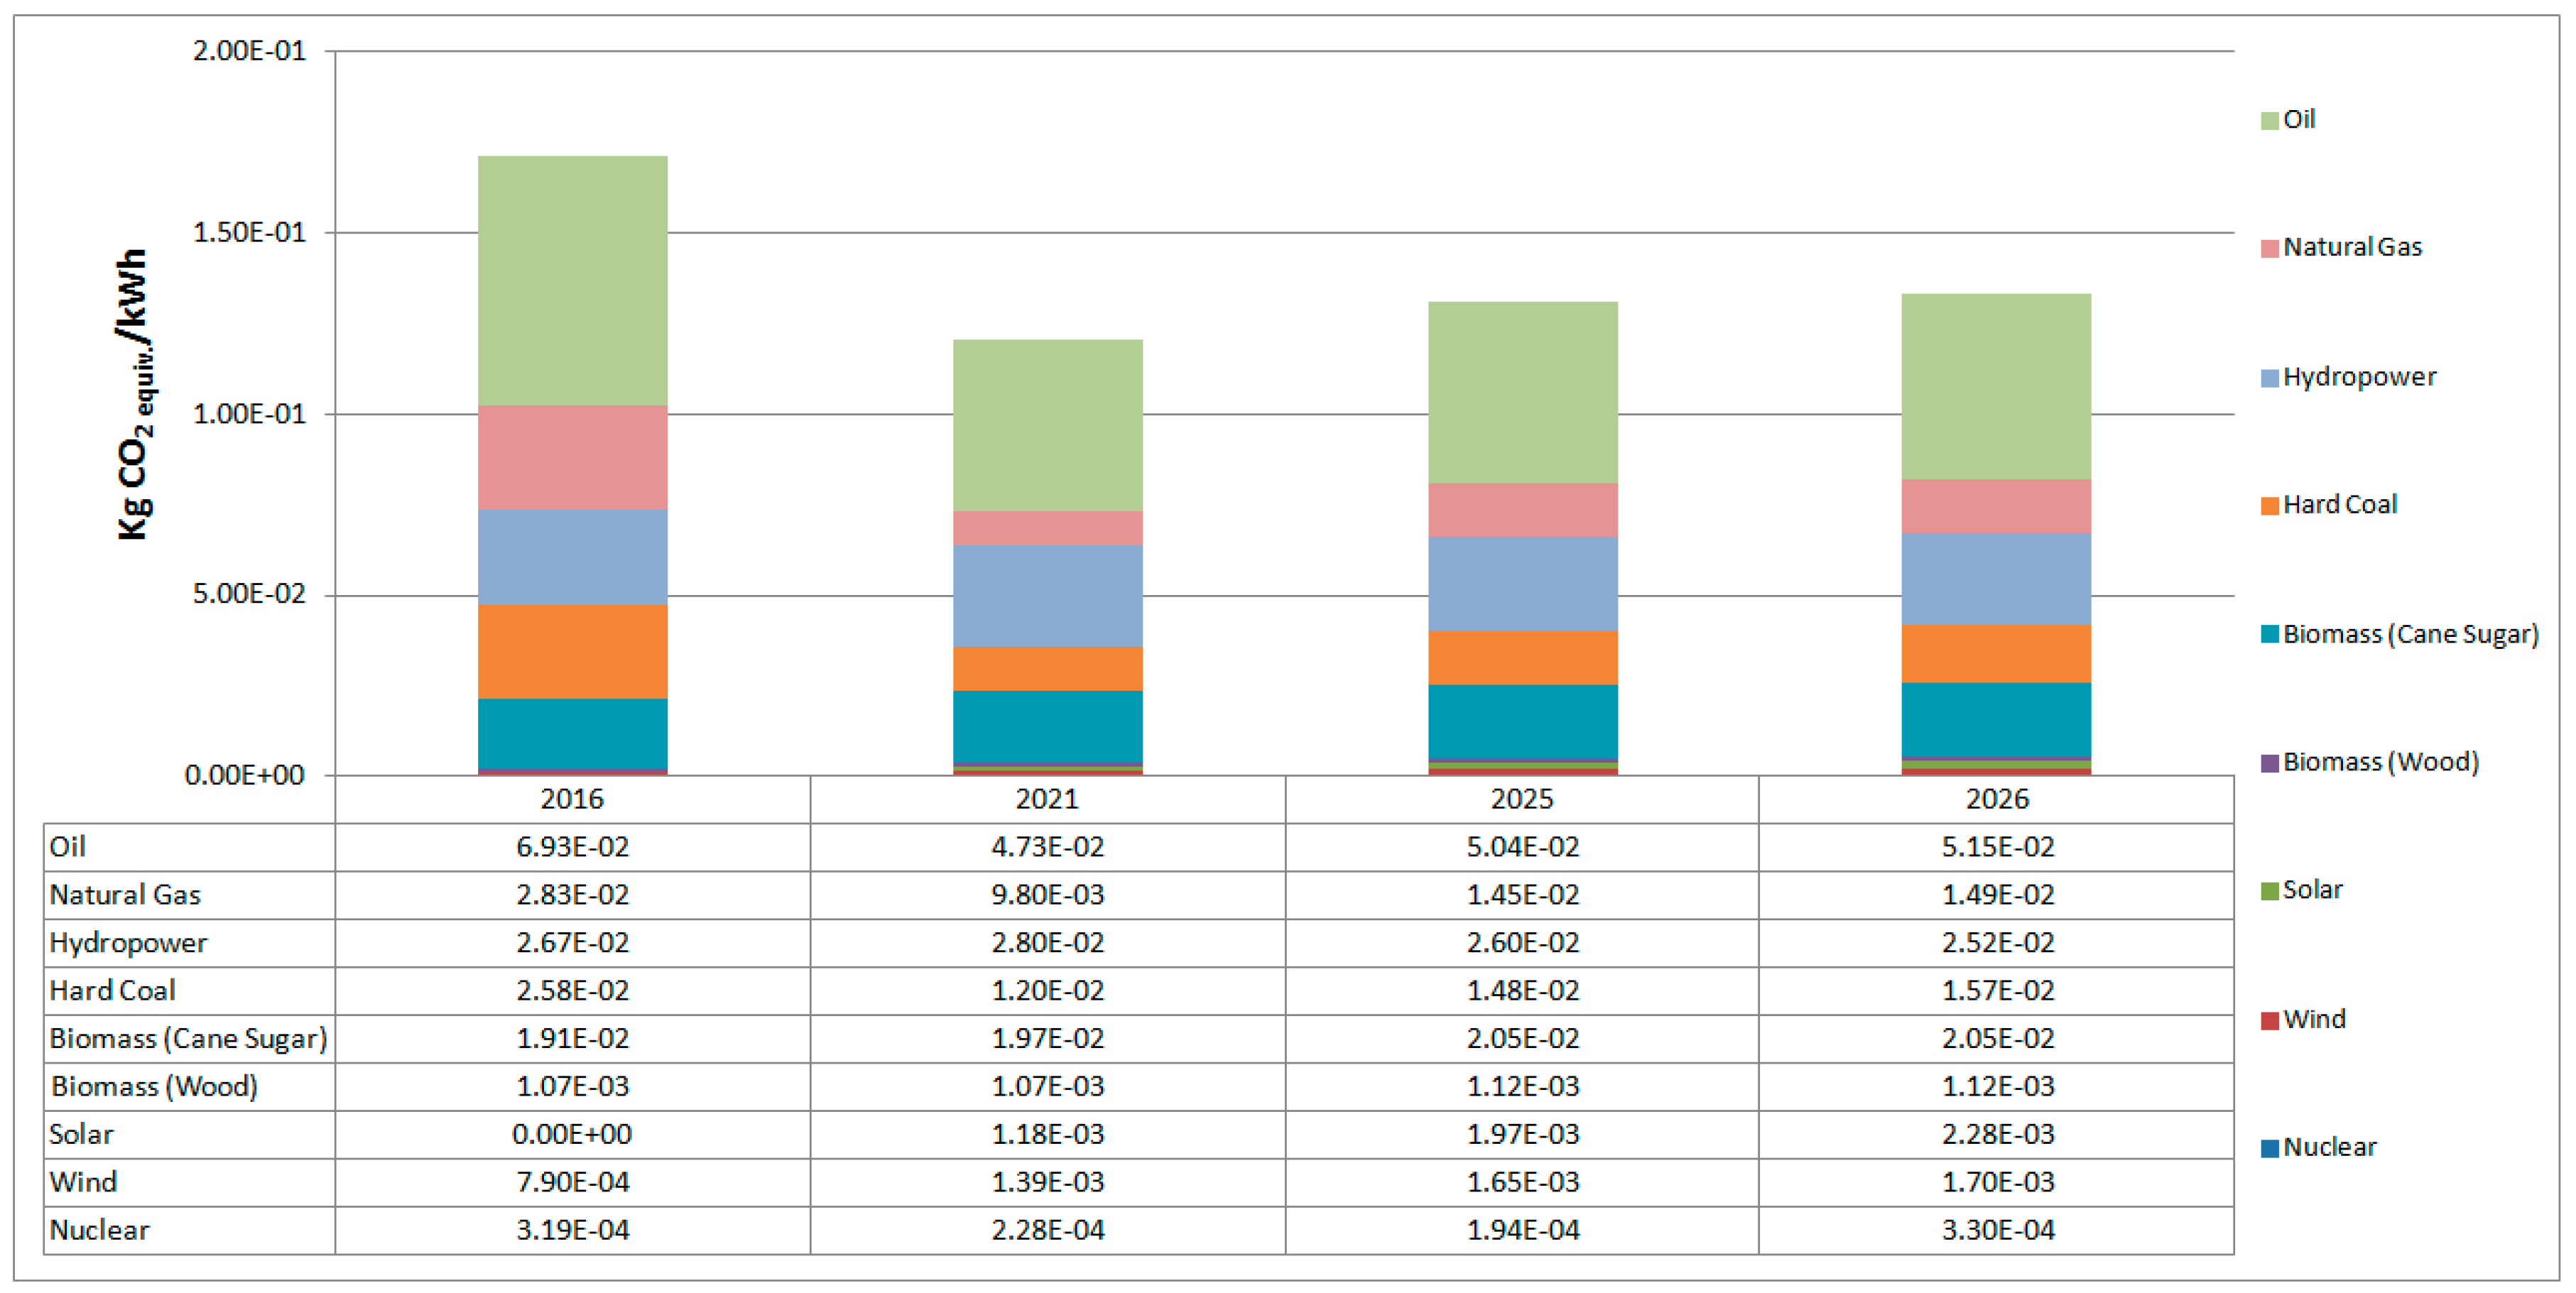
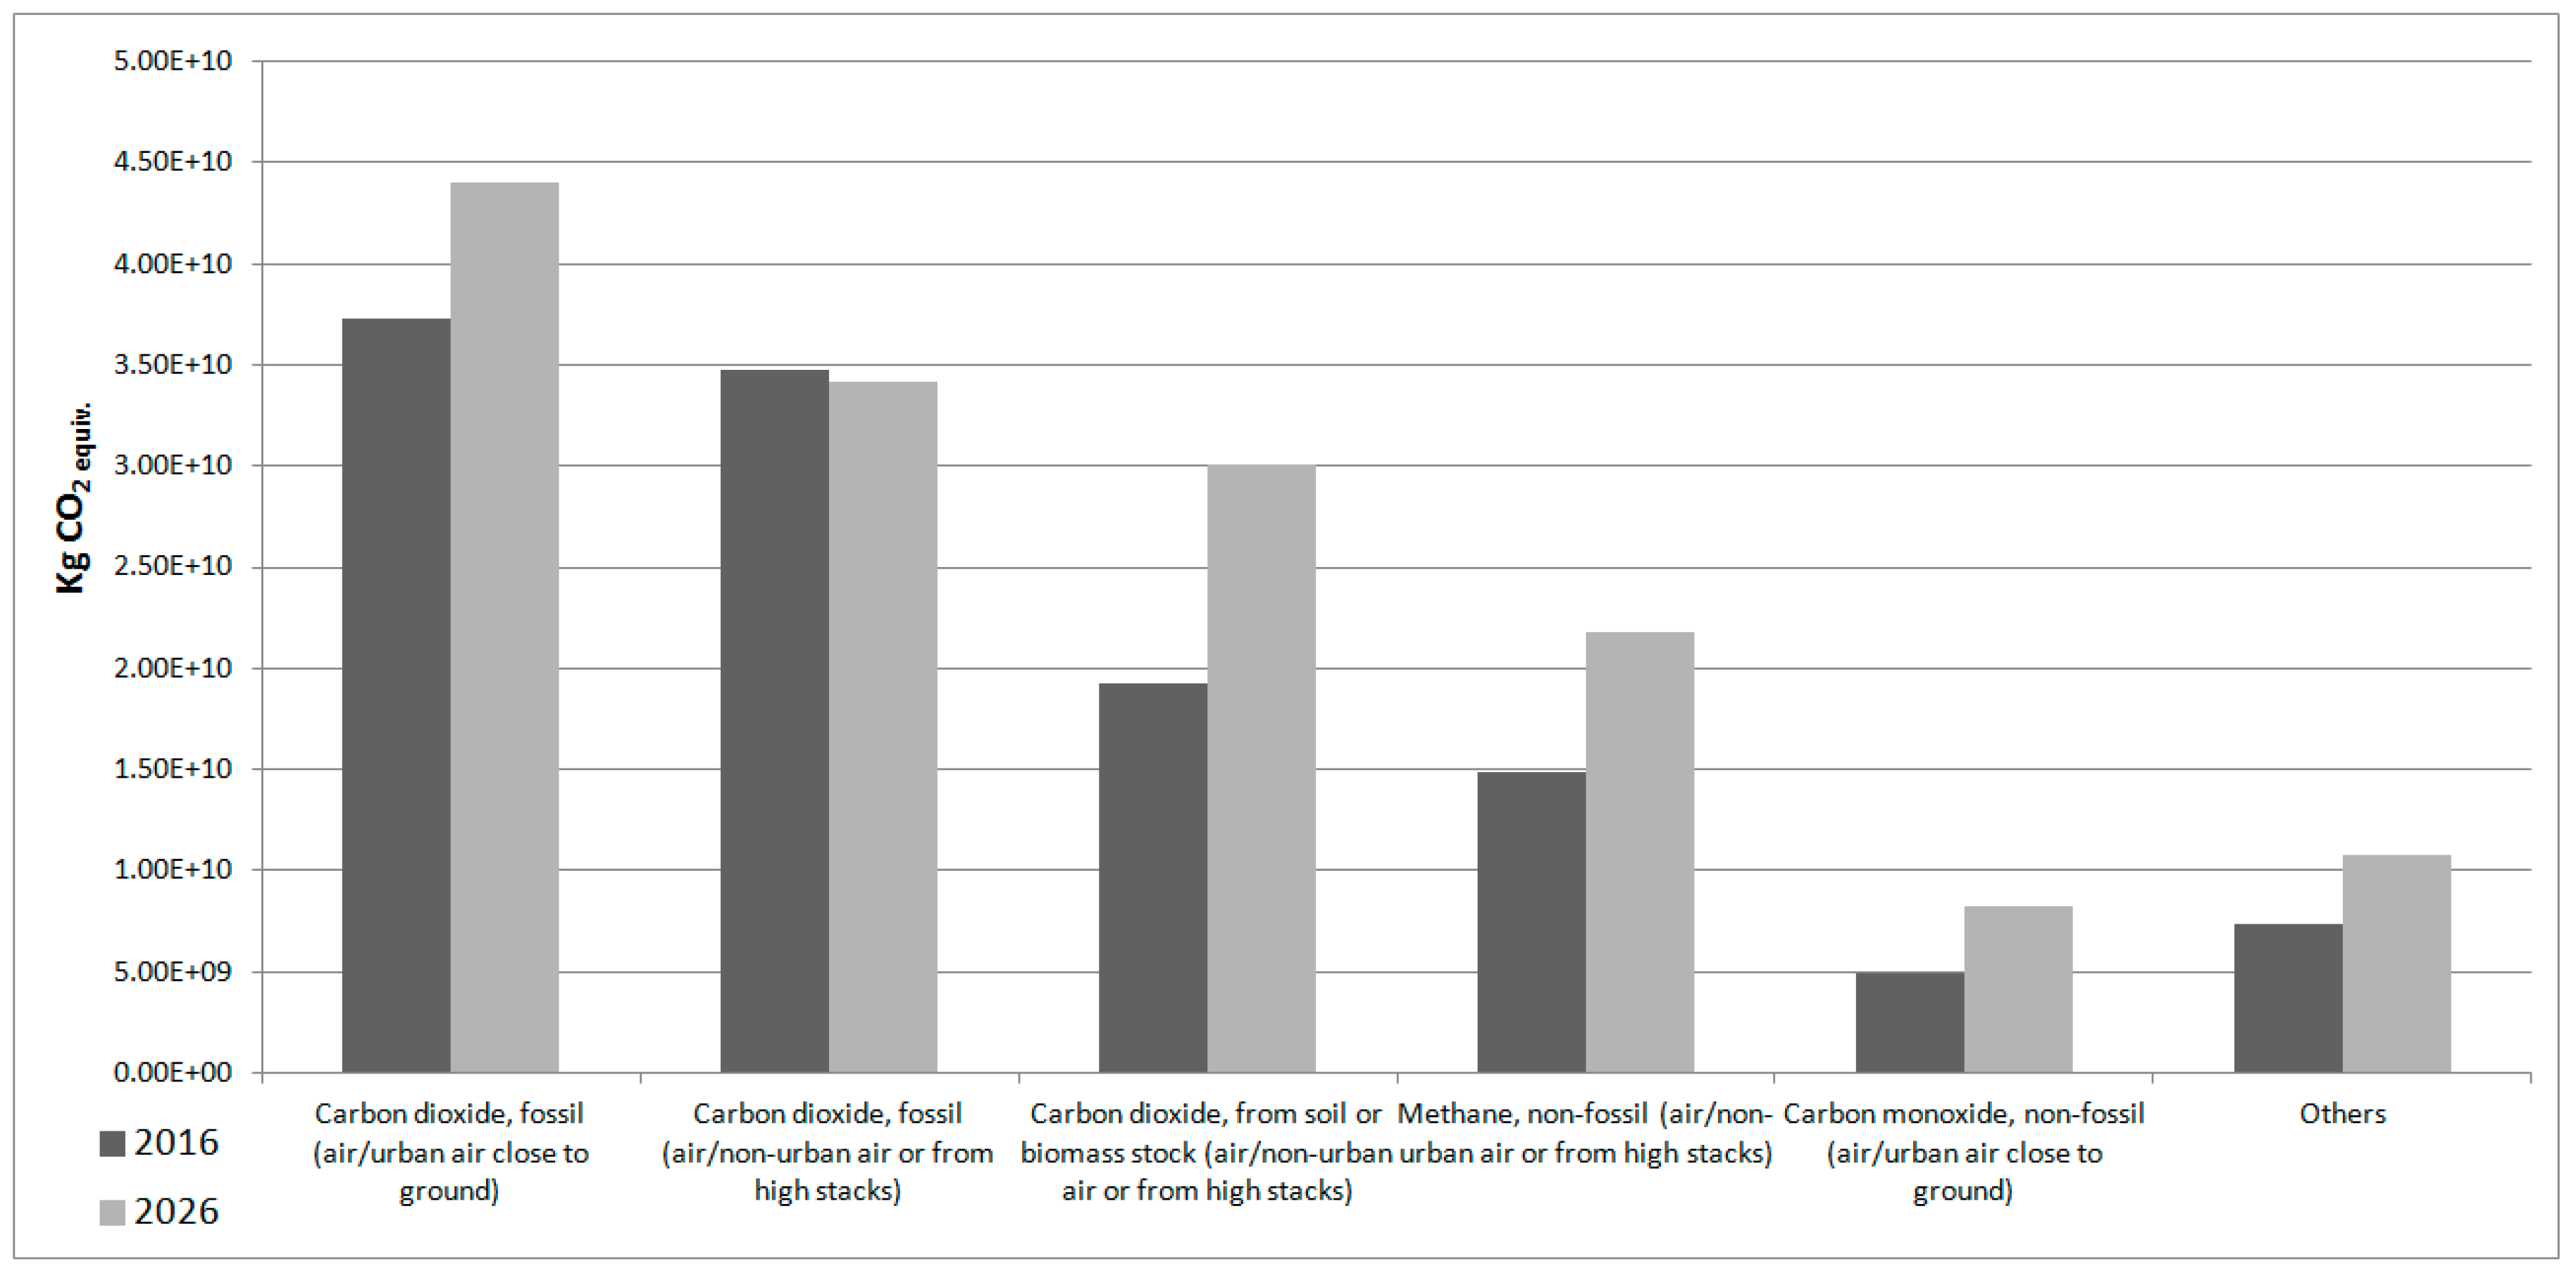
4. Results and Discussions

According to Section 3.2, LCI was constructed considering the total amount (TWh) of each source present in the Brazilian electricity matrix. Nine types of sources were analyzed in Brazil. Hence, Figure 3 details all the sources in the electricity generation in Brazil with their respective GWP (kg CO2equiv.) between 2016 and 2026. Figure 4 shows in terms of GTP (kg CO2equiv.).
Figure 3 and Figure 4 show the total growth of potential impact according to the quantity the electricity generation in Brazil. It is observed that between 2016 and 2026 there will be an increase in total potential environmental impact. Among the main impacting sources in terms of CO2equiv., oil, natural gas, hydropower and hard coal stand out. The potential total impact in 2016 was 98 Mt CO2equiv. (GTP) and 118 Mt CO2equiv. (GWP). By 2026, this result increases to 119 Mt CO2equiv. (GTP) and 149 Mt CO2equiv. (GWP). This was observed because non-renewable sources present a drop in generation, such as natural gas and coal.
By 2025, the potential impact increases to 114 Mt CO2equiv. (GTP) and 143 Mt CO2equiv. (GWP). It is noted that all sources (renewable and non-renewable) of the Brazilian portfolios suffered an increase in generation.
On the other hand, it is expected that by 2026 wind, solar and natural gas sources will increase considerably.
Hydroelectric plants represent the main source in the installed electricity capacity and electricity generation in Brazil. This source is renewable, although it has the highest environmental impacts in terms of GWP (2.81 × 10¹⁰ kg CO2equiv. in 2016 and 4.14 × 10¹⁰ kg CO2equiv. in 2026).
Oil, natural gas and hard coal sources present small contributions to the electricity generation in Brazil and high contribution rates for potential environmental impacts in terms of GWP and GTP for being non-renewable sources. In Brazil, after the extraction of oil, the great majority is destined to goods and fuels’ production and the minority for electricity generation.
Figure 5 shows the specific impact potential (kg CO2equiv./kWh) (per year) for the electricity generation in Brazil between 2016 and 2026 for GWP.
The carbon footprint (kg CO2equiv.) of renewable and non-renewable sources of the installed capacity for different sources and years was assessed.
Figure 5 indicates the GWP according to the IPCC 2013 method to 1 kWh of electricity generation in Brazil per year. In this case, considering the relative impact, it can be compared which sources actually provide the greatest environmental impacts.
The relative potential impact in 2016 was 0.171 CO2equiv./kWh (GTP) and 0.205 CO2equiv./kWh (GWP). By 2026, this result decreases to 0.133 CO2equiv./kWh (GTP) and 0.166 CO2equiv./kWh (GWP).
The data presented show the contribution percentage of each source that makes up the Brazilian electric matrix by scenario. According to specific emissions (see Table 1), it is possible to note the relative contributions. In 2016, the hydroelectric plant came in third place (relative impact) because it owns about 65.80% (see Table 2) of the total generation contribution in Brazil. This generates a relative impact of 0.04855 kg CO2equiv./kWh in the total of 0.205 CO2equiv./kWh (see Figure 5) in 2016. Applying the same example to 2026, the hydroelectric plant could generate 62.06% (see Table 2) of the total generation contribution in Brazil. This generates a relative impact of 0.04579 kg CO2equiv./kWh in the total of 0.166 CO2equiv./kWh (see Figure 5) in 2026.
Figure 6 presents the specific impact potential (kg CO2equiv./kWh) for the electricity generation in Brazil between 2016 and 2026 to GTP category.
According to the period of analysis, GWP and GTP categories will increase after 2021, and renewable sources will almost double generation (during 2021–2026), as is the case for wind and solar sources.
The generation of electricity by oil represented 6.56% in 2016, and 34.33% of the potential environmental impact for that source in the same year. This source is the most impactful in terms of GWP and GTP for the 10 years of the analysis. In this context, the Brazilian electricity matrix is expected to be less pollutant in terms of carbon footprint for the year 2021.
There may be variations in GHG emissions for coal mining. According to Irving and Tailakov [33], underground coal mining releases more methane than surface or open-pit mining because of the higher gas content of deeper seams. Silva et al. [34] corroborated and described that the lack of data about the levels of methane in the underground coal mines in Brazil can be related to their difficult access and lack of adequate procedures for correct gas sampling.
As mentioned in Section 1, several studies on the environmental impacts of electricity using LCA have been conducted. An attempt is made here to compare this study’s results with some other studies. In the work by Garcia, Marques and Freire [16], a reduction of environmental impacts was observed between the years 2003 and 2012. In this period, renewable energy had its production capacity more than double in Portugal, driven by large investments that occurred especially in the installed wind power source [16]. As in the present paper, the study in Portugal indicates the reduction of environmental impacts in the country according to the electricity sources using the IPCC category. In terms of global warming, they found 0.456 kg CO2equiv./kWh in 2012 in the electric matrix of Portugal evaluating the transmission and distribution of electricity. In line with this result, Atilgan and Azapagic [14] pointed out that the GWP for the electricity mix in Turkey is estimated at 0.523 kg CO2equiv./kWh in 2010.
Different from the present research, Lelek et al. [9] identified that the biggest environmental problem in the energy sector, in Poland, was the electricity generation from hard coal and lignite. In addition, unlike the Brazilian government and the present study, since Australia enjoys the benefits of abundant fossil and renewable energy resources, the government is currently focusing on large-scale fossil fuel exploration and the current political mechanisms to promote large-scale renewable energy are not promising [18]. The study by Berrill et al. [15] identified that the increase in renewable sources such as wind and solar in Europe will create positive aspects besides reducing GHG emissions in the coming years. Following this, Miranda-Santos et al. [35] worked on stimulating public policies on production sources with lower environmental impacts.
In Brazil, Carvalho and Delgado [27] found 0.299 kg CO2equiv./kWh in 2015 and 0.225 kg CO2equiv./kWh in 2024; however, they analyzed the generation, transmission, distribution and transformation of electricity.
In results comparison, wind energy had the lowest CO2equiv. emissions, as the source is renewable and clean [17]. Raugei and Leccisi [36] showed that hard coal (37.0%), natural gas (26.70%) and nuclear (19.10%) are the main sources of electricity generation in the United Kingdom, sequentially, in 2013. Comparing with the present study’s data, the Brazilian generation in 2016 is comprised of hard coal (2.76%), natural gas (7.77%) and nuclear (2.76%), respectively [29,30]. All the Brazilian sources were well below the English levels, since in Brazil the predominant source is hydropower.
Figure 7 presents the main substances emitted according to the Brazilian electricity matrix for the year 2016 and 2026.
The main substance emitted to the environment was carbon dioxide. “Air/urban air close to ground” represents approximately 30.0% of the emissions in 2016 and 2026. “Others” in Figure 7 represents other types of emissions, such as methane and variations, carbon monoxide, ethane and variations and other types of carbon dioxide.

5. Conclusions

The results of the present study align with the Sustainable Development Goals (SDGs) proposed by the UN [37] for building a better planet, contributing to the control of climate change by reducing long-term GHG emissions. The present work can be understood from the influence of the environmental impacts to GWP and GTP according to the composition of the electricity matrix in Brazil (2016–2026). Besides, results can be used for directing public policies, promoting development actions and encouraging different electricity matrices. Therefore, the use of LCA to assess the electricity generation in Brazil was an important contribution to fill the related gap in the literature.
This study estimated the C2G environmental impacts of the life cycle in terms of GWP and GTP for the electricity generation in Brazil in the period from 2016 to 2026. The impacts were estimated to the climate change impact category.
The results of the literature review allow concluding that international scientific studies are already being developed, analyzing the composition of their country’s electricity matrix or performing sectoral analyses using LCA to generate knowledge on the system and support future decisions for public policies.
The study identified some hotspots and conclusion. There will be an increase of 55.70% in the installed capacity in Brazil by 2024 with investments being directed to renewable sources, such as hydropower, biomass and wind power. The Brazilian electricity matrix is expected to be less pollutant in terms of carbon footprint for the year 2021. The main substance emitted to the environment was carbon dioxide in 2016 and 2026.
The results of the present work show that increasing the electricity generation of renewable sources would lead to significant reductions in GHG emissions. This could be achieved in the short term by expanding the capacity and generation of wind and solar power plants.
Wind and solar power can play a positive role in the future, since these renewable sources are abundant in Brazil. Wind power plants show high performance of electricity generation in places with high wind rates, as it is the case in some places in the Brazilian territory. In addition, the country is considered subtropical, with a high index of solar radiation, taking advantage of electricity generation through photovoltaic panels.
For a promising future in terms of reducing environmental impacts and reducing the carbon footprint, it is extremely necessary that such studies be developed, since governments and organizations of the energy sector can take advantage of the results for decision-making on the energy sources in Brazil.
The analysis did not measure the sequestration of carbon related to sugarcane, which would result in a smaller contribution of relative impact in terms of GWP and GTP, being considered a limitation of this study. The findings of this study provide an overview of GWP’s environmental impact in the electricity generation in Brazil, helping to identify future opportunities for improvement. However, it is also important for future research to analyze the sensitivity of investments in different sources, in addition to including other environmental impact categories. Furthermore, it could be interesting to compare the carbon footprint of the installed electricity capacity and generation of different renewable energy systems and its evolution over time, considering technology evolution, scale, and location.

Author Contributions

M.V.B. wrote items 1–5, collected the data and calculated GWP and GTP for electricity generation in Brazil (2016–2026) with the assistance of C.M.P., who supported the development of the LCA study. C.M.P. and A.C.d.F. guided the objectives of the study. All authors analyzed the data, read and approved the manuscript.

Acknowledgments

This work was supported by the Coordination of Improvement of Higher Education Personnel (CAPES), the National Council for Scientific and Technological Development (CNPq) and the Federal University of Technology—Paraná (UTFPR) (Brazil).

Conflicts of Interest

The authors declare no conflict of interest.

References

  1. Ministry of Mines and Energy (MME), National Energy Balance (BEN). 2016. Available online: https://ben.epe.gov.br/downloads/Relatorio_Final_BEN_2016.pdf (accessed on 22 April 2018).
  2. Vougioukli, A.Z.; Didaskalou, E.; Georgakellos, D. Financial appraisal of small hydro-power considering the cradle-to-grave environmental cost: A case from Greece. Energies 2017, 10, 430. [Google Scholar] [CrossRef]
  3. Montes-Romero, J.; Piliougine, M.; Muñoz, J.V.; Fernández, E.F.; Casa, J. Photovoltaic device performance evaluation using an open-hardware system and standard calibrated laboratory instruments. Energies 2017, 10, 1869. [Google Scholar] [CrossRef]
  4. Lund, H.; Mathiesen, B.V.; Christensen, P.; Schmidt, J.H. Energy system analysis of marginal electricity supply in consequential LCA. Int. J. Life Cycle Assess. 2010, 15, 260–271. [Google Scholar] [CrossRef]
  5. Dale, A.T.; Lucena, A.F.P.; Marriott, J.; Borba, B.S.M.C.; Schaeffer, R.; Bilec, M.M. Modeling future life-cycle greenhouse gas emissions and environmental impacts of electricity supplies in Brazil. Energies 2013, 6, 3182–3208. [Google Scholar] [CrossRef]
  6. International Organization for Standardization (ISO). Environmental Management—Life Cycle Assessment—Principles and Framework, 2nd ed.; ISO 14040:2006; ISO: Geneva, Switzerland, 2006. [Google Scholar]
  7. International Organization for Standardization (ISO). Environmental Management—Life Cycle Assessment—Requirements and Guidelines, 1st ed.; ISO 14044:2006; ISO: Geneva, Switzerland, 2006. [Google Scholar]
  8. Luz, L.M.; Francisco, A.C.; Piekarski, C.M. Proposed model for assessing the contribution of the indicators obtained from the analysis of life-cycle inventory to the generation of industry innovation. J. Clean. Prod. 2015, 96, 339–348. [Google Scholar] [CrossRef]
  9. Lelek, L.; Kulczycka, J.; Lewandowska, A.; Zarebska, J. Life cycle assessment of energy generation in Poland. Int. J. Life Cycle Assess. 2016, 21, 1–14. [Google Scholar] [CrossRef]
  10. Omwoma, S.; Lalah, J.O.; Kueppers, S.; Wang, Y.; Lenoir, D.; Schramm, K.W. Technological tools for sustainable development in developing countries: The example of Africa, a review. Sustain. Chem. Pharm. 2017, 6, 67–81. [Google Scholar] [CrossRef]
  11. Piekarski, C.M.; Francisco, A.C.; Luz, L.M.; Kovaleski, J.L.; Silva, D.A.L. Life cycle assessment of medium-density fiberboard (MDF) manufacturing process in Brazil. Sci. Total Environ. 2017, 575, 103–111. [Google Scholar] [CrossRef] [PubMed]
  12. Treyer, K.; Bauer, C.; Simons, A. Human health impacts in the life cycle of future European electricity generation. Energy Policy 2014, 74, S31–S44. [Google Scholar] [CrossRef]
  13. Şengül, H.; Bayrak, F.; Köksal, M.A.; Ünver, B. A cradle to gate life cycle assessment of Turkish lignite used for electricity generation with site-specific data. J. Clean. Prod. 2016, 129, 478–490. [Google Scholar] [CrossRef]
  14. Atilgan, B.; Azapagic, A. Assessing the environmental sustainability of electricity generation in Turkey on a life cycle basis. Energies 2016, 9, 31. [Google Scholar] [CrossRef]
  15. Berrill, P.; Arvesen, A.; Scholz, Y.; Gils, H.C.; Hertwich, E.G. Environmental impacts of high penetration renewable energy scenarios for Europe. Environ. Res. Lett. 2016, 11, 014012. [Google Scholar] [CrossRef] [Green Version]
  16. Garcia, R.; Marques, P.; Freire, F. Life-cycle assessment of electricity in Portugal. Appl. Energy 2014, 134, 563–572. [Google Scholar] [CrossRef]
  17. Asdrubali, F.; Baldinelli, G.; D’alessandro, F.; Scrucca, F. Life cycle assessment of electricity production from renewable energies: Review and results harmonization. Renew. Sustain. Energy Rev. 2015, 42, 1113–1122. [Google Scholar] [CrossRef]
  18. Wolfram, P.; Wiedmann, T.; Diesendorf, M. Carbon footprint scenarios for renewable electricity in Australia. J. Clean. Prod. 2016, 124, 236–245. [Google Scholar] [CrossRef]
  19. Kadiyala, A.; Kommalapati, R.; Huque, Z. Evaluation of the Life Cycle Greenhouse Gas Emissions from Different Biomass Feedstock Electricity Generation Systems. Sustainability 2016, 8, 1181. [Google Scholar] [CrossRef]
  20. Raj, R.; Ghandehariun, S.; Kumar, A.; Linwe, M. A well-to-wire life cycle assessment of Canadian shale gas for electricity generation in China. Energy 2016, 111, 642–652. [Google Scholar] [CrossRef]
  21. Santos, M.J.; Ferreira, P.; Araújo, M.; Portugal-Pereira, J.; Lucena, A.F.P.; Schaeffer, R. Scenarios for the future Brazilian power sector based on a multi-criteria assessment. J. Clean. Prod. 2017, 167, 938–950. [Google Scholar] [CrossRef]
  22. Geller, M.T.B.; Meneses, A.A.M. Life cycle assessment of a small hydropower plant in the Brazilian Amazon. J. Sustain. Dev. Energy Water Environ. Syst. 2016, 4, 379–391. [Google Scholar] [CrossRef]
  23. Restrepo, A.; Bazzo, E.; Miyake, R. A life cycle assessment of the Brazilian coal used for electric power generation. J. Clean. Prod. 2015, 92, 179–186. [Google Scholar] [CrossRef]
  24. Guerra, J.P.M.; Coleta, J.R.; Arruda, L.C.M.; Silva, G.A.; Kulay, L. Comparative analysis of electricity cogeneration scenarios in sugarcane production by LCA. Int. J. Life Cycle Assess. 2014, 19, 814–825. [Google Scholar] [CrossRef] [Green Version]
  25. Oebels, K.B.; Pacca, S. Life cycle assessment of an onshore wind farm located at the northeastern coast of Brazil. Renew. Energy 2013, 53, 60–70. [Google Scholar] [CrossRef]
  26. Ribeiro, F.M.; Silva, G.A. Life-cycle inventory for hydroelectric generation: A Brazilian case study. J. Clean. Prod. 2010, 18, 44–54. [Google Scholar] [CrossRef]
  27. Carvalho, M.; Delgado, D. Potential of photovoltaic solar energy to reduce the carbon footprint of the Brazilian electricity matrix. LALCA-Revista Latino Americana em Avaliação do Ciclo de Vida 2017, 1, 64–85. [Google Scholar] [CrossRef]
  28. Ecoinvent. Data Base. 2016. Available online: http://www.ecoinvent.org/database/database.html (accessed on 22 April 2018).
  29. Ministry of Mines and Energy (MME). Plan for the Expansion of Energy 2026; MME: Federal District, Brazil, 2017. Available online: http://www.epe.gov.br/sites-pt/publicacoes-dados-abertos/publicacoes/PublicacoesArquivos/publicacao-40/PDE2026.pdf (accessed on 6 April 2018).
  30. National Electric Energy Agency. Generation Information Database (BIG); ANEEL: Federal District, Brazil, 2017. Available online: http://www2.aneel.gov.br/aplicacoes/capacidadebrasil/OperacaoCapacidadeBrasil.cfm (accessed on 6 April 2018).
  31. Batista, A.A.S.; Francisco, A.C. Organizational Sustainability Practices: A Study of the Firms Listed by the Corporate Sustainability Index. Sustainability 2018, 10, 226. [Google Scholar] [CrossRef]
  32. European Fluorocarbons Technical Committee (EFCTC). 2016. Available online: https://www.fluorocarbons.org/wp-content/uploads/2016/09/EFCTC_Learn_about_GTP_versus_GWP.pdf (accessed on 4 April 2018).
  33. Irving, W.; Tailakov, O. CH4 Emissions: Coal Mining and Handling. Good Practice Guidance and Uncertainty Management in National Greenhouse Gas Inventories. 1999. Available online: https://www.ipcc-nggip.iges.or.jp/public/gp/bgp/2_7_Coal_Mining_Handling.pdf (accessed on 22 April 2018).
  34. Silva, R.; Pires, M.; Azevedo, C.M.N.; Fagundes, L.; Garavaglia, L.; Gomes, C.J.B. Monitoring light hydrocarbons in Brazilian coal mines and in confined coal samples. Int. J. Coal Geol. 2010, 84, 269–275. [Google Scholar] [CrossRef]
  35. Miranda-Santos, S.F.O.; Piekarski, C.M.; Ugaya, C.M.L.; Donato, D.B.; Braghini Júnior, A.; Francisco, A.C.; Carvalho, A.M.M.L. Life cycle analysis of charcoal production in masonry kilns with and without carbonization process generated gas combustion. Sustainability 2017, 9, 1558. [Google Scholar] [CrossRef]
  36. Raugei, M.; Leccisi, E. A comprehensive assessment of the energy performance of the full range of electricity generation technologies deployed in the United Kingdom. Energy Policy 2016, 90, 46–59. [Google Scholar] [CrossRef]
  37. United Nations (UN). 17 Goal to Transform our World: Goal 7: Ensure Access to Affordable, Reliable, Sustainable and Modern Energy for All. 2016. Available online: http://www.un.org/sustainabledevelopment/energy/ (accessed on 3 November 2016).
Figure 1. This figure shows the increase in the installed electricity capacity in Brazil (2014–2024) for hydropower including the small hydro. Source: Adapted from Brazil [1] and ANEEL [30].
Energies 11 01412 g001
Figure 2. This figure shows the increase of the installed electricity capacity in Brazil (2014–2024) for others sources. Source: Adapted from Brazil [1] and ANEEL [30].
Energies 11 01412 g002
Figure 3. This figure reveals the potential of absolute impact in the electricity generation in Brazil (2016–2026) in terms of GWP.
Energies 11 01412 g003
Figure 4. This figure reveals the potential of absolute impact in the electricity generation in Brazil (2016–2026) in terms of GTP.
Energies 11 01412 g004
Figure 5. This figure indicates the relative impact of the electricity generation in Brazil (2016–2026) in terms of GWP.
Energies 11 01412 g005
Figure 6. This figure indicates the relative impact of the electricity generation in Brazil (2016–2026) in terms of GTP.
Energies 11 01412 g006
Figure 7. This figure presents the total impacts emitted by the main substances (kg CO2equiv.) in the Brazilian electricity matrix in 2016 and 2026.
Energies 11 01412 g007
Table 1. This table demonstrates the process names and specific emissions (GWP) for each technology. Source: Ecoinvent [28].
SourcesProcess NamesEmissions (kg CO2equiv./kWh)
Hydropowerelectricity production, hydro, reservoir, tropical region [BR] Allocation, cut-off0.07378
Windelectricity production, wind, 1–3 MW turbine, onshore [BR] Allocation, cut-off0.01525
Solarelectricity production, photovoltaic, 570 kWp open ground installation, multi-Si [RoW] Allocation, cut-off0.08591
Biomass (sugar cane)cane sugar production with ethanol by-product [BR] Allocation, cut-off0.4171
Biomass (wood and others)heat and power co-generation, wood chips, 6667 kW, state-of-the-art 2014 [BR] Allocation, cut-off)0.05906
Nuclearelectricity production, nuclear, pressure water reactor [BR] Allocation, cut-off0.01209
Natural gaselectricity production, natural gas, combined cycle power plant [BR] Allocation, cut-off0.3816
Hard coalelectricity production, hard coal [BR] Allocation, cut-off0.9264
Oilelectricity production, oil [BR] Allocation, cut-off1.068
Table 2. This table demonstrates changes in proportions in the electricity generation in Brazil (TWh and percent) (2016–2026). Source: Adapted from Brazil [29] and ANEEL [30].
Sources2016
TWh
2021
TWh
2025
TWh
2026
TWh
2016
%
2021
%
2025
%
2026
%
Reference
Hydropower38151755956165.8069.0364.1162.06A
Wind33751041115.7010.0111.9312.28A
Solar011222601.472.252.88A
Biomass (sugar cane)385162656.686.927.197.19A and B
Biomass (wood and others)111518181.952.022.102.10A and B
Nuclear161515262.762.001.722.88A
Natural gas452035377.772.674.014.09A
Hard coal161014152.761.341.611.66A
Oil383442446.564.544.824.87A and B
Total579749872903100.00100.00100.00100.00A

