Article

In Deep Analysis on the Behavior of Grape Marc Constituents during Hydrothermal Carbonization

1
Faculty of Science and Technology, Free University of Bolzano, Piazza Università 5, 39100 Bolzano, Italy
2
IMT Mines Albi, Centre RAPSODEE, UMR CNRS 5302, Campus Jarlard, F-81013 Albi CEDEX 09, France
3
DICAM, Department of Civil, Environmental and Mechanical Engineering, University of Trento—Via Mesiano 77, 38123 Trento, Italy
*
Author to whom correspondence should be addressed.
Energies 2018, 11(6), 1379; https://doi.org/10.3390/en11061379
Submission received: 27 April 2018 / Revised: 17 May 2018 / Accepted: 22 May 2018 / Published: 29 May 2018
(This article belongs to the Special Issue Thermo Fluid Conversion of Biomass)

Abstract

:
Grape marc is a residue of the wine-making industry, nowadays not always effectively valorized. It consists of grape seeds (mostly lignocellulosic) and grape skins (mostly holocellulosic). In order to understand possible correlations between seeds and skins in forming hydrochar for it to be used as a solid biofuel, hydrothermal carbonization (HTC) was applied separately to grape marc and its constituents. HTC was performed at several process conditions (temperature: 180, 220 and 250 °C; reaction time: 0.5, 1, 3 and 8 h), in order to collect data on the three phases formed downstream of the process: solid (hydrochar), liquid and gas. An in deep analytical characterization was performed: ultimate analysis and calorific value for hydrochar, Total Organic Carbon (TOC) and Inductively Coupled Plasma (IPC) analyses for liquid phase, composition for gas phase. In previous works, the same experimental apparatus was used to treat residual biomass, obtaining interesting results in terms of possible hydrochar exploitation as a solid biofuel. Thus, the main objectives of this work were both to get results for validating the hypothesis to apply HTC to this feedstock, and to collect data for subsequent theoretical investigations. Moreover, a severity model was developed to allow a predictive description of the hydrochar yield as a function of a unique parameter condensing both temperature and reaction time effects. The results obtained demonstrate that this process can upgrade wet residues into a solid biofuel ad that the process can be satisfactorily described in terms of a severity factor.

1. Introduction

Nowadays, finding and understanding in depth new processes that can represent opportunities in the direction of both economic and environmental sustainability is a challenge worldwide. Since the last few years in Europe, strong efforts started to be required to sustain the European strategy for circular economy [1], which represents a new approach for the management and treatment of residual materials. In this field, the organic residues coming from both food industry and household wastes can represent a great opportunity. The organic matter is composed by many interesting compounds that can be isolated, extracted or transformed into secondary raw materials, which can be used as renewable precursors for the production of other goods.
Hydrothermal carbonization (HTC) is a thermochemical process through which it is possible to directly transform a wet organic substrate into a useful material called hydrochar. This process has been studied by several authors [2,3,4,5,6,7,8,9,10,11] even in recent years. The HTC solid product is expected to have different applications, for example for renewable energy production [12,13], as a soil improver and conditioner [14], as a precursor for the production of activated carbons [15], for the generation of nanostructured materials, and many more [16,17]. Hydrochar is a solid carbonaceous material, with physical and chemical characteristics very similar to those of fossil peat and lignite, depending on the applied HTC process conditions. HTC is performed in hot pressurized water, at temperatures that range between 180 and 250 °C, pressures between 10 and 50 bar, and residence times that can last from tens of minutes to several hours. Although this process can be applied to almost every biodegradable organic material and although it seems to be possible to give the hydrochar specific physical and chemical characteristics by controlling the process conditions, interactions between the feedstock constituents in each phase are still not known in deep at present. Moreover, the effects on combining raw material properties and process conditions have to be deeper analyzed, in order to be able to improve the quality of hydrochar, in relation with its foreseen utilization. Thus, to improve the general knowledge of the HTC process and to better understand which are the best hypotheses to follow when modelling it, in this work several carbonizations were carried out and many characterizations were performed on the three phases obtained downstream each carbonization.
Grape marc is a residue of the wine-making industry and is largely available in wine-making countries: the world production is estimated in around 67.1 million tons per year [18]. Grape marc is nowadays not always adequately valorized and a recent study [19] proposed various ways for the valorization of this residue, comprising HTC. Thus, it is of great environmental and economic interest to find a technological route, as HTC, to upgrade grape marc to a useful material. With this purpose, HTC was recently studied by Lucian and Fiori [20], who proposed a very interesting real scale application scenario of valorization of this residue, with a bio-refinery approach. In this work, grape marc was selected as the substrate worth of investigation, even because of its composition, namely lignocellulose and holocellulose, which represent the main vegetal biomass constituents. As a matter of fact, it is well known that HTC process acts in different ways when applied to holocellulosic or lignin polymers. Thus, data relevant to HTC of grape marc constituents offer interesting insights in terms of their different biochemical composition (more lignocellulosic the seeds, more holocellulosic the skins) and, consequently, different behavior (and eventually synergistic effect) during HTC.
Thus, the procedure that has been followed and the data collected in this work were thought to make it an important basis for the development of further theoretical and modeling investigations on HTC. In addition, a severity factor model was implemented to validate the possibility of predicting the mass yield of the three phases obtained downstream of the HTC process (solid, i.e., hydrochar, liquid and gas): the severity factor condenses both the temperature and the residence time of the carbonization process.

2. Materials and Methods

2.1. Feedstock Characteristics

Grape marc was freshly collected at a wine-producer in Trentino province, in northeast Italy. It was rapidly transported to the laboratory where it was dried for at least 8 h at 105 °C, and subsequently manually separated into skins and seeds. The average mass composition rigorously found by Fiori and Florio [21] was about 46% of skins, 52% of seeds and 2% of stalks, on dry basis. These data are in good agreement with those found by Jordan [22]: 51% skins, 47% seeds and 2% stalks, on dry basis. Since the percentages of these constituents can slightly vary considering different grape cultivars, and in order to be generalist and to ensure the repeatability and consistency of the research work, it was decided to reproduce grape marc by reconstituting it with 50% of dried skins and 50% of dried seeds. This operative hypothesis was assumed to be acceptable considering that, when referring to macromolecules (i.e., hemicellulose, cellulose and lignin), grape stalks are more similar to seeds than to skins. As reported by Corbin et al. [23], grape marc is composed by 31–54% w/w of carbohydrates, of which 47–80% water-soluble carbohydrates, namely glucose and fructose, and structurally complex polysaccharides, such as polyphenols, pectins, heteroxylans, xyloglucan and cellulose.

2.2. Physical and Chemical Characterizations

The procedures adopted in order to characterize the feedstock, the hydrochar and both the liquid and gaseous phases are fully described in [24]. Briefly, both the feedstock and hydrochar were firstly characterized in terms of C, H, N, and S mass fractions (Vario Macro Cube, Elementar Analysensysteme GmbH, Lagenselbold, Germany). The ash content was determined by incineration at 550 °C according to EN 14775 procedure. The O content was then deduced by difference. The higher heating values (HHV) of the hydrochars was measured using a calorimetric bomb (5005, IKA, Staufen, Germany).
As far as the liquid phase is concerned, it was analyzed in terms of total organic carbon TOC content and through inductively coupled plasma (ICP). The total carbon (TC) and the total inorganic carbon (TIC) were measured in a TOC-Analyzer (TOC V-CSH, Shimadzu Europa GmbH, Marne la Vallée, France), while the mineral content in the liquid phase was measured using inductively coupled plasma optical emission spectroscopy ((ICP-OES, ICP -ULTIMA 2, JOBIN YVON, Horiba Palaiseau, France)). TOC analyzer was calibrated with solutions for TIC (Na2CO3) and TC (C8H5KO4).
Gas analysis was performed by means of a portable gas chromatograph (3000 micro-GC, SRA Instruments®, Marcy-l’Étoile, France) equipped with two columns: a Molsieve® column able to detect He, H2, O2, N2, CH4 and CO using Ar as carrier gas, and a Plot-U® (Agilent, Santa Clara, USA) column able to detect CO2, C2H4, C2H6 and C3H6/C3H8 (C3′s) using He as carrier gas. The column pressure was kept at 28 and 25 psi, respectively. Different calibration blends with compositions close to those detected were used in order to obtain a multi-point calibration of the micro-GC device. The masses of gaseous products were calculated normalizing the data recorded by the portable gas chromatograph, considering only the following gases: H2, CH4, CO and CO2. Furthermore, in order to measure the amount of gas formed during the HTC process, a plastic graduated cylinder with the lower part submerged into water was used, as described in [24].
Characterization of the hydrochar was performed also by an environmental scanning electron microscope (ESEM, XL30 FEG, ThermoFischer Scientific, Villebon sur Yvette, France) in nitrogen atmosphere at ambient temperature. A back-scattered electrons detector was used to highlight the chemical contrast of the samples.

2.3. Experimental Procedure

The 50 mL reactor used for the carbonization tests was already fully described by Basso et al. [24], and a picture of it was previously shown by Fiori et al. [25]. The reactor was filled at about 75% of its inner volume. Then, the reactor was closed with the flanged top. Prior to the heating up, nitrogen gas was fluxed for at least 4 min to create an inert atmosphere inside the reactor and to avoid the presence of oxygen. Subsequently, the reactor was heated up. Depending on the set point temperature, the heating up took about 15 to 20 min. Once the set point temperature was reached, the residence time (elsewhere here referred to also as reaction time) was started to be measured. Two data loggers were used to register both temperature and pressure every 10 s. Once passed the defined residence time, the reactor was quenched, putting a steel disc of about 3 kg at −24 °C under it and blowing compressed air over its external walls. When the temperature inside the reactor was lower than 30 °C, the quenching was stopped and the residual pressure was lowered by opening the reactor outlet needle valve. In this way, the gas fluxed through the apparatus used to measure the gas volume and connected to a portable micro GC for the measurement of its composition. Hence, the reactor was opened and the content (i.e., water and hydrochar) was filtered with a 0.45 m Whatman filter. The liquid was stored in brown glass vials and kept in a fridge at 4 °C, while both the reactor and the dirty filter were dried in an oven at 105 °C for at least 8 h. Eventually, by measuring the weights of both the dried reactor and filter, all the data to calculate the mass of hydrochar obtained were collected. The hydrochar was stored in glass vials at −24 °C, before being analyzed.

2.4. The Severity Factor Approach

Many authors [26,27,28,29,30,31] used the severity approach to condensate at least two process parameters, with the purpose of describing one or more characteristics of the products obtained during thermochemical conversion processes. In this work, the mass yields of hydrochar, liquid phase and gaseous phase of the three substrates have been described using the severity factor (SF) proposed by Ruyter [26]. The author developed a severity model for hydrothermal coalification, on the basis of an Arrhenius relation, and obtained the coefficients of his equation using a wide range of experimental data, obtained at different temperatures and residence times. Ruyter [26] defined the severity factor as reported in Equation (1):
S F = 50   t 0.2   exp ( 3500 T )
where t is time (expressed in s) and T is temperature (expressed in K). This severity factor was then used by the author to predict the oxygen conversion during HTC, finding that SF can be correlated as in in Equation (2):
S F = O f e e d O t O f e e d 6
where, O f e e d is the oxygen content of the feedstock and O t is the oxygen content after a reaction time equal to t. In the present work, the use of SF is valuable since the conditions referring to 250 °C, 0.5 h and 1 h are interleaved between (220 °C, 3 h) and (220 °C, 8 h). The SF proposed by Ruyter [26] was used to predict the hydrochar yield.

3. Results and Discussion

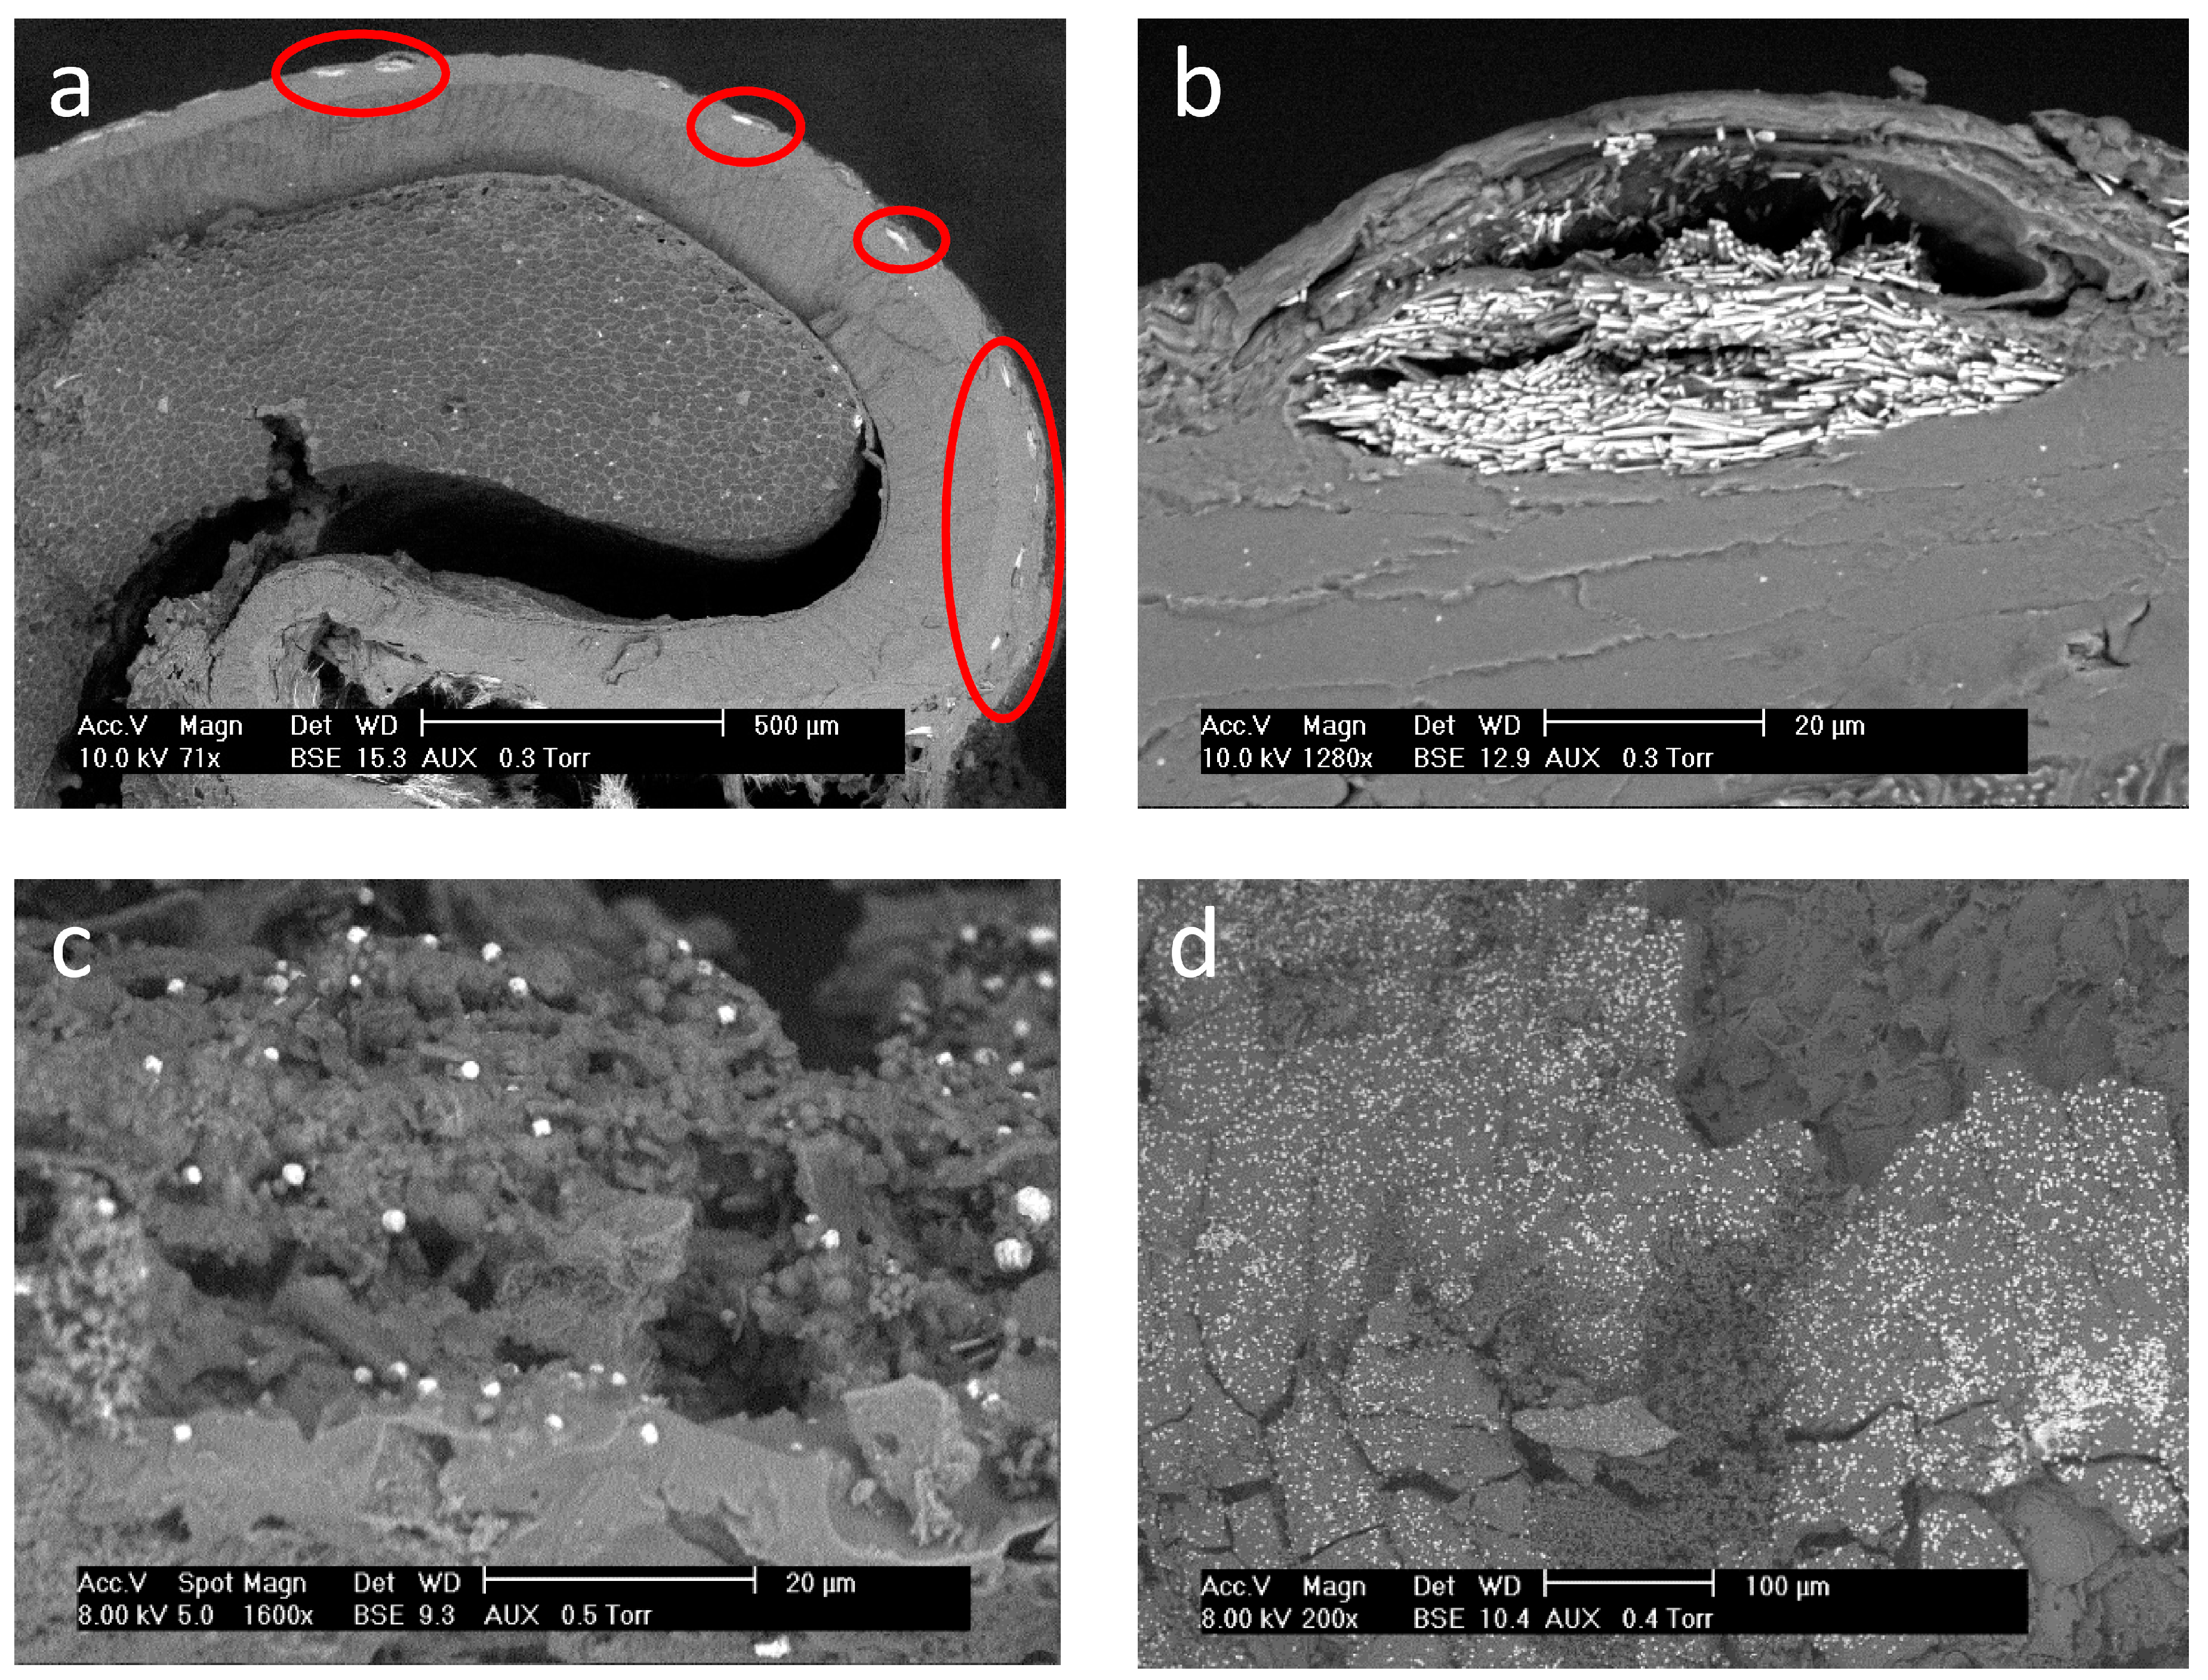
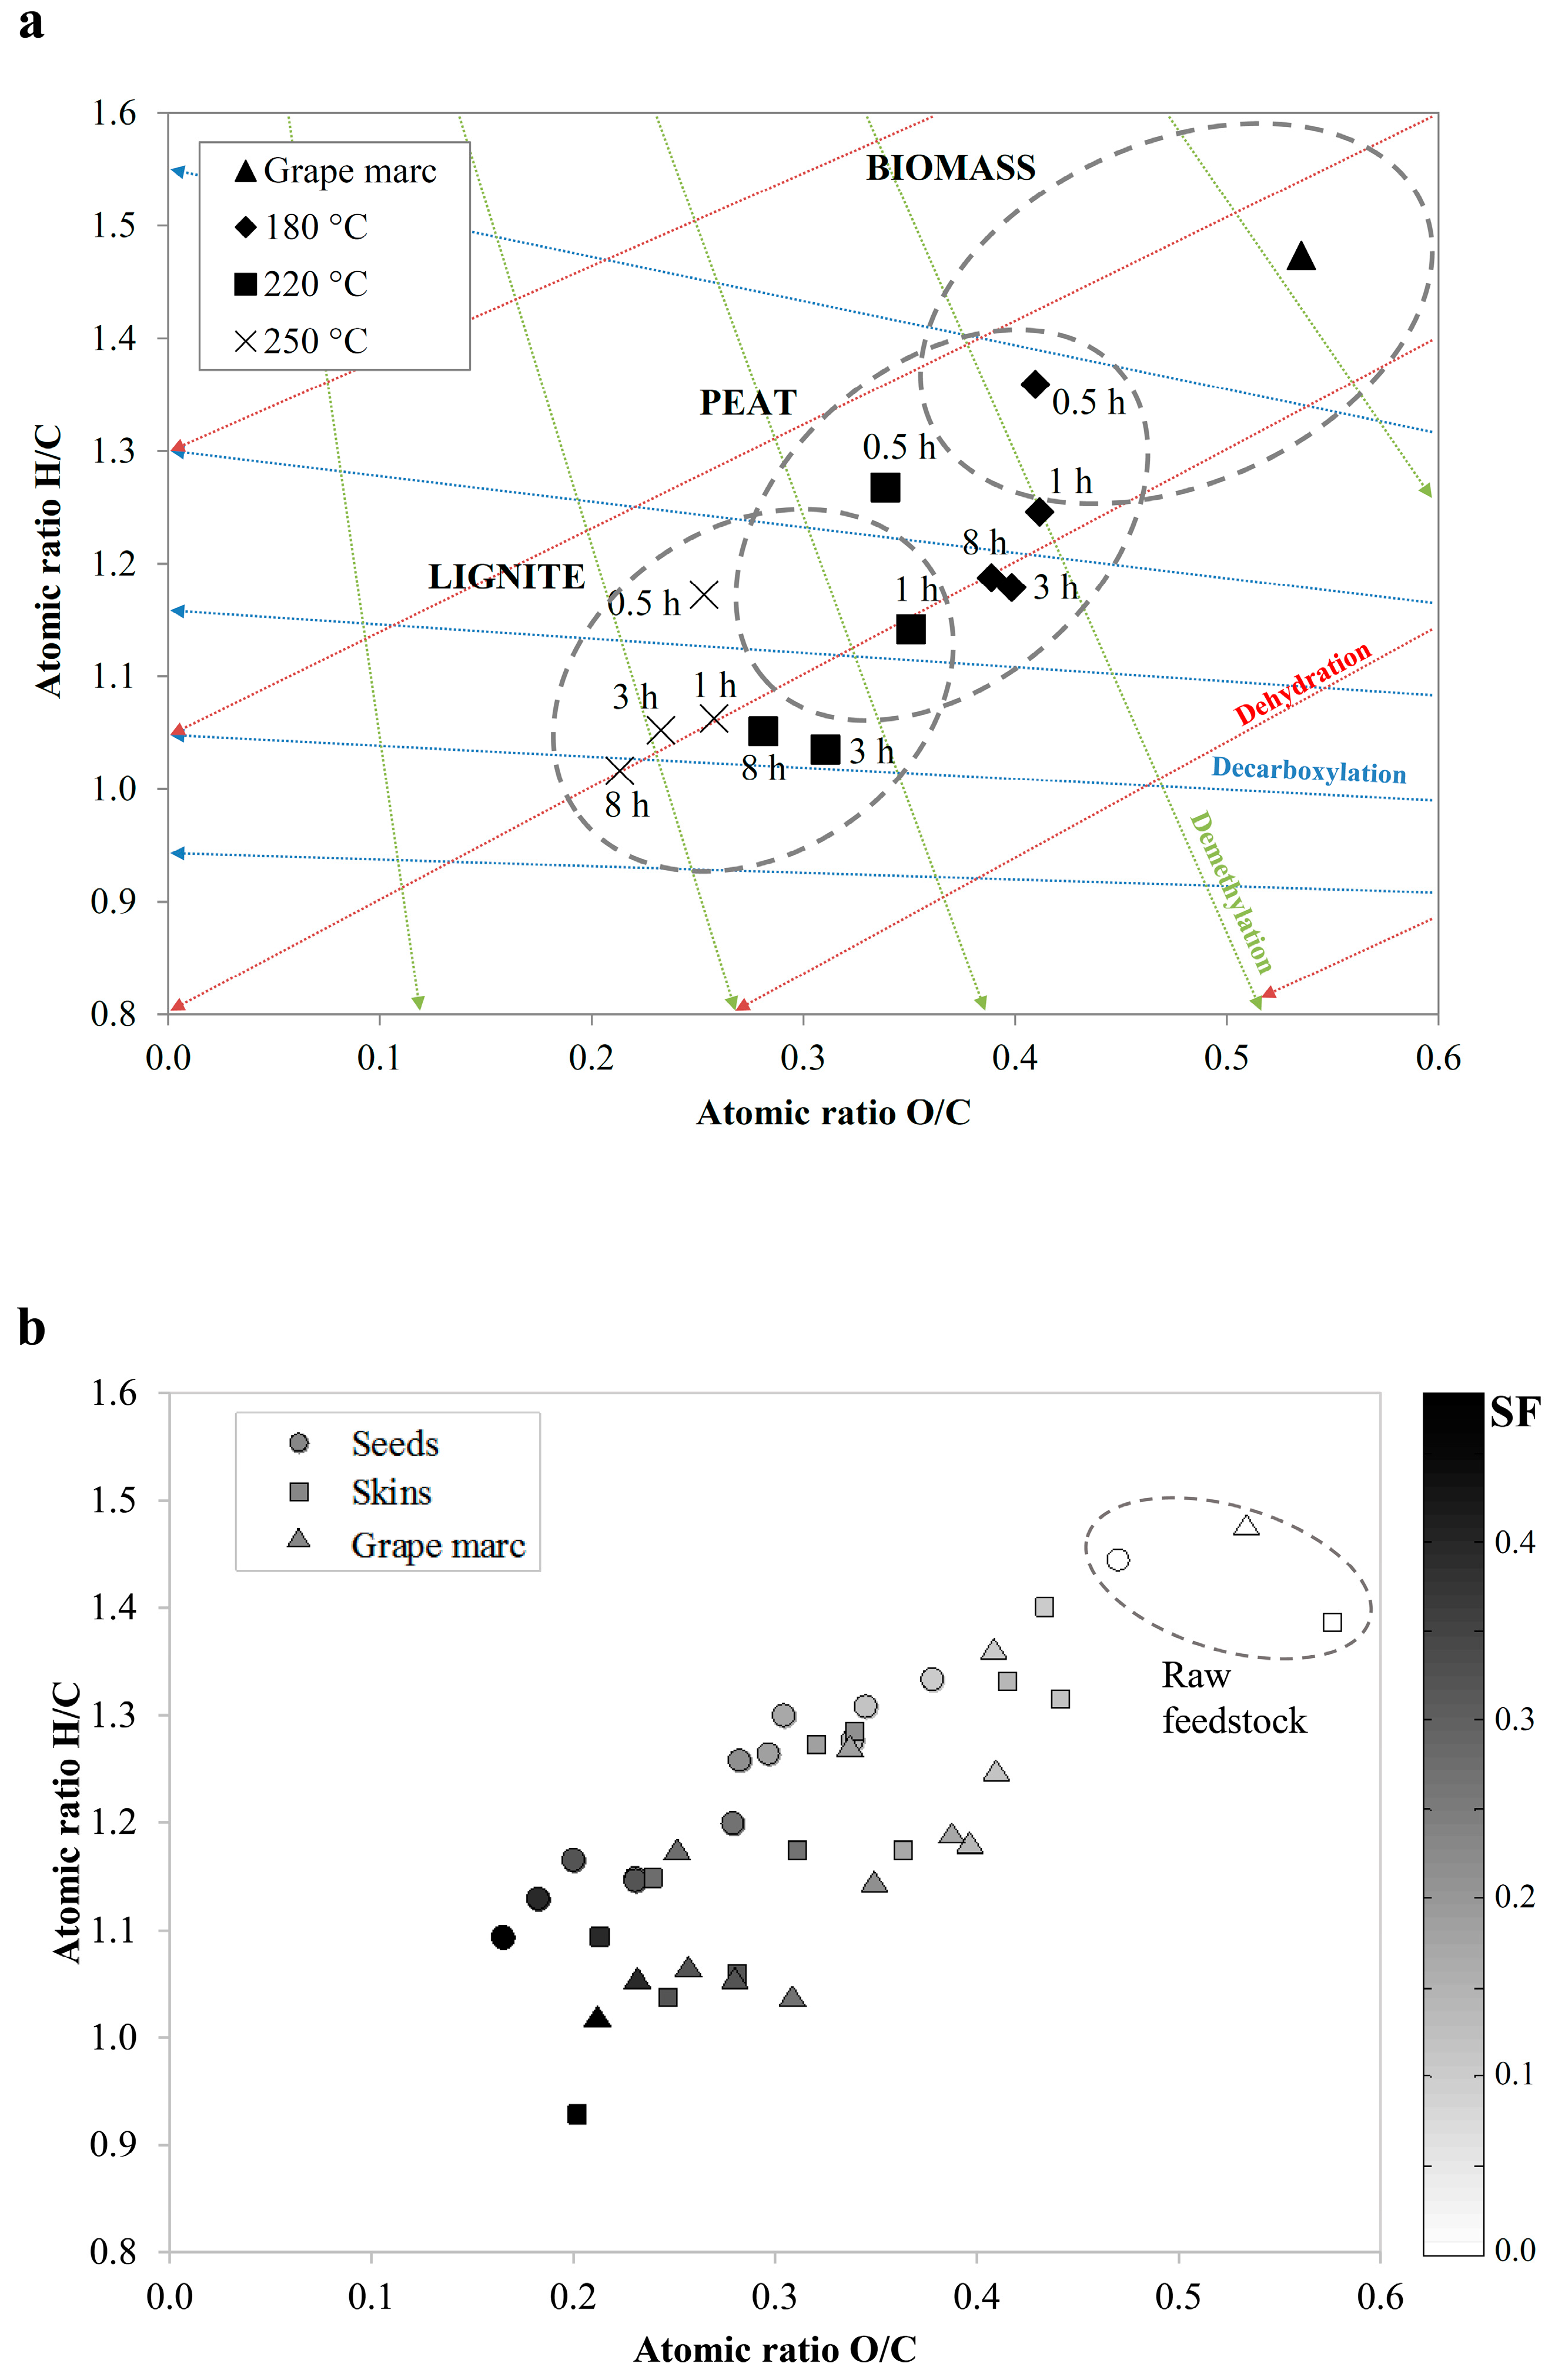
3.1. Solid Phase (Hydrochar)

As previously mentioned, hydrochar was produced at different process conditions, combining three temperatures (180, 220 and 250 °C) and four residence times (0.5, 1, 3 and 8 h). Three different substrates, namely grape seeds, grape skins and grape marc were investigated. Table 1 reports the ultimate analyses of the three feedstocks and of the hydrochars obtained at the different process conditions.
Looking at the ultimate analyses, it is possible to state that the more severe the process conditions, the more oxygen is lost, while the carbon content increases in the solid phase. In particular, both grape seeds and skins loose from 12% to 54% of oxygen, depending on both process temperature and residence time. Interestingly, the reduction in ash content is stronger in skins than in seeds: this can be explained considering that while skins are mainly composed by hemicellulose and cellulose, seeds have higher lignin content, which is more resistant to HTC conversion. Moreover, as it can be seen in Figure 1a,b, minerals are embedded within the seeds and close to the surface, highlighted by the red circles. Ashes can then be solved in water only when water comes in contact with them, by entering the seeds. This happens at more severe conditions. As far as skins are concerned, minerals are more easily accessible, since they are not strictly embedded within the woody matrix. Figure 1c,d show both skins and seeds after the HTC treatment. Interestingly, minerals are attached to the surface and this can be explained by the fact that during the process water coats the biomass and, when drying the hydrochar, minerals deposit on the surface. Thus, in the case of seeds, less ash dissolves into the liquid phase because the ash remains more closely linked to the seed lignin structure than in the case of skins. However, in order to have a more comprehensive explanation on the behavior of ash during a HTC process, more in deep analyses are required.
The different nature of seeds and skins affects the carbon densification: the carbon densification is more pronounced in skins (from +16% to +46%) than in seeds (from +9% to +30%). For what concerns the combination of these two substrates into grape marc, the carbon densification ranges between +13 and +37%, values that are very similar to the average of the ranges encountered in skins and seeds. Apart from skins, the hydrogen content seems to remain relatively constant, even though data regarding grape marc shows a slight decrease at longer residence times.
The hydrochar loses some amount of nitrogen in the early stages of carbonization. Subsequently, the nitrogen content increases within the solid phase, in particular at higher temperatures and residence times. An interesting behavior can be appreciated regarding ash: it seems that there is a limit in ash depletion, around −30%, which is reached quite immediately at 250 °C, while longer residence times are required at 180 and 220 °C.
Figure 2a shows the van Krevelen diagram [32] obtained from the data relevant to grape marc. In the van Krevelen diagram, the influence of both temperature and residence time is evident. These process parameters influence both dehydration and decarboxylation reactions, promoting the loss of water and carbon dioxide during the process. An interesting information that can be recovered from Figure 2a is that temperature seems to linearly increase the loss of hydrogen and oxygen atoms. Considering constant the residence time, the three points (obtained at 180, 220 and 250 °C) can be arranged in straight lines (dehydration lines), with positive intercept. Actually, the point obtained at 3 h and 250 °C does not respect the general trend: it is positioned in a higher position in respect to the expectations. When considering that re-polymerization reactions can occur at longer reaction times rather than at higher temperatures and that re-polymerization of cyclic or long-chains molecules may slightly increase the hydrogen atomic ratio, this might explain the position of the point corresponding to 3 h at 250 °C.
At longer residence times, namely 8 h at 250 °C, dissolution could again lower the hydrogen content, and probably explaining why the point corresponding to 8 h at 250 °C is positioned on the bottom left of the previously considered point. However, further scientific analyses are required in order to support this possible explanation. In Figure 2b, the carbonization degree is described in terms of the severity factor (see also Section 3.5). As expected, the higher the severity factor, the higher the carbonization degree. Moreover, considering that the severity factor is calculated with couples of temperature and pressure data, this could suggest that the same carbonization degree might be reached with different combination of temperatures and pressures. However, Figure 2a suggests that temperature affects more than residence time the O/C ratio, while the H/C ratio seems more dependent on residence time.
In the early stages of the process (residence times up to 0.5 h), the main reaction that seems to occur is dehydration. This is in agreement with what was found by Funke and Ziegler [2]. Interestingly, after this early reaction stage, from 0.5 h to 1 h, the O/C ratio seems to be nearly constant, while a strong reduction in the H/C ratio occurs (combination of dehydration and demethylation). This can be explained considering the solution of sugars (like glucose and fructose) within the liquid. As suggested by Funke and Ziegler [2], other sugars can be solved in the liquid, for example d-xylose, d-mannose and d-galactose. Moreover, acetic acid can be a degradation product of hemicellulose. Considering the results obtained for the temperatures of 220 and 250 °C, the O/C ratio at 1 h is slightly higher than that at 0.5 h. Apparently, this effect is not evident at 180 °C. The explanation can be found considering that at temperatures below 200 °C the degradation of lignin is more difficult, even more at lower residence times, because of its difficult accessibility within the feedstock. As a matter of fact, although hydrolysis of both cellulose and lignin occurs in the same range of temperature (namely, above 200 °C), lignin is expected to degrade after cellulose release. Moreover, because lignin mainly degrades into phenolic compounds, as indicated by Funke and Ziegler [33], in this case the loss of carbon and hydrogen atoms is more marked if compared to that of oxygen. Thus, the O/C ratio could slightly increase.
As the residence time increases, other reaction mechanisms begin to act. In particular, decarboxylation leads to the removal of carboxyl groups, as suggested by many authors [34,35,36]. Finally, at longer residence times (i.e., from 3 to 8 h) the variations of both H/C and O/C ratios are less pronounced, a part from what happens at higher temperatures, namely 250 °C. This can represent an important hint while designing the process parameters for an industrial plant. In fact, the efforts due to the extension of the residence time may not be justified only considering the coalification degree of the feedstock. Table 2 reports the higher heating values of grape seeds, skins and marc at the different process conditions.
As expected, increasing the severity of the process, the energy content of the hydrochar is enhanced. Although it is not possible to determine which of the two process parameters (temperature and residence time) was more effective to enhance the heating value of the hydrochar, the average tendency is that at higher temperatures the marginal increase of HHV is higher than at lower temperatures. This is in agreement with the information provided by the van Krevelen diagram of Figure 2a. At higher temperatures the oxygen content of the hydrochar is lower, thus the heating value is higher. The increase in HHV of carbonized grape marc is significant, ranging from 4.5% (residence time: 0.5 h; temperature: 180 °C) to 27.2% (residence time: 8 h; temperature: 250 °C). Similarly, the HHV increase is in the range 1.4% (0.5 h, 180 °C)–27.8% (8 h, 250 °C) and 2.7% (0.5 h, 180 °C)–47.6% (8 h, 250 °C) for grape seeds and skins, respectively. These values of energy densification are consistent with those obtained by Pala et al. [37].
Performing HTC of several municipal solid wastes, Lu et al. [38] obtained an increase in HHV ranging from 1% to 41% (residence time: 30 min; temperature: 220 °C), values comparable to those obtained here.
Thermogravimetric analyses (TGA) were performed on grape marc. Results from TGA testify that the mass loss of the hydrochar samples during analysis greatly reflects the HTC operational conditions: the mass loss is in the range of 65.7–67.9 wt.% for the hydrochars obtained at 180 °C, while it is comprised between 51.8 and 57.2 wt.% for the hydrochars obtained at 250 °C.

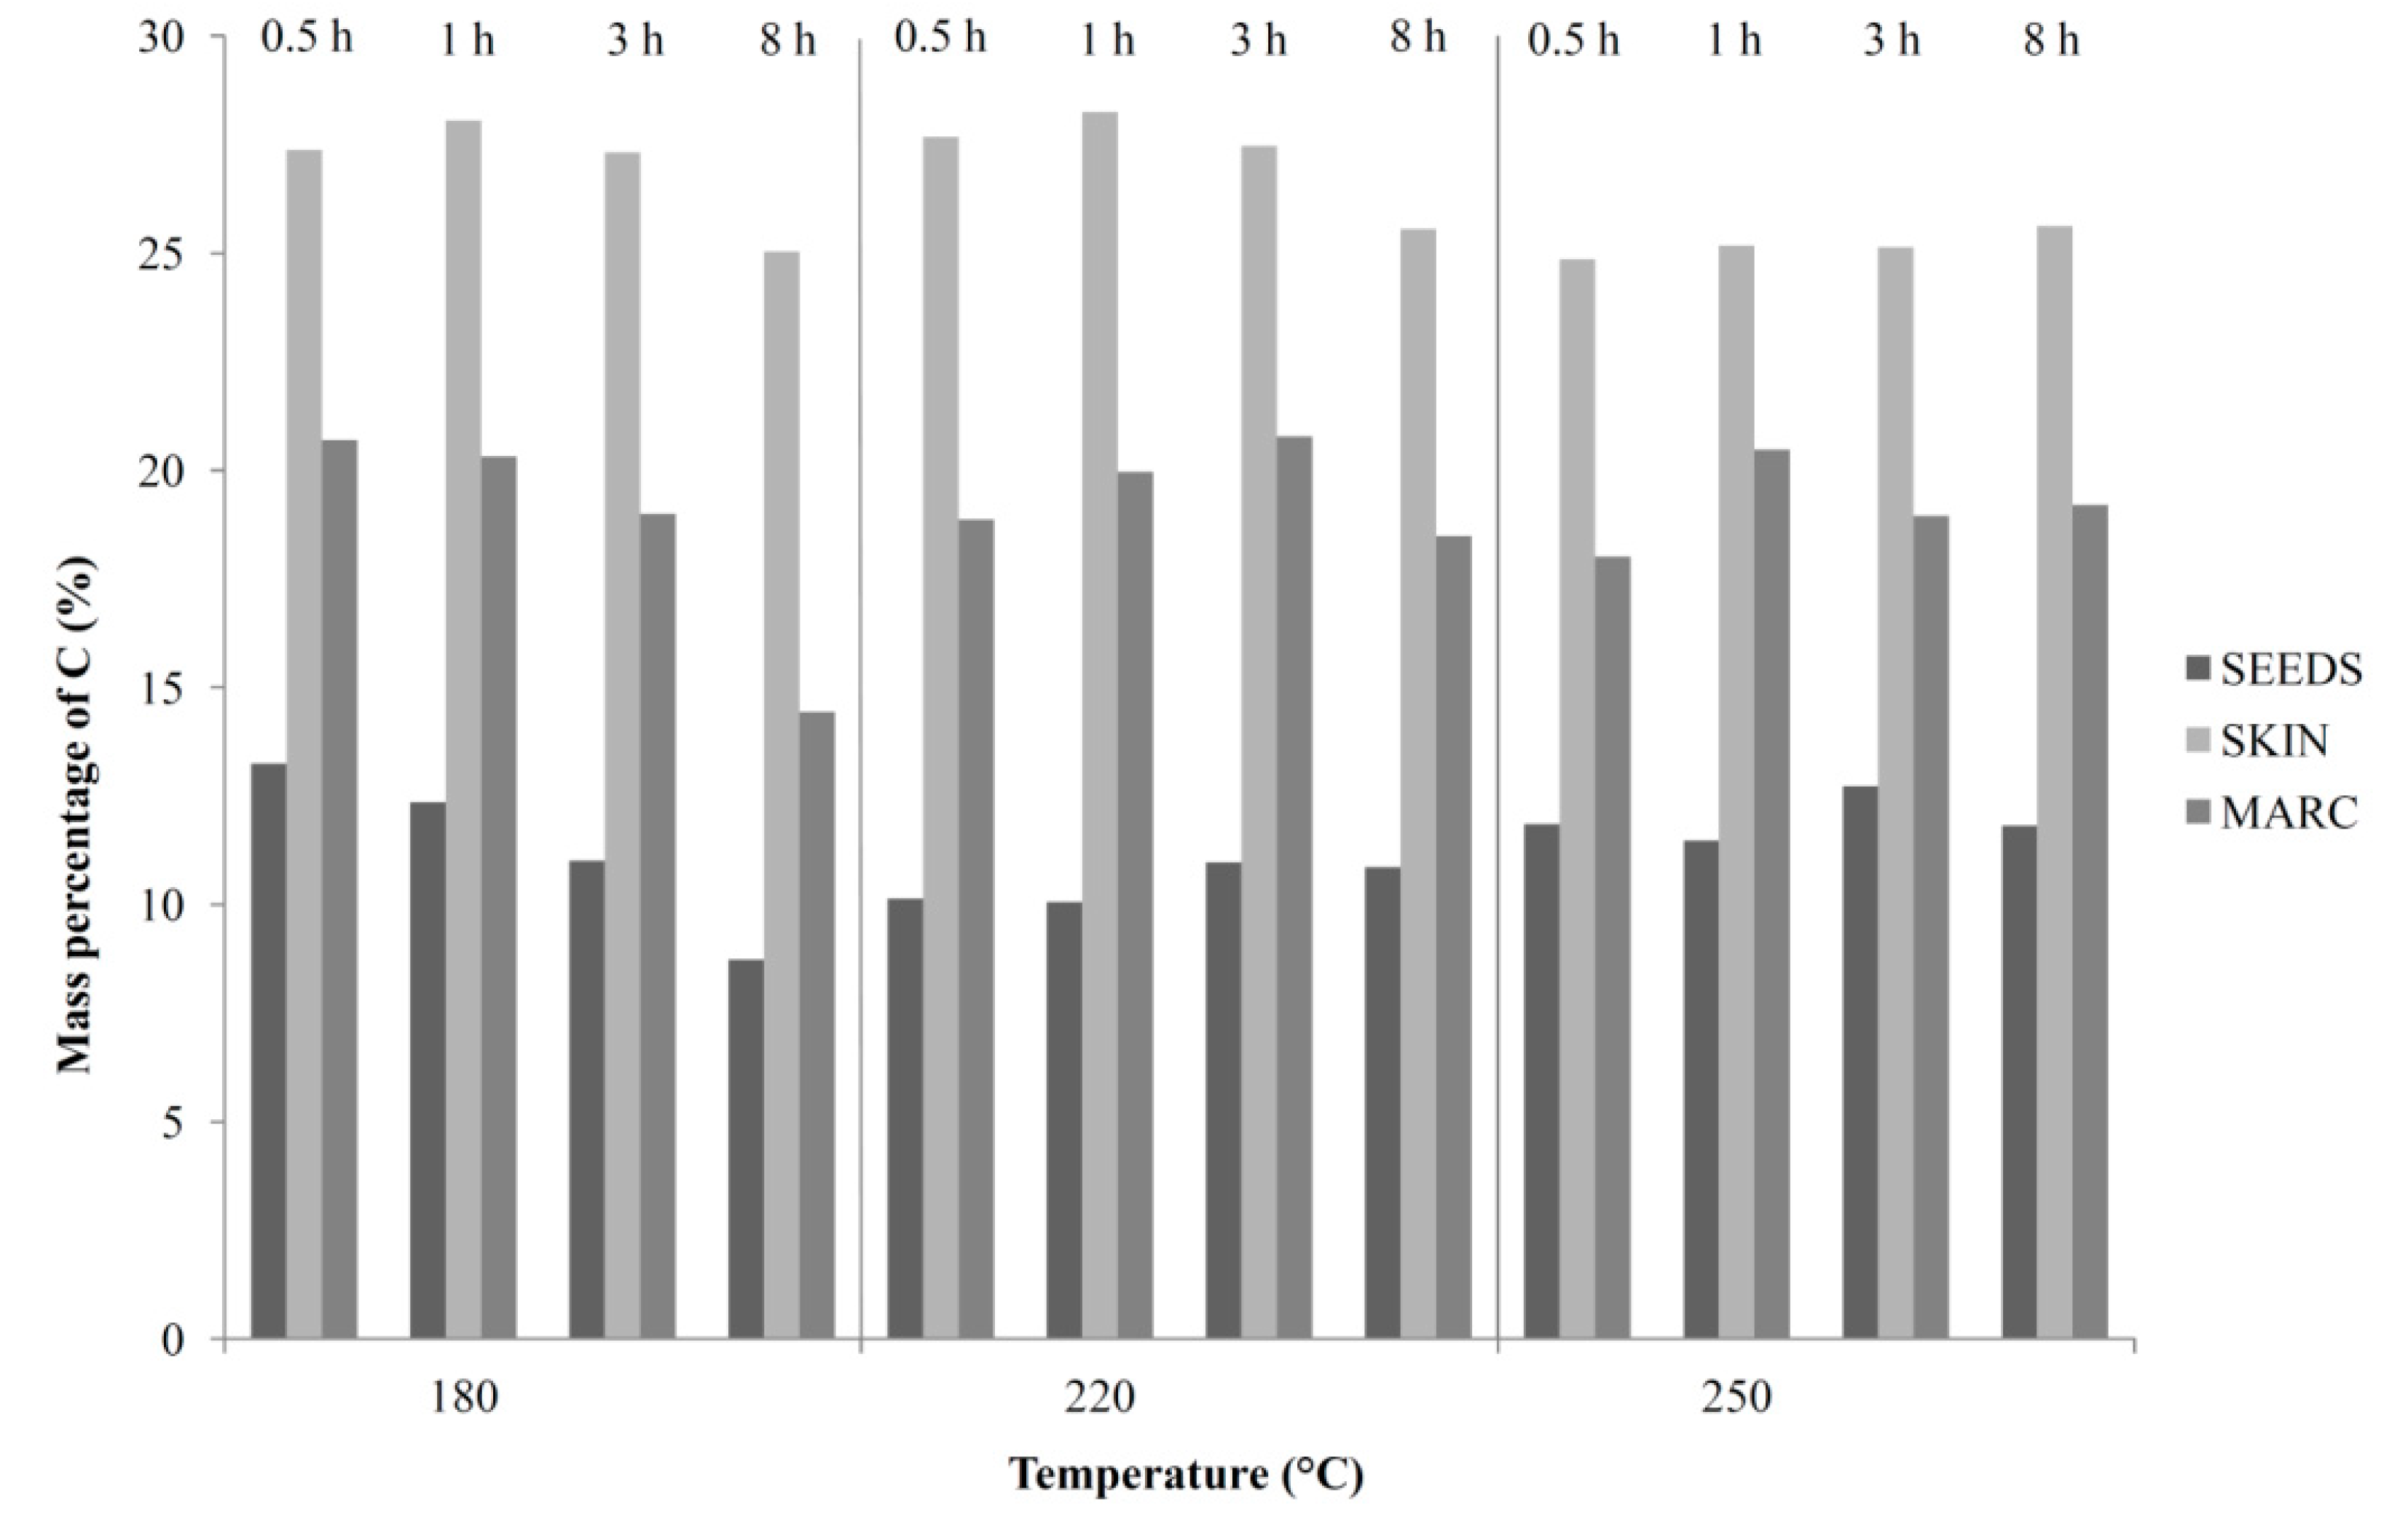
3.2. Liquid Products

Total organic carbon (TOC) and inductively coupled plasma (ICP) analyses were performed on the liquid phase obtained from the carbonization of the three substrates. TOC data were used to calculate the mass of carbon that is transferred into the liquid phase during HTC, and then the percentage of carbon originally present in the raw solid that is transferred to the liquid phase: Figure 3.
Although the data are very variable, in general at 180 °C the mass of carbon within the liquid tends to decrease with time. This can be due to polymerization reactions that involve organic molecules in the liquid phase, which solidify producing secondary char, according to the definition given by Müller and Vogel [39]. Another cause of the decrease of the carbon in the liquid can be the formation of gaseous compounds (carbon dioxide and carbon monoxide, Section 3.3).
Regarding grape seeds, the carbon content is decreasing with time at 180 °C, while it is slightly increasing at higher temperatures. Regarding grape skin, not a clear correlation is obtained. However, it seems that the maximum carbon concentration within the liquid is reached after 1 h of treatment, whatever the temperature. The difference between the obtained trends observed could be due to the different composition of seeds and skins, especially regarding the distribution between cellulose, hemicelluloses and lignin: seeds contain more lignin than skins. This could explain why the amount of organic carbon in the liquid phase accounts for 8–13% and 24–28% for seeds and skins, respectively.
Table 3 reports the results of the ICP analyses performed on the HTC liquid produced processing grape seeds, grape skins and grape marc respectively.
The value of 8–13% of C in the aqueous phase for experiments with seeds is in agreement with literature [37,40]. At 180 °C, it seems to be clear that the carbon content decreases in the liquid phase for HTC experiments with seeds. One explanation could be that lignin and part of cellulose are not completely degraded into the liquid phase at this temperature, even if the reaction time increases. By increasing the reaction time, two phenomena could occur: organic liquids are broken into little molecules and gas is produced or they react causing repolymerization. Regarding the solid phase with respect to the raw material, the carbon content increased more significantly after 8 h and oxygen content decreased significantly and this can be linked to repolymerization reactions. At higher temperatures, hemicelluloses and lignin are attacked by water and the walls of the seeds are expected to be thinner, allowing the release of organic molecules in the liquid phase. In addition, seeds contain oily products that could dissolve in the aqueous phase.
The dissolution of inorganic ions into the liquid was studied analyzing the liquid phase through ICP. The data are reported in Table 3. for grape seeds, grape skins and grape marc, respectively.
It is not possible to identify a clear correlation between process conditions and results obtained with this analysis. The phosphorous content in the process water is higher at 180 °C, presenting a peak for all the three substrates carbonized at 180 °C for 1 h. After 1 h, the phosphorous content tends to decrease. At higher temperatures, this inorganic element tends to lower his presence. In general, the presence of inorganics seems to be higher during the early stages of the carbonization, the data presenting typically a maximum at around 1 h. Going on with the residence time, the total amount of inorganics slightly tend to decrease or to remain quite constant.

3.3. Gaseous Products

Table 4 reports the gas yields (mass of formed gas divided by the mass of feedstock).
Considering the composition of each substrate, in terms of hemicellulose, cellulose and lignin content, it is clear that grape skins, mostly composed by holocellulose, produce more gas than grape seeds, which are a woody material. The gas yields for grape marc are quite in the middle between the values for grape seeds and those for grape skins. This is completely in agreement with the experimental procedure adopted to reproduce grape marc as composed by seeds and skins in the proportion 50% and 50% and with the fact that seeds and skins seem do not have any synergistic effect in terms of gas production.
Moreover, the mass of feedstock that degrades into gas increases enhancing both temperature and time. The mass of gas formed during the carbonization, with respect to the initial dry charge, ranges between 1.5% (for seeds carbonized at 180 °C for 0.5 h) and 9.4% (for skins carbonized at 250 °C for 8 h).
The gaseous phase produced during each carbonization test was analyzed. The results are reported in Table 5.
The gas formed during a HTC process is mainly composed by carbon dioxide. In particular, as far as grape marc is concerned, the molar fractions of carbon dioxide range between 93.7 and 99.4%. Carbon monoxide is present in a range of 0.5–5.9%, while traces of methane (0.00–0.17%) and hydrogen (0.05–0.55%) are found. Focusing on grape marc and considering the trend of formation of these gases, at lower temperatures (180 °C) the percentage of carbon dioxide tends to decrease with residence time, while the formation of carbon monoxide and hydrogen (even though at very small percentages) is promoted. Methane has a peak after 1 h (0.05%), and then it tends to decrease with time. At 220 °C, the trend previously described cannot be clearly appreciated, even though a slight decrease in the carbon dioxide percentage can be seen, in particular from 0.5 h to 1 h. Then, the molar fraction of this gas seems to remain constant (95.97% at 1 h, 96.02% at both 3 and 8 h). Interestingly, if the carbon dioxide percentage remains constant, the carbon monoxide production has a peak at 1 h (3.72%), presenting a slight decrease at longer residence times (3.63% at 3 h, and 3.64% at 8 h). Hydrogen has a peak after 3 h (0.3%) but tends to decrease at 8 h (0.24%). On the contrary, the presence of methane increases with time. At 250 °C, carbon dioxide seems to decrease in the early stages of the process (from 0.5 h to 1 h), while it increases at longer residence times. Conversely, carbon monoxide percentage increases from 0.5 h to 1 h, and decreases at 3 h and 8 h. As expected, at higher temperatures more methane and hydrogen are formed, and their production increases at longer residence times.
As far as carbon dioxide is concerned, which represents averagely the 96.4% in molar fraction of the gas and ranges between 92.6% (grape seeds at 250 °C, 8 h) and 99.4% (grape skins and grape marc at 180 °C, 0.5 h), at lower temperatures its amount tends to slightly decrease with time. One exception is represented by grape seeds carbonized at 180 °C, where carbon dioxide molar fraction increases from 0.5 h to 1 h. After one hour, carbon dioxide begins to decrease. This particular behavior cannot be appreciated for the other substrates at the same HTC temperature. One hypothesis can be that, being grape seeds composed mainly by lignin, the process conditions are not strong enough to make the gasification mechanisms to completely start after only 0.5 h. If compared with the molar fraction of carbon dioxide produced by grape skins after the same residence time at 180 °C, the more easily degradable molecules composing this substrate can faster initiate all the gasification mechanisms.
The molar percentages of carbon monoxide formed at 180 °C and at 220 °C tend to increase both with temperature and residence time, while at 250 °C they tend to decrease after 3 h. One exception is represented by data of grape seeds carbonized at 250 °C. In this case, carbon monoxide increases from 0.5 to 1 h, then it decreases from 1 to 3 h, and finally it increases again from 3 to 8 h. It is noteworthy that the gaseous phases with lower concentration of carbon dioxide and higher concentration of H2 are obtained at residence time of 8 h, for all the three cases analyzed. The higher amount of H2 can be due to the fact that at longer residence times, even the molecules dissolved within the liquid phase contribute to its formation. Moreover, the higher presence of potassium within the liquid phase at longer residence times could act as a catalyst with respect to the H2 formation. Furthermore, the decrease of Ca in the liquid phase at 220 °C compared to 180 °C would be the result of CaCO3 formation, since CO2 has a significant decrease in proportion.
Methane is present in very low concentrations. None or negligible amounts of methane were formed during the carbonization of grape skins. When carbonizing grape seeds and marc, methane molar fractions tend to increase at higher temperatures. The H2 production generally tends to increase both with temperature and residence time, and traces of this molecule were always found after every carbonization.

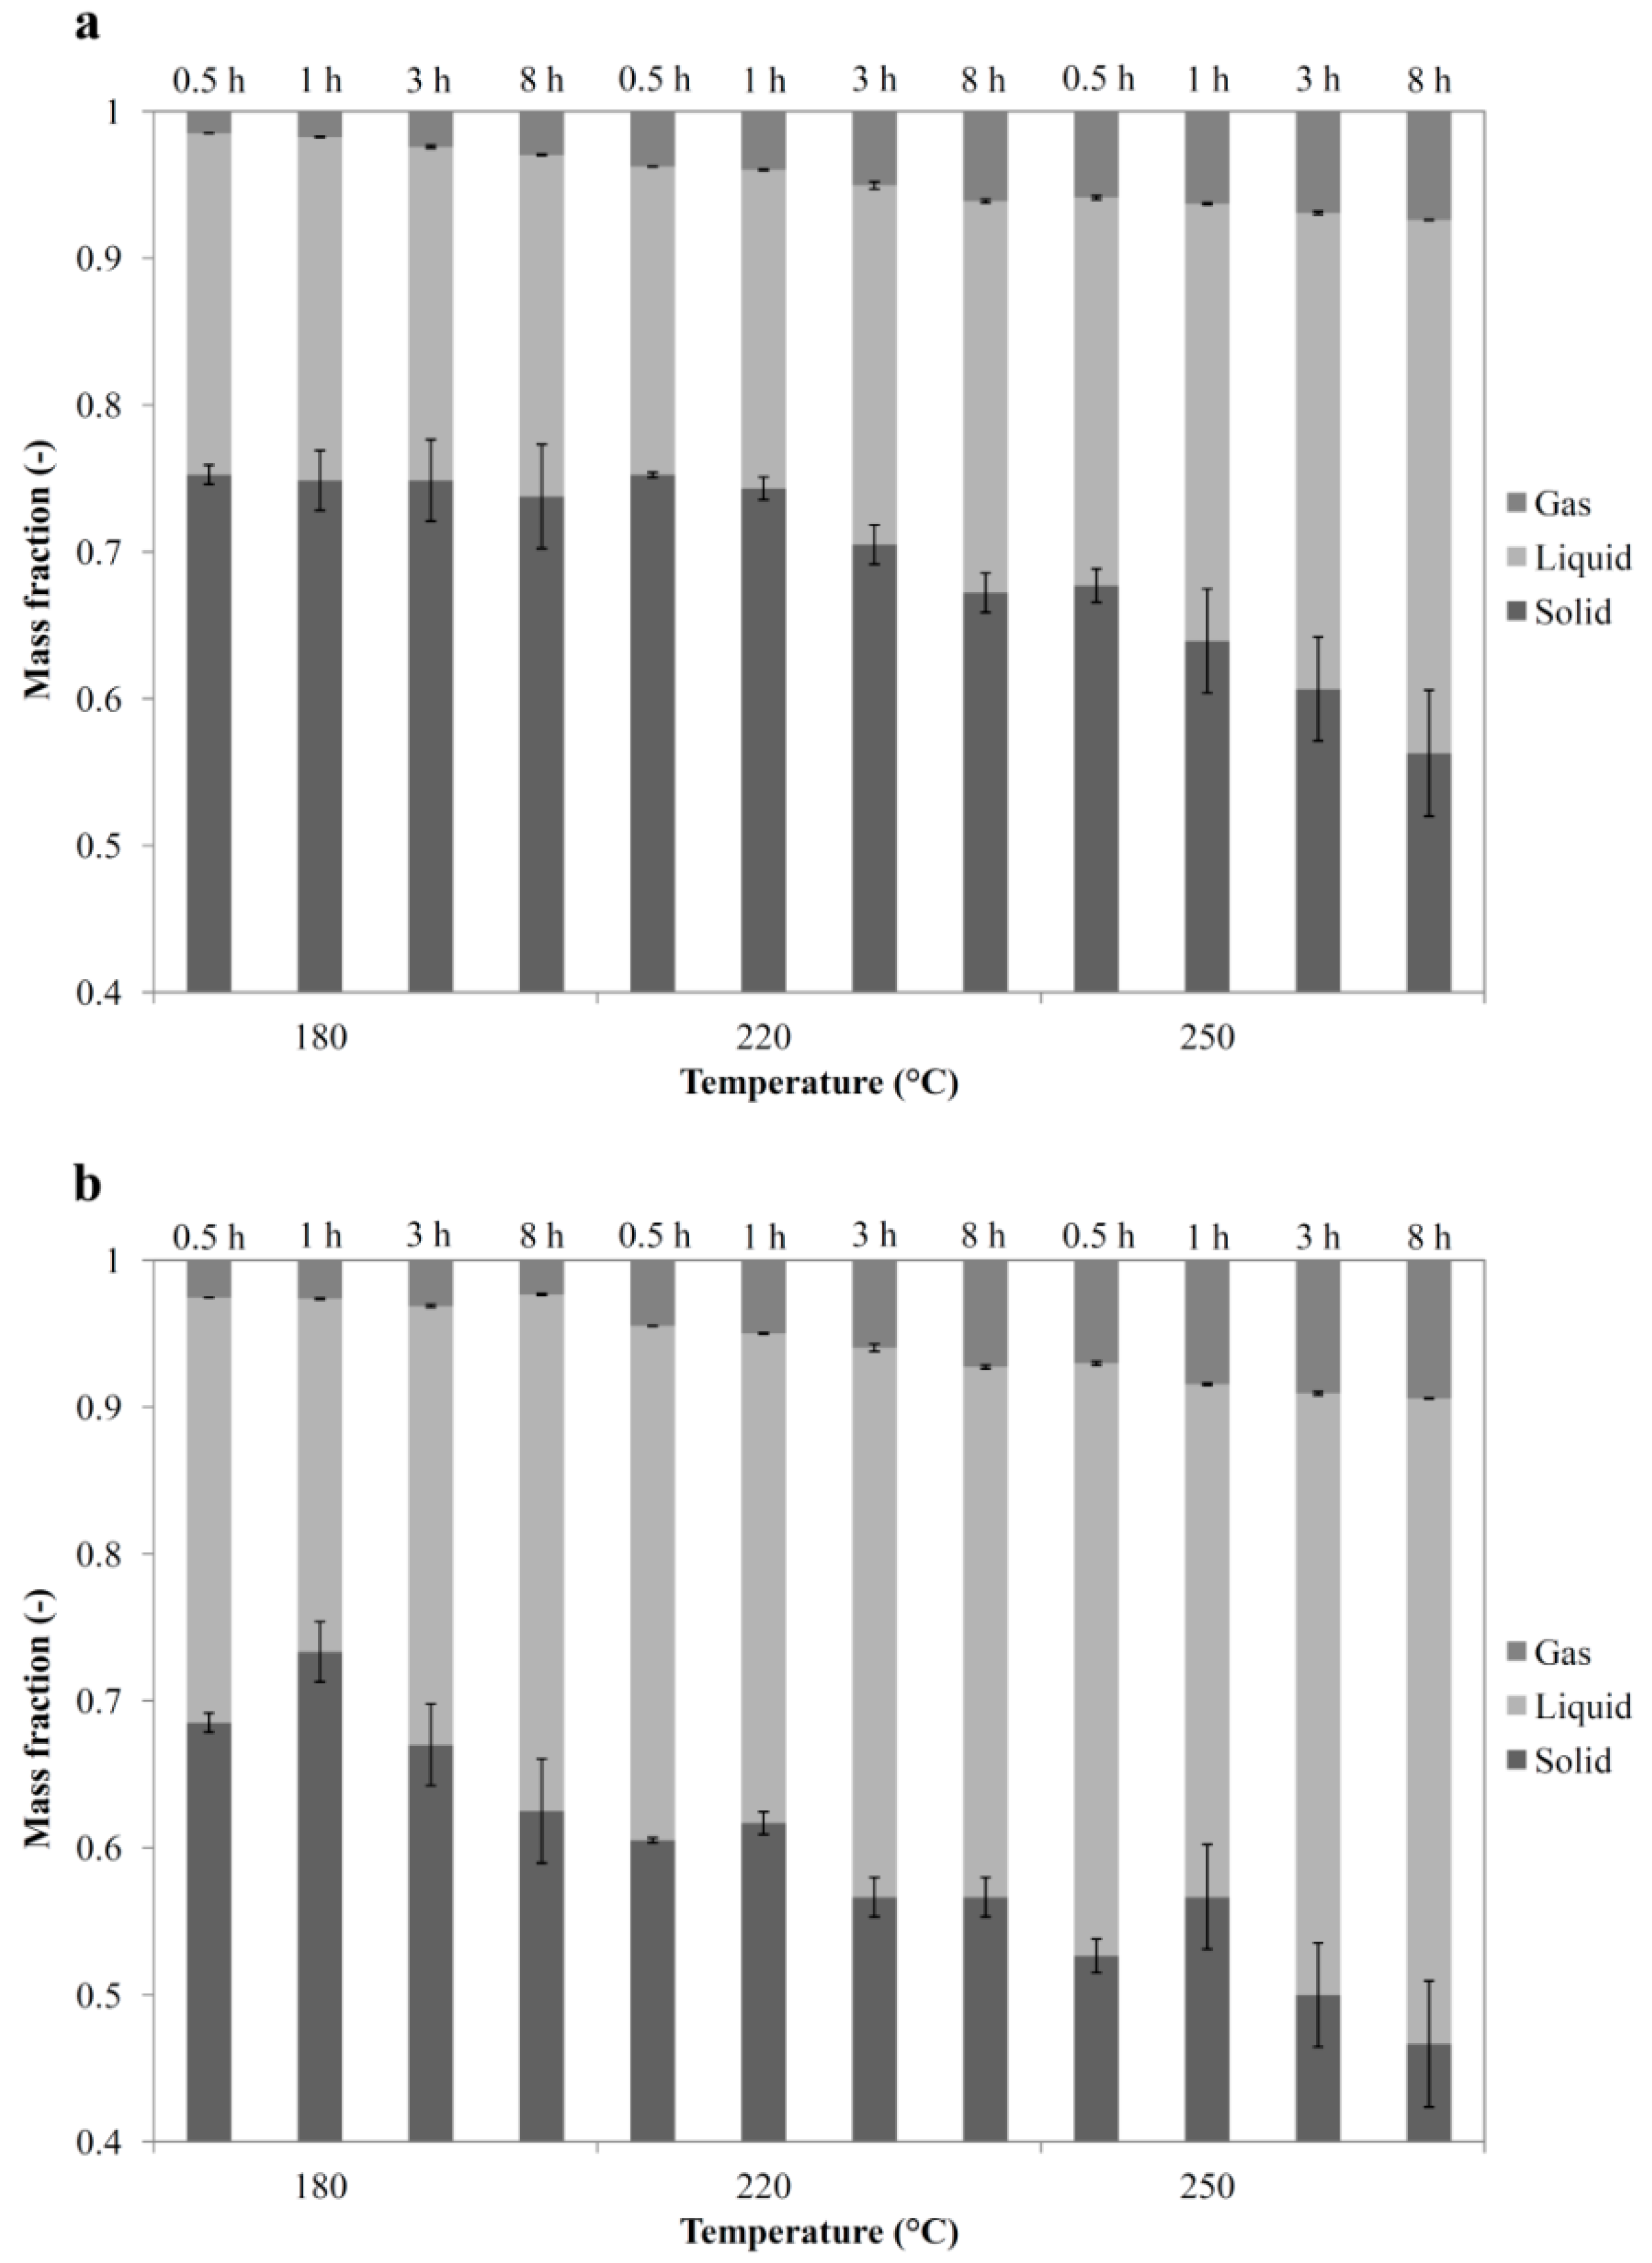
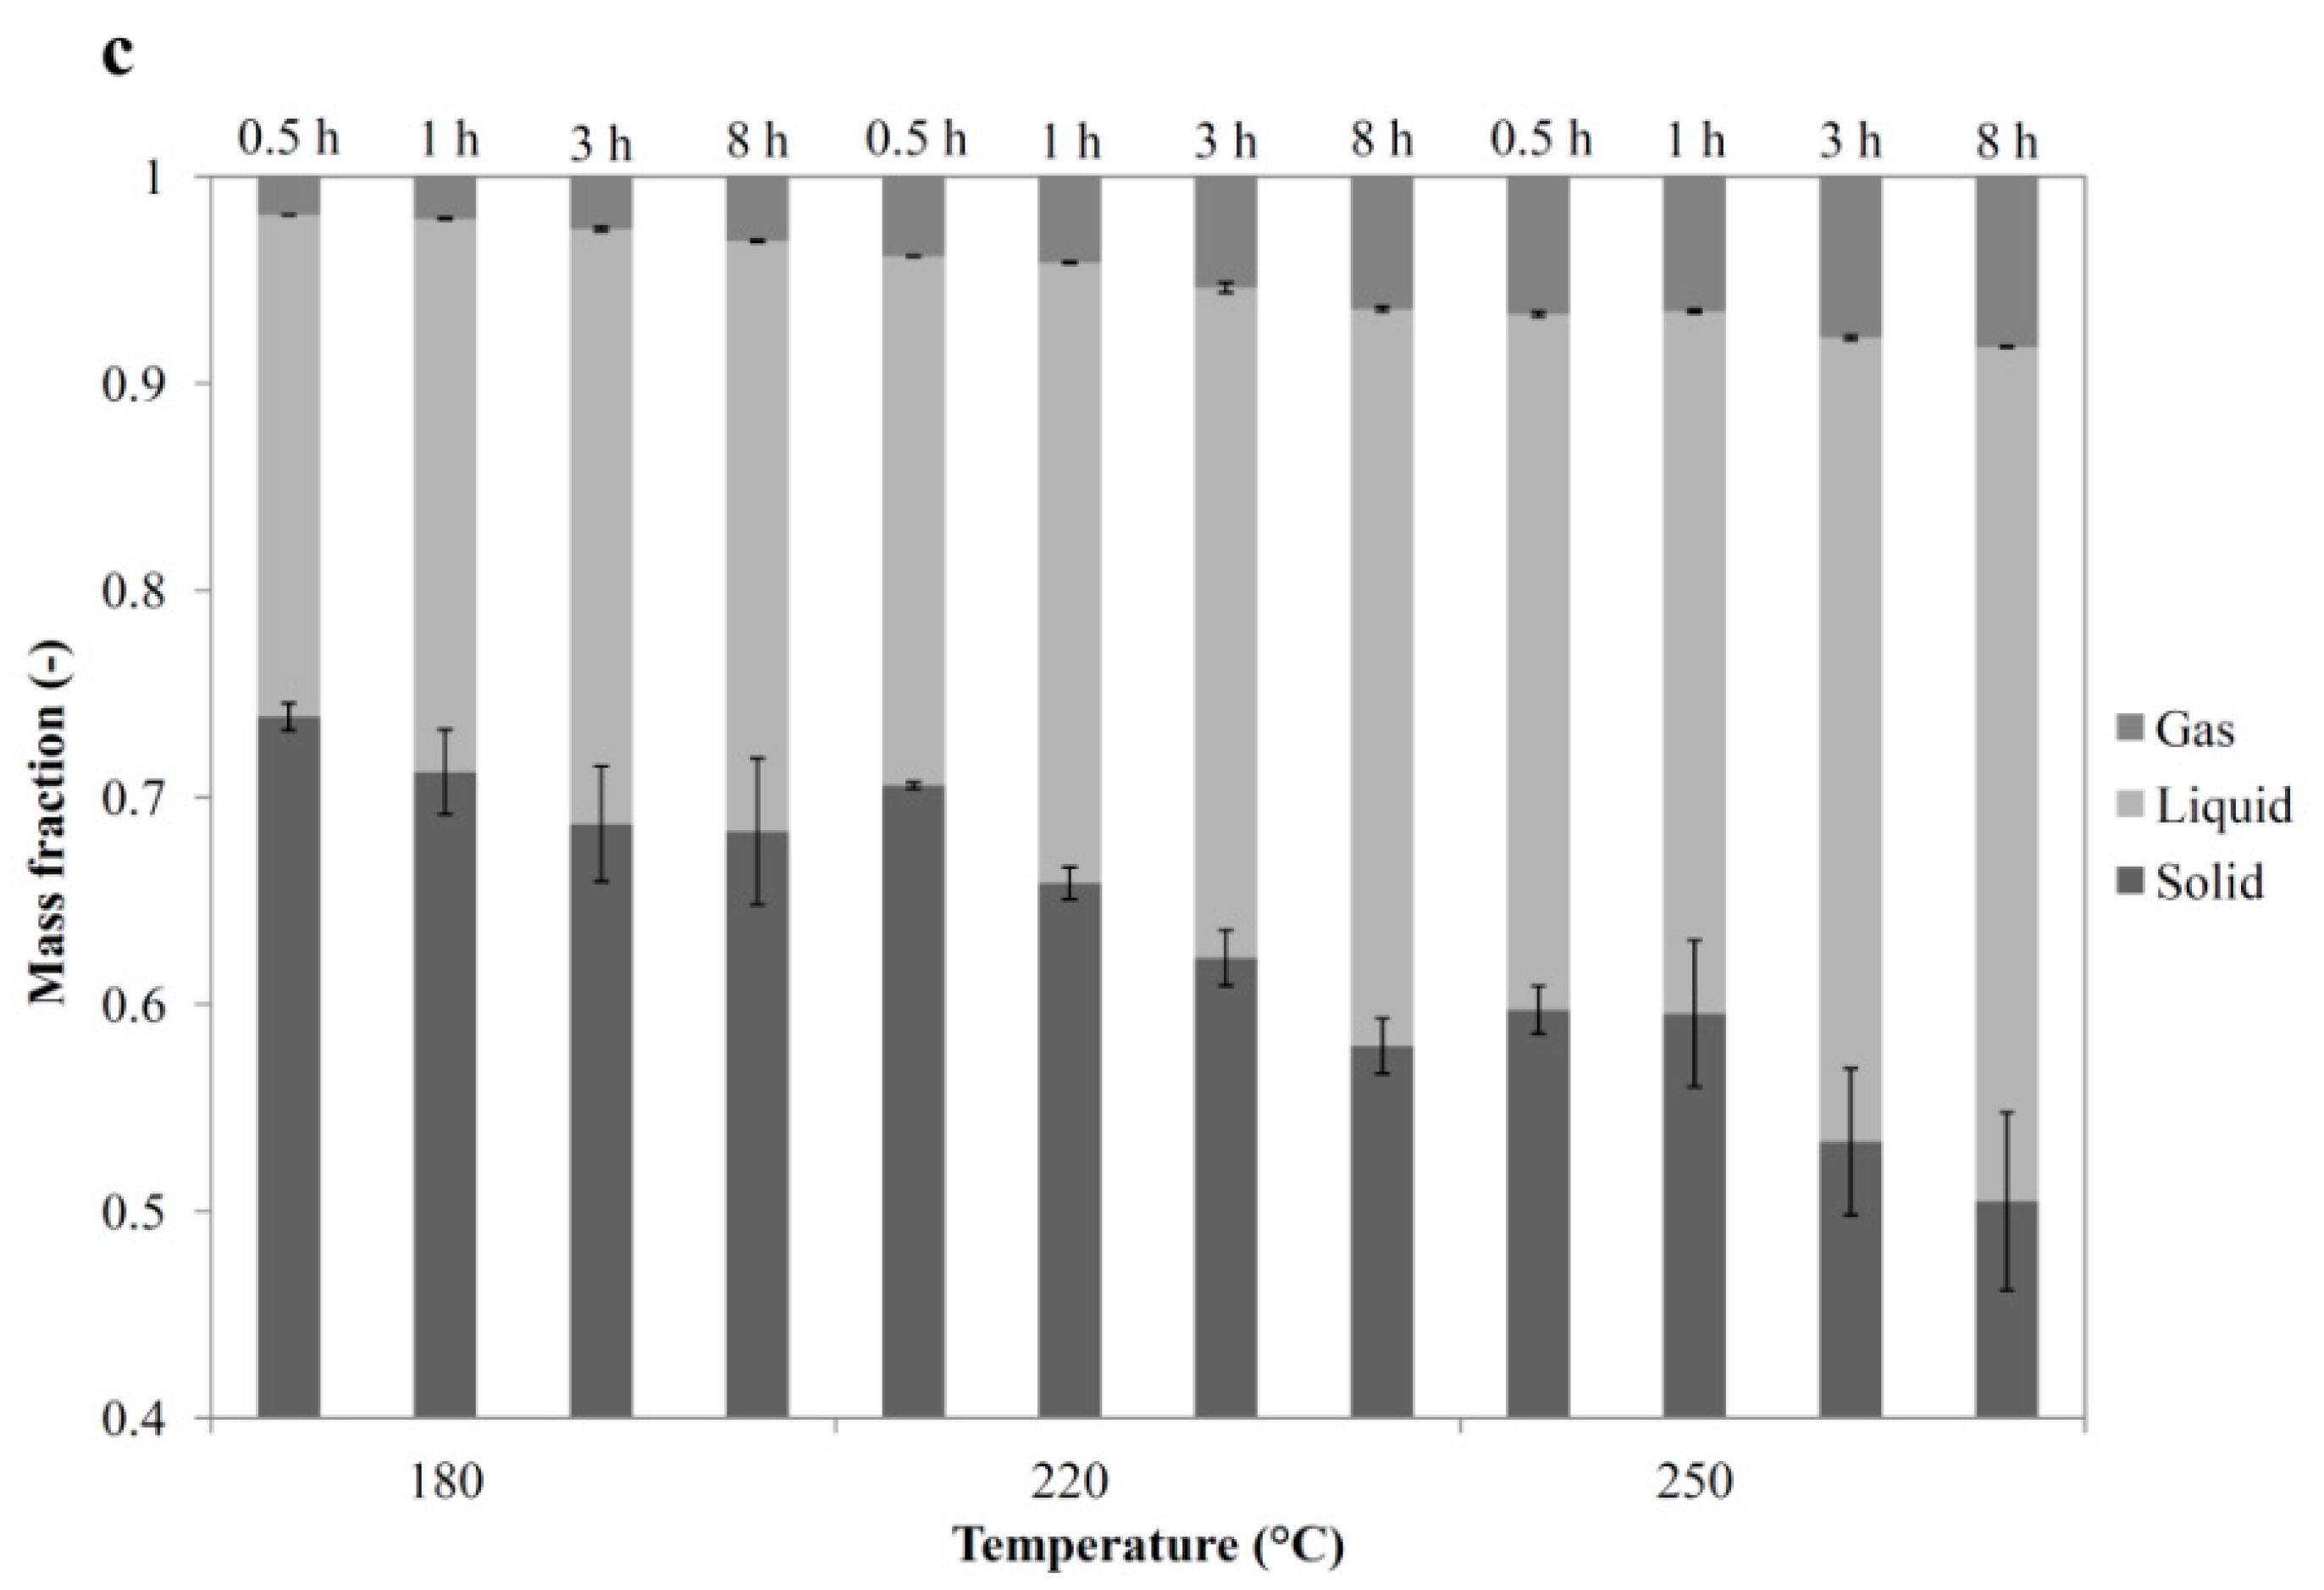
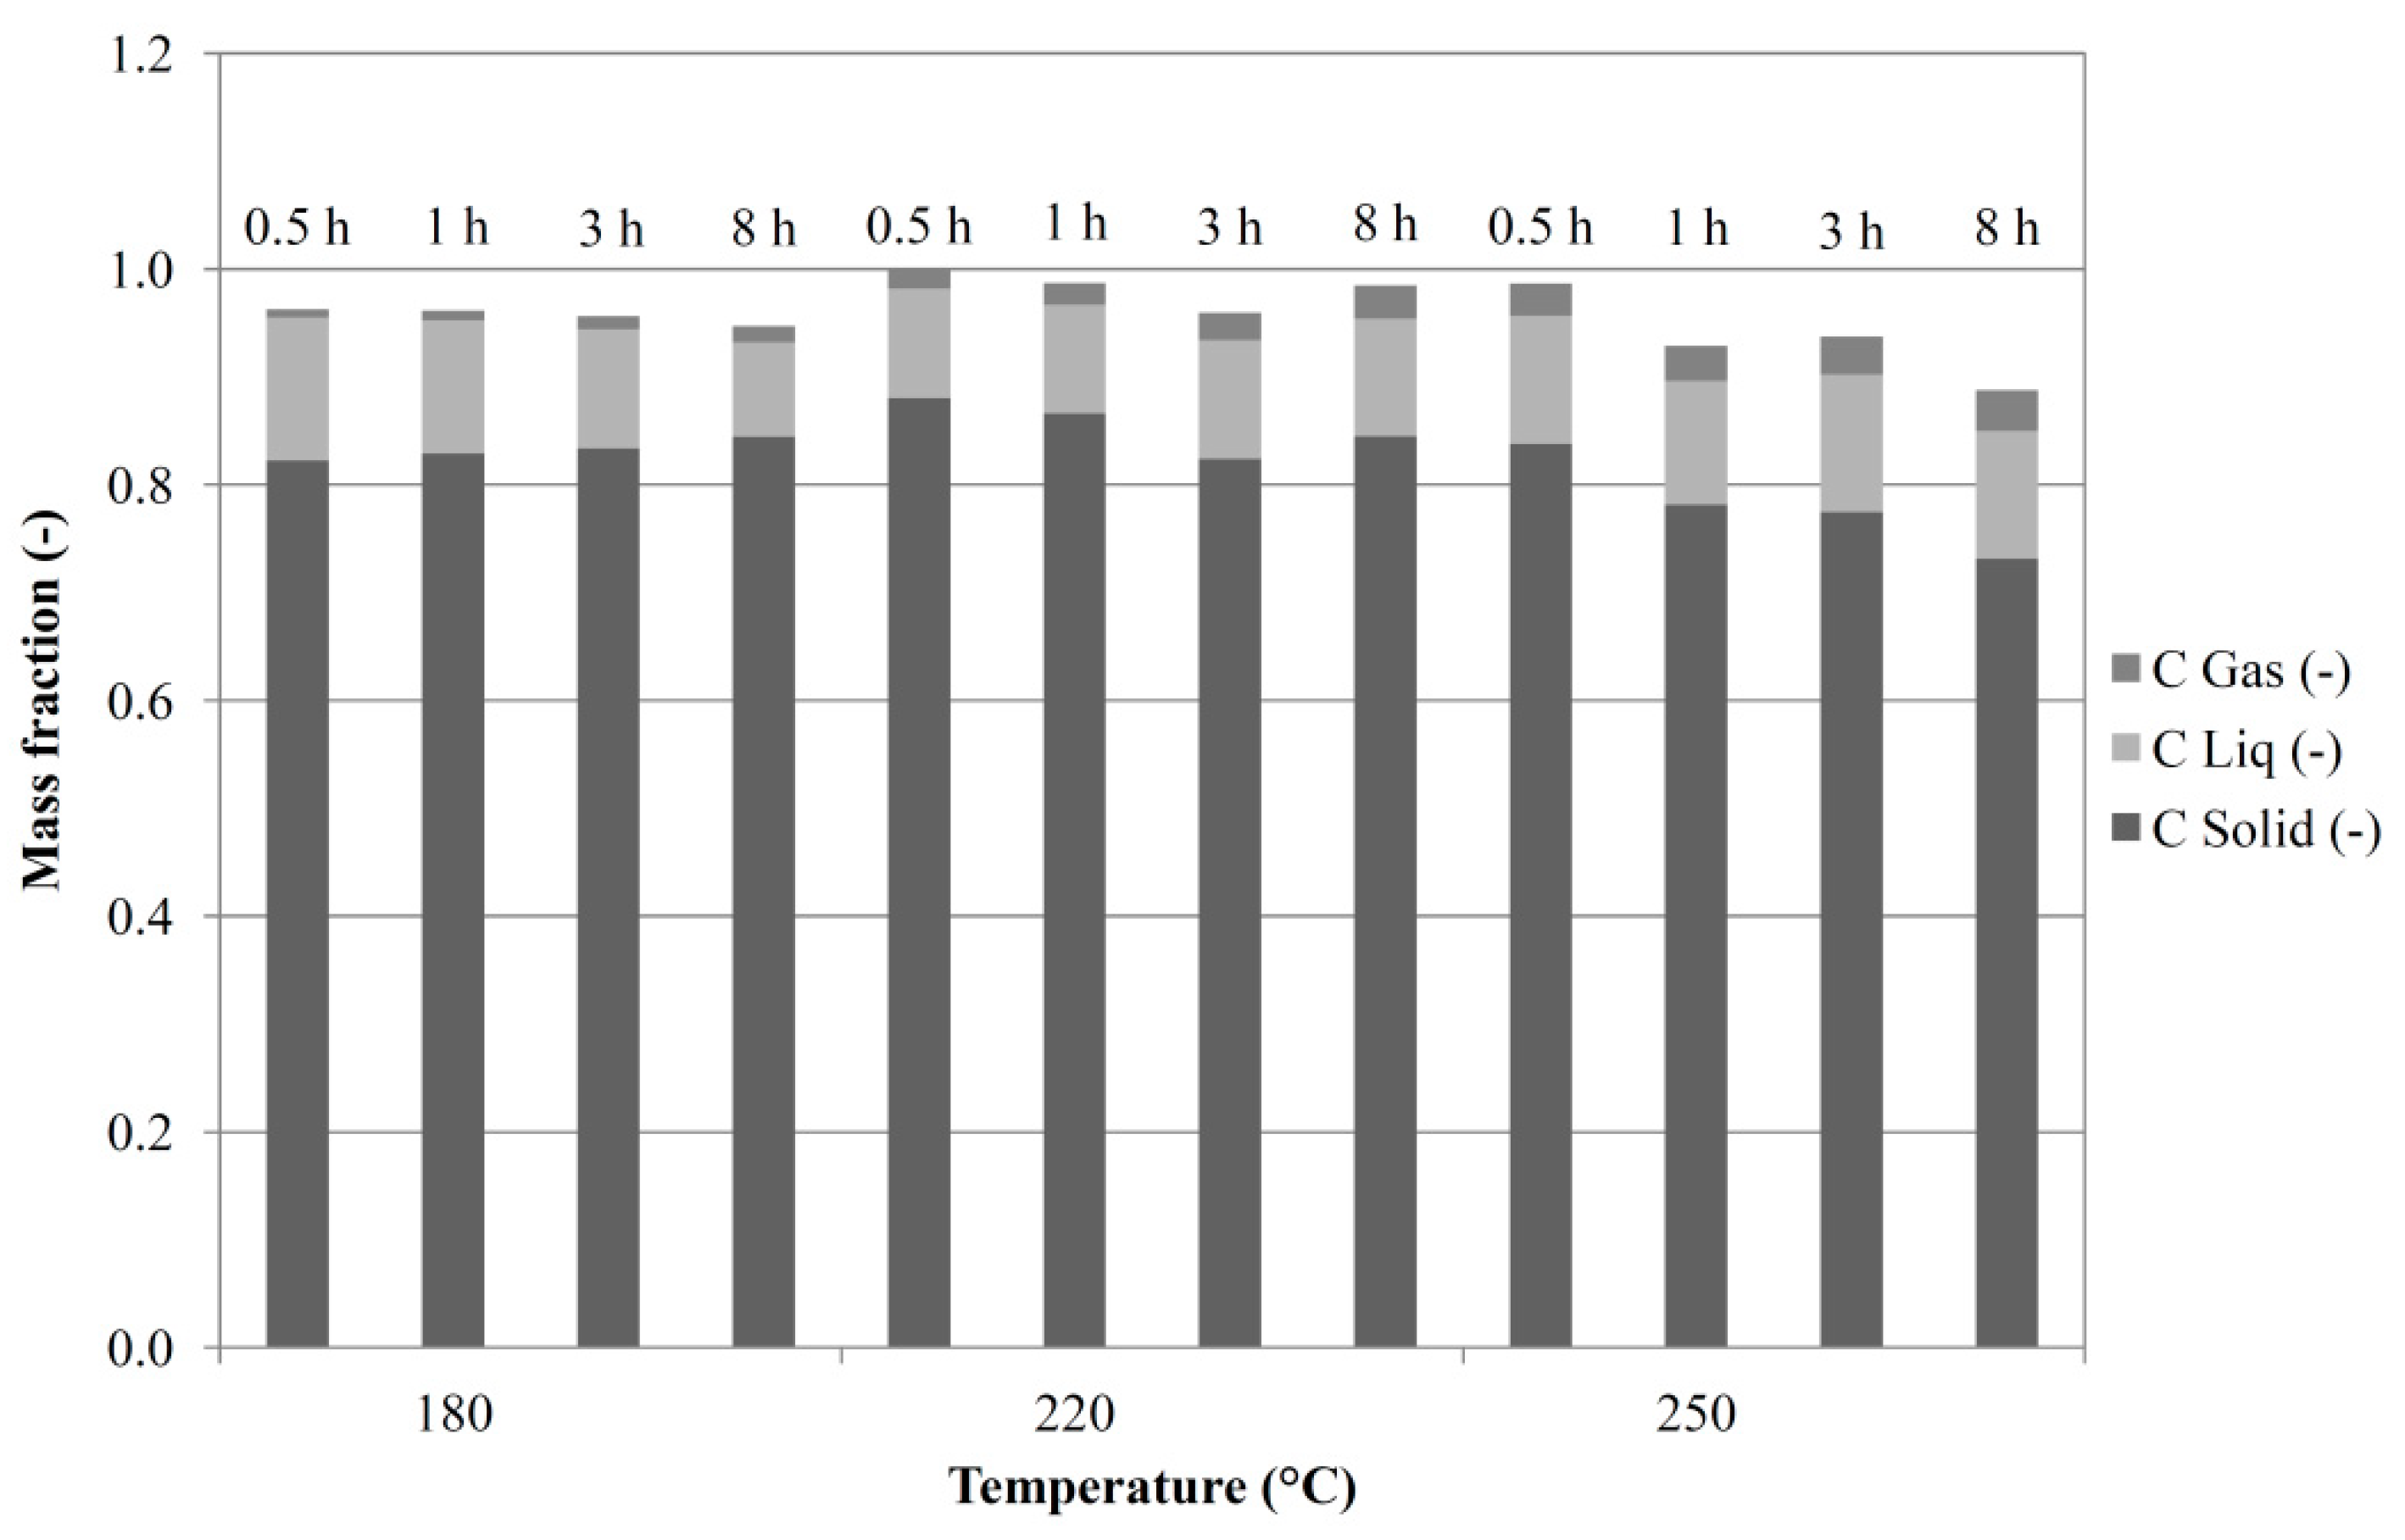
3.4. Overall Balances

Figure 4 shows the mass yields of the three phases obtained downstream of the HTC process at the different operating conditions.
Generally, the longer the residence time and the higher the temperature, the lower is the hydrochar yield. Moreover, the mass lost by the feedstock during the process tends in proportion to move more to the gaseous phase than to the liquid phase. In particular, at longer residence times the liquid production tends to be lower, in proportion, than the gas released, since the gas production is slightly enhanced. This fact can be explained considering that, as the residence time increases, the compounds, which were solved in the liquid phase, degrade into gaseous compounds more and more. Thus, a part of the liquid compounds contributes to the formation of the gases. At higher temperatures, the gasification reactions occur faster than at lower temperatures: this fact can explain why at 250 °C the distribution of the mass lost during HTC between liquid and gas seems to be slightly time independent. Moreover, to analyze the carbon distribution between the three phases, the carbon balance for grape seeds was calculated and is reported in Figure 5.
The carbon mass fractions in solid, liquid and gas were obtained calculating the mass of carbon present within each phase and dividing this datum by the mass of carbon initially present within the raw feedstock.
As expected, carbon mainly remains in the solid phase, ranging between 73 and 88% of the carbon initially present within the feedstock. Interestingly, the mass fraction of carbon within the hydrochar obtained at 180 °C tends to increase with time, while the mass of carbon contained within the hydrochars obtained at 220 °C and 250 °C tends to decrease with time. The higher carbon fraction in the hydrochar is obtained after 0.5 h at 220 °C, while the lower value is obtained after 8 h at 250 °C. The carbon mass fraction in the liquid phase ranges between 8.7 and 13.3%, being the lower value referred to the test performed for 8 h at 180 °C, and the higher value referred to the test performed for 0.5 h at 180 °C. In the gas, the carbon mass fraction ranges between 0.8% (0.5 h, 180 °C) and 3.8% (8 h, 250 °C).
As far as grape skins and marc are concerned, the carbon mass fraction tends to decrease with time, and this behavior can be appreciated for each HTC temperature. Considering HTC of grape skins, the carbon content ranges between 67.9% (8 h, 250 °C) and 85.4% (1 h, 180 °C) in the hydrochar, between 24.9% (0.5 h, 250 °C) and 28.2% (1 h, 220 °C) in the liquid, and between 1.4% (8 h, 180 °C) and 5.6% (8 h, 250 °C) in the gas. As far as grape marc is concerned, the carbon ranges between 69.1% (8 h, 250 °C) and 85.7% (0.5 h, 220 °C) in the hydrochar, between 14.4% (8 h, 180 °C) and 20.8% (3 h, 220 °C) in the liquid and between 1.0% (0.5 h, 180 °C) and 4.6% (8 h, 250 °C) in the gas.

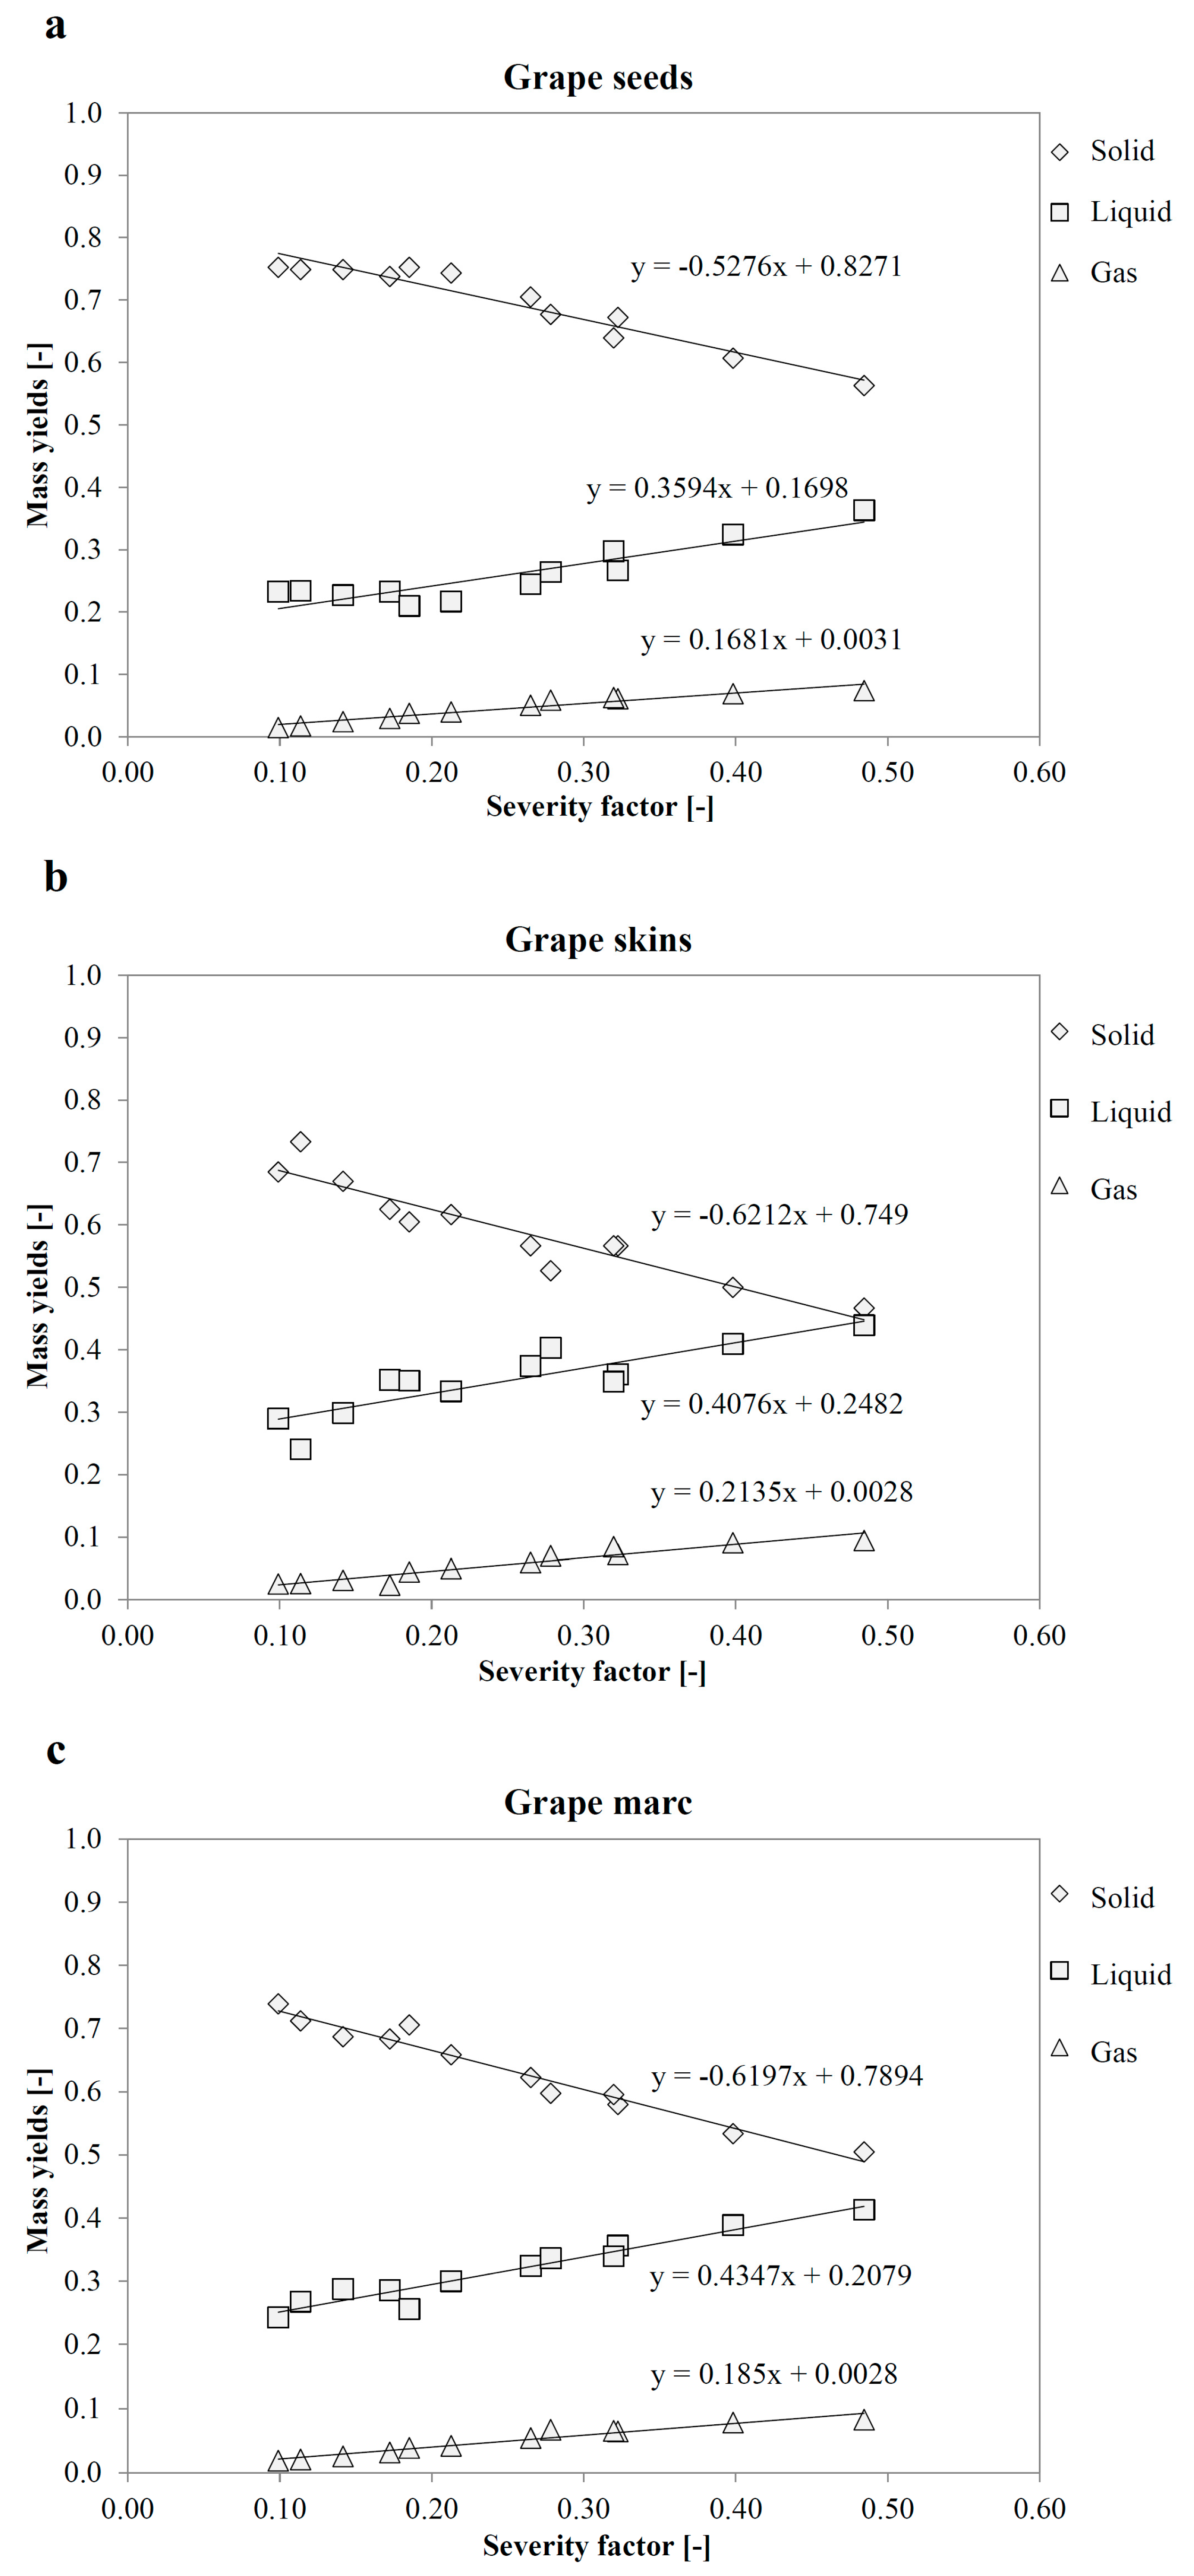
3.5. Yields Prediction Using a Severity Factor

The mass yields of the solid, liquid and gaseous phases obtained after hydrothermal carbonization were plotted as a function of the severity factor, obtaining the trend lines for each substrate (Figure 6).
The data are fitted very well by the trend lines, thus the description of mass yields as a function of SF proposed by Ruyter [26] can be used for the development of prediction models in the case of the three substrates here investigated. When predicting the solid mass yields of the hydrochars for the three substrates with the trend lines, the absolute errors range between 0.02 and 9.39%, while the predictions for both the liquid and the gaseous phases seems to be less accurate in some cases, presenting absolute errors higher than 10%. Hoekman et al. [40] proposed a different severity factor (hereinafter SFR0) shown in Equation (3), where t is expressed in min and T in °C, and applied it to hydrothermally carbonized loblolly pine:
S F R 0 = l o g { t · exp [ ( T 100 ) 14.75 ] }
Similar results were obtained by using SFR0 to hydrothermally carbonized grape seeds, skins and marc (data not shown). Even in this case, the description of the solid yields was quite good, having absolute errors ranging between 0.31 and 7.1%, while both liquid and gaseous phase presented in more than one case absolute errors higher than 10%. However, once the description of the mass yield in terms of SF is improved, it could allow finding different couples of temperature and residence time that give the same value of SF, which corresponds to a mass yield value. For example, performing HTC at 220 °C for 8 h gives almost the same SF (i.e., SF = 0.32) as at 250 °C for 1 h. Thus, the mass yields of the three phases obtained at this SF conditions should be similar. This clearly happens for grape skins and marc, while for grape seeds the difference (especially for the solid mass yield) is more evident.
In general, a careful analysis of the data reported in Figure 6 allows stating that, during HTC, the mutual effect of the grape marc constituents, seeds and skins, is negligible, but not null.
Table 6 reports the yield in the different phases obtained downstream of the HTC of grape marc calculated resorting to the linear correlations “phase yield vs. SF” reported in Figure 6. More precisely, the columns indicated as EXP refer to the actual experimental data relevant to grape marc (Figure 6c), while in the columns indicated as MEAN the yields were calculated averaging the yield data relevant to grape marc constituents (Figure 6a,b). If there was no interaction between seeds and skins during HTC, the EXP and MEAN yield data should be identical: the differences are in truth very small, but exist and follow a precise trend. The hydrochar yield experimentally obtained for grape marc is slightly lower than that calculated adding the contributions of seeds and skins: the differences increase at increasing SF. Conversely, the liquid phase yield experimentally obtained is slightly higher than that calculated, and the differences increase at increasing SF. Finally, the gas yield experimentally obtained is slightly lower than that calculated, and the differences remain the same in all the range of SF investigated. As a whole, the synergistic effect of seeds and skins during HTC results in a slight increase in liquid yield at the expenses of both solid and gas yields.

5. Conclusions

Extensive data were collected on the HTC of grape marc and its constituents, seeds and skins. The behavior during HTC of the three substrates was satisfactorily described by a severity factor condensing both reaction temperature and time effects. A slight synergistic effect during HTC exists between the more lignocellulosic seeds and the more holocellulosic skins. The analysis allowed getting insights on the main chemical pathways occurring during HTC: the data obtained can be the basis for an in deep kinetics modeling. Several output of technological interest were also reported: HTC can be effectively applied to valorize and upgrade grape marc.

Author Contributions

D.B., L.F. and M.B. conceived and designed the experiments; D.B. performed the HTC experiments; E.W.-H., F.P. and D.B. analyzed the HTC reaction products; all the authors analyzed the data and contributed to write the paper.

Acknowledgments

The authors want to thank Celine Boachon, Christine Rolland and Jean-Marie Sabathier for their support in some solid characterizations.

Conflicts of Interest

The authors declare no conflict of interest.

References

  1. European Commission. Available online: http://ec.europa.eu/environment/circular-economy/index_en.htm (accessed on 2 May 2016).
  2. Funke, A.; Ziegler, F. Hydrothermal carbonization of biomass: A summary and discussion of chemical mechanisms for process engineering. Biofuels Bioprod. Biorefin. 2010, 4, 160–177. [Google Scholar] [CrossRef]
  3. Libra, J.A.; Ro, K.S.; Kammann, C.; Funke, A.; Berge, N.D.; Neubauer, Y.; Titirici, M.M.; Fühner, C.; Bens, O.; Kern, J.; et al. Hydrothermal carbonization of biomass residuals: A comparative review of the chemistry, processes and applications of wet and dry pyrolysis. Biofuels 2011, 2, 89–124. [Google Scholar] [CrossRef]
  4. Basso, D.; Castello, D.; Baratieri, M.; Fiori, L. Hydrothermal carbonization of waste biomass: Progress report and prospects. In Proceedings of the 21st European Biomass Conference and Exhibition, Copenhagen, Denmark, 3–7 June 2013. [Google Scholar]
  5. Volpe, M.; Goldfarb, J.L.; Fiori, L. Hydrothermal carbonization of Opuntia ficus-indica cladodes: Role of process parameters on hydrochar properties. Bioresour. Technol. 2018, 247, 310–318. [Google Scholar] [CrossRef] [PubMed]
  6. Mäkelä, M.; Volpe, M.; Volpe, R.; Fiori, L.; Dahl, O. Spatially resolved spectral determiantion of polysaccharides in hydrothermally carbonized biomass. Green Chem. 2018. [Google Scholar] [CrossRef]
  7. Yang, X.; Wang, H.; Strong, P.J.; Xu, S.; Liu, S.; Lu, K.; Sheng, K.; Guo, J.; Che, L.; He, L.; et al. Thermal Properties of Biochars Derived from Waste Biomass Generated by Agricultural and Forestry Sectors. Energies 2017, 10, 469. [Google Scholar] [CrossRef]
  8. Oh, S.-Y.; Yoon, Y.-M. Energy Recovery Efficiency of Poultry Slaughterhouse Sludge Cake by Hydrothermal Carbonization. Energies 2017, 10, 1876. [Google Scholar] [CrossRef]
  9. Liu, C.; Huang, X.; Kong, L. Efficient Low Temperature Hydrothermal Carbonization of Chinese Reed for Biochar with High Energy Density. Energies 2017, 10, 2094. [Google Scholar] [CrossRef]
  10. Zhao, S.-X.; Ta, N.; Wang, X.-D. Effect of Temperature on the Structural and Physicochemical Properties of Biochar with Apple Tree Branches as Feedstock Material. Energies 2017, 10, 1293. [Google Scholar]
  11. Guizani, C.; Jeguirim, M.; Valin, S.; Limousy, L.; Salvador, S. Biomass Chars: The Effects of Pyrolysis Conditions on Their Morphology, Structure, Chemical Properties and Reactivity. Energies 2017, 10, 796. [Google Scholar] [CrossRef]
  12. Cai, J.; Li, B.; Chen, C.; Wang, J.; Zhao, M.; Zhang, K. Hydrothermal carbonization of tobacco stalk for fuel application. Bioresour. Technol. 2016, 220, 305–311. [Google Scholar] [CrossRef] [PubMed]
  13. Mäkelä, M.; Kwong, C.W.; Broström, M.; Yoshikawa, K. Hydrothermal treatment of grape marc for solid fuel applications. Energy Convers. Manag. 2017, 145, 371–377. [Google Scholar] [CrossRef]
  14. Basso, D.; Pavanetto, R. Greenpeat: An innovative sustainable material recovered from waste. Procedia Environ. Sci. Eng. Manag. 2017, 4, 9–16. [Google Scholar]
  15. Purnomo, C.W.; Castello, D.; Fiori, L. Granular activated carbon from grape seeds hydrothermal char. Appl. Sci. 2018, 8, 331. [Google Scholar] [CrossRef]
  16. Volpe, M.; Fiori, L. From olive waste to solid biofuel through hydrothermal carbonisation: The role of temperature and solid load on secondary char formation and hydrochar energy properties. J. Anal. Appl. Pyrolysis 2017, 124, 63–72. [Google Scholar] [CrossRef]
  17. Xu, X.; Jiang, E. Treatment of urban sludge by hydrothermal carbonization. Bioresour. Technol. 2017, 238, 182–187. [Google Scholar] [CrossRef] [PubMed]
  18. Food and Agriculture Organization of the United Nations Statistics Division (FAO). 2015. Available online: http://faostat3.fao.org/home/E (accessed on 19 February 2015).
  19. Muhlack, R.A.; Potumarthi, R.; Jeffery, D.W. Sustainable wineries through waste valorisation: A review of grape marc utilisation for value-added products. Waste Manag. 2018, 72, 99–118. [Google Scholar] [CrossRef] [PubMed]
  20. Lucian, M.; Fiori, L. Hydrothermal carbonization of waste biomass: Process design, modeling, energy efficiency and cost analysis. Energies 2017, 10, 211. [Google Scholar] [CrossRef]
  21. Fiori, L.; Florio, L. Gasification and combustion of grape marc: Comparison among different scenarios. Waste Biomass Valorization 2010, 1, 191–200. [Google Scholar] [CrossRef]
  22. Jordan, R. Ecorecycle Australian Report on Grape Marc Utilization—Cold Pressed Grape Seed Oil and Meal by the Cooperative Research Centre for International Food Manufacture and Packaging Science. 2008. Available online: http://www.ecorecycle.vic.gov.au (accessed on 22 April 2018).
  23. Corbin, K.R.; Hsieh, Y.S.Y.; Betts, N.S.; Byrt, C.S.; Henderson, M.; Stork, J.; De Bolt, S.; Fincher, G.B.; Burton, R.A. Grape marc as a source of carbohydrates for bioethanol: Chemical composition, pre-treatment and saccharification. Bioresour. Technol. 2015, 193, 76–83. [Google Scholar] [CrossRef] [PubMed]
  24. Basso, D.; Hortala, E.-W.; Patuzzi, F.; Castello, D.; Baratieri, M.; Fiori, L. Hydrothermal carbonization of off-specification compost: A byproduct of the organic municipal solid waste treatment. Bioresour. Technol. 2015, 182, 217–224. [Google Scholar] [CrossRef] [PubMed]
  25. Fiori, L.; Basso, D.; Castello, D.; Baratieri, M. Hydrothermal carbonization of biomass: Design of a batch reactor and preliminary experimental results. Chem. Eng. Trans. 2014, 37, 55–60. [Google Scholar] [CrossRef]
  26. Ruyter, H.P. Coalification model. Fuel 1982, 61, 1182–1187. [Google Scholar] [CrossRef]
  27. Abatzoglou, N.; Chornet, E.; Belkacemi, K.; Overend, R.P. Phenomenological kinetics of complex systems: The development of a generalized severity parameter and its application to lignocellulosics fractionation. Chem. Eng. Sci. 1992, 47, 1109–1122. [Google Scholar] [CrossRef]
  28. Janga, K.K.; Oyaas, K.; Hertzberg, T.; Moe, S.T. Application of a pseudo-kinetic generalized severity model to the concentrated sulfuric acid hydrolysis of pinewood and aspenwood. BioResources 2012, 7, 2728–2741. [Google Scholar]
  29. Kieseler, S.; Neubauer, Y.; Zobel, N. Ultimate and proximate correlations for estimating the higher heating value of hydrothermal solids. Energy Fuels 2013, 27, 908–918. [Google Scholar] [CrossRef]
  30. Reza, M.T.; Yan, W.; Uddin, M.H.; Lynam, J.G.; Hoekman, S.K.; Coronella, C.J.; Vàsquez, V.R. Reaction kinetics of hydrothermal carbonization of loblolly pine. Bioresour. Technol. 2013, 139, 161–169. [Google Scholar] [CrossRef] [PubMed]
  31. Forchheim, D.; Hornung, U.; Kruse, A.; Sutter, T. Kinetic modelling of hydrothermal lignin depolymerisation. Waste Biomass Valorization 2014, 5, 985–994. [Google Scholar] [CrossRef]
  32. Van Krevelen, D.W. Graphical-statistical method for the study of structure and reaction processes of coal. Fuel 1950, 29, 269–284. [Google Scholar]
  33. Funke, A.; Ziegler, F. Heat of reaction measurements for hydrothermal carbonization of biomass. Bioresour. Technol. 2011, 102, 7595–7598. [Google Scholar] [CrossRef] [PubMed]
  34. Schafer, H.N.S. Factors affecting the equilibrium moisture content of low rank coals. Fuel 1972, 51, 4–9. [Google Scholar] [CrossRef]
  35. Blaszò, M.; Jakab, E.; Vargha, A.; Székely, T.; Zoebel, H.; Klare, H.; Keil, G. The effect of hydrothermal treatment on Merseburg lignite. Fuel 1986, 65, 337–341. [Google Scholar]
  36. Lau, F.S.; Roberts, M.J.; Rue, D.M.; Punwani, D.V.; Wen, W.W.; Johnson, P.B. Peat beneficiation by wet carbonization. Int. J. Coal Geol. 1987, 8, 111–121. [Google Scholar] [CrossRef]
  37. Pala, M.; Kantarli, I.C.; Buyukisik, H.B.; Yanik, J. Hydrothermal carbonization and torrefaction of grape pomace: A comparative evaluation. Bioresour. Technol. 2014, 161, 255–262. [Google Scholar] [CrossRef] [PubMed]
  38. Lu, L.; Namioka, T.; Yoshikawa, K. Effects of hydrothermal treatment on characteristics and combustion behaviors of municipal solid wastes. Appl. Energy 2011, 88, 3659–3664. [Google Scholar] [CrossRef]
  39. Müller, J.B.; Vogel, F. Tar and coke formation during hydrothermal processing of glycerol and glucose. Influence of temperature, residence time and feed concentration. J. Supercrit. Fluids 2012, 70, 126–136. [Google Scholar]
  40. Hoekman, S.K.; Broch, A.; Felix, L.; Farthing, W. Hydrothermal carbonization (HTC) of loblolly pine using a continuous, reactive twin-screw extruder. Energy Convers. Manag. 2017, 134, 247–259. [Google Scholar] [CrossRef]
Figure 1. SEM images of grape seeds (a,b), carbonized grape skins (c) and carbonized grape seeds (d). Both grape skins and seeds (c,d) were carbonized at 250 °C for 8 h.
Energies 11 01379 g001
Figure 2. Van Krevelen diagram of grape marc (a) and degree of carbonization vs. severity factor (b).
Energies 11 01379 g002
Figure 3. Mass percentage of carbon in the liquid phase.
Energies 11 01379 g003
Figure 4. Overall balances for grape seeds (a), skins (b) and marc (c). At least two measurements were performed to evaluate the error bars.
Energies 11 01379 g004aEnergies 11 01379 g004b
Figure 5. Carbon balance of grape seeds.
Energies 11 01379 g005
Figure 6. Mass yields of grape seeds (a), skins (b), mar (c) vs severity factor severity factor (SF).
Energies 11 01379 g006
Table 1. Elemental analysis of the raw feedstocks and of the hydrochars obtained at different process conditions.
Grape SeedsGrape SkinsGrape Marc
Temperature
(°C)
Time (h)SFC
(%)
H
(%)
N
(%)
O
(%)
Ash
(%)
C
(%)
H
(%)
N
(%)
O
(%)
Ash
(%)
C
(%)
H
(%)
N
(%)
O
(%)
Ash
(%)
Raw feedstock-054.46.61.634.23.246.85.42.636.29.049.76.22.435.56.1
1800.50.09959.56.71.430.12.254.96.52.531.93.956.96.52.031.13.3
10.11460.26.61.327.82.554.56.02.632.24.656.25.92.530.84.5
30.14260.66.51.427.42.755.46.22.330.85.157.05.62.630.34.5
80.17262.36.81.425.43.558.25.72.128.35.657.25.72.829.73.7
2200.50.18563.76.81.525.32.659.76.42.325.65.660.46.42.027.33.7
10.21363.46.71.624.02.858.86.32.326.75.459.85.72.628.03.8
30.26563.66.41.623.82.961.06.02.325.45.262.55.42.725.93.5
80.32368.46.71.918.33.162.35.52.723.45.964.15.72.224.04.0
2500.50.27867.36.51.720.83.664.76.22.320.75.864.76.42.221.84.8
10.32066.56.41.820.53.063.95.62.721.26.664.95.82.822.33.9
30.39869.56.61.917.03.166.36.13.018.95.665.66.02.820.35.3
80.48570.76.52.015.73.968.25.33.118.44.368.15.82.619.44.2
Table 2. Heating values of grape seeds, skins and marc at different process conditions.
Temperature
(°C)
Time
(h)
HHV Seeds
(MJ/kg)
HHV Skins
(MJ/kg)
HHV Marc
(MJ/kg)
Raw feedstock-22.5218.6620.59
1800.522.8419.1621.51
124.9219.3822.46
324.3620.6922.72
824.3623.8423.52
2200.522.7021.8421.03
122.9124.3620.95
326.3523.1121.71
826.0926.7224.01
2500.522.9721.8823.24
123.3324.5624.86
327.8124.8526.09
828.7927.5426.19
Table 3. ICP data of the liquid obtained after HTC of grape seeds, skins and marc. All the values are in μg/L.
FeedstockTemp. (°C)Res. Time (h)AlCaCuFeKMgPSSiZnTotal (μg/L)Total (μg)
Grape seeds1800.50.065.60.37.21716.963.5141.82.022.51.42021.241.2
10.054.60.431.82223.687.5344.446.869.03.32861.358.4
30.015.91.617.72247.283.3279.742.651.12.42741.655.9
80.06.10.221.82151.473.5224.627.046.12.82553.552.1
2200.50.037.20.48.51788.642.341.63.221.90.51944.339.7
10.03.80.44.42031.447.974.738.559.41.12261.646.1
30.03.30.13.51945.044.220.728.745.40.92091.842.7
80.089.20.42.02036.443.66.320.146.91.22245.945.8
2500.50.049.10.011.12197.217.132.86.443.90.92358.448.1
10.0127.30.33.32099.137.419.638.662.61.82389.948.8
30.0131.80.21.02233.137.49.716.057.50.92487.750.7
80.0165.60.40.42255.236.23.411.844.61.02518.651.4
Grape skins1800.50.0126.50.00.52006.433.778.26.414.10.32266.168.0
10.0126.80.01.12144.836.5129.956.618.42.92517.075.5
30.069.80.01.22433.337.6126.262.216.72.72749.682.5
80.012.40.04.22541.438.7102.956.819.32.02777.883.3
2200.50.040.80.00.82612.523.842.49.512.40.22742.582.3
10.03.90.01.52887.030.375.873.716.72.23091.292.7
30.05.60.00.02936.027.251.764.518.42.13105.593.2
80.02.60.00.02897.024.637.563.922.33.43051.391.5
2500.50.030.30.00.22381.119.515.412.911.80.12471.274.1
10.03.60.00.03000.819.939.371.122.91.73159.394.8
30.019.80.00.03077.117.414.959.334.71.33224.596.7
80.027.00.00.03012.515.723.854.327.50.93161.794.9
Grape marc1800.50.0153.80.03.32495.957.7129.010.924.20.92875.777.6
10.0133.60.06.22522.265.2217.496.725.13.33069.882.9
30.038.90.07.13014.068.6199.698.030.61.33458.193.4
80.012.10.06.13116.452.9144.570.229.31.23432.792.7
2200.50.034.00.00.72974.538.754.47.220.70.43130.684.5
10.011.40.02.83806.049.8114.192.730.51.94109.2110.9
30.07.90.01.84159.545.973.186.136.63.34414.2119.2
80.07.90.00.13402.439.649.865.631.91.63598.797.2
2500.50.019.90.00.42870.529.35.112.025.60.42963.280.0
10.08.50.00.03616.135.645.069.534.51.63810.6102.9
30.041.80.00.03697.229.027.555.934.91.53887.8105.0
80.047.30.00.03577.228.814.247.841.31.03757.6101.5
Table 4. Gas yields (mass of gas formed divided by the mass of initial dry feedstock, %).
Temperature (°C)
180220250
Residence Time (h)SeedsSkinsMarcSeedsSkinsMarcSeedsSkinsMarc
0.51.52.51.93.84.53.95.97.06.7
11.72.62.04.05.04.26.38.56.5
32.43.12.55.06.05.46.99.17.8
83.03.63.16.17.36.47.49.48.2
Table 5. Gas composition at different process conditions.
Temperature (°C)
180220250
FeedstockRes. Time (h)CO2COCH4H2CO2COCH4H2CO2COCH4H2
Grape seeds0.597.652.090.000.2696.793.060.000.1594.914.850.030.20
199.080.800.000.1295.763.910.010.3294.435.250.060.27
398.371.160.000.4795.414.270.030.2994.604.870.080.45
897.192.110.000.7094.864.450.020.6692.595.930.381.11
Grape skins0.599.420.460.000.1197.272.510.010.2095.174.590.030.21
199.340.490.000.1696.653.090.000.2694.215.540.000.25
398.900.780.000.3296.303.370.000.3393.785.800.000.42
896.552.280.001.1795.733.790.000.4895.853.560.000.59
Grape marc0.599.430.520.000.0596.892.960.020.1294.934.860.040.17
199.100.710.050.1495.973.720.030.2993.745.890.070.29
398.751.010.020.2296.023.630.040.3094.824.710.110.35
898.171.440.030.3696.023.640.100.2496.322.950.170.55
Table 6. Data refers to grape marc. The experimental values (EXP) were calculated by using the correlations of Figure 6c. The mean values (MEAN) were calculated by averaging the correlations of Figure 6a,b.
Yield
Solid (Hydrochar)LiquidGas
SFExpMeanErr %ExpMeanErr %ExpMeanErr %
0.10.7270.731−0.40.2510.2471.60.0210.022−3.3
0.20.6650.673−1.10.2950.2863.20.0400.041−3.2
0.30.6030.616−2.00.3380.3244.40.0580.060−3.1
0.40.5420.558−3.00.3820.3625.30.0770.079−3.1
0.50.4800.501−4.30.4250.4016.10.0950.098−3.1

