Energy Performance of Liquid Desiccant and Evaporative Cooling-Assisted 100% Outdoor Air Systems under Various Climatic Conditions


Abstract
:1. Introduction
2. System Overview
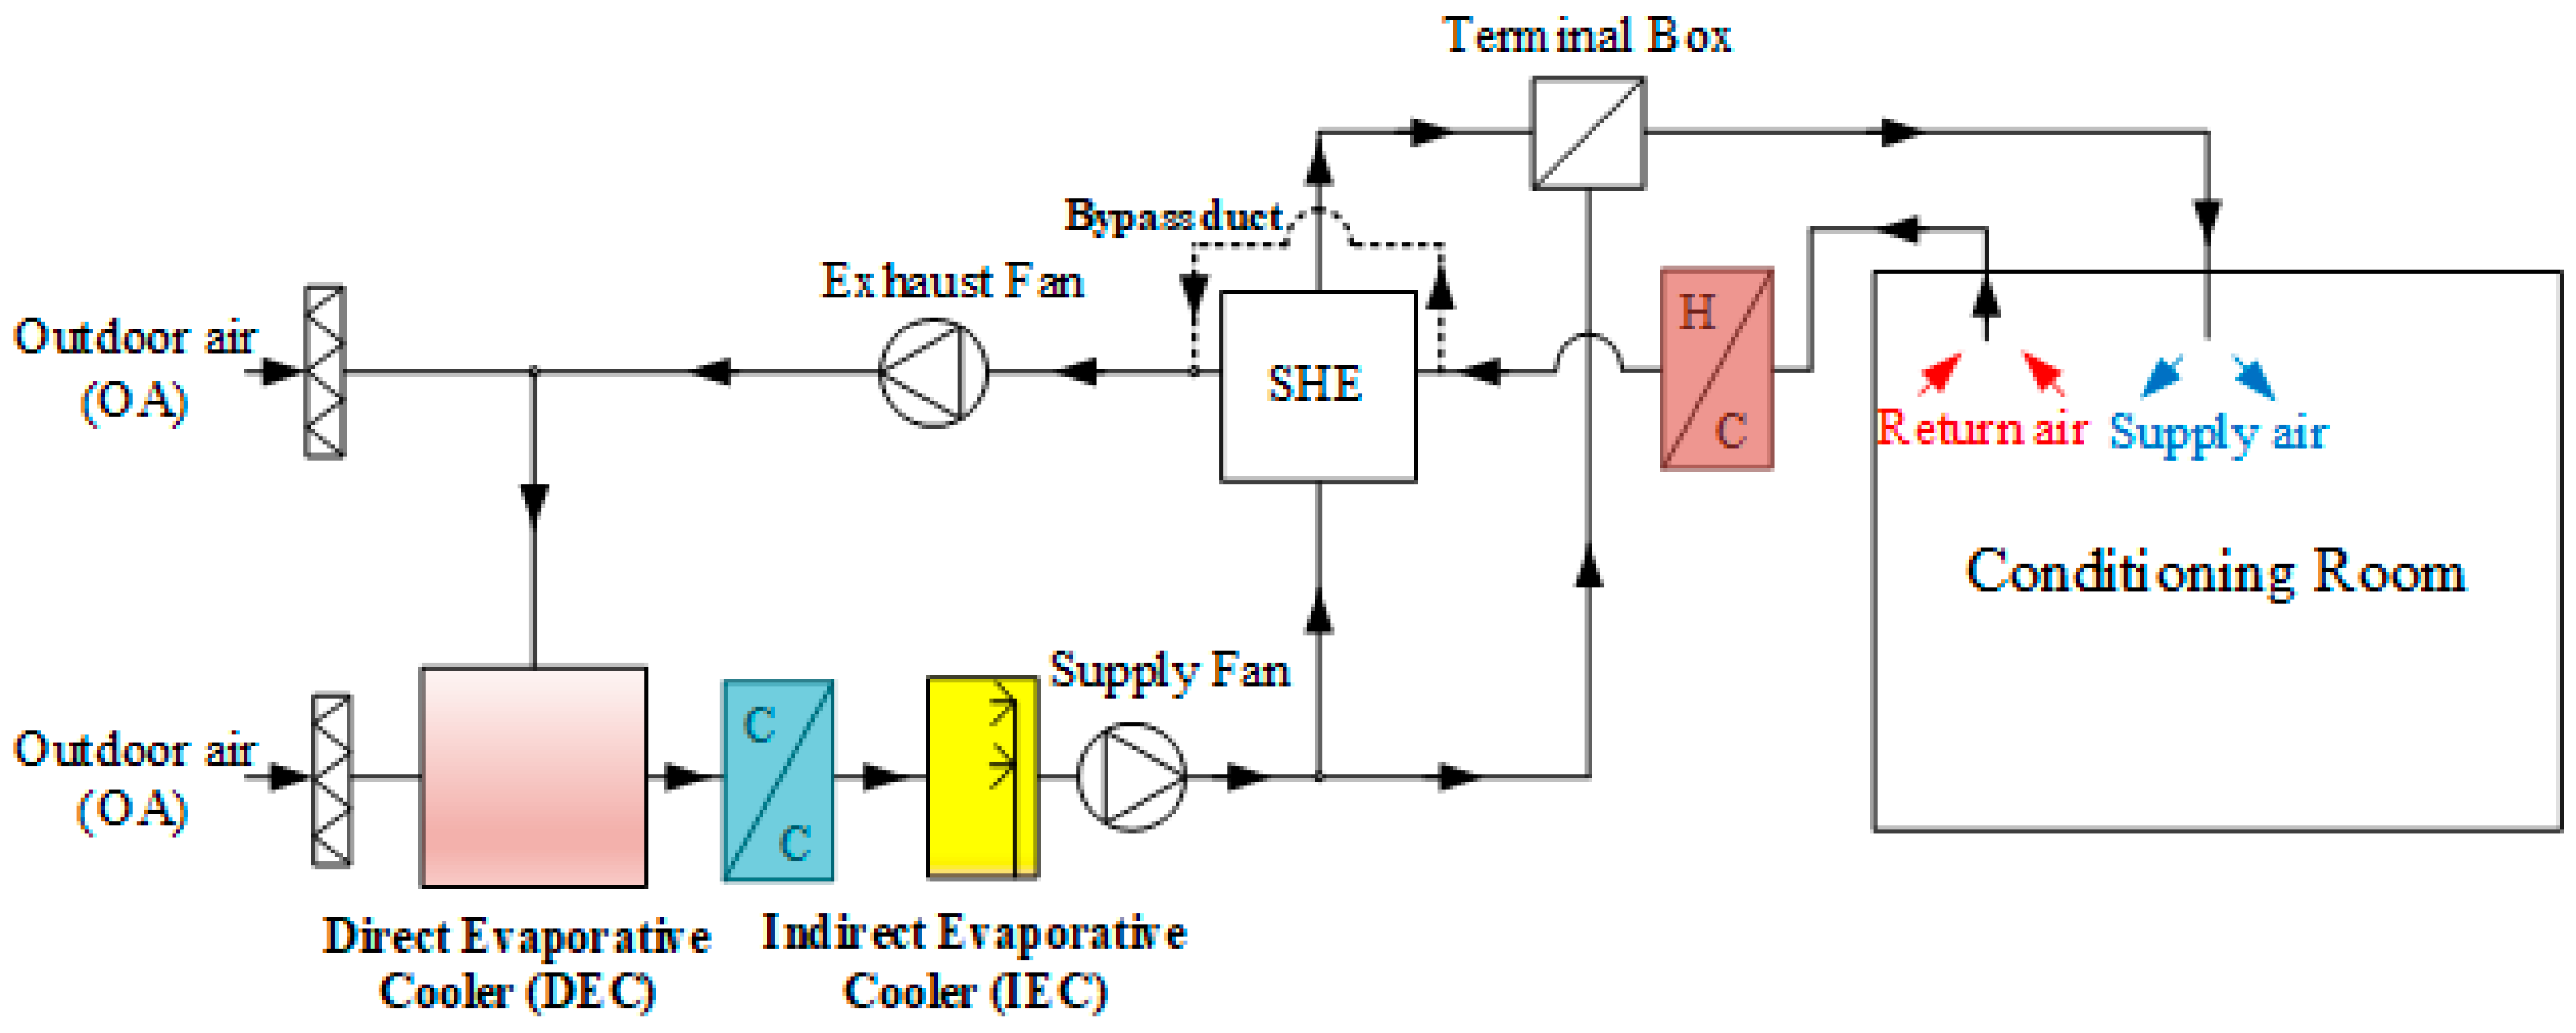
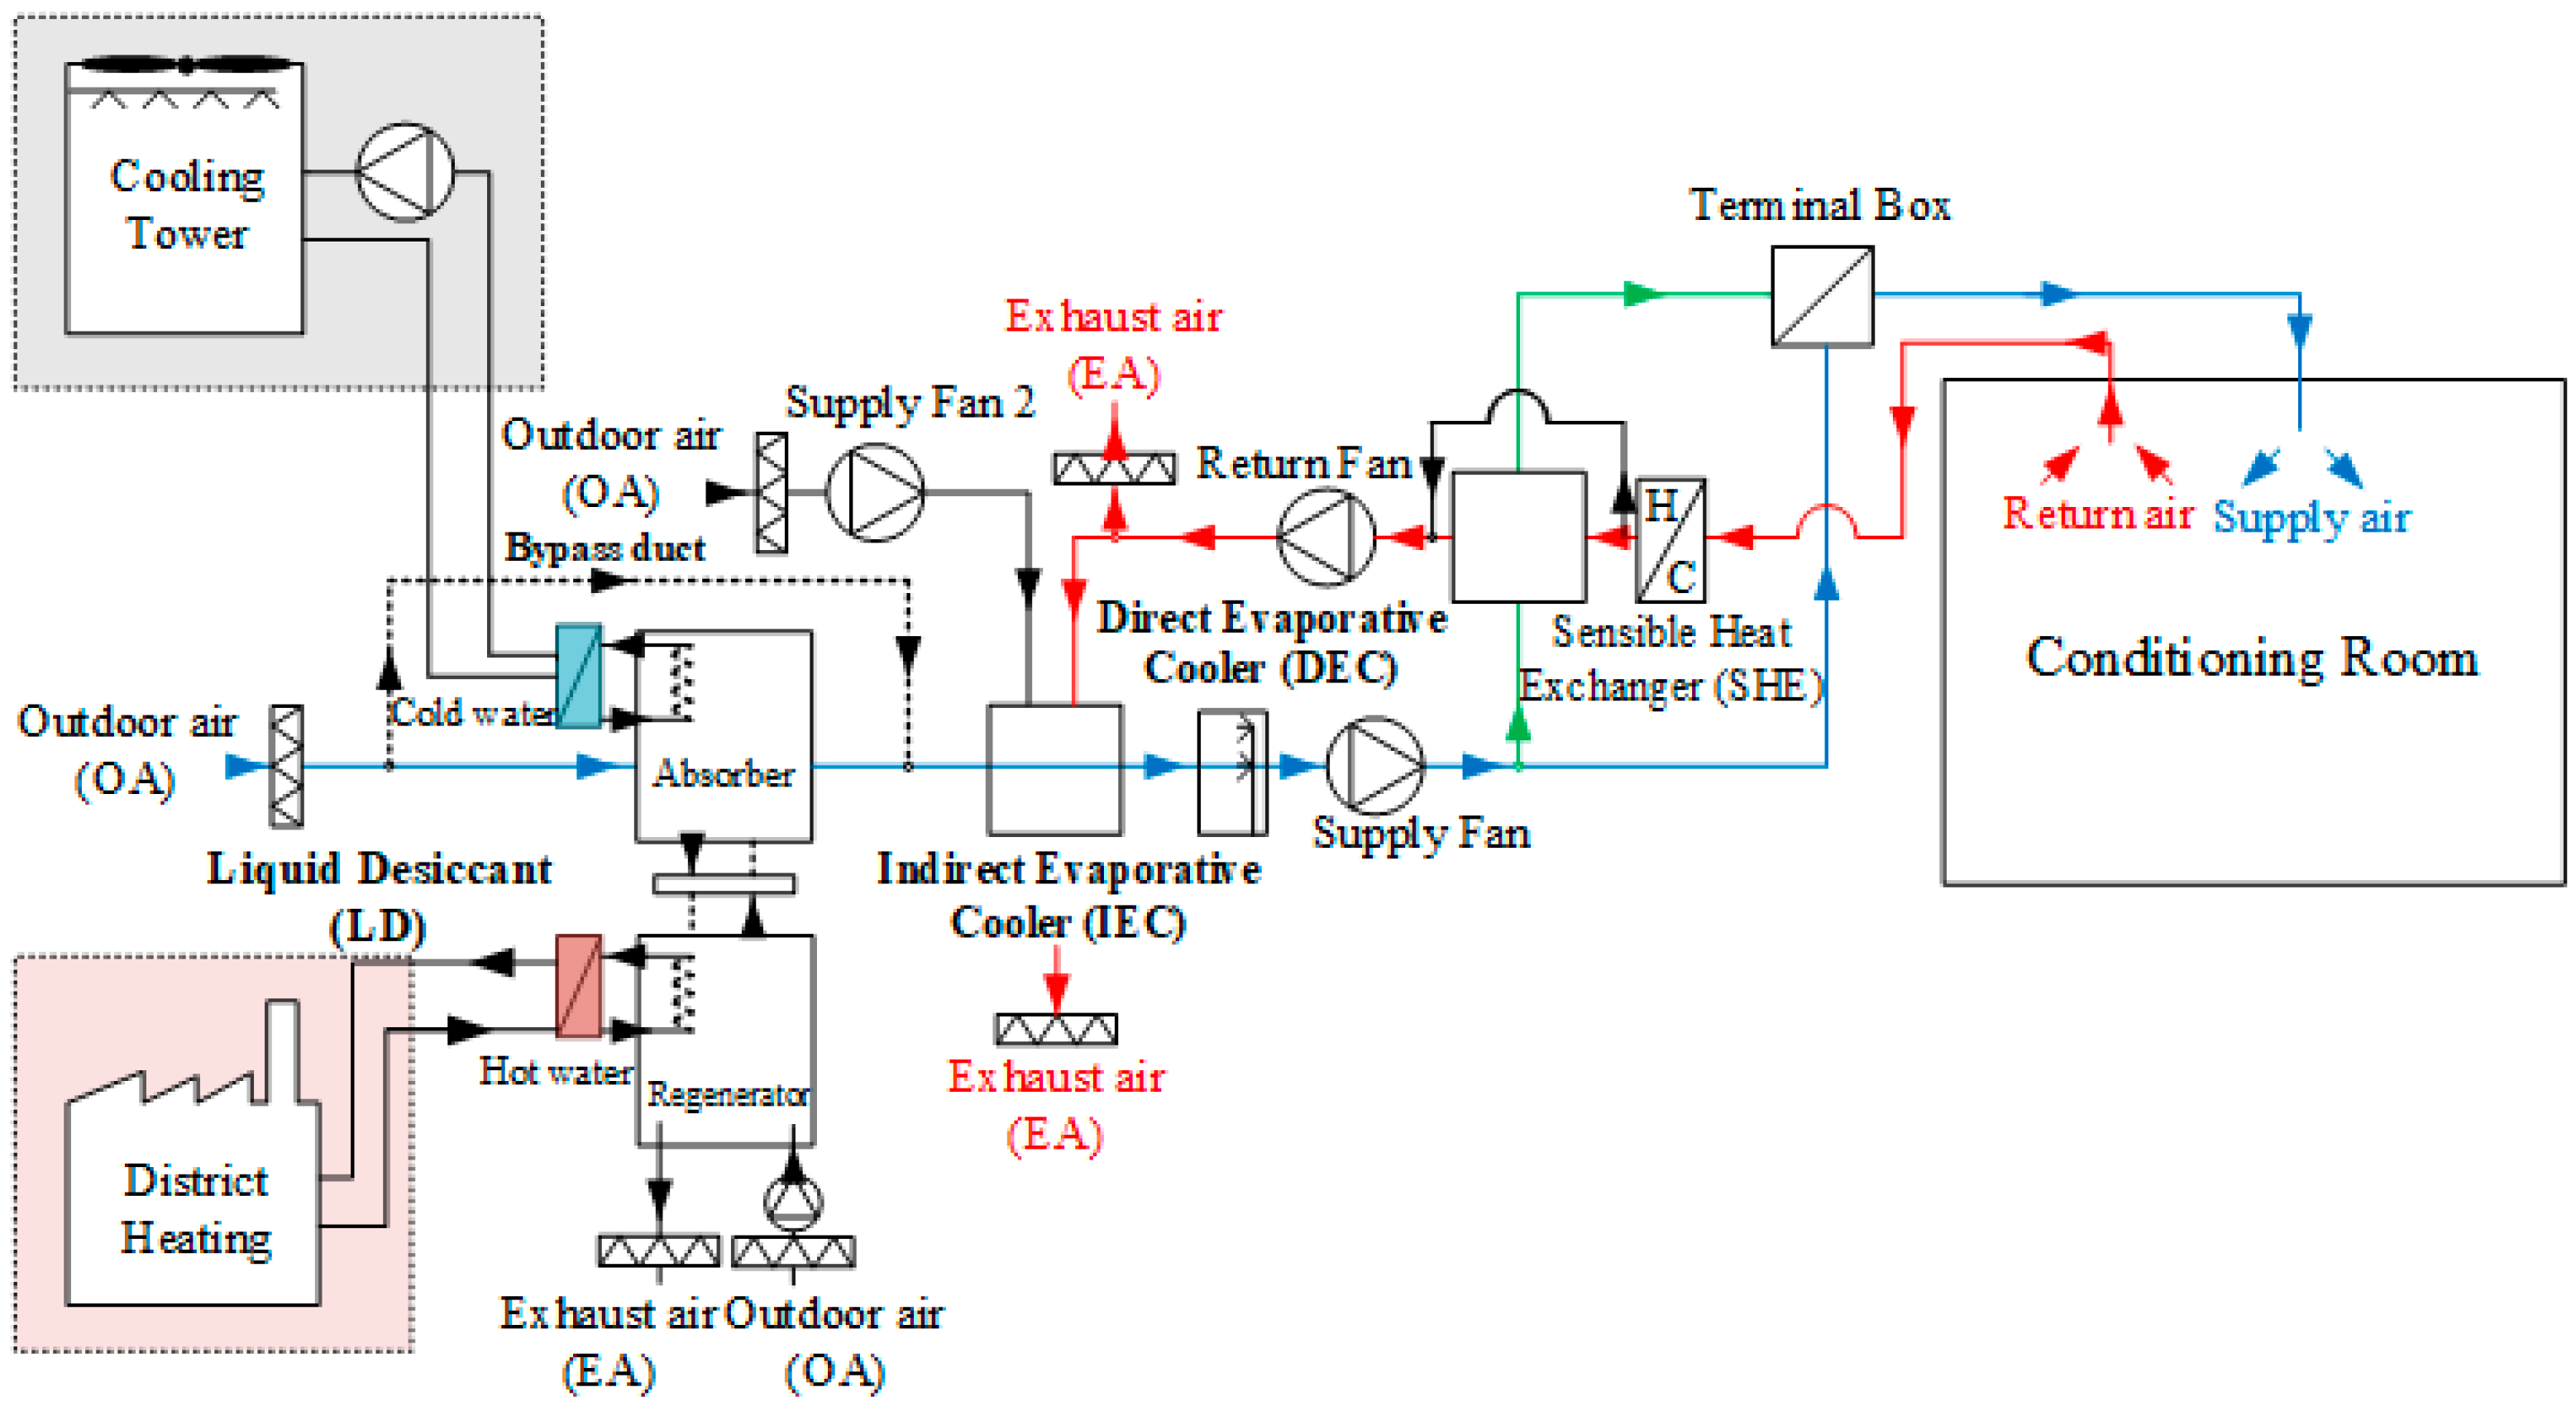
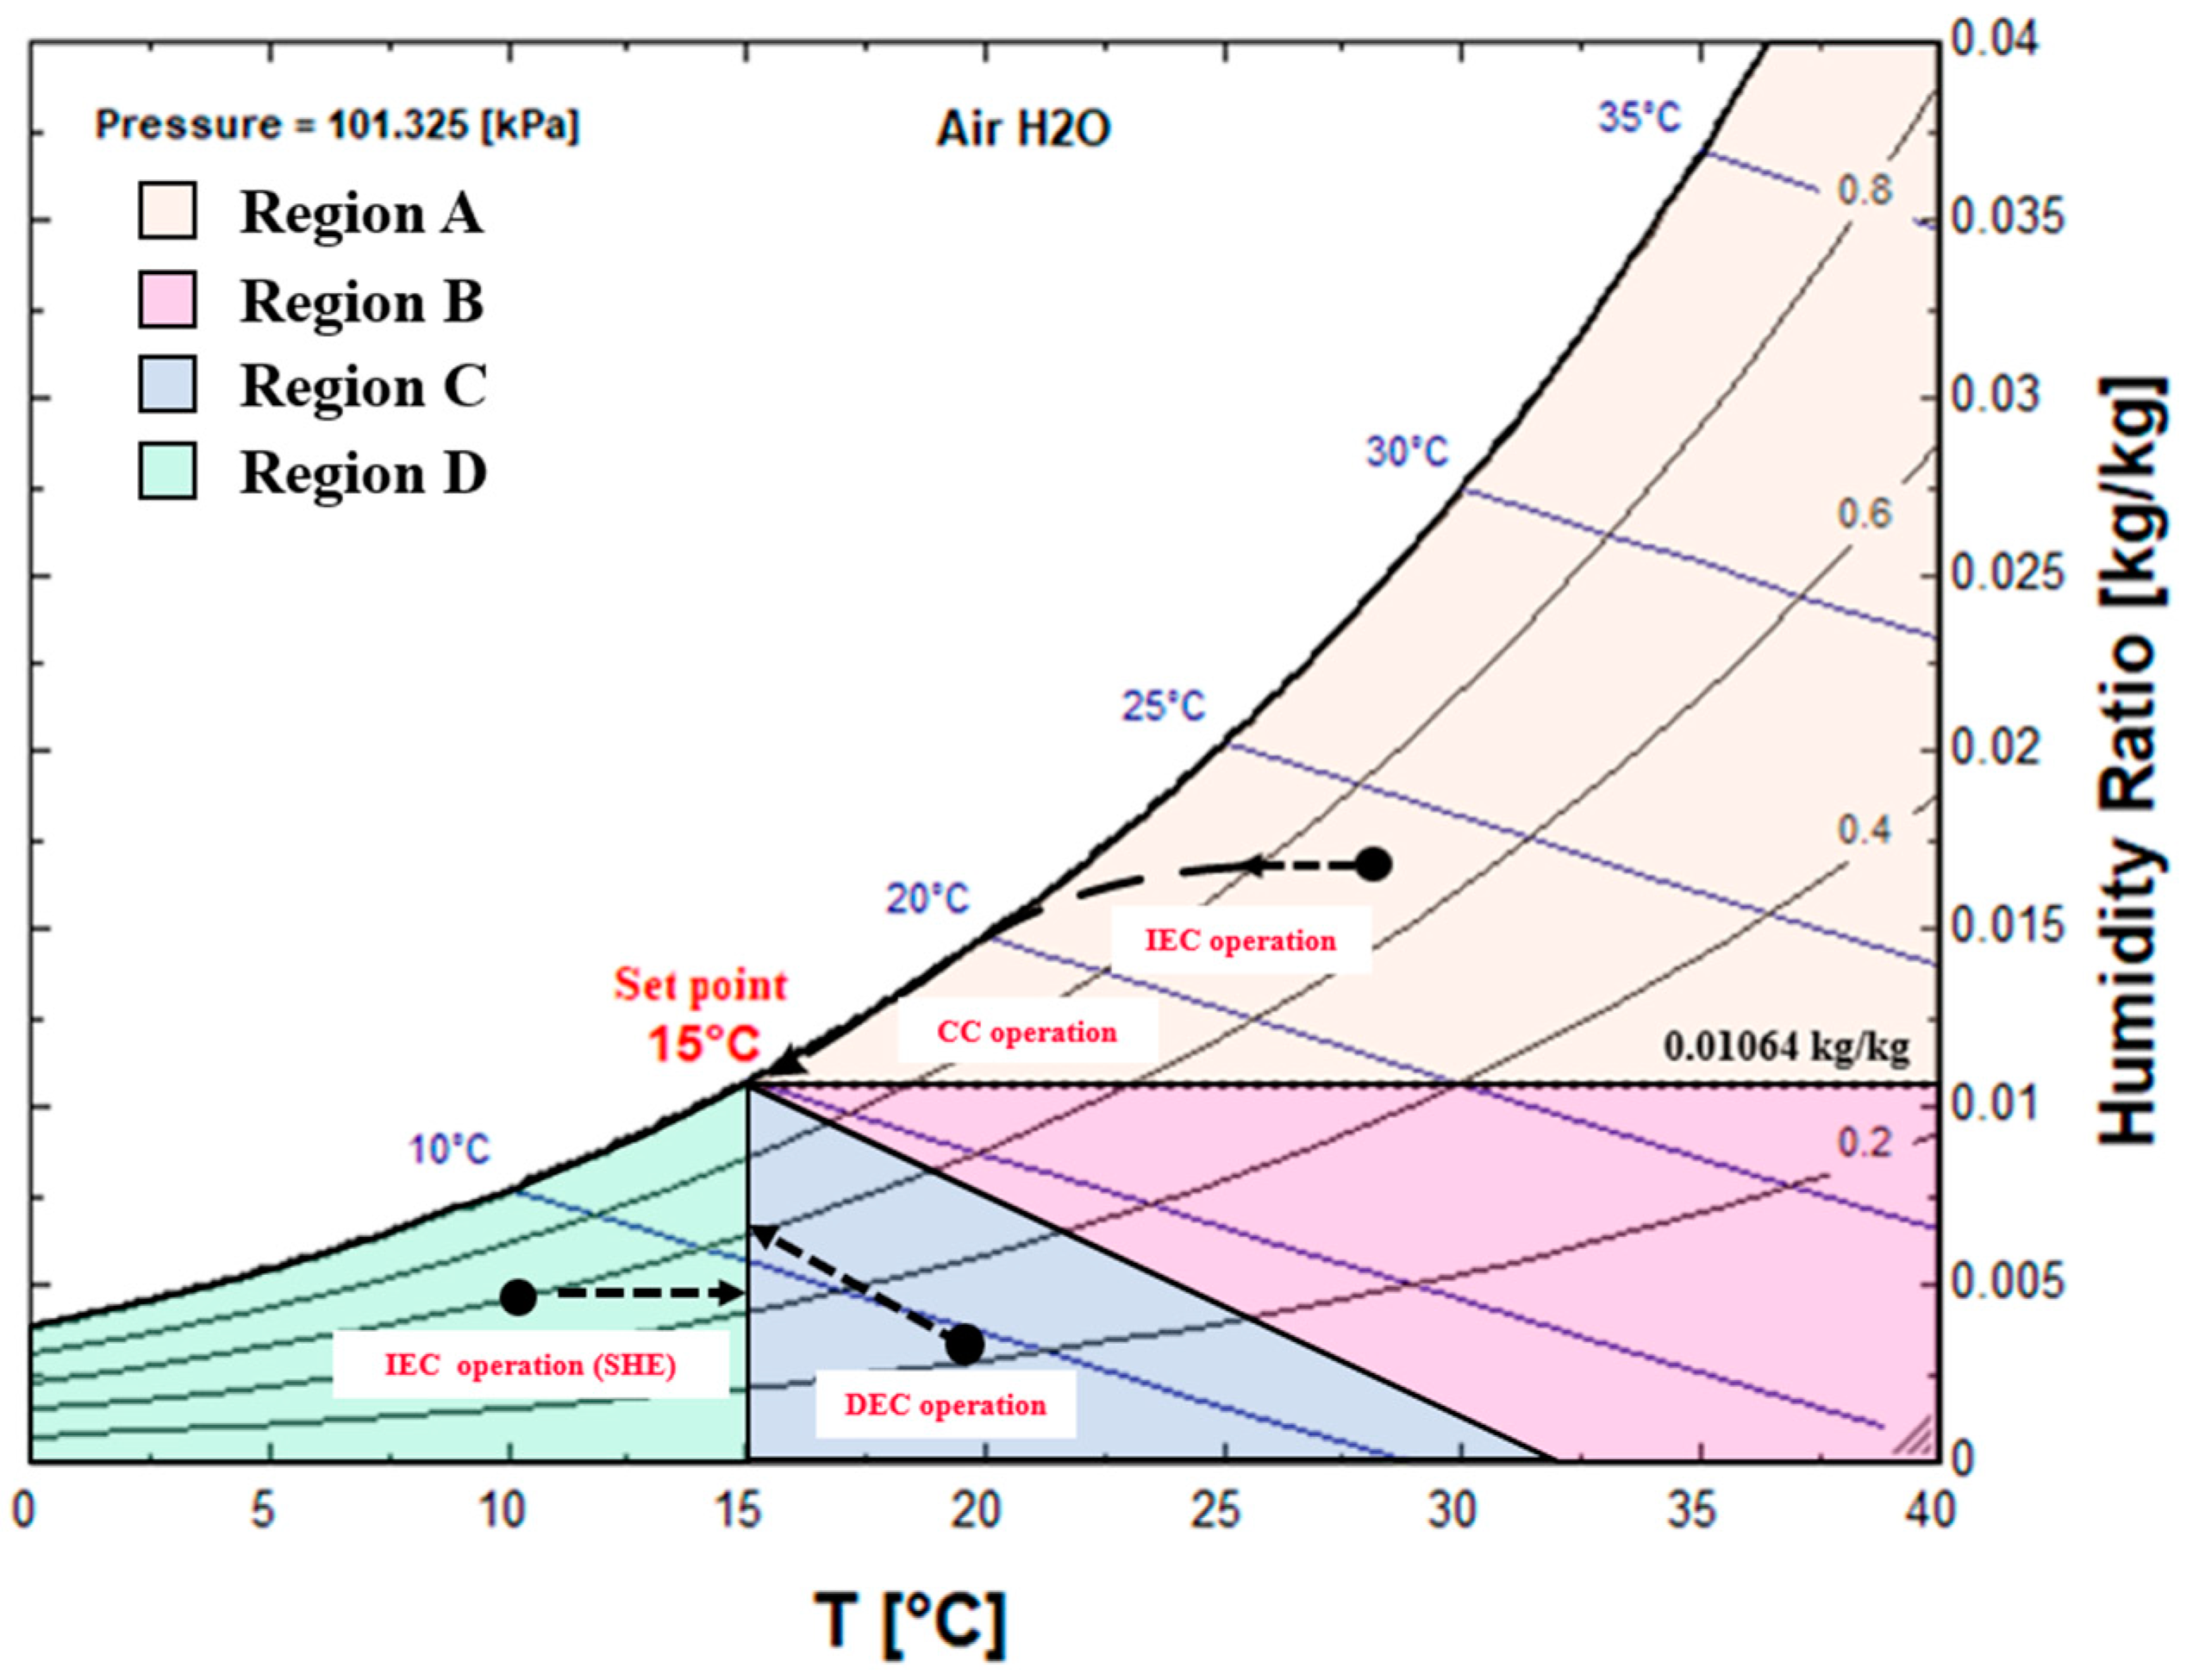
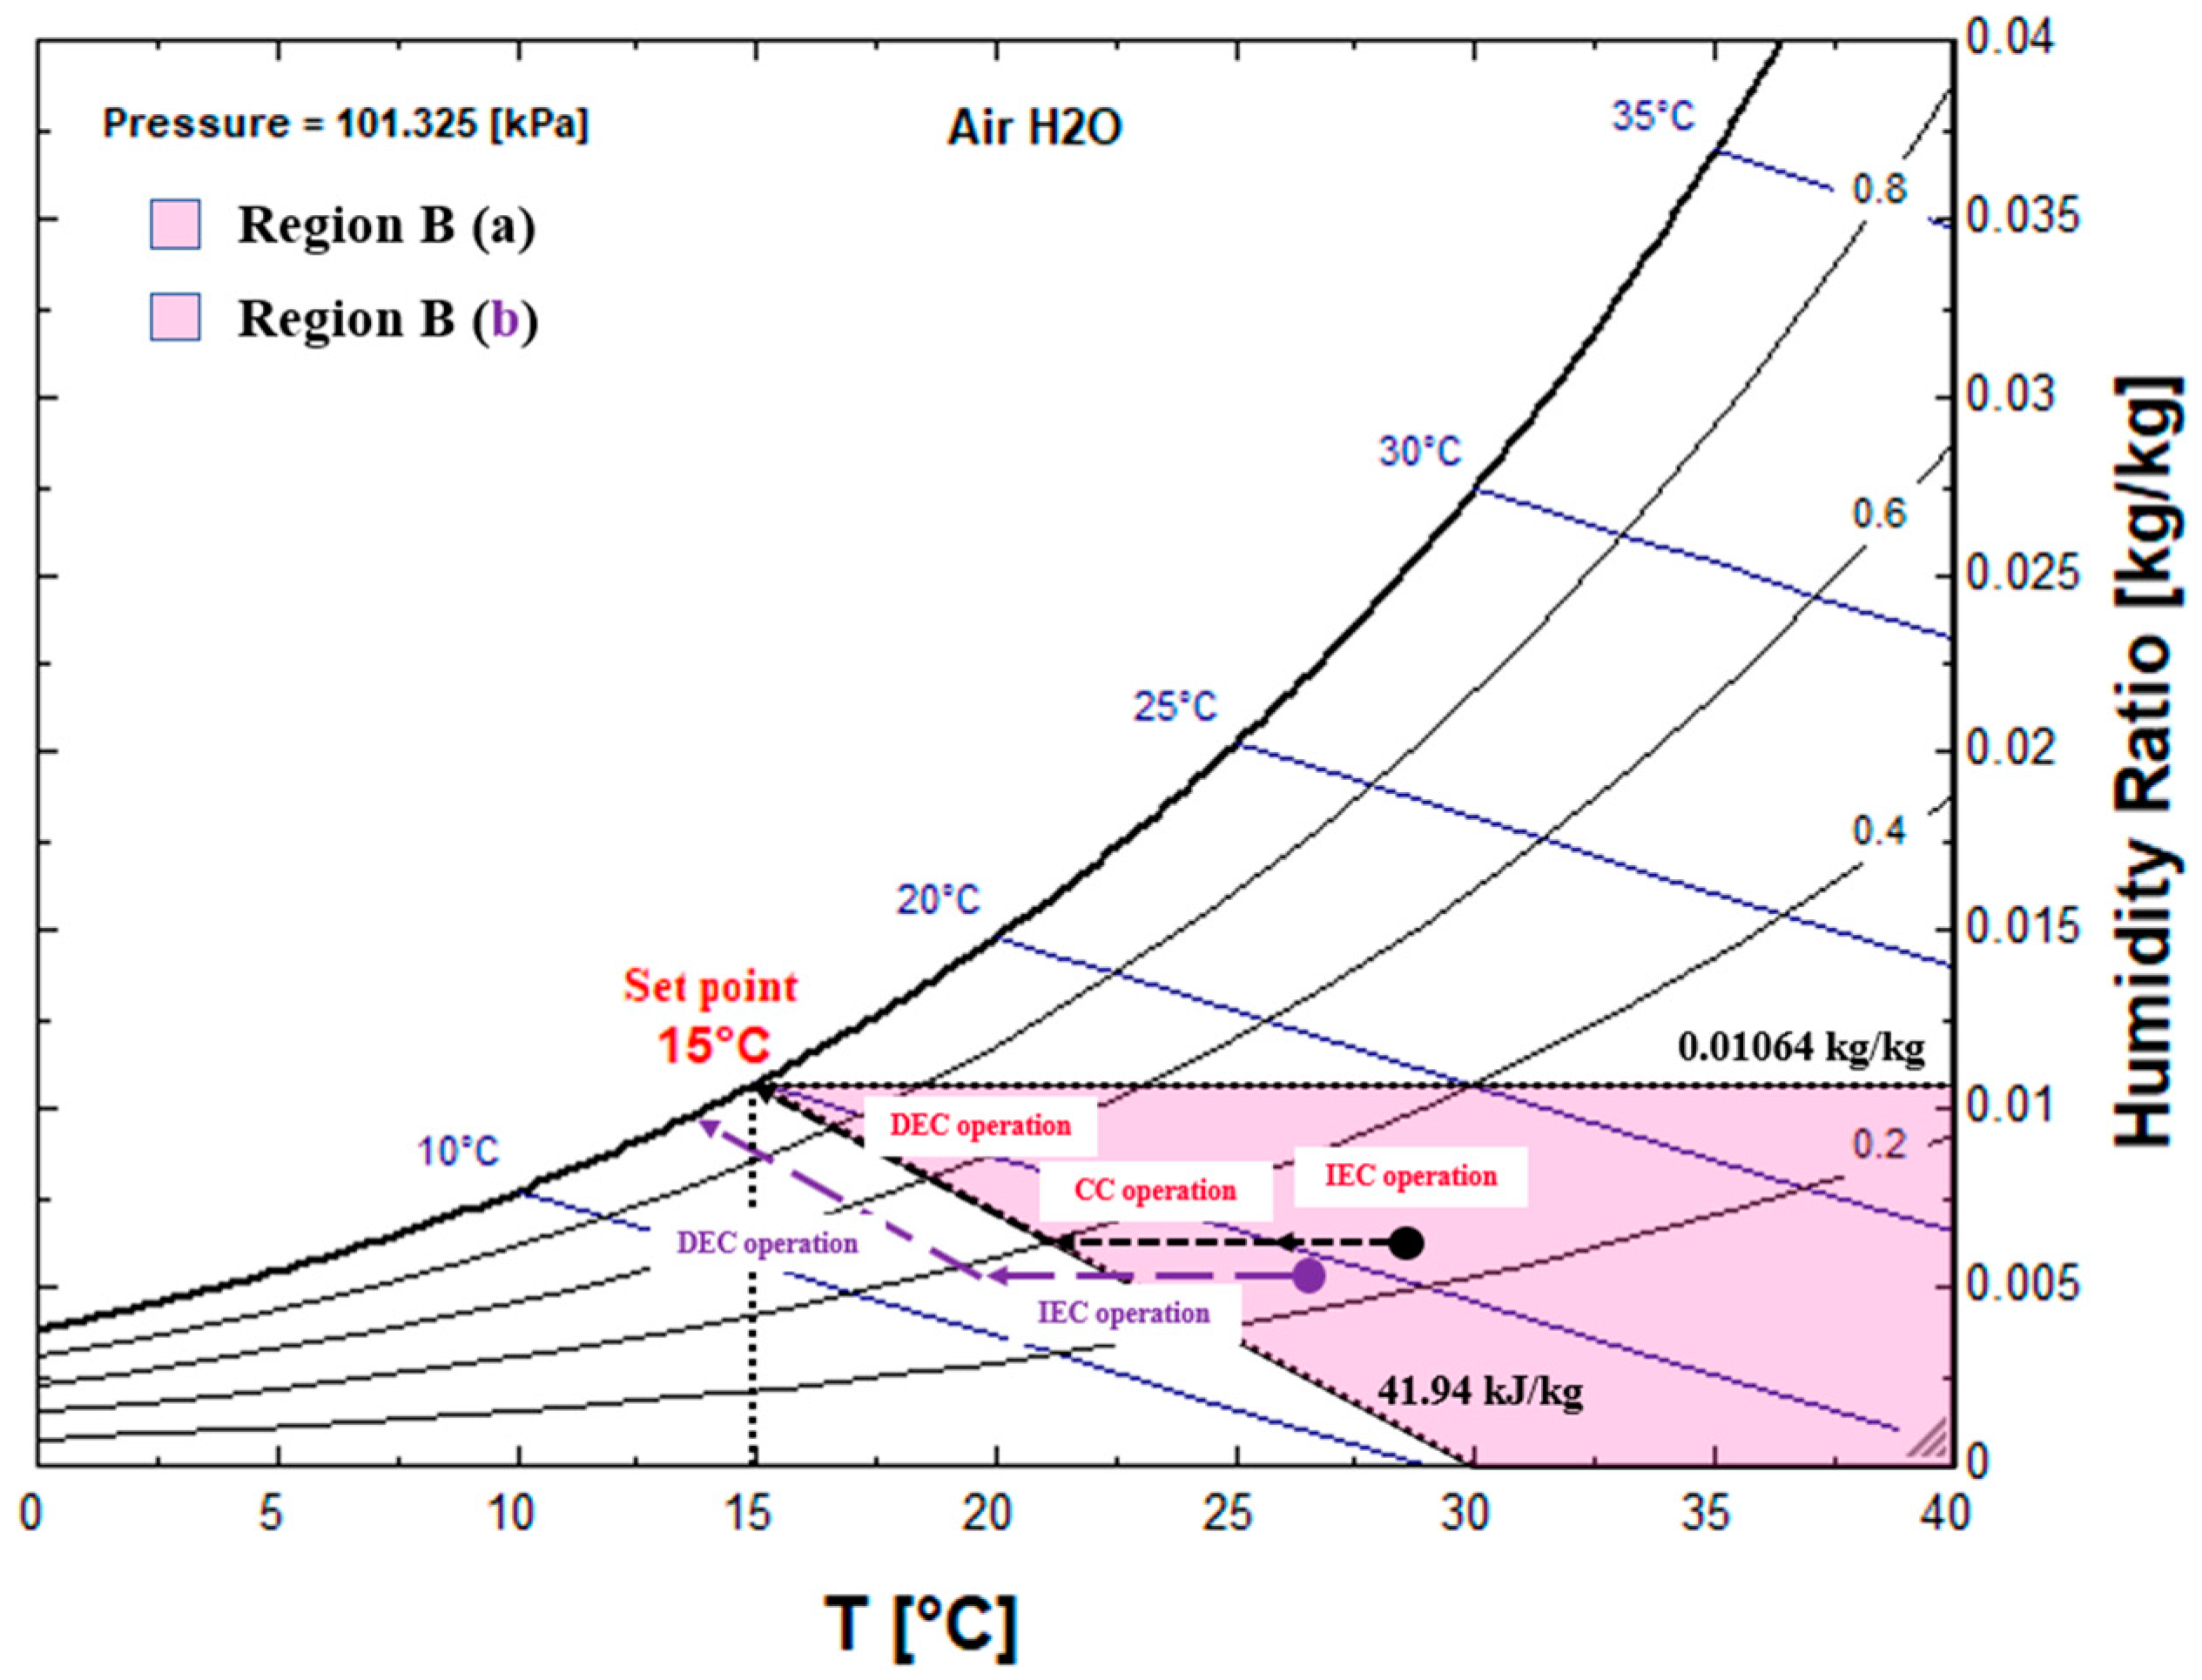
2.1. LD-IDECOAS
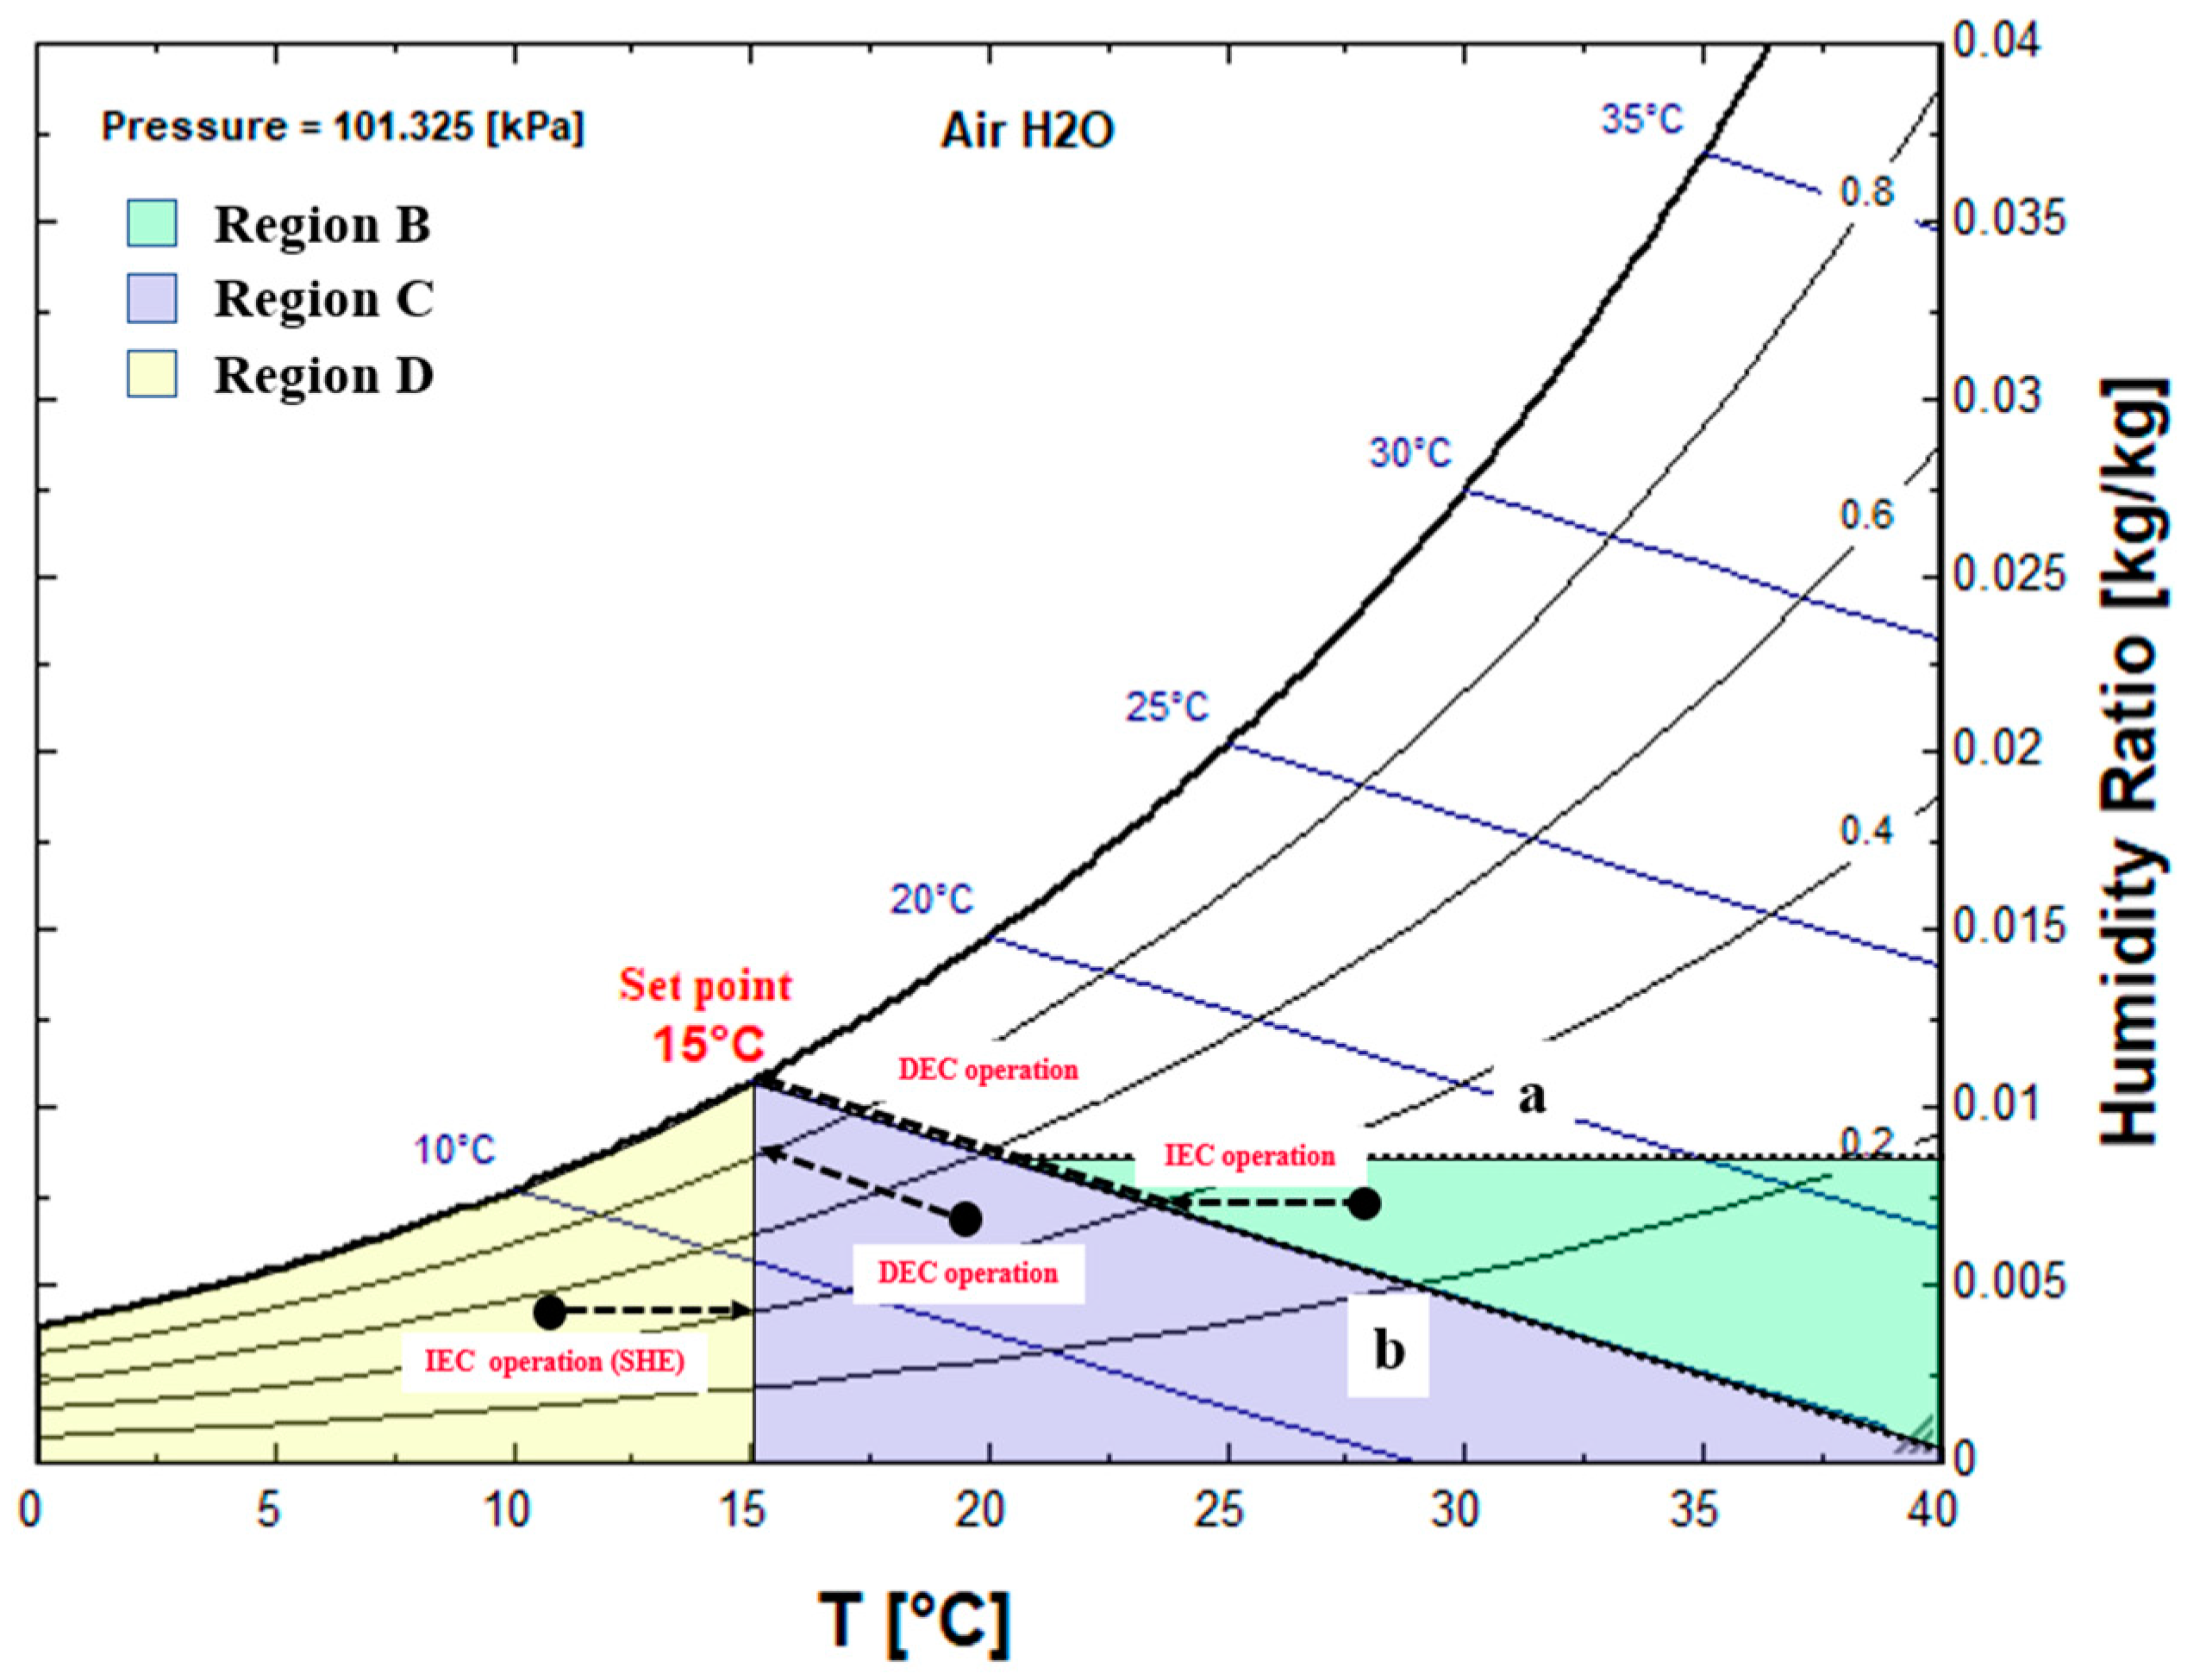
2.2. IDECOAS
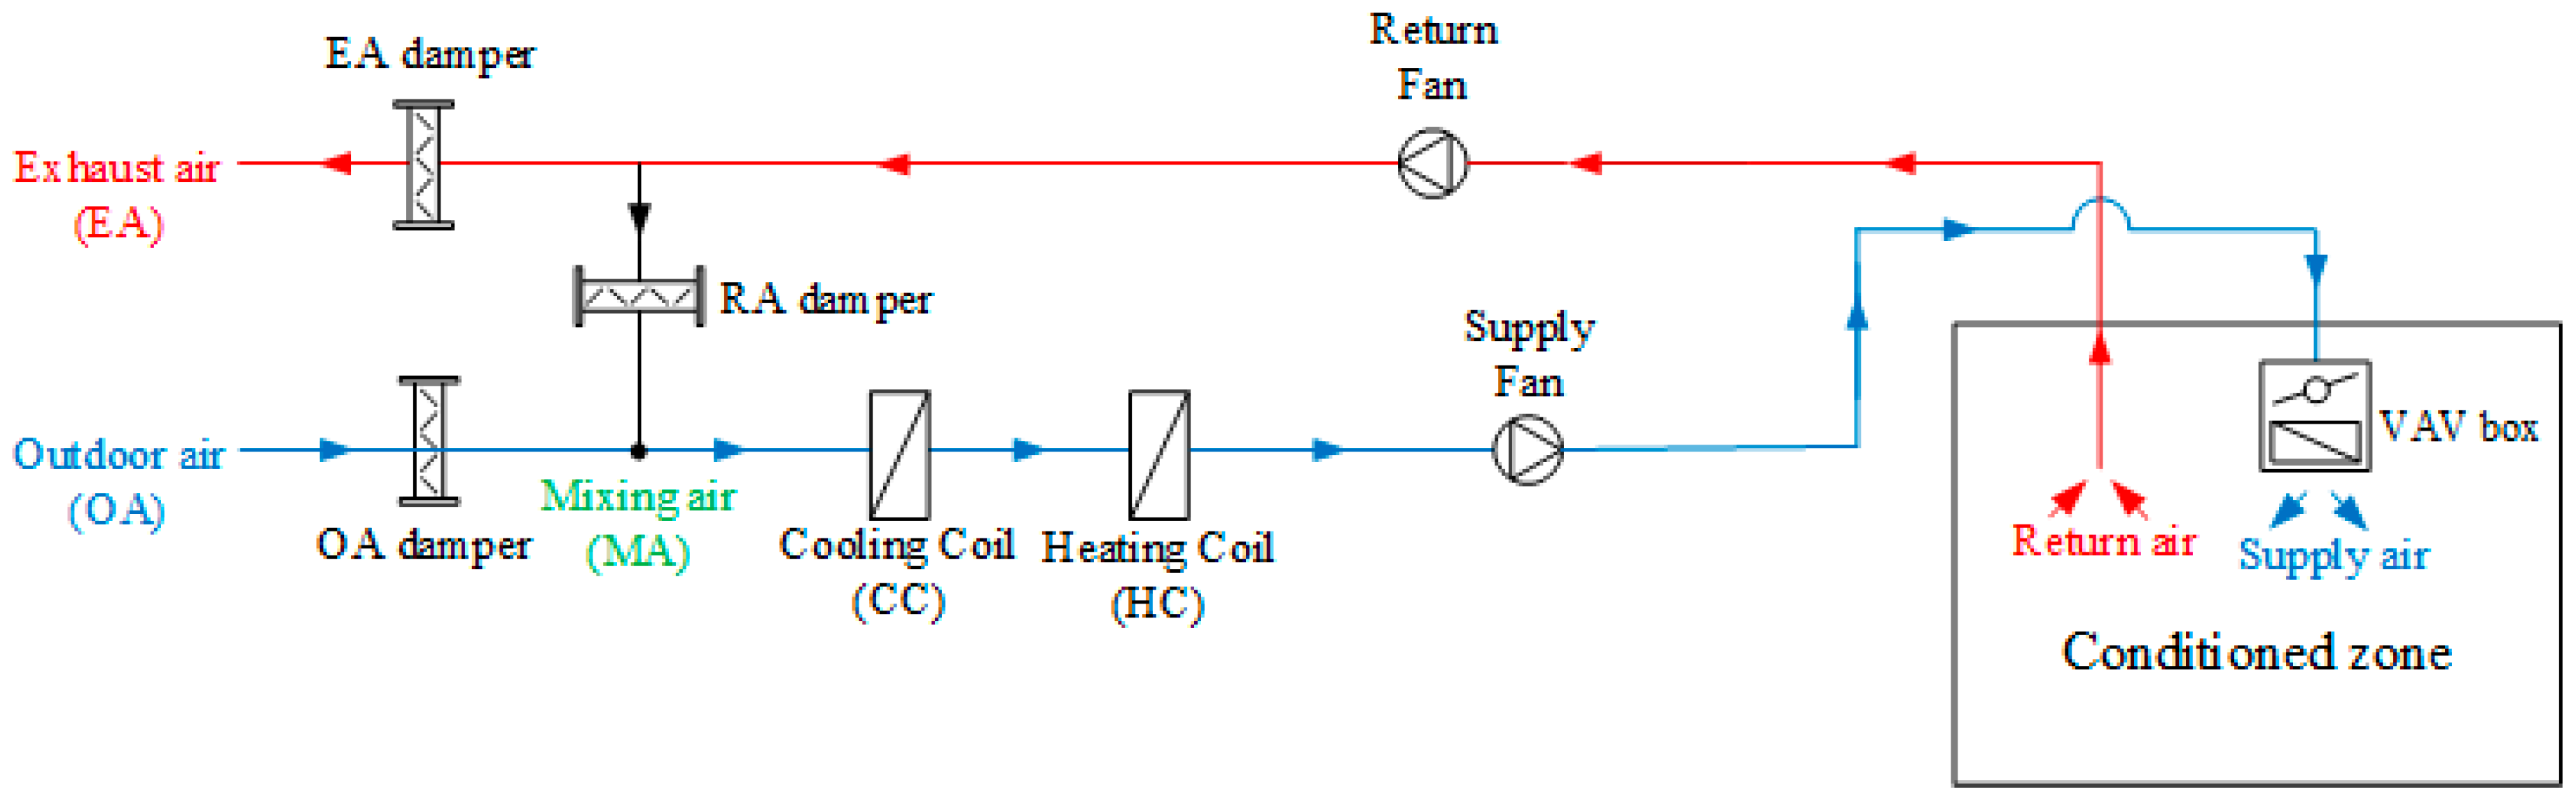
2.3. VAV System
3. Energy Simulation
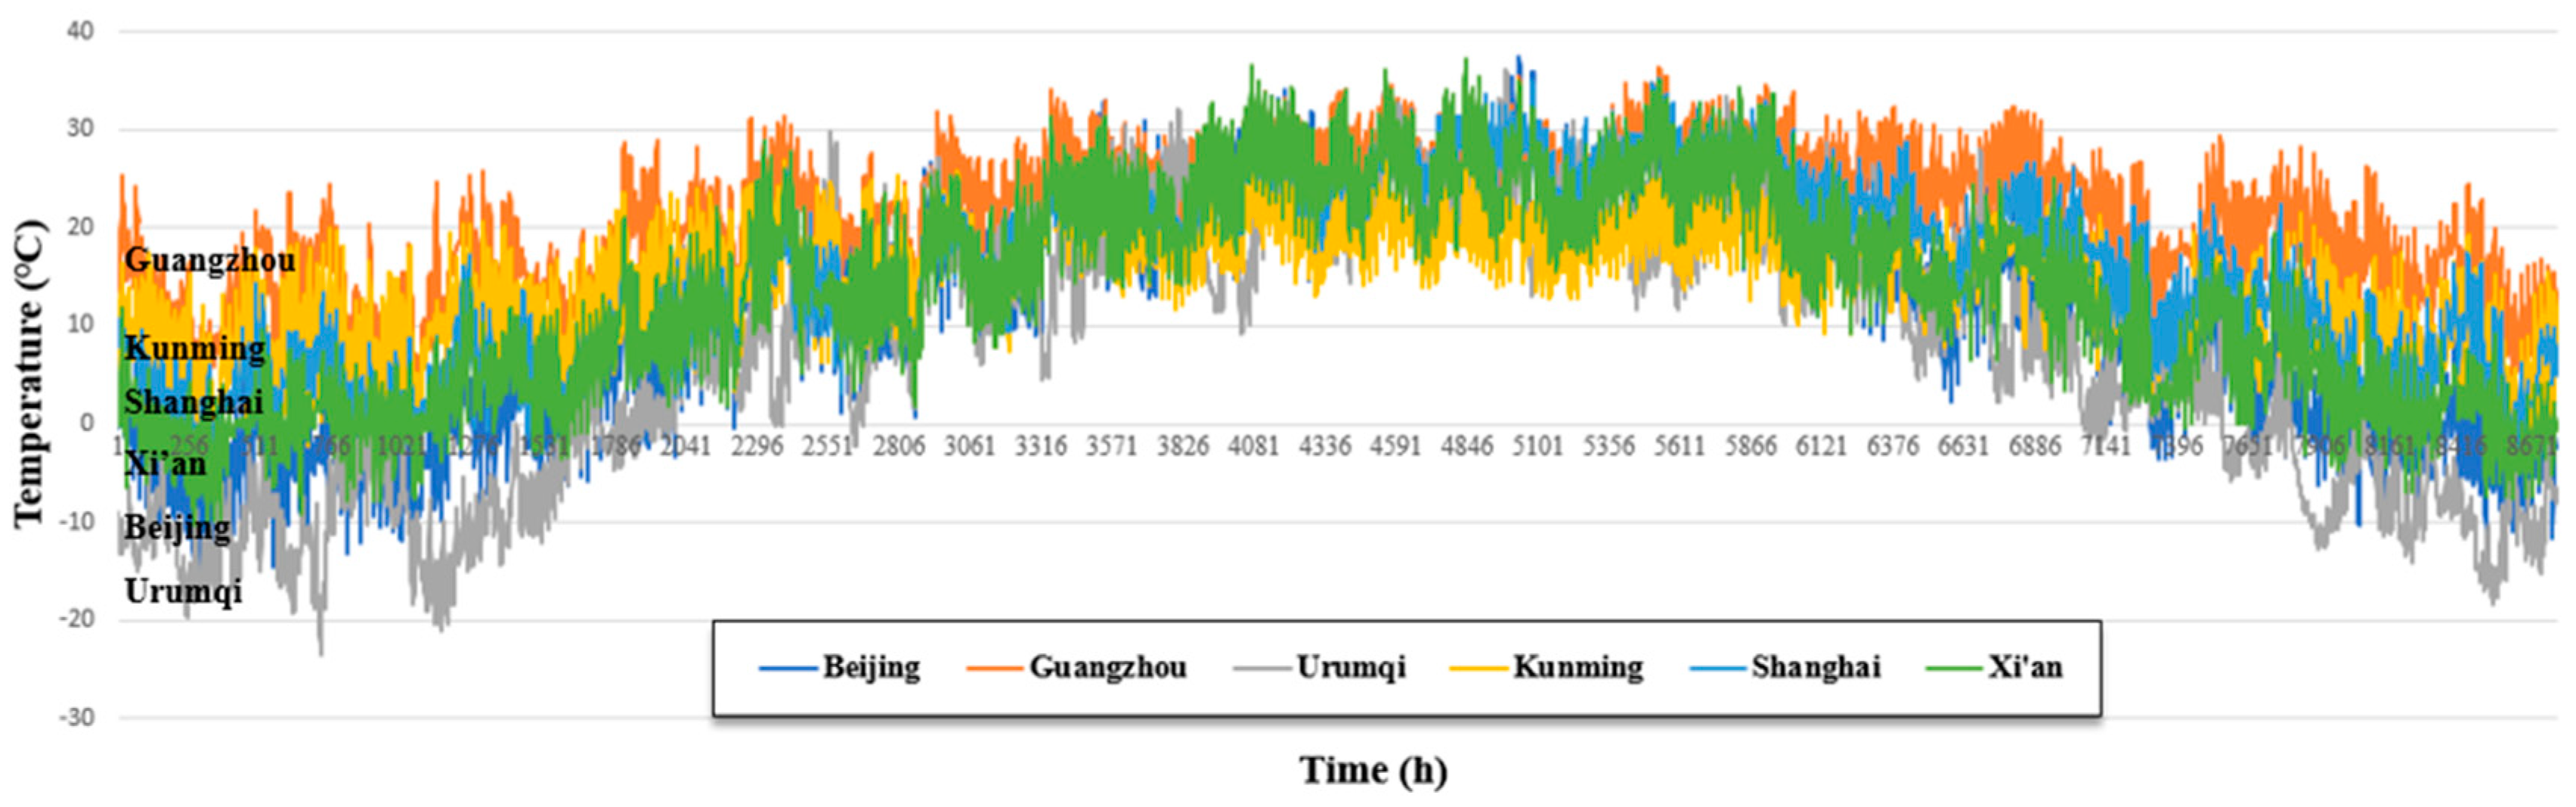
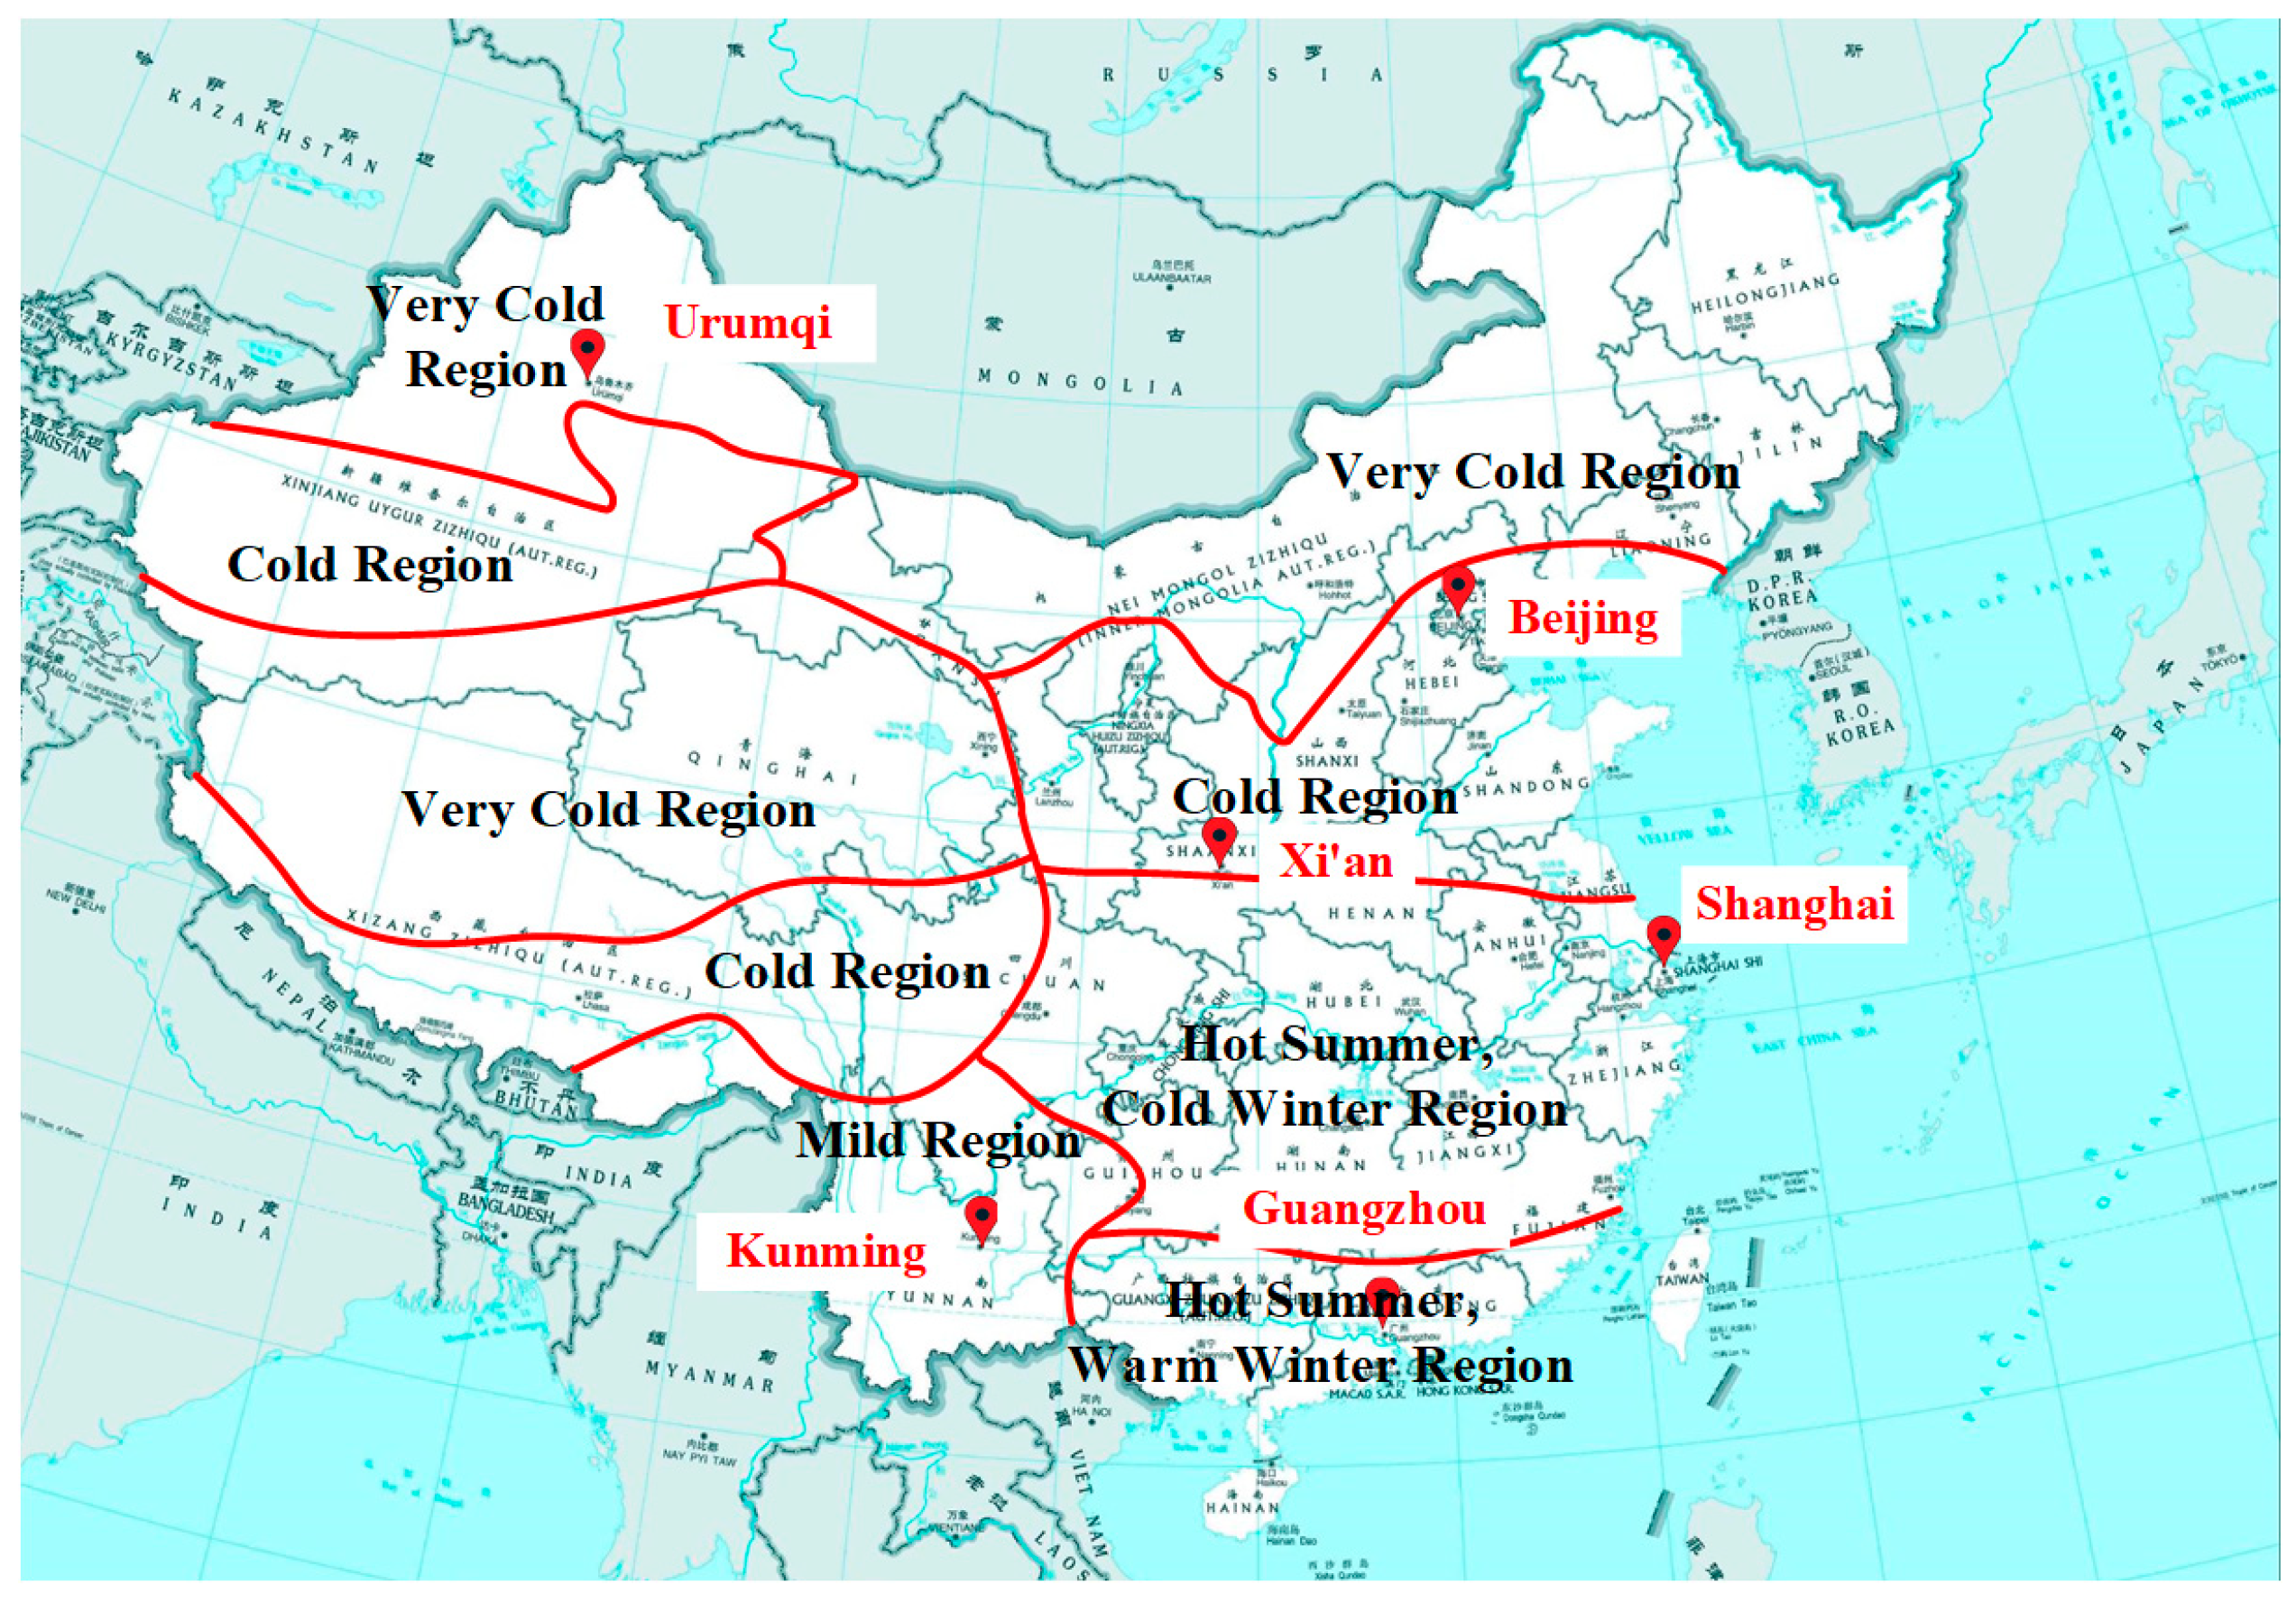
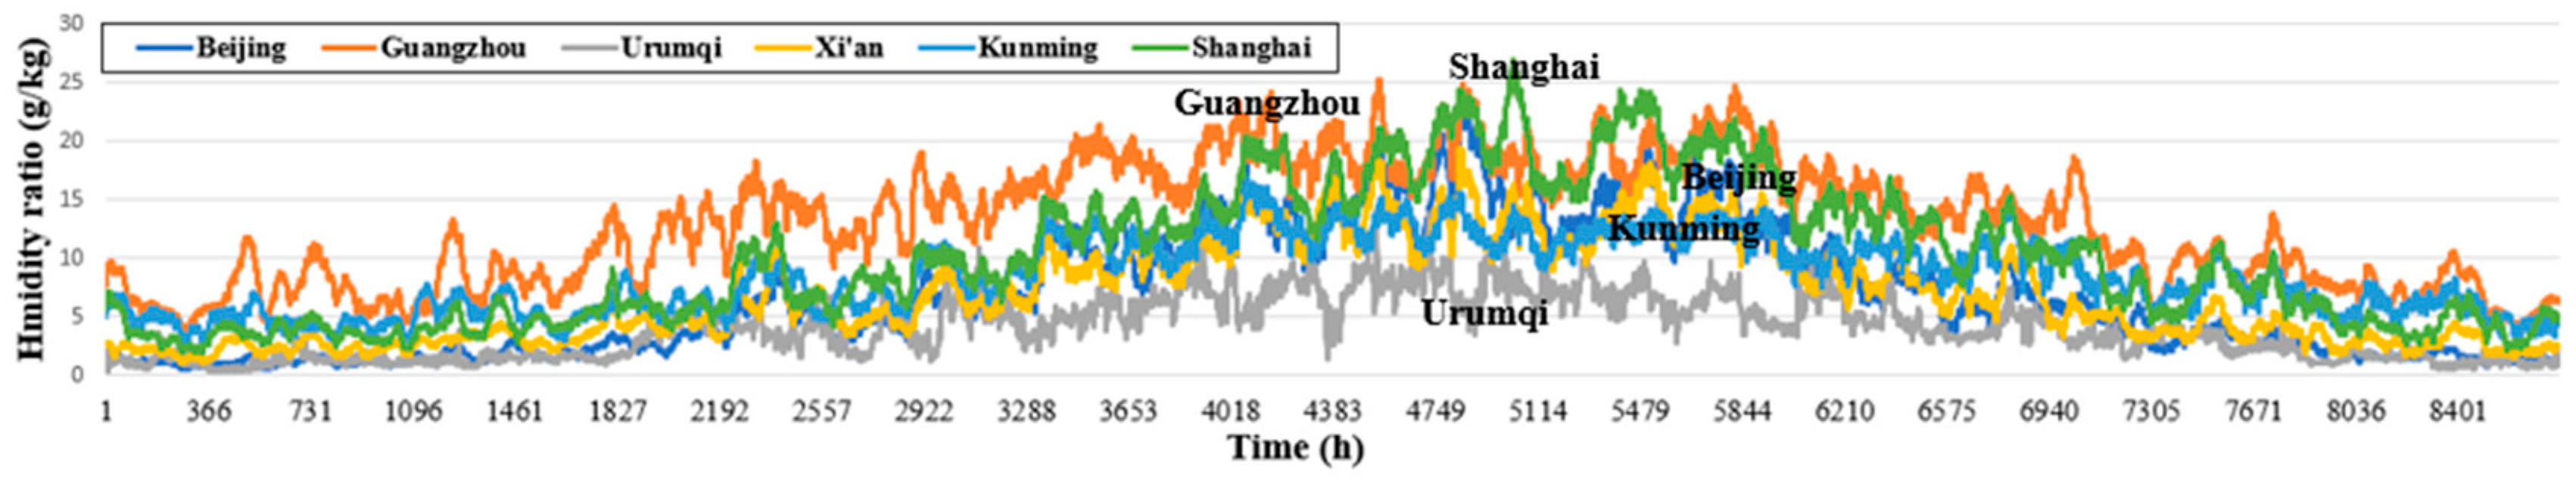
3.1. Selection of the Region to be Simulated
3.2. Model Building Information
3.3. Simulation Overview
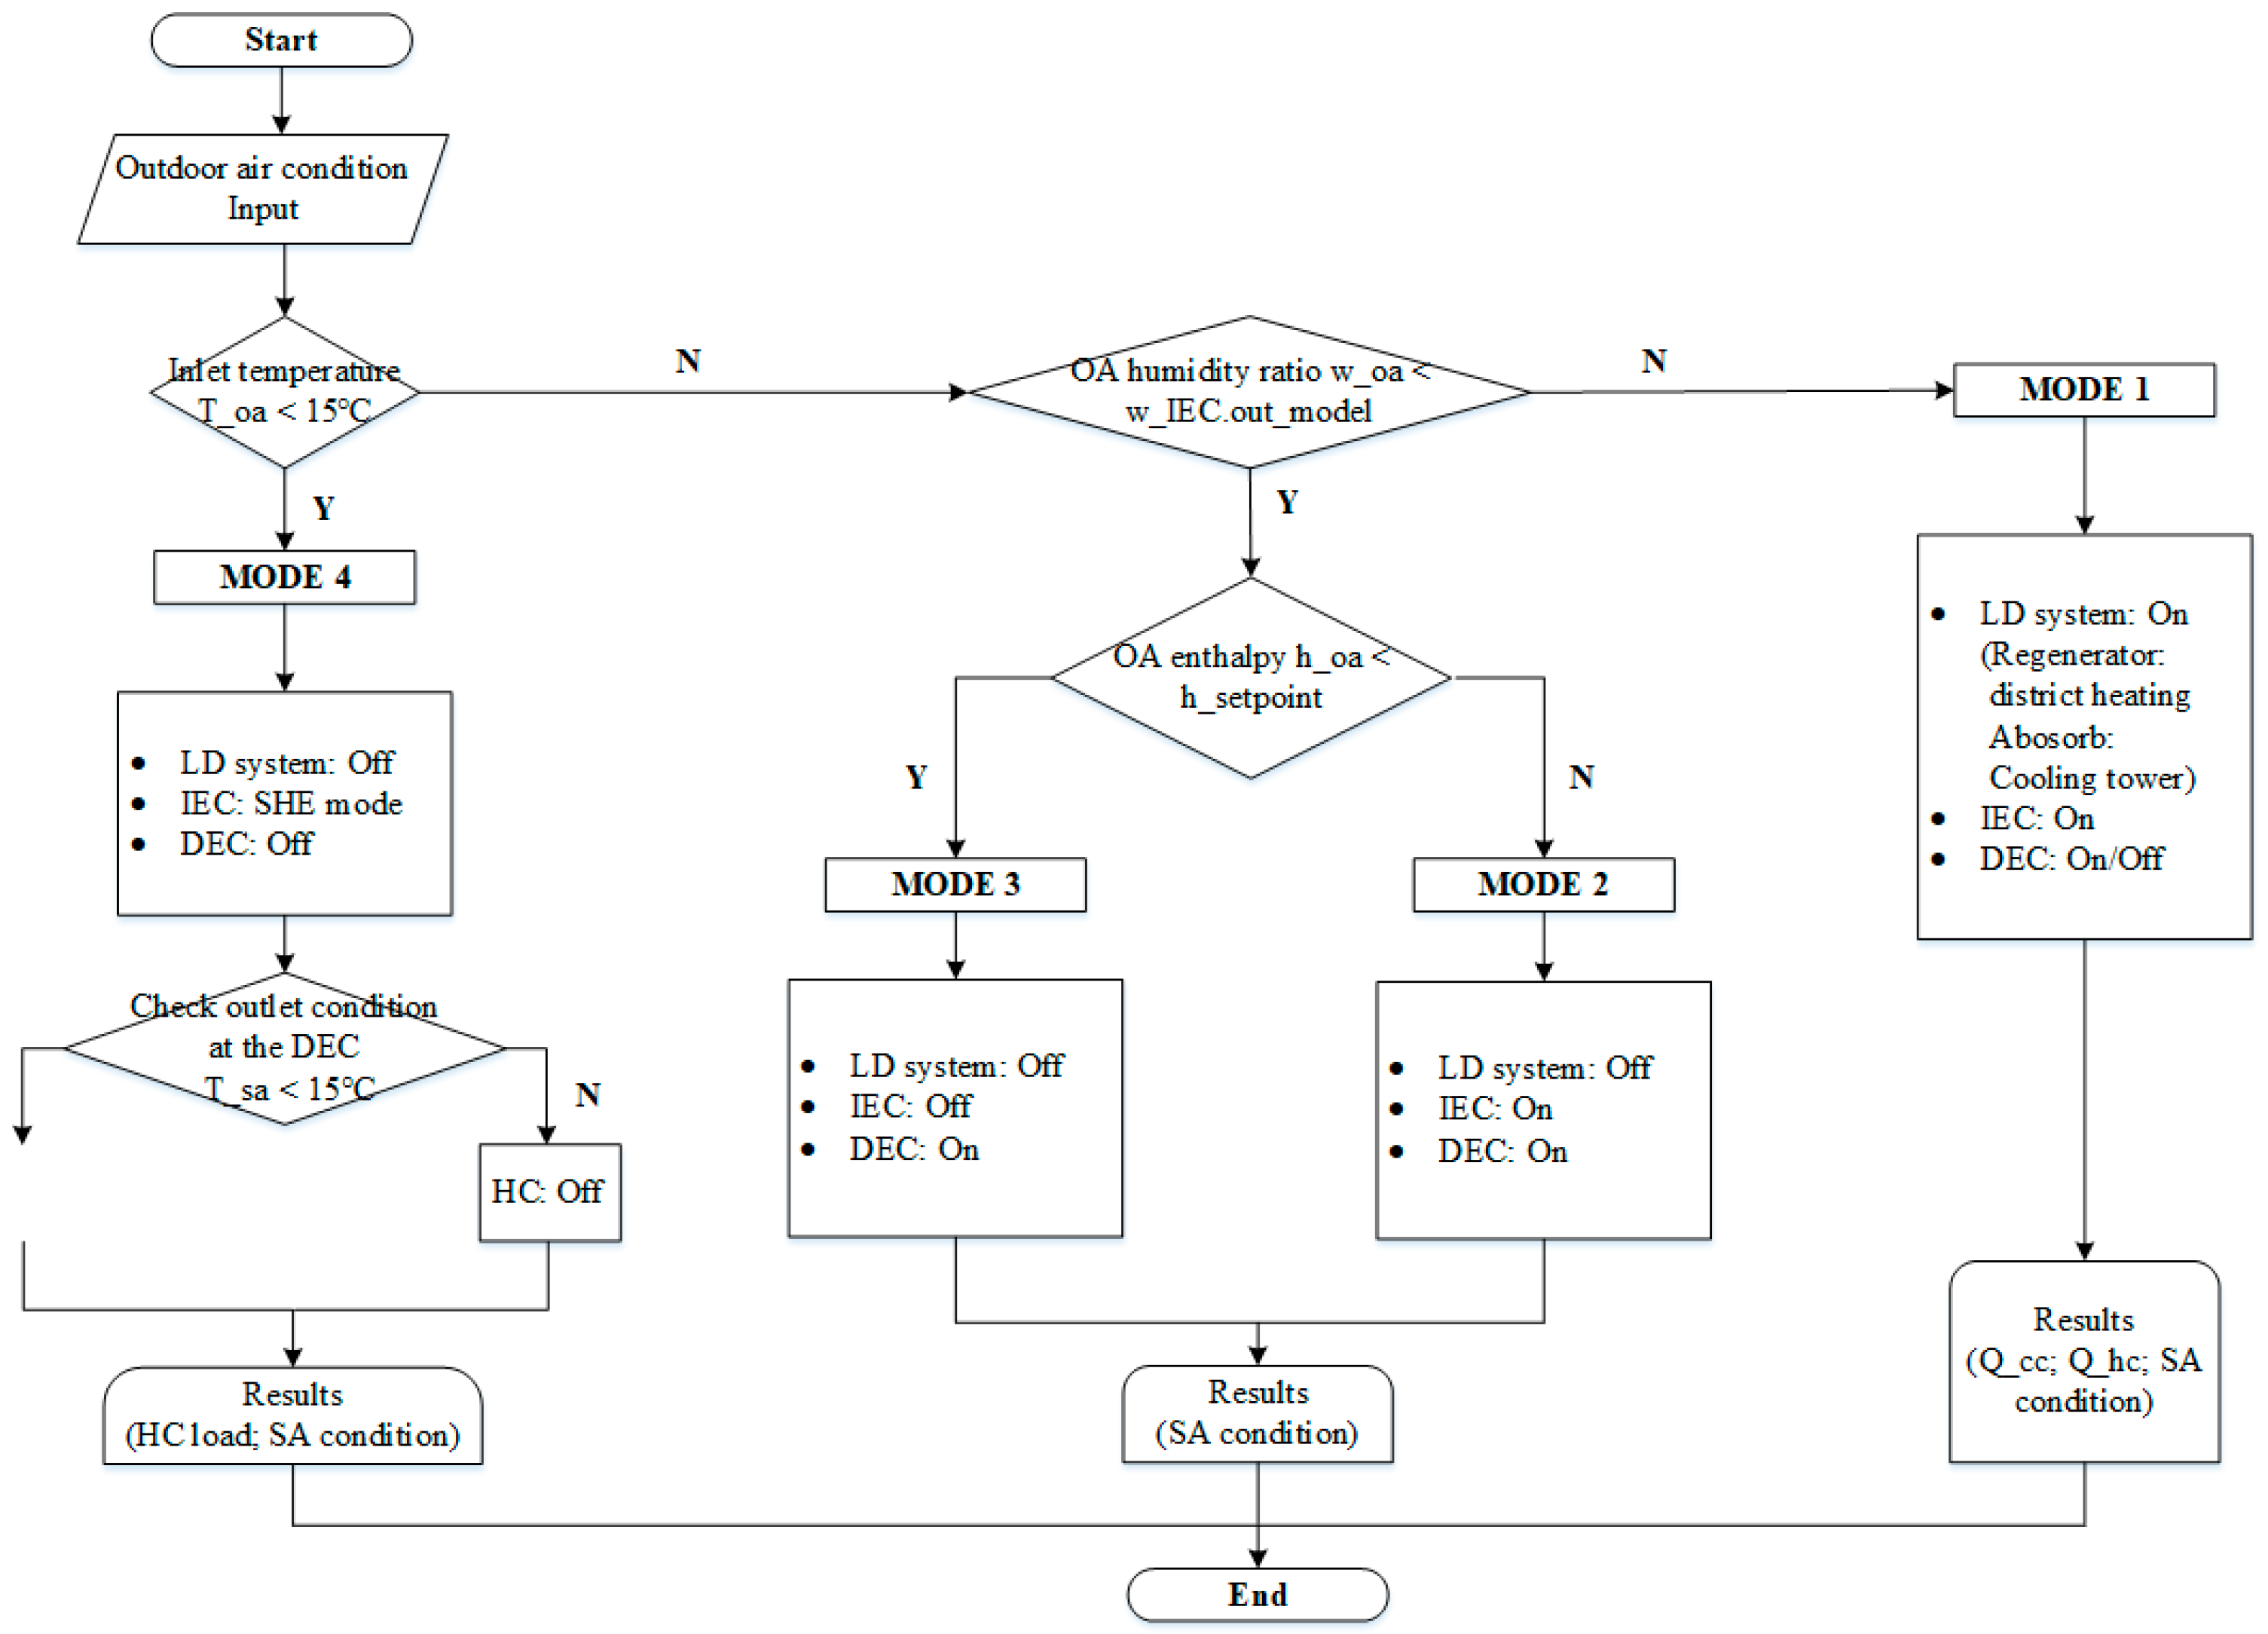
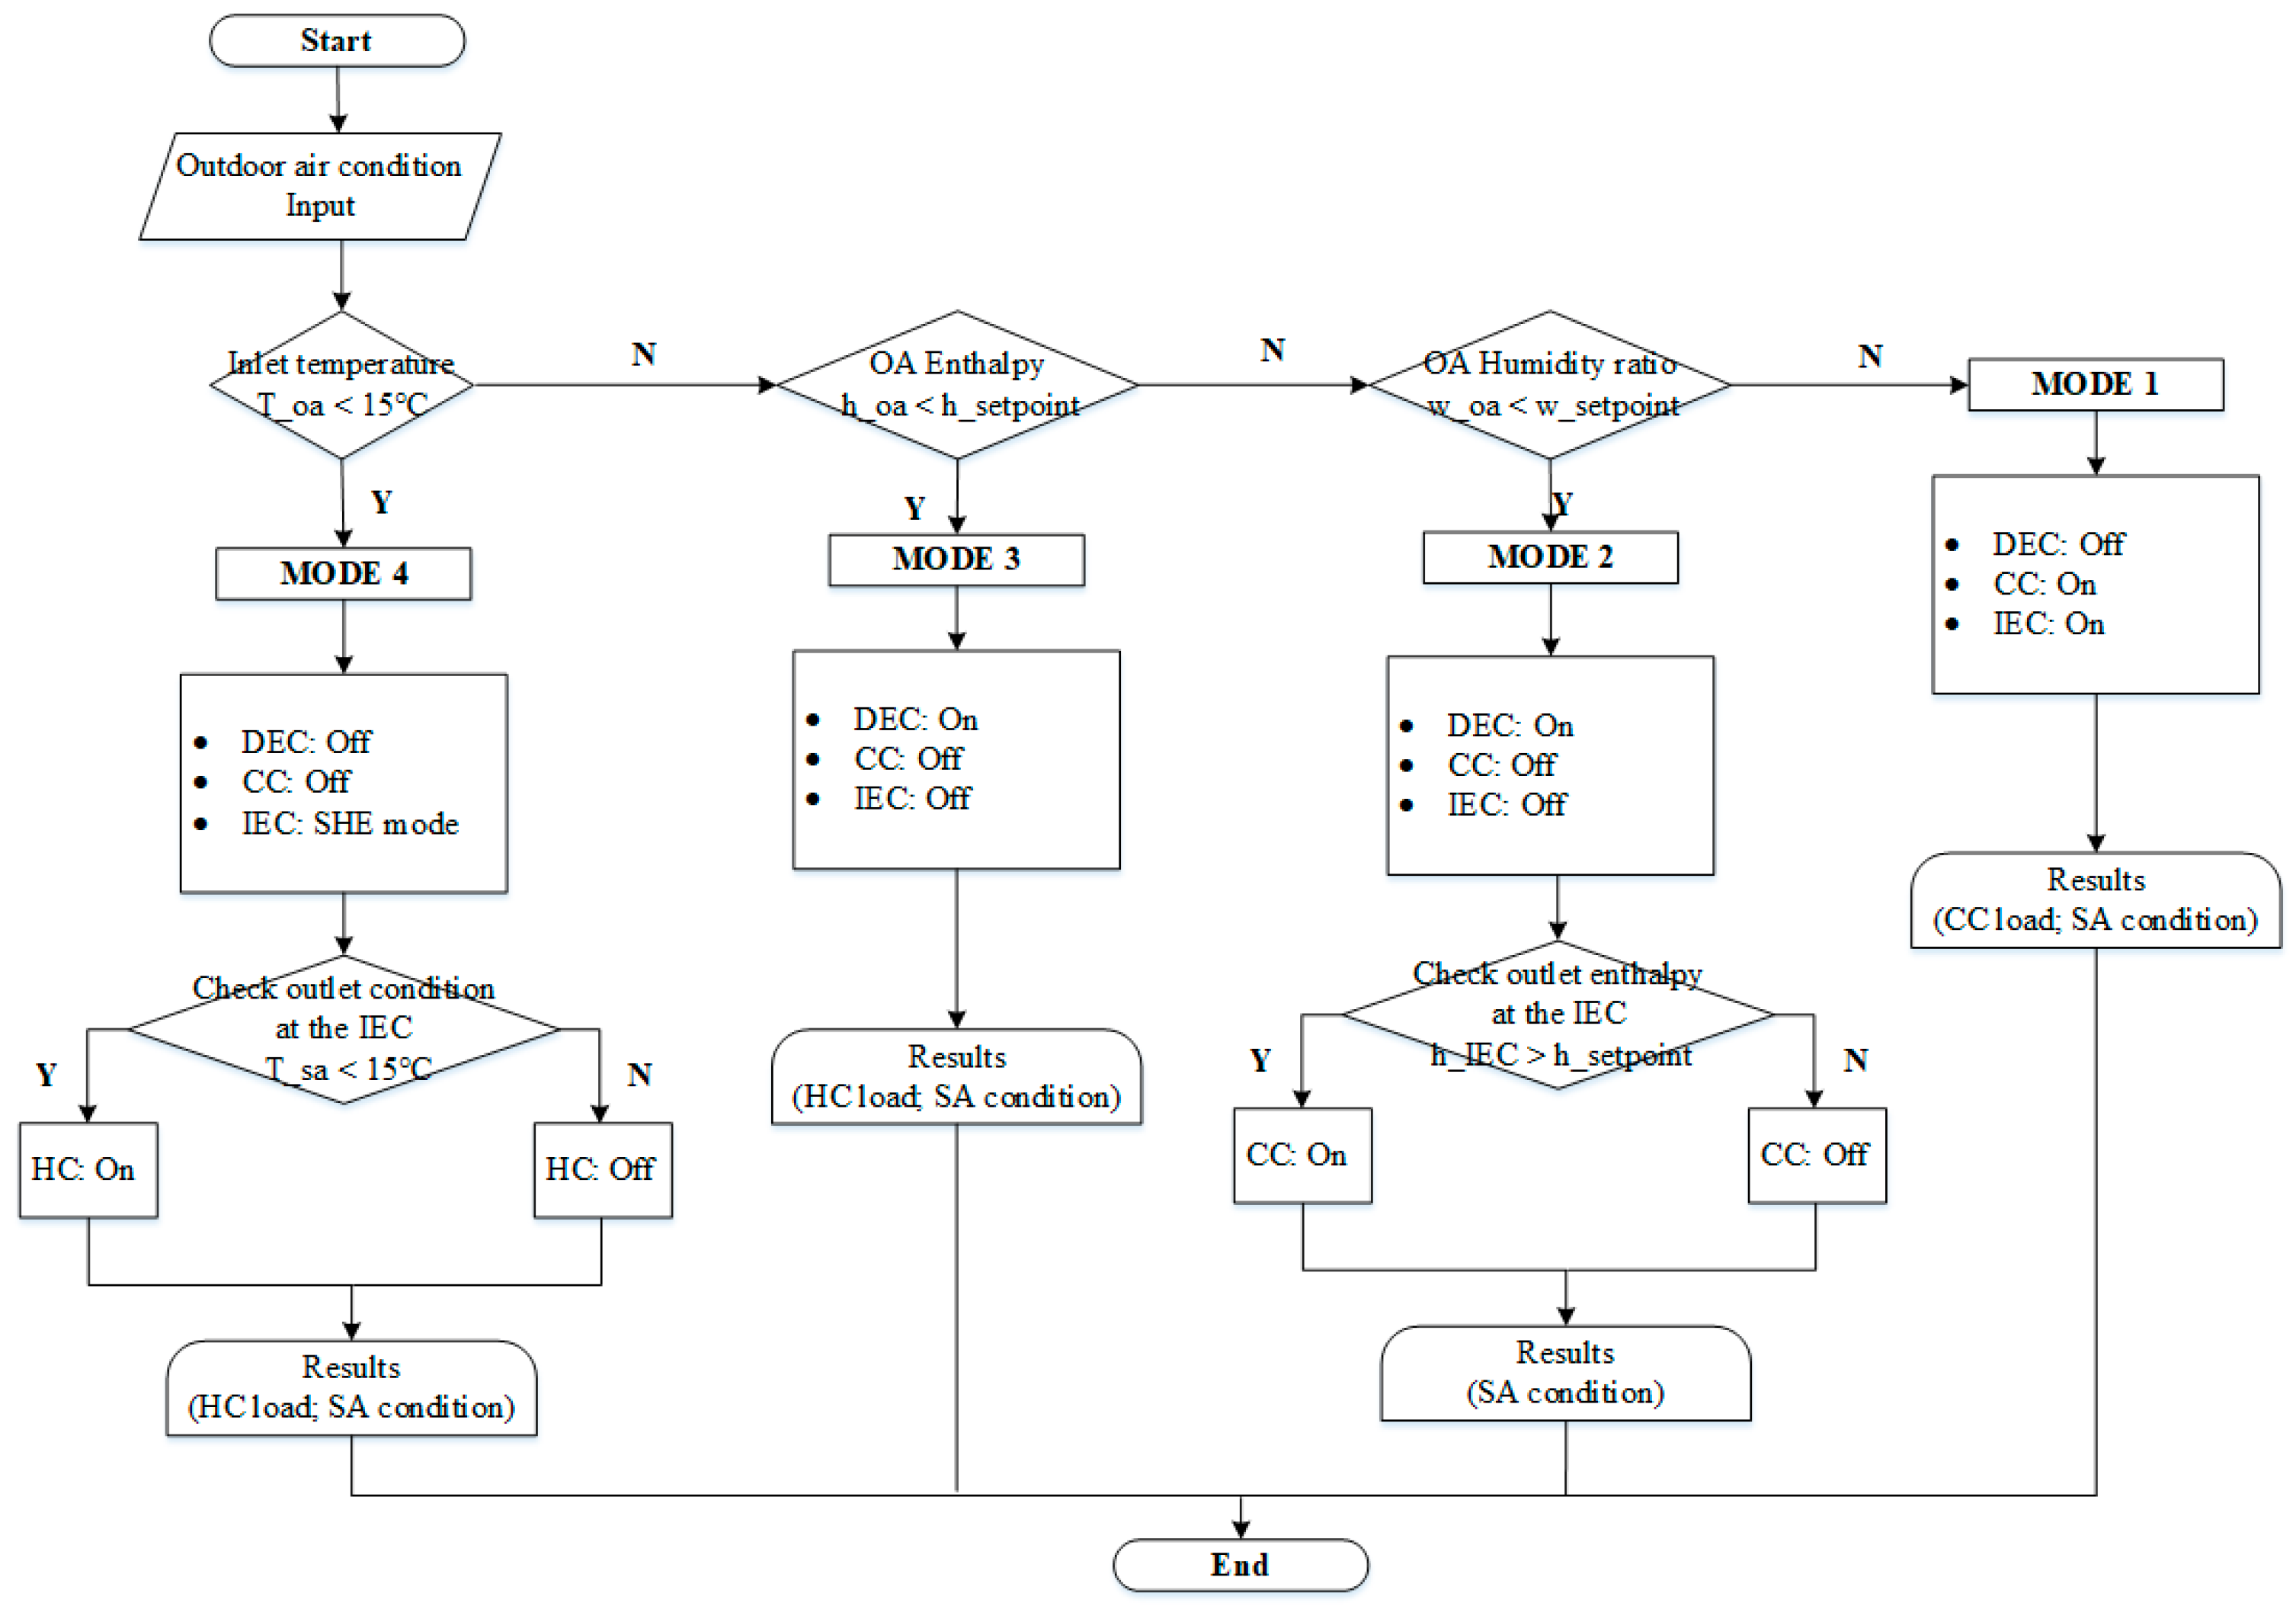
3.4. Simulation Flow Chart
4. Simulation Results
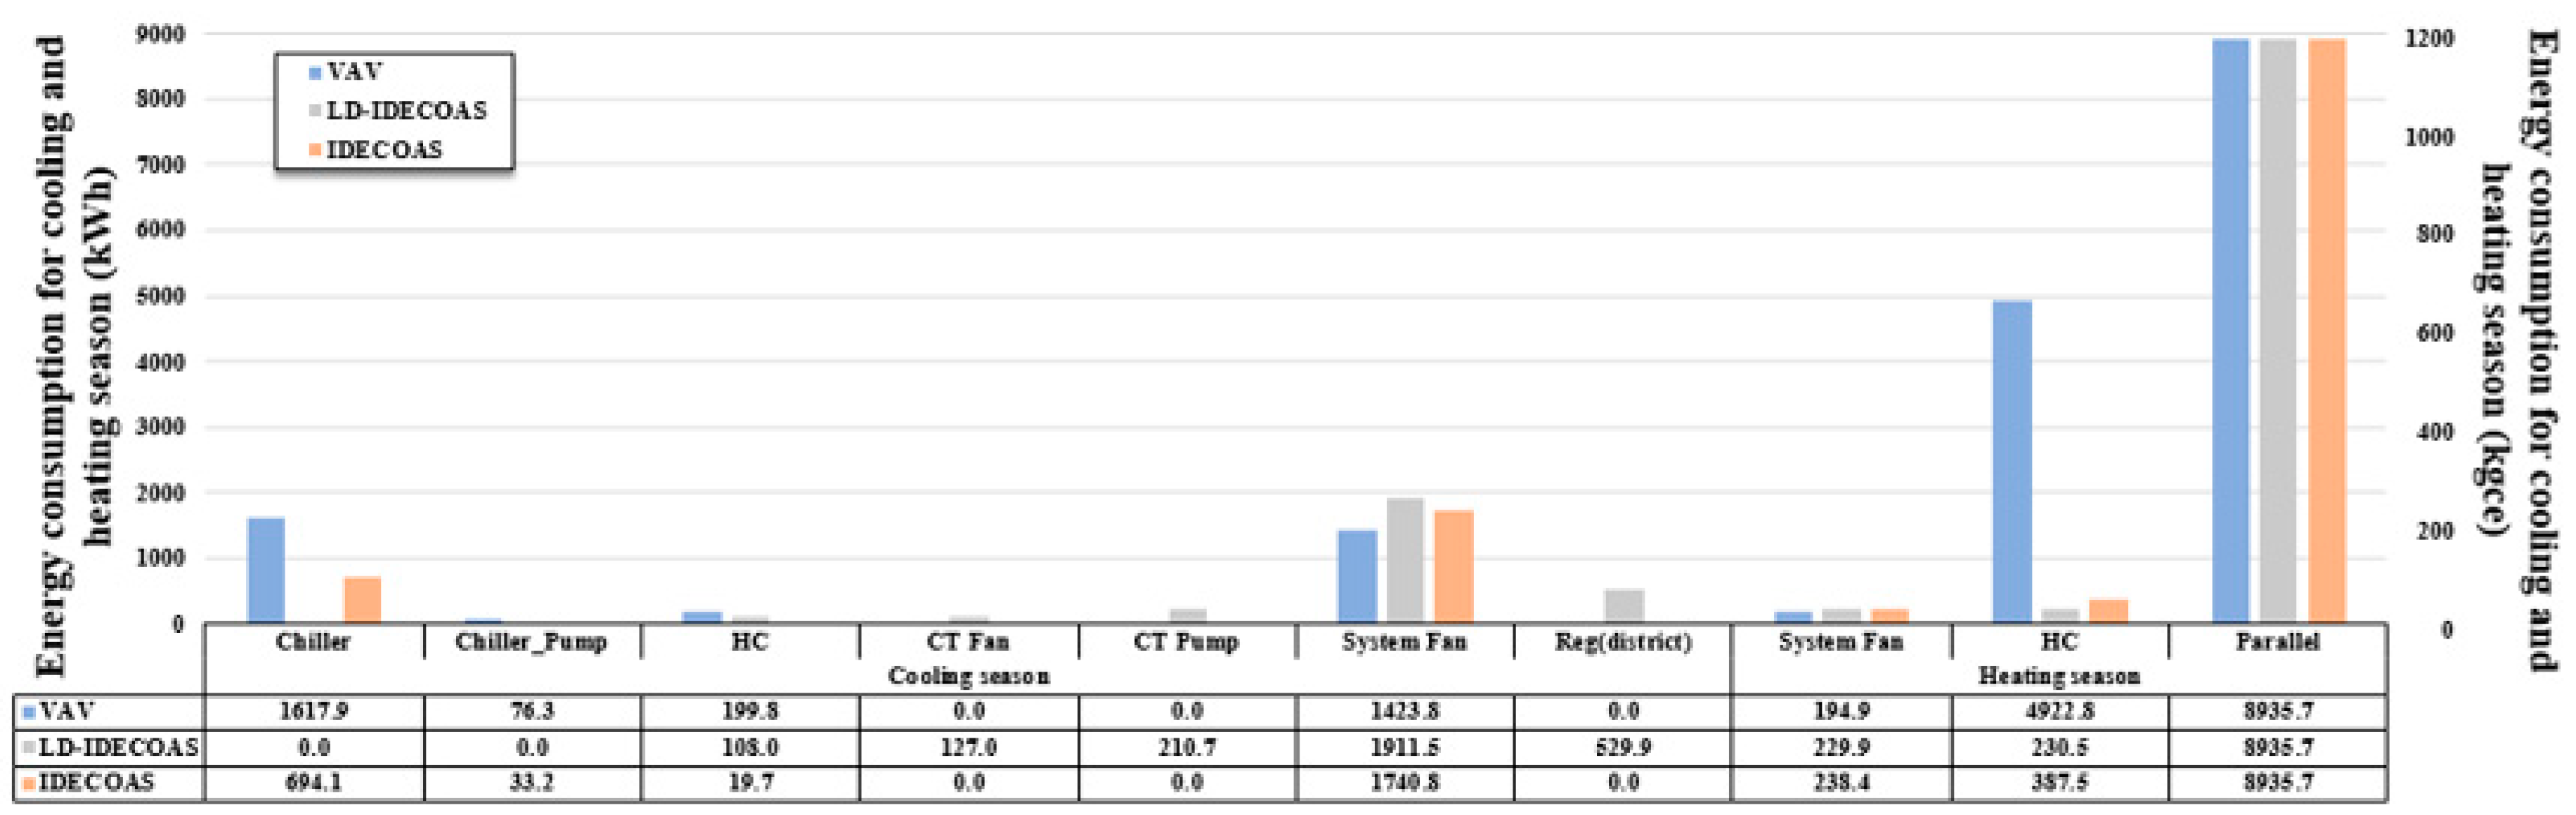
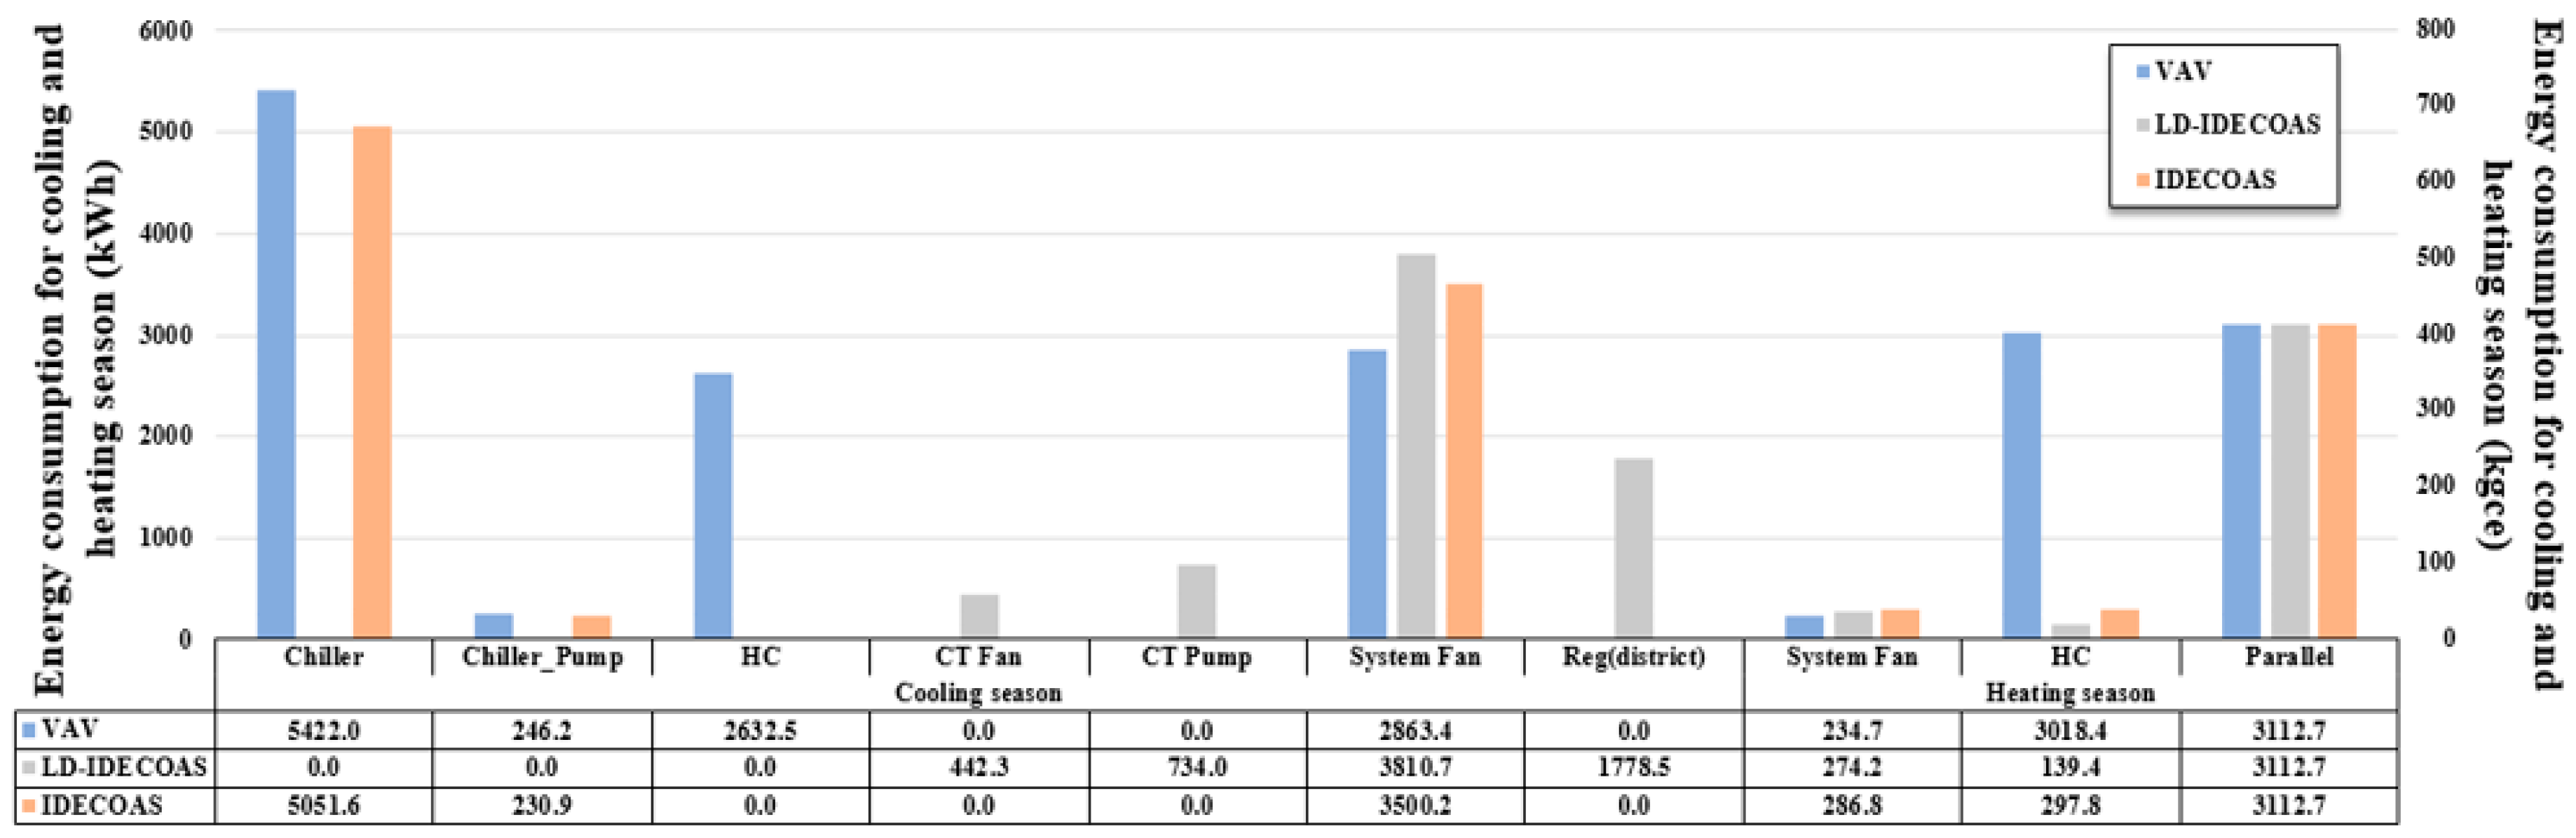
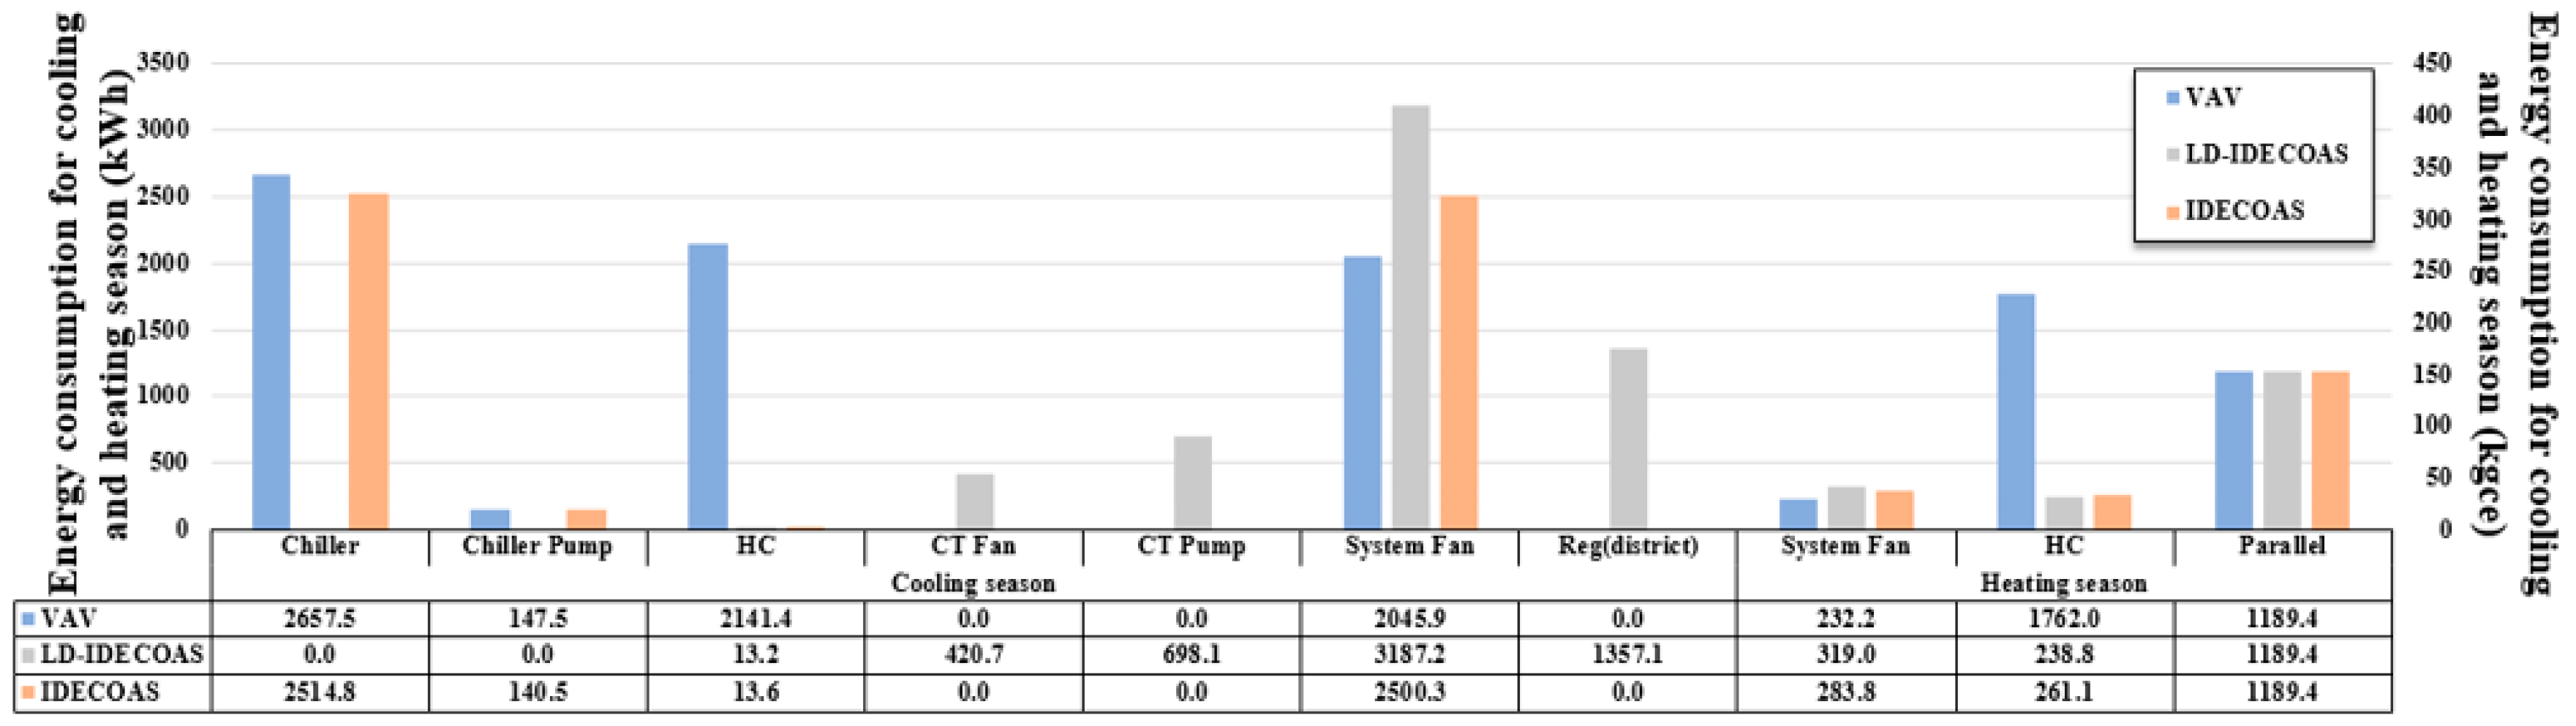
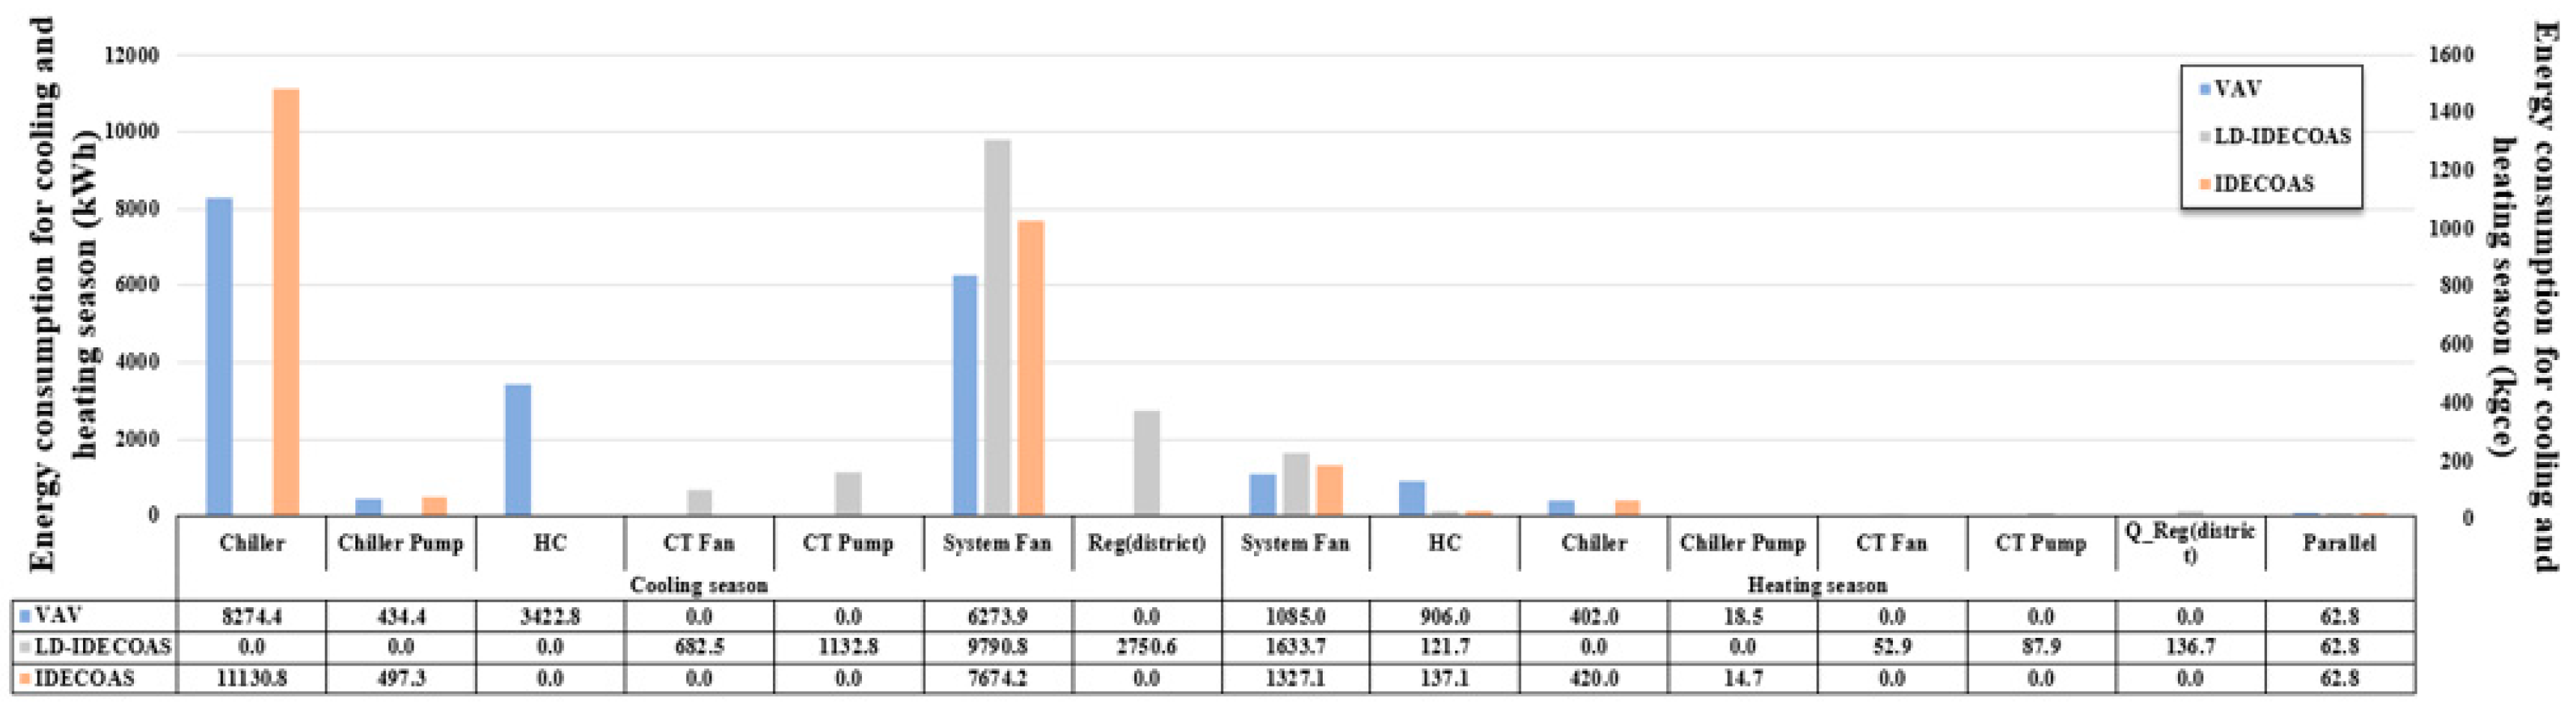
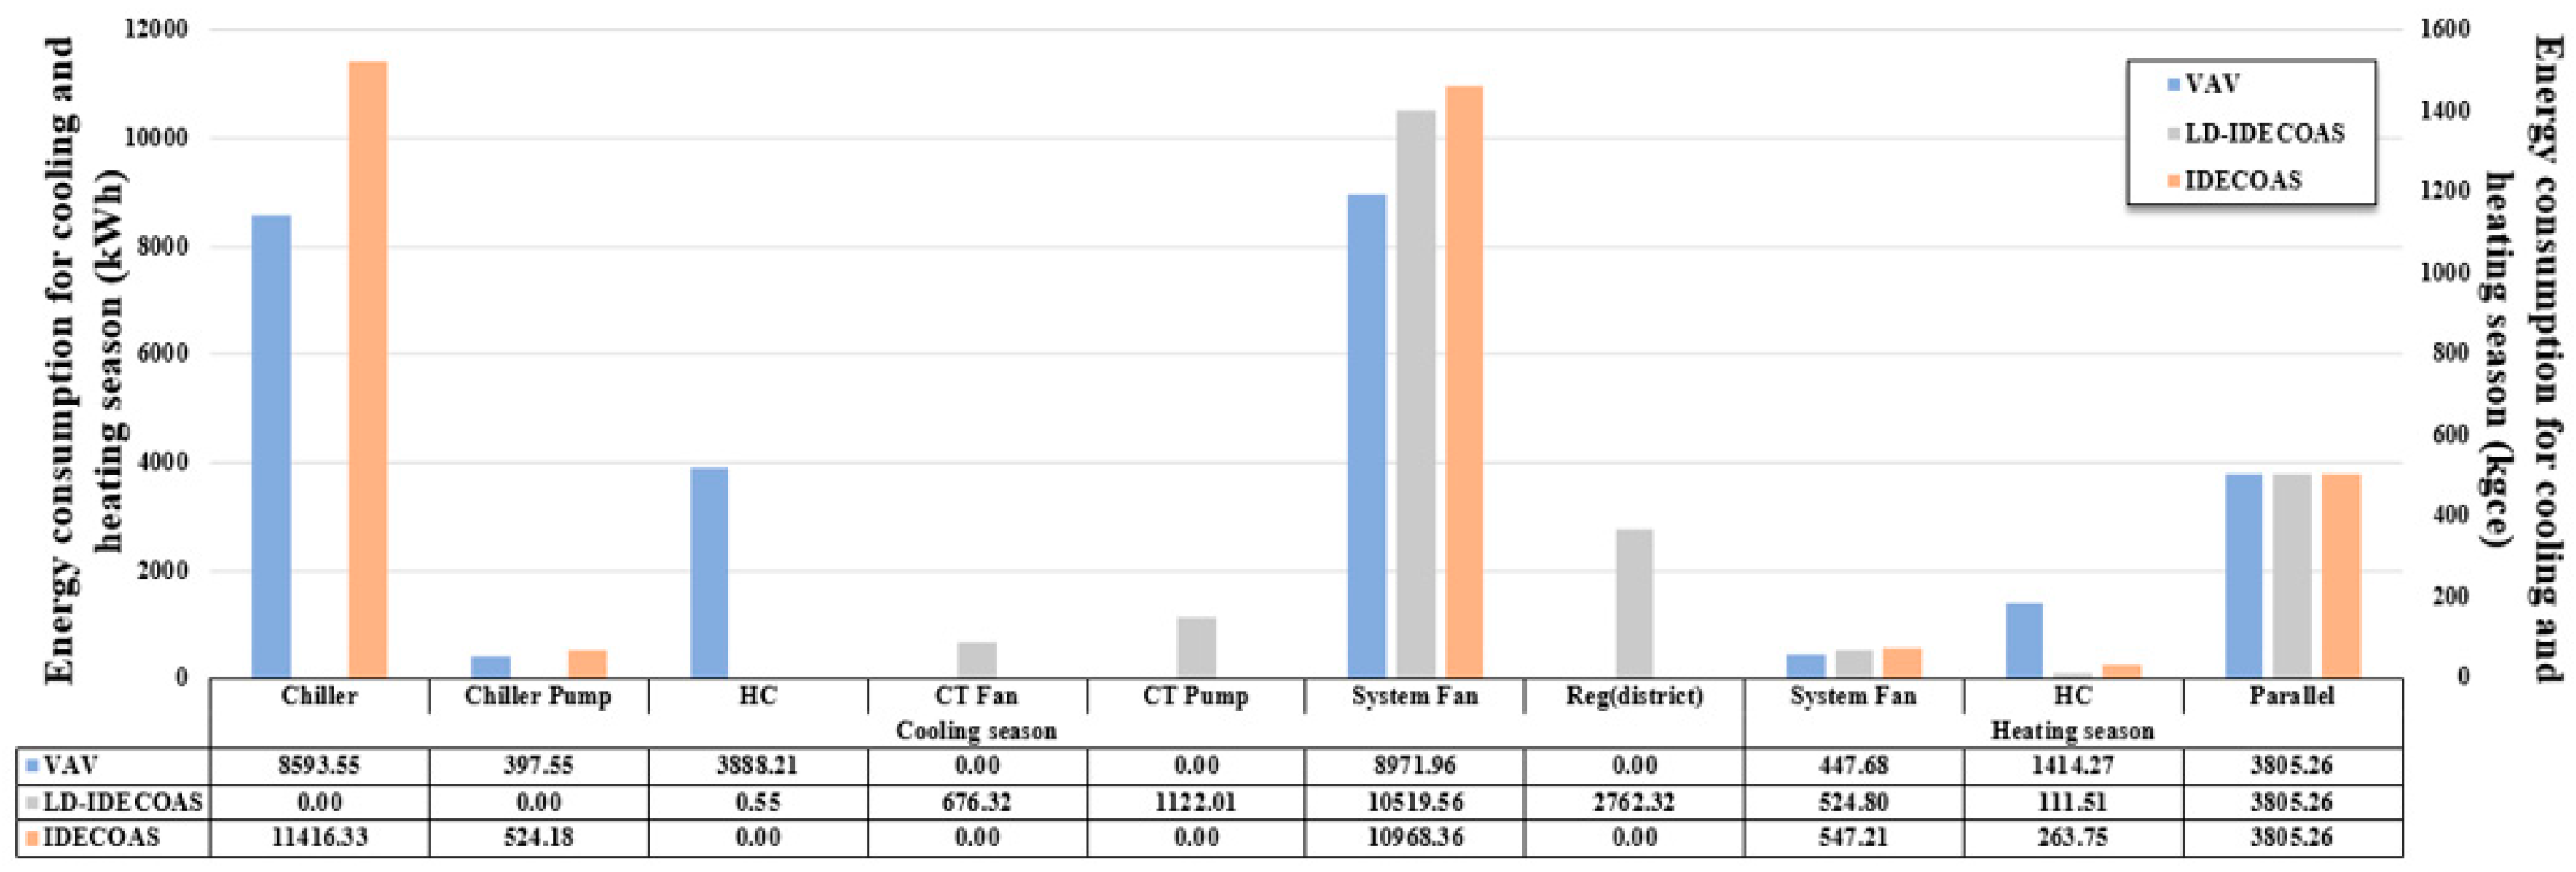
4.1. Comparative Analyses of Seasonal Results
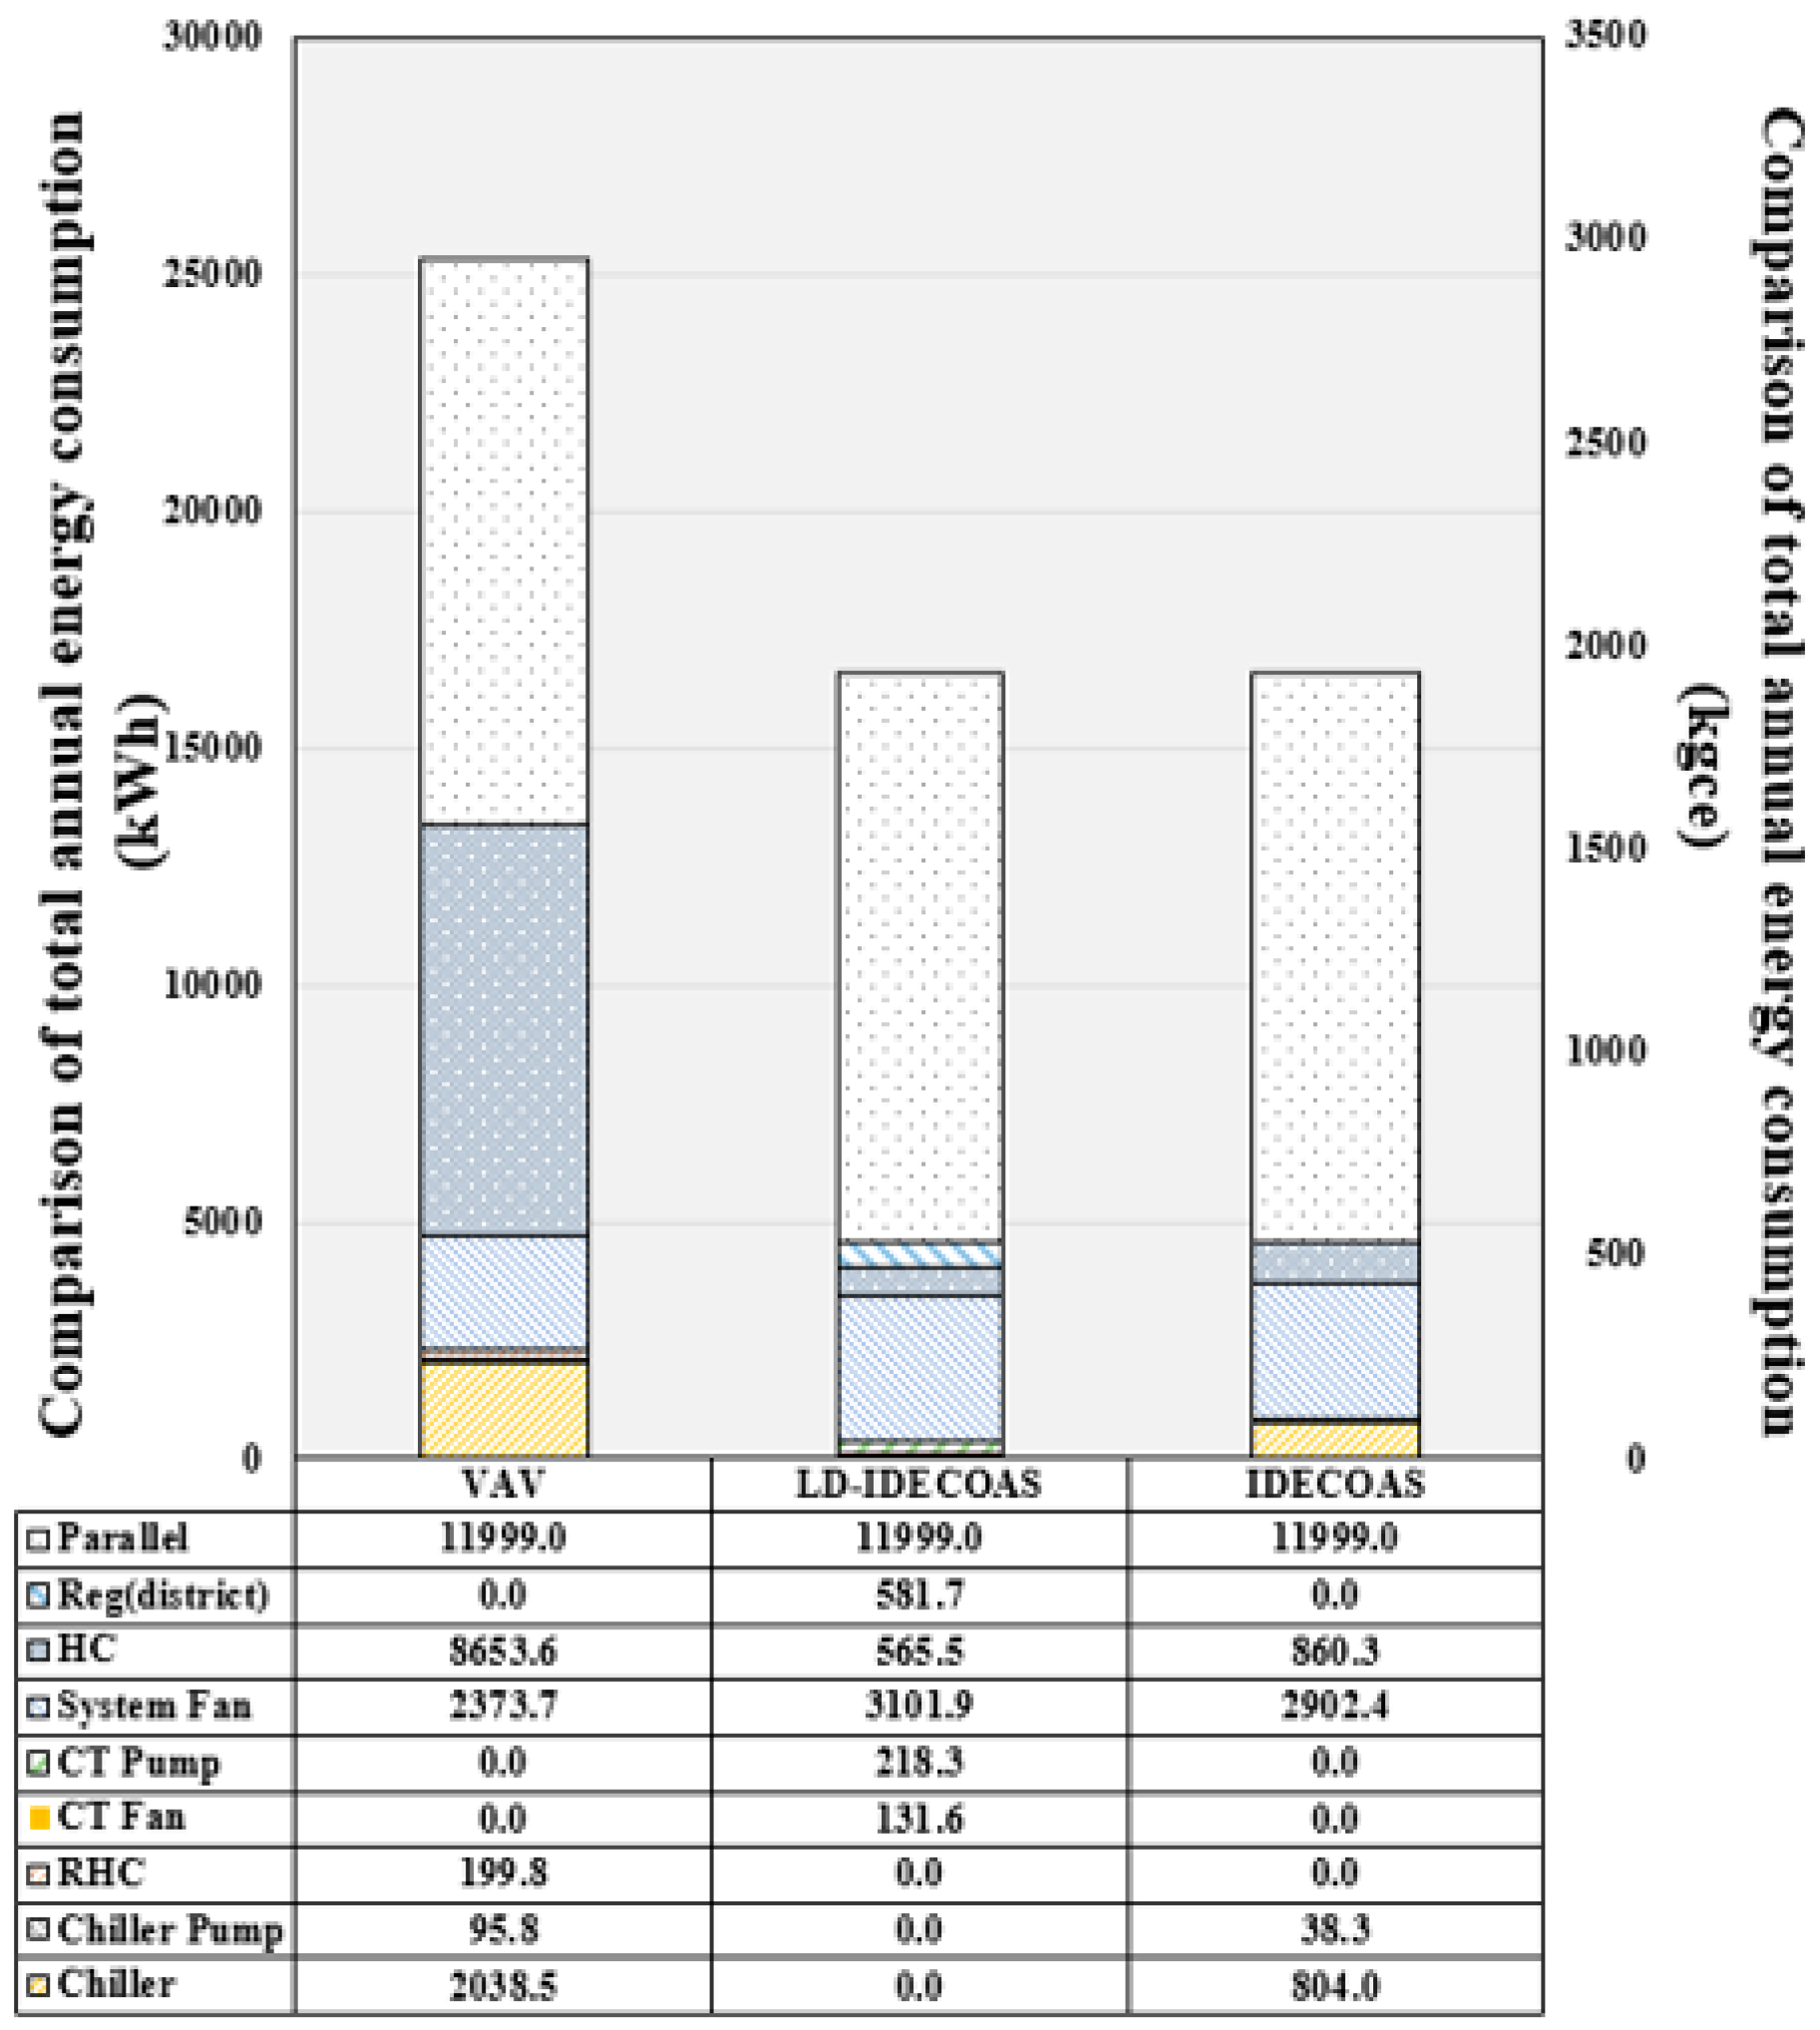
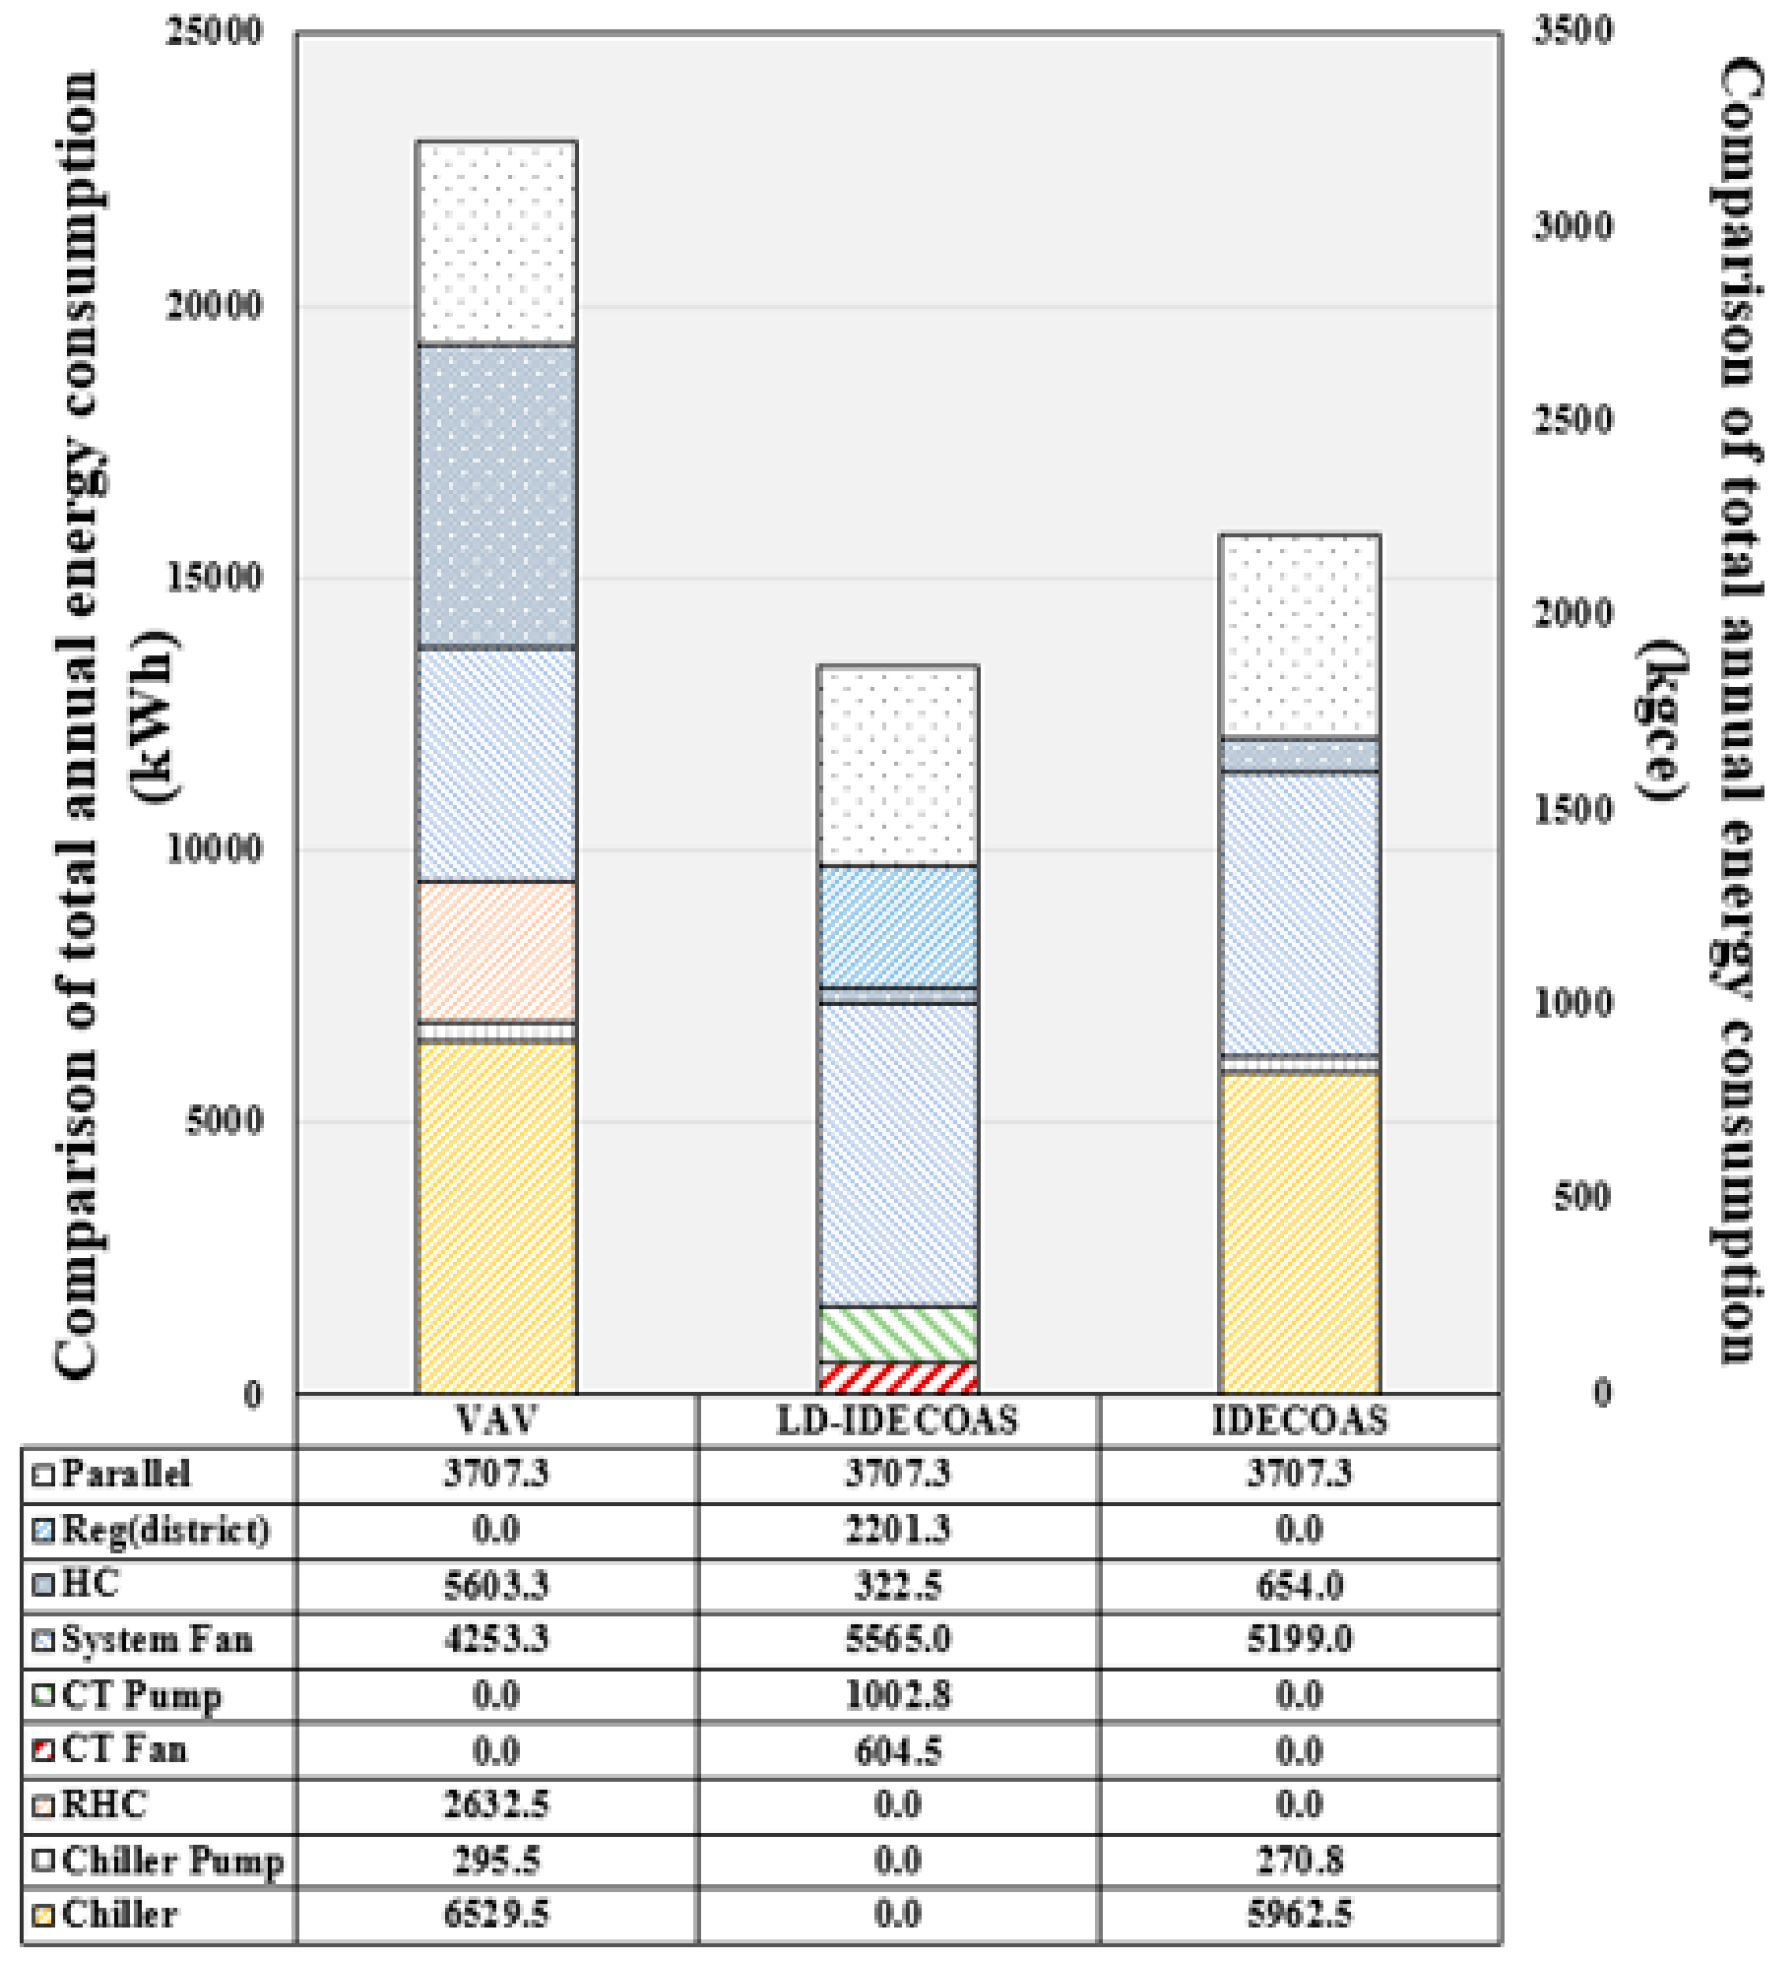
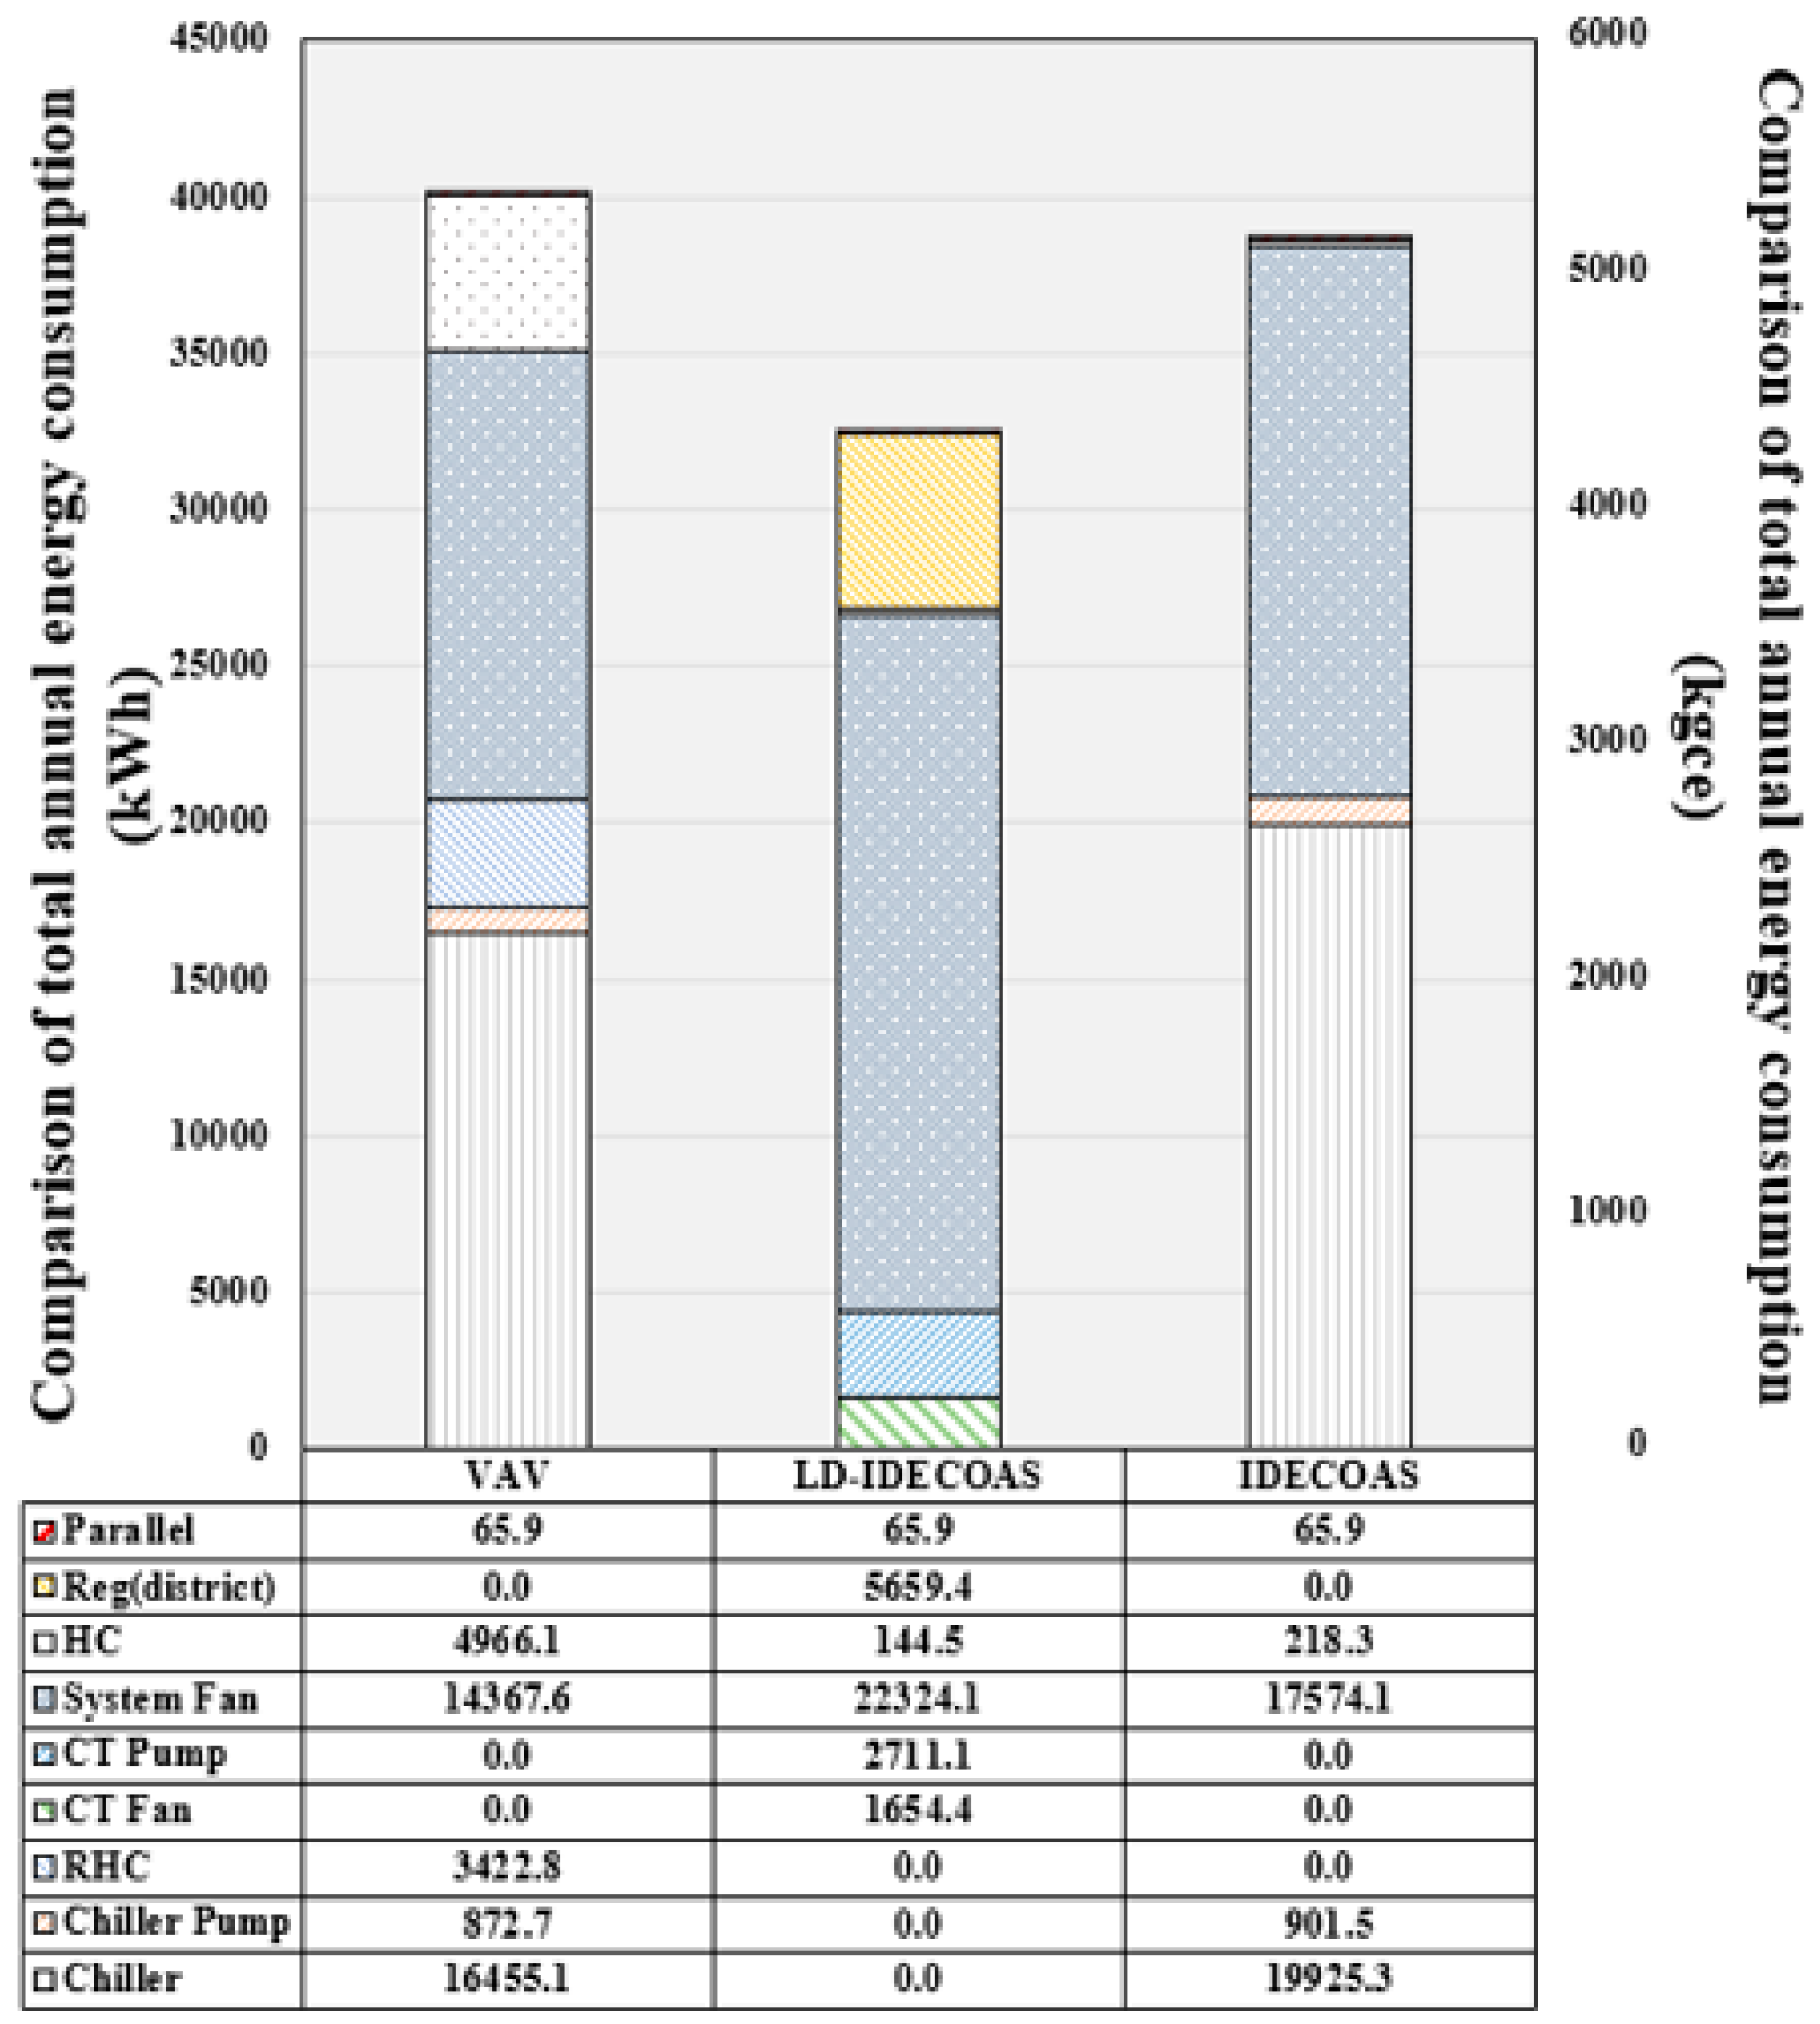
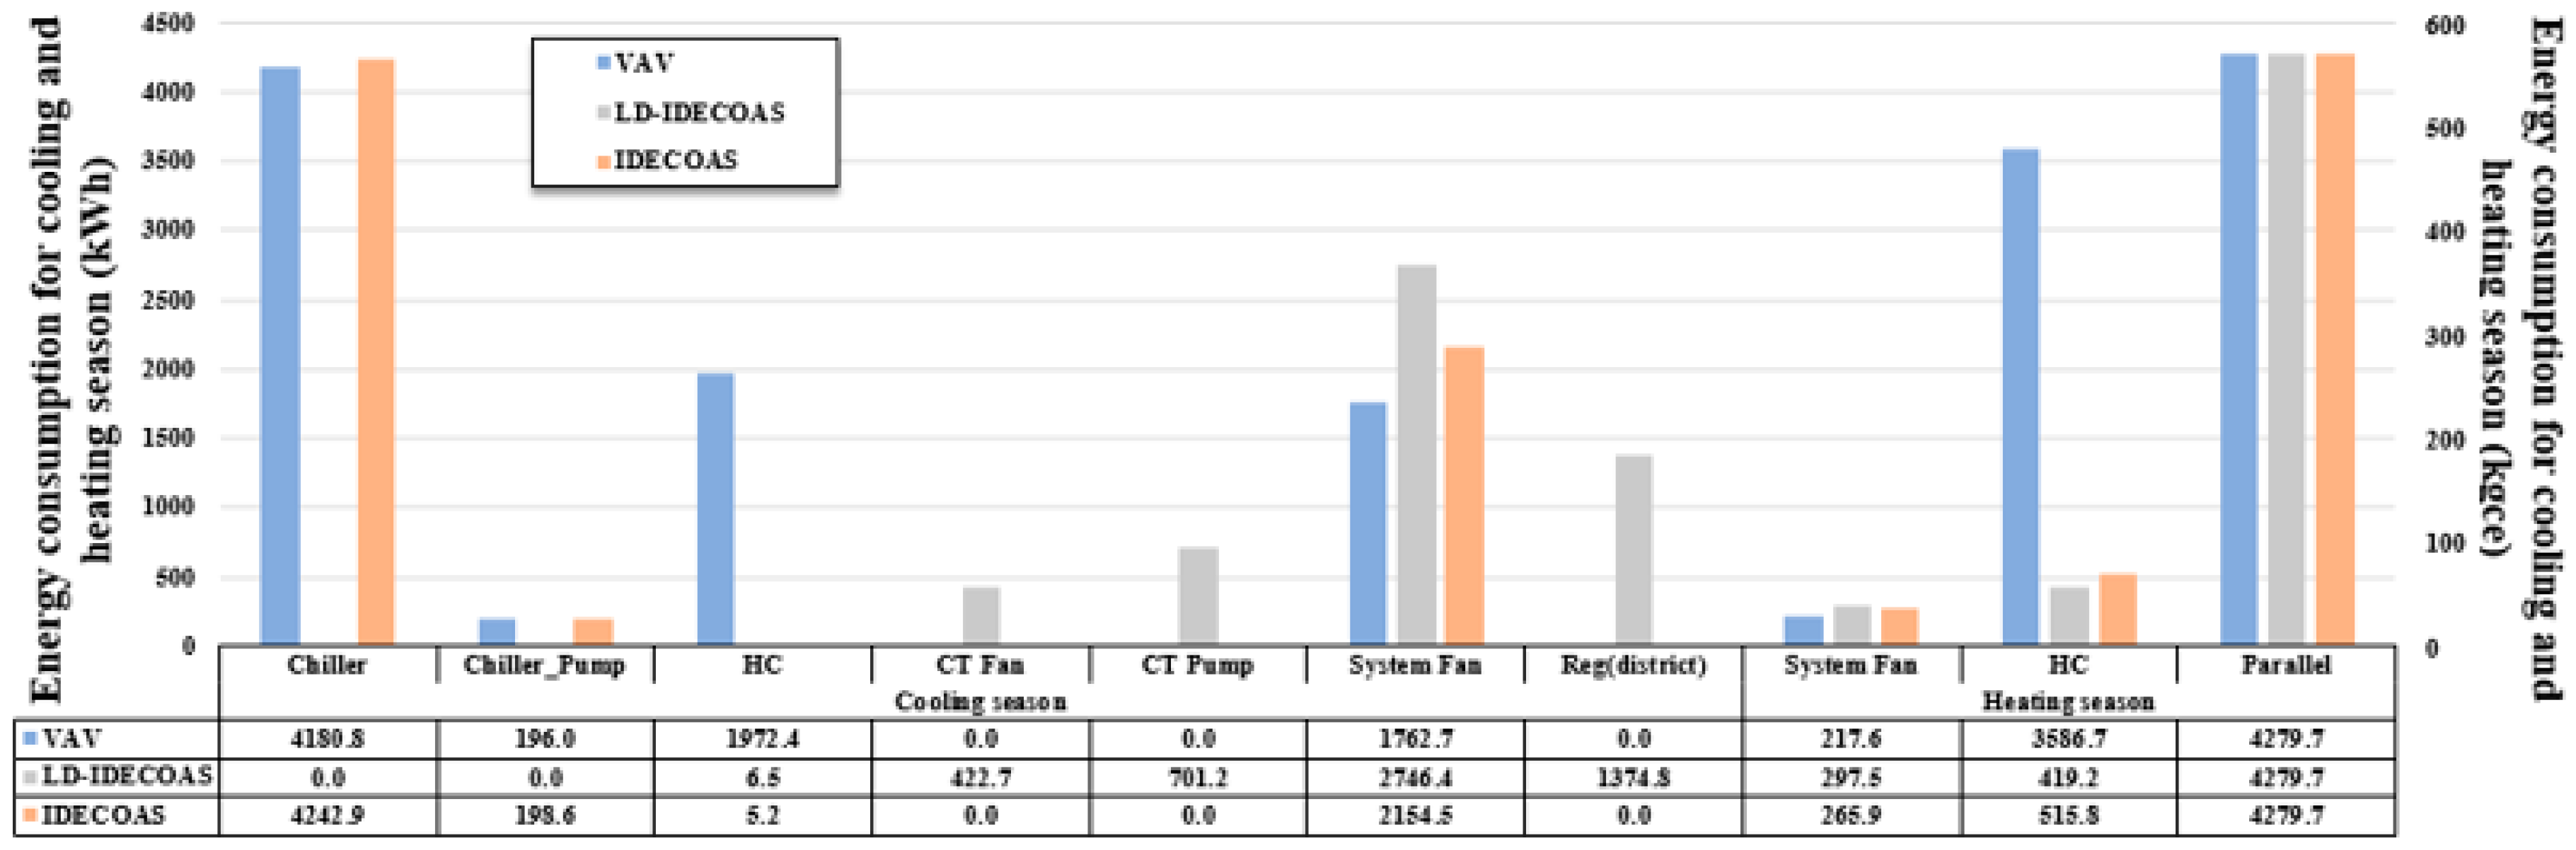
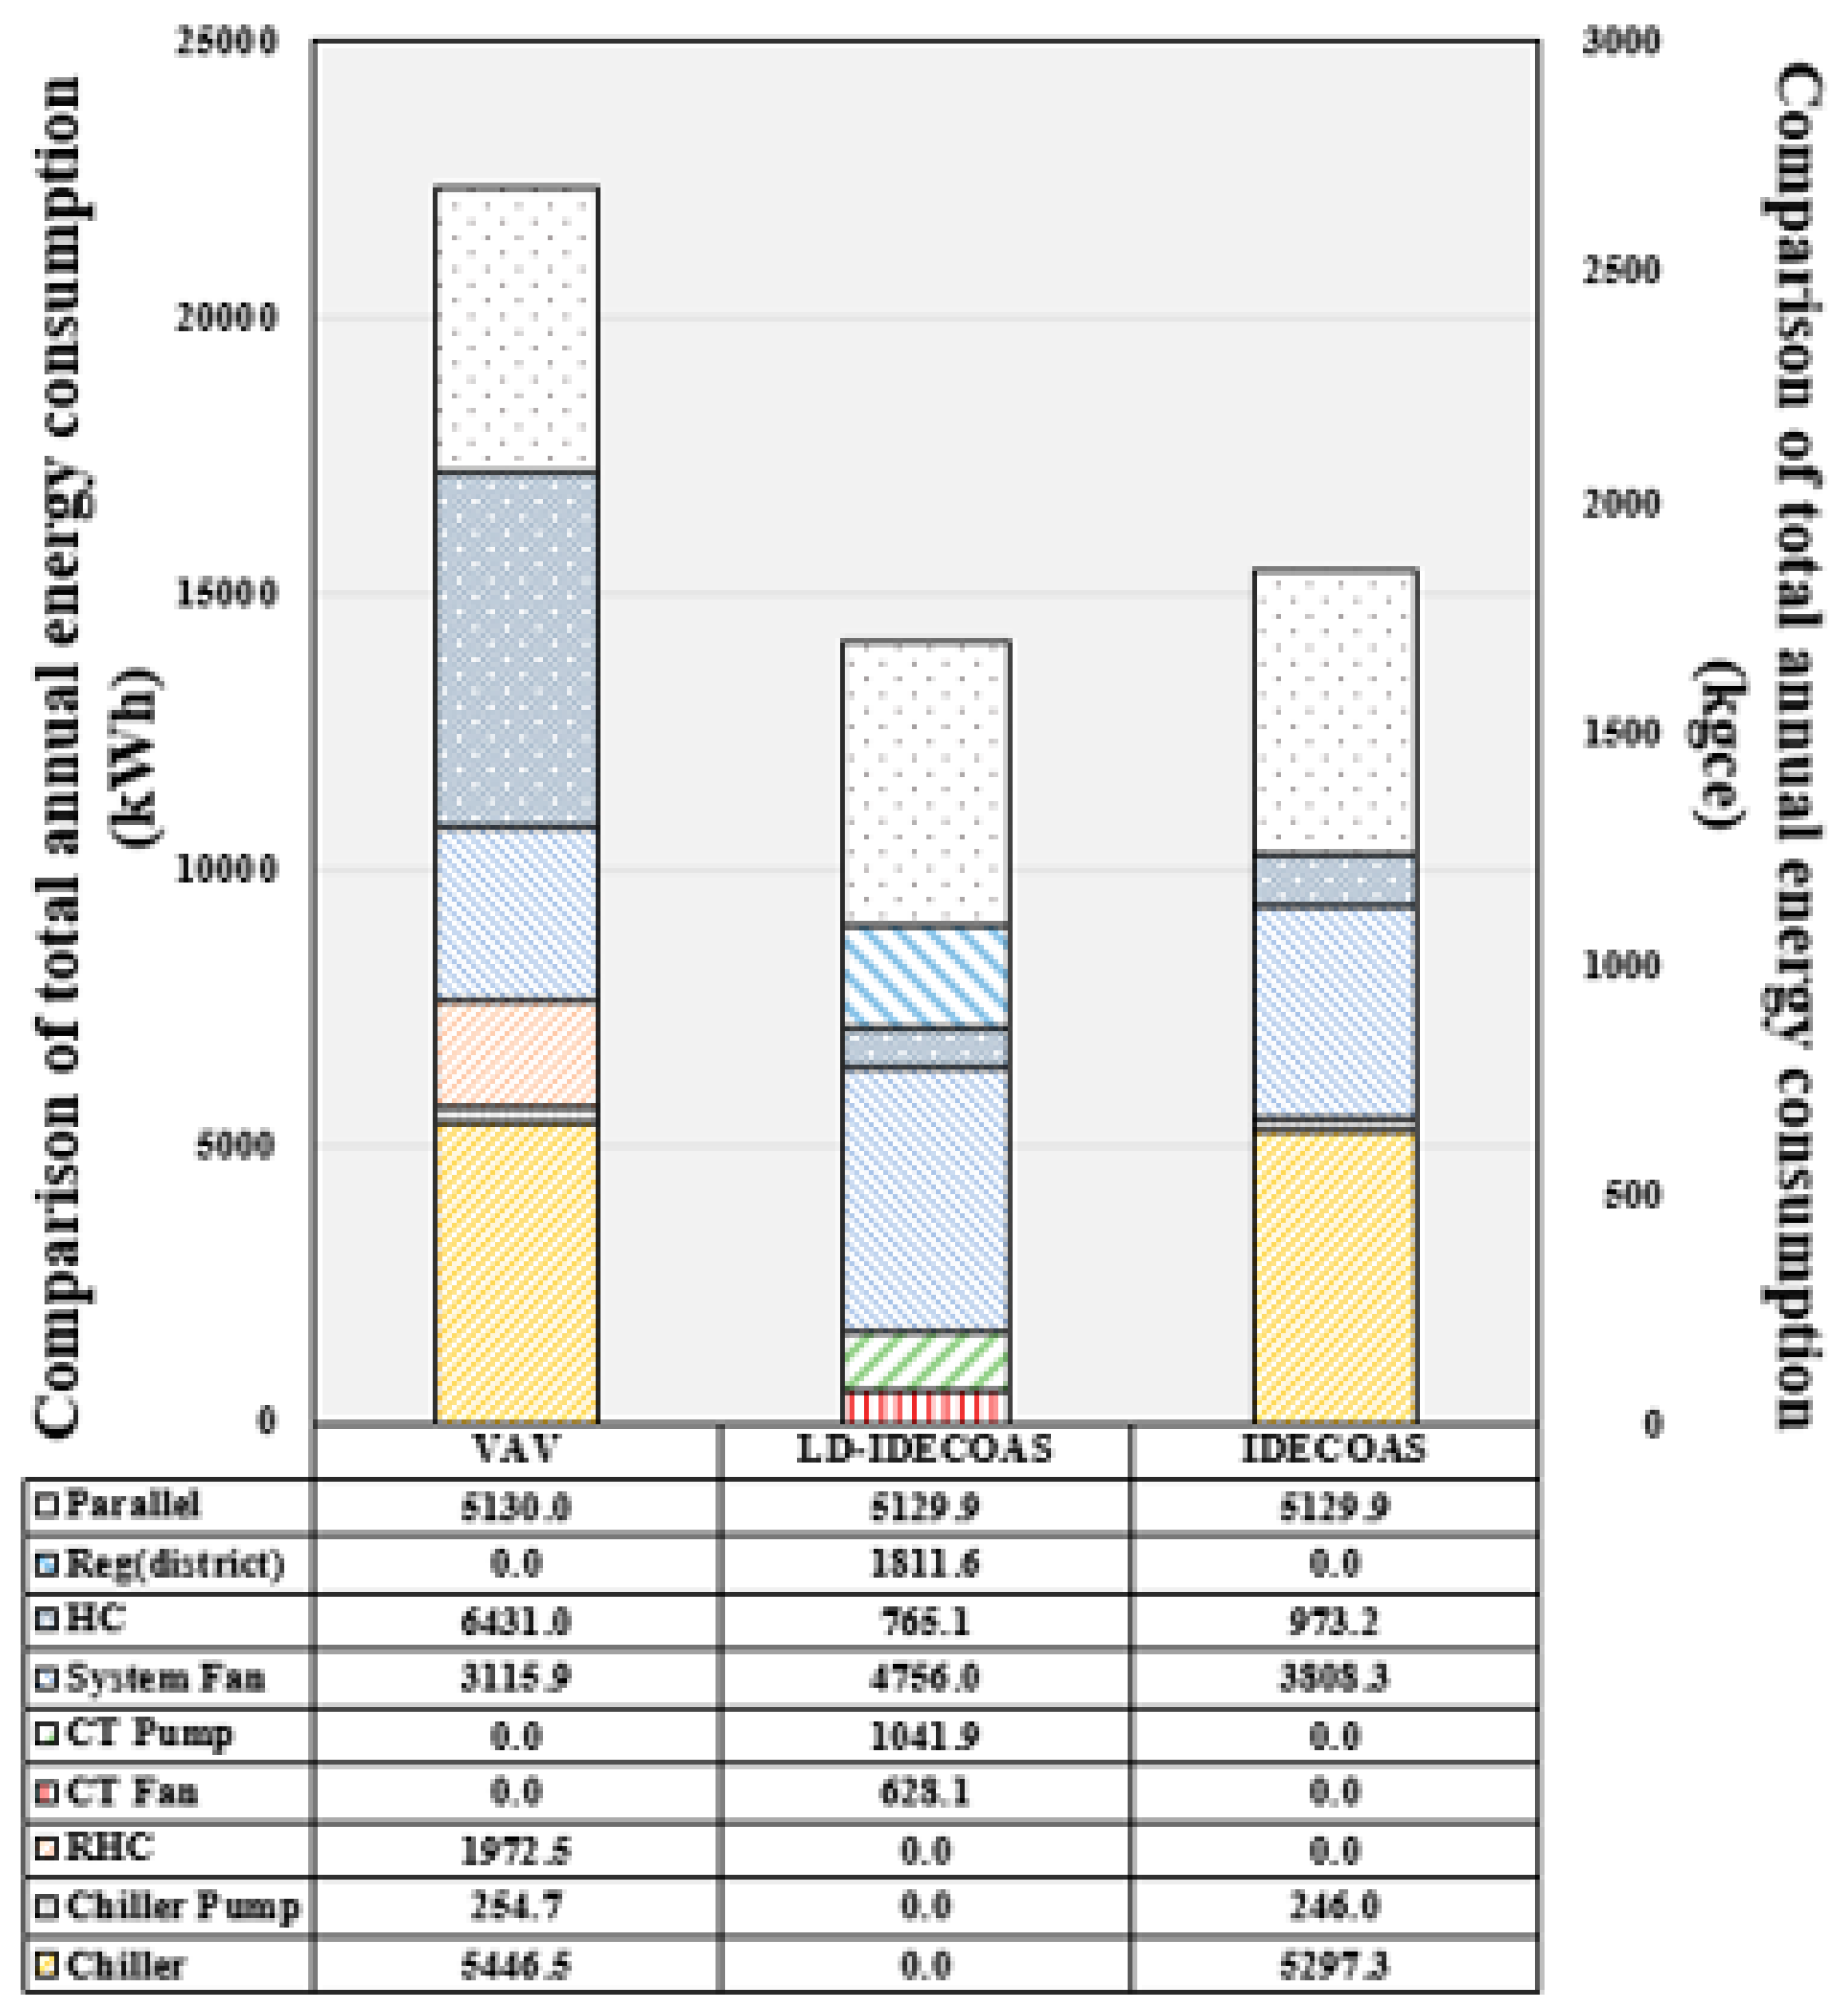
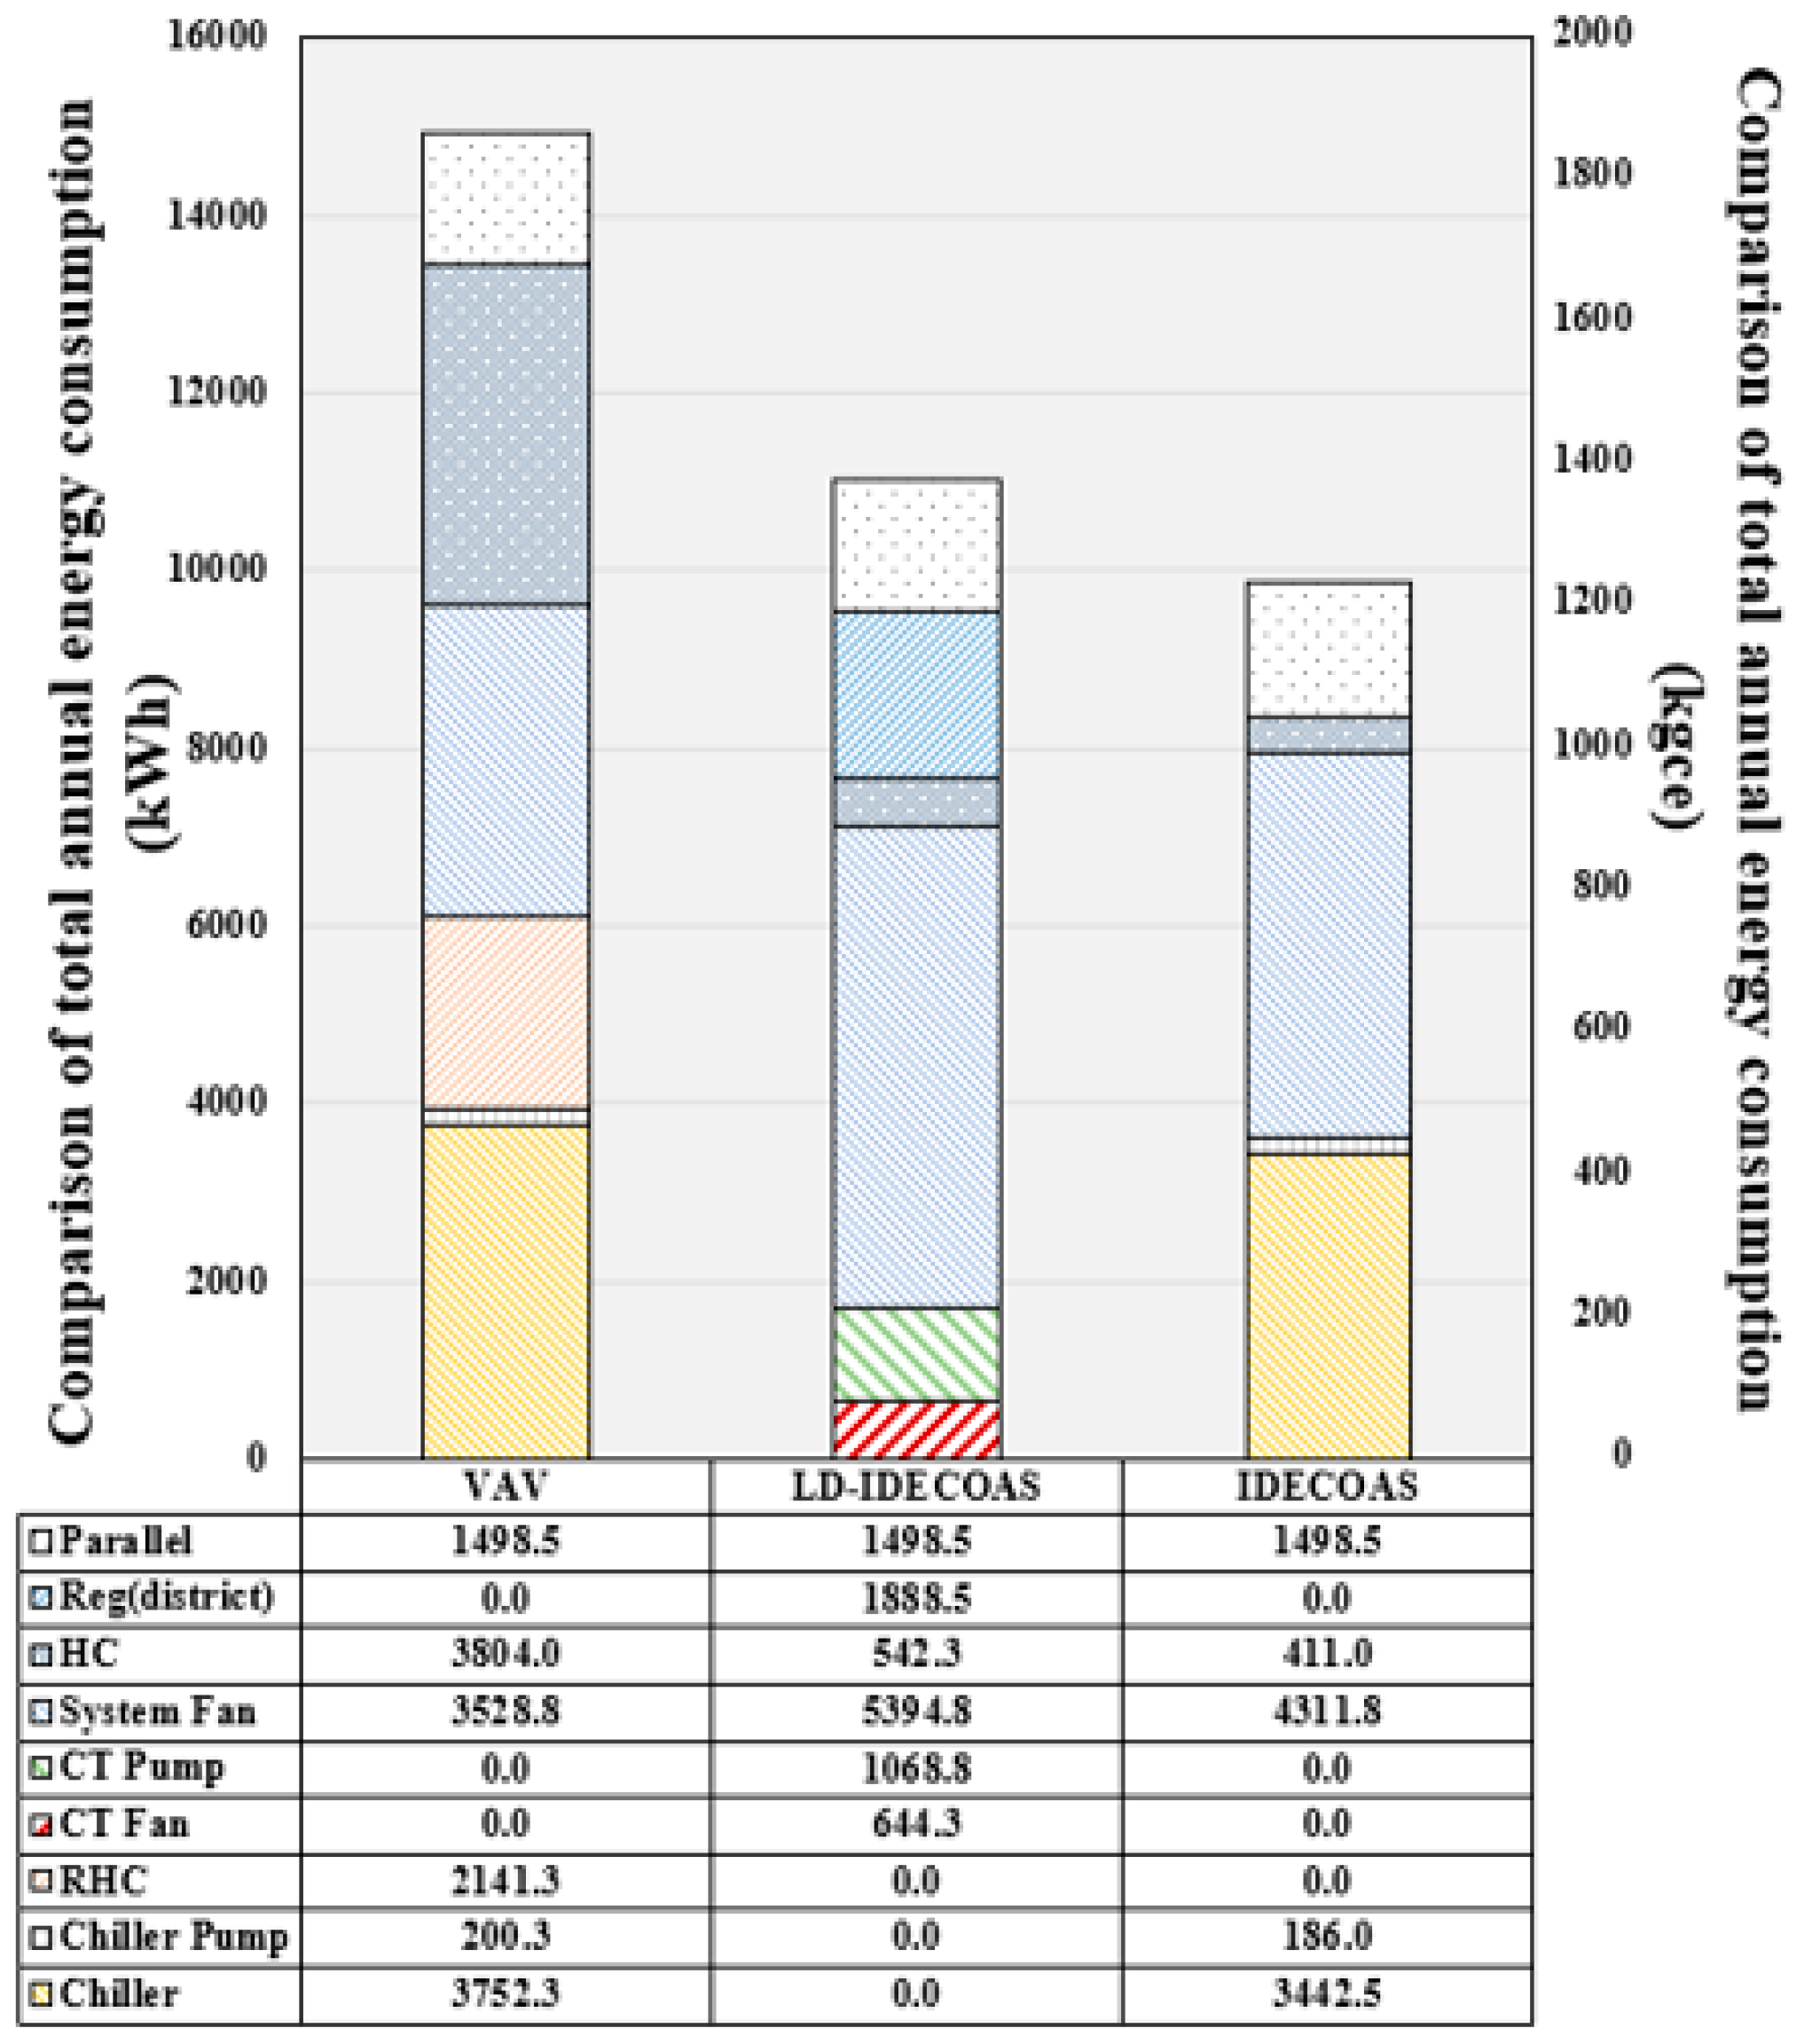
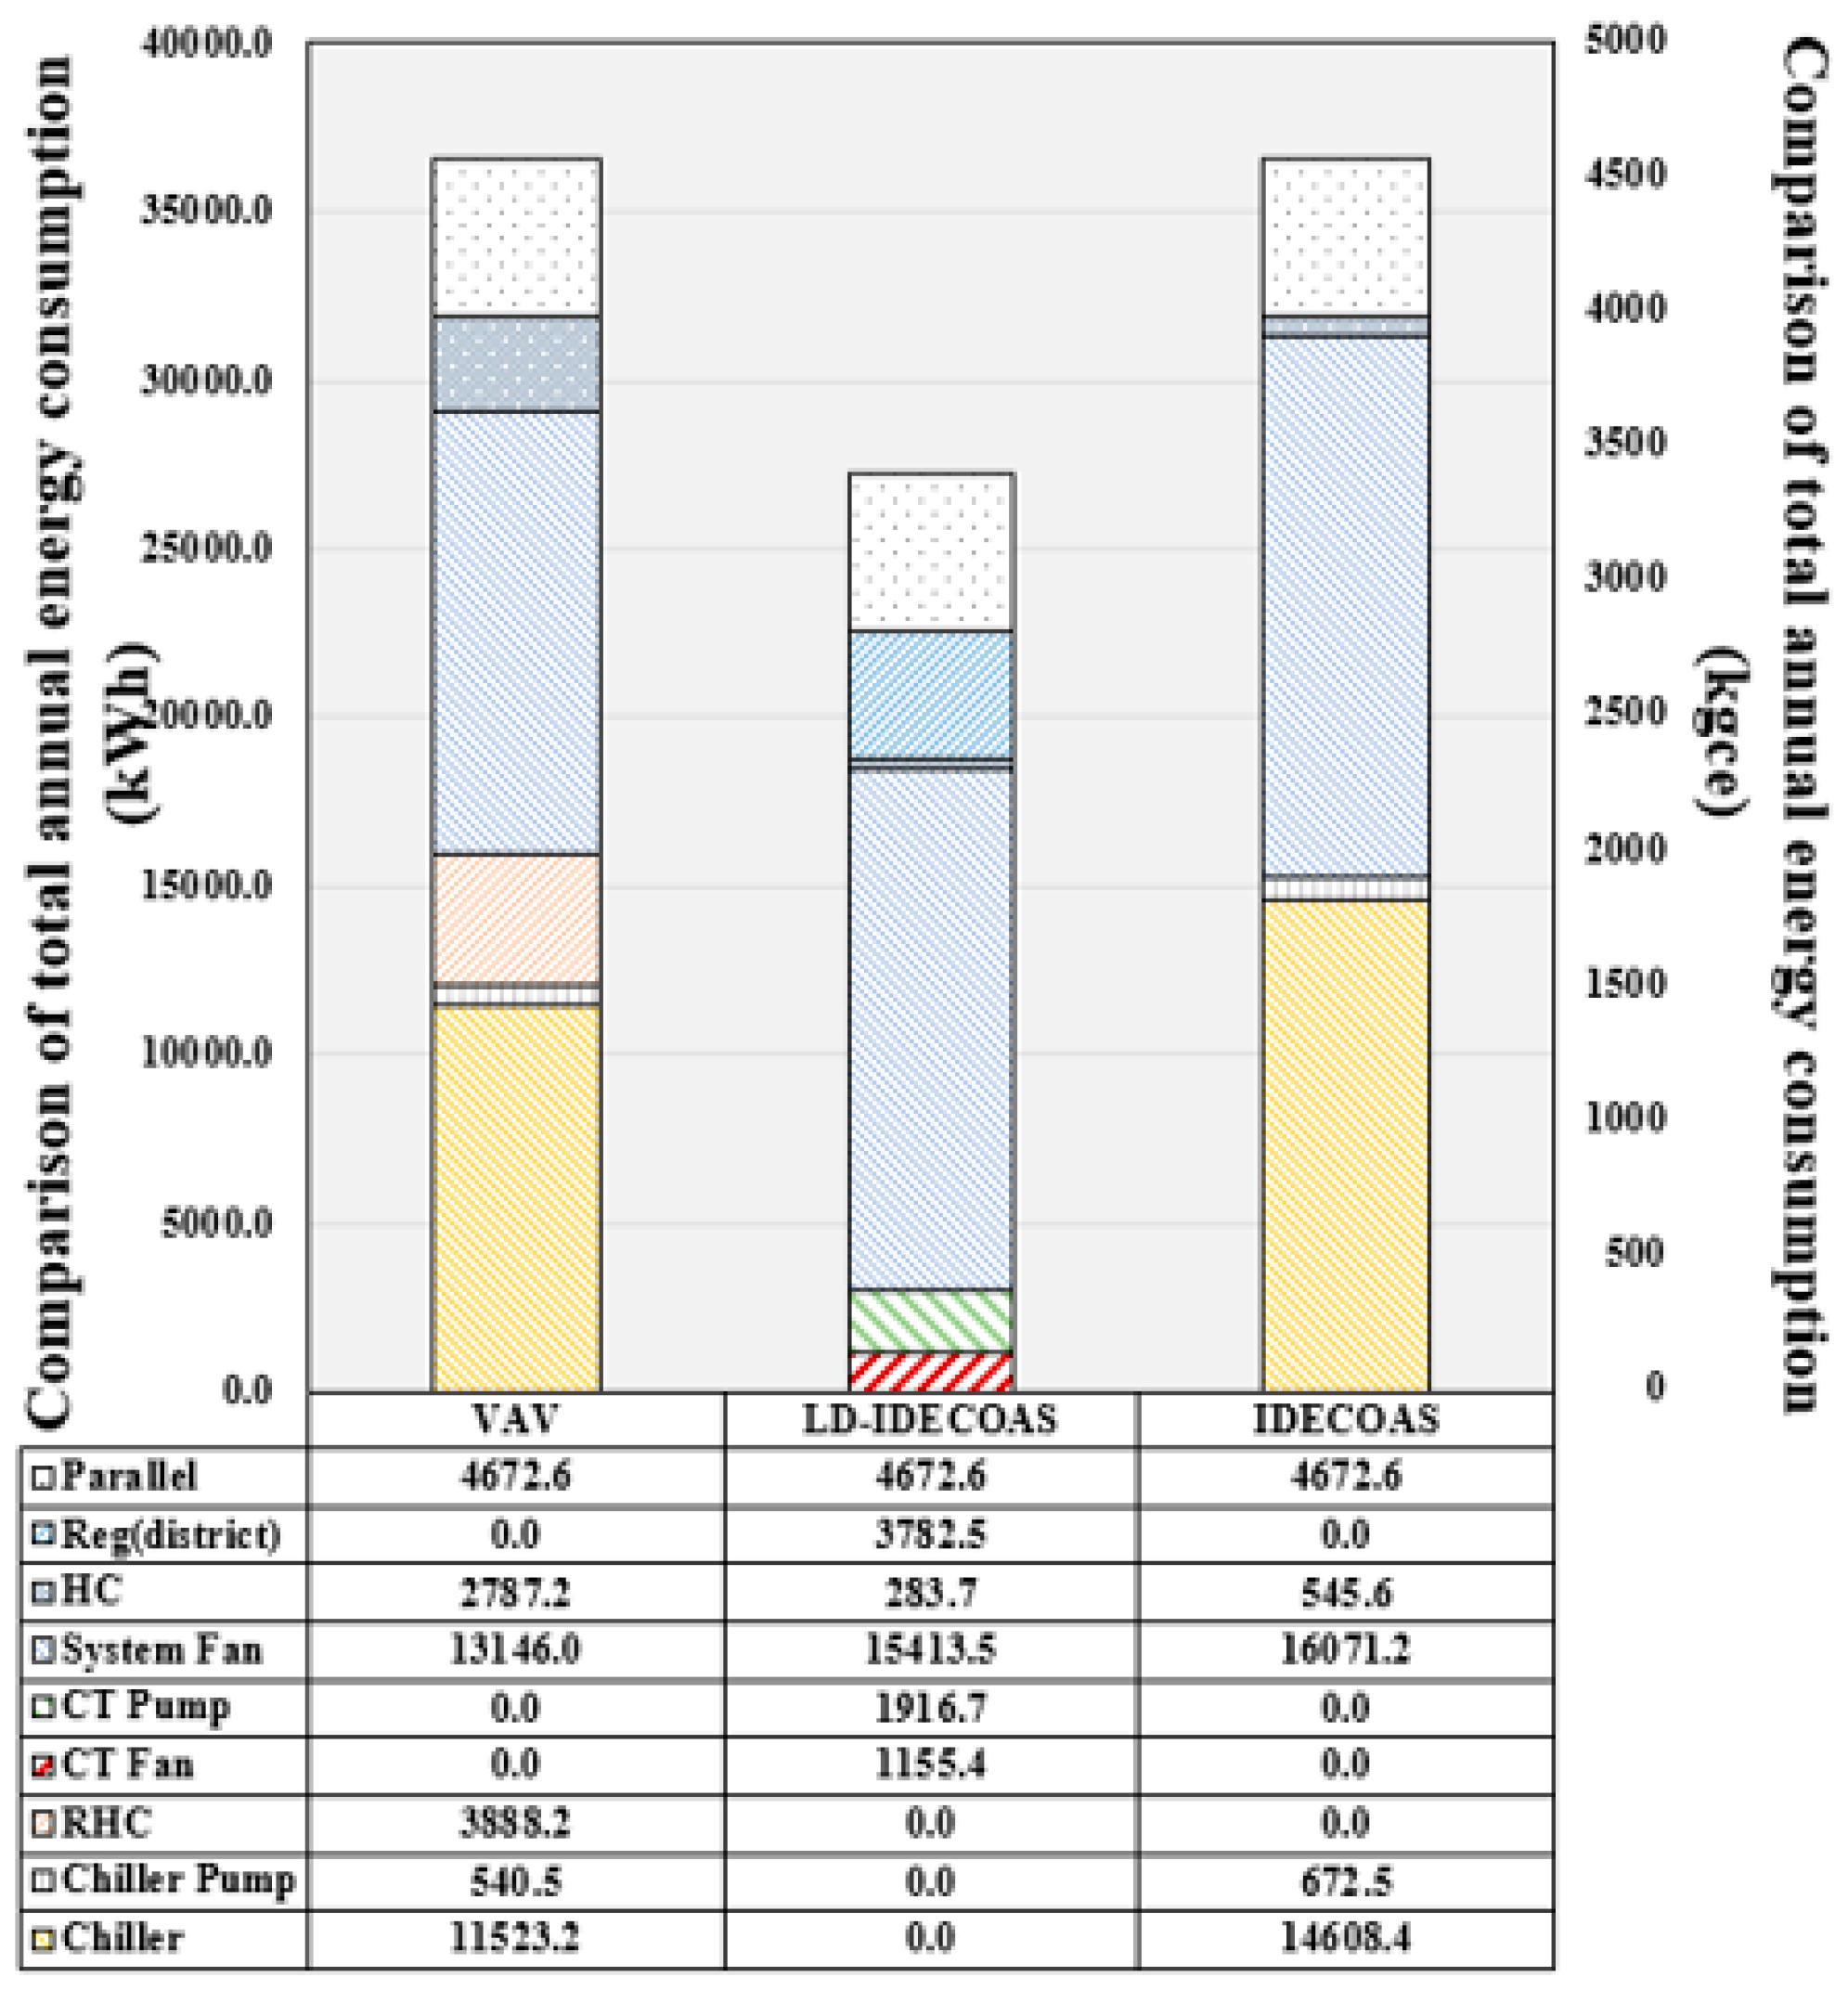
4.2. Comparison of Annual Energy Consumption
5. Conclusions
- The results of the seasonal analysis show that LD-IDECOAS can save considerable energy when applying LD-IDECOAS in all regions compared with the conventional VAV system.
- In addition, in seasonal results, IDECOAS is better in the Urumqi region, which has a very cold and dry condition, and Kunming region with special ambient conditions, compared to LD-IDECOAS. In hot and humid areas, the application of LD-IDECOAS is much better.
- The annual results show that LD-IDECOAS saved much more energy than the VAV systems in all regions.
- When LD-IDECOAS is compared with IDECOAS in the annual results, the energy consumption results in the dry areas are not much different, but they may vary depending on the area characteristics. The more the drying, the less the dehumidification performance of the LD system is needed, so the application of IDECOAS is more advantageous. In this study, it was found that the application of LD-IDECOAS is more advantageous in hot and humid areas.
Author Contributions
Acknowledgments
Conflicts of Interest
Nomenclature
| desiccant concentration (%) | |
| gas flow rate (kg/s) | |
| liquid flow rate (kg/s) | |
| enthalpy (kJ/kg) | |
| desiccant vapor pressure (kPa) | |
| Temperature (°C) | |
| humidity ratio (kg/kg) | |
| low- wetting characteristics of desiccant solution | |
| high- wetting characteristics of desiccant solution |
Abbreviations
| WBT | wet-bulb temperature (°C) |
| IEC | indirect evaporative cooler |
| DEC | direct evaporative cooler |
| LD | liquid desiccant |
| VAV | variable air volume |
| IDECOAS | indirect and direct evaporative cooler assisted 100% outdoor air system |
| LD-IDECOAS | evaporative cooler assisted 100% outdoor air system integrated with liquid desiccant system |
| OA | outdoor air |
| RA | return air |
| SA | supply air |
| EA | exhaust air |
| SHE | sensible heat exchanger |
| LiBr | lithium bromide |
Greek symbols
| effectiveness (%) |
Subscripts
| cooling coil | |
| cooling tower | |
| equilibrium | |
| heating coil | |
| regeneration part | |
| system | |
| reheating coil |
References
- Kim, M.H.; Choi, A.S.; Jeong, J.W. Energy performance of an evaporative cooler assisted 100% outdoor air system in the heating season operation. Energy Build. 2012, 49, 402–409. [Google Scholar] [CrossRef]
- Kim, M.H.; Kim, J.H.; Kwon, O.H.; Choi, A.S.; Jeong, J.W. Energy conservation potential of an indirect and direct evaporative cooling assisted 100% outdoor air system. Build. Serv. Eng. Res. Technol. 2011, 32, 345–360. [Google Scholar] [CrossRef]
- Kim, M.H.; Jeong, J.W. Cooling performance of a 100% outdoor air system integrated with indirect and direct evaporative coolers. Energy 2013, 52, 245–257. [Google Scholar] [CrossRef]
- Gilani, N.; Poshtiri, A.H. Thermal design of two-stage evaporative cooler based on thermal comfort criterion. Heat Mass Transf. 2017, 53, 1355–1374. [Google Scholar] [CrossRef]
- Chua, K.J.; Xu, J.; Cui, X.; Ng, K.C.; Islam, M.R. Numerical heat and mass transfer analysis of a cross-flow indirect evaporative cooler with plates and flat tubes. Heat Mass Transf. 2016, 52, 1765–1777. [Google Scholar] [CrossRef]
- Chen, Y.; Yin, Y.; Zhang, X. Experimental Analysis of Direct Evaporative Cooling in Special Temperature Range and Extended Application Study. In Proceedings of the 8th International Symposium on Heating, Ventilation and Air Conditioning; Springer: Berlin, Germany, 2013; pp. 399–410. [Google Scholar]
- Lotfizadeh, H.; Layeghi, M. Design and performance analysis of a small solar evaporative cooler. Energy Effic. 2014, 7, 55–64. [Google Scholar] [CrossRef]
- Cannistraro, G.; Cannistraro, M.; Restivo, R. The local media radiant temperature for the calculation of comfort in areas characterized by radiant surfaces. ResearchGate 2015, 33, 115–122. [Google Scholar] [CrossRef]
- Cannistraro, G.; Cannistraro, M.; Restivo, R. Smart control of air climatization system in function on the values of mean local radiant temperature. Smart Sci. 2015, 3, 157–163. [Google Scholar] [CrossRef]
- Jain, S.; Tripathi, S.; Das, R.S. Experimental performance of a liquid desiccant dehumidification system under tropical climates. Energy Convers. Manag. 2011, 52, 2461–2466. [Google Scholar] [CrossRef]
- Goetzler, W.; Zogg, R.; Young, J.; Johnson, C. Energy Saving Potential and RD&D Opportunities for Non-Vapor-Compression HVAC Technologies; Navigant Consulting, Inc., U.S Department of Energy: Burlington, VT, USA, 2014. [Google Scholar]
- Khalid Ahmed, C.S.; Gandhidasan, P.; Al-Farayedhi, A.A. Simulation of a hybrid liquid desiccant based air-conditioning system. Appl. Therm. Eng. 1997, 17, 125–134. [Google Scholar] [CrossRef]
- Katejanekarn, T.; Kumar, S. Performance of a solar-regenerated liquid desiccant ventilation pre-conditioning system. Energy Build. 2008, 40, 1252–1267. [Google Scholar] [CrossRef]
- Gommed, K.; Grossman, G. Experimental investigation of a liquid desiccant system for solar cooling and dehumidification. Sol. Energy 2007, 81, 131–138. [Google Scholar] [CrossRef]
- Odgaard, O. China’s Quest for New District Heating Reforms. 2015. Available online: http://www.thinkchina.ku.dk/documents/2015-12-01ThinkChina_PolicyBrief_DH_and_CHP_in_China.pdf (accessed on 1 December 2017).
- Cannistraro, G.; Cannistraro, M.; Cannistraro, A.; Galvagno, A.; Trovato, G. Evaluation on the convenience of a citizen service district heating for residential use. A new scenario introduced by high efficiency energy systems. Heat Technol. 2015, 33, 167–172. [Google Scholar] [CrossRef]
- Kim, M.H.; Park, J.S.; Jeong, J.W. Energy saving potential of liquid desiccant in evaporative-cooling-assisted 100% outdoor air system. Energy 2013, 59, 726–736. [Google Scholar] [CrossRef]
- Kim, M.H.; Park, J.Y.; Sung, M.K.; Choi, A.S.; Jeong, J.W. Annual operating energy savings of liquid desiccant and evaporative-cooling-assisted 100% outdoor air system. Energy Build. 2014, 76, 538–550. [Google Scholar] [CrossRef]
- Shin, J.H.; Park, J.Y.; Jo, M.K.; Choi, A.S.; Jeong, J.W. Impact of heat pump-driven liquid desiccant dehumidification on the energy performance of an evaporative cooling-assisted air conditioning system. Energies 2018, 11, 345. [Google Scholar] [CrossRef]
- Park, J.Y.; Jeong, J.W. Operating energy savings of a liquid desiccant and evaporative cooling-assisted air handling system in marine applications. Energies 2017, 10, 487. [Google Scholar] [CrossRef]
- Duan, Z.; Zhao, X.; Zhan, C.; Dong, X.; Chen, H. Energy saving potential of a counter-flow regenerative evaporative cooler for various climates of China: Experiment-based evaluation. Energy Build. 2017, 148, 199–210. [Google Scholar] [CrossRef]
- ASHRAE Handbook; American Society of Heating, Refrigerating and Air-Conditioning Engineers, Inc.: Atlanta, GA, USA, 2015.
- Department of Construction of the PRC. Thermal Design Code for Civil Building-GB 50176-1993; China Plan Press: Beijing, China, 1993.
- Klein, S.A.; Beckman, W.A.; Mitchell, J.W.; Duffie, J.A. TRNSYS 17—A Transient System Simulation Program; User Manual; Solar Energy Laboratory, University of Wisconsin-Madison: Madison, WI, USA, 2009. [Google Scholar]
- GB 50189-2015, Design Standard for Energy Efficiency of Public Buildings; Ministry of Housing and Urban-Rural Development of China: Beijing, China, 2015.
- Design Code for Office Building, JGJ67-2006; Ministry of Construction of the People’s Republic of China Zhejiang: Hangzhou, China, 2006.
- Kim, M.H.; Ham, S.W.; Park, J.S.; Jeong, J.W. Impact of integrated hot water cooling and desiccant-assisted evaporative cooling systems on energy savings in a data center. Energy 2014, 78, 384–396. [Google Scholar] [CrossRef]
- Kim, M.H.; Park, J.Y.; Ham, S.W.; Jeong, J.W. Energy conservation benefit of water-side free cooling in a liquid desiccant and evaporative cooling-assisted 100% outdoor air system. Energy Build. 2015, 104, 302–315. [Google Scholar] [CrossRef]
- Ham, S.W.; Lee, S.J.; Jeong, J.W. Operating energy savings in a liquid desiccant and dew point evaporative cooling-assisted 100% outdoor air system. Energy Build. 2016, 78, 535–552. [Google Scholar] [CrossRef]
- Fumo, N.; Goswami, D.Y. Study of an aqueous lithium chloride desiccant system: Air dehumidification and desiccant regeneration. Sol. Energy 2002, 72, 351–361. [Google Scholar] [CrossRef]
- Chung, T.W.; Luo, C.M. Vapor pressure of the aqueous desiccants. J. Chem. Eng. Data 1999, 44, 1024–1027. [Google Scholar] [CrossRef]
- Martin, V.; Goswami, D.Y. Effectiveness of heat and mass transfer processes in a packed bed liquid desiccant dehumidifier/regenerator. HVAC R Res. 2000, 6, 21–39. [Google Scholar] [CrossRef]
- Katejanekarn, T.; Chirarattananon, S.; Kumar, S. An experimental study of a solar-regenerated liquid desiccant ventilation pre-conditioning system. Sol. Energy 2009, 83, 920–933. [Google Scholar] [CrossRef]
- Klein, S.A.; Alvarado, F.L. EES-Engineering Equation Solver for Microsoft Windows Operating Systems, F-Chart Software. 2008. Available online: http://www.fchart.com/ees/ (accessed on 26 October 2017).
- GB/T 2589-2008. General Principles for Calculation of the Comprehensive Energy Consumption. 2008. Available online: https://infostore.saiglobal.com/en-au/standards/gb-t-2589-2008-1082209/ (accessed on 3 February 2018).


| City | Beijing | Guangzhou | Urumqi | Shanghai | Kunming | Xi’an | |
|---|---|---|---|---|---|---|---|
| Parameters | |||||||
| Location | Guangzhou, China | ||||||
| Area | 300 m2 | ||||||
| Window-to-wall ratio (GB50189-2015) | 0.3(0.8) | 0.3(0.8) | 0.3(0.8) | 0.3(0.8) | 0.3(0.8) | 0.3(0.8) | |
| Indoor condition (JGJ67-2006) | Cooling season | 26 °C, 0% (relative humidity) | |||||
| Heating season | 18 °C, 0% (relative humidity) | ||||||
| Internal heat gain | People (number of persons) | 15 | |||||
| Computer (W) | 230 | ||||||
| Lighting (W/m2) | 13 | ||||||
| U-values (W/m2K) | Roof | 0.45 | 0.5 | 0.35 | 0.4 | 0.5 | 0.45 |
| Exterior wall | 0.5 | 0.8 | 0.43 | 0.6 | 0.8 | 0.5 | |
| Window | 2.7 | 4.0 | 2.6 | 3.0 | 4.0 | 2.7 | |
| Dehumidification | 4.58208 | −0.159174 | 0.0072594 | −18.3816 | −18.3816 | 0.5661 |
| Regeneration | 16.294 | −0.8893 | 0.01927 | 74.3 | −1.8035 | −0.01875 |
| Dehumidification | 21.312 | −0.666 | 0.01332 | |||
| Regeneration | −226.4 | 7.49 | −0.039 |
| Energy Type | Transfer Factor () |
|---|---|
| Electrical energy | 0.1229 |
| Thermal energy (district heating) | 0.0095 |
© 2018 by the authors. Licensee MDPI, Basel, Switzerland. This article is an open access article distributed under the terms and conditions of the Creative Commons Attribution (CC BY) license (http://creativecommons.org/licenses/by/4.0/).
Share and Cite
Li, S.; Jeong, J.-W. Energy Performance of Liquid Desiccant and Evaporative Cooling-Assisted 100% Outdoor Air Systems under Various Climatic Conditions. Energies 2018, 11, 1377. https://doi.org/10.3390/en11061377
Li S, Jeong J-W. Energy Performance of Liquid Desiccant and Evaporative Cooling-Assisted 100% Outdoor Air Systems under Various Climatic Conditions. Energies. 2018; 11(6):1377. https://doi.org/10.3390/en11061377
Chicago/Turabian StyleLi, Shiying, and Jae-Weon Jeong. 2018. "Energy Performance of Liquid Desiccant and Evaporative Cooling-Assisted 100% Outdoor Air Systems under Various Climatic Conditions" Energies 11, no. 6: 1377. https://doi.org/10.3390/en11061377
APA StyleLi, S., & Jeong, J.-W. (2018). Energy Performance of Liquid Desiccant and Evaporative Cooling-Assisted 100% Outdoor Air Systems under Various Climatic Conditions. Energies, 11(6), 1377. https://doi.org/10.3390/en11061377