Article

Comparing Urban and Rural Household CO2 Emissions—Case from China’s Four Megacities: Beijing, Tianjin, Shanghai, and Chongqing

1
Key Laboratory of Virtual Geographic Environment for the Ministry of Education, Nanjing Normal University, Nanjing 210023, China
2
Jiangsu Center for Collaborative Innovation in Geographical Information Resource Development and Application, Nanjing 210023, China
3
School of Economics & Management, Beihang University, Beijing 100191, China
4
International Institute for Applied Systems Analysis, Schossplatz 1, A-2361 Laxenburg, Austria
5
Institutes of Science and Developments, Chinese Academy of Sciences, Beijing 100190, China
*
Authors to whom correspondence should be addressed.
Energies 2018, 11(5), 1257; https://doi.org/10.3390/en11051257
Submission received: 3 May 2018 / Revised: 8 May 2018 / Accepted: 10 May 2018 / Published: 15 May 2018
(This article belongs to the Special Issue Modeling and Simulation of Carbon Emission Related Issues)

Abstract

:
CO2 emissions caused by household consumption have become one of the main sources of greenhouse gas emissions. Studying household CO2 emissions (HCEs) is of great significance to energy conservation and emissions reduction. In this study, we quantitatively analyzed the direct and indirect CO2 emissions by urban and rural households in Beijing, Tianjin, Shanghai, and Chongqing. The results show that urban total HCEs are larger than rural total HCEs for the four megacities. Urban total per capita household CO2 emissions (PHCEs) are larger than rural total PHCEs in Beijing, Tianjin, and Chongqing, while rural total PHCEs in Shanghai are larger than urban total PHCEs. Electricity and hot water production and supply was the largest contributor of indirect HCEs for both rural and urban households. Beijing, Tianjin, Shanghai, and Chongqing outsourced a large amount of indirect CO2 emissions to their neighboring provinces.

1. Introduction

CO2 is increasing rapidly due to human activities. Cities are related to about 70–80% of the global carbon emissions: as the main locus of human economic activities and energy consumption, cities play an important role in implementing carbon reduction policies [1,2,3]. Inhabitants of cities are a key driving force of greenhouse gas (GHG) emissions due to global urbanization development [4]. Biesiot and Noorman [5] proposed that “most of the environmental load in an economy can be allocated to households”. The consumption of goods and services in households plays a key role for energy use and CO2 emissions, especially for developing countries [6]. The activities of consumers (i.e., personal transportation, personal services, and homes) accounts for 45–55% of total energy consumption [7]. Among the key determinants of household energy requirements are socio-economic, demographic, geographic and residential factors [8,9]. Therefore, the consumption patterns of households differ widely within countries, because household characteristics vary (e.g., personal income, household size and related age, the level of education). These factors usually indicate variance in rural and urban areas, meaning that the trajectory of energy consumption in these areas is different [10]. As such, it is significant to study urban and rural energy consumption and CO2 emissions at a city scale.
China has promised to achieve peak CO2 emissions around 2030 and to make their best efforts to achieve this goal earlier (National Development & Reform Commission of China, 2015). Given that China’s regions have different resource endowments, energy structures, and economic development levels, China has delegated emissions reduction targets to the lower administrative units [11,12]. Tackling global climate change needs to be integrated into city management [13]. Beijing, Tianjin, Shanghai, and Chongqing, as the four municipalities of China, are the economic leaders for other provinces and cities. Thus, these four metropolitan areas’ household CO2 emissions (HCEs) and per capita household CO2 emissions (PHCEs) need to be studied as examples for other provinces to make policies about energy conservation and emission reduction. On the other hand, the existing research on HCEs at a micro level are mostly based on survey data [14], which provides useful and detailed information for community and households. However, the indirect CO2 emissions caused by consuming goods and services have not been considered. Park and Heo [15] quantified the direct and indirect energy use of Korean households from 1980 to 2000 and found that the share of indirect household energy consumption accounts for above 60% of the total energy consumption. Markaki et al. [16] found that indirect emissions of Greek households accounted for more than 70% of the total carbon footprint. Therefore, it is essential to evaluate the indirect CO2 emissions when making policies for household emission reduction. In addition, due to the characteristics of survey data, the results have great uncertainties. It may be difficult for city planners and policy-makers to establish and implement united environmental practices. In light of the above, we adopted the data from the National Bureau of Statistics and an input–output table in this study to estimate direct and indirect CO2 emissions of urban and rural households in Beijing, Tianjin, Shanghai, and Chongqing.
Household energy consumption is a subject that has attracted considerable scholarly interest. Frequently, studies of household energy consumption, household carbon/CO2 emissions, and household carbon footprints have been springing up. Some scholars made cross-national comparative studies. For example, Reinders et al. [17] investigated both the direct and indirect energy use of households in 11 EU member countries. Sommer and Kratena [18], and Ivanova et al. [19] calculated the household carbon footprint in the EU27. Lenzen et al. [20] comparatively analyzed the energy requirements of the household sector in Australia, Brazil, Denmark, India, and Japan. Maraseni et al. [21] compared the household carbon emissions between China, Canada, and the UK. Kerkhof et al. [6] examined the household CO2 emissions of Netherlands, UK, Sweden, and Norway. Brizga et al. [22] estimated the household CO2 emissions for the three Baltic States (Estonia, Latvia, and Lithuania). Their results show that per capita household CO2 emissions (PHCEs) in developing countries were much lower than developed countries, while the indirect energy consumption in the sectors of housing, food, beverages, and tobacco, and recreation and culture, and hotel, cafes and restaurants vary significantly per country.
Some research based on a national scale has also been widely studied [23,24,25,26,27,28,29,30,31,32]. For instance, Baiocchi et al. [33] pointed out that private households accounted for 75% of the total UK CO2 emissions, whereas China’s household energy consumption was about 25% of the total final energy consumption [34]. With the economic development and improvement of peoples’ living standards, the share of household CO2 emissions is supposed to increase; for example, carbon footprint per household in Norwegian increased by 26% between 1999 and 2012 [35].
There are some household CO2 emissions studies at the micro scale, such as Sydney, Australia [36], Melbourne, Australia [1], Xiamen, China [37], Tianjin, China [38], and Noakhali, Bangladesh [10]. In China, due to the regional differences between economic structure, resource endowment, industry structure, consumption structures and patterns, urban household CO2 emissions in eastern regions were much larger, while the provinces in undeveloped western regions had the smallest carbon footprint [39,40].
The analysis of social structures and their evolution trends could inform the government planners and households [41]. In order to find out the impacts of socio-economic factors on household CO2 emissions, many variables, such as population, affluence, energy intensity, the urbanization level, employment rate, and the share of the tertiary industry, are considered. A large amount of research has shown that household energy requirements, carbon emissions and carbon footprint are closely related to income [42], level of education [43], age [36], gender [38], occupation [14], household size [44], urbanization [45], car ownership [43], urban density [46,47], consumption patterns [48,49], and imports [50]. Different methods, such as index decomposition analysis (IDA) [51], logarithmic mean Divisia index (LMDI) [52], and Stochastic Impacts by Regression on Population, Affluence, and Technology (STIRPAT)model [53,54] were adopted. More discussions can be seen in the review by Zhang et al. [2]. However, the similarities and differences of the direct and indirect HCEs between the urban and rural households are the focus in this study.

2. Materials and Methods

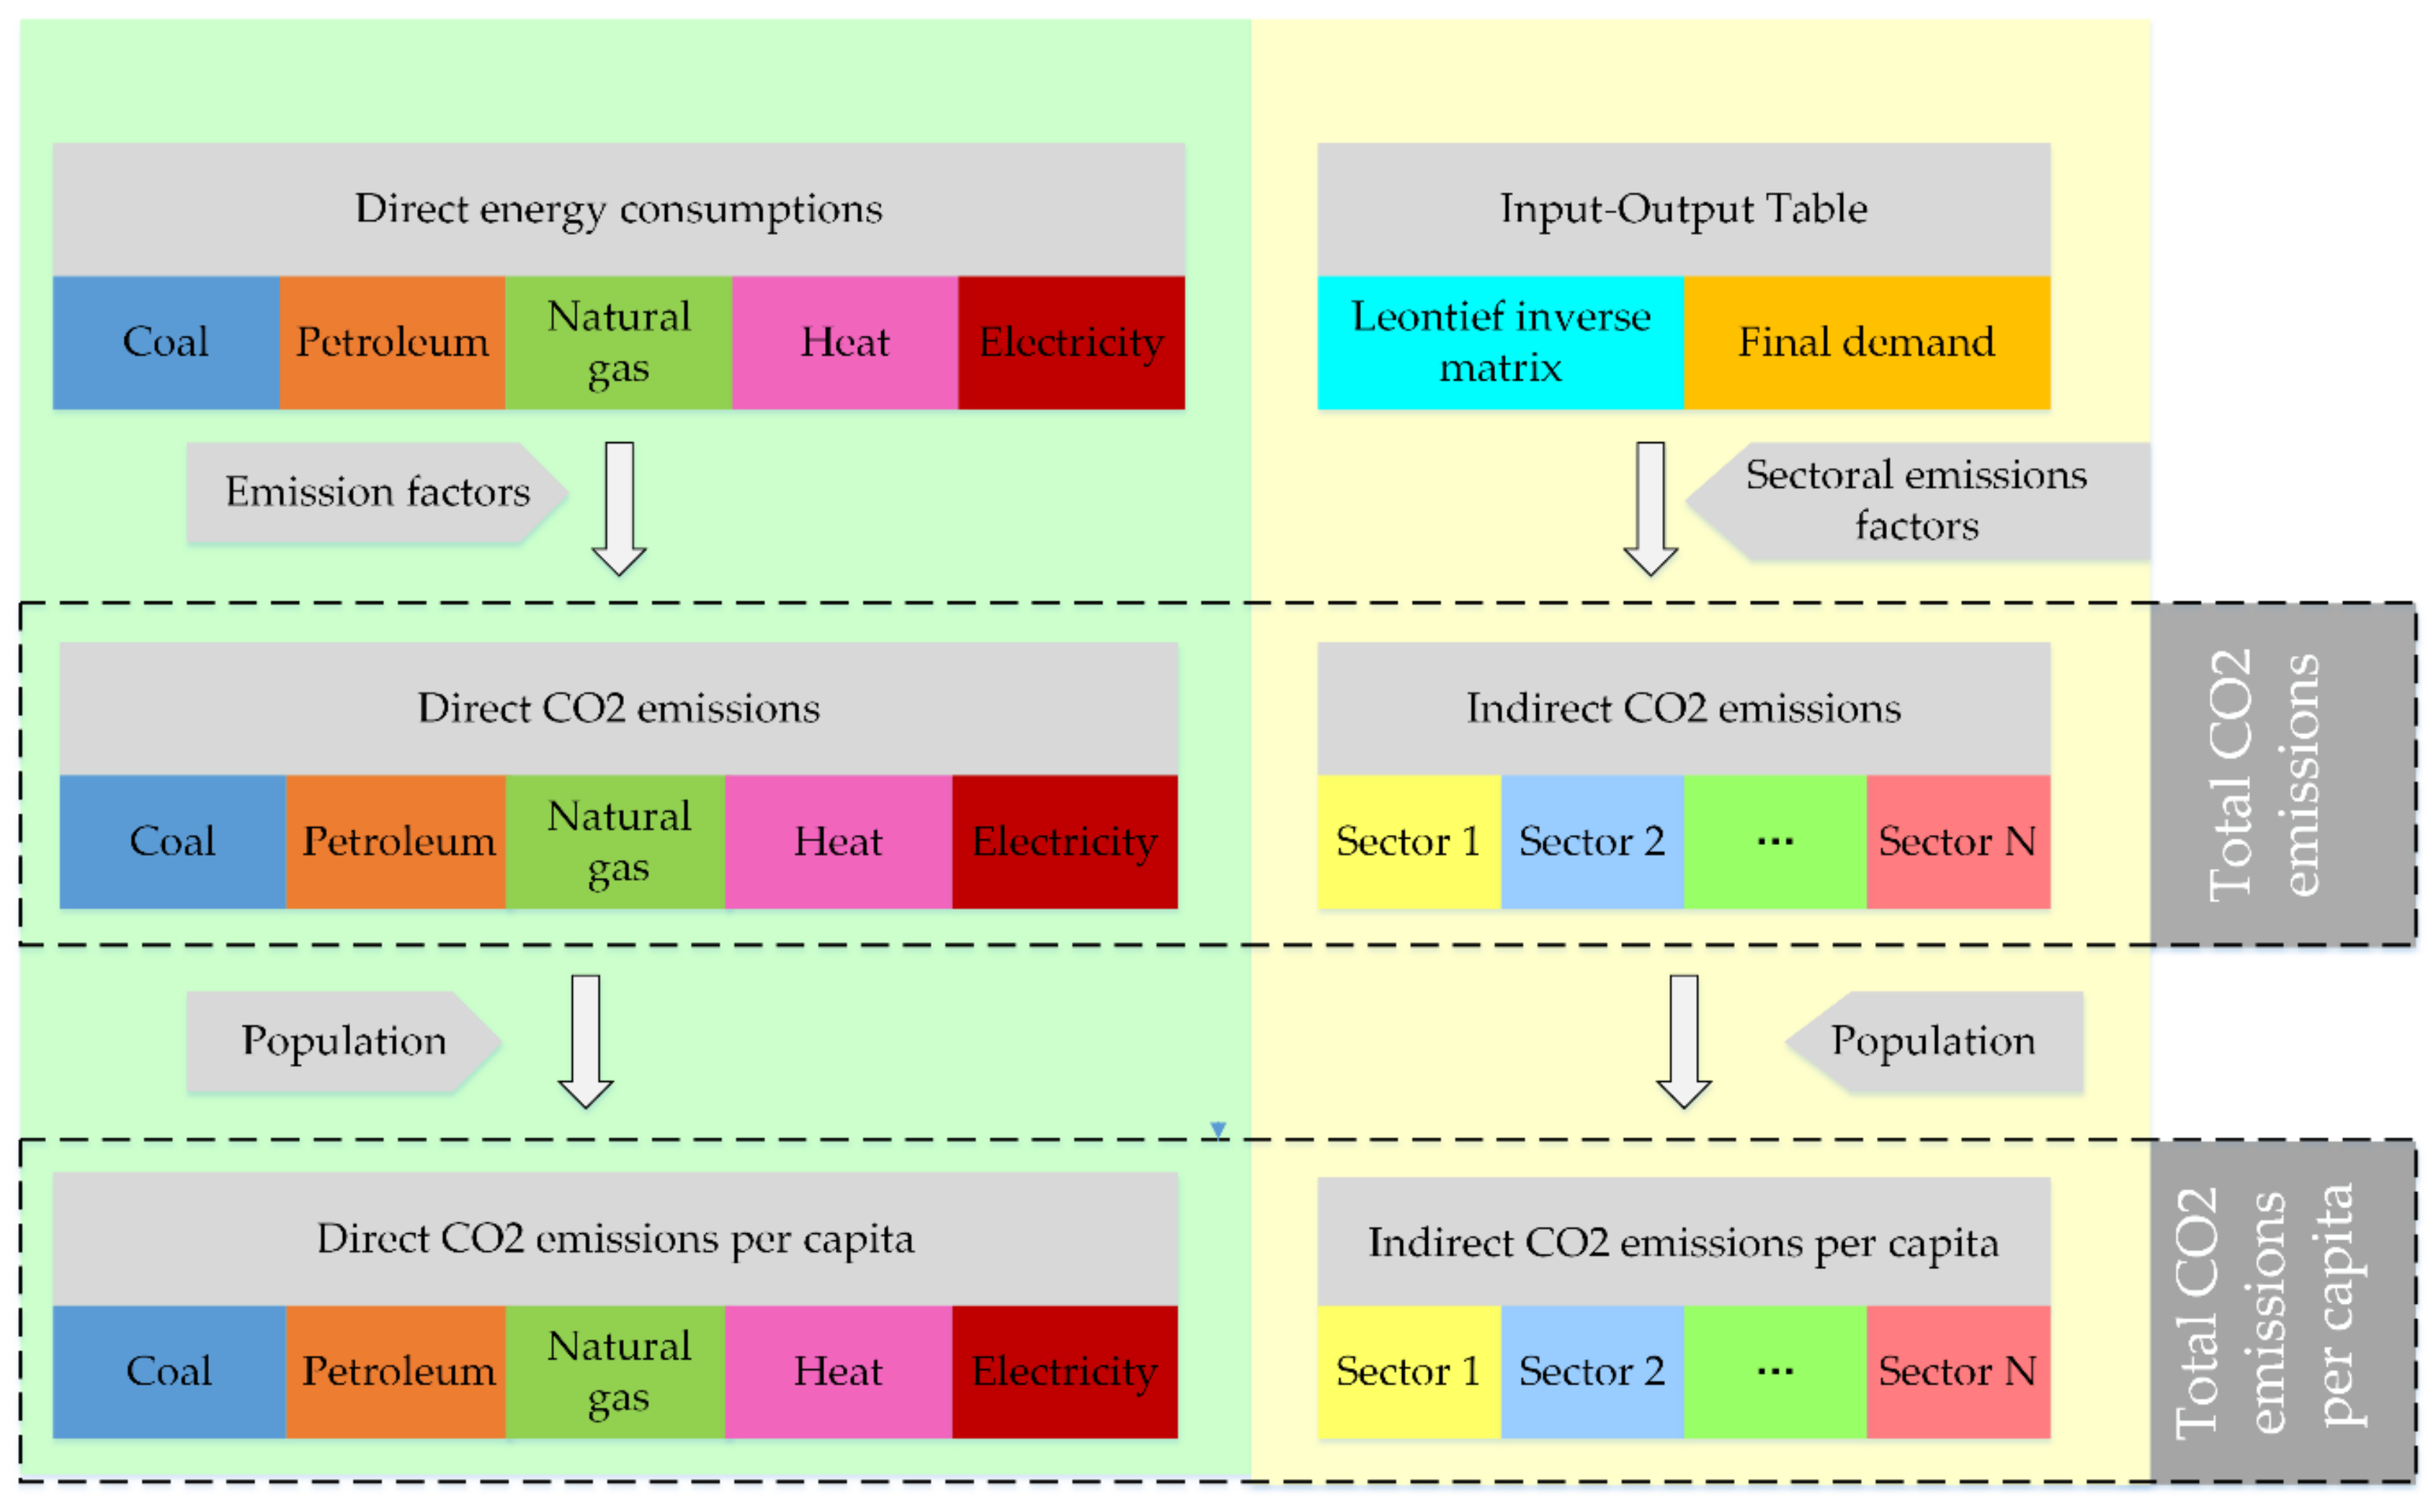
2.1. Household CO2 Emissions

Household CO2 emissions include both direct and indirect components of energy consumption. Direct energy consumption refers to the end use of energy, such as for lighting and space heating. Indirect energy, also referred to as “embodied energy,” is the amount of energy use throughout the production of goods and services used by households [55,56]. The framework of household CO2 emissions accounting is shown in Figure 1.

2.1.1. Direct CO2 Emissions

For direct energy consumption in Beijing’s households, we mainly consider coal, oil, natural gas, electricity, and heat. In order to calculate CO2 emissions for a given energy type, we multiplied its use by a carbon emission coefficient and then added up the results. Expressed mathematically, the procedure is as follows:
D C = i E C i · C o e f i
where D C represents the direct CO2 emissions and E C i denotes direct energy consumption of each energy variety i . C o e f i is the CO2 coefficient for each energy variety i . According to Equation (1), we can calculate the direct CO2 emissions of urban and rural households, respectively.

2.1.2. Indirect CO2 Emissions

Based on the input–output model, a region’s indirect CO2 emissions can be obtained by
I n d C = I n C o e f · ( I A ) 1 · Y
where I n d C denotes the indirect CO2 emissions, I n C o e f is the CO2 coefficient of each sector, I is the identity matrix, A is the intermediate consumption coefficients, and Y is the household final demand.

2.1.3. Total CO2 Emissions

Total CO2 emissions are obtained by summing the direct CO2 emissions and the indirect CO2 emissions, as shown in Equation (3). T C represents the total CO2 emissions for urban or rural households. We calculated both urban and rural households’ CO2 emissions in this study.
T C = D C + I n d C

2.1.4. Total CO2 Emissions Per Capita

Total CO2 emissions per capita are obtained by total CO2 emissions divided by the population:
P C = T C / P
where P C and P denote the PHCEs and population, respectively.

2.2. Data

In this paper, energy consumption data are obtained from the China Energy Statistical Yearbook [57] compiled by the Department of Energy Statistics, National Bureau of Statistics (2008–2016). Direct CO2 coefficients are obtained from the IPCC report as shown in Table 1. Heat value is adjusted according to principles for calculation of total production energy consumption in 2008 in China. The China Multi-Regional Input–Output Table 2007 [58] and 2012 [59] are used to calculate indirect CO2 emissions, including 30 sectors. The indirect CO2 emissions of each province at a sectoral level are obtained from China Emission Account and Datasets (CEADs, http://www.ceads.net/). Population data are from the Beijing Statistical Yearbook (2016) [60], Tianjin Statistical Yearbook (2016) [61], Shanghai Statistical Yearbook (2016) [62], and Chongqing Statistical Yearbook (2016) [63], as shown in Table 2. Due to the lack of data regarding Shanghai’s urban and rural population, its rural population is represented by agricultural population and urban population is obtained by total population minus its agricultural population. Although Beijing and Shanghai municipal governments have adopted the strictest household registration system to control their population, the population still increased to a large extent. For example, Beijing’s urban population increased by 32.6% from 2007 to 2012, while rural population increased by 12.8%.

3. Results

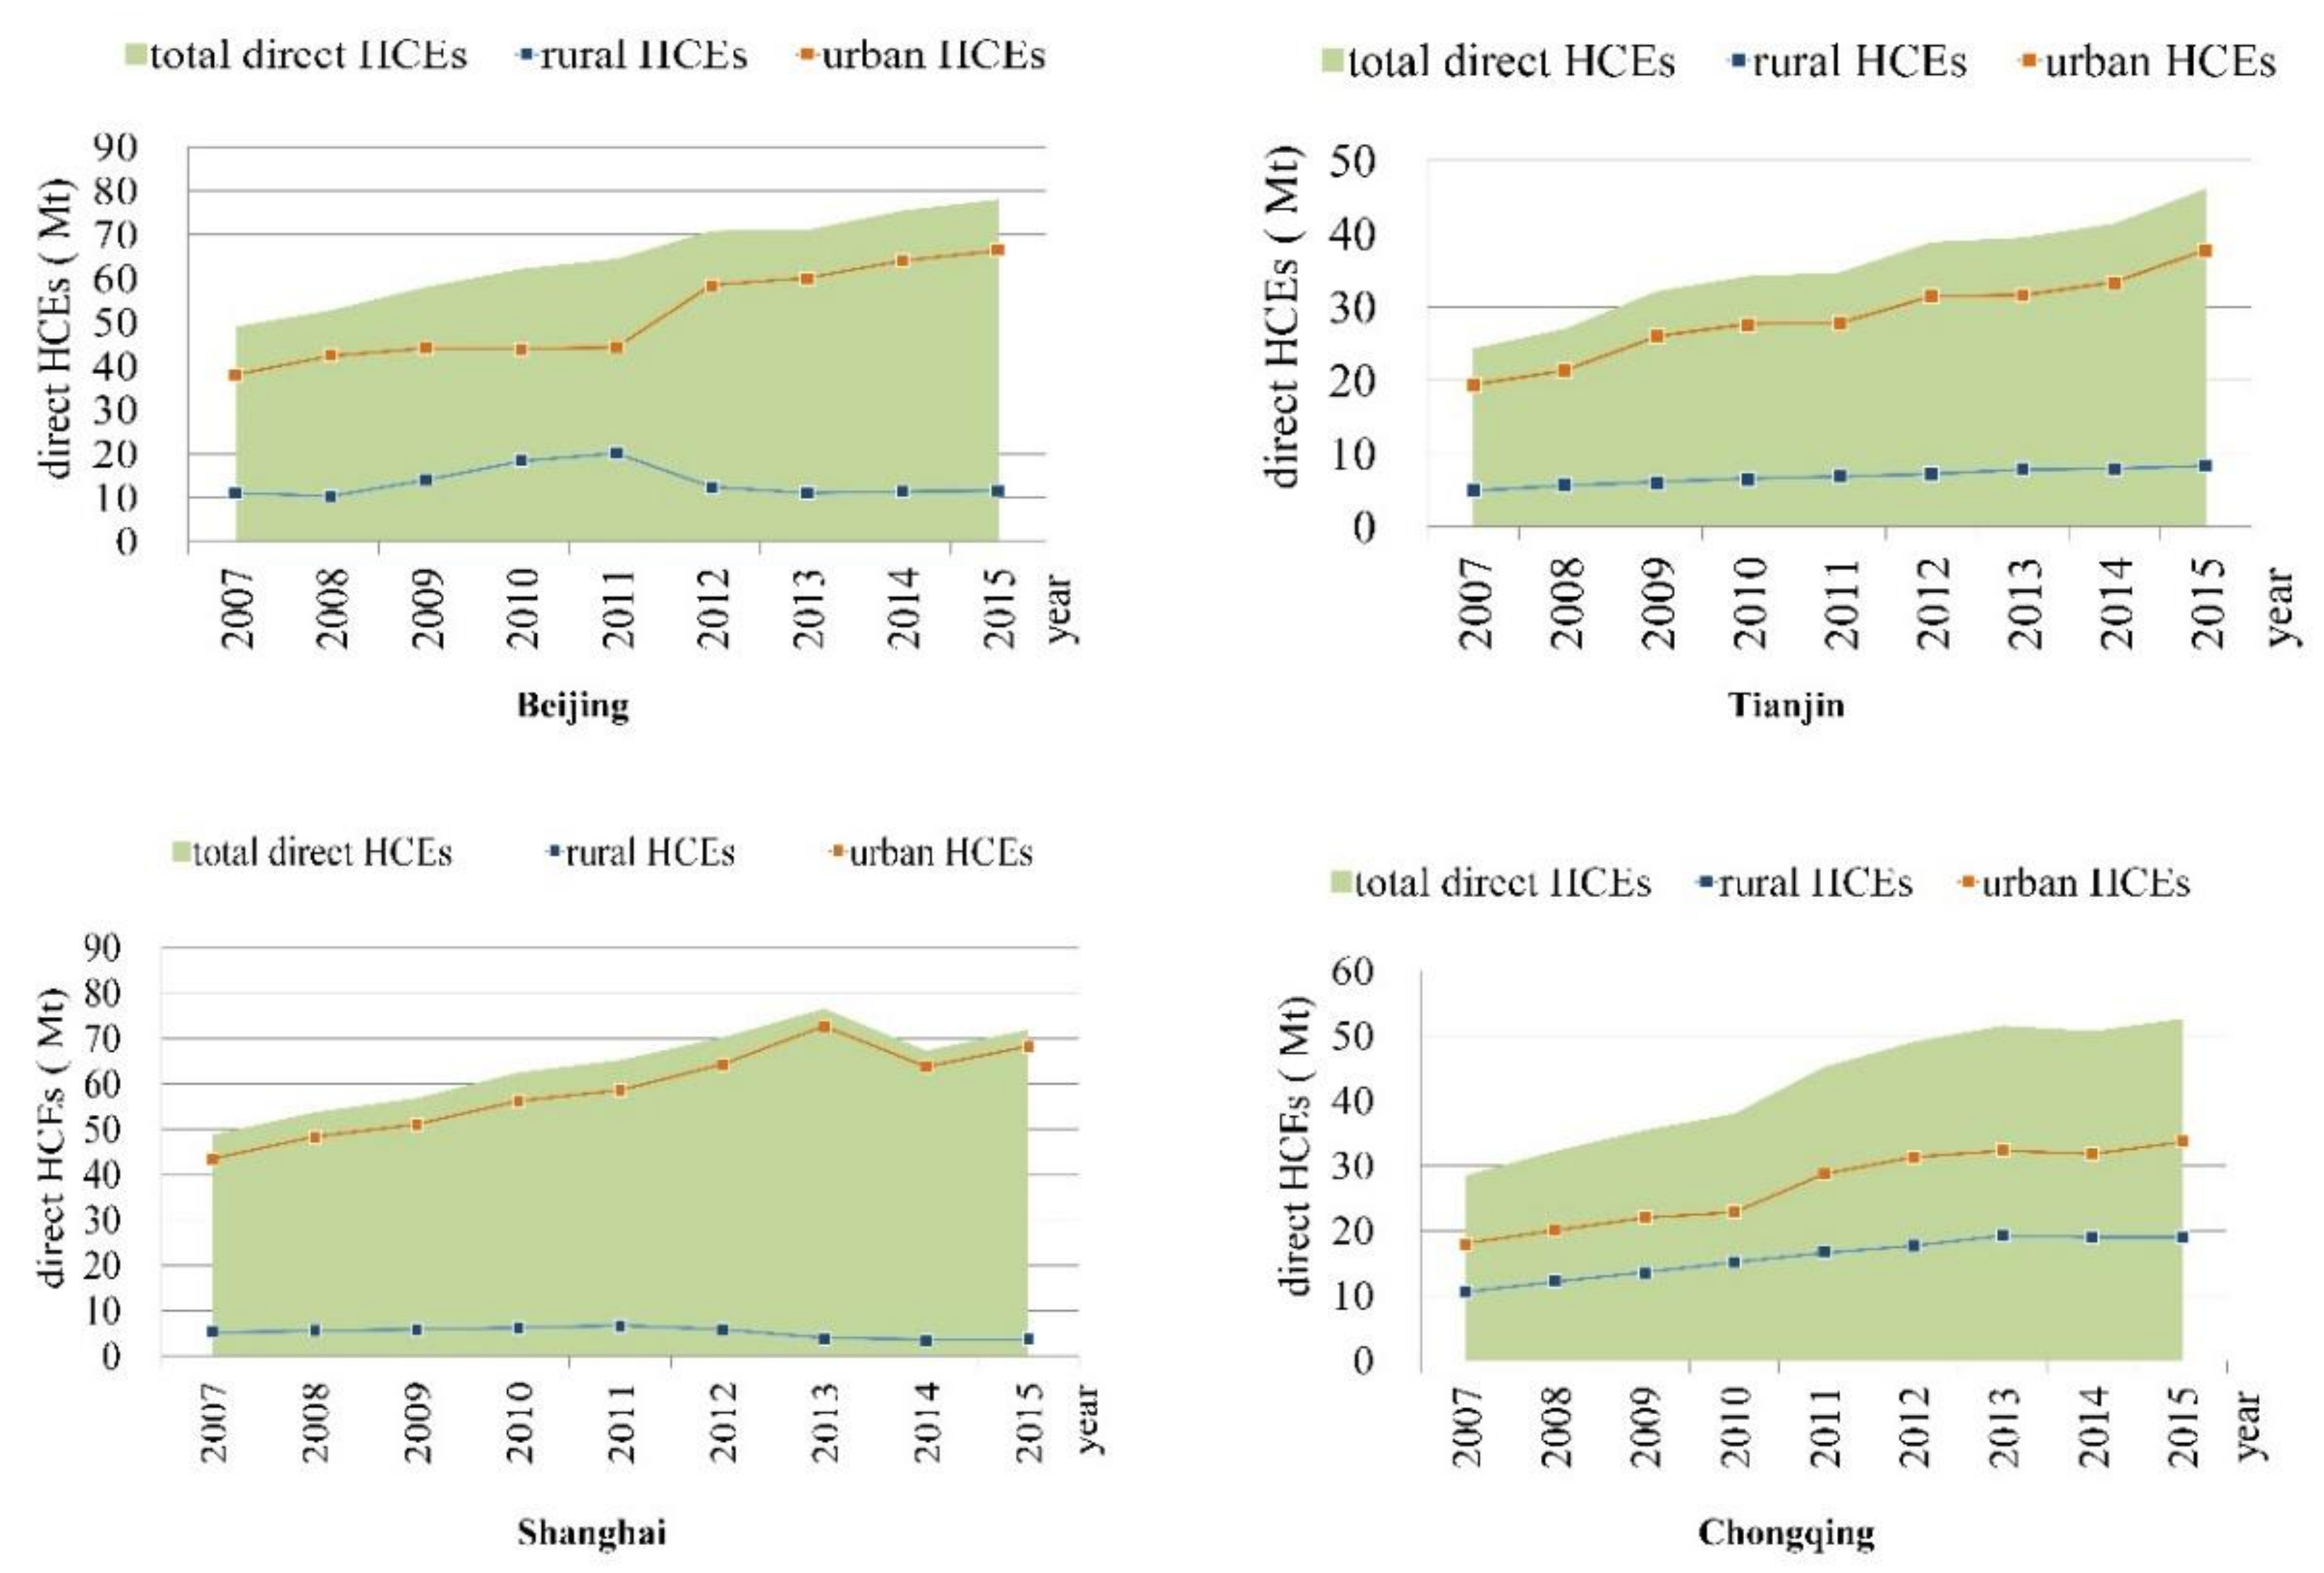
3.1. Urban and Rural Direct HCEs

3.1.1. Direct HCEs

Direct household CO2 emissions (HCEs) of Beijing, Tianjin, Shanghai, and Chongqing are shown in Figure 2. Beijing’s total direct HCEs increased by approximately 60% from 49.1 Mt in 2007 to 78 Mt in 2015. Shanghai’s total direct HCEs increased by approximately 47.7% from 48.7 Mt in 2007 to 71.9 Mt in 2015. The total direct HCEs in Tianjin and Chongqing were smaller than that of Beijing and Shanghai; for example, Tianjin’s total direct HCEs were around 59% of that of Beijing in 2015, and Chongqing’s total direct HCEs were about 73% of that in Shanghai in 2015. However, total direct HCEs of Tianjin and Chongqing increased by 89.8% and 84.2% from 2007 to 2015, respectively.
Urban direct HCEs were much larger than rural direct HCEs for the four megacities; for instance, Shanghai’s urban direct HCEs were more than 18 times larger than rural direct HCEs in 2015, which accounted for about 95% of its total direct HCEs. Beijing’s rural and urban HCEs show different trends. These can be divided into two phases. The first phase is from 2007 to 2011. During this phase, both rural and urban direct HCEs kept a similar increasing trend. However, they have showed different trends since 2012. Urban direct HCEs increased sharply in 2012. After that, they kept increasing steadily. On the contrary, rural direct HCEs declined significantly in 2012, then remained about the same. Tianjin’s urban direct HCEs increased rapidly during 2007–2015 with an annual increase rate of 9%, while the annual increase rate of rural direct HCEs were 7%, whereas Chongqing’s urban and rural direct HCEs kept the same annual increase rate, which was 8%.

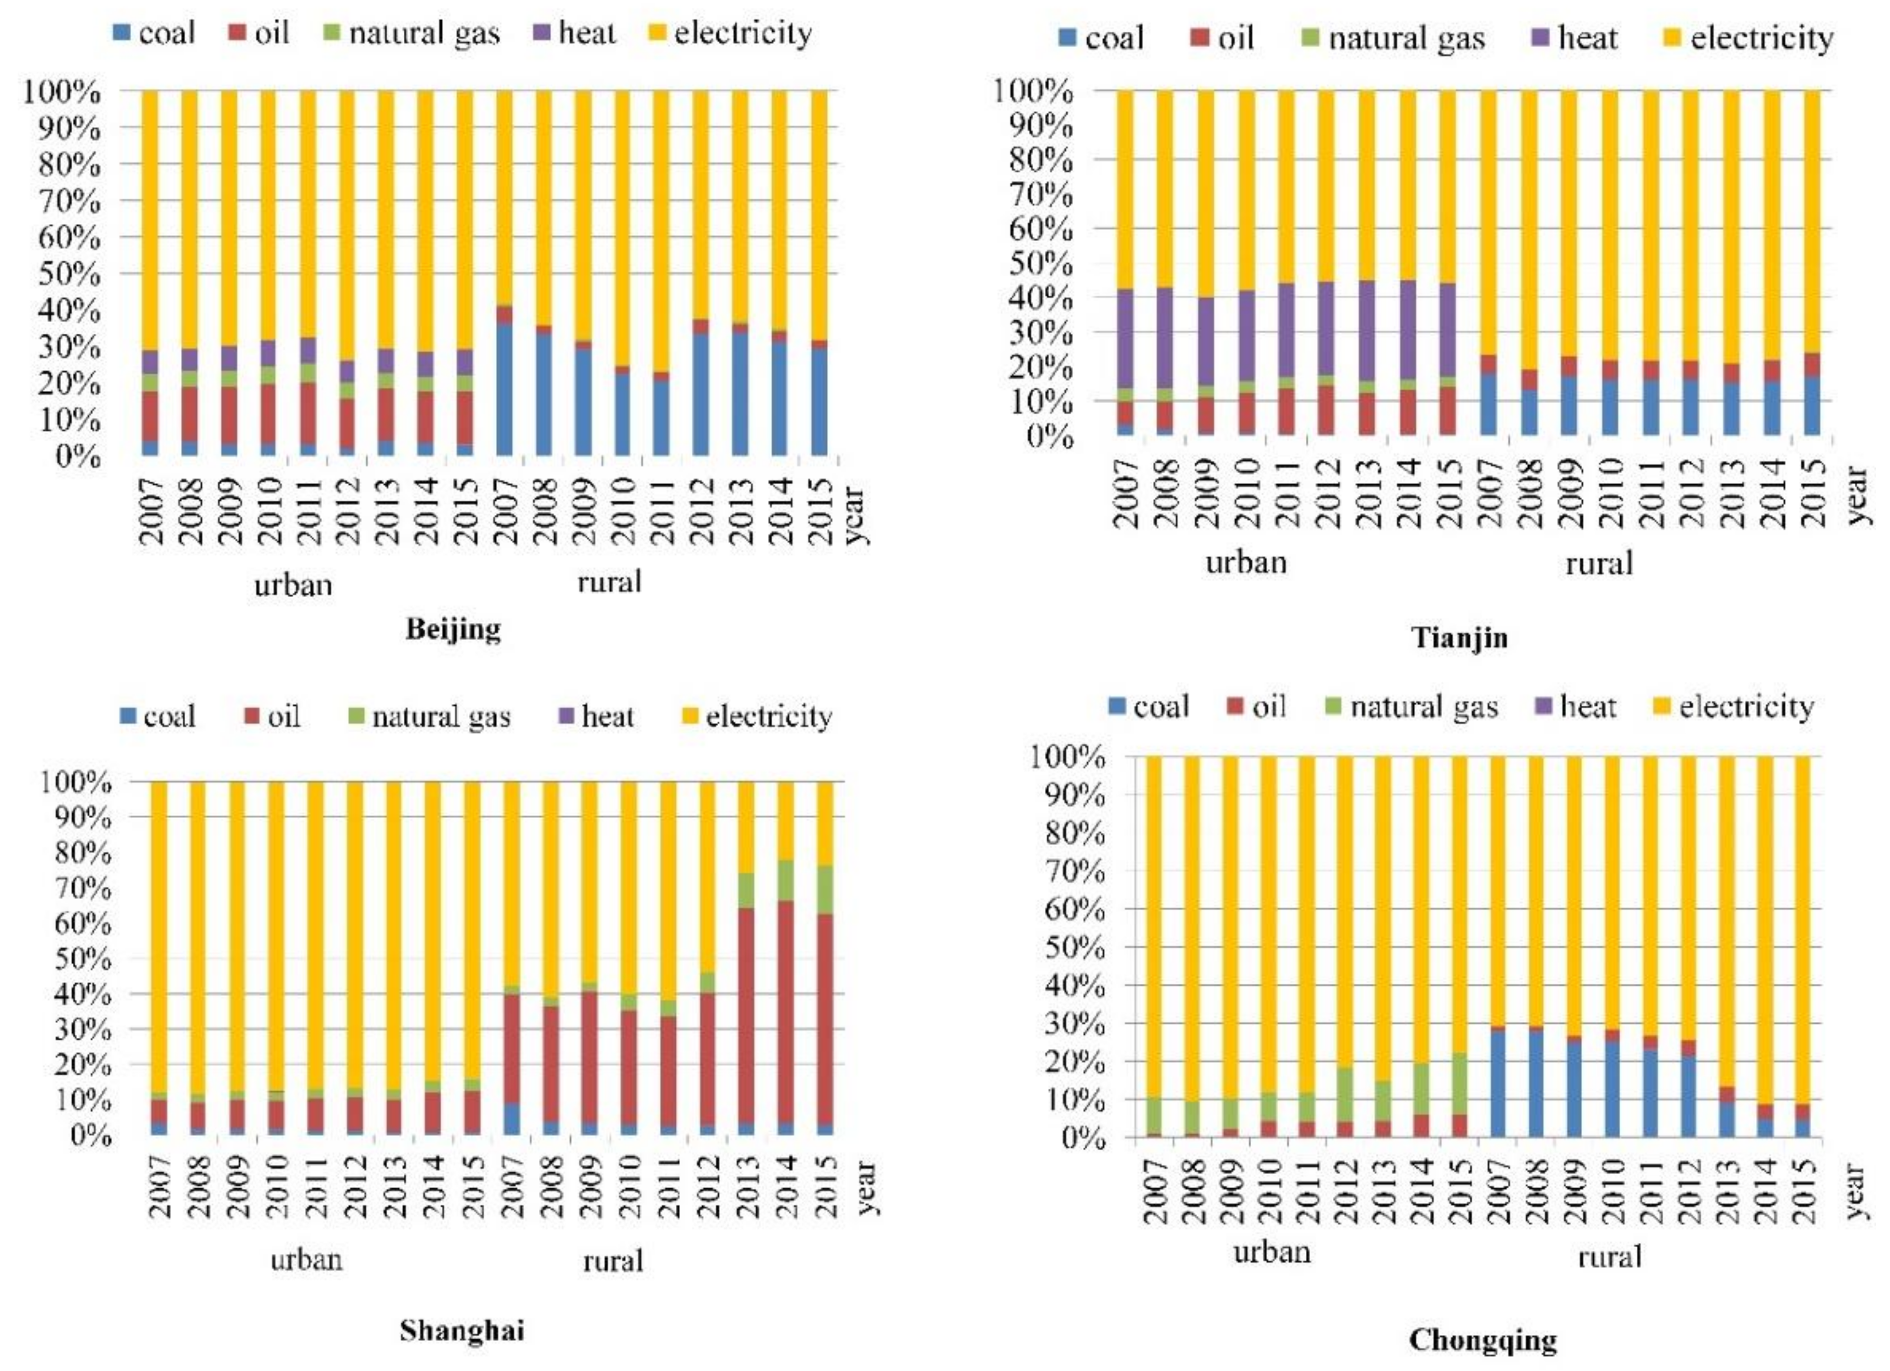
3.1.2. Direct Energy Consumption Structure
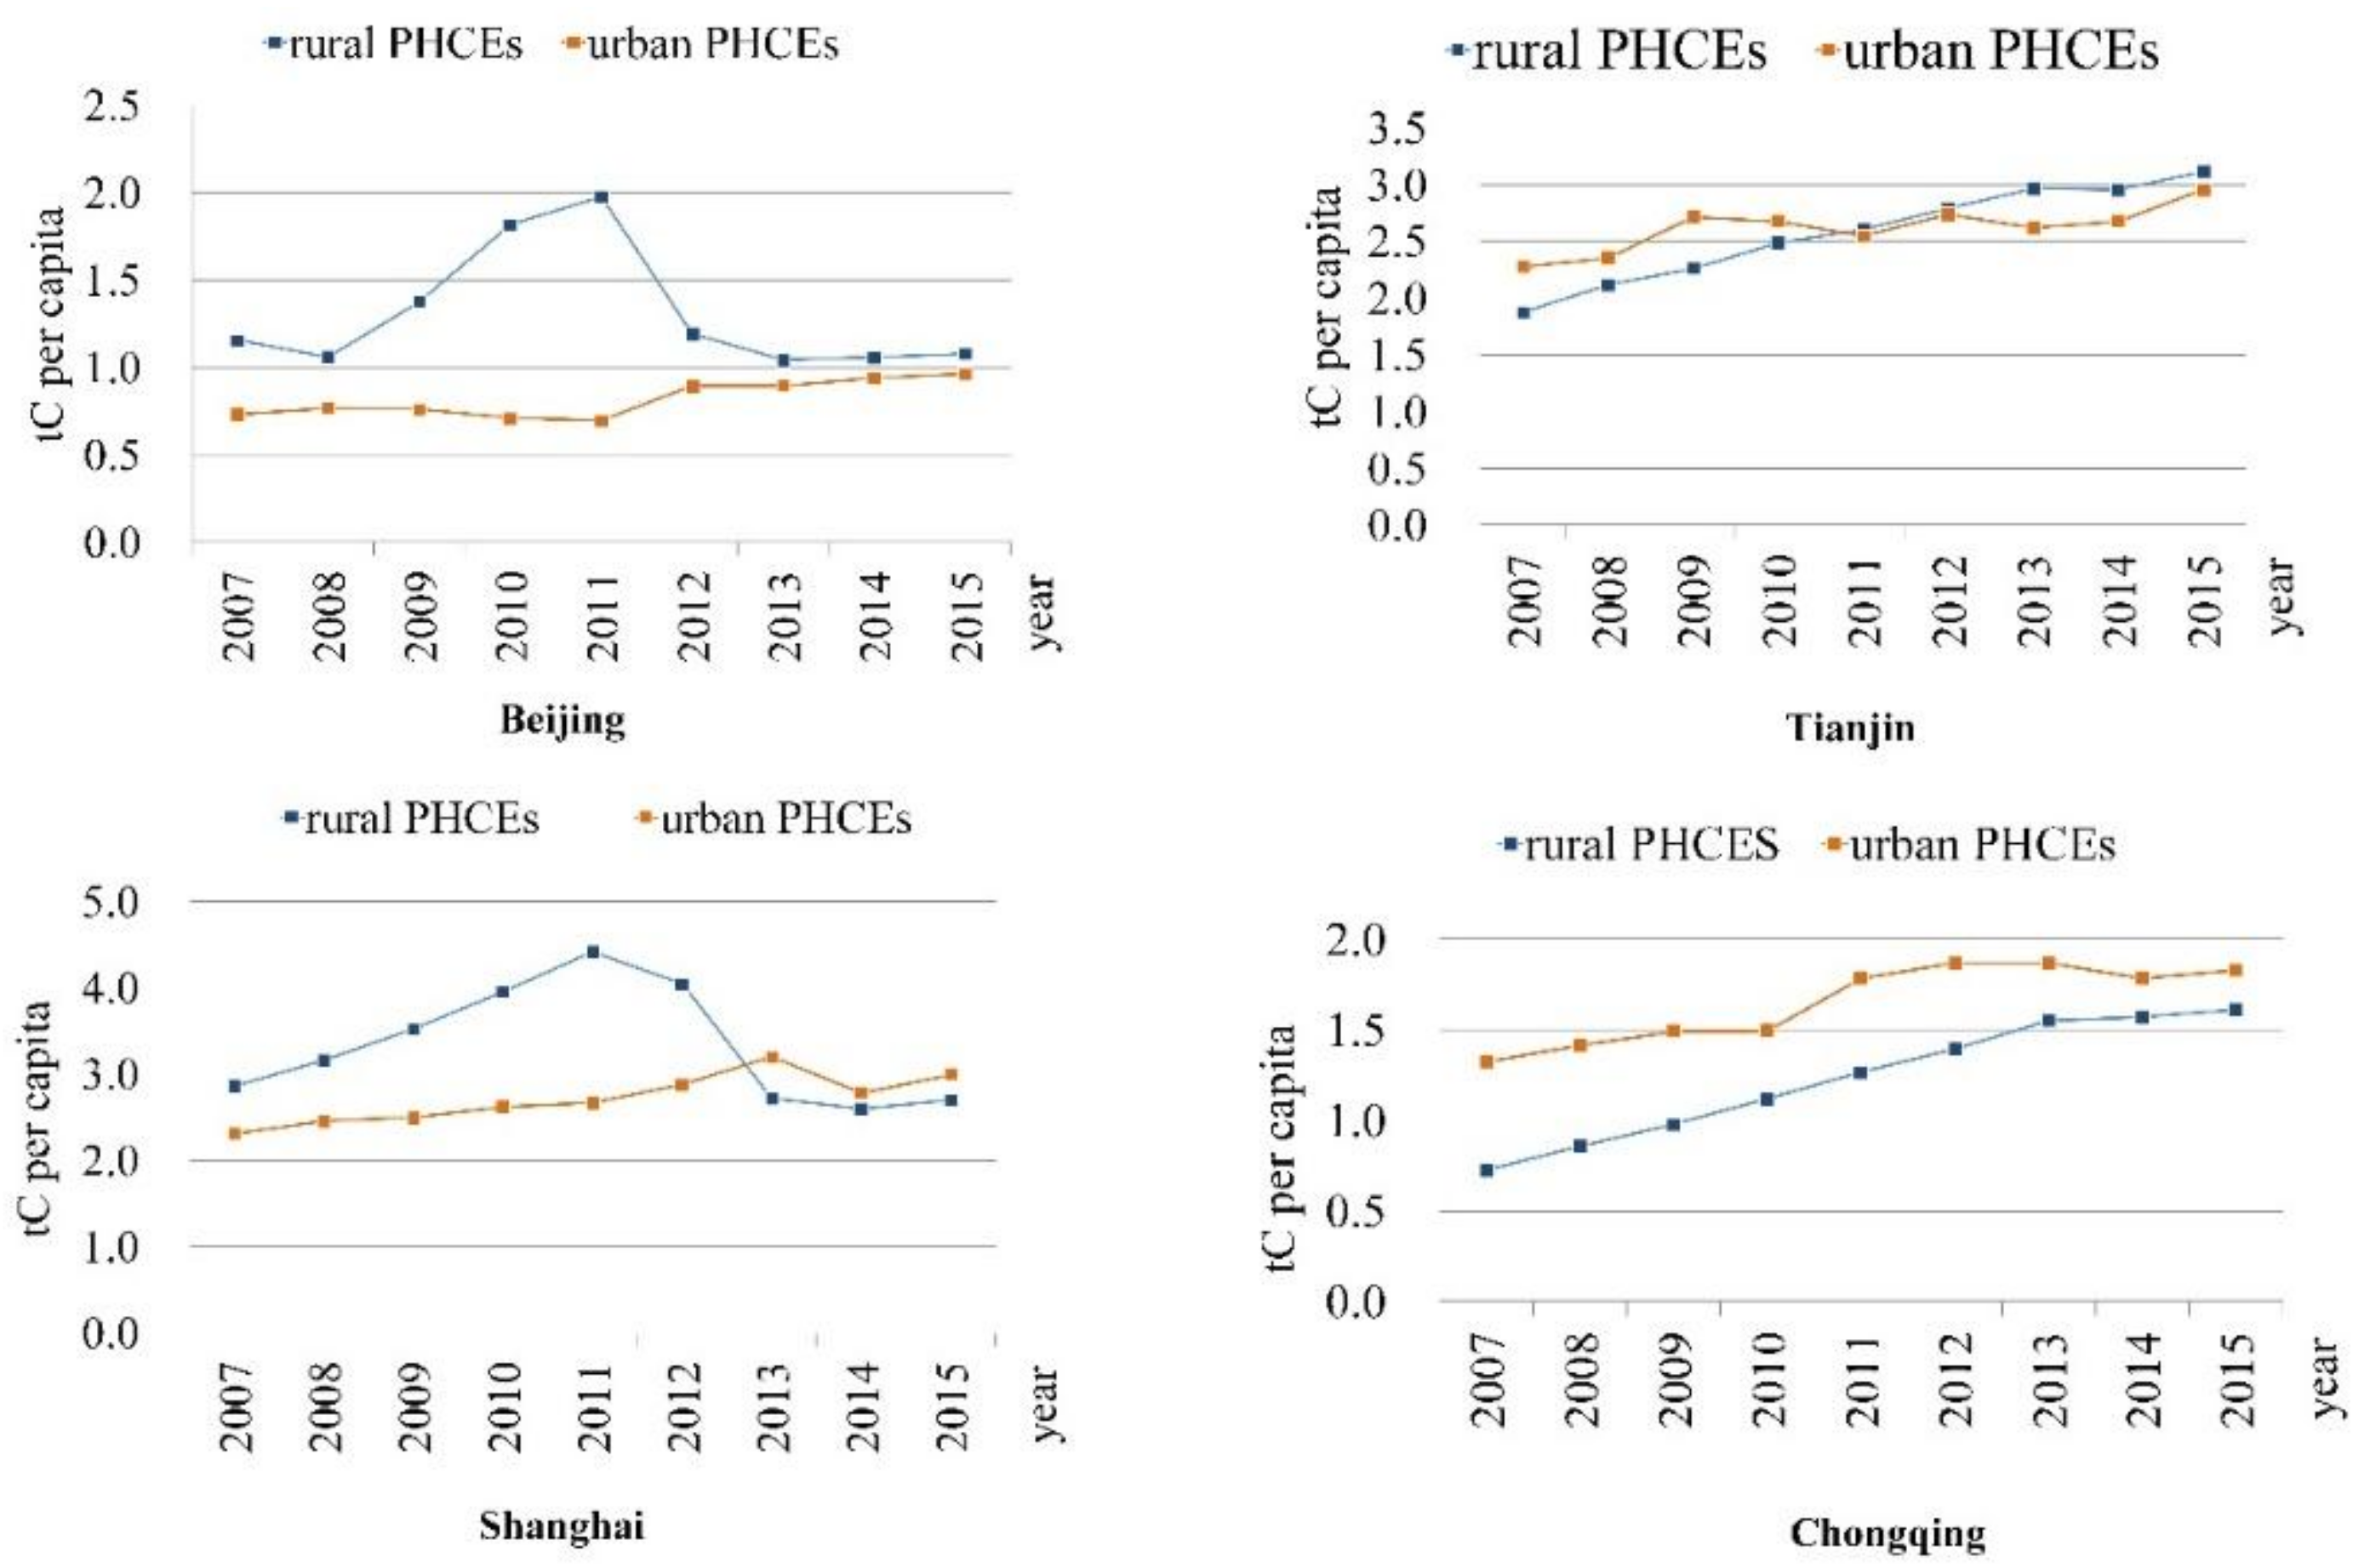
Energy consumption structure for direct HCEs are shown in Figure 3. The energy consumption structure of Beijing’s urban households remained stable from 2007 to 2015. By contrast, rural households’ energy consumption structure had a large fluctuation during 2008–2011. Due to the global financial crisis, coal prices rose sharply [64]. The coal consumption of rural households dropped significantly. In 2011, the share of coal was only 20.6%. After the financial crisis, coal consumption rose and stayed stable with a relatively lower coal price. Heat consumption in Tianjin’s urban households accounted for 26–29% of their total direct energy consumption, which was much higher than Beijing. It is unexpected to find that the oil consumption of Shanghai’s rural households accounted for about one third of their total direct energy consumption. After the financial crisis, the share increased to more than 60%. By contrast, the household energy consumption structure in Chongqing was cleaner.

3.1.3. Direct PHCEs

Direct PHCEs in Beijing, Tianjin, Shanghai, and Chongqing from 2007 to 2015 are shown in Figure 4. It is interesting to find that the direct PHCEs of rural and urban households were getting close in the last three years for the four cities. For example, direct PHCEs of Beijing’s rural households were larger than that of urban households. In 2011, the former was 2.85 times larger than the latter. Since 2012, PHCEs of urban and rural household were about 1 ton of CO2 (tC) per person, which is the smallest. PHCEs of urban and rural households in Tianjin and Shanghai were approximately three times that of Beijing.

3.2. Urban and Rural Indirect HCEs

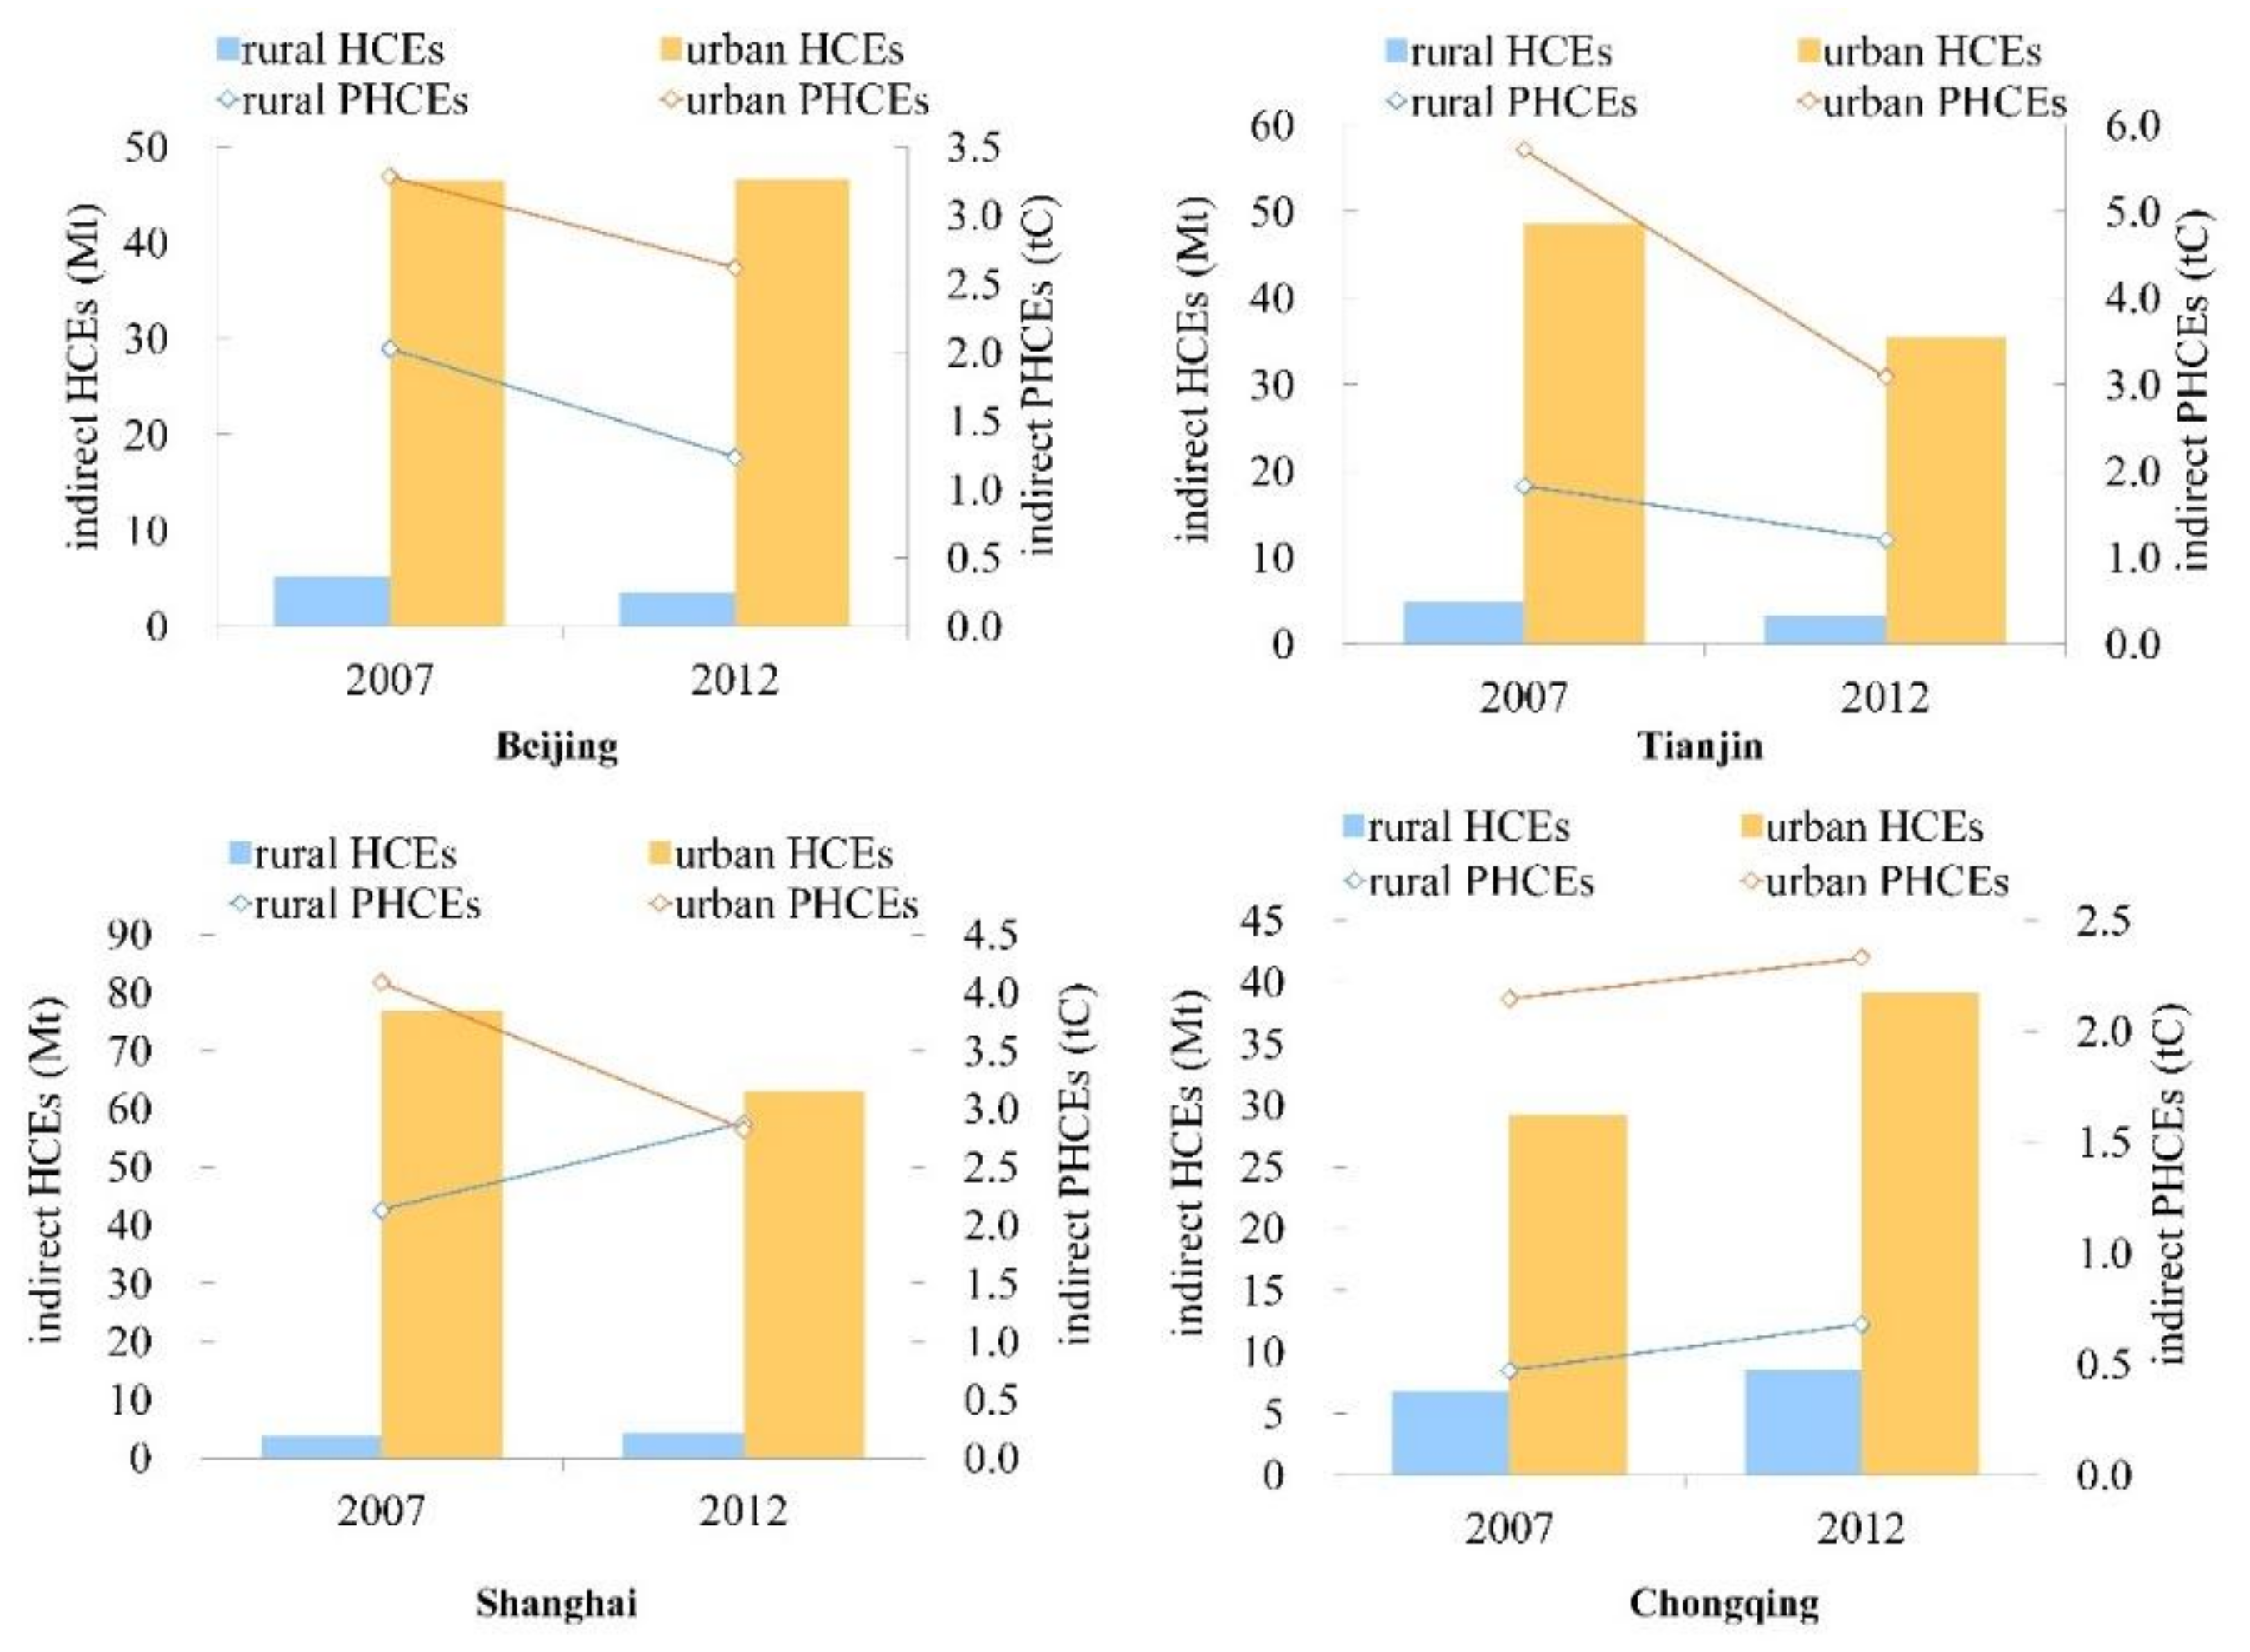
3.2.1. Indirect HCEs and PHCEs

By adding urban and rural indirect HCEs, we can obtain the total indirect HCEs of each city. Total indirect HCEs of Beijing, Tianjin, and Shanghai, respectively, decreased by 2.96%, 27.54%, and 16.67% from 2007 to 2012, while Chongqing’s total indirect HCEs increased by 32.36%. Urban and rural indirect HCEs and PHCEs are shown in Figure 5. We can see that urban indirect HCEs were much larger than that of rural households. For example, Beijing’s urban indirect HCEs were more than 13 times those of rural households in 2015. Chongqing’s urban indirect HCEs were more than four times that of rural households in 2015.
From the perspective of per capita, urban and rural indirect PHCEs of Beijing and Tianjin decreased from 2007 to 2012, while urban and rural indirect PHCEs of Chongqing increased. Urban indirect PHCEs of Shanghai were two times that of rural indirect PHCEs in 2007. However, they were about the same in 2012.

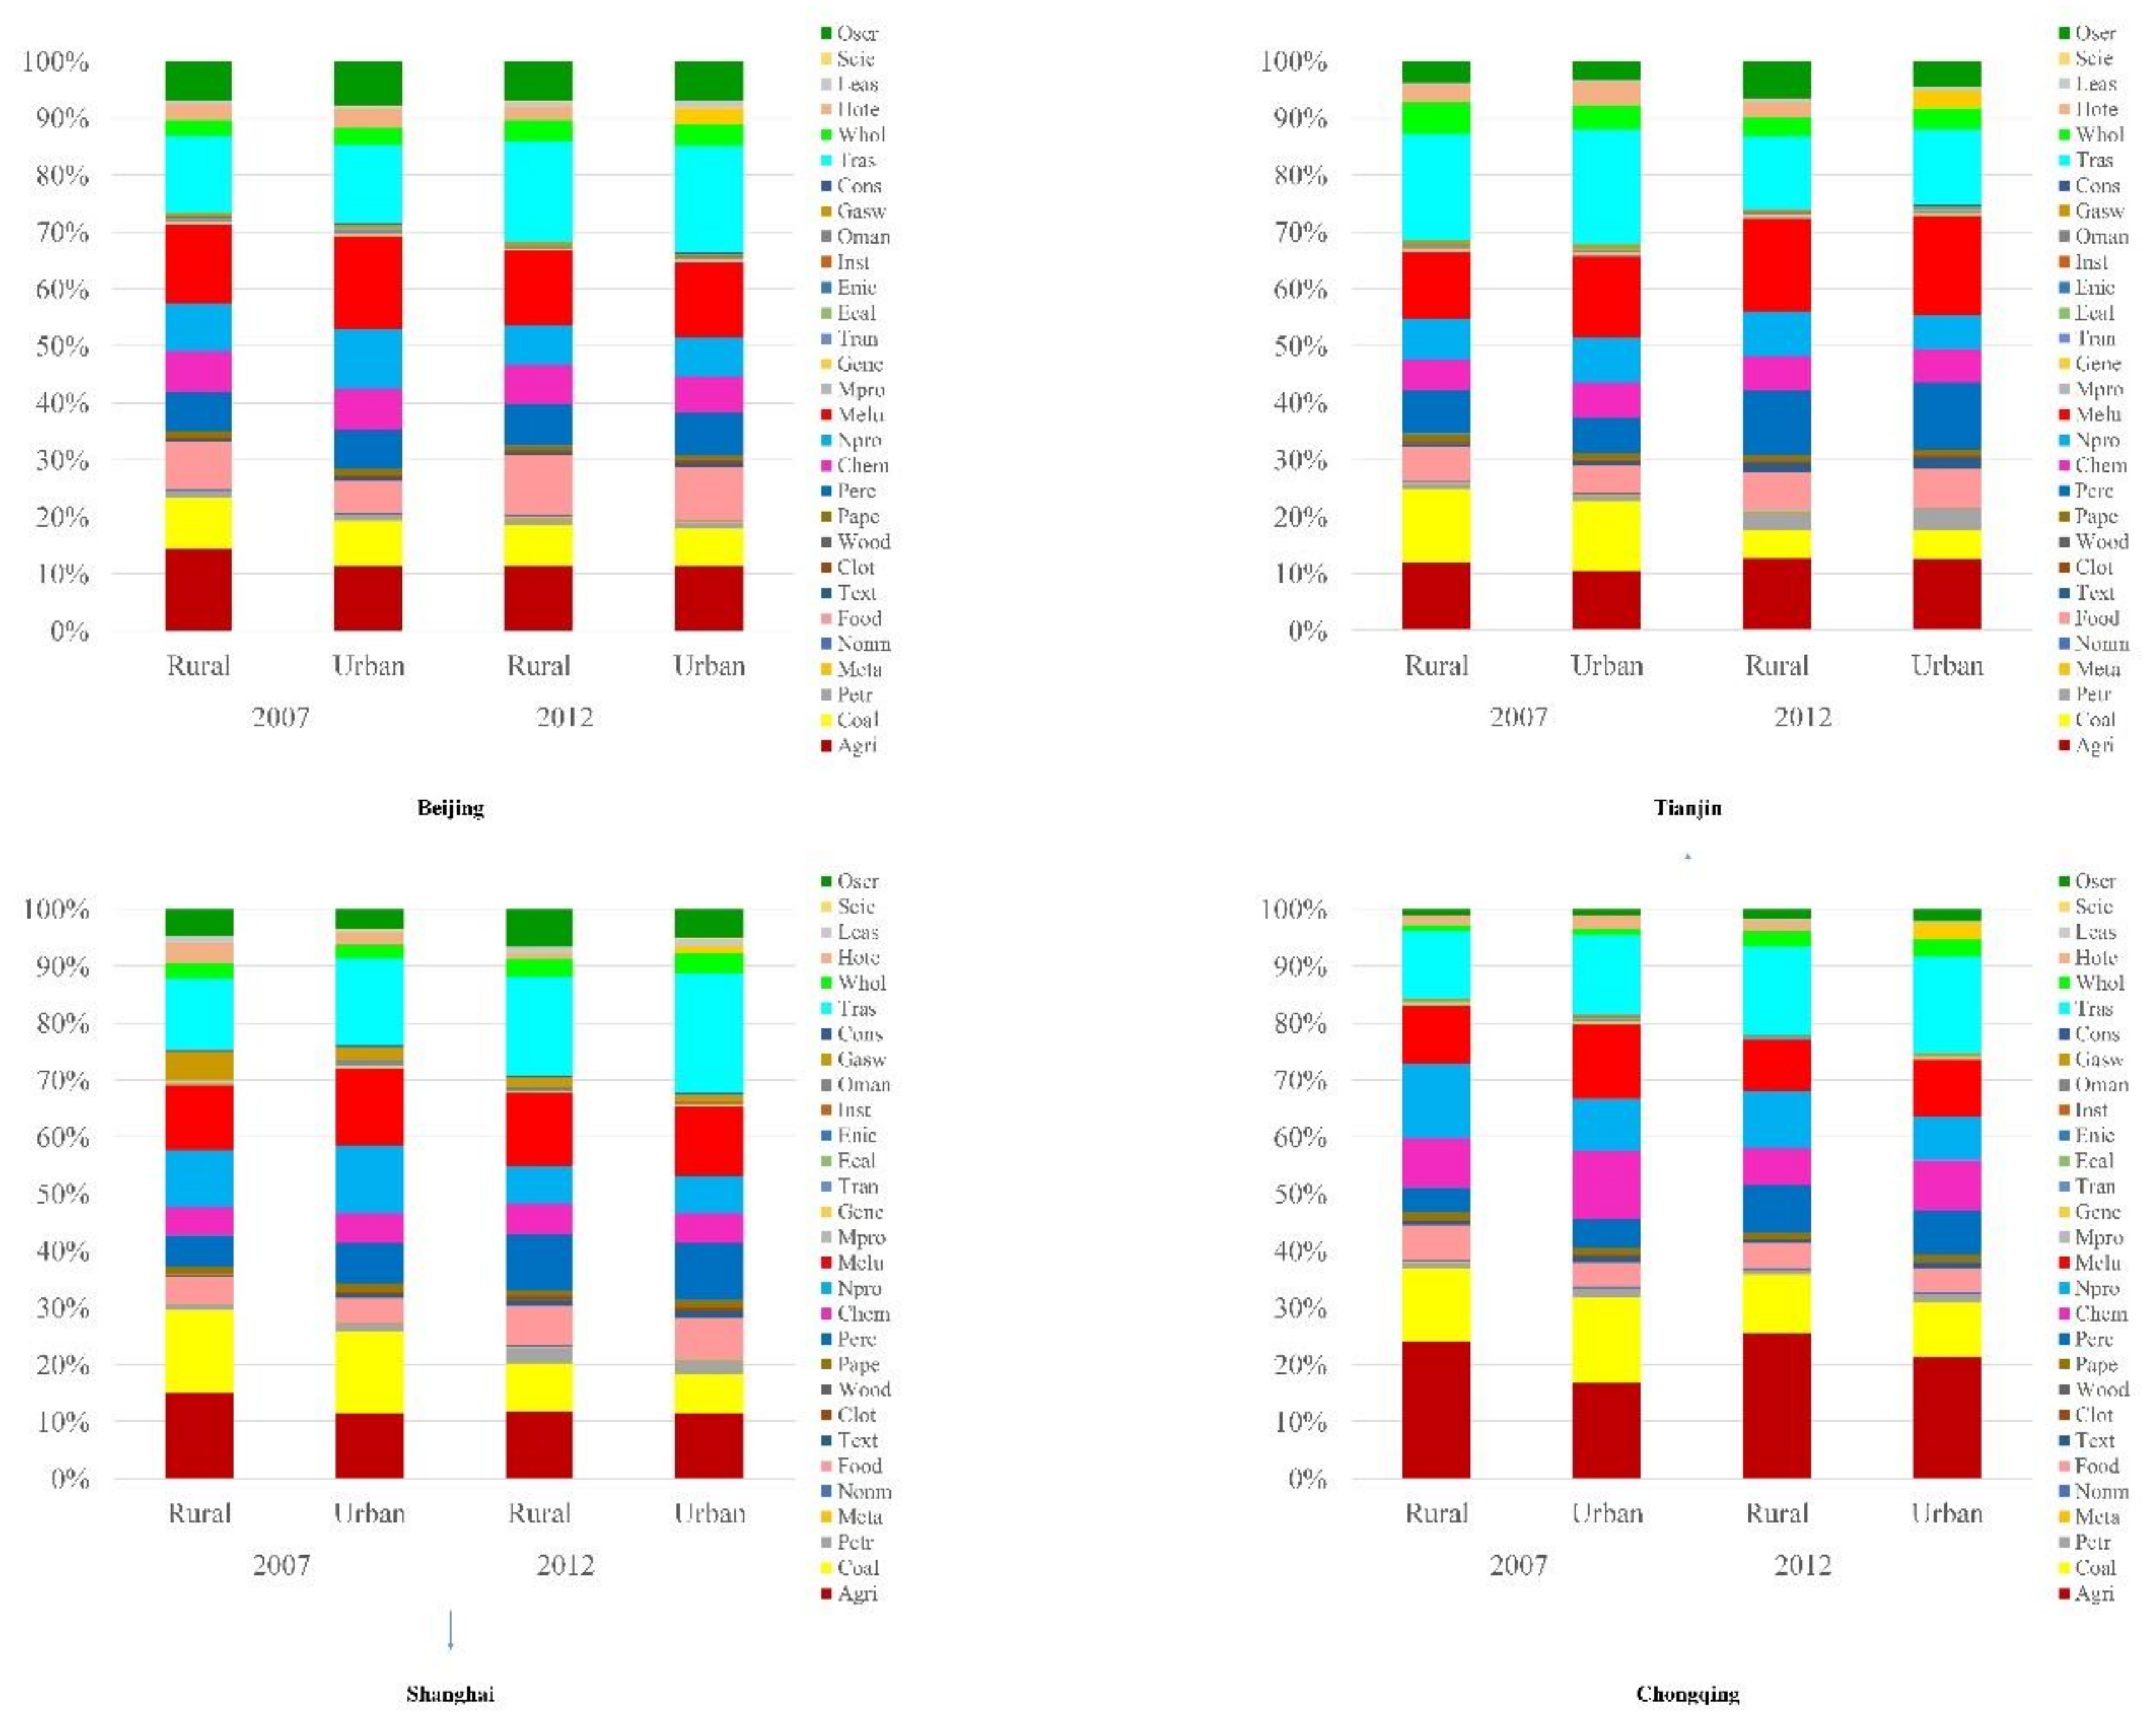
3.2.2. Sectoral Indirect HCEs

Sectoral abbreviation and indirect HCEs are shown in Table A1. Indirect HCEs from electricity and hot water production and supply were much larger than other sectors for all the four cities. For instance, rural and urban indirect HCEs from electricity and hot water production and supply in Tianjin accounted for 63.3% and 69.4% in 2012, respectively. Thus, to better express the indirect HCEs at sectoral level, we give the percentage-stacked bar chart of indirect HCEs from all the sectors except electricity and hot water production and supply, as shown in Figure 6.
For Beijing, Tianjin, Shanghai, and Chongqing, the indirect HCEs from agriculture, coal mining, food processing and tobacco, petroleum refining, coking, etc., chemical industry, nonmetal products, metallurgy, construction, transport and storage increased. The share of indirect HCEs from agriculture were relatively large and increased from 2007 to 2012 for both urban and rural residents in Chongqing. The share of indirect HCEs from coal mining decreased from 2007 to 2012 in Shanghai, Tianjin, and Chongqing; however, the share of indirect HCEs from petroleum refining, coking, etc. increased. For Beijing, Shanghai, and Chongqing, the share of indirect HCEs from transport and storage increased from 2007 to 2012, but the share decreased by 5.9% and 6.7% for rural and urban residents in Tianjin, respectively. However, the share of indirect HCEs from metallurgy respectively increased by 4.5% and 3% for rural and urban residents in Tianjin.

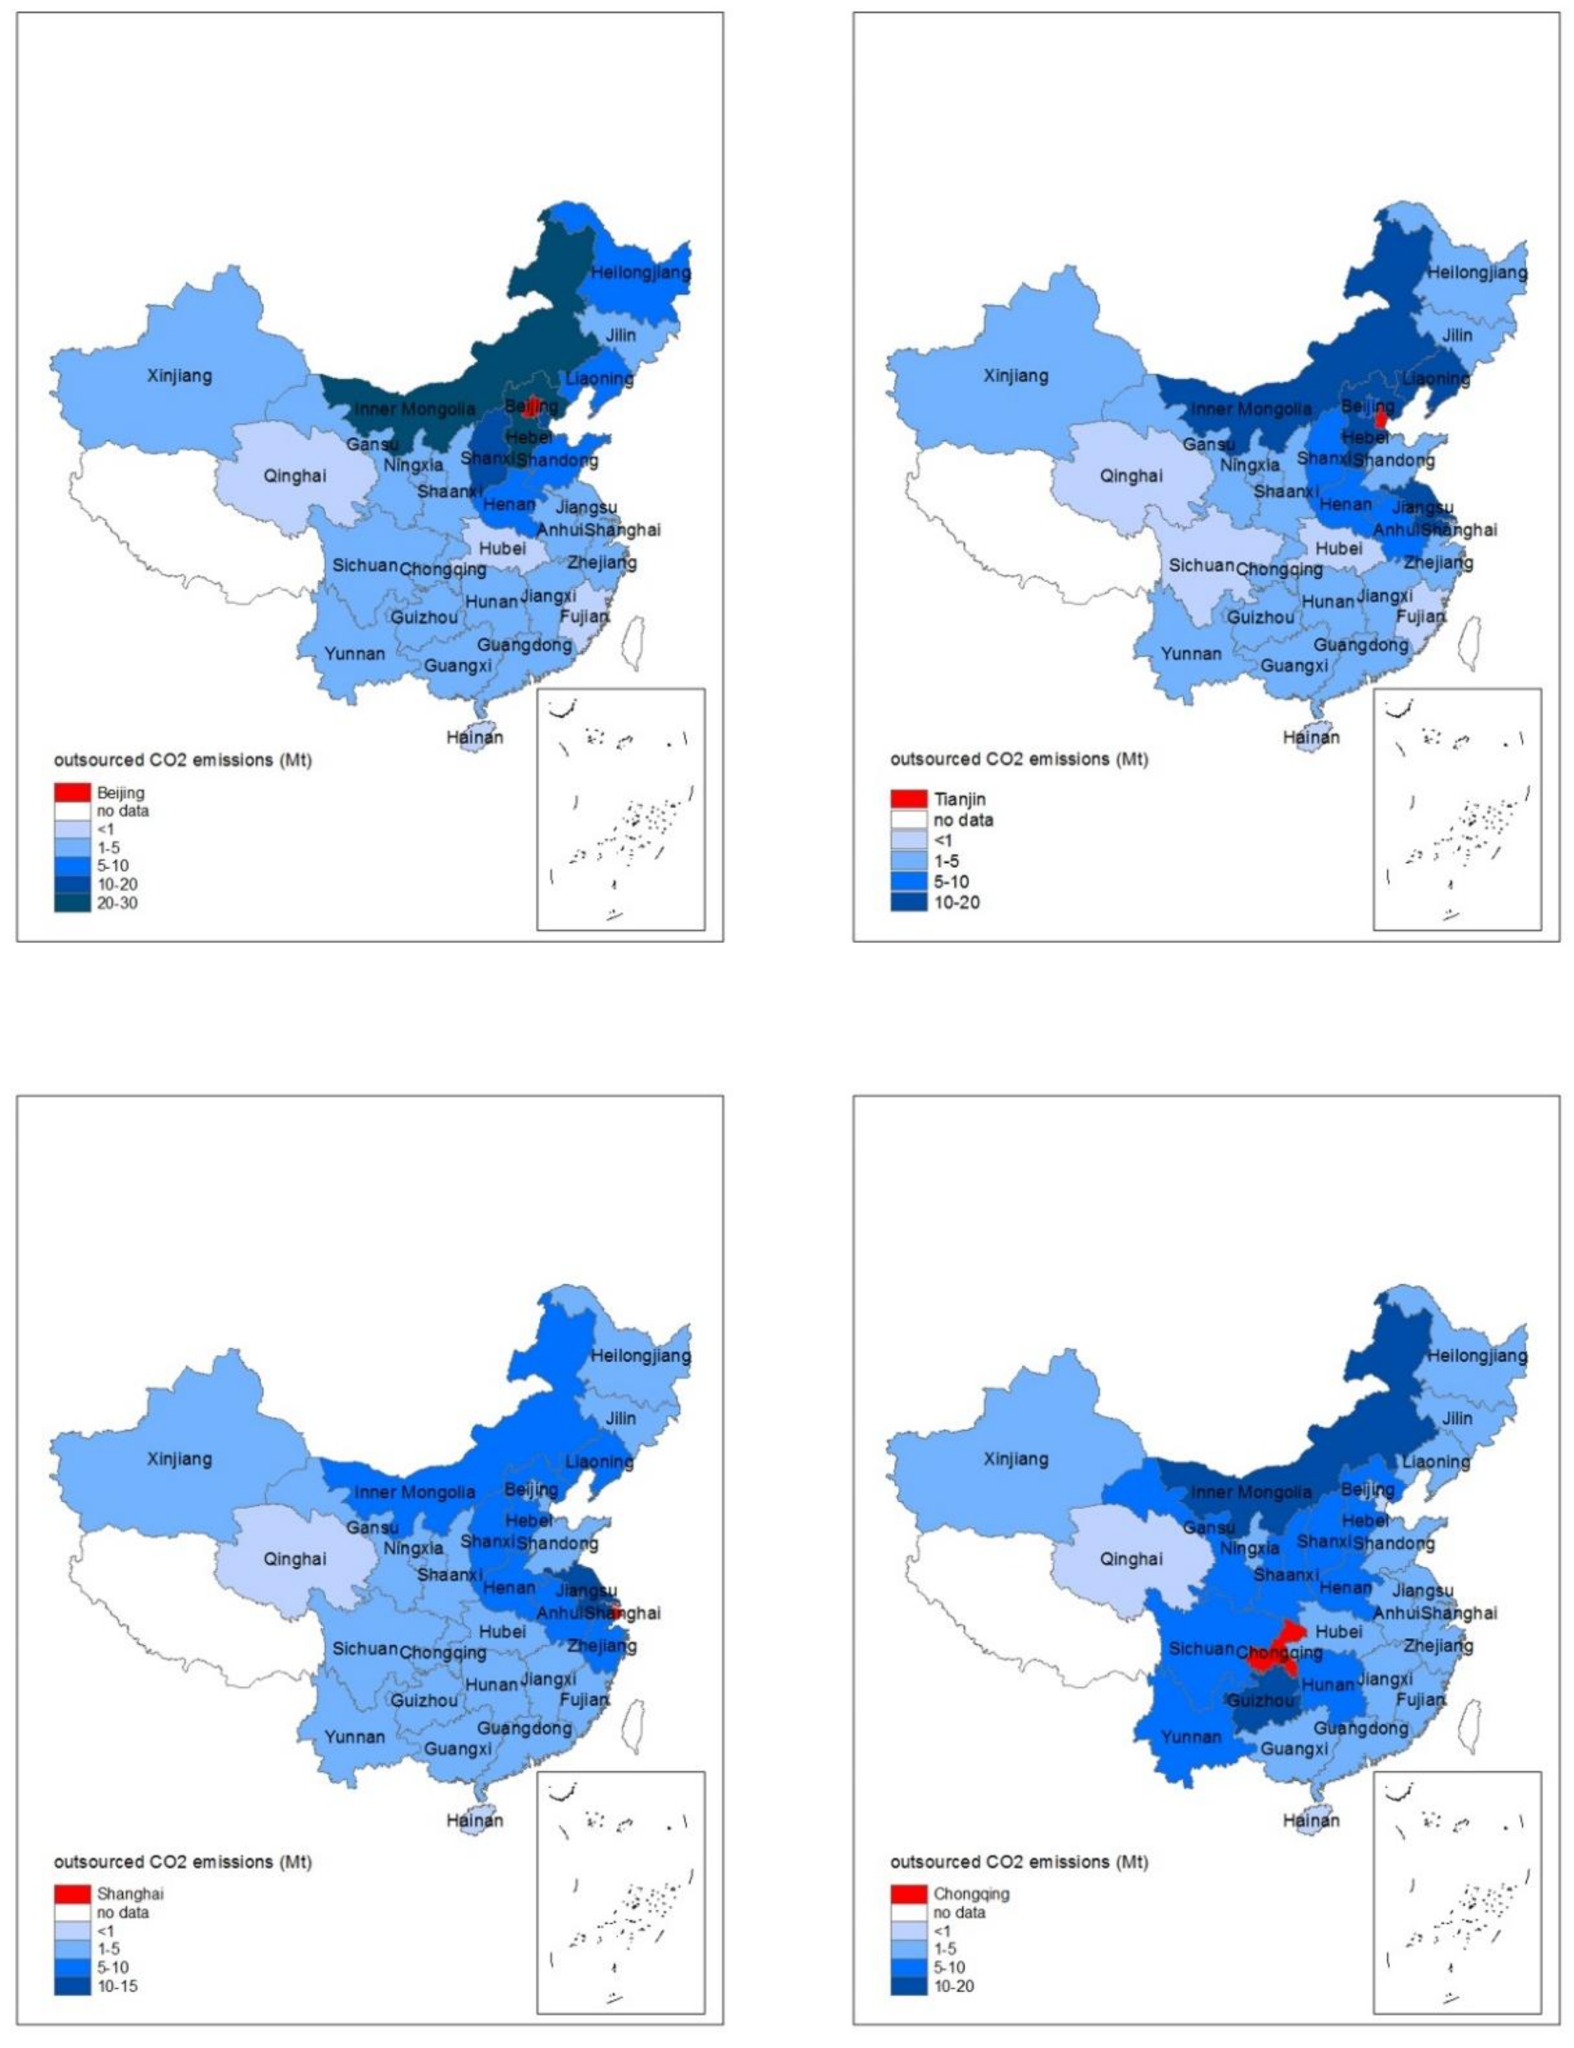
3.2.3. Outsourced Indirect HCEs

Due to the difference of regional resource endowment and industrial structure, the four cities outsourced large amounts of CO2 emissions to other provinces to meet their own demands for products and services through inter-regional trade. For example, outsourced indirect HCEs accounted for 73.7% for Beijing in 2007, and the share increased to 87.6% in 2012. Similarly, the share of outsourced indirect HCEs in Chongqing increased from 43.9% in 2007 to 59.7% in 2012. On the contrary, the share of outsourced indirect HCEs in Shanghai and Tianjin decreased by 6.9% and 8.7%, respectively. However, the outsourced indirect HCEs in Shanghai and Tianjin still accounted for more than 60%.
The outsourced indirect HCEs of Beijing, Tianjin, Shanghai, and Chongqing in 2012 are shown in Figure 7. Beijing, Tianjin, Shanghai, and Chongqing respectively outsourced 142 Mt, 127.1 Mt, 108.6 Mt, and 130.6 Mt indirect HCEs to other provinces in 2012, most of which were neighboring provinces with rich resources and less developed economic structure. For example, Inner Mongolia, Hebei, and Shanxi were the top three contributors to Beijing’s outsourced indirect HCEs; the shares were 17.8%, 17.4%, and 8.6%, respectively. 26.8% of Chongqing’s outsourced indirect HCEs were from Guizhou, Yunnan, and Sichuan.

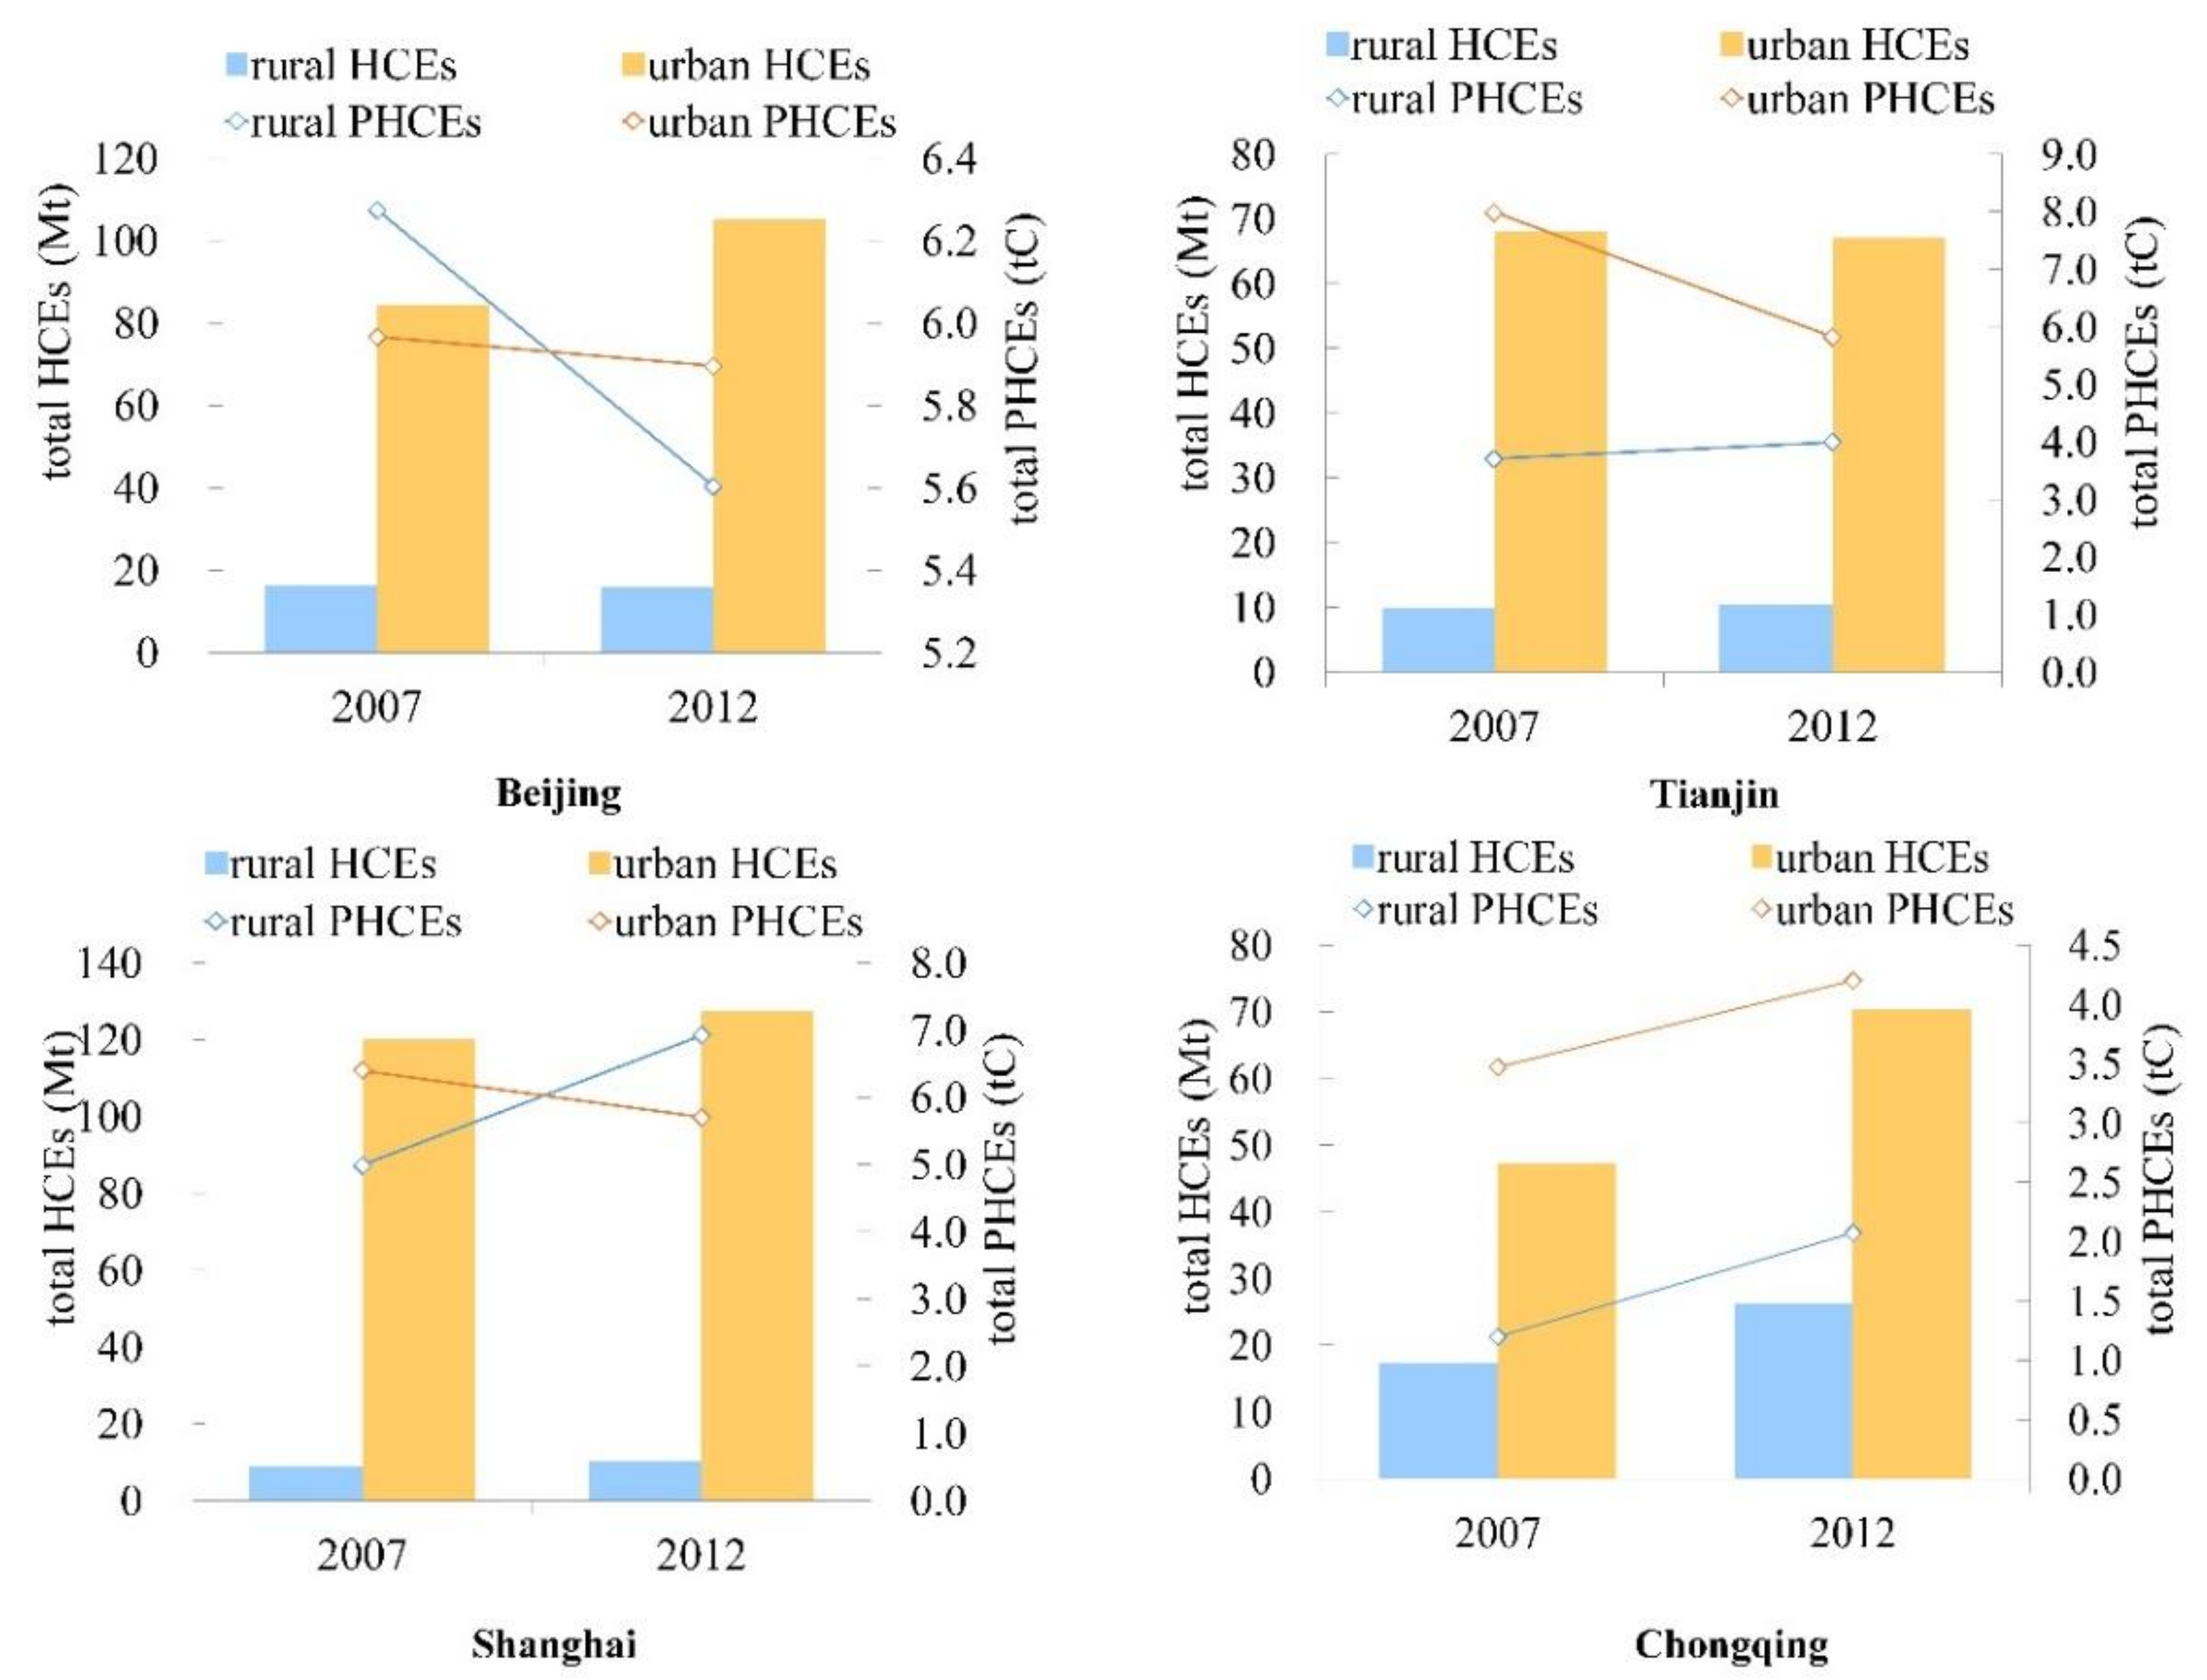
3.3. Urban and Rural Total HCEs and PHCEs

The total CO2 emissions can be obtained by summing up urban and rural households’ direct and indirect CO2 emissions. Chongqing’s total CO2 emissions increased significantly with the increase rate of 49.71% from 64.63 Mt in 2007 to 96.76 Mt in 2012. Beijing’s total CO2 emissions increased by 20.2% from 100.79 Mt in 2007 to 121.15 Mt in 2012. Shanghai’s total CO2 emissions increased by 6.21% from 129.45 Mt in 2007 to 137.49 Mt in 2012, whereas Tianjin’s total CO2 emissions decreased slightly from 77.75 Mt in 2007 to 77.53 Mt in 2012.
Rural and urban households’ HCEs and PHCEs are shown in Figure 8. The urban–rural total HCEs gap in Shanghai is the largest, followed by Beijing and Tianjin. Chongqing’s urban–rural total HCEs gap is the smallest. From the amount of total HCEs, Chongqing has the largest rural HCEs and the smallest urban HCEs. On the contrary, Shanghai has the smallest rural HCEs and the largest urban HCEs.
From the perspective of total PHCEs, Chongqing’s rural and urban PHCEs increased by 73.59% and 21.01%, respectively. Beijing’s rural and urban PHCEs decreased by 10.69% and 1.19%. Rural PHCEs in both Tianjin and Shanghai respectively increased by 8.03% and 38.72%, while urban PHCEs decreased by 27.10% and 10.89%, respectively.
PHCEs in our study and other studies are compared in Table 3. PHCEs in Beijing, Tianjin, Shanghai, and Chongqing were larger than the national average household footprint shown by Wiedenhofer et al. [65], Fan et al. [66], and Qu et al. [67], but much smaller than the U.S. [68] and European countries [18,69,70]. Compared to the results of Tian et al. [71] and Fry et al. [72], Beijing’s total PHCEs in our results were 31.56% and 29.02% smaller, respectively, due to different research methods and data sources. Shanghai’s total PHCEs in our results were close to other cities in the Yangtze River delta region [14].

4. Discussion

In this study, we considered both direct and indirect emissions caused by rural and urban household consumption (as shown in Figure 1). Total emissions are obtained by summing direct CO2 emissions and indirect CO2 emissions [56]. The direct CO2 emissions mainly refer to the consumption of coal, oil, gas, electricity, and heat from China energy statistical yearbook, while the indirect CO2 emissions are caused by the consumption of products and services, which is also named embodied emissions [40,72].
Urban direct HCEs were much larger than rural direct HCEs. There are several reasons for this: (1) in terms of both quantity and variety, urban residents have more household equipment than rural residents; (2) urban citizens have more cars, which not only brings about severe traffic problems, but also consumes lots of gasoline and produces more emissions; and (3) the population of urban areas is larger than that of rural areas. With rapid urbanization, more and more people flood into the city. For example, Beijing’s urban population was six times larger than the rural population in 2014.
For both urban and rural households in Beijing, Tianjin, and Chongqing in China, CO2 emissions caused by electricity consumption accounted for the largest proportion of their direct CO2 emissions: the most carbon-intensive categories were electricity and hot water production and supply. For instance, the shares of direct HCEs from electricity in Beijing were 71.3% and 58.2% in 2007 for urban and rural household, respectively, and increased to 73.7% and 62.3% in 2012, respectively. An increased level of income or consumption increased the probability of the use of electricity [76,77]. Thus, the result reflects the improvement of the income and living standard of urban and rural household and the widespread use of household electrical appliances with the rapid development of economy.
For rural households in Beijing and Shanghai, direct HCEs from coal and oil consumption occupied a larger relative proportion. This is related to the large amounts of coal use for heating and cooking in rural areas of Beijing. Oil is the main energy consumption in rural areas of Shanghai, and the share of direct HCEs from oil consumption was approximately 60% in 2015. Affected by the financial crisis and post-crisis, the coal and oil price rose dramatically and the consumption of coal and oil of rural household declined, thus direct HCEs decreased significantly in 2012. Increasing the price of coal and oil may be an effective way to control fossil energy use and reduce CO2 emissions, such as the through implementation of a carbon tax or environmental tax [78]. However, to avoid the economic loss and urban–rural household welfare losses caused by carbon tax, the optimal carbon tax rate should be formulated carefully.
Large amounts of CO2 emissions are outsourced to other provinces to meet the demand of local residents. For example, about 68.5% of Beijing’s household emissions were outsourced to other provinces in 2007, which is consistent with Feng et al. [79]. The share increased to 81.7% in 2012. The Chinese government has taken active measures to improve the capacity of key areas to adapt to climate change and mitigate the adverse effects of climate change on economic and social development and people’s livelihood. The National Development and Reform Commission (NDRC) started the pilot work of carbon emissions trading in Beijing, Tianjin, Shanghai, Chongqing, Hubei, Guangdong, and Shenzhen in 2011. The completion of the reduction of carbon dioxide emission intensity is included in the comprehensive evaluation system of economic and social development in various regions and the system of cadre performance assessment [80]. To reduce Beijing’s CO2 emissions and environmental pressure, Beijing adjusted its industrial structure: heavy industries were moved to its neighboring provinces, such as Hebei, Inner Mongolia, and Shanxi. Through interregional trade, products and services are imported to meet the demands of local household. Government should pay more attention to interprovincial carbon leakage to make an equitable and effective regional emissions reduction scheme. To reduce China’s total CO2 emissions, energy efficiency improvement and clean energy development are significant.
Urban total HCEs increased to a large extent with the increase of urban population. For example, urban population increased by 23.27% in Chongqing from 2007 to 2012, while its urban total HCEs increased by 49.16%. In our study, urban households contributed 72.81–92.65% of total HCEs in 2012. Yang et al. [81] find that urban households contribute 92.6% of the particulate matter 2.5 (PM 2.5) footprint of Beijing’s households. Therefore, it is urgent to control urban population. City planners should promote economic development and increase the job opportunities in rural areas and the rural–urban fringe zone to reduce the migrants who move to the city and seek jobs. For example, on 1 April 2017, the State Council of China has decided to build Xiongan New Area, which is a new area of national significance after Shenzhen Special Economic Zone and Pudong New Area of Shanghai. It is expected to relieve the stress of Beijing’s population and environment.

5. Conclusions

We examined the direct and indirect CO2 emissions of urban and rural households in Beijing, Tianjin, Shanghai, and Chongqing in this study. The results showed that total PHCEs were larger than the national average level, but much smaller compared to developed countries such as the US and EU countries [82]. Direct HCEs caused by electricity consumption account for a large proportion of emissions. Despite the urban/rural differential for both groups, the most carbon-intensive categories were electricity and hot water production and supply, agriculture, coal mining, food processing and tobacco, petroleum refining, coking, etc., chemical industry, nonmetal products, metallurgy, construction, transport and storage.
Most household CO2 emissions are contributed by urban HCEs in Beijing, Tianjin, Shanghai, and Chongqing. Chongqing’s total HCEs are approximately 70–80% of Beijing and Shanghai in 2012; however, this increased by about 50% from 2007 to 2012. With the acceleration of urbanization, this is supposed to increase in future. Therefore, it is important to advocate low carbon consumption patterns to control household CO2 emissions.
Measuring and understanding energy consumption helps in forming a proper policy to motivate the citizens of metropolitan areas to become “greener” consumers and promote renewable energy development. This “greener” character needs to be achieved, as urban cities are environmentally compromised regions because of their metropolitan character [83]. Therefore, the following suggestions are proposed for city planners and policy makers: (1) continue to promote low-carbon green lifestyles and encourage residents to use low-carbon and renewable energy to save energy with the aid of the media; (2) control cities’ populations: promote the development of neighbouring districts, create more jobs and opportunities in the neighbouring districts, and divert migrant workers; (3) in the process of urbanization, encourage the development of low-carbon infrastructure, along with the use of materials that improve building quality and sustainability; and (4) judge government performance on the basis not only of GDP, but also of energy efficiency and technical progress.

Author Contributions

R.H. designed the research, R.H., S.Z. and C.L. discussed the results and contributed to writing the paper. We would like to thank Klaus Hubacek from University of Maryland and the reviewers’ suggestions, which helps to improve our paper.

Acknowledgments

This work was supported by Chinese National Natural Science Foundation (41701615, 71690245), Jiangsu Provincial Natural Science Foundation (BK20171038), China Postdoctoral Science Foundation (2016M600429), and Natural science fund for colleges and universities in Jiangsu Province (16KJB170003).

Conflicts of Interest

The authors declare no conflict of interest.

Appendix A

Table A1. Indirect CO2 emissions of urban and rural household in 2012 (10,000 tons).
RuralUrban
AbbreviationBeijingTianjinShanghaiChongqingBeijingTianjinShanghaiChongqing
AgricultureAgri15.8014.5917.73121.28217.41136.95314.11410.59
Coal miningCoal10.015.7413.0049.64126.2355.35187.89186.31
Petroleum and gasPetr1.643.834.203.3722.8138.5669.8723.54
Metal miningMeta0.230.220.200.793.232.203.333.70
Nonmetal miningNonm0.250.200.200.683.491.753.302.74
Food processing and tobaccoFood14.637.3910.7622.08183.1375.33197.0582.99
TextileText0.571.871.592.2110.3218.9231.3118.38
Clothing, leather, fur, etc.Clot0.460.330.620.259.043.3815.102.02
Wood processing and furnishingWood0.170.190.180.162.452.763.990.73
Paper making, printing, stationery, etc.Pape1.081.101.535.6315.3211.0334.1524.53
Petroleum refining, coking, etc.Perc10.3212.9615.0439.75143.91127.27275.21148.75
Chemical industryChem9.587.048.1430.89124.7464.56147.35171.91
Nonmetal productsNpro9.599.159.9948.13131.2565.25180.55144.45
MetallurgyMelu17.7818.6219.5042.22255.95188.25331.14194.87
Metal productsMpro0.290.440.260.704.214.034.772.72
General and specialist machineryGene0.370.370.360.715.123.636.463.44
Transport equipmentTran0.290.330.500.594.503.637.623.01
Electrical equipmentEcal0.150.230.180.401.982.112.911.92
Electronic equipmentEnic0.080.080.090.071.080.981.790.29
Instrument and meterInst0.010.010.010.090.130.060.150.60
Other manufacturingOman0.140.060.170.391.890.533.072.00
Electricity and hot water production and supplyEhwp214.24199.05268.23384.032739.072467.623562.091988.70
Gas and water production and supplyGasw0.690.332.730.637.893.4729.383.79
ConstructionCons0.310.220.370.325.253.457.701.65
Transport and storageTras24.5314.7226.3074.21362.53145.55579.24324.73
Wholesale and retailingWhol4.993.944.9913.6669.6640.4796.6859.56
Hotel and restaurantHote3.173.041.618.6956.3032.6937.6254.32
Leasing and commercial servicesLeas1.220.631.370.8525.056.5535.436.07
Scientific researchScie0.200.060.080.133.110.521.390.60
Other servicesOser9.787.6310.108.83131.2650.39141.0141.87

References

  1. Wiedmann, T.; Chen, G.W.; Barrett, J. The concept of city carbon maps, a case study of Melbourne, Australia. J. Ind. Ecol. 2016, 20, 676–691. [Google Scholar] [CrossRef]
  2. Zhang, X.L.; Luo, L.Z.; Skitmore, M. Household carbon emission research: An analytical review of measurement, influencing factors and mitigation prospects. J. Clean. Prod. 2015, 103, 873–883. [Google Scholar] [CrossRef] [Green Version]
  3. Kennedy, C.; Steinberger, J.; Gasson, B.; Hansen, Y.; Hillman, T.; Havránek, M.; Pataki, D.; Phdungsilp, A.; Ramaswami, A.; Mendez, G.V. Methodology for inventorying greenhouse gas emissions from global cities. Energy Policy 2010, 38, 4828–4837. [Google Scholar] [CrossRef]
  4. Satterthwaite, D. Cities’ contribution to global warnings: Notes on the allocation of greenhouse gas emissions. Environ. Urban. 2008, 20, 539–549. [Google Scholar] [CrossRef]
  5. Biesiot, W.; Noorman, K.J. Energy requirements of household consumption: A case study of the Netherlands. Ecol. Econ. 1999, 28, 367–383. [Google Scholar] [CrossRef]
  6. Kerkhof, A.C.; Benders, R.M.J.; Moll, H.C. Determinants of variation in household CO2 emissions between and within countries. Energy Policy 2009, 37, 1509–1517. [Google Scholar] [CrossRef]
  7. Schipper, L.; Bartlett, S.; Hawk, D.; Vine, E. Linking life-styles and energy use: A matter of time? Annu. Rev. Energy 1989, 14, 271–320. [Google Scholar] [CrossRef]
  8. Pachauri, S. An analysis of cross-sectional variations in total household energy requirements in India using micro survey data. Energy Policy 2004, 32, 1723–1735. [Google Scholar] [CrossRef]
  9. Rao, M.N.; Reddy, B.S. Variations in energy use by Indian households: An analysis of micro level data. Energy 2007, 32, 143–152. [Google Scholar]
  10. Miah, M.D.; Foysal, M.A.; Koike, M.; Kobayashi, H. Domestic energy-use pattern by the households: A comparison between rural and semi-urban areas of Noakhali in Bangladesh. Energy Policy 2011, 39, 3757–3765. [Google Scholar] [CrossRef]
  11. Liu, L.C.; Liang, Q.M.; Wang, Q. Accounting for China’s regional carbon emissions in 2002 and 2007: Production-based versus consumption-based principles. J. Clean. Prod. 2015, 103, 384–392. [Google Scholar] [CrossRef]
  12. Shan, Y.L.; Liu, J.H.; Liu, Z.; Xu, X.W.H.; Shao, S.; Wang, P.; Guan, D.B. New provincial CO2 emission inventories in China based on apparent energy consumption data and updated emission factors. Appl. Energy 2016, 184, 742–750. [Google Scholar] [CrossRef] [Green Version]
  13. Bai, X. Integrating global environmental concerns into urban management: The scale and readiness arguments. J. Ind. Ecol. 2007, 11, 15–29. [Google Scholar] [CrossRef]
  14. Xu, X.; Tan, Y.; Chen, S.; Yang, G.; Su, W. Urban household carbon emission and contributing factors in the Yangtze River Delta, China. PLoS ONE 2015, 10, e0121604. [Google Scholar] [CrossRef] [PubMed]
  15. Park, H.C.; Heo, E. The direct and indirect household energy requirements in the Republic of Korea from 1980 to 2000-An input-output analysis. Energy Policy 2007, 35, 2839–2851. [Google Scholar] [CrossRef]
  16. Markaki, M.; Belegri-Roboli, A.; Sarafidis, Y.; Mirasgedis, S. The carbon footprint of Greek households (1995–2012). Energy Policy 2017, 100, 206–215. [Google Scholar] [CrossRef]
  17. Reinders, A.H.M.E.; Vringer, K.; Blok, K. The direct and indirect energy requirement of households in the European Union. Energy Policy 2003, 31, 139–153. [Google Scholar] [CrossRef]
  18. Sommer, M.; Kratena, K. The carbon footprint of European households and income distribution. Ecol. Econ. 2017, 136, 62–72. [Google Scholar] [CrossRef]
  19. Ivanova, D.; Vita, G.; Steen-Olsen, K.; Stadler, K.; Melo, P.C.; Wood, R.; Hertwich, E.G. Mapping the carbon footprint of EU regions. Environ. Res. Lett. 2017, 12, 54013. [Google Scholar] [CrossRef]
  20. Lenzen, M.; Wier, M.; Cohen, C. A comparative multivariate analysis of household energy requirements in Australia, Brazil, Denmark, India and Japan. Energy 2006, 31, 181–207. [Google Scholar] [CrossRef]
  21. Maraseni, T.N.; Qu, J.S.; Zeng, J.J. A comparison of trends and magnitudes of household carbon emissions between China, Canada and UK. Environ. Dev. 2015, 15, 103–119. [Google Scholar] [CrossRef]
  22. Brizga, J.; Feng, K.; Hubacek, K. Household carbon footprints in the Baltic States: A global multi-regional input–output analysis from 1995 to 2011. Appl. Energy 2017, 189, 780–788. [Google Scholar] [CrossRef]
  23. Bin, S.; Dowlatabadi, H. Consumer lifestyle approach to US energy use and the related CO2 emissions. Energy Policy 2005, 33, 197–208. [Google Scholar] [CrossRef]
  24. Kok, R.; Benders, R.M.J.; Moll, H.C. Measuring the environmental load of household consumption using some methods based on input-output energy analysis: A comparison of methods and a discussion of results. Energy Policy 2006, 34, 2744–2761. [Google Scholar] [CrossRef]
  25. Wei, Y.M.; Liu, L.C.; Fan, Y.; Wu, G. The impact of lifestyle on energy use and CO2 emission: An empirical analysis of China’s residents. Energy Policy 2007, 35, 247–257. [Google Scholar] [CrossRef]
  26. Weber, C.L.; Matthews, H.S. Quantifying the global and distributional aspects of American household carbon footprint. Ecol. Econ. 2008, 66, 379–391. [Google Scholar] [CrossRef]
  27. Dhakal, S. Urban energy use and carbon emissions from cities in China and policy implications. Energy Policy 2009, 37, 4208–4219. [Google Scholar] [CrossRef]
  28. Feng, Z.H.; Zou, L.L.; Wei, Y.M. The impact of household consumption on energy use and CO2 emissions in China. Energy 2011, 36, 656–670. [Google Scholar] [CrossRef]
  29. Wang, Z.H.; Yang, L. Indirect carbon emissions in household consumption: Evidence from the urban and rural area in China. J. Clean. Prod. 2014, 78, 94–103. [Google Scholar] [CrossRef]
  30. Zhu, Q.; Peng, X.Z.; Wu, K.Y. Calculation and decomposition of indirect carbon emissions from residential consumption in China based on the input-output model. Energy Policy 2012, 48, 618–626. [Google Scholar] [CrossRef]
  31. Teubler, J.; Buhl, J.; Lettenmeier, M.; Greiff, K.; Liedike, C. A household’s burden- the embodied resource use of household equipment in Germany. Ecol. Econ. 2018, 146, 96–105. [Google Scholar] [CrossRef]
  32. Pachauri, S.; Spreng, D. Direct and indirect energy requirements of households in India. Energy Policy 2002, 30, 511–553. [Google Scholar] [CrossRef]
  33. Baiocchi, G.; Minx, J.; Hubacek, K. The impact of social factors and consumer behavior on carbon dioxide emissions in the United Kingdom. J. Ind. Ecol. 2010, 14, 50–72. [Google Scholar] [CrossRef]
  34. Ding, Q.; Cai, W.; Wang, C.; Sanwal, M. The relationships between household consumption activities and energy consumption in China-an input-output analysis from the lifestyle perspective. Appl. Energy 2017, 207, 520–532. [Google Scholar] [CrossRef]
  35. Steen-Olsen, K.; Wood, R.; Hertwich, E.G. The carbon footprint of Norwegian household consumption 1999–2012. J. Ind. Ecol. 2016, 20, 582–592. [Google Scholar] [CrossRef]
  36. Lenzen, M.; Dey, C.; Foran, B. Energy requirements of Sydney households. Ecol. Econ. 2004, 49, 375–399. [Google Scholar] [CrossRef]
  37. Yang, D.; Gao, L.; Xiao, L.; Wang, R. Cross-boundary environmental effects of urban household metabolism based on an urban spatial conceptual framework: A comparative case of Xiamen. J. Clean. Prod. 2012, 27, 1–10. [Google Scholar] [CrossRef]
  38. Bai, Y.; Liu, Y. An exploration of residents’ low-carbon awareness and behavior in Tianjin, China. Energy Policy 2013, 61, 1261–1270. [Google Scholar] [CrossRef]
  39. Wang, Z.H.; Yang, Y.T.; Wang, B. Carbon footprints and embodied CO2 transfers among provinces in China. Renew. Sustain. Energy Rev. 2018, 82, 1068–1078. [Google Scholar] [CrossRef]
  40. Feng, K.S.; Davis, S.J.; Sun, L.X.; Li, X.; Guan, D.B.; Liu, W.D.; Liu, Z.; Hubacek, K. Outsourcing CO2 within China. Proc. Natl. Acad. Sci. USA 2013, 110, 11654–11659. [Google Scholar] [CrossRef] [PubMed] [Green Version]
  41. Duchin, F.; Hubacek, K. Linking social expenditures to household lifestyles. Futures 2003, 35, 61–74. [Google Scholar] [CrossRef]
  42. López, L.A.; Arce, G.; Morenate, M.; Zafrilla, J.E. How does income redistribution affect households’ material footprint? J. Clean. Prod. 2017, 153, 515–527. [Google Scholar] [CrossRef]
  43. Minx, J.; Baiocchi, G.; Wiedmann, T.; Barrett, J.; Cueutzig, F.; Feng, K.S.; Forster, M.; Pichler, P.; Weisz, H.; Hubacek, K. Carbon footprints of cities and other human settlements in the UK. Environ. Res. Lett. 2013, 8, 35039. [Google Scholar] [CrossRef]
  44. Fremstad, A.; Underwood, A.; Zahram, S. The environmental impact of sharing: Household and urban economics in CO2 emissions. Ecol. Econ. 2018, 145, 137–147. [Google Scholar] [CrossRef]
  45. Zhang, C.; Cao, X.Y.; Ramaswami, A. A novel analysis of consumption-based carbon footprints in China: Unpacking the effects of urban settlement and rural-to-urban migration. Glob. Environ. Chang. 2016, 39, 285–293. [Google Scholar] [CrossRef]
  46. Jones, C.; Kammen, D.M. Spatial distribution of U.S. household carbon footprints reveals suburbanization undermines greenhouse gas benefits of urban population density. Environ. Sci. Technol. 2014, 48, 895–902. [Google Scholar] [CrossRef] [PubMed]
  47. Gill, B.; Moeller, S. GHG Emissions and the Rural-Urban Divide. A Carbon Footprint Analysis Based on the German Official Income and Expenditure Survey. Ecol. Econ. 2018, 145, 160–169. [Google Scholar] [CrossRef]
  48. Duarte, R.; Mainar, A.; Sánchez-Chóliz, J. The impact of household consumption patterns on emissions in Spain. Energy Econ. 2010, 32, 176–185. [Google Scholar] [CrossRef]
  49. Dai, H.C.; Musui, T.; Matsuoka, Y.; Fujimori, S. The impacts of China’s household consumption expenditure patterns on energy demand and carbon emissions towards 2050. Energy Policy 2012, 50, 736–750. [Google Scholar] [CrossRef]
  50. López, L.A.; Arce, G.; Morenate, M.; Monsalve, F. Assessing the inequality of Spanish households through the carbon footprint: The 21st century great recession effect. J. Ind. Ecol. 2016, 20, 571–581. [Google Scholar] [CrossRef]
  51. Zha, D.L.; Zhou, D.Q.; Zhou, P. Driving forces of residential CO2 emissions in urban and rural China: An index decomposition analysis. Energy Policy 2010, 38, 3377–3383. [Google Scholar]
  52. Zhao, X.L.; Li, N.; Ma, C.B. Residential energy consumption in urban China: A decomposition analysis. Energy Policy 2012, 41, 644–653. [Google Scholar] [CrossRef]
  53. Zhang, C.G.; Lin, Y. Panel estimation for urbanization, energy consumption and CO2 emissions: A regional analysis in China. Energy Policy 2012, 49, 488–498. [Google Scholar] [CrossRef]
  54. Zhao, C.S.; Niu, S.W.; Zhang, X. Effects of household energy consumption on environment and its influence factors in rural and urban areas. Energy Procedia 2012, 14, 805–811. [Google Scholar]
  55. Miller, R.E.; Blair, P.D. Input-Output Analysis: Foundations and Extensions, 2nd ed.; Cambridge University Press: New York, NY, USA, 2009. [Google Scholar]
  56. Feng, K.S.; Hubacek, K. Carbon implications of China’s urbanization. Energy Ecol. Environ. 2006, 1, 39–44. [Google Scholar] [CrossRef]
  57. Department of Energy Statistics, National Bureau of Statistics, People’s Republic of China. China Energy Statistical Yearbook (2008–2016); China Statistics Press: Beijing, China, 2015. [Google Scholar]
  58. Liu, W.D.; Chen, J.; Tang, Z.P.; Liu, H.G.; Han, D.; Li, F.Y. Theories and Practice of Constructing China’s Interregional Input Output Tables between 30 Provinces in 2007; China Statistics Press: Beijing, China, 2012. [Google Scholar]
  59. Mi, Z.F.; Meng, J.; Guan, D.B.; Shan, Y.L.; Song, M.L.; Wei, Y.M.; Liu, Z.; Hubacek, K. Chinese CO2 emission flows have reversed since the global financial crisis. Nat. Commun. 2017, 8, 1712. [Google Scholar] [CrossRef] [PubMed]
  60. Beijing Municipal Bureau of Statistics. Beijing Statistical Yearbook 2016; China Statistics Press: Beijing, China, 2017. [Google Scholar]
  61. Tianjin Municipal Bureau of Statistics. Tianjin Statistical Yearbook 2016; China Statistics Press: Beijing, China, 2017. [Google Scholar]
  62. Shanghai Municipal Bureau of Statistics. Shanghai Statistical Yearbook 2016; China Statistics Press: Beijing, China, 2017. [Google Scholar]
  63. Chongqing Municipal Bureau of Statistics. Chongqing Statistical Yearbook 2016; 2017. [Google Scholar]
  64. Guo, J.; Zheng, X.Y.; Chen, Z.M. How does coal price drive up inflation? Reexamining the relationship between coal price and general price level in China. Energy Econ. 2016, 57, 265–276. [Google Scholar] [CrossRef]
  65. Wiedenhofer, D.; Guan, D.; Liu, Z.; Meng, J.; Zhang, N.; Wei, Y.M. Unequal household carbon footprints in China. Nat. Clim. Chang. 2016, 7, 75–80. [Google Scholar] [CrossRef]
  66. Fan, J.; Guo, X.M.; Marinova, D.; Wu, Y.R.; Zhao, D.T. Embedded carbon footprint of Chinese urban households: Structure and changes. J. Clean. Prod. 2012, 33, 50–59. [Google Scholar] [CrossRef]
  67. Qu, J.S.; Maraseni, T.; Liu, L.N.; Zhang, Z.Q.; Yusaf, T. A comparsion of household carbon emission patterns of urban and rural China over the 17 years perild (1995–2011). Energies 2015, 5, 10537–10557. [Google Scholar] [CrossRef]
  68. Jones, C.M.; Kammen, D.M. Quantifying carbon footprint reduction opportunities for U.S. households and communities. Environ. Sci. Technol. 2011, 45, 4088–4095. [Google Scholar] [CrossRef] [PubMed]
  69. Isaksen, E.T.; Narbel, P.A. A carbon footprint proportional to expenditure- a case for Norway? Ecol. Econ. 2017, 131, 152–165. [Google Scholar] [CrossRef]
  70. Weber, C.; Perrels, A. Modelling lifestyle effects on energy demand and related emissions. Energy Policy 2000, 28, 549–566. [Google Scholar] [CrossRef]
  71. Tian, X.; Chang, M.; Lin, C.; Tanikawa, H. China’s carbon footprint: A regional perspective on the effect of transitions in consumption and production patterns. Appl. Energy 2014, 123, 19–28. [Google Scholar] [CrossRef]
  72. Fry, J.; Lenzen, M.; Jin, Y.T.; Wakiyama, T.; Baynes, T.; Wiedmann, T.; Malik, A.; Chen, G.W.; Wang, Y.F.; Geschke, A.; et al. Assessing carbon footprints of cities under limited information. J. Clean. Prod. 2017, 176, 1254–1270. [Google Scholar] [CrossRef]
  73. Lin, T.; Yu, Y.; Bai, X.; Feng, L.; Wang, J. Greenhouse gas emissions accounting of urban residential consumption: A household survey based approach. PLoS ONE 2013, 8, e55642. [Google Scholar] [CrossRef] [PubMed]
  74. Tian, X.; Geng, Y.; Dong, H.J.; Dong, L.; Fujita, T.; Wang, Y.T.; Zhao, H.Y.; Wu, R.; Liu, Z.; Sun, L. Regional household carbon footprint in China: A case of Liaoning province. J. Clean. Prod. 2016, 114, 401–411. [Google Scholar] [CrossRef]
  75. Qu, J.; Zeng, J.; Li, Y.; Wang, Q.; Maraseni, T.; Zhang, L.H.; Zhang, Z.Q.; Clarke-Sather, A. Household carbon dioxide emissions from peasants and herdsmen in northwestern arid-alpine regions, China. Energy Policy 2013, 57, 133–140. [Google Scholar] [CrossRef]
  76. Zhang, C.; Zhou, K.L.; Yang, S.L.; Shao, Z. On electricity consumption and economic growth in China. Renew. Suatain. Energy Rev. 2017, 76, 353–368. [Google Scholar] [CrossRef]
  77. Bridge, B.A.; Adhikari, D.; Fontenla, M. Household-level effects of electricity on income. Energy Econ. 2016, 58, 222–228. [Google Scholar] [CrossRef]
  78. Dong, H.J.; Dai, H.C.; Geng, Y.; Fujita, T.; Liu, Z.; Xie, Y.; Wu, R.; Fujii, M.; Masui, T.; Tang, L. Exploring impact of carbon tax on China’s CO2 reductions and provincial disparities. Renew. Sustain. Energy Rev. 2017, 77, 596–603. [Google Scholar] [CrossRef]
  79. Feng, K.S.; Hubacek, K.; Sun, L.X.; Liu, Z. Consumption-based CO2 accounting of China’s megacities: The case of Beijing, Tianjin, Shanghai and Chongqing. Ecol. Indic. 2014, 47, 26–31. [Google Scholar] [CrossRef]
  80. Su, M.; Liang, C.; Chen, B.; Yang, Z.F. Low-Carbon Development Patterns: Observations of Typical Chinese Cities. Energies 2012, 5, 1796–1803. [Google Scholar] [CrossRef]
  81. Yang, S.Y.; Chen, B.; Wakeel, M.; Hayat, T.; Alasedi, A.; Ahmad, B. PM2.5 footprint of household energy consumption. Appl. Energy 2017. [Google Scholar] [CrossRef]
  82. Ntanos, S.; Chalikias, M. Countries clustering with respect to carbon dioxide emissions by using the IEA database. In Proceedings of the 7th International Conference on Communication Technologies in Agriculture, Food and Envitronment (HAICTA 2015), Kavala, Greece, 17–20 September 2015. [Google Scholar]
  83. Ntanos, S.; Kyriakopoulos, G.; Chalikias, M.; Arabatzis, G.; Skordoulis, M.; Galatsidas, S.; Drosos, D. A social assessment of the usage of renewable energy sources and its contribution to life quality: The case of an Attica urban area in Greece. Sustainability 2018, 10, 1414. [Google Scholar] [CrossRef]
Figure 1. The framework of household CO2 emissions accounting.
Energies 11 01257 g001
Figure 2. Direct household CO2 emissions (HCEs).
Energies 11 01257 g002
Figure 3. Energy structure of direct HCEs.
Energies 11 01257 g003
Figure 4. Direct per capita HCEs (PHCEs).
Energies 11 01257 g004
Figure 5. Indirect HCEs and PHCEs.
Energies 11 01257 g005
Figure 6. Sectoral indirect HCEs.
Energies 11 01257 g006
Figure 7. Outsourced indirect HCEs.
Energies 11 01257 g007
Figure 8. Total HCEs and total PHCEs.
Energies 11 01257 g008
Table 1. Direct CO2 emissions coefficients.
FuelUnitHeat ValueCarbon ContentOxidation RataCO2 Emission Factor Unit (Kg/GJ)
CoalGJ/t20.9127.494%94.44
OilGJ/t41.8220.198%72.73
Natural gasGJ/ 104 Nm338.9315.399%55.54
Heat----110
Electricity----873
Table 2. Population data (10,000 person).
Urban PopulationRural Population
BeijingTianjinShanghaiChongqingBeijingTianjinShanghaiChongqing
20071416851188213612602641821455
20081504908196614192672681741420
20091581958204614752792701651384
201016861034214515302762661571355
201117411090219616062782641521313
201217841152223416782862611461267
201318251207227217332902651431237
201418591248228617832932691391208
201518781278228018382932691361178
Table 3. Results comparison (ton of CO2).
SourcesStudy AreaCarbon FootprintsStudy Period
This studyBeijing5.752012
Tianjin4.912012
Shanghai6.312012
Chongqing3.142012
Wiedenhofer et al. [65]China1.72012
Fan et al. [66]China22005
Qu et al. [67]China1.752011
Jones and Kammen [68]US202005
Isaksen et al. [69]Norway12.22007
Weber and Perrels [70]West Germany19.81990
Netherlands18.7
France12.9
Sommer and Kratena [18]EU2715.7-
Tian et al. [71]Jingjin region8.42007
Fry et al. [72]Beijing8.12011
Xu et al. [14]Nanjing, Ningbo, and Changzhou6.02010
Lin et al. [73]Xiamen, China3.92009
Tian et al. [74]Liaoning3.52007
Qu et al. [75]Northwestern China arid-alpine regions1.42008

