Abstract
The energy base of urban settlements requires greater integration of renewable energy sources. This study presents a “hydrogen city” model with two cycles at the district and building levels. The main cycle comprises of hydrogen gas production, hydrogen storage, and a hydrogen distribution network. The electrolysis of water is based on surplus power from wind turbines and third-generation solar photovoltaic thermal panels. Hydrogen is then used in central fuel cells to meet the power demand of urban infrastructure. Hydrogen-enriched biogas that is generated from city wastes supplements this approach. The second cycle is the hydrogen flow in each low-exergy building that is connected to the hydrogen distribution network to supply domestic fuel cells. Make-up water for fuel cells includes treated wastewater to complete an energy-water nexus. The analyses are supported by exergy-based evaluation metrics. The Rational Exergy Management Efficiency of the hydrogen city model can reach 0.80, which is above the value of conventional district energy systems, and represents related advantages for CO2 emission reductions. The option of incorporating low-enthalpy geothermal energy resources at about 80 °C to support the model is evaluated. The hydrogen city model is applied to a new settlement area with an expected 200,000 inhabitants to find that the proposed model can enable a nearly net-zero exergy district status. The results have implications for settlements using hydrogen energy towards meeting net-zero targets.
1. Introduction
Hydrogen production from renewable energy sources based on options for power-to-gas or power-to-liquid is one of the essential components of smart energy systems, which require the integration of smart electricity, thermal, and gas grids [1]. Smart energy systems are deemed as the most feasible approach towards 100% renewable energy solutions [2]. In this context, electrolysers and fuel cells are options to allow energy systems to gain flexibility [3]. A hydrogen economy that encompasses an entire supply chain based on hydrogen energy from production to usage [4] is also a valid option for supporting progress towards cleaner, smarter, and integrated energy systems.
Among related studies, an outlook for hydrogen as an energy storage medium and energy carrier in renewable energy systems for islands, including water, waste treatment, and wastewater treatment, was put forth for Porto Santo Island [5,6]. Future scenarios for the energy system of Denmark [7] were undertaken with the aim of enabling a hydrogen economy. Those for Italy [8] involved the use of hydrogen energy to increase energy system flexibility. In contrast, studies that undertake the integration of hydrogen-based options at the urban level as a whole for districts and cities are still limited. One of the examples may be given from the analyses of Sveinbjörnsson et al. [9] who evaluated a smart energy system for Sønderborg in Denmark. As a contribution to these and other studies, the present research work provides a hydrogen economy based model for districts, including original metrics and an extended outlook to energy-water relations in the urban context.
At the building level, Singh et al. [10] had presented the selection and analysis of a hybrid energy system for an academic building, including a system configuration that involved a system of solar photovoltaic (PV) arrays, an electrolyser, a hydrogen fuel cell, and a hydrogen storage tank. Cao et al. [11] analyzed a zero-energy building with a ground-source heat pump (GSHP), solar PV panels and/or a wind turbine according to the geographical context, and a hydrogen vehicle in a vehicle-to-building (V2B) scheme. As other related developments in the field of hydrogen systems, Reuß et al. [12] analyzed hydrogen production from electrolysis and its seasonal storage, transport, and fuelling means, including liquid organic hydrogen carrier tanks, trailers, and stations. Nabgana et al. [13] overviewed developments in hydrogen production from biomass using steam reforming. In addition, Qolipour et al. [14] compared options to produce hydrogen from wind power plants, PV, and hybrid PV-wind power plants, of which the latter was found to be more feasible. Tebibel et al. [15] proposed an off-grid system with a PV array, an aqueous methanol (CH3OH) tank, an electrolyser that produces hydrogen from CH3OH, and a hydrogen tank to supply hydrogen on demand. The proposed system was found to be more suitable than the selection of an option for hydrogen production based on water electrolysis at the location of Algiers. In contrast, these studies did not provide a district energy model with hydrogen, solar, and wind energy utilization.
In the urban transport context, Xu et al. [16] calculated the quantity of fuel cell vehicles on the road and the daily hydrogen demand in Shenzhen, China to the year 2025. The quantities were estimated based on cautious, moderate, and optimistic scenarios. Mohareb and Kennedy [17] used the Pathways to Urban Reductions in Greenhouse Gas Emissions modeling tool to analyze possible scenarios for Toronto, including hydrogen fuel cell vehicles. Miranda et al. [18] analyzed the energy management system of a prototype city bus using a hybrid electric-hydrogen fuel cell powertrain that was demonstrated during the Rio Olympics. In addition, Franzitta et al. [19] evaluated the use of electricity from wind and wave farms as well as solar energy to produce hydrogen for fuel cells to substitute diesel fuel in the public transport fleets of the city of Trapani and island of Pantelleria in Italy. Briguglio et al. [20] further analyzed possible uses of hydrogen energy for urban mobility in another Italian city. At the country level, Moreno-Benito et al. [21] modeled the required quantity of hydrogen production to satisfy transport demands in the next 50 years for the United Kingdom. In contrast, additional recommendations to shift modes of transport from the use of private vehicles to public mass transit were not given, which could further reduce carbon dioxide (CO2) emissions.
It is possible to evaluate multiple sectors with relevance for urban areas from an urban systems perspective. Oldenbroek et al. [22] analyzed the possibility of a 100% local renewable energy system to provide for the energy needs of power, heat, and transport in an urban area. The options were based on solar, wind, and fuel cell options with hydrogen as an energy carrier. The proposed energy system was applied to a hypothetical smart city area as an average city based on European statistics. The possibility of eliminating high and medium voltage electricity grids was assessed. This study, however, did not involve energy self-sufficiency or near-zero targets and exergy-based analyses.
Other studies focused on hydrogen production from available sources at the city or industrial complex vicinity with a technological focus. For example, Kumar et al. [23] evaluated the prospects of valorizing industrial wastewater for biological hydrogen production and techniques to increase the hydrogen yield. Nahar et al. [24] reviewed the technological options for producing hydrogen from biogas in India, including industrial wastewater and landfill gas. Khan et al. [25] concluded on the applicability of the use of microbial electrolysis cells in replacing conventional technologies for municipal wastewater treatment technologies. In contrast, none of these studies addressed the need to plan for a more closed urban water cycle or compare possibilities to progress in net-zero targets.
Among other necessities, the need to address an energy-water nexus in the water treatment sector is crucial [26]. This need also extends to processes of water desalination when this option may be valid or required in a given local context. Rather than the use of fossil fuels, solar thermal, solar PV [27], hybrid solar PV-wind, geothermal, and wave energy [28] as well as hybrid wave-solar [29] systems can be used to satisfy the energy intense demands of water desalination. In this respect, Viola et al. [26] used an island as a laboratory to experiment with the use of wave energy to support cleaner energy options for water desalination. At the same time, studies that span across hydrogen energy, an urban systems perspective that extends to the water sector, and net-zero targets remain to be addressed. For example, Sanseverino et al. [30] conceptualized a “net zero energy island” based on the use of solar, wind and geothermal energy while hydrogen energy as an energy carrier was not involved. In contrast, Da Silva et al. [31] analysed prospects for a hydrogen production plant in Brazil based on electricity from solar, wind and hydropower for export to neighbouring countries. Despite the combined use of renewable energy sources for hydrogen production, the study focused on a centralized approach at the country level without considerations of an energy-water nexus.
Most recently, Alanne and Cao [32] reviewed small-scale options for hydrogen economy in buildings and communities and proposed that future research work may be directed to “zero-energy hydrogen economy” (ZEH2E) concepts where hydrogen is the main energy carrier. Based on the most recent literature, it is therefore evident that there is a knowledge gap for integrating hydrogen economy models for urban renewable energy systems, especially those that involve net-zero targets.
Moreover, hydrogen economy models for urban systems may be supported with guidance based on metrics that involve the quality of energy, namely, exergy. Exergy is a measure of the useful work potential of energy. Unlike energy, exergy is irreversibly destroyed according to the Second Law of Thermodynamics while temperatures converge to thermal equilibrium with a given reference environment [33]. In this way, this research work seeks to put forth hydrogen economy models in the urban context based on renewable energy using exergy metrics and net-zero targets. The framework and the analytical results are expected to be instrumental for engineers and city planners in integrating a multitude of renewable and waste energy resources at the urban level.
Aims of the Research Work
The main objective of this research is to develop a hydrogen economy model for nearly net-zero cities with a holistic approach. The metrics involve those from the Rational Exergy Management Model (REMM), which provides an analytical framework based on exergy in planning for CO2 mitigation measures, including those for districts that may seek to reach net-zero targets [34]. This necessitates that energy resources, including renewable energy, are allocated with the priority of ensuring better compatibility in exergy levels to streamline primary energy spending [34]. Among others, REMM has been applied to districts [35,36], university campuses [37], airports [38] and dairy farms [39] while applications that involve hydrogen production based on renewable energy and its utilization within the urban context remain to be analyzed as a further basis for the present study.
The paper proceeds to the method of the research work and the metrics that are utilized. As an additional novelty of the research work, net-zero targets for a hydrogen community are combined with an energy/exergy and water nexus perspective. To achieve the main aim, multiple hydrogen cycles for the urban context are envisioned and analyzed, including comparisons to conventional district energy systems. The analyses are extended to an application that involves a new settlement.
2. Method of the Research Work
The large-scale mobilization of renewable and waste energy resources is required for a net-zero or net-positive concept based on exergy at large, such as at the district and city levels. In addition, the hybridization of systems with energy conversion and distribution systems that are connected to respective demand points is necessary. This must be planned at an optimum mix based on local conditions, constraints as well as options for effective and efficient distribution, energy storage, and cogeneration. The concept of a hydrogen economy can provide a valid response in several aspects:
- Hydrogen may be produced by renewable energy resources to provide a suitable energy storage and distribution system.
- Hydrogen may be distributed even with existing natural gas pipelines [40] given upgrades involving hydrogen meters and sensors [41].
- Hydrogen is a suitable fuel for fuel cells, which are in essence a cogeneration system.
- With optimum design and operation, exergy destruction in a hydrogen economy may be minimal.
- Hydrogen production may be realized in a closed-cycle energy-water nexus in a district energy system.
In addition, a hydrogen distribution network based on existing natural gas pipelines can consume less pumping energy than the district hot and cold-water piping in conventional systems. Western Europe already has a hydrogen gas pipeline network with a total length of 1500 km [40].
These and other aspects indicate that hydrogen economy can have multiple attributes for a more efficient energy supply base in districts. This research work acknowledges that the existing unresolved issues of future net or near net-zero cities and districts based on hydrogen economy is an important knowledge gap in the literature. To fill such a gap, an exergy-based hydrogen economy model is put forth with proper evaluation metrics and compared to a baseline district energy system.
The proposed hydrogen economy for nearly net-zero districts based on exergy is coupled with the hybridization of several systems, such as solar photovoltaic thermal (PVT), wind turbines, fuel cells, poly-generation systems, organic Rankine cycle (ORC) and heat pumps with biogas and/or geothermal energy. According to REMM, the level of exergy matches in a district must be improved to minimize related CO2 emission responsibilities. This includes comparisons based on the avoidable CO2 emissions impact due to exergy destruction that takes place within the boundaries of the district. Improvements in the level of exergy match are compared based on respective Exergy Flow Bars [42].
In the proposed energy system, two cycles of a hydrogen economy at district and building levels are analyzed in an exergy-based framework. Comparisons with a geothermal energy option are further put forth to evaluate integration possibilities. The model is applied to the planning of a new settlement with 200,000 inhabitants that is conceived as a case study of the research work.
In the first cycle, hydrogen gas is produced by electrolysis of water in the district power plant based on wind turbines with double-blade arrangement [43] and third-generation PVT panels. PVT panels were designed such that coolant fluid has minimum pumping requirements by extensively using heat pipes in the PVT modules with internal thermal energy storing capability. The embedded layer contains phase change material (PCM) to obtain efficiency improvements. Experimental data on the PVT modules are conducted and integrated into the analyses and the case study. Accordingly, low-pressure hydrogen is supplied to the district through a network of hydrogen pipelines.
The second cycle is the hydrogen utilization in each low-exergy building based on building scale fuel cells to satisfy virtually all types of domestic energy demands. Power that is produced by all energy systems, including the fuel cell unit, is in direct current (DC) electricity form. Buildings are equipped with low-exergy heat distribution/absorption equipment, such as radiant wall, ceiling and floor panels, chilled beams, desiccant type of humidity controls, and high-efficiency appliances, faucets, and drainage systems. In the buildings, fuel cells also produce water and heat. The heat is used in low-exergy space heating systems and for domestic hot water (DHW) subject to temperature peaking. Absorption chillers produce cold and their waste heat is collected. Separate large-scale thermal energy storage systems (TES) with different exergy levels are utilized in the buildings.
Moreover, rainwater is collected and utilized in the water supply system. In an energy-water nexus, water is cycled between the plant where it is first electrolyzed to produce hydrogen and then recovered mostly in the fuel cells at the power plant and the buildings. Make-up water is supplied by the building fuel cells, treated wastewater from the district grid, and sea (lake) water, if nearby or feasible to transport. In the latter case, seawater is converted to fresh water by light-assisted catalysis oxidation where power is received from the plant fuel cells. This is an important aspect of the system to close the energy-water nexus. The possibilities of directly connecting biogas generation based on city waste and low-enthalpy geothermal energy resources are also evaluated for further utilization.
Prior to the application of the method to realize the analyses in this research work, a justification of an exergy-based framework is put forth based on two examples, particularly those that involve net-zero buildings and Coefficient of Performance (COP) based on exergy principles. These examples are used to emphasize the crucial role of the Second Law of Thermodynamics in addressing major urban challenges, most importantly CO2 mitigation. Needs for the exergy-based metrics that are used to evaluate the hydrogen city model are further put forth with discussions.
2.1. Near-Zero Targets for Buildings and Districts
Net-zero energy buildings (NZEB), near zero energy buildings (nZEB) and net positive-energy buildings (NPEB) [44] are gaining importance in the quest of reducing CO2 emissions towards reaching the goals of the Paris Agreement. At the same time, there are still issues to be resolved [45]. A major issue that is not addressed in the building and energy sector is the fact that renewable energy resources and systems in the built environment have or require different energy quality or exergy levels. With an increasing share of renewable energy resources, differences in exergy levels need to be identified to ensure an exergy balance between the supply (resource) and the demand points in the built environment. In addition, the importance of renewable energy resources in optimum and net-positive solutions has to be acknowledged [46]. The First Law of Thermodynamics is necessary but not sufficient to address these problems as demonstrated in the following contexts.
2.1.1. Necessity for Net-Zero Exergy Targets
In addition to the exchange of electricity, the exchange of heat through NZEBs can support district networks [47]. At the same time, thermal energy at different temperatures means variation in quality. Several shortcomings of the NZEB definition may be inferred from references [34,48]:
- Thermal energy exchange definitions must distinguish between different forms of heat with different exergy levels, such as steam, hot water, service water, and cold water.
- The quality of energy exchange needs to be embedded into the nZEB definition.
- The impact of the exchanged energy quality must be considered when calculating emissions.
Hence, differences in the energy received from and supplied to a district energy system must be considered. For example, a NZEB may exchange electrical and thermal power with a district energy system. The building may receive 10,000 kWh of alternating current (AC) electrical energy with an average power rms of 5% and provide 10,000 kWh AC electrical energy with an average power rms of 10% annually. The building may also receive 15,000 kWh of heat in the form of hot water from the district at an average supply temperature of 353 K (80 °C) and provide 15,000 kWh of thermal energy to the district at an average temperature of 343 K (70 °C). From the ideal Carnot cycle with reference environment temperature of 283 K, the thermal exergy exchange between the building and district, namely Exsup as the supplied exergy (Equation (1)) and Exret as the returned exergy (Equation (2)) is:
By definition, this building is a net-zero energy building with an exact annual exchange of 15,000 kWh with the district but has a deficit based on the exergy levels of the energy amount that is exchanged. The qualities of the exchanged electrical energy are also different in terms of power quality characteristics, possibly due to the electronics involved in the DC to AC power conversion.
Evidently, the building in Equations (1) and (2) is not a building that satisfies the NZEXB target. In order to account for an exergy balance, a Net Zero Exergy Building (NZEXB) was defined, which generates energy at the same grade and quality as consumed on an annual basis while involving exchanges with the grid [48]. Such a definition is important especially when renewable energy systems become more diversified and coupled to the district at different exergy levels [49,50,51].
2.1.2. Exergy-Based Coefficient of Performance
Figure 1 represents the energy and exergy flow of a GSHP driven by grid electricity [52,53]. The electrical power input to a GSHP is utilized with a given COP value at given operating conditions to supply thermal energy. From an exergy perspective, the GSHP needs to have such a COP value that the exergy of the electrical power supply (εin) is at least equal to the exergy of the thermal output (εout). Equation (3) defines a minimum COP as COPmin that reaches this threshold for a temperature output (Tout) of 55 °C (328 K) and an environment reference temperature (Tref) that is equal to 283 K.
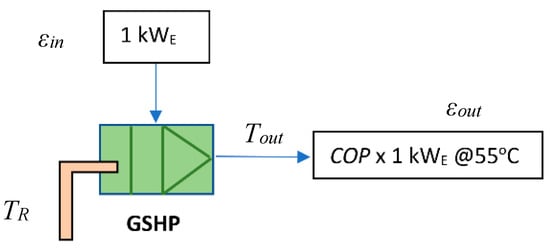
Figure 1.
Exergy input and output for GSHP.
The example shown in Figure 1 indicates that most conventional heat pumps will have an exergy-based COP value (COPEX) that is less than one according to Equation (4) even if an optimum Tout is found. In Equation (5), an optimum Tout is based on maximum COPEX for a given reservoir temperature and TR considering function constants a and b that are linearized for a given heat pump. Combining Equations (4) and (5), taking a derivative of the product, and equating it to zero gives the optimum Tout value in Equation (6) as put forth within the method of this research work:
New developments are promising in making heat pumps exergetically feasible above the threshold value in Equation (3). These include water-source heat pumps with heat recovery that has a heating COP of 8.15 and a cooling Energy Efficiency Ratio (EER) of 5.02 [54]. With technological advances, heat pumps may perform better in hybridized applications that involve hydrogen energy (see Section 3). The Primary Energy Ratio (PER) definition can also be advanced with a Primary Exergy Ratio (PEXR) definition as put forth in Equation (7) that considers a power plant with a First Law efficiency ηI and a heat pump with COPEX. If ηI is 0.3 for a conventional power plant running on fossil fuels and COPEX is 0.49 as in Figure 2 (the blue circled point), PEXR is 0.147. This means that a heat pump uses only 14.7% of the exergy available in the fossil fuel consumed at the power plant. In contrast, the PER definition would give a result of 0.3 times 2.85, which is 0.86:
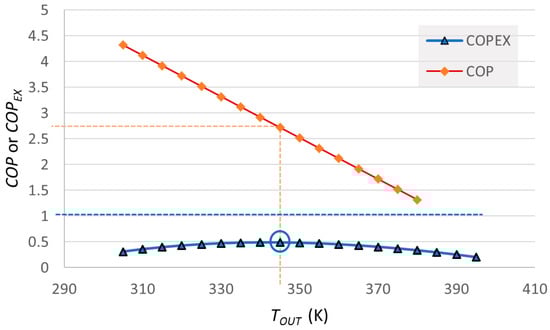
Figure 2.
Sample variation of COP and COPEX with a = 5, b = 0.04 K−1, TR = 288 K, Tref = 283K.
Evidently, the utilization of exergy-based analyses is necessary to effectively show the quality flow of energy rather than the quantity flow [55] in related analyses, design, and operation steps.
2.1.3. Exergy-Based Formulations for a Nexus Approach
Equations (8)–(13) put forth additional formulations that are used in the evaluation of the hydrogen city model. The unit exergy of each 1 kWh of the supply heat (εsup) according to the ideal Carnot cycle is given in Equation (8). Here, Tsup is the supply temperature. Similarly, Equation (8) is adapted for unit destroyed exergy (εdes), unit demand exergy (εdem), and unit returned exergy (εret):
The basis for establishing the energy, exergy, and environment nexus is provided by the exergy magnitude Ex, which is based on εsup and magnitude of thermal energy Qsup (Equation (9)), REMM efficiency (see Equations (10) and (11)) and CO2 emissions (see Equations (12) and (13)), respectively. The latter formulations are based on REMM in which a mismatch in the supply and demand of exergy is linked to additional primary energy spending in the energy system and related CO2 emissions [34].
In Equation (10), ψR is the metric for the exergy utilization rationale, namely the Rational Exergy Management Efficiency [34]. The formulation is for cases that involve power generation. If in any process, major exergy destruction takes place upstream of the useful application at the absence of power generation, then Equation (10) is replaced based on a re-arrangement of terms as in Equation (11) [34]. A weighted mean value is used when multiple energy outputs are involved:
By definition, the annual average of ψR must be at least equal to 0.80 for any connected building in a hydrogen economy district with the aim of obtaining a better exergy match. This is instrumental for reducing available CO2 emission impacts in the energy supply due to any need to re-supply primary energy resources. Equation (12) defines the compound CO2 emissions, which includes avoidable emissions due to exergy destruction in a process as represented by the term (1 − ψR) [34]:
Equation (12) as formulated in REMM [34] establishes the metric to evaluate the environmental dimension of the nexus. The first term within the square brackets is the direct CO2 emissions from an on-site (local) energy conversion unit, such as a boiler with a thermal efficiency, ηl, which satisfies a thermal load QH. Here, cl is the CO2 intensity of the energy resource that is used locally on-site. In conventional thermal systems, exergy is usually destroyed upstream of the thermal load. Hence, the second term within the square brackets derives from the forgone power generation opportunity as a function of the destroyed exergy (1 − ψR) while satisfying a thermal load QH. This second term is the avoidable CO2 emissions impact, which is associated with a power plant at the energy system level that in effect has to compensate for the forgone opportunity of generating power on-site. The variable cm is the CO2 intensity of the energy resource that is used at the power plant and ηm is the power generation efficiency of the power plant. According to an energy system boundary, the variable ηT is the overall efficiency of power transmission and power feeding. The last term in Equation (12) is the CO2 emissions that take place to satisfy the on-site electrical power demand, E.
For a net-zero CO2 building (NZCB) or district, Equation (12) implies that renewable energy resources must be used (cl and cm approach zero) and exergy mismatches must be reduced for ψR to approach one. In addition, the Ratio of Emissions Difference (EDR) as given in Equation (13) must be close to one. Here, the CO2base term is the standardized emission rate with unit defaults for 0.5 kWh thermal (QH) and 0.5 kWh electrical power demand (E) with a power to heat ratio (C) of one. Other default values include 0.2 for ψR for an energy system that does not involve any combined heat and power (CHP) with renewables. In Equation (14), CO2base is 0.63 kg CO2 per 1 kWh total energy load based on Equation (12). The CO2base is compared within EDR for a given hydrogen economy option:
2.1.4. Definition of a Composite Rationality Indicator
The efficiency of energy activities can be improved based on at least six major parameters:
- Type of fuel or renewable energy source
- Equipment and plant energy efficiency
- Rational Exergy Management Efficiency (ψR)
- Thermal loads
- Plant and grid power transmission efficiency, transformer losses, etc.
- Power loads
The trend of transitioning to renewable energy is already improving the first parameter. The second parameter, namely the equipment efficiency, is also improving as CHP, condensing boilers, and other energy technologies are approaching theoretical limits so that there is limited room for improvement. Parameters 4, 5, and 6 are also on the right track with smart grids, DC underground lines, and energy saving measures for thermal and electrical loads. In contrast, the third parameter ψR remains unresolved although it has large room for improvement. This parameter is important since the current average value for most cities is less than 0.3 [51]. This value will substantially improve by addressing more structural issues in the energy system, namely imbalances between the supply and demand of exergy. Re-thinking exergy aspects can support innovative combinations of technology in a circular economy approach, improve urban quality, and reduce CO2 emissions.
Given both quantity and quality oriented efficiency aspects, a new indicator that combines the First and Second Law efficiencies is defined as a Composite Rationality Indicator, CR. Equation (15) is valid for the use of energy efficiency values that may also be COP in Equation (16). The defined CR is used to compare proposed options, including possible uses of geothermal energy.
2.1.5. Exergy-Based Net and Near-Zero Definitions
Net-zero targets based on exergy are valid for buildings and districts as developed in previous phases of the research work and summarized in Table 1. Prior to these definitions, various applied definitions for a Low-Exergy Building (LowExB) were present [56], which may be considered as a building that satisfies its heating loads with low-exergy sources at about 40 °C and sensible cooling loads at about 15 °C to 18 °C [57]. All such definitions have been put forth for approval in ASHRAE Technical Committees, namely Exergy Analysis for Sustainable Buildings and Terminology based on [48,49,50,51]. In Table 1, related definitions are also harmonized based on above Equation (9) or Equation (13). Based on Table 1, for example, a nearly Zero Exergy Building (nZEXB) is a building or building cluster that is connected to the district returning at least 80% of the total exergy of heat and power to the district as the total exergy of heat and power supplied from the district annually.

Table 1.
Building and District Level Net and Near Zero Definitions Based on Exergy.
A Net Positive Exergy Building (NPEXB) supplies a surplus of total exergy of heat and power to the local district energy system when compared to the total exergy of heat and power received from the district energy system on an annual basis.
At a district level, a Net-Zero Exergy District (NZEXD) [35,36] is a district that has its own local centralized and/or distributed energy system with any sub-stations in the same district so that the same total exergy of heat and power is supplied by the local district energy system as the total exergy of heat and power used in the district on an annual basis. In this context, lower temperature supply networks [1,2] that take place in Fourth Generation District Energy Systems (4GDE) can support the NZEXD target. Figure 3 shows the relation between NZEXD and NZEXB targets. By definition, the parameter ψR must be equal to or greater than 0.80.
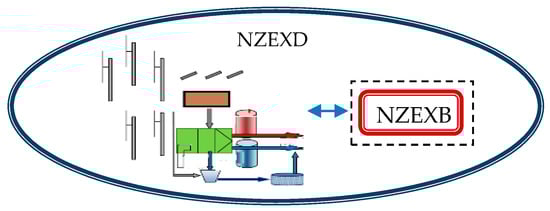
Figure 3.
NZEXD and NZEXB Targets.
3. Characterization of the Hydrogen City Model
Based on the method, a hydrogen city model is characterized based on two cycles at the district and building levels as described subsequently. Both of the cycles support the hybridization of energy options in the district energy system for the effective use of renewable energy sources.
3.1. Main Cycle of the Hydrogen City at the District Level
The first cycle consists of the central CHP plant (Figure 4). The CHP system runs on locally produced biogas from city wastes. Wind turbines and solar PVT systems are further combined to generate on-site electricity. Surplus renewable electricity is utilized in an on-site hydrogen production facility by the electrolysis of water. The produced hydrogen is stored in high-pressure tanks and upon demand, de-pressurized below 100 bar and then served to the city-wide grid. The central fuel cell system generates DC electricity that is supplemented by the DC electricity, which is generated by wind and solar energy systems. A smart low voltage DC (LVDC) micro-grid serves the district along with all information and data services. Hydrogen is about 1.5 times more energy dense compared to natural gas. The higher heating value (HHV) of hydrogen is 142 MJ/kg that favorably compares with natural gas that has a HHV of 52 MJ/kg [58]. This allows hydrogen to be better suited for being distributed in the district. In addition, the stored hydrogen is partly used to enrich the biogas that is used in the central CHP plant to generate AC electricity for the city infrastructure, mass transport systems, and industry. Biogas enriched with hydrogen increases the net reaction rate with higher addition ratios of hydrogen, thereby improving combustion [59]. The reaction of the CO2 in biogas with hydrogen in a Sabatier process substitutes conventional upgrading units [60].
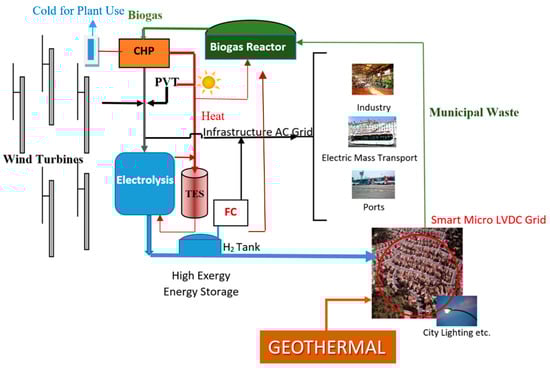
Figure 4.
Hydrogen-Solar-Wind District Plant in the Energy-Water-Environment Nexus.
The production of hydrogen from numerous renewable energy sources as given in Figure 4 can provide the basis for a more stable and sustainable energy supply profile for the district. Among the renewable energy options, double-blade wind turbines are considered to expand the feasible operational wind speed range by starting at low speeds and sustaining generating power [43]. These turbines are located only in and around the district plant due to the relatively high turbine noise.
Figure 5 shows the water cycle in the main cycle of the hydrogen city where water recycling takes place between the plant where it is first electrolyzed to produce hydrogen and the fuel cells at the central plant. Additional water input as make-up water includes treated wastewater and any light-assisted catalysis oxidation from seawater with the partial use of the power that is generated by the fuel cells. The integration of treated wastewater into the hydrogen production plant alongside any additional fresh water sources provides an opportunity to attain a more closed water cycle.
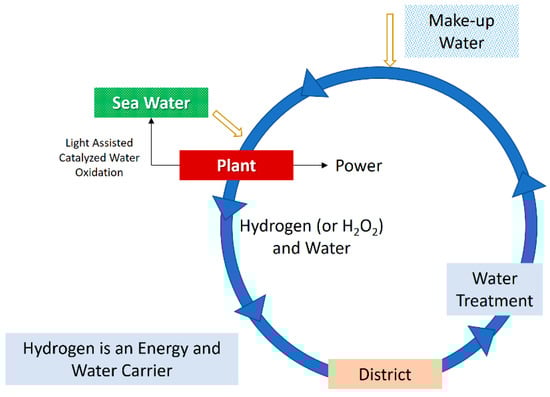
Figure 5.
Closing the Water Cycle and Generating Fresh Water from the Sea or a Large Lake.
Integration with Solar PVT-3 System
In solar PV systems, the electrical efficiency is a function of temperature with higher panel temperatures resulting in lower efficiency. PVT systems can stabilize the PV efficiency despite hotter panel surfaces. In many cases, water is circulated through heat exchanging pipes on the backside of PV panels. However, proper control of the circulation pump flow rate is essential to minimize motor power consumption. The water output temperature needs to be low if the PV is to be cooled effectively and vice versa. It is also important to maximize the total exergetic efficiency by controlling the coolant flow rate by recognizing that power and heat have different exergy levels.
PVT systems become more feasible in warmer and hot climates in which PV systems need to be cooled frequently and the temperature of the heated water can satisfy useful applications on-site. Figure 6 provides the feasibility contours of PVT systems based on average solar radiation on a flat surface in Europe. The plant size also makes a difference since unit costs reduce with total surface area of solar radiation, including costs for automation software, hardware, and equipment (e.g., pyranometers).
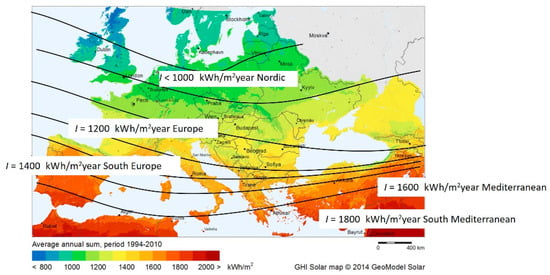
Figure 6.
Solar PVT Feasibility Map for Different Levels of Solar Irradiation in Europe.
The simple payback periods are evaluated based on PVT area in Figure 7. Based on Figure 7, even smaller systems in residential applications become more feasible and can payback the initial financial investment in a shorter time if the annual solar insolation level, I is high as in Southern Europe and the Mediterranean. The payback period is three years if I is 1800 kWh/m2-year and the PVT area is 200 m2 as denoted in the marking in Figure 7. In contrast, the same-sized PVT plant will have a payback period of 5.2 years in a climatic region with I equal to 1200 kWh/m2-year.
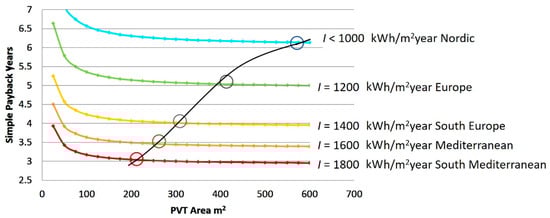
Figure 7.
Solar PVT Feasibility Diagram for Europe with Different PVT Plant Size.
The proposed hydrogen city includes a novel third-generation solar PVT system, namely PVT-3 that involves multiple layers as shown in Figure 8, including a thermoelectric generator (TEG) layer [61,62]. Thermal energy storage is achieved with an embedded layer of PCM. The circulation pump is eliminated by using heat pipes (HP), which transfer the heat when there is thermal demand and according to the level of solar insolation at the site. The glass cover (GC) and the air gap (AG) over the PV surfaces form a flat plate collector, which is optimized to maximize PVT performance.
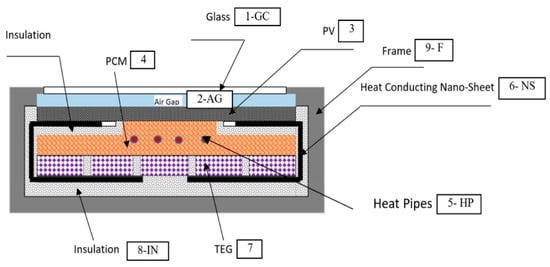
Figure 8.
Photo-Heat-Voltaic-Thermal (PVT-3) Module (not to scale) [61,62].
After sunrise, solar irradiation enables the generation of power while the undesired heating of the PV panel surfaces takes place. Cooling is effectively achieved by transferring the additional solar heat to the backside of the TEG modules with a heat-conducting nano-sheet (NS). While the packed-bed type PCM layer is thermally charging at a relatively cool temperature, a temperature difference across the TEG units takes place. This temperature difference generates additional DC power. Depending on the thermal demand, heat may be transferred to the external manifold via the heat pipes. After sunset, the PVT-3 module starts to back radiate to the cooler atmosphere from the top surface. This generates a reverse heat flow starting from the bottom of the TEG units via the heat conducting sheet. In turn, additional electrical power with a reverse polarity is generated. A polarity switch corrects the DC output sign. Power generation can be extended after sunset depending on the total PCM mass, temperature distribution, thermal mass, and the material of the module.
Figure 9 shows the PVT-3 test set-up in a horizontal position with packets of PCM material that eliminates the gravity effect of molten PCM in operation. The PVT-3 unit may also be positioned vertically for integration to building façades. In practice, it is difficult to control the flow in a heat pipe. For this reason, a device to control the heat pipes was developed, which eliminates this problem mechanically that is depicted in Figure 10. Figure 11 shows a power output performance curve of the PVT-3 prototype on a typical summer day on a flat surface with 1 m2 area and In at 750 W/m2 where In is the net solar insolation intensity reaching perpendicular to the solar PV surface. Here, E1 and E2 are the power generated by the PV layer and TEG elements of the PVT-3 module.

Figure 9.
Experimental Set-up. (Photo courtesy of Varışlı and Aydoğan).
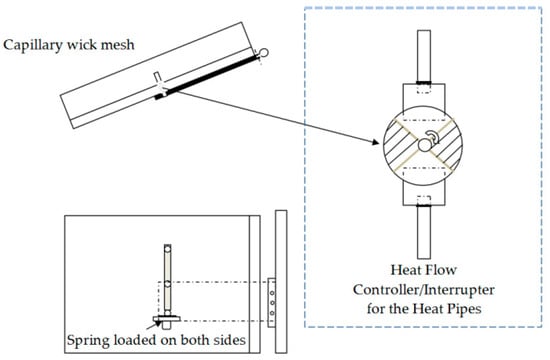
Figure 10.
Heat Pipe Controls of the PVT-3.
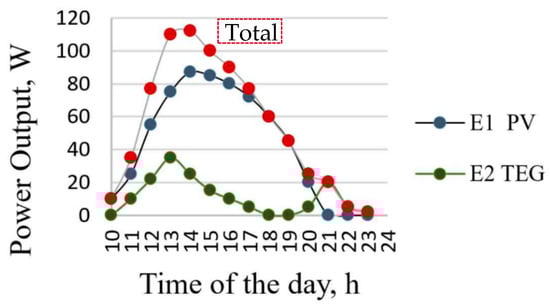
Figure 11.
Combined power performance of PVT-3 on a typical summer day [61,62].
3.2. Second Cycle of the Hydrogen City at the Building Level
A hydrogen city may be considered either for retrofit cities or new green cities in brownfield area developments. One of the first essential steps, however, is to retrofit buildings accordingly or to construct new buildings of a plug-in type that are ready for innovative hydrogen energy systems.
Figure 12 represents a transition to a hydrogen city through the phased introduction of net-positive exergy buildings that are connected to the hydrogen pipeline. A domestic fuel cell is the centerpiece of the building system with close to or even higher than 60% energy efficiency for power generation. The distributed power and heat system in Figure 12 enables a downsizing of the central fuel cell system and eliminates a thermal grid previously servicing buildings. Rather, the central fuel cell system is dedicated to other city infrastructure, mass transit, and industrial applications.
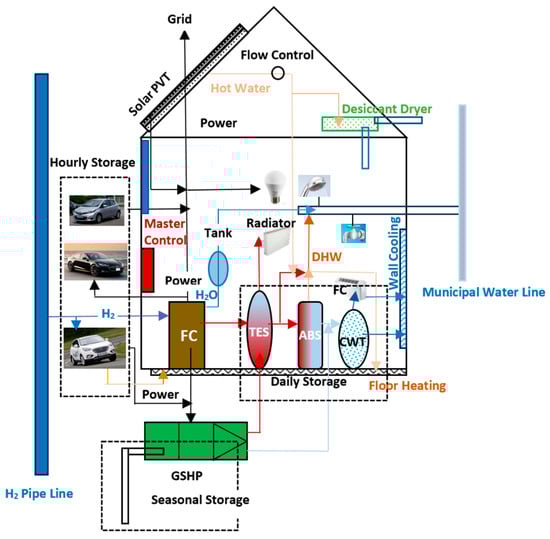
Figure 12.
All DC-Solar-Central Hydrogen Hybrid Net-Zero/Positive Exergy Building.
The building fuel cell system primarily satisfies the base loads. Other renewables are assisted by domestic daily or weekly TES and are used mainly for satisfying the peak loads, such as cooling in the summer months. Separate TES units at different exergy levels serve the building heating and cooling system. During the summer season, part of the heat is used to temperature peak the reject heat from the absorption cooling system (ABS) for DHW supply to avoid the risk of Legionella bacteria. Cold energy is used in fan-coils for peak loads and in-wall cooling panels are used for the base loads. In the winter season, if there is a cooling load present in the building, the reject heat of the ABS is used for low-temperature space heating through radiant floor systems. If thermal loads are too high, then a GSHP is installed that also serves for seasonal thermal storage in the ground.
The energy supply is complemented by roof-top and façade integrated PVT-3 that generates both power and warm water. The warm water charges the desiccant dehumidification system. In the net-positive exergy building, rainwater, fuel cell water condensate, and wastewater are domestically treated and returned to the plant in a separate water line to close an energy-water nexus (Figure 12).
Hydrogen Building to Hydrogen Car Interaction
There can be four power inputs to the net-positive exergy building of Figure 12, namely the domestic fuel cell, the solar PVT, the grid electricity provided by the central fuel cell system in DC current as well as power inputs from private vehicles, including those from any hydrogen cars.
Private vehicles spend almost 95% of their time in a parked position in or around the buildings [63]. Hourly electrical energy storage is possible by connecting the hydrogen and electric cars to the building power system. In addition, any gasoline-engine car may be a part of the hourly/nightly electrical energy storage system based on car batteries. In total, three types of cars may be docked to the building, namely those with a conventional gasoline engine, an electric car, or a hydrogen car.
The source of supply to electric cars depends on the context of the energy system in which they operate. If an electric car is parked in the building of Figure 12, then car batteries may be charged by the fuel cell system at a much higher efficiency of power conversion using hydrogen gas and with almost zero emissions due to the fact that hydrogen is produced by renewable energy. Even in the case of the conventional gasoline engine car, the car may be connected to the electrical system of the building to provide electricity from its battery that is charged during the daytime while driving.
In the presence of a parked hydrogen car, hydrogen fuel may be received at the building site after pressurization. In turn, the hydrogen car may provide power, water, and heat to the building. Figure 13 depicts a “hydrogen building to hydrogen car” interaction. In this case, a micro hydrogen generating system may be added to the hydrogen building, driven by the excess power generated by the PVT-3 system, possibly during the daytime when the hydrogen car is away off-site and the power load of the building may be at a minimal level according to lower occupancy. This additional generation supplements the main hydrogen grid supply. When the car docks back to the building, the hydrogen stored in the dedicated storage tank is pressurized more and supplied to the hydrogen car. In the meantime, electrical energy derived from the building may charge the backup battery of the car or vice versa to enable nightly electrical energy exchange between the car and the building.
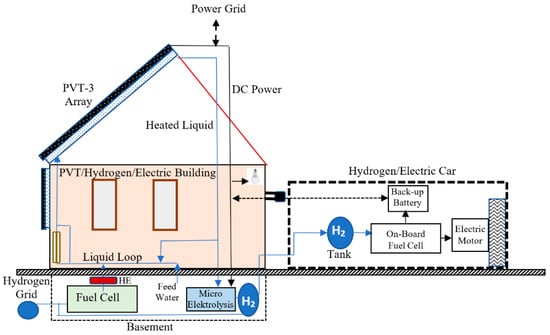
Figure 13.
Schematic for Hydrogen Building to Hydrogen Car Interaction.
4. Results for the Exergy Rationale of the Hydrogen City Model
Figure 14 shows the Exergy Flow Bars [42] for a baseline district energy (DE) system to which the hydrogen city model is compared. The baseline DE system uses natural gas with a combustion temperature of 2000 K while the reference environment temperature is 283 K. The available unit exergy (blue bars) is initially equal to εsup that reduces at each proceeding application and point of exergy destruction. The first application is electricity production after which an alternating order of exergy destruction and applications at lower temperature levels take place for heat and cold production. The REMM Efficiency ψR of the baseline DE system is calculated from Equation (10) as 0.25 based on two temperature intervals that represent points of exergy destruction. The values of the temperature intervals that determine εdes(1) and εdes(2) are given in Table 2 that represent un-used temperature intervals between demanded applications. If the same system involves an additional steam generation process starting from 600 K and ending at 450 K, then the temperature interval for εdes(1) will be split and reduce to (1 − 600 K/700 K) plus (1 − 365 K/450 K), which would increase the REMM efficiency only to 0.42. Exergy losses due to the pumping of any steam if generated and the hot and cold-water circulation in separate circuits in the district are not included in this value.
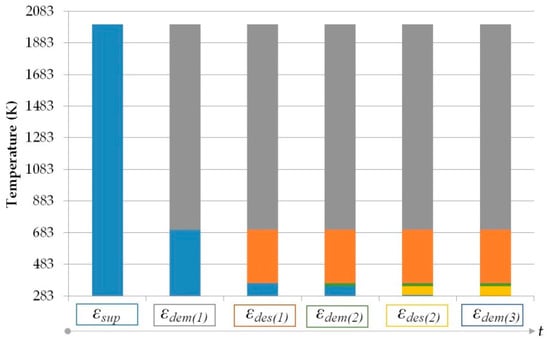
Figure 14.
Exergy Flow Bars for a Conventional DE System with Power, Heat, and Cold Supply.
Table 2.
Un-Utilized Temperature Intervals between Demanded Applications.
The baseline DE system that provides a basis of comparison is to be upgraded to a hydrogen city. Figure 15 puts forth the linkages between the various components in providing exergy supply and useful applications. In the hydrogen city model, the circulation of hot and cold water and any steam is eliminated through the circulation of hydrogen gas, which is less energy intensive. In the upper left component of Figure 15, solar energy is utilized in the PVT-3 system in the plant. First, DC electric power is generated in the PV modules. The heat that is absorbed by the PV coolant is utilized in the thermal charging of the biogas reactor. The exergy flow bar for a typical PVT-3 application at a solar insolation level of 600 W/m2 is depicted in the form of the upper left bar in Figure 15. Here, the Carnot cycle equivalent temperature for solar energy Tfs is by definition the mapped equivalent source temperature for solar energy at a given insolation level In as given by Equation (17) [64]. This enables an exergy accounting with a more consistent boundary other than a Sun-Earth boundary.
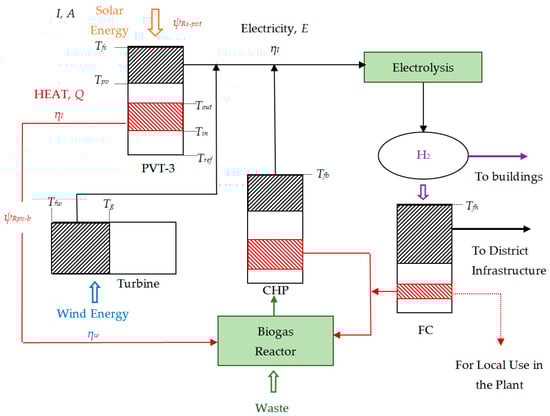
Figure 15.
Exergy Flow Bars for the District Energy Plant of the Main Cycle Generating Hydrogen from Renewables for Power, Heat, and Cold Supply.
According to Equation (17), if In is 600 W/m2, then Tfs is 486 K. From Equation (10), the value of ψR for the PVT-3 will then be established as given below. This involves typical operating temperature values of TE as the PV layer average temperature with cooling at 313 K, Tout as the average supply water temperature from PVT-3 to the biogas reactor at 303 K, and return temperature Tin at 298 K.
In addition to the PVT-3 system, the Carnot cycle equivalent temperature Tf for wind energy at a given mechanical energy of ηW, namely Tfw, is given by Equation (19) [42]. Accordingly, if the wind turbine efficiency ηW is 0.4, then Tfw will be 471.6 K.
The DC power generated by the wind turbine system is combined with the PVT-3 DC output. This power combination is further supported by the CHP system, which is driven by biogas. Cumulative DC power is utilized mainly in the electrolysis process. The generated hydrogen drives the central fuel cell system to generate electricity as needed. As a means of utilizing residual heat to a maximum extent, the residual heat of the CHP system mainly goes to the biogas reactor (see arrows from the red component in Figure 15). Part of the residual heat may be also utilized within the plant such as in the form of DHW. In contrast, the CHP power output may be partially inverted to AC for district infrastructure that is not shown. Based on an analysis of the district energy plant, Figure 15 provides the Exergy Flow Bars in each step and marks the respective exergy components.
4.1. Partial REMM Efficiencies and CO2 Emissions Avoidance
Partial REMM Efficiencies, ψRi−j between any node i and j is calculated by using Equation (10) or Equation (11) as provided in the method of Section 2. These nodes depend on the locations of the points of exergy destruction either upstream or downstream of the major application. As an overall summation, the averaged REMM Efficiency is found as given in Equation (20) [64]:
In Equation (20), Exi−j is the exergy flow between nodes i and j. The term Exi−j depends on the energy flow between the same nodes i and j multiplied by the temperature factor (1 − Tref/Tout) and divided by the First Law energy efficiency. After applying typical operational temperatures and efficiencies for the hydrogen economy cycle, the value of ψR bar varies between 0.75 and 0.85. Such a range represents typical daily variation of the efficiency as well as the overall performance. The value of ψR bar is higher than district energy systems using fossil fuels. Comparing a value of ψR bar at 0.80 for the hydrogen economy cycle and 0.42 for the baseline DE system, the hydrogen city model has a potential of 32% more reduction in CO2 emissions from the built environment stock ({[(2 − 0.42)/(2 − 0.80)] − 1} × 100 = 31.67%).
4.2. Additional Exergy Benefit of the Hydrogen City
In conventional district energy systems, thermal energy in the form of heating, cooling, DHW, and sometimes steam is distributed in the district in separate circuits, each having different flow rated pumping requirements. In particular, water circulation that requires pumping power and a piping network is energy/exergy intensive both in embedded and operational terms. These parasitic losses may be up to 10% of the load and even 15% during cooling. The parasitic pumping energy demand for district energy systems and the parasitic losses will be much less in a hydrogen economy as another important advantage. In hydrogen piping, the circuit length practically has no limit. In contrary, depending on the amount of thermal power of different forms to be distributed, there are economical and technical limits on the maximum piping length as given in Equation (21) for heating.
In Equation (21), QH is the useful thermal power to be transmitted and Lmax is the farthest point that a closed thermal circuit may feasibly reach. Here, ao is an empirical constant, which is generally taken as 0.6 km. The power n depends on the temperature, thus the exergy of the heat supplied, as provided in Equation (22). Tref is 283.15 K while 333.15 K is the traditional supply temperature. For cooling circuits, a similar formulation is applicable.
4.3. Comparison with a Circular Geothermal Option
Low-enthalpy geothermal energy sources provide another option for the hydrogen city model if such resources exist in the vicinity (see previous Figure 4). This option emerges from the fact that low-enthalpy geothermal energy sources have about a 30% share among different heat sources that drive ORC systems for electricity generation [65]. The ORC market is rapidly increasing but their expansion is dependent on economic incentives, subsidies, and special tariffs [65,66]. For this reason, the ORC industry is reliant on the economic benefits of producing and selling electrical energy based on favorable conditions without considering the existing possibilities of improving exergy efficiency and acting upon the additional benefits of utilizing the available waste heat [67].
Exergy analysis mainly focuses on the ORC operation and design without a holistic approach based on its connection between the energy source and demand points in the built environment. For example, Rowshanzadeh [68] underlined the wide-ranging applications of ORC technology while pointing out the need for exergy analysis. Sun et al. [69] investigated the suitable application conditions of ORC-Absorption Refrigeration Cycle (ARC) and ORC-Ejector Refrigeration Cycle (ERC) and compared results based on exergy analyses. Marini et al. [70] analyzed an ORC system driven by solar energy with vacuum-tube collectors that provided electrical power for a building. The performance of different working fluids was simulated based on the objective of minimizing exergy destruction to conclude that ORC can be exergetically feasible given careful optimization.
Other studies that evaluated the benefits, risks, and potential disadvantages of ORC systems from a sustainability perspective indicate that ORC units may not be ecologically sound if used in a stand-alone format to generate only electric power [67]. ORC systems need to be bundled with other renewable energy resources, systems, and energy storage units to be acceptable from an exergy point of view [67]. From this perspective, exergy analyses can be used to quantify the advantages and disadvantages of using stand-alone ORC units versus different bundling alternatives with other renewable energy systems. Kılkış et al. [53] indicated that the First Law of Thermodynamics is not sufficient to evaluate ORC systems for maximum performance and environmental sustainability. Different renewable energy systems and energy storage need to be bundled to form a hybrid system.
In this context, ground heat and geothermal energy is combined in a circular exergy flow to support the hydrogen city model. The option in heating mode is shown in Figure 16 in which each unit power of geothermal energy at 80 °C is utilized in an ORC unit, which produces 0.08 kWE that is used in a GSHP. The GSHP can generate 0.32 kWH given that the average COP is 4.0 at an output temperature of 55 °C in heating mode. This is coupled with the waste heat of the ORC at the same output temperature and directed to the district buildings in a local sub-district heating network.
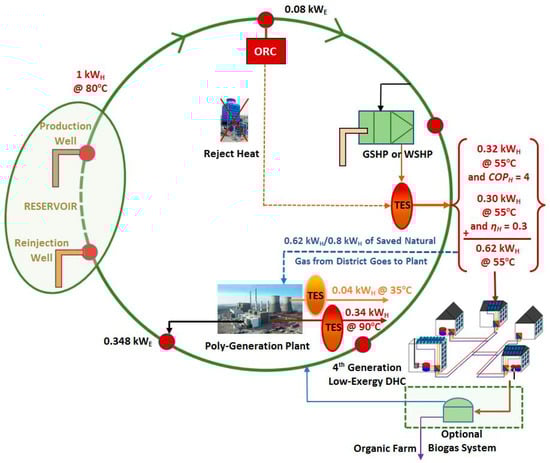
Figure 16.
Combined Heat and Power in Circular Geothermal Model in Heating Mode.
If needed, the saved natural gas from the buildings’ previous on-site thermal systems is utilized in a poly-generation unit based on fuel cells. TES that are suited to two different levels of exergy are used to match the loads and shave-off peak loads. Electricity and additional high-exergy heat is generated at 90 °C for high-temperature applications in the district. In the cooling season, this heat may be used in absorption chillers for cold generation. From the geothermal production well to the re-injection well, the overall performance results are obtained as the total output. The three thermal power terms that include the later term at 35 °C for the preheating of DHW provides 1 kWH.
In the case that the displaced natural gas, which was originally used in the district, is consumed internally in the fuel cell unit, then the gross COP of the Circular Geothermal option becomes 1.348 based on 1 kWH of geothermal thermal power input (Equation (24) and Figure 16). COP is greater than a value of one, since ground heat is utilized in the GSHP in addition to the geothermal energy.
Starting from a unit geothermal power at 80 °C (353 K), the Circular Geothermal option provides 0.348 kWE and 1 kWH at different supply temperatures. This output compares favorably with the 0.08 kWE supplied by the ORC unit without reject heat recovery (see Table 3) and 1 kWH at 80 °C supply if the geothermal power is utilized in the district in the form of heating only. In contrast, the above Equation (24) algebraically combines heat and power although their exergy values are quite different. While COP is greater than one, this definition is misleading and requires the use of the COPEx definition that considers the quality of the outputs as put forth in Equation (4).
Table 3.
Comparison of the Circular Geothermal Option with Conventional Options.
In the above application of Equation (4), COPEX is the exergy-based COP for the entire cycle. All systems operate at constant base load. Optional solar and wind energy systems in the district contribute to peak loads with thermal storage. The grid is also acting for electrical energy storage at large. The entire collection of systems operates in a cascaded form, similar to a single, large-scale heat pump. If only an ORC unit would be used, then COPEX would be 0.092 and only 0.08 kWE would be generated. For this reason, the bundling of renewable energy systems can be warranted.
In some countries, including Italy, New Zealand, and Turkey, geothermal reservoirs are located in carbonate-rich rock grabens that contain calcium carbonate (CaCO3). This means that geothermal wells extract CO2 that needs to be recaptured, which is a rather expensive process. Consequently, most of the applications release CO2 emissions into the atmosphere, nearly at a rate of 0.5 kg CO2/kWh. In extreme cases, such as in the Menderes and Gediz grabens with high-enthalpy geothermal energy sources, the CO2 emissions per kWh as c is 0.9 to 1.3 kg/kWh that can be much higher than coal-based thermal plants [71,72]. If, however, a pumped binary power plant is used, then the emission factor is zero [72]. An effective CO2 capture and selection of the right technology are necessary if such reservoirs are to contribute favorably towards the aims of the Paris Agreement.
The Circular Geothermal option as shown in Figure 16 comprises of geothermal production and re-injection wells, an ORC system, GSHP or water-source heat pumps (WSHP), a district energy distribution and collection system, a poly-generation system, and TES at different exergy levels. Such an option couples and mobilizes ground thermal energy and geothermal energy, including with the aim of displacing the use of natural gas in boilers for space heating in buildings. Instead, the displaced natural gas is used in the poly-generation plant with the generated electric power fed into the local grid. In distributed applications, the evaporator side of the heat pumps may be coupled to PV systems if this option is used in buildings to absorb the heat collected by the panels to improve the COP of the GSHP. The flow rate needs to be dynamically optimized according to instantaneous solar insolation, heat demand, and other operating conditions to maximize the total exergy output (both power and heat) of the PVT system [61,62]. A biogas system that could be mixed with natural gas that is saved from the boilers and also provide organic fertilizer for local farming is optional.
The multiple outputs of the Circular Geothermal option surpass the outputs of conventional options. In this respect, Figure 16 can be contrasted to options that have singular outputs, namely a DE system based on natural gas and the use of geothermal energy in ORC to produce only electricity. The integration that enables the multiplicity of outputs in Figure 16 also provides for improvements in the value of ψR. This is further valid if the Circular Geothermal option is compared to the direct use of geothermal energy for separate heat and power production. The direct use of geothermal energy for district heating (Figure 17) and the direct use of geothermal energy for ORC power generation (Figure 18) are compared based on Exergy Flow Bars as provided below.
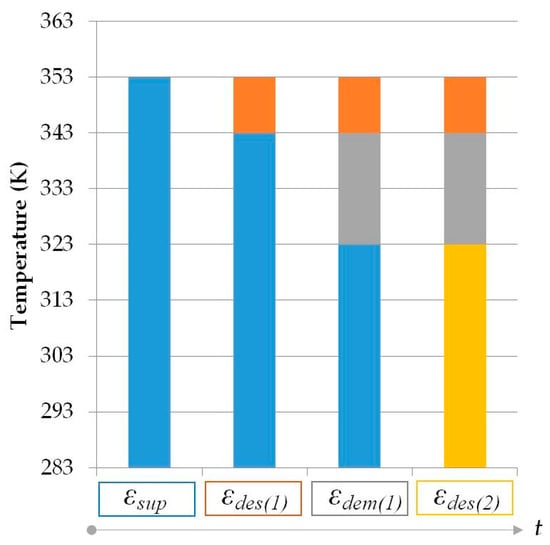
Figure 17.
Exergy Flow Bars for Geothermal District Heating.
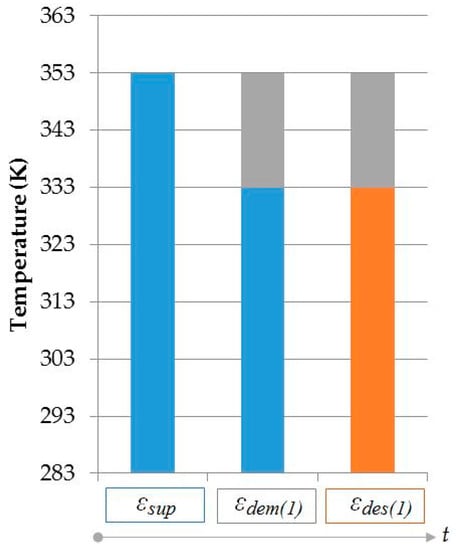
Figure 18.
Exergy Flow Bars for Direct Geothermal Power with ORC.
In Figure 17 for the direct use of geothermal energy for district heating, exergy destruction takes place both upstream (εdes(1)) and downstream (εdes(2)) of energy usage. Since exergy is also destroyed upstream, Equation (11) is used for the REMM Efficiency ψR based on an ideal Carnot cycle [42]:
Here, εdem represents the demand exergy of the district heating system application between 70 °C (343 K) and 50 °C (323 K) for buildings that are connected to the system (see also Equation (11)). Another feature of the analysis is the ability to identify the exergetic match of the exergy supply with the final application. The final application is comfort heating at 20 °C indoor air temperature in buildings so that the εdem term is replaced by (1 − 283 K/293 K). In this case, ψR reduces to 0.172.
Figure 18 provides the Exergy Flow Bars for the ORC power generation case. The un-utilized thermal output of the ORC is taken at temperatures about 60 °C (333 K) onwards. Since practically no exergy destruction takes place upstream, Equation (10) is applied as given in Equation (27):
The resource temperature Tf is the geothermal fluid temperature at the wellhead that is taken as 353 K also in Figure 17, Figure 18 and Figure 19. If any fuel like biogas or natural gas is used, then this temperature is equal to the Adiabatic Flame Temperature (AFT). As previously defined, an equivalent temperature is put forth for solar, wind, and any other renewable energy resource without a direct Tf value.
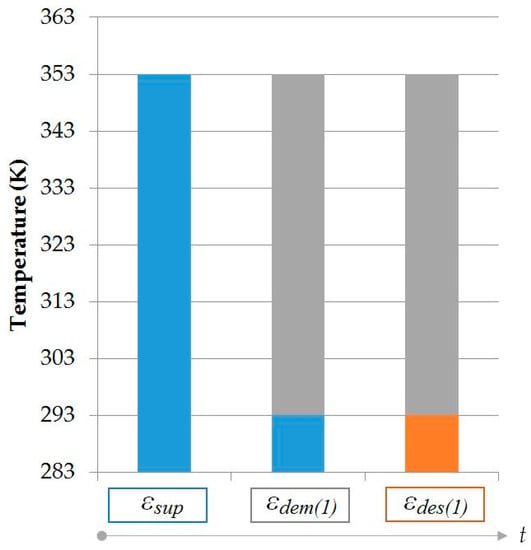
Figure 19.
Exergy Flow Bars for the Circular Geothermal Option.
The primary characteristic of the Circular Geothermal option is that it represents an integrated, compound power and heat system at large. The option may be also applied to single buildings and scaled up to large district energy systems with possible integration with a hydrogen economy cycle. While most suitable for 4GDE, the Circular Geothermal option can be further applicable to district cooling applications. In this case, cold storage and absorption/adsorption units may be used.
The two options in Figure 17 and Figure 18 are further compared based on the CR indicator as defined in Equations (15) and (16). From Equation (15), the values of CR for geothermal district heating and power-only ORC options are 0.19 and 0.019, respectively. Here, the value of the net energy efficiency after parasitic losses ηI is taken as 0.65 for district heating while it is taken as 0.08 for ORC.
The approach of CR further reveals advantages when applied to the Circular Geothermal option for which the Exergy Flow Bars are provided below in Figure 19. Other minor exergy destructions in heating are neglected. The respective values based on the application of Equation (10) are:
and from Equation (16):
After comparing the above results, the CR values are further used to evaluate a CO2 reduction potential ratio R according to REMM [38]. Equation (30) compares the geothermal district heating only case with CR = 0.19 and the Circular Geothermal option with CR = 1.114. A similar comparison with the power-only ORC case with CR = 0.09 indicates 2.15 times higher CO2 reduction potential. The degree of improvement increases with the geothermal reservoir temperature and applications.
4.4. Comparison of Options for the Hydrogen City Model
Table 4 compares each option based on ψR values and the CO2 avoidance capacity based on unit CO2 emissions, including an avoidable CO2 emissions impact due to exergy mismatches in the energy system according to REMM [34]. The reference values represent separate heat and power production. The comparisons in Table 4 indicate that the hydrogen city model with renewables has important advantages over the reference and conventional DE systems. The inclusion of a Circular Geothermal option can further improve the values of the proposed model. For example, the hydrogen city model with all renewable energy and a contribution from the geothermal energy option has a ψR value of 0.83 as given in Table 4, which takes place above the targeted value of 0.80.
Table 4.
Overall Comparison of Conventional and Proposed District Energy System Options.
Such improvements are further represented in the EDR values based on Equation (13) so that the exergetic advantages of these options are compared to reductions in CO2 emissions over the reference case. In particular, while the reference case has no reduction (EDR = 0), the evaluated options represent incremental or significant improvements in EDR values when compared with CO2base. The greatest improvements take place for the hydrogen city model with all renewable energy sources involving the inclusion of a Circular Geothermal option. The EDR values of these options are calculated as 0.91 and 0.92, respectively, which indicates greater CO2 savings over CO2base. These EDR values can qualify the district as a nZCD based on the net-zero definitions that were provided in Table 1. In contrast, none of the options have EDR values equal to 1 for a strictly NZCD status although these values have closely approached to 1 already with the respective values in Table 4.
5. Discussions on an Application of the Hydrogen City Model to a New Settlement
About half of the carbon budget that remains to have a chance of limiting global warming to at most 1.5 °C by the end of this century could be consumed with the emissions impact from new urban development alone unless prompt action is taken to avoid lock-in to incumbent technologies [73]. One implication of the present research work requires that new settlements, most preferably at brownfield sites to reduce land use changes, are equipped with an energy system that maximizes the rational use of renewable energy sources based on exergy matches between the supply and demand.
For this reason, an application of the hydrogen city model was considered for a new district development in the province of Ankara, Turkey (40.13° N, 33.00° E) that has a population target of 200,000 inhabitants. Degree days for seasonal heating (less than or equal to 15 °C) and cooling (greater than 22 °C) are 2493 and 289 degree-days, respectively [74]. Although Ankara appears to have dominance of the heating season, practices in other recent urban development projects that are in operation indicate considerable increases in comfort cooling loads. Figure 20 shows the annual variation of monthly average outdoor dry-bulb temperatures [75]. The local climate is dry and latent cooling loads may be negligible except in gathering places. Design outdoor dry-bulb temperatures are −12 °C for winter and 35 °C for summer with a cooling season that is less than three months.
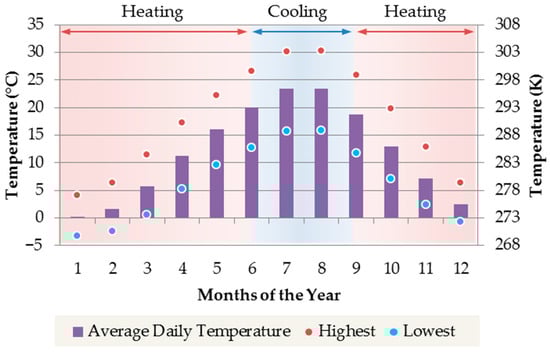
Figure 20.
Annual Variation of Monthly Average Outdoor Dry-Bulb Temperatures in Ankara.
The new district development is expected to consist of residential areas, social service buildings, offices, shopping plazas, and mixed mode (office, residential, commercial) buildings. Consequently, low-rise residential buildings, single story homes, and higher-rise office buildings will be common. The total required floor area of all buildings, AF in the new settlement is obtained by Equation (31):
Here, P is the population and q is the floor area per person averaged for the settlement based on different building functions, typology, and their relative mix in the settlement plan.
In Equation (31), the multiplier q generally decreases with P. Conversely, density per given floor area increases with higher population [76]. This relation is represented by the power of P, namely y that depends on climate, population, culture, average affluence, geographic location, population of neighboring built environments, and the degree of daily or weekly commuting, among other factors. Therefore, y is a number smaller than 1 (0.8 in this case) while q is taken to be 10 m2 per person for the purposes of the case study. The multiplier q also varies based on the development of the region or country and building function(s). About 65% of the world population has less than 20 m2 per person [77]. Moreover, the average number of floors in the buildings for minimum CO2 emissions responsibility is optimized. The optimum number of floors in the buildings with conventional walls (no glass façade) that are partially integrated with PVT-3 panels on south facing walls was determined to be 25 floors for the present case study based on the optimization approach as developed in related research [76]. The evaluations are used to find the number of buildings and to determine energy loads using the tool available for the Building Energy Performance of Turkey, namely BEP-TR [78].
Table 5 provides typical data for the hydrogen city model at the building level for a building with total area of 250 m2 based on loads and equipment differentiated for the heating and cooling seasons. Peak thermal and power loads of the city were predicted for nominally well-insulated hydrogen homes. The two TES options and cold storage are further integrated into the building. Electrical loads of the typical building increase in the summer months since the COP values of heat pumps decrease in the cooling season. More power is required even if the cooling capacity is the same as the heating capacity. In addition, cooling appliances require more power in the summer months. However, this increase in individual power demands can level-off at the district scale since the diversity factor is greater in the summer months with inhabitants locating to coastal areas. Such a load balancing factor that is typical for the context of Ankara makes it possible to size the system with respect to the winter season without any redundancy for the cooling season. The same holds true for the fuel cells, which are also sized for the heating season. The only seasonal redundancy will be the absorption chillers, which are not used in the heating season. However, this capacity may be directed to the industry for such applications as cold warehouses. Moreover, the PVT-3 system produces more power and heat in the summer months due to the increase in solar insolation. This helps to overcome the increase in the power demand in the summer months and at the same time, charges the desiccant system. Absorption cooling is activated by hydrogen heat upon demand. The heat output of the PVT-3 in the summer goes to DHW demands. Therefore, load amounts and type variations in the summer months are largely compensated at the building scale. This enables the central power system to operate with the same overall demand loads year-round.
Table 5.
Typical Building Level Data for the Hydrogen City Model.
At the district level, Table 6 tabulates the power and thermal loads for the main cycle of the hydrogen city model. The power and thermal loads include those for mass transport, city lighting, and miscellaneous service loads. The base loads are taken to be about 50% of the peak loads, including diversity factors, while peak loads are to be satisfied by various energy storage. Overall, the district is evaluated to have electrical loads of 10,000 kWE, heating loads of 20,000 kWH and cooling loads for sensible and latent cooling needs at 14,000 kWC and 10,000 kWC, respectively. As implied by the loads that can be provided by equipment and energy systems in the hydrogen city, including hydrogen storage, the district produces sufficient energy at the required exergy levels to qualify in becoming a nearly self-sufficient district towards reaching a possible NZEXD status. The region is nominally rich in low-exergy geothermal energy resources with wellhead temperatures in the range of 80 °C to 70 °C, which can also permit integrating a Circular Geothermal option.
Table 6.
Power and Thermal Loads for the District Infrastructure.
6. Conclusions
The rapidly emerging penetration of renewable energy systems makes it more feasible to establish a hydrogen economy, which needs to be optimized by both the First and Second Laws of Thermodynamics. In this research work, third-generation PVT modules, double-blade wind turbines, high-efficiency fuel cells at the central plant and building levels, as well as cogeneration based on hydrogen-enriched biogas, are gathered around a district level hydrogen economy approach. The renewable energy-based hydrogen city model was found to provide an end result that is particularly rewarding for DE systems. The analysis of the renewable energy-based hydrogen city model with PVT-3 and high-efficiency wind energy indicated the possibility of obtaining values of the REMM efficiency reaching 0.80 and savings in CO2 emission impacts when compared to a conventional DE system based on lower primary energy spending. Values of the parameter ψR at or beyond 0.80 were targeted as a criterion for a net or nearly net-zero exergy status for the district. In addition to exergy benefits, a more closed-loop water cycle is proposed to provide a way in which hydrogen economy can support a more self-sustaining urban water cycle in an energy-water nexus.
The two cycles of a hydrogen city model and the Circular Geothermal option are found to provide a useful approach in contributing to the success of future hydrogen economy cities as well as a more rational utilization and storage of renewable energy sources. Dedicated metrics to evaluate related improvements, including an assessment of COP values for heat pumps based on exergy, namely COPEX were also integrated into the analyses. The dedicated metrics have enabled an effective comparison with conventional DE systems, including natural gas based DE systems as well as those in which there may be only district heating or only electricity generation. These metrics underlined the importance of utilizing renewable energy resources in combined energy systems.
The results for the hydrogen city model and Circular Geothermal option have addressed a gap in the literature for analyzing renewable energy oriented hydrogen economy solutions for urban energy systems. The two hydrogen cycles at the district and building levels that are analyzed from an exergy framework can provide districts with new opportunities to reach near-zero exergy targets. The comparative analyses have shown that this target is achievable and the level of match between the supply and demand of exergy can be effectively increased in comparison to the basic DE system. The effective utilization of renewable energy sources also increased the emissions difference with the reference values, including avoidable CO2 emissions. Indeed, utilization of renewables in hydrogen economy can have a key role in the success of urban energy systems. For example, the Athlete’s Village of the Tokyo 2020 Olympics will be the first hydrogen city example relying on renewables [80]. The possible case study of a 200,000 inhabitant hydrogen city in a new settlement in Ankara, Turkey as analyzed in this research work is important to diversify the options that may be adapted to reach net-zero targets in the urban context with an outlook for the more rational use of exergy. The integration of hydrogen economy principles, considerations of an energy-water nexus and net-zero targets can provide an effective option for the future of urban settlements and districts.
Author Contributions
B.K. conceived the Hydrogen City model that provided the basis for the research work and also designed the experiments for the PVT-3 system. Ş.K. contributed to analyses in formulations and comparisons of the energy system options based on REMM metrics and net-zero targets.
Acknowledgments
The manuscript is a revised and expanded version of an original scientific contribution that was presented at the 12th Conference on Sustainable Development of Energy, Water and Environment Systems (SDEWES) held during 4–8 October 2017 in Dubrovnik, Croatia entitled “Hydrogen Economy-Based Net-Zero Exergy Cities of the Future with Water-Energy Nexus.” A case study of a new settlement is added to the present version among other original elaborations. Funding has not been received to undertake the research work.
Conflicts of Interest
The authors declare no conflict of interest.
Nomenclature
| AF | Total floor area of buildings to be occupied by population P, m2 |
| a, b | Heat pump COP versus heat output temperature function constants |
| ao | Constant of Lmax |
| C | Power to heat ratio, dimensionless |
| c | Emissions ratio (Factor), kg CO2/kWh |
| CO2 | Compound carbon dioxide emissions, kg CO2 |
| COP | Coefficient of Performance (First Law) |
| COPEX | Exergy-Based Coefficient of Performance (Second Law) |
| CR | Composite Rationality Indicator |
| E | Electrical energy (load), kWh |
| EDR | Ratio of Emissions Difference to the base case CO2 emissions, dimensionless |
| Ex | Exergy, kW or kWh |
| I | Annual solar insolation on horizontal surface, kWh/m2/year |
| In | Net solar insulation intensity reaching perpendicular to the solar PV surface |
| Lmax | Maximum length of the district circuit (one way) |
| PER | Primary energy ratio |
| PEXR | Exergy-based primary energy ratio |
| Q, QH | Thermal energy (load), kWh |
| Q | Floor area per person, m2/person |
| R | CO2 reduction potential ratio |
| T | Temperature, K |
Greek Symbols
| ηEX | Second Law Efficiency, dimensionless |
| ηT | Power transmission and distribution efficiency |
| ψR | Rational exergy management efficiency, rationality ratio |
| ε | Unit exergy, kW/kW |
| ηI | First Law Efficiency |
| Δ | Difference |
Subscripts
| b | Biogas |
| base | Base |
| c | Cold |
| dem | Demand |
| des | Destroyed |
| E | Electric |
| f | Resource temperature, or Adiabatic Flame Temperature (Real or virtual), K |
| g | Generator |
| H | Thermal (Heat) |
| h | Hydrogen |
| i, j | Node indexes for partial REMM efficiencies between two nodal connections |
| in, out | Inlet and outlet connections of a hydronic circuit |
| l, m | Local power plant, distant power plant, respectively |
| min, max | Minimum, maximum |
| opt | Optimum |
| R | Rational or Reservoir |
| ref | Reference |
| ret | Return |
| s | Solar |
| sup | Supply |
| ref | Reference |
| T | Power transmission |
| w | Wind |
| X, EX | Exergy, exergetic |
Superscripts
| n | Maximum district circuit length coefficient |
| y | Population coefficient |
Chemical Symbols
| CaCO3 | Calcium carbonate |
| CH3OH | Methanol |
| CO2 | Carbon dioxide |
| H2 | Hydrogen |
| H2O2 | Hydrogen peroxide |
Abbreviations
| 4GDE | Fourth generation district energy system |
| ABS | Absorption chiller |
| AC | Alternating current |
| AG | Air gap |
| AFT | Adiabatic flame temperature, K |
| ARC | Absorption Refrigeration Cycle |
| CR | Composite Rationality Index |
| CHP | Combined heat and power |
| CWT | Cold water tank |
| DC | Direct current |
| DE | District energy |
| DHC | District heating and cooling |
| DHW | Domestic hot water |
| E1 | Power generated by PV layer of the PVT-3 module |
| E2 | Power generated by the TEG elements in the PVT-3 module |
| EER | Energy Efficiency Ratio |
| ERC | Ejector Refrigeration Cycle |
| F | Frame of the PVT-3 module |
| FC | Fuel cell, Fan-coil |
| GC | Glass cover |
| GSHP | Ground-source heat pump |
| HHV | Higher heating value |
| HP | Heat pipe |
| HWT | Hot water tank |
| IN | Insulator |
| LowEx | Low-exergy |
| LVDC | Low-voltage DC power |
| NPEB | Net Positive Energy Building |
| NPEXB | Net Positive Exergy Building |
| NS | Heat-conducting nano sheet |
| NZCB | Net-Zero CO2 Building |
| nZCB | Near Zero CO2 Building |
| NZCD | Net-Zero CO2 (Emissions) District |
| nZCD | Near Zero CO2 District |
| NZEXB | Net-Zero Exergy Building |
| nZEXB | Nearly Zero Exergy Building |
| NZEXD | Net-Zero Exergy District |
| nZEXD | Near Net-Zero Exergy District |
| ORC | Organic Rankine cycle |
| PCM | Phase change material |
| PV | Photovoltaic |
| PVT | Photovoltaic-thermal |
| PVT-3 | Third-generation photovoltaic-thermal |
| REMM | Rational Exergy Management Model |
| rms | Root-mean square |
| TEG | Thermo-electric generator |
| TES | Thermal energy storage |
| V2B | Vehicle to Building or Vehicle to Grid (V2G) |
| WSHP | Water-source heat pump |
| ZEH2E | Zero-energy hydrogen economy |
References
- Lund, H.; Østergaard, P.; Connolly, D.; Vad Mathiesen, B. Smart energy and smart energy systems. Energy 2017, 137, 556–565. [Google Scholar] [CrossRef]
- Lund, H. Renewable Heating Strategies and their Consequences for Storage and Grid Infrastructures Comparing a Smart Grid to a Smart Energy Systems Approach. Energy 2018, 151, 94–102. [Google Scholar] [CrossRef]
- Mathiesen, B.; Skov, I.; Hansen, K.; Connolly, D.; Wunsch, J. Applications of SOECs in Different Types of Energy Systems: German and Danish Case Studies; Department of Development and Planning, Aalborg University: Aalborg, Denmark, 2015. [Google Scholar]
- Veziroğlu, N. Conversion to Hydrogen Economy. Energy Procedia 2012, 29, 654–656. [Google Scholar] [CrossRef]
- Duić, N.; Krajačić, G.; Graça Carvalho, M. RenewIslands methodology for sustainable energy and resource planning for islands. Renew. Sustain. Energy Rev. 2008, 12, 1032–1062. [Google Scholar] [CrossRef]
- Krajačić, G.; Martins, R.; Busuttil, A.; Duić, N.; Graça Carvalho, M. Hydrogen as an energy vector in the islands’ energy supply. Int. J. Hydrog. Energy 2008, 33, 1091–1103. [Google Scholar] [CrossRef]
- Sørensen, B.; Petersen, A.; Juhj, C.; Ravn, H.; Søndergren, C.; Simonsen, P.; Jørgensen, K.; Nielsen, L.H.; Larsen, H.V.; Morthorst, P.E.; et al. Hydrogen as an energy carrier: Scenarios for future use of hydrogen in the Danish energy system. Int. J. Hydrog. Energy 2004, 29, 23–32. [Google Scholar] [CrossRef]
- Calise, F.; D’Accadia, M.; Barletta, C.; Battaglia, V.; Pfeifer, A.; Duic, N. Detailed Modelling of the Deep Decarbonisation Scenarios with Demand Response Technologies in the Heating and Cooling Sector: A Case Study for Italy. Energies 2017, 10, 1535. [Google Scholar] [CrossRef]
- Sveinbjörnsson, D.; Amer-Allam, S.; Hansen, A.; Algren, L.; Pedersen, A. Energy supply modelling of a low-CO2 emitting energy system: Case study of a Danish municipality. Appl. Energy 2017, 195, 922–941. [Google Scholar] [CrossRef]
- Singh, A.; Baredar, P.; Gupta, B. Techno-economic feasibility analysis of hydrogen fuel cell and solar photovoltaic hybrid renewable energy system for academic research building. Energy Convers. Manag. 2017, 145, 398–414. [Google Scholar] [CrossRef]
- Cao, S.; Klein, K.; Herkel, S.; Sirén, K. Approaches to enhance the energy performance of a zero-energy building integrated with a commercial-scale hydrogen fueled zero-energy vehicle under Finnish and German conditions. Energy Convers. Manag. 2017, 142, 153–175. [Google Scholar] [CrossRef]
- Reuß, M.; Grube, T.; Robinius, M.; Preuster, P.; Wasserscheid, P.; Stolten, D. Seasonal storage and alternative carriers: A flexible hydrogen supply chain model. Appl. Energy 2017, 200, 290–302. [Google Scholar] [CrossRef]
- Nabgana, W.; Abdullah, T.; Nabgan, R.; Gambo, Y.; Ibrahim, M.; Ahmad, A.; Jalil, A.; Triwahyono, S.; Saeh, I. Renewable hydrogen production from bio-oil derivative via catalytic steam reforming: An overview. Renew. Sustain. Energy Rev. 2017, 79, 347–357. [Google Scholar] [CrossRef]
- Qolipour, M.; Mostafaeipour, A.; Tousi, O. Techno-economic feasibility of a photovoltaic-wind power plant construction for electric and hydrogen production: A case study. Renew. Sustain. Energy Rev. 2017, 78, 113–123. [Google Scholar] [CrossRef]
- Tebibel, H.; Khellaf, A.; Menia, S.; Nouicer, I. Design, modelling and optimal power and hydrogen management strategy of an off-grid PV system for hydrogen production using methanol electrolysis. Int. J. Hydrog. Energy 2017, 42, 14950–14967. [Google Scholar] [CrossRef]
- Xu, X.; Xu, B.; Dong, J.; Liu, X. Near-term analysis of a roll-out strategy to introduce fuel cell vehicles and hydrogen stations in Shenzhen China. Appl. Energy 2017, 196, 229–237. [Google Scholar] [CrossRef]
- Mohareb, E.; Kennedy, C. Scenarios of technology adoption towards low-carbon cities. Energy Policy 2017, 66, 685–693. [Google Scholar] [CrossRef]
- Miranda, P.; Carreira, E.; Icardi, U.; Nunes, G. Brazilian hybrid electric-hydrogen fuel cell bus: Improved on-board energy management system. Int. J. Hydrog. Energy 2017, 42, 13949–13959. [Google Scholar] [CrossRef]
- Franzitta, V.; Curto, D.; Rao, D.; Viola, A. Hydrogen production from sea wave for alternative energy vehicles for public transport in Trapani (Italy). Energies 2016, 9, 850. [Google Scholar] [CrossRef]
- Briguglio, N.; Andaloro, L.; Ferraro, M.; Di Blasi, A.; Dispenza, G.; Matteucci, F.; Breedveld, L.; Antonucci, V. Renewable energy for hydrogen production and sustainable urban mobility. Int. J. Hydrog. Energy 2010, 35, 9996–10003. [Google Scholar] [CrossRef]
- Moreno-Benito, M.; Agnolucci, P.; Papageorgiou, L. Towards a sustainable hydrogen economy: Optimisation-based framework for hydrogen infrastructure development. Comput. Chem. Eng. 2017, 102, 110–127. [Google Scholar] [CrossRef]
- Oldenbroek, V.; Verhoef, L.; van Wijk, A. Fuel cell electric vehicle as a power plant: Fully renewable integrated transport and energy system design and analysis for smart city areas. Int. J. Hydrog. Energy 2017, 42, 8166–8196. [Google Scholar] [CrossRef]
- Kumar, G.; Sivagurunathan, P.; Pugazhendhi, A.; Thi, N.; Zhen, G.; Chandrasekhar, K.; Kadier, A. A comprehensive overview on light independent fermentative hydrogen production from wastewater feedstock and possible integrative options. Energy Convers. Manag. 2017, 141, 390–402. [Google Scholar] [CrossRef]
- Nahar, G.; Mote, D.; Dupont, V. Hydrogen production from reforming of biogas: Review of technological advances and an Indian perspective. Renew. Sustain. Energy Rev. 2017, 76, 1032–1052. [Google Scholar] [CrossRef]
- Khan, M.; Nizami, A.; Rehan, M.; Ouda, O.; Sultana, S.; Ismail, I.; Shahzad, K. Microbial electrolysis cells for hydrogen production and urban wastewater treatment: A case study of Saudi Arabia. Appl. Energy 2017, 185, 410–420. [Google Scholar] [CrossRef]
- Viola, A.; Franzitta, V.; Trapanese, M.; Curto, D. Nexus water & energy: A case study of wave energy converters (WECs) to desalination applications in Sicily. Int. J. Heat Technol. 2016, 34, S379–S386. [Google Scholar] [CrossRef]
- Rizzuti, L.; Ettouney, H.M.; Cipollina, A. (Eds.) Solar Desalination for the 21st Century: A Review of Modern Technologies and Researches on Desalination Coupled to Renewable Energies, 1st ed.; Springer Netherlands Science+Business Media B.V.: Dordrecht, The Netherlands, 2007. [Google Scholar]
- García-Rodríguez, L. Renewable energy applications in desalination: State of the art. Sol. Energy 2003, 75, 381–393. [Google Scholar] [CrossRef]
- Franzitta, V.; Curto, D.; Milone, D.; Viola, A. The Desalination Process Driven by Wave Energy: A Challenge for the Future. Energies 2016, 9, 1032. [Google Scholar] [CrossRef]
- Sanseverino, E.; Sanseverino, R.; Favuzza, S.; Vaccaro, V. Near zero energy islands in the Mediterranean: Supporting policies and local obstacles. Energy Policy 2014, 66, 592–602. [Google Scholar] [CrossRef]
- Da Silva, E.; Marin Neto, A.; Ferreira, P.; Camargo, J.; Apolinário, F.; Pinto, C. Analysis of hydrogen production from combined photovoltaics, wind energy and secondary hydroelectricity supply in Brazil. Sol. Energy 2005, 78, 670–677. [Google Scholar] [CrossRef]
- Alanne, K.; Cao, S. Zero-energy hydrogen economy (ZEH2E) for buildings and communities including personal mobility. Renew. Sustain. Energy Rev. 2017, 71, 697–711. [Google Scholar] [CrossRef]
- Schmidt, D.; Torío, H. (Eds.) Low Exergy Systems for High Performance Buildings and Communities; Annex 49, Summary Report. Available online: https://www.annex49.info/download/Annex49_guidebook.pdf (accessed on 3 January 2018).
- Kılkış, Ş. A Rational Exergy Management Model to Curb CO2 Emissions in the Exergy-Aware Built Environments of the Future. Ph.D. Thesis, KTH Royal Institute of Technology School of Architecture and the Built Environment, Stockholm, Sweden, 2011. [Google Scholar]
- Kılkış, Ş. Energy system analysis of a pilot net-zero exergy district. Energy Convers. Manag. 2014, 87, 1077–1092. [Google Scholar] [CrossRef]
- Kılkış, Ş. Exergy transition planning for net-zero districts. Energy 2015, 92, 515–531. [Google Scholar] [CrossRef]
- Kilkiş, Ş.; Wang, C.; Björk, F.; Martinac, I. Cleaner energy scenarios for building clusters in campus areas based on the Rational Exergy Management Model. J. Clean. Prod. 2017, 155, 72–82. [Google Scholar] [CrossRef]
- Kılkış, B.; Kılkış, Ş. New exergy metrics for energy, environment, and economy nexus and optimum design model for nearly-zero exergy airport (nZEXAP) systems. Energy 2017, 140, 1329–1349. [Google Scholar] [CrossRef]
- Kılkış, Ş.; Kılkış, B. Integrated circular economy and education model to address aspects of an energy-water-food nexus in a dairy facility and local contexts. J. Clean. Prod. 2017, 167, 1084–1098. [Google Scholar] [CrossRef]
- Hydrogen Transport by Pipeline, Roads2Hycom, Institut für Kraft-Fahr-Zeuge. Available online: https://www.ika.rwth-aachen.de/r2h/index.php/Hydrogen_Transport_by_Pipeline.html (accessed on 18 August 2017).
- Dodds, P.; Demoullin, S. Conversion of the UK gas system to transport hydrogen. Int. J. Hydrog. Energy 2013, 38, 7189–7200. [Google Scholar] [CrossRef]
- Kılkış, B.; Kılkış, Ş. Yenilenebilir Enerji Kaynakları ile Birleşik Isı ve Güç Üretimi (Combined Heat and Power Generation with Renewable Energy Resources), 1st ed.; TTMD Pub. No: 32; Doğa Publishers: İstanbul, Turkey, 2015; ISBN 978-975-6263-25-9. [Google Scholar]
- Yavuz, T.; Kılkış, B.; Koç, E.; Erol, Ö. Flow and performance characteristics of a double-blade hydrofoil. Adv. Mater. Res. 2012, 433–440, 7218–7222. [Google Scholar] [CrossRef]
- Net Zero Energy Buildings, Whole Building Design Guide (WBDG). National Institute of Building Sciences. Available online: https://www.wbdg.org/resources/net-zero-energy-buildings (accessed on 11 June 2017).
- A Common Definition for Zero Energy Buildings. Prepared for the U.S. Department of Energy by The National Institute of Building Sciences. Available online: https://energy.gov/sites/prod/files/2015/09/f26/A%20Common%20Definition%20for%20Zero%20Energy%20Buildings.pdf (accessed on 11 June 2017).
- Kılkış, B. Analysis of Fourth-Generation District Energy Systems with Renewable Energy Cogeneration by Using Rational Exergy Management Model. In Proceedings of the SBE 16 Smart Metropoles Conference, İstanbul, Turkey, 13–15 October 2016; pp. 512–522. [Google Scholar]
- Nielsen, S.; Möller, B. Excess heat production of future net zero energy buildings within district heating areas in Denmark. Energy 2012, 48, 23–31. [Google Scholar] [CrossRef]
- Kılkış, Ş. A net-zero building application and its role in exergy-aware local energy strategies for sustainability. Energy Convers. Manag. 2012, 63, 208–217. [Google Scholar] [CrossRef]
- Kılkış, B. Energy and Exergy Analysis of Water and Air-Cooled PVT Systems with Heat Pipe Technology. In Proceedings of the Seminar 72 Low Energy Building Design Using Exergy Modeling, ASHRAE Winter Meeting, Las Vegas, NV, USA, 27 January–1 February 2017. [Google Scholar]
- Kılkış, B. An Economic Analysis Tool for Tri-generation Systems in Net-Zero Exergy Buildings (NZEXB). In Proceedings of the XIIth International TTMD HVAC+R Symposium, Istanbul, Turkey, 31 March–2 April 2016. [Google Scholar]
- Kılkış, B. Energy and Exergy Metrics in Zero CO2 Emission Buildings. Which Comes First to Raise Cost Effectiveness of Deep Energy Refurbishment? In Proceedings of the 12th REHVA World Congress, Aalborg, Denmark, 22–25 May 2016. [Google Scholar]
- Kılkış, B.; Kılkış, Ş. Rational Exergy Management Model for Effective Utilization of Low-Enthalpy Geothermal Energy Resources. In Proceedings of the 21th National Heat Science and Technique Conference, Çorum, Turkey, 13–16 September 2017. [Google Scholar]
- Kılkış, B.; Kılkış, S.; Kılkış, Ş. Optimum Hybridization of Wind Turbines, Heat Pumps, and Thermal Energy Storage Systems for Near Zero-Exergy Buildings Using Rational Exergy Management Model. In Proceedings of the 12th IEA Heat Pump Conference, Rotterdam, The Netherlands, 15–18 May 2017. [Google Scholar]
- Aldağ. Hundred Percent Fresh Air Comfort with Water-Source Heat Pumps with Heat Recovery. Available online: https://www.termodinamik.info/arsiv (accessed on 25 June 2017).
- Kılkış, B. Sustainability and Decarbonization Efforts of the EU: Potential Benefits of Joining Energy Quality (Exergy) and Energy Quantity (Energy) in EU Directives, A State of the Art Survey and Recommendations; Exclusive EU Position Report; TTMD: Ankara, Turkey, 2017. [Google Scholar]
- Meggers, F.; Ritter, V.; Goffin, P.; Baetschmann, M.; Leibundgut, H. Low exergy building systems implementation. Energy 2012, 41, 48–55. [Google Scholar] [CrossRef]
- EBC. Annex 37 Low Exergy Systems for Heating and Cooling. Markku Virtanen, VTT Building and Transport. 2003. Available online: http://www.iea-ebc.org/projects/completed-projects/ebc-annex-37/ (accessed on 12 June 2017).
- Khan, B. Non-Conventional Energy Resources, 2nd ed.; Tata McGraw-Hill: New Delhi, India, 2009. [Google Scholar]
- Li, J.; Huang, H.; Osaka, Y.; Bai, Y.; Kobayashi, N.; Chen, Y. Combustion and Heat Release Characteristics of Biogas under Hydrogen and Oxygen-Enriched Condition. Energies 2017, 10, 1200. [Google Scholar] [CrossRef]
- Wall, D.; McDonagh, S.; Murphy, J. Cascading biomethane energy systems for sustainable green gas production in a circular economy. Bioresour. Technol. 2017, 243, 1207–1215. [Google Scholar] [CrossRef] [PubMed]
- Kılkış, B.; Kılkış, Ş.; Kılkış, Ş. Next-Generation PVT System with PCM Layer and Heat Distributing Sheet. In Proceedings of the Solar TR2016 Conference and Exhibition, İstanbul, Turkey, 6–9 December 2016; Paper No: 0006. pp. 20–28. [Google Scholar]
- Kılkış, B. Optimum Operation of Solar PVT Systems: An Exergetic Approach. In Proceedings of the Solar TR2016 Conference and Exhibition, İstanbul, Turkey, 6–9 December 2016; Paper No: 0025. pp. 72–79. [Google Scholar]
- Meis, K. Designing Cities for a Car-Light Future. Available online: https://www.greenbiz.com/ article/designing-cities-car-light-future (accessed on 5 March 2017).
- Kılkış, B. Exergetic comparison of wind energy storage with ice making cycle versus mini-hydrogen economy cycle in off-grid district cooling. Int. J. Hydrog. Energy 2017, 42, 17571–17582. [Google Scholar] [CrossRef]
- Quoilin, S.; Lemort, V. Technological and Economical Survey of Organic Rankine Cycle Systems. In Proceedings of the 5th European Conference Economics and Management of Energy in Industry, Vilamoura, Portugal, 14–17 April 2009. [Google Scholar]
- Shoshan, G. Application of ORC systems in Geothermal Energy. In Proceedings of the Plant Technologies Session, Turkish Geothermal Workshop and Congress, Ankara, Turkey, 8–9 February 2017. [Google Scholar]
- Kılkış, B.; Kılkış, Ş. Energy and Exergy Based Comparison of Utilizing Waste Heat of a Cogeneration System for Comfort Cooling Using ORC Driven Chillers or Heat Pumps versus Absorption/Adsorption Cycles. In Proceedings of the ASME ORC 2013, Rotterdam, The Netherlands, 7–8 October 2013. [Google Scholar]
- Rowshanzadeh, R. Performance and Cost Evaluation of Organic Rankine Cycle at Different Technologies. Master’s Thesis, Department of Energy Technology, KTH, Stockholm, Sweden, 2010. [Google Scholar]
- Sun, W.; Yue, X.; Wang, Y. Exergy efficiency analysis of ORC (Organic Rankine Cycle) and ORC-based combined cycles driven by low-temperature waste heat. Energy Convers. Manag. 2017, 135, 63–73. [Google Scholar] [CrossRef]
- Marini, A.; Alexandru, D.; Grosu, L.; Gheorghian, A. Energy and Exergy Analysis of an Organic Rankine Cycle. U.P.B. Sci. Bull. Ser. D 2014, 76, 127–136. Available online: https://www.scientificbulletin.upb.ro/ (accessed on 30 August 2017).
- Baba, A. Hydro-Geochemical Properties of Geothermal Systems and its Effect on the System in Turkey. In Proceedings of the IGC 2017 Conference, İzmir, Turkey, 22–24 May 2017. [Google Scholar]
- Greenhouse Gases from Geothermal Power Production; ESMAP Technical Report 009/16; The World Bank Group: Washington, DC, USA, 2016.
- Bai, X.; Dawson, R.; Ürge-Vorsatz, D.; Delgado, G.; Barau, A.; Dhakal, S.; Dodman, D.; Leonardsen, L.; Masson-Delmotte, V.; Roberts, D. Six research priorities for cities and climate change. Nature 2018, 555, 23–25. [Google Scholar] [CrossRef] [PubMed]
- General Directorate of Meteorology. Heating and Cooling Degree Days. 2017. Available online: https://www.mgm.gov.tr/veridegerlendirme/gun-derece.aspx (accessed on 7 January 2018).
- General Directorate of Meteorology. Monthly Average Temperatures by Province. Available online: https://www.mgm.gov.tr/veridegerlendirme/il-ve-ilceler-istatistik.aspx (accessed on 4 April 2018).
- Kılkış, B. Most Effective Means of Utilizing Solar Energy in Urban Development for Different Building Typologies and Climates. In Proceedings of the 7th Solar Energy Symposium and Exhibition, Turkish Chamber of Mechanical Engineers, Mersin, Turkey, 22–23 September 2017. [Google Scholar]
- United Nations Population Division. Charting the Progress of Populations Section XII Floor Area per Person; Department of Economic and Social Affairs: New York, NY, USA, 2000; pp. 79–83. Available online: http://www.un.org/en/development/desa/population/publications/trends/progress-of-populations.shtml (accessed on 15 December 2017).
- BEP-TR. Ministry of Environment and Urbanization. Available online: http://www.bep.gov.tr/ (accessed on 25 December 2017).
- Kılkış, B. COOLP: a computer program for the design and analysis of ceiling cooling panels. ASHRAE Transactions 1995, 101, 703–710. Available online: https://www.ashrae.org/technical-resources/ashrae-transactions (accessed on 2 March 2018).
- Tokyo Aims to Realize “Hydrogen Society” by 2020—Metro Government Undertakes Pioneering Initiative. Available online: https://www.japan.go.jp/tomodachi/2016/spring2016/tokyo_realize_hydrogen_by_2020.html (accessed on 18 August 2017).
© 2018 by the authors. Licensee MDPI, Basel, Switzerland. This article is an open access article distributed under the terms and conditions of the Creative Commons Attribution (CC BY) license (http://creativecommons.org/licenses/by/4.0/).