Simulation for the Effects of Well Pressure and Initial Temperature on Methane Hydrate Dissociation

Key Laboratory of Ocean Energy Utilization and Energy Conservation of Ministry of Education, Dalian University of Technology, Dalian 116023, China
*
Author to whom correspondence should be addressed.
Energies 2018, 11(5), 1179; https://doi.org/10.3390/en11051179
Submission received: 1 March 2018
/
Revised: 18 April 2018
/
Accepted: 23 April 2018
/
Published: 8 May 2018
(This article belongs to the Section L: Energy Sources)
Abstract
:Methane hydrate dissociation is a process of heat and mass transfer, and pressure and temperature are the most important parameters. The influence of pressure and temperature on the hydrate dissociate relationship between the two parameters is the determinant for gas hydrate dissociation; meanwhile, the gradients of these parameters are the sources of flow and gas production. In this study, a 1D simulator was developed for investigating the effects of well pressures (3 MPa, 5 MPa, and 8 MPa) and initial temperatures (274 K, 279 K, and 284 K) in the process of methane hydrate dissociation by depressurization. The simulation results showed that the well pressure and initial temperature have significant effects on pressure distribution, temperature distribution, and gas production. A lower well pressure and higher initial temperature can promote methane hydrate dissociation. The combined effect of hydrate dissociation and fluid flow can cause more substantial changes in pressure distribution, temperature distribution, and gas production, especially in the initial stage of the methane hydrate dissociation process. However, the changes of the parameters tend to disappear as mining time goes on. There is a difference in the influences of exploitation well pressure and initial temperature on the stability time of gas production.
1. Introduction
Methane hydrate is a kind of potential clean energy source, and research on it has occurred all over the world in recent decades. Methane hydrate is a compound with a structure of gas molecules wrapped in cages formed by hydrogen-bonded water molecules. Methane hydrate remains stable under a certain pressure and temperature; under marine conditions this is typically a few degrees above the melting point of ice and pressures from a few to several tens of MPa. First approximation to the stability field of gas hydrates was introduced by Van der Waals and Platteeuw [1] and is commonly known as the VW-P model that is based on the first law of thermodynamics and the microscopic property of hydrate. This early model suggested the calculation of the chemical potential in hydrate which has been used by later researches. Without considering porous media, this model ignored the effect of capillary force. Clarke et al. [2] and Klauda et al. [3] modified the VW-P model and proved that the capillary force influenced the pressure-temperature equilibrium of hydrate. In addition, also, many experimental studies [4,5,6,7,8,9,10] investigated the effect of pressure and temperature on hydrate formation and dissociation.
Based on these studies, currently favored methods for gas production from methane hydrate reservoir are depressurization, thermal stimulation and a combination of depressurization and thermal stimulation. For gas production by depressurization, the well pressure leads to the methane hydrate dissociation and flowing into the exploitation well [11,12]. At the same time, the initial temperature of the reservoir should be considered for choosing an appropriate well pressure. Of course, different well pressure and initial temperature can affect the changes of other parameters including permeability, phase saturation, gas production rate and so on. Flow and heat transfer is one of the dominant factors in the process hydrate formation and dissociation in porous media. Zhao et al. [13] analyzed heat transfer effects during methane hydrate dissociation by depressurization. In addition, Lanlan et al. [14] suggested an effective method for researching mass transfer effects in porous media by X-ray CT apparatus. The formation of methane hydrate in dependence of temperature and pressure has been studied from a variety of aspects, which include the effects of unsaturated solutions of NaCl [15], different phase density and gas solubility, initial hydrate saturation, capillary effects [10], and the solubility of CO2 [16]. At the same time, Maekawa et al. [17] examined the relationship between pressure, and the salinity of the water and proposed an empirical equation for methane hydrate dissociation in sodium chloride solutions. In addition, during hydrate dissociation, there is a memory effect which is related to pressure and temperature [18].
Compared with experimental research, numerical simulation has the advantage of being low cost and allowing for easy adjustment of the space-time scale. A single-phase model for methane hydrate with a conventional, adjacent, hidden, and step-down dissociation process was reported by Holder and Angert [19]. This model assumed that dissociation occurred at the interface between two adjacent reservoirs; however, dynamic water flow condition was not considered. Meanwhile, an associated model, including two thermal and one depressurization model [20], was proposed to analyze the dissociation during hot water injection and pressure reduction. The thermal model was a displacement front model with fracture flow, and the one-dimensional pore flow model could simulate a hydraulic fracturing well by depressurization. Next, a variable composition model was established to study gas hydrate. There were two phases, which include water and mixture gas, considered in this 2D model. The feasibility of the gas production and utilization from natural hydrate could be fundamental explained by the model [21]. Based on the incipient models, some more targeted and accurate hydrate dissociation models were proposed. The kinetic model (Kim-Bishnoi model) of hydrate dissociation was first reported by Kim et al. [4]. It suggested that the hydrate dissociation rate is determined by the hydrate reaction specific area and a difference of fugacity. The kinetic model can be expressed as an equation, which described the influences of pressure, temperature, and particle surface area on hydrate dissociation. In addition, the Kim-Bishnoi model was later incorporated in many classical mathematical models [22]. In addition, a one-dimensional mathematical model was developed to consider heat transfer and hydrate dissociation kinetics for the first time [23]. Simulation results suggested that the dissociation rate was sensitive to the pressure and surface roughness. In contrast to the Kim-Bishnoi model, Makogon [24] suggested that the hydrate dissociation rate depended on the moving dissociation front rather than the volume. According to the hydrate dissociation kinetic model, Musuda et al. [25,26] developed the model into a three-dimensional form and used the model to simulate methane hydrate exploitation on a field scale. The potential gas flux generated by the kinetics of hydrate dissociation, gas flow and heat transfer was calculated, and the gas production on the lab scale was limited mainly by heat transfer [27]. Moridis et al. [28,29,30] considered more factors and parameters into their model and embedded it in the simulator named TOUGH to specially simulate the hydrate formation and dissociation. In recent years, some modified models were published. For example, Bai et al. [31] established a three-dimensional model to simulate the exploitation of hydrate in marine sediment. It is worth mentioning that they adopted the Primary Variable Switch Method (PVSM) to conduct the influence of the ice generated on the process of hydrate dissociation. A hydrate dissociation theoretical model was published by Oyama et al. [32] in 2009. Considering the chemical equilibrium, the model was mainly composed of two parts: dissociation reaction and heat transfer. Moreover, in the model, they divided the dissociation process into four stages.
Based on the existing models, in this study, a one-dimensional model that considered three phases (water, gas, and hydrate) and three components (water, methane, and hydrate) was set up to simulate the process of hydrate dissociation by depressurization. It must be admitted that this model mainly focused on hydromechanics and thermophysics. However, geotechnical information and the change of pore structure are important to describe the process of gas production by hydrate dissociation. Omitting this important factor will undoubtedly affect the accuracy of conducted simulations [33,34,35] by a degree that cannot be easily evaluated. However, this study mainly focused on the influences of exploitation pressure and initial temperature through comparing changes of relevant parameters. In addition, instead of specific values, the comparison of trend was emphasized prudently for avoiding significant errors caused by the assumptions which include ignoring geotechnical information. According to the simulation results, we analyzed the effects of different well pressures and initial reservoir temperatures on some important parameters (reservoir pressure and temperature distribution, and gas production rate).
2. Methods
We consider a system of three phases (water, gas, and hydrate) and three components (water, methane, and hydrate) for the depressurization model. This model adhered to the following assumptions: (1) the porous media is considered homogeneous, reflecting the same porosity and permeability at any position; (2) gravity force is not considered; (3) ice formation is not considered; (4) flow of hydrate was not considered; (5) pore structure change is ignored. In addition, the effect of hysteresis is ignored. This is because that only in a small (microscale to nanometer scale) pore does, the solid-liquid interfacial energy becomes an important contribution to the total Gibbs free energy of the system [34], and the effect of hysteresis is greater during formation than during dissociation [36]. However, this study only considers the process of hydrate dissociation, and the pore is in millimeters (not microscale) because a glass bead is chosen as the material of porous media.
The well pressures and initial temperatures of the reservoir were set according to the methane hydrate phase equilibrium equation as Equation (1) proposed by Selim et al. [37].
where is the equilibrium pressure corresponding to the current temperature .
We got the values of profile varying with temperature within the range from a temperature of 274 K–284 K by calculating through Equation (1), and the result is shown in Figure 1. Considering the critical line, three different initial temperatures (274 K, 279 K, and 284 K) for well pressure of 3 MPa were chosen to study the effects of initial temperature of the reservoir. For investigating the effects of well pressure, we set three different well pressures (3 MPa, 5 MPa, and 8 MPa) at the initial temperature of 284 K.
2.1. Mathematical Model
This study focuses on the heat and mass transfer during the process of hydrate dissociation. It is governed by mass, energy, and momentum conservation equations. The mass conservation equation for water, gas and hydrate are shown as following in the one-dimensional model:
where , are water and methane gas density, respectively; , are water and methane seepage velocity, respectively; , , are the quality of water and gas by the hydrate dissociation per unit volume per unit time and hydrate consumption quality; () is each phase saturation; and is porosity.
Hydrate dissociation is an endothermic reaction, which is considered to be a source term in the energy conservation equation:
where is thermal conductivity, is specific heat at constant pressure, and the subscripts are solid matrix, water, methane gas and hydrate respectively. is the heat absorption capacity per unit mass hydrate dissociation.
The Kim dissociation dynamic model [32] is used to calculate the gas production rate as follows:
where is the hydrate dissociation kinetic constant, which depends on the hydrate particle geometry; in this study, the value of is 1.25 × 10⁵ mol/m2Pa·s. (in this study the value is 81,084.19722 J/mol [37]) is the activation energy; R is a gas constant; is the molar mass of methane; and is the decomposition surface area.
From the assumption, hydrate phase was considered to not be flowing. As the gas hydrate dissociation, fluid flow through the reservoir is described by Darcy’s Law.
The velocities of gas () and water () are presented as follows, respectively:
where is absolute permeability; , are gas and water relative permeability, respectively; , are gas and water dynamic viscosity; and , are gas pressure and water pressure, respectively. Here, the two pressures are associated together by capillary force. The relationship is specified as
where is the capillary force. Here, this parameter has been obtained with the Van Genuchten model [38].
The absolute permeability is calculated as Equation (8) proposed by Masuda et al. [25]
where is the initial absolute permeability (the value is 97.98 md in this paper [25]), and is the permeability decline index.
This study used the finite difference method (FDM) to discrete the mass conservation equation and energy conservation equation. The boundary pressure of exploitation well and boundary temperatures were set to a fixed value. In addition, impermeable boundary was adopted for other boundary pressures. Then, we can set different exploitation well pressures and initial reservoir temperatures to get the changes of other important parameters by solving the model.
2.2. Mathematical Model Verification
This study used the experimental data from Masuda et al. [25] to verify the mathematical model. We set the initial conditions as experiment in the model (as Table 1), the outlet pressure set to 2.84 MPa. The experiment used a tube sealed at one end as a reaction vessel, and the ambient temperature remained constant. Therefore, in the model, the boundary temperature was set to a constant value of 275.45 K, and the boundary pressure except the outlet pressure was set as an impermeable boundary. The comparative result is shown in Figure 2. It can be seen that the numerical simulation result is in good agreement with the experimental data. The final gas productions of the two results are almost consistent. In addition, the variation trend of the curve from the model coincides with the experimental curve. However, compared to the experimental data, the calculated cumulative gas produced is greater in the early stage and is smaller in the later stage. The difference is mainly caused by the change of pore structure being ignored, and hydrate is assumed to be stationary in the model. Analysis suggests that, in the early stage, the solid particles move significantly due to stronger hydrate dissociation and fluid flow, especially near the exploitation well. The flow passage is partially blocked. Thus, the decrease of local permeability inhibits the output of gas to some extent. However, in our model, the influence factors are ignored. Therefore, the cumulative gas produced is greater in the model than that in the experiment in the early stage. In addition, in the later stage, with the hydrate near outlet dissociation, the gas production rate in the experiment is greater than that in the model predicts. In addition, different from the experimental data, the calculation curve has a sustained small growth trend in the end. Analysis suggests that this is because there is some gas which cannot output in the experiment due to pore plugging. This study mainly focused on the influence of the well pressure and initial temperature through comparing different conditions. Therefore, the mathematical model can approximate the process of methane hydrate dissociation by depressurization.
3. Results and Analysis
In this study, the comparisons of some parameters, which include pressure and temperature distributions, and gas production, were made under different well pressures, initial reservoir temperatures, and exploiting time. Considering the range of the condition of pressures and temperatures, the scale of the model was extended to 30 m, and other initial parameters were set as Table 2. The boundary temperature was set to constant which equates to the initial reservoir temperature. The boundary pressure was also set to an impermeable boundary, as before. In addition, the effects of well pressure and initial temperature on these parameters were obtained by the comparisons. At the same time, we provided in-depth analysis for the numerical simulation results.
3.1. Effects on Pressure Distribution
The reservoir pressure declined with low exploitation well pressure, which destabilized the hydrate. During the depressurization, the well pressure, initial temperature, and exploitation time strongly affect the pressure distribution in the reservoir. To analyze the pressure distribution, we ran comparisons under different initial temperatures. The results are shown in Figure 3. Of course, the low well pressure gradually transfers into the reservoir and makes the pressures at the points near the exploitation well be lower.
Figure 3a shows the pressure distributions when the exploitation is set to 300 min. It can be seen that the average pressure under initial temperature of 274 K is the lowest, but the average pressure under initial temperature of 279 K is higher than that of 284 K. In other words, as initial temperature rises, the average pressure first increases and then decreases. This is caused by the hydrate dissociation and fluid flow. The gas and water generated by hydrate dissociation make the local pressure increase, especially when the fluid cannot flow to the exploitation well immediately. Thus, the higher pressure inhibits hydrate dissociation rate, to some extent. However, when the initial temperature is high enough (284 K), the drastic hydrate dissociation enhances the fluid flow to make the pressure decrease more quickly. Therefore, the pressure curve of 284 K is lower than that of 279 K. According to Equation (1), under a temperature of 274 K, the critical pressure for hydrate dissociation is 3.07 MPa. The effects of hydrate dissociation and fluid flow do not work until the pressure is below 3.07 MPa. This suggests that the equilibrium pressure and fluid flow combine to affect the pressure distribution.
It shows that the well pressure has strong influence on the hydrate dissociation under an initial temperature of 284 K at the time of 300 min. As shown in Figure 3b, when the exploitation time goes to 3000 min, the pressures in reservoir under different initial temperature decline. In addition, the pressure in the reservoir under the initial temperature of 284 K decreases continually, and it is even lower than the pressure of 274 K. It indicates that a high enough initial temperature can make the pressure field tend to balance more quickly. However, below the temperature, the time when to achieve the balance is longer with the initial temperature rise because of the gas and water formation and flow. In Figure 3c, when the time goes to 30,000 min, the pressures in the reservoirs of initial temperatures of 274 K and 284 K are almost consistent. However, it needs some time for the reservoir of initial temperature of 279 K to make its pressure drop.
It can be suggested that it took different times to stabilize the pressure field and nearly eliminate the pressure gradient in the reservoir under different well pressures and initial temperatures. In this study, taking the reservoir under well pressure of 5 MPa and initial temperature of 284 K as an example, the comparison of pressure distributions at different exploitation time (300 min, 3000 min, and 30,000 min) is shown in Figure 4. The results indicate that when goes to 300 min, the pressure gradient in reservoir is well pronounced. However, the pressures in the reservoir at 3000 min and 30,000 min are almost consistent and decrease to around the well pressure (5 MPa). This finding that when exploiting to 3000 min, the pressure in the reservoir tends to be stable.
3.2. Effects on Temperature Distribution
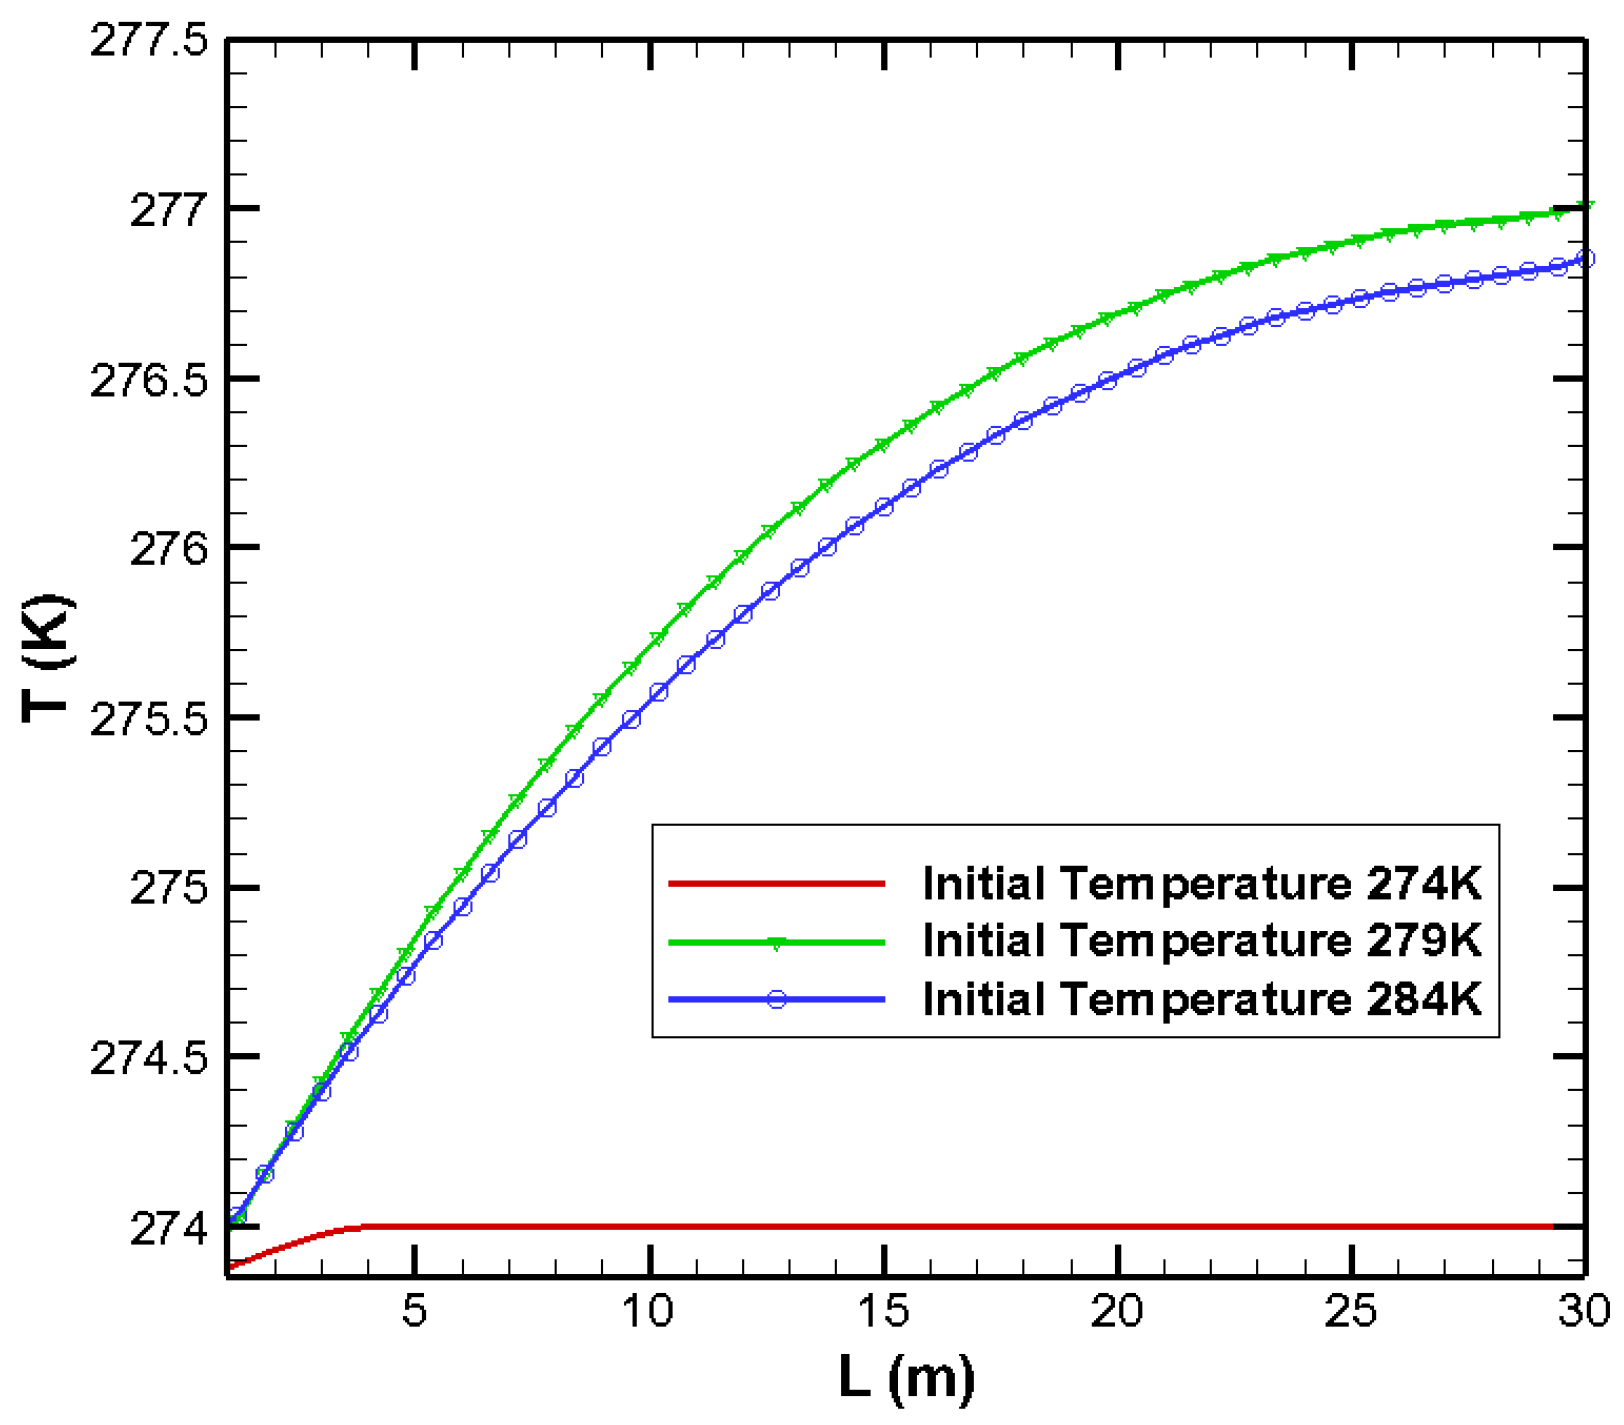
The study also investigates the temperature distribution during hydrate dissociation under different initial temperature conditions. From the results shown in Figure 5, we can see that the trend of temperature distribution is similar to pressure distribution analyzed above. Specifically, under the initial temperature of 274 K, only the temperatures in the near exploitation well slightly decrease. The area far from the exploitation well does not meet the condition of hydrate dissociation due to the lower initial temperature. Thus, the temperatures are stable at the initial value (274 K). However, as the initial temperature increases into 279 K or 284 K, the hydrate near the exploitation well dissociates earlier and in greater quantities, resulting in a sharp reduction of the local temperature, and hydrate dissociation throughout the whole simulated reservoir. Moreover, at exploiting time of 300 min, the average temperature in the reservoir under the initial temperature of 284 K is even lower than that under an initial temperature of 279 K.
Meanwhile, the effect of the well pressure on temperature distribution was studied by comparison of temperature distributions under 284 K and different well pressures at different exploiting times (300 min, 3000 min, and 30,000 min). When the well pressure is lower, the hydrate in the reservoir dissociates easier, and the temperature drops more. As shown in Figure 6, at 3 MPa, the temperature in the reservoir can even drop to below 274 K. While at 8 MPa, the temperature in the reservoir stays above 281 K. We also see that different well pressures result in different degrees of hydrate dissociation, which are reflected through the temperature distributions. From Figure 6a,b, under well pressures of 3 MPa and 5 MPa, the temperature gradient is obvious at the exploitation time of 300 min, but the temperatures in the reservoir tend to be consistent at 3000 min and 30,000 min. However, the temperature gradient still exists under well pressure of 8 MPa, even if the exploiting time is 30,000 min. This finding indicates that when the difference between well pressure and initial pressure of reservoir is smaller, the hydrate dissociation rate is lower, and the rate of decrease in temperature is also lower due to heat absorbed by hydrate dissociation. Figure 6c shows that due to the constant temperature boundary, the temperature near the right boundary of the reservoir has a leap. Ignoring the boundary leap, the figure also suggests that hydrate dissociation is slower and milder under a well pressure of 8 MPa. However, the temperature distributions are even consistent between that at the time of 3000 min and 30,000 min. This is because in this model, when the temperature decreases to approximately 281.83 K, the equilibrium pressure is close to 8 MPa. Thus, hydrate dissociates so slow that the boundary temperature can work on the temperature in the reservoir. Of course, the direction of this action is opposite to the direction of flow.
3.3. Effects on Gas Production
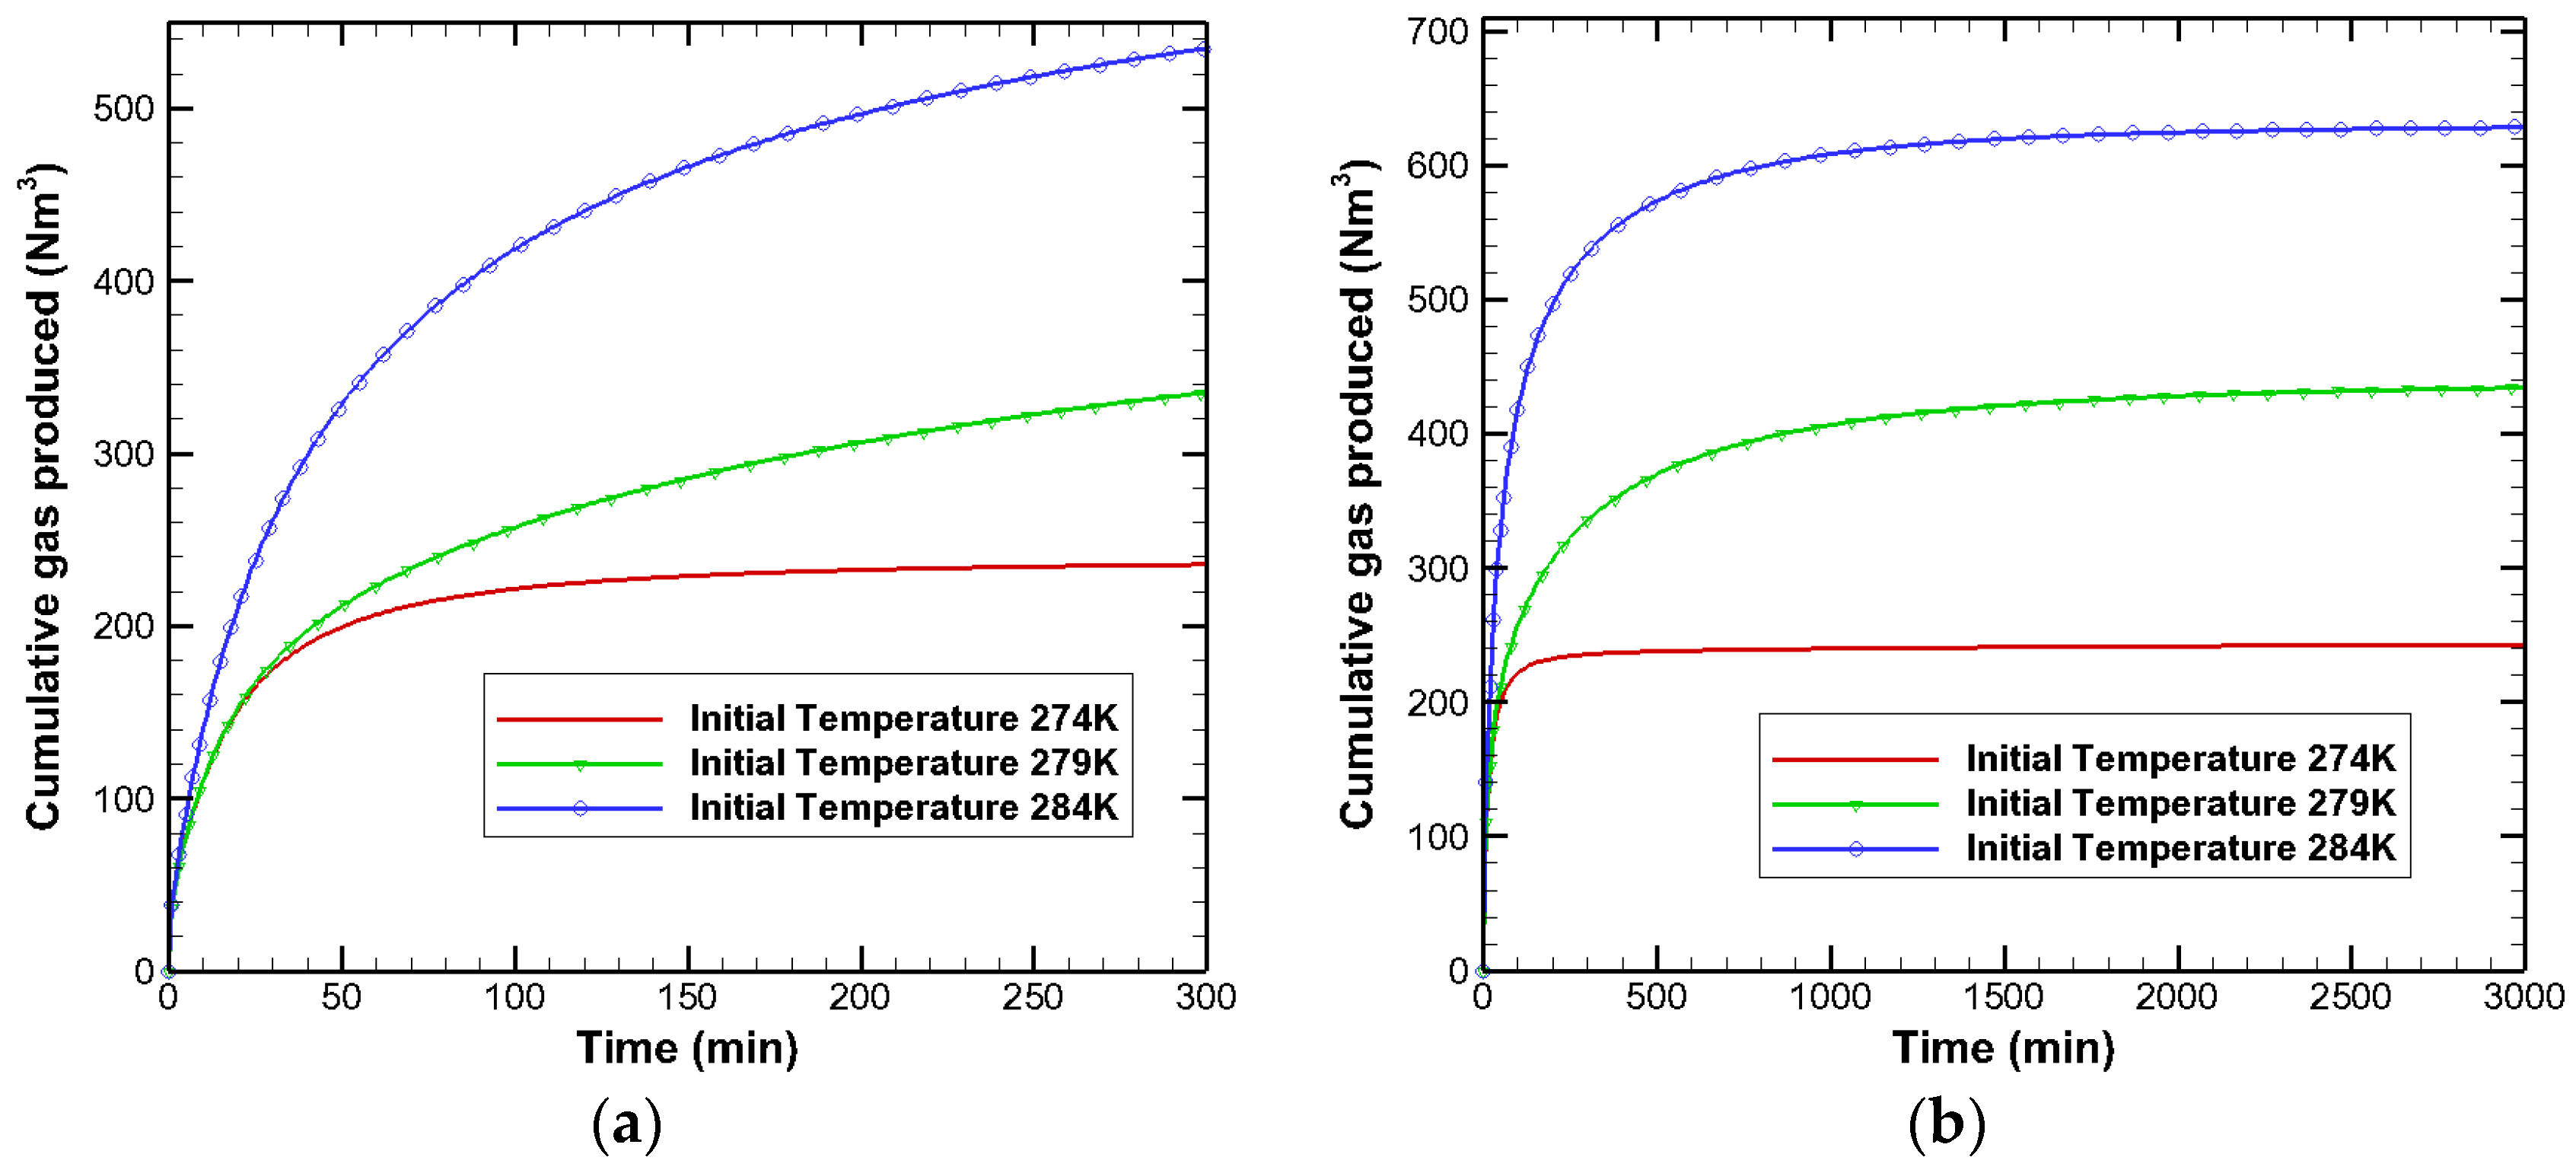
Gas production is the ultimate aim of methane hydrate exploitation. The changes of cumulative gas productions under different well pressures and initial temperatures were investigated in this study. Comparison of cumulative gas produced under well pressure of 3 MPa and different initial temperatures (274 K, 279 K, and 284 K) are shown in Figure 7. Obviously, the gas production under high initial temperature is large, because the condition is favorable to hydrate dissociation. From Figure 7a, at the beginning of mining (about exploiting time of 15 min), the gas production rates of the three cases are almost consistent and are all fast. Thus, the gas productions tend to stabilize. The stability time of gas production under initial temperature of 274 K is the earliest (approximately 100 min). As Figure 7b shows, though the gas production rate under initial temperature of 284 K is faster at the beginning, the gas productions under 284 K and 279 K both tend to stabilize after 1500 min. It indicates that the initial temperature can affect the stability time of gas production in the lower temperature zone, but the effect can be ignored in a higher initial temperature zone.
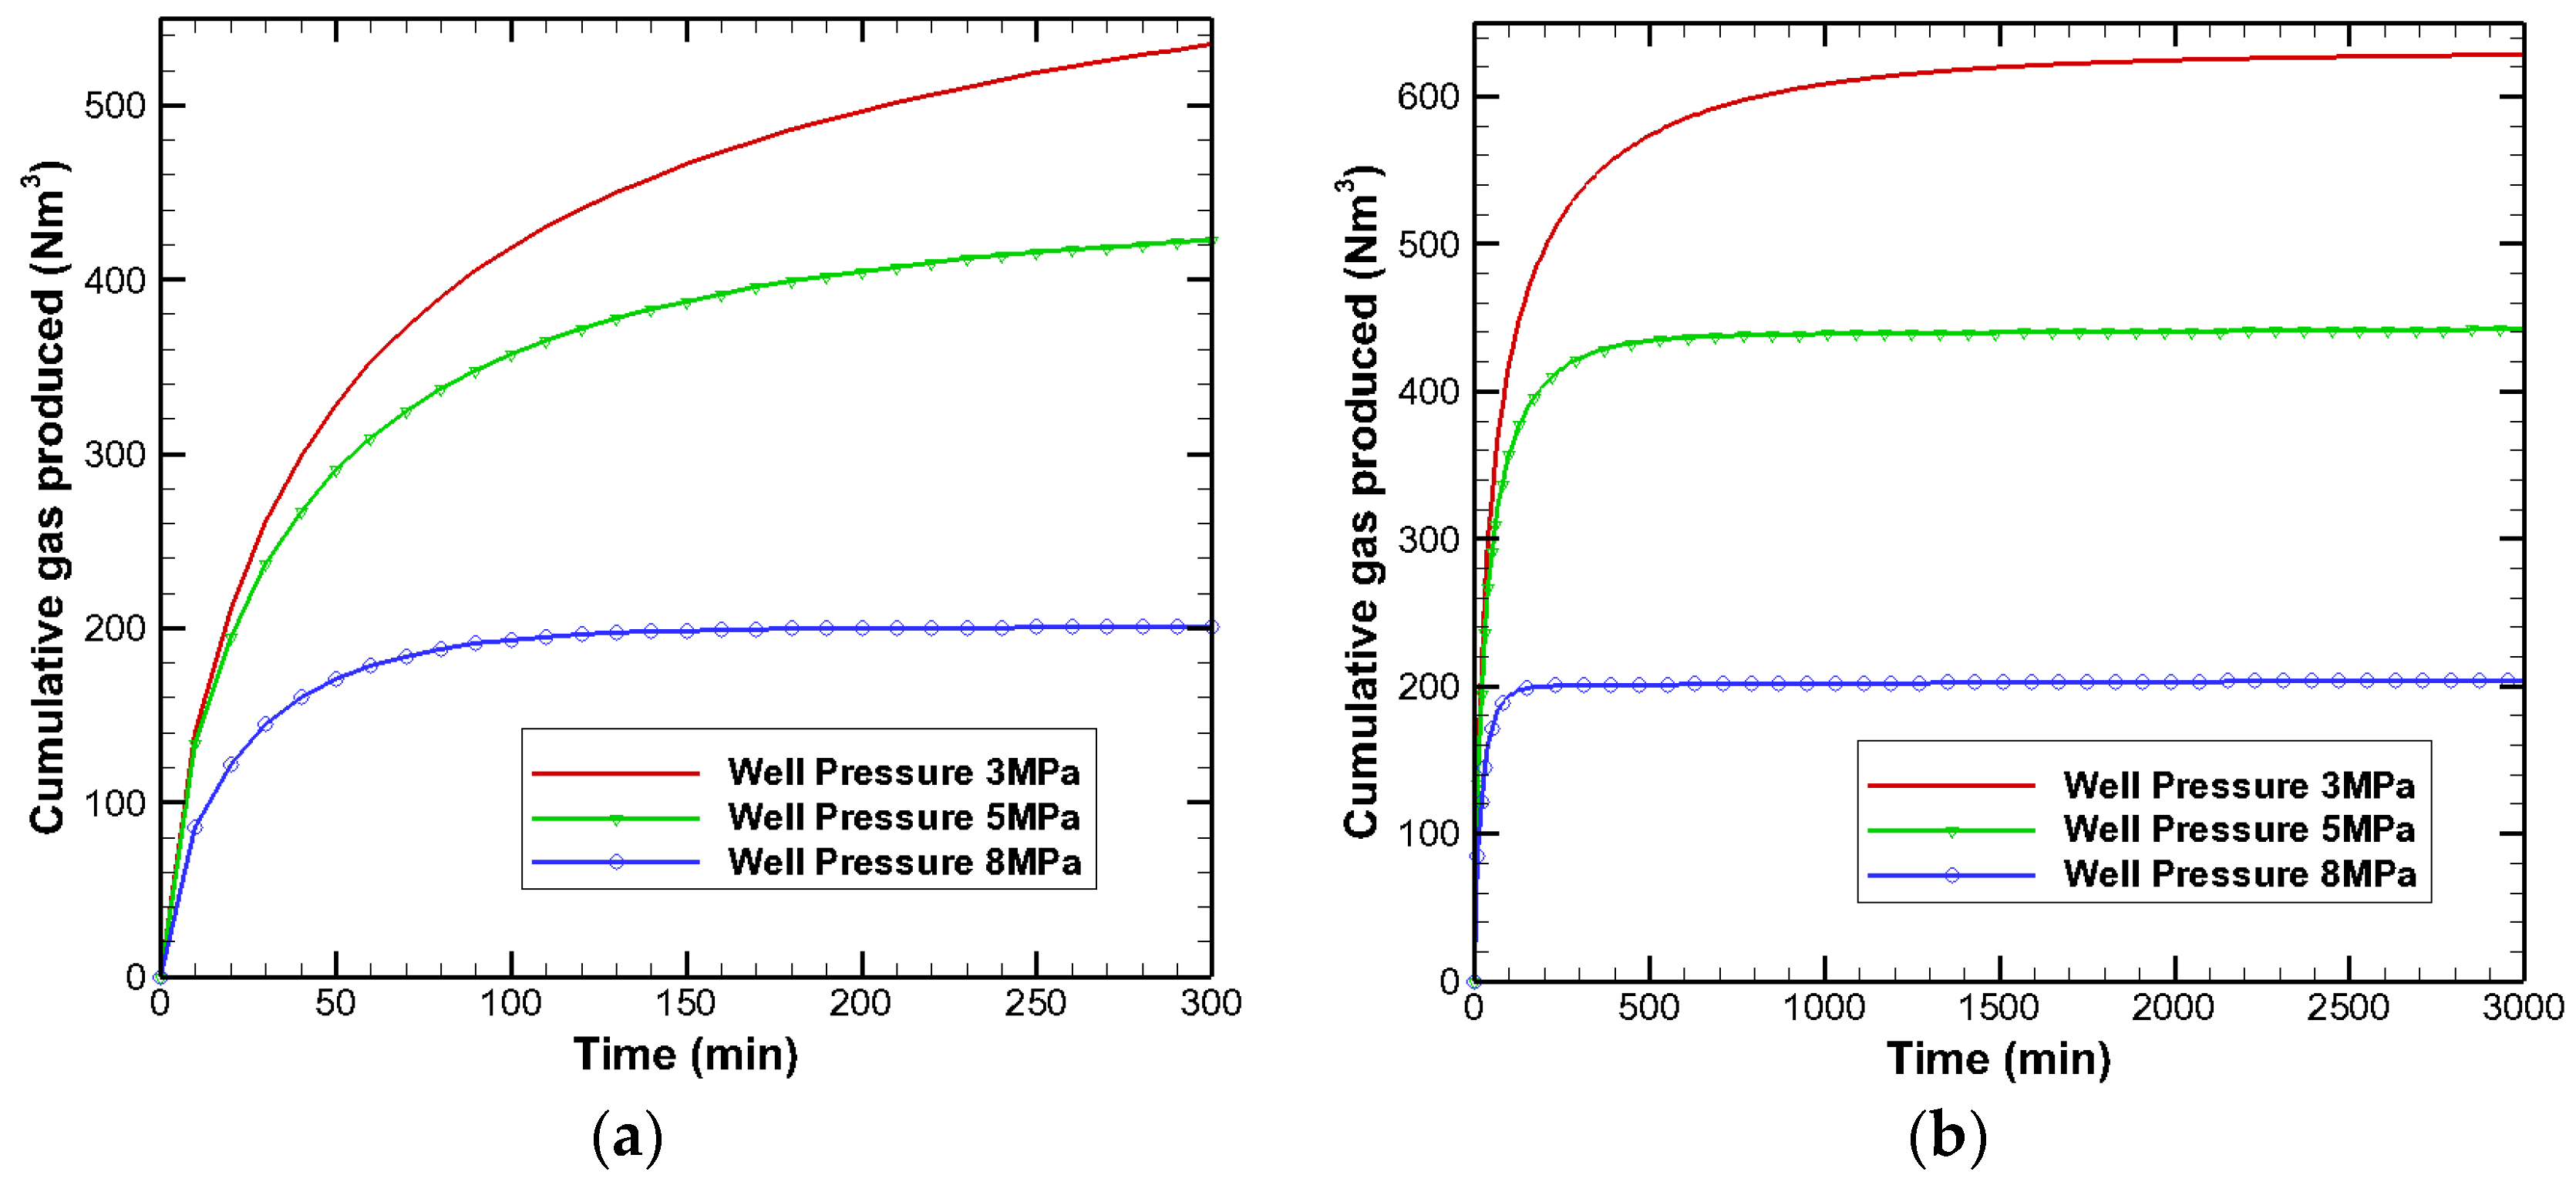
With high initial temperature, a low well pressure is a favorable term for hydrate dissociation. In this study, under the same initial temperature (284 K), the well pressure is lower, and the gas production is higher (as Figure 8). The stability time of gas production under a high well pressure is short. In addition, under the well pressure of 8 MPa, the time is approximately 100 min (as Figure 8a). From Figure 8b, the stability time under 5 MPa is approximately 500 min, and under 3 MPa is approximately 1500 min. These findings indicate that, unlike the effect of initial temperature, the different well pressures can affect the stability time of gas production in every pressure range.
4. Conclusions
A mathematical model was proposed for methane hydrate dissociation by depressurization in porous media. We developed a new code to solve the model, which can be used to investigate the effects of well pressure and initial temperature of reservoir on some important parameters for the hydrate dissociation process. The parameters include pressure distribution, temperature distribution, and gas production. Three different well pressures (3 MPa, 5 MPa, and 8 MPa), initial temperatures (274 K, 279 K, and 284 K), and different exploiting time (300 min, 3000 min, and 30,000 min) were set. The results show that the different well pressures and initial temperatures significantly affect the pressure distribution, temperature distribution and gas production. Under a higher well pressure (8 MPa) and lower initial temperature (274 K), the parameters are all stable after 300 min exploiting process. The average value of pressure and temperature under initial temperature of 279 K are all higher than that under 284 K. This is because of the combination effect of hydrate dissociation and fluid flow. As mining time goes on, all parameters tend to stabilize. For the initial parameters setting, the stability time is less than 3000 min in this study. The well pressure is higher and initial pressure is lower, and the time required for parameter stability is shorter. In the stage of stability, the pressure and temperature distributions under different conditions tend to be consistent, and the gas production almost have no change with time but are only related to the well pressure and initial temperature. Moreover, the initial temperature can affect the stability time of gas production in the lower temperature zone, but the effect can be ignored in the higher initial temperature zone. However, the different well pressures can affect the stability time of gas production in every pressure range.
Author Contributions
All authors contributed to interpretation of data and drafting of the manuscript. Minghao Yu wrote the code for simulation. Minghao Yu made substantial contributions to the concept and the analysis of data. Weizhong Li, Bo Dong and Cong Chen revised it critically for important intellectual content. Xin Wang gave some helpful advice for revision. Weizhong Li final approved the version to be published and agreed to be accountable for all aspects of the work.
Acknowledgments
This study was supported by the National Natural Science Foundation of China (Grant Nos. 51436003 and 51776031). It was also supported by the Fundamental Research Funds for the Central Universities (DUT16QY12).
Conflicts of Interest
We declare that we have no financial and personal relationships with other people or organizations that can inappropriately influence our work, and there is no professional or other personal interest of any nature or kind in any product, service and/or company that could be construed as influencing the position presented in, or the review of, the manuscript.
References
- Van der Waals, J.; Platteeuw, J. Clathrate solutions. Adv. Chem. Phys. 2007, 2, 1–57. [Google Scholar]
- Clarke, M.A.; Pooladi-Darvish, M.; Bishnoi, P.R. A method to predict equilibrium conditions of gas hydrate formation in porous media. Ind. Eng. Chem. Res. 1999, 38, 2485–2490. [Google Scholar] [CrossRef]
- Klauda, J.B.; Sandler, S.I. Modeling gas hydrate phase equilibria in laboratory and natural porous media. Ind. Eng. Chem. Res. 2001, 40, 4197–4208. [Google Scholar] [CrossRef]
- Kim, H.; Bishnoi, P.; Heidemann, R.; Rizvi, S. Kinetics of methane hydrate decomposition. Chem. Eng. Sci. 1987, 42, 1645–1653. [Google Scholar] [CrossRef]
- Uchida, T.; Ebinuma, T.; Ishizaki, T. Dissociation condition measurements of methane hydrate in confined small pores of porous glass. J. Phys. Chem. B 1999, 103, 3659–3662. [Google Scholar] [CrossRef]
- Seshadri, K.; Wilder, J.W.; Smith, D.H. Measurements of equilibrium pressures and temperatures for propane hydrate in silica gels with different pore-size distributions. J. Phys. Chem. B 2001, 105, 2627–2631. [Google Scholar] [CrossRef]
- Smith, D.H.; Wilder, J.W.; Seshadri, K. Methane hydrate equilibria in silica gels with broad pore-size distributions. AIChE J. 2002, 48, 393–400. [Google Scholar] [CrossRef]
- Seo, Y.; Lee, H.; Uchida, T. Methane and carbon dioxide hydrate phase behavior in small porous silica gels: Three-phase equilibrium determination and thermodynamic modeling. Langmuir 2002, 18, 9164–9170. [Google Scholar] [CrossRef]
- Sloan, E.D., Jr.; Koh, C. Clathrate Hydrates of Natural Gases; CRC Press: Boca Raton, FL, USA, 2007. [Google Scholar]
- Kwon, T.-H.; Cho, G.-C.; Santamarina, J.C. Gas hydrate dissociation in sediments: Pressure-temperature evolution. Geochem. Geophys. Geosyst. 2008, 9. [Google Scholar] [CrossRef]
- Song, Y.; Cheng, C.; Zhao, J.; Zhu, Z.; Liu, W.; Yang, M.; Xue, K. Evaluation of gas production from methane hydrates using depressurization, thermal stimulation and combined methods. Appl. Energy 2015, 145, 265–277. [Google Scholar] [CrossRef]
- Zhao, J.; Zhu, Z.; Song, Y.; Liu, W.; Zhang, Y.; Wang, D. Analyzing the process of gas production for natural gas hydrate using depressurization. Appl. Energy 2015, 142, 125–134. [Google Scholar] [CrossRef]
- Zhao, J.; Liu, D.; Yang, M.; Song, Y. Analysis of heat transfer effects on gas production from methane hydrate by depressurization. Int. J. Heat Mass Trans. 2014, 77, 529–541. [Google Scholar] [CrossRef]
- Jiang, L.; Wu, B.; Song, Y.; Yang, M.; Wang, D.; Liu, Y.; Xue, Z. Mass transfer coefficient measurement during brine flush in a CO2-filled packed bed by X-ray CT scanning. Int. J. Heat Mass Transf. 2017, 115, 615–624. [Google Scholar] [CrossRef]
- De Roo, J.; Peters, C.; Lichtenthaler, R.; Diepen, G. Occurrence of methane hydrate in saturated and unsaturated solutions of sodium chloride and water in dependence of temperature and pressure. AIChE J. 1983, 29, 651–657. [Google Scholar] [CrossRef]
- Servio, P.; Englezos, P. Effect of temperature and pressure on the solubility of carbon dioxide in water in the presence of gas hydrate. Fluid Phase Equilib. 2001, 190, 127–134. [Google Scholar] [CrossRef]
- Maekawa, T.; Itoh, S.; Sakata, S.; Igari, S.-I.; Imai, N. Pressure and temperature conditions for methane hydrate dissociation in sodium chloride solutions. Geochem. J. 1995, 29, 325–329. [Google Scholar] [CrossRef]
- Wu, Q.; Zhang, B. Memory effect on the pressure-temperature condition and induction time of gas hydrate nucleation. J. Nat. Gas Chem. 2010, 19, 446–451. [Google Scholar] [CrossRef]
- Holder, G.D.; Angert, P.F. Simulation of gas production from a reservoir containing both gas hydrates and free natural gas. In Proceedings of the SPE Annual Technical Conference and Exhibition, New Orleans, LA, USA, 26–29 September 1982; Society of Petroleum Engineers: Richardson, TX, USA, 1982. [Google Scholar]
- McGuire, P.L. Recovery of gas from hydrate deposits using conventional technology. In Proceedings of the SPE Unconventional Gas Recovery Symposium, Pittsburgh, PA, USA, 16–18 May 1982; Society of Petroleum Engineers: Richardson, TX, USA, 1982. [Google Scholar]
- Burshears, M.; O’brien, T.; Malone, R. A multi-phase, multi-dimensional, variable composition simulation of gas production from a conventional gas reservoir in contact with hydrates. In Proceedings of the SPE Unconventional Gas Technology Symposium, Louisville, KY, USA, 18–21 May 1986; Society of Petroleum Engineers: Richardson, TX, USA, 1986. [Google Scholar]
- Zhao, J.; Yu, T.; Song, Y.; Liu, D.; Liu, W.; Liu, Y.; Yang, M.; Ruan, X.; Li, Y. Numerical simulation of gas production from hydrate deposits using a single vertical well by depressurization in the Qilian Mountain permafrost, Qinghai-Tibet Plateau, China. Energy 2013, 52, 308–319. [Google Scholar] [CrossRef]
- Jamaluddin, A.; Kalogerakis, N.; Bishnoi, P. Modelling of decomposition of a synthetic core of methane gas hydrate by coupling intrinsic kinetics with heat transfer rates. Can. J. Chem. Eng. 1989, 67, 948–954. [Google Scholar] [CrossRef]
- Makogon, I.F. Hydrates of Hydrocarbons; Pennwell Books: Houston, TX, USA, 1997. [Google Scholar]
- Masuda, Y.; Fujinaga, Y.; Naganawa, S.; Fujita, K.; Sato, K.; Hayashi, Y. Modeling and experimental studies on dissociation of methane gas hydrates in Berea sandstone cores. In Proceedings of the 3rd International Conference on Gas Hydrates, Salt Lake City, UT, USA, 18–22 July 1999; pp. 18–22. [Google Scholar]
- Masuda, Y.; Kurihara, M.; Ohuchi, H.; Sato, T. A field-scale simulation study on gas productivity of formations containing gas hydrates. In Proceedings of the 4th International Conference on Gas Hydrate, Yokohama, Japan, 19–23 May 2002; pp. 40–46. [Google Scholar]
- Chong, Z.R.; Yang, S.H.B.; Babu, P.; Linga, P.; Li, X.-S. Review of natural gas hydrates as an energy resource: Prospects and challenges. Appl. Energy 2016, 162, 1633–1652. [Google Scholar] [CrossRef]
- Moridis, G.; Apps, J.; Pruess, K.; Myer, L. EOSHYDR: A TOUGH2 Module for CH4-Hydrate Release and Flow in the Subsurface; Report LBNL-42386; Lawrence Berkeley National Laboratory: Berkeley, CA, USA, 1998. [Google Scholar]
- Moridisd, G.J.; Collett, T.S. Preliminary Studies of Gas Production from Methane Hydrates in the Eileen Area, Alaska; National Energy Technology Laboratory: Pittsburgh, PA, USA, 2002. [Google Scholar]
- Moridis, G.J. TOUGH + HYDRATE v1.2 User’s Manual: A Code for the Simulation of System Behavior in Hydrate-Bearing Geologic Media; Lawrence Berkeley National Laboratory: Berkeley, CA, USA, 2014. [Google Scholar]
- Bai, Y.; Li, Q.; Li, X.; Du, Y. The simulation of nature gas production from ocean gas hydrate reservoir by depressurization. Sci. China Ser. E Technol. Sci. 2008, 51, 1272–1282. [Google Scholar] [CrossRef]
- Oyama, H.; Konno, Y.; Masuda, Y.; Narita, H. Dependence of depressurization-induced dissociation of methane hydrate bearing laboratory cores on heat transfer. Energy Fuels 2009, 23, 4995–5002. [Google Scholar] [CrossRef]
- Uchida, S.; Soga, K.; Yamamoto, K. Critical state soil constitutive model for methane hydrate soil. J. Geophys. Res. Solid Earth 2012, 117. [Google Scholar] [CrossRef]
- Daigle, H.; Dugan, B. Capillary controls on methane hydrate distribution and fracturing in advective systems. Geochem. Geophys. Geosyst. 2013, 12. [Google Scholar] [CrossRef]
- Mahabadi, N.; Dai, S.; Seol, Y.; Sup Yun, T.; Jang, J. The water retention curve and relative permeability for gas production from hydrate-bearing sediments: Pore-network model simulation. Geochem. Geophys. Geosyst. 2016, 17, 3099–3110. [Google Scholar] [CrossRef]
- Anderson, R.; Tohidi, B.; Webber, J.B.W. Gas hydrate growth and dissociation in narrow pore networks: Capillary inhibition and hysteresis phenomena, in Sediment- Hosted Gas Hydrates: New Insights on Natural and Synthetic Systems. Geol. Soc. Spec. Publ. 2009, 319, 145–159. [Google Scholar] [CrossRef]
- Selim, M.; Sloan, E. Hydrate dissociation in sediment. SPE Res. Eng. 1990, 5, 245–251. [Google Scholar] [CrossRef]
- Van Genuchten, M.T. A closed-form equation for predicting the hydraulic conductivity of unsaturated soils. Soil Sci. Soc. Am. J. 1980, 44, 892–898. [Google Scholar] [CrossRef]
Figure 1.
The equilibrium pressure corresponding to the current temperature within the range of 274 K to 284 K. Red line shows the critical line.
Figure 1.
The equilibrium pressure corresponding to the current temperature within the range of 274 K to 284 K. Red line shows the critical line.
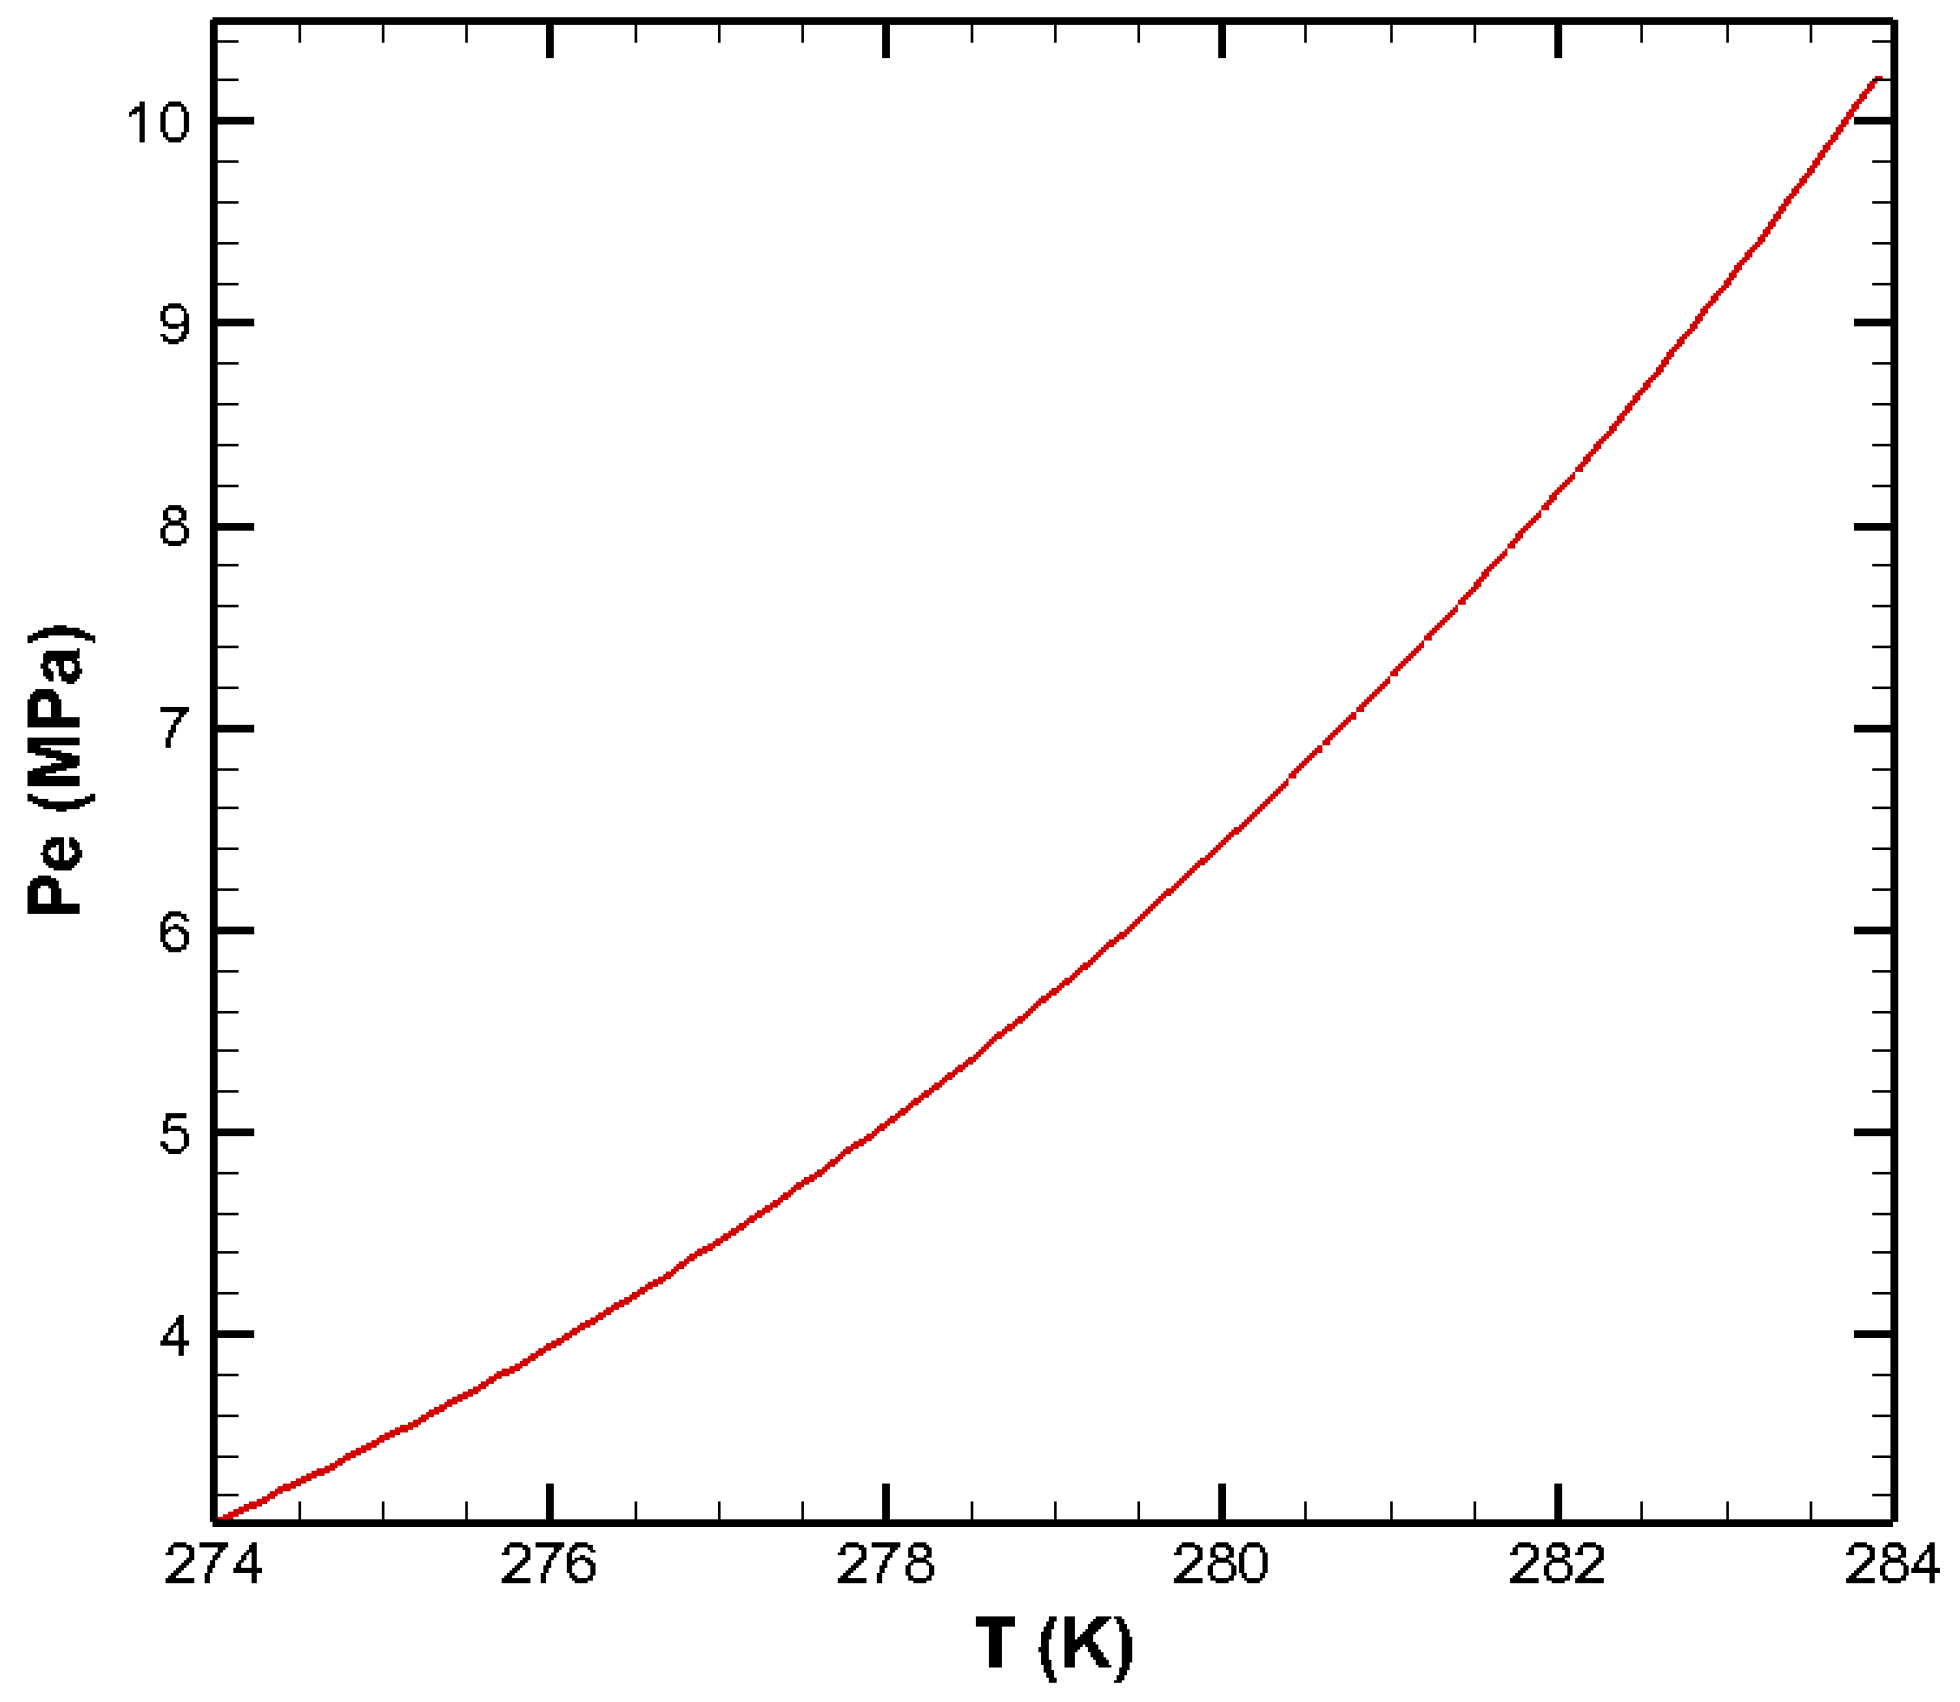
Figure 2.
Comparison of the cumulative gas produced from this model and Musuda’s experiment [25].
Figure 2.
Comparison of the cumulative gas produced from this model and Musuda’s experiment [25].
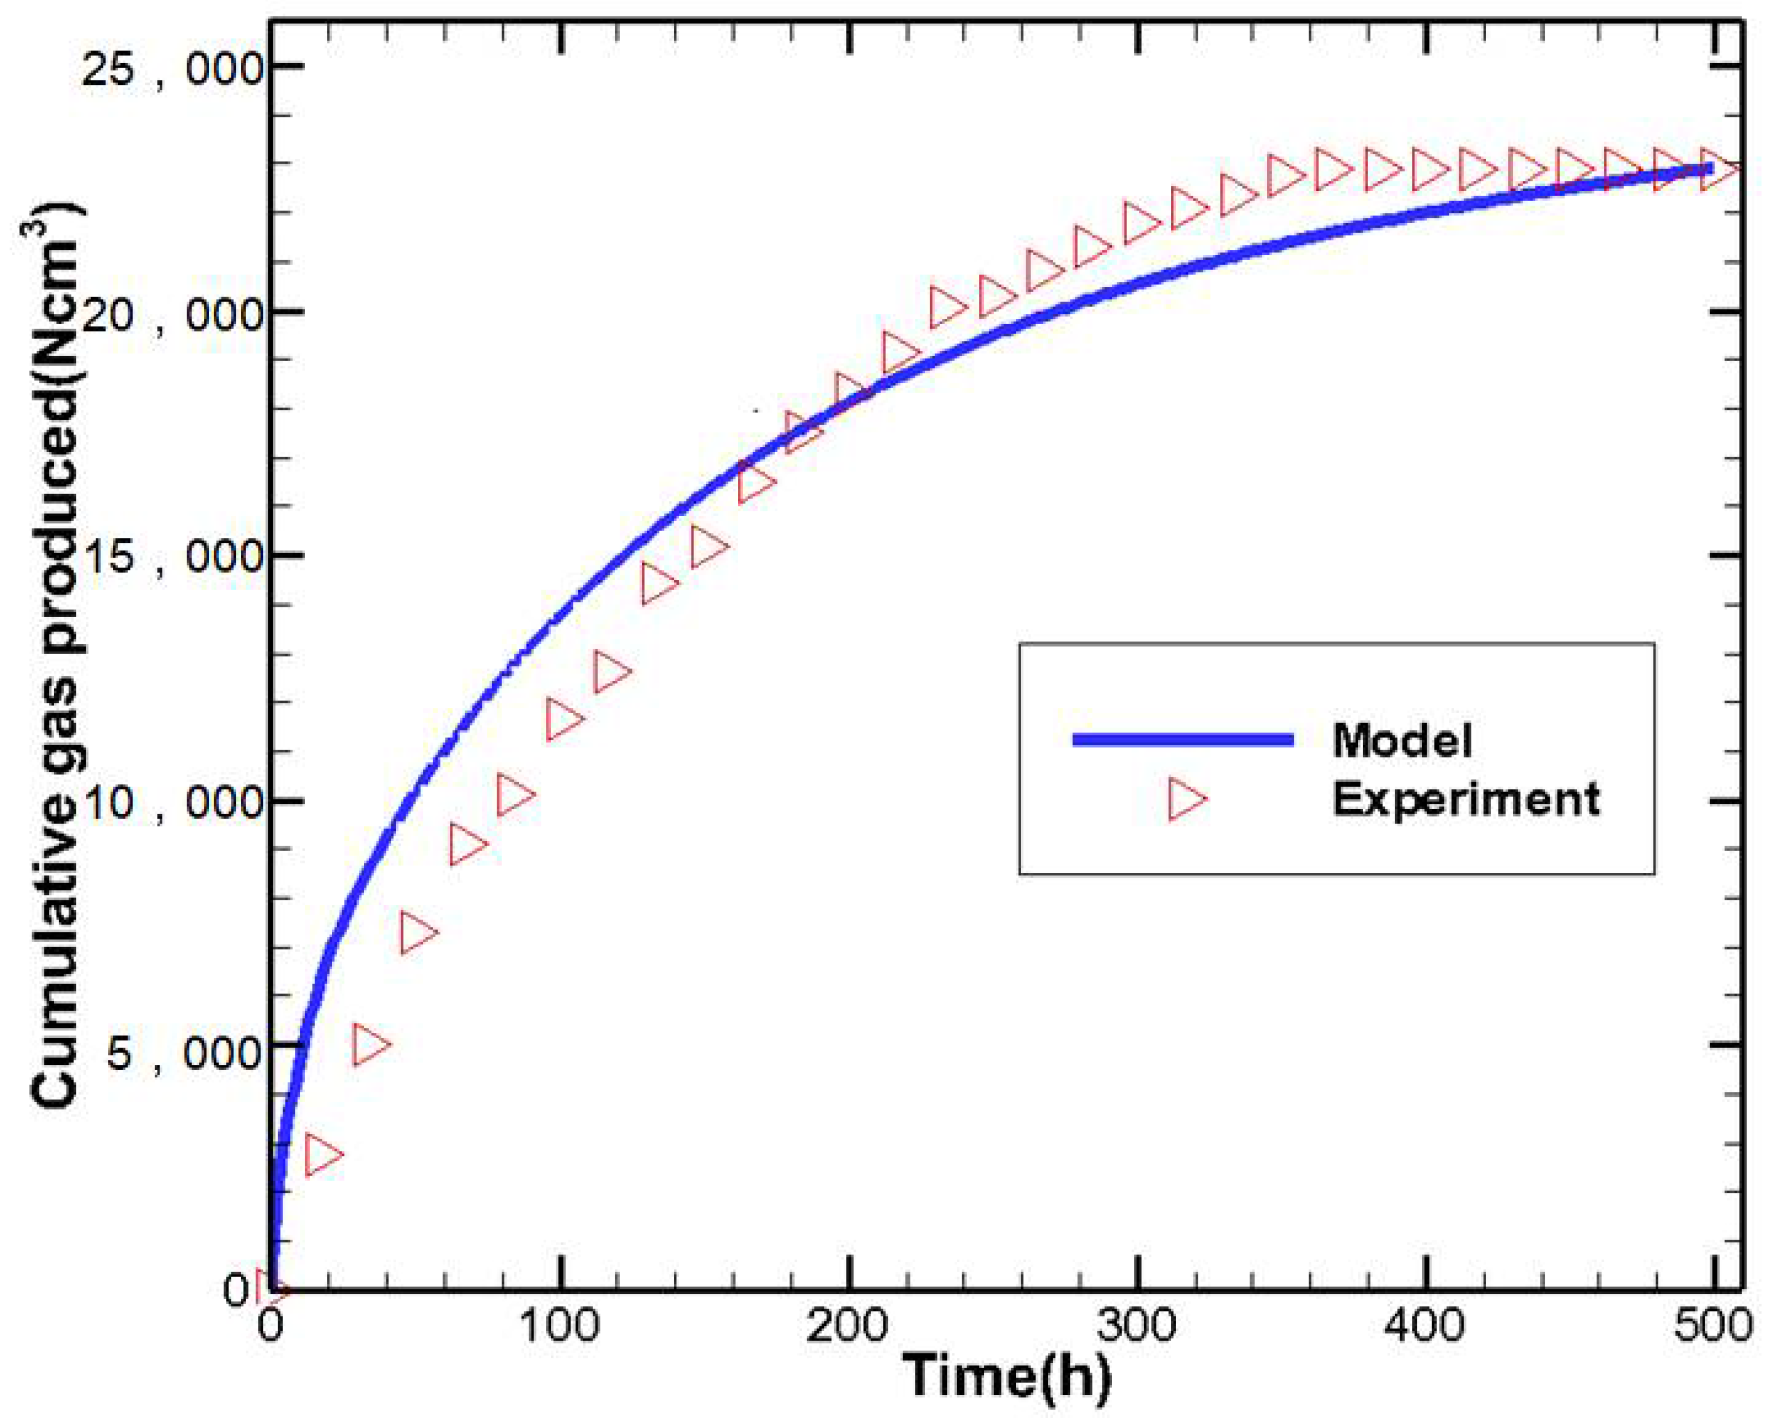
Figure 3.
Comparisons of pressure distributions in reservoir under different initial temperatures (274 K, 279 K, and 284 K) at different exploiting time (a) 300 min; (b) 3000 min; (c) 30,000 min.
Figure 3.
Comparisons of pressure distributions in reservoir under different initial temperatures (274 K, 279 K, and 284 K) at different exploiting time (a) 300 min; (b) 3000 min; (c) 30,000 min.
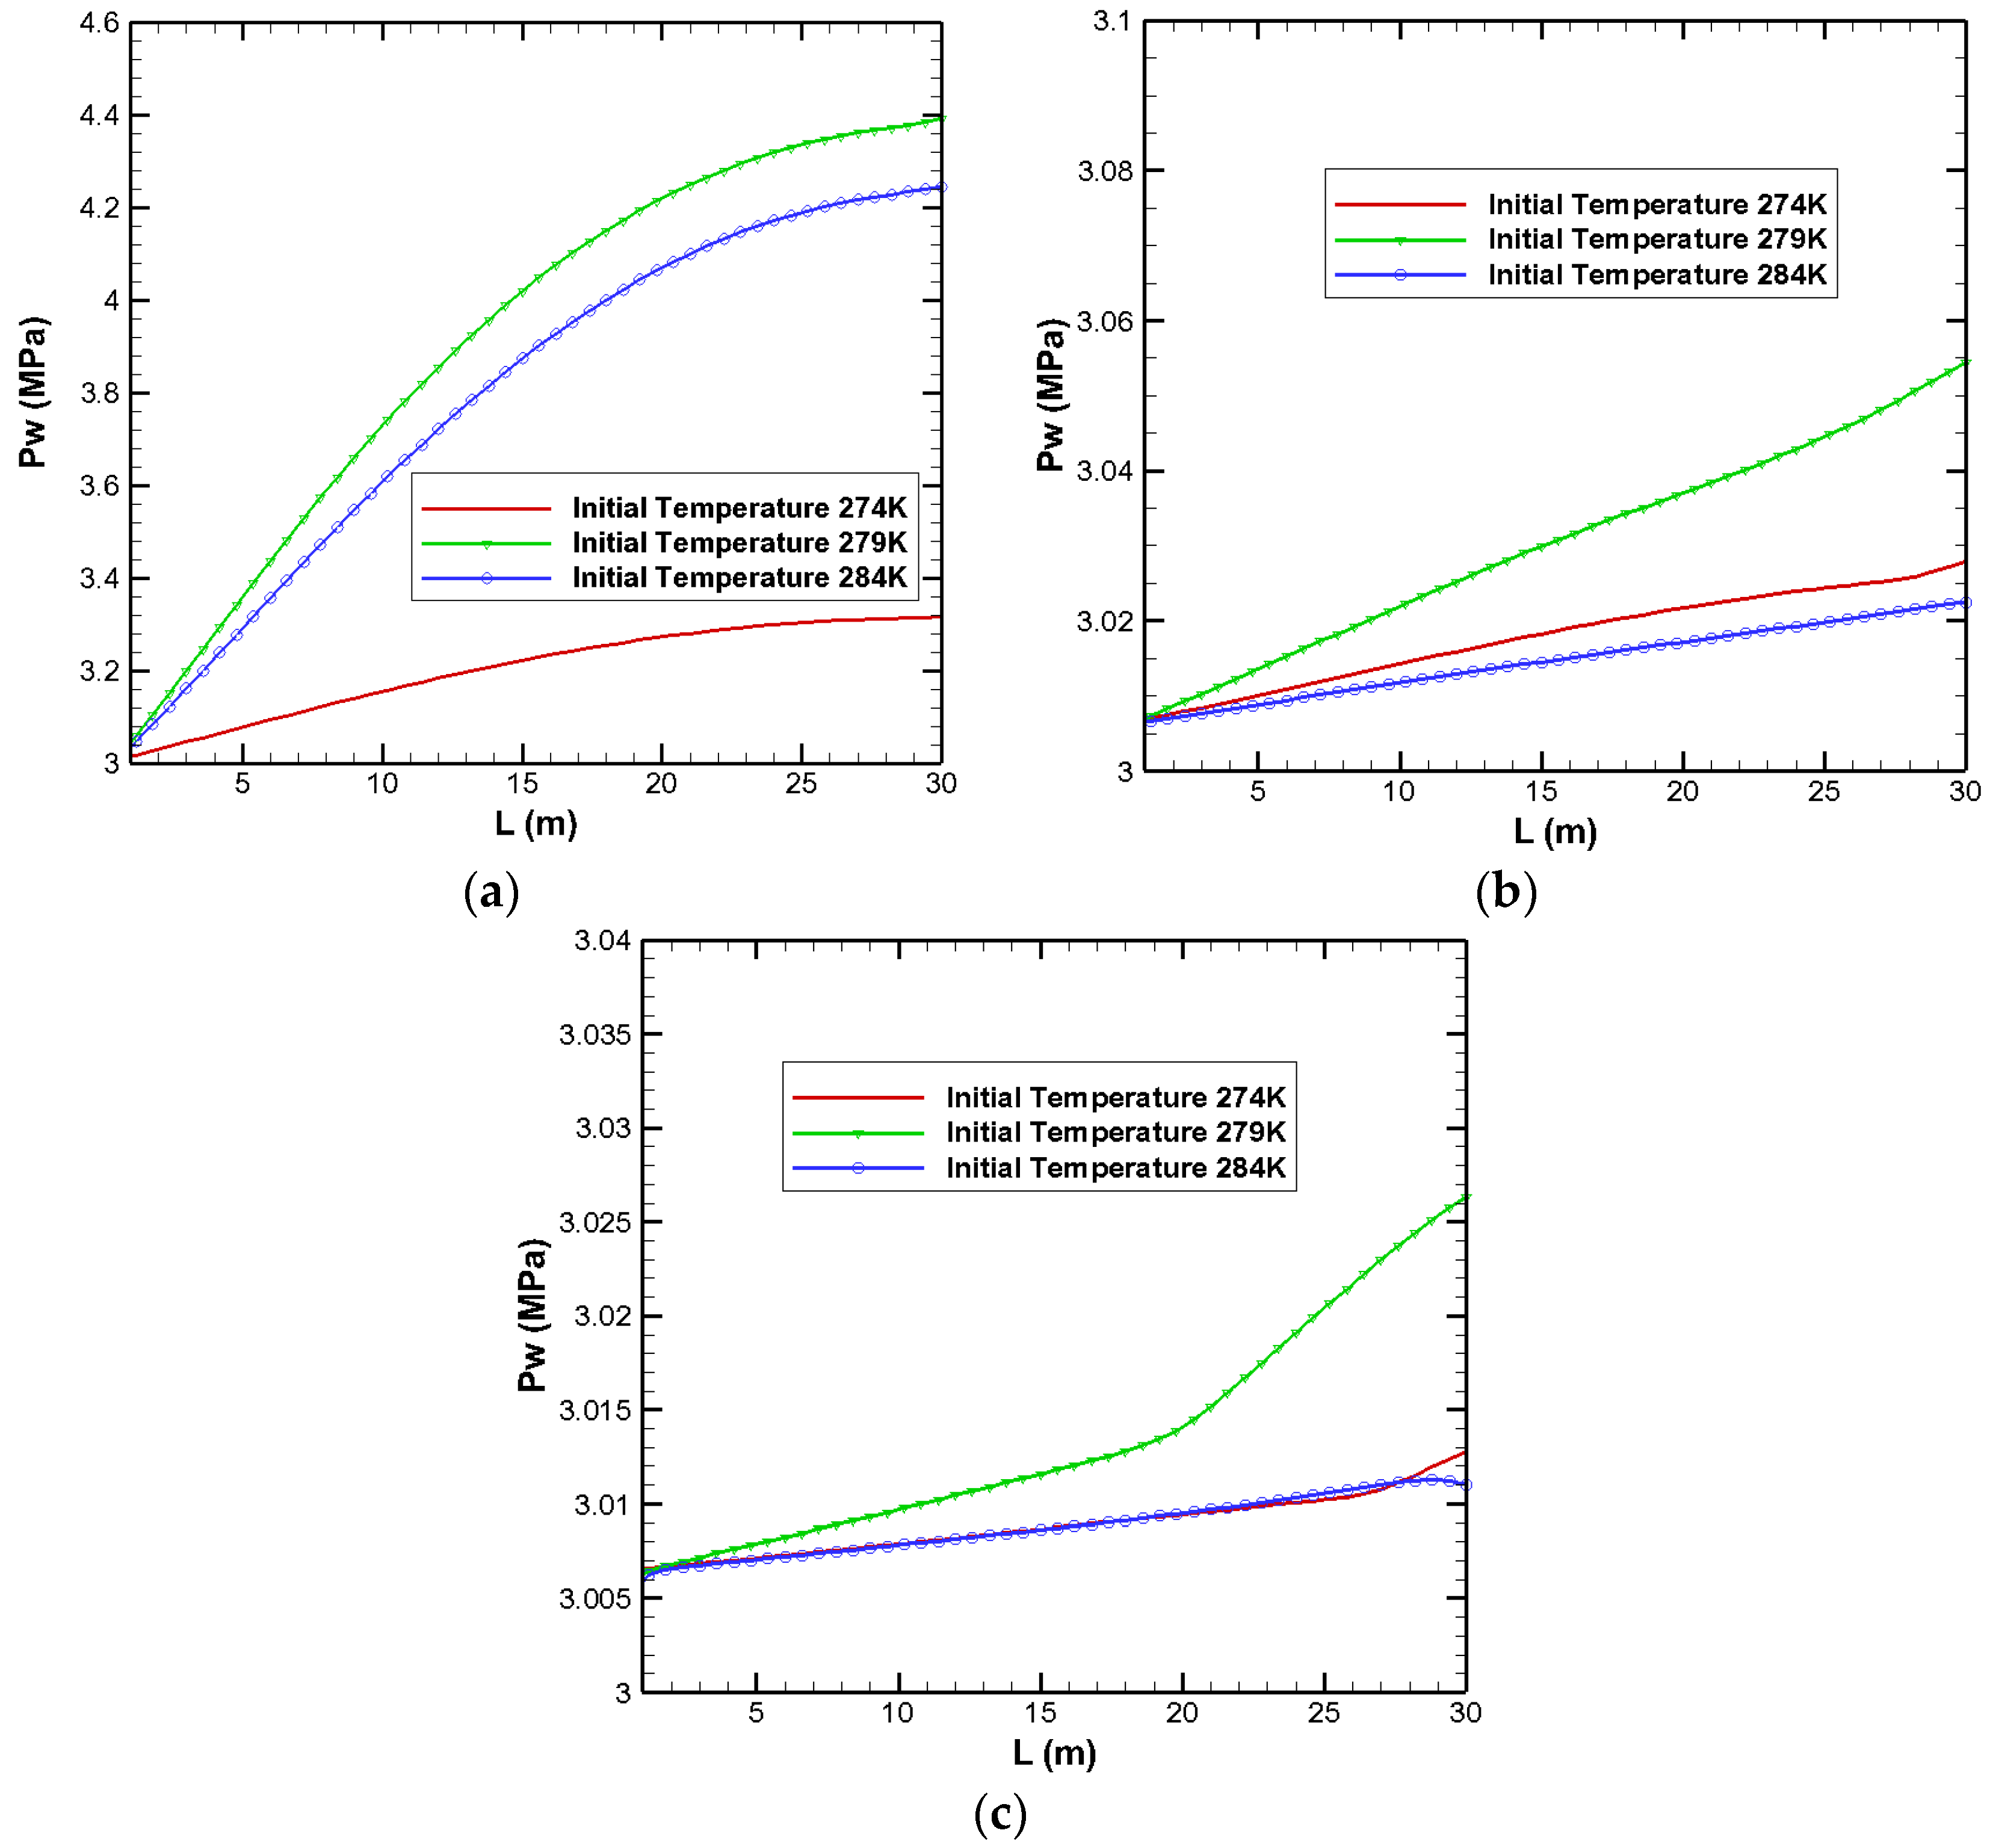
Figure 4.
Comparison of pressure distribution in the reservoir under well pressure of 5 MPa and initial temperature of 284 K at different exploiting times (300 min, 3000 min, and 30,000 min).
Figure 4.
Comparison of pressure distribution in the reservoir under well pressure of 5 MPa and initial temperature of 284 K at different exploiting times (300 min, 3000 min, and 30,000 min).
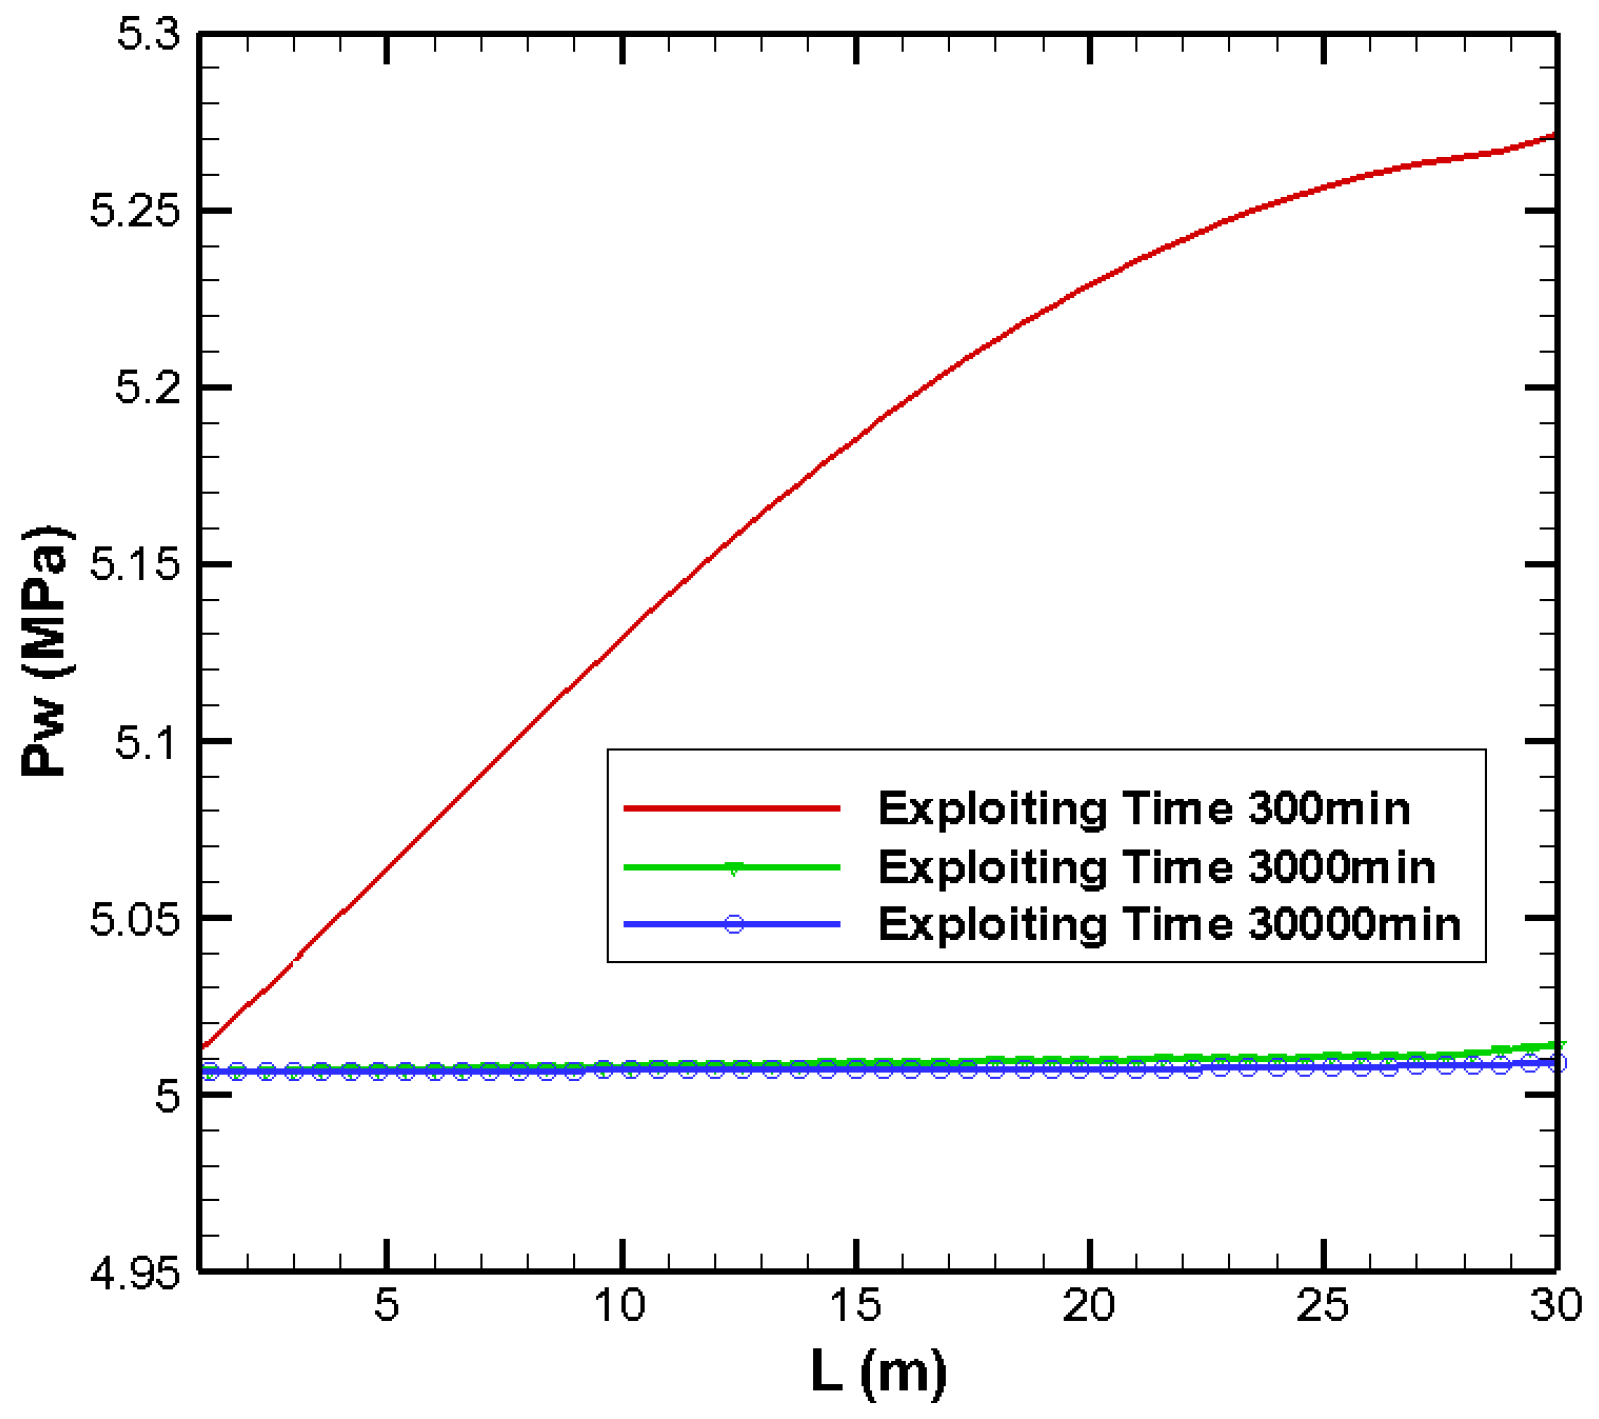
Figure 5.
Comparison of temperature distributions in reservoirs under well pressure of 3 MPa, and different initial temperatures (274 K, 279 K, and 284 K) at exploiting time of 300 min.
Figure 5.
Comparison of temperature distributions in reservoirs under well pressure of 3 MPa, and different initial temperatures (274 K, 279 K, and 284 K) at exploiting time of 300 min.

Figure 6.
Comparison of temperature distributions in reservoir under initial temperature of 284 K and different well pressures (a) 3 MPa; (b) 5 MPa; (c) 8 MPa at different exploiting time (300 min, 3000 min, and 30,000 min).
Figure 6.
Comparison of temperature distributions in reservoir under initial temperature of 284 K and different well pressures (a) 3 MPa; (b) 5 MPa; (c) 8 MPa at different exploiting time (300 min, 3000 min, and 30,000 min).

Figure 7.
Comparisons of cumulative gas produced under well pressure of 3 MPa and different initial temperatures (274 K, 279 K, and 284 K) at different exploiting time (a) 300 min; (b) 3000 min.
Figure 7.
Comparisons of cumulative gas produced under well pressure of 3 MPa and different initial temperatures (274 K, 279 K, and 284 K) at different exploiting time (a) 300 min; (b) 3000 min.

Figure 8.
Comparisons of cumulative gas produced under initial temperature of 284 K and different well pressures (3 MPa, 5 MPa, and 8 MPa) at different exploiting time (a) 300 min; (b) 3000 min.
Figure 8.
Comparisons of cumulative gas produced under initial temperature of 284 K and different well pressures (3 MPa, 5 MPa, and 8 MPa) at different exploiting time (a) 300 min; (b) 3000 min.


Table 1.
Reservoir initial conditions in Masuda experiment [25].
Table 1.
Reservoir initial conditions in Masuda experiment [25].
| Parameters | Values | Parameters | Values |
|---|---|---|---|
| Reservoir length, L (cm) | 30 | Initial hydrate saturation, Sh (%) | 45 |
| Initial permeability, K0 (md) | 97.98 | Initial water saturation, Sw (%) | 20 |
| Porosity, Φ (%) | 18.2 | Initial gas saturation, Sg (%) | 35 |
| Initial reservoir pressure, P0 (MPa) | 3.75 | Permeability reduction index, N | 4 |
| Initial reservoir temperature, T0 (K) | 275.45 | - | - |
Table 2.
Reservoir basic parameters values in the hydrate depressurization model.
| Parameters | Values | Parameters | Values |
|---|---|---|---|
| Reservoir length, L (m) | 30 | Initial hydrate saturation, Sh (%) | 45 |
| Initial permeability, K0 (md) | 97.98 | Initial water saturation, Sw (%) | 20 |
| Porosity, Φ (%) | 20 | Initial gas saturation, Sg (%) | 35 |
| Initial reservoir pressure, P0 (MPa) | 10.4 | Permeability reduction index, N | 4 |
© 2018 by the authors. Licensee MDPI, Basel, Switzerland. This article is an open access article distributed under the terms and conditions of the Creative Commons Attribution (CC BY) license (http://creativecommons.org/licenses/by/4.0/).
Share and Cite
MDPI and ACS Style
Yu, M.; Li, W.; Dong, B.; Chen, C.; Wang, X. Simulation for the Effects of Well Pressure and Initial Temperature on Methane Hydrate Dissociation. Energies 2018, 11, 1179. https://doi.org/10.3390/en11051179
AMA Style
Yu M, Li W, Dong B, Chen C, Wang X. Simulation for the Effects of Well Pressure and Initial Temperature on Methane Hydrate Dissociation. Energies. 2018; 11(5):1179. https://doi.org/10.3390/en11051179
Chicago/Turabian StyleYu, Minghao, Weizhong Li, Bo Dong, Cong Chen, and Xin Wang. 2018. "Simulation for the Effects of Well Pressure and Initial Temperature on Methane Hydrate Dissociation" Energies 11, no. 5: 1179. https://doi.org/10.3390/en11051179
Note that from the first issue of 2016, this journal uses article numbers instead of page numbers. See further details here.