1. Introduction
In the Köppen-Geiger climate classification system, some subdivisions of tropical climates (Af, Am, Aw), temperate climates (Cfa, Cfb, Cfc, Cw, Cs) and continental climates have many humid days due to either rain or fog. Seoul, the capital city of South Korea, belongs to the group of hot summer continental climates (Dwa) and experiences hot and humid weather during summer. Accordingly, recent research and development activities have focused on dehumidification as well as cooling [
1].
The conventionally used evaporative cooling dehumidification (ECD) system consumes considerable energy for dehumidification and an increase in the temperature at the dehumidifier outlet makes it difficult to use the dehumidifier during weather that is both hot and humid. Moreover, ECD is unsuitable in places where temperature-sensitive products such as food and pharmaceuticals are stored. The desiccant dehumidifier consumes relatively less energy but uses environmentally restricted materials, which are difficult to dispose of after use. Moreover, although the hybrid dehumidifier has been developed to remedy the disadvantages of ECD and desiccant dehumidifiers and to maximize their advantages, it is a complex and expensive system, thereby not as efficient as expected in small and medium-sized buildings. However, the membrane-based dehumidification system (MDS) does not cause temperature changes or environmental problems and consumes less energy than the ECD. Furthermore, the dehumidification process employed in an ECD leads to an increase in the air temperature, thereby making it necessary to use an air-conditioner. The desiccant dehumidifier also increases the air temperature during its operation and a desiccant such as silica gel and zeolite may contaminate the environment. For these reasons, many researchers have expressed interested in the MDS system. In particular, Metz et al. [
2], Bolto et al. [
3] and Murali et al. [
4] have investigated polymer membranes. However, they were limited by the permeability and selectivity enhancement of the membrane; furthermore, they failed to consider the effect of the improved membrane performance on the potential of energy demand reduction of the building.
Yang et al. [
5] created a dehumidifier using a shell-and-tube hollow fiber membrane and conducted an exergy analysis under various dehumidification conditions. Based on the analysis of exergy, they argued that the membrane was superior. Zhao et al. [
6] fabricated a bundle-type hollow fiber membrane and conducted a performance experiment to compare energy saving rates between the membrane and the air-conditioning process. However, the air-conditioning system to which it was compared was not a dedicated device for dehumidification but rather eliminated moisture as an extra function while lowering the temperature. The exothermic phenomenon of a conventional dehumidification system also needs to be considered. On the other hand, the hollow fiber membrane presents a wider available area of application than other types of membranes due to its circular shape. In this regard, the hollow fiber membrane is expected to show better performance and thus is widely used. This study also applied a hollow fiber membrane, which was fabricated as a cartridge that could be inserted into the duct of a dehumidifying air-conditioning system. The membrane-based dehumidification method was adopted to examine its applicability. Energy consumption was also analyzed in comparison with the existing evaporative cooling dehumidification method.
In this study, TRNSYS (transient system simulation) was used for simulation. TRNSYS is typically used for thermal and energy simulations and incorporates components that can be used to calculate the temperature/humidity and loads, respectively. It can be conveniently applied to HVAC (Heating, Ventilation, Air Conditioning) systems or employed to calculate values of new and renewable energy [
7]. Abdel-Salam et al. [
8] used TRNSYS to compare the existing air-conditioning system with liquid-to-air membrane energy exchangers (LAMEEs) in terms of performance. They reported that the membrane-based energy exchangers exhibited better performance in a dehumidified environment. From the comparison between the two dehumidification methods, this paper demonstrated the better energy savings of the membrane-based dehumidification method. In practice, it is difficult to conduct every necessary experiment before installing a system. Accordingly, a simple experiment was conducted by applying the main parameters (temperature, humidity and flow rate) in this study. Nevertheless, for the experiment, a smoke test was performed at the duct of the membrane inlet to see whether the flow was stabilized. Three flow channels were positioned at the inlet to provide a flow that was uniformly distributed in the header of the membrane. Any other parameters except temperature, humidity, pressure and flowrate were prevented from affecting the dehumidification efficiency. The main parameters influencing the performance of the system were presented to enable the performance of the system to be predicted before installation.
2. Simulation Approach
The simulation compared energy demand variations with ECD and MDS, the effect of pollutants in the air was not considered due to the filter installed at the inlet side.
2.1. Membrane-Based Dehumidification
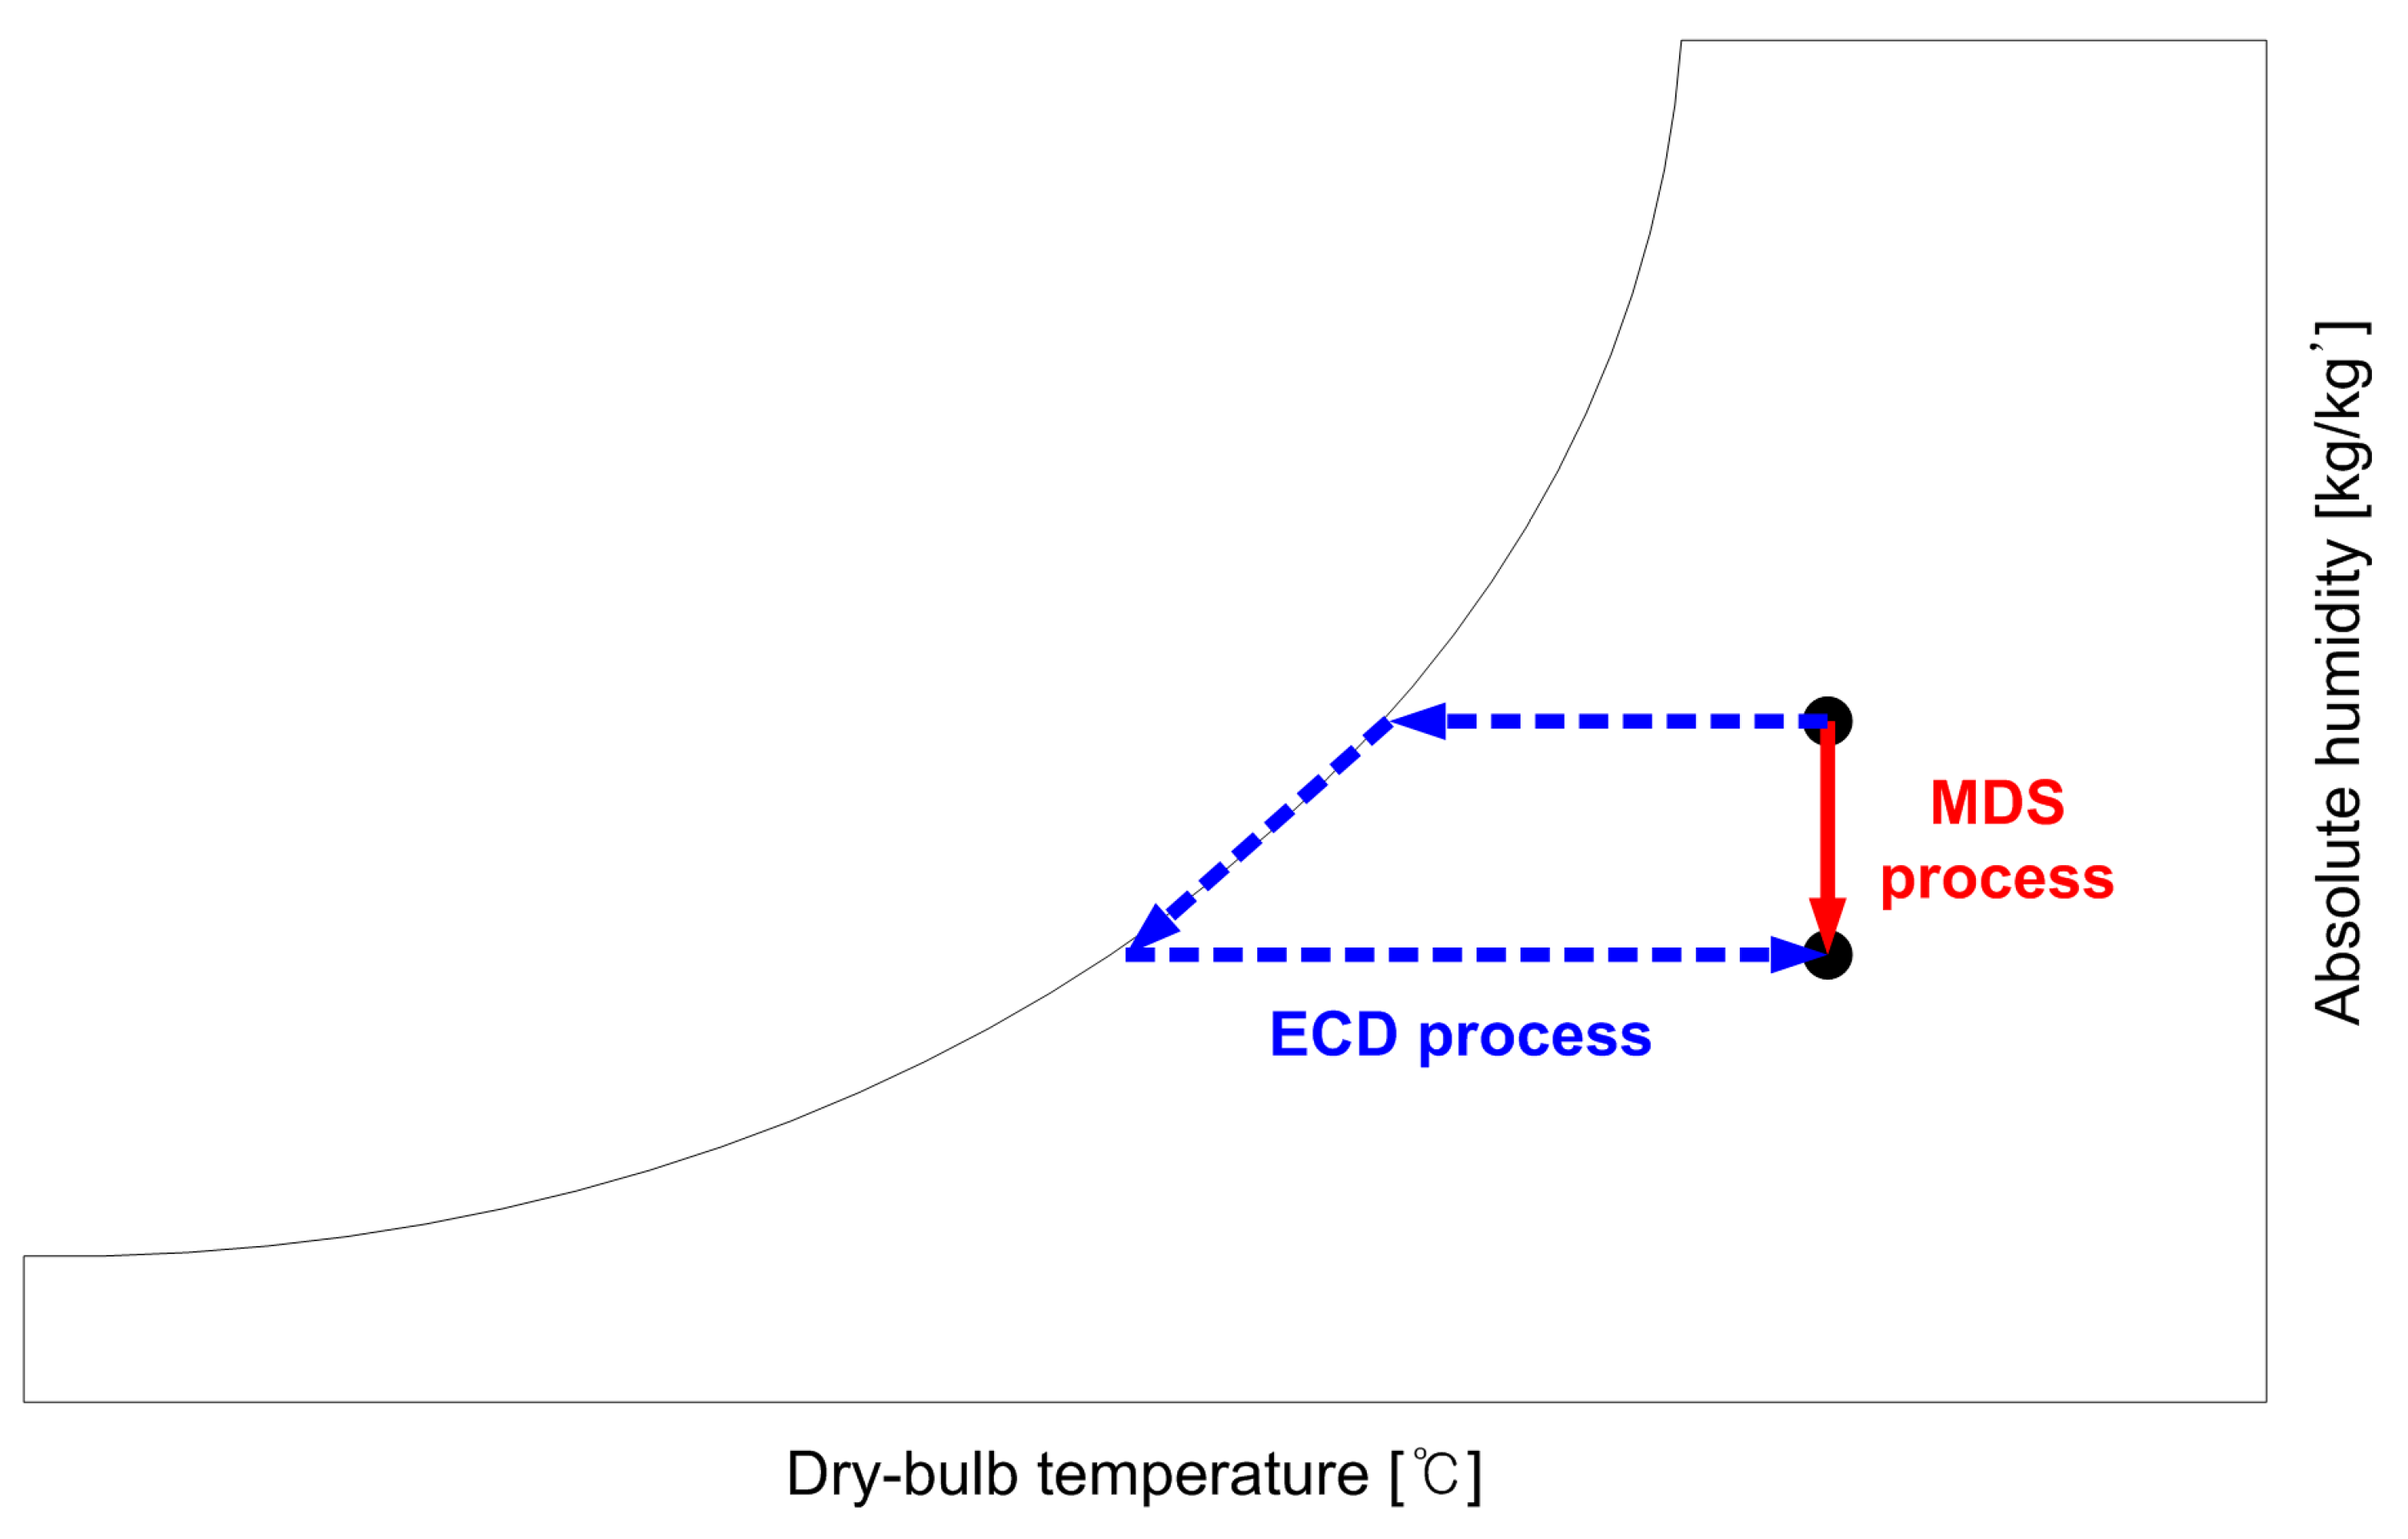
The ECD method saturates air by putting it into contact with a material at a temperature lower than dew point and then removes the moisture from the saturated air. However, this process inevitably raises the temperatures to decrease the relative humidity. Accordingly, an additional decrease of temperature is needed because of the temperature rise required for dehumidification (dotted blue line,
Figure 1). On the other hand, MDS, as shown in
Figure 1, separates moisture from wet air, which does not cause any temperature change while lowering the humidity (solid red line,
Figure 1).
2.2. Simulation Concept
To calculate the dehumidification load, a space with dimensions of 7 m × 7 m × 3 m was assumed for dehumidification. In most private houses in South Korea, a dehumidifier is installed in the living room, a space that occupies approximately half of the total living area of the house. Thus, the size of the assumed total space was approximately 100 m2.
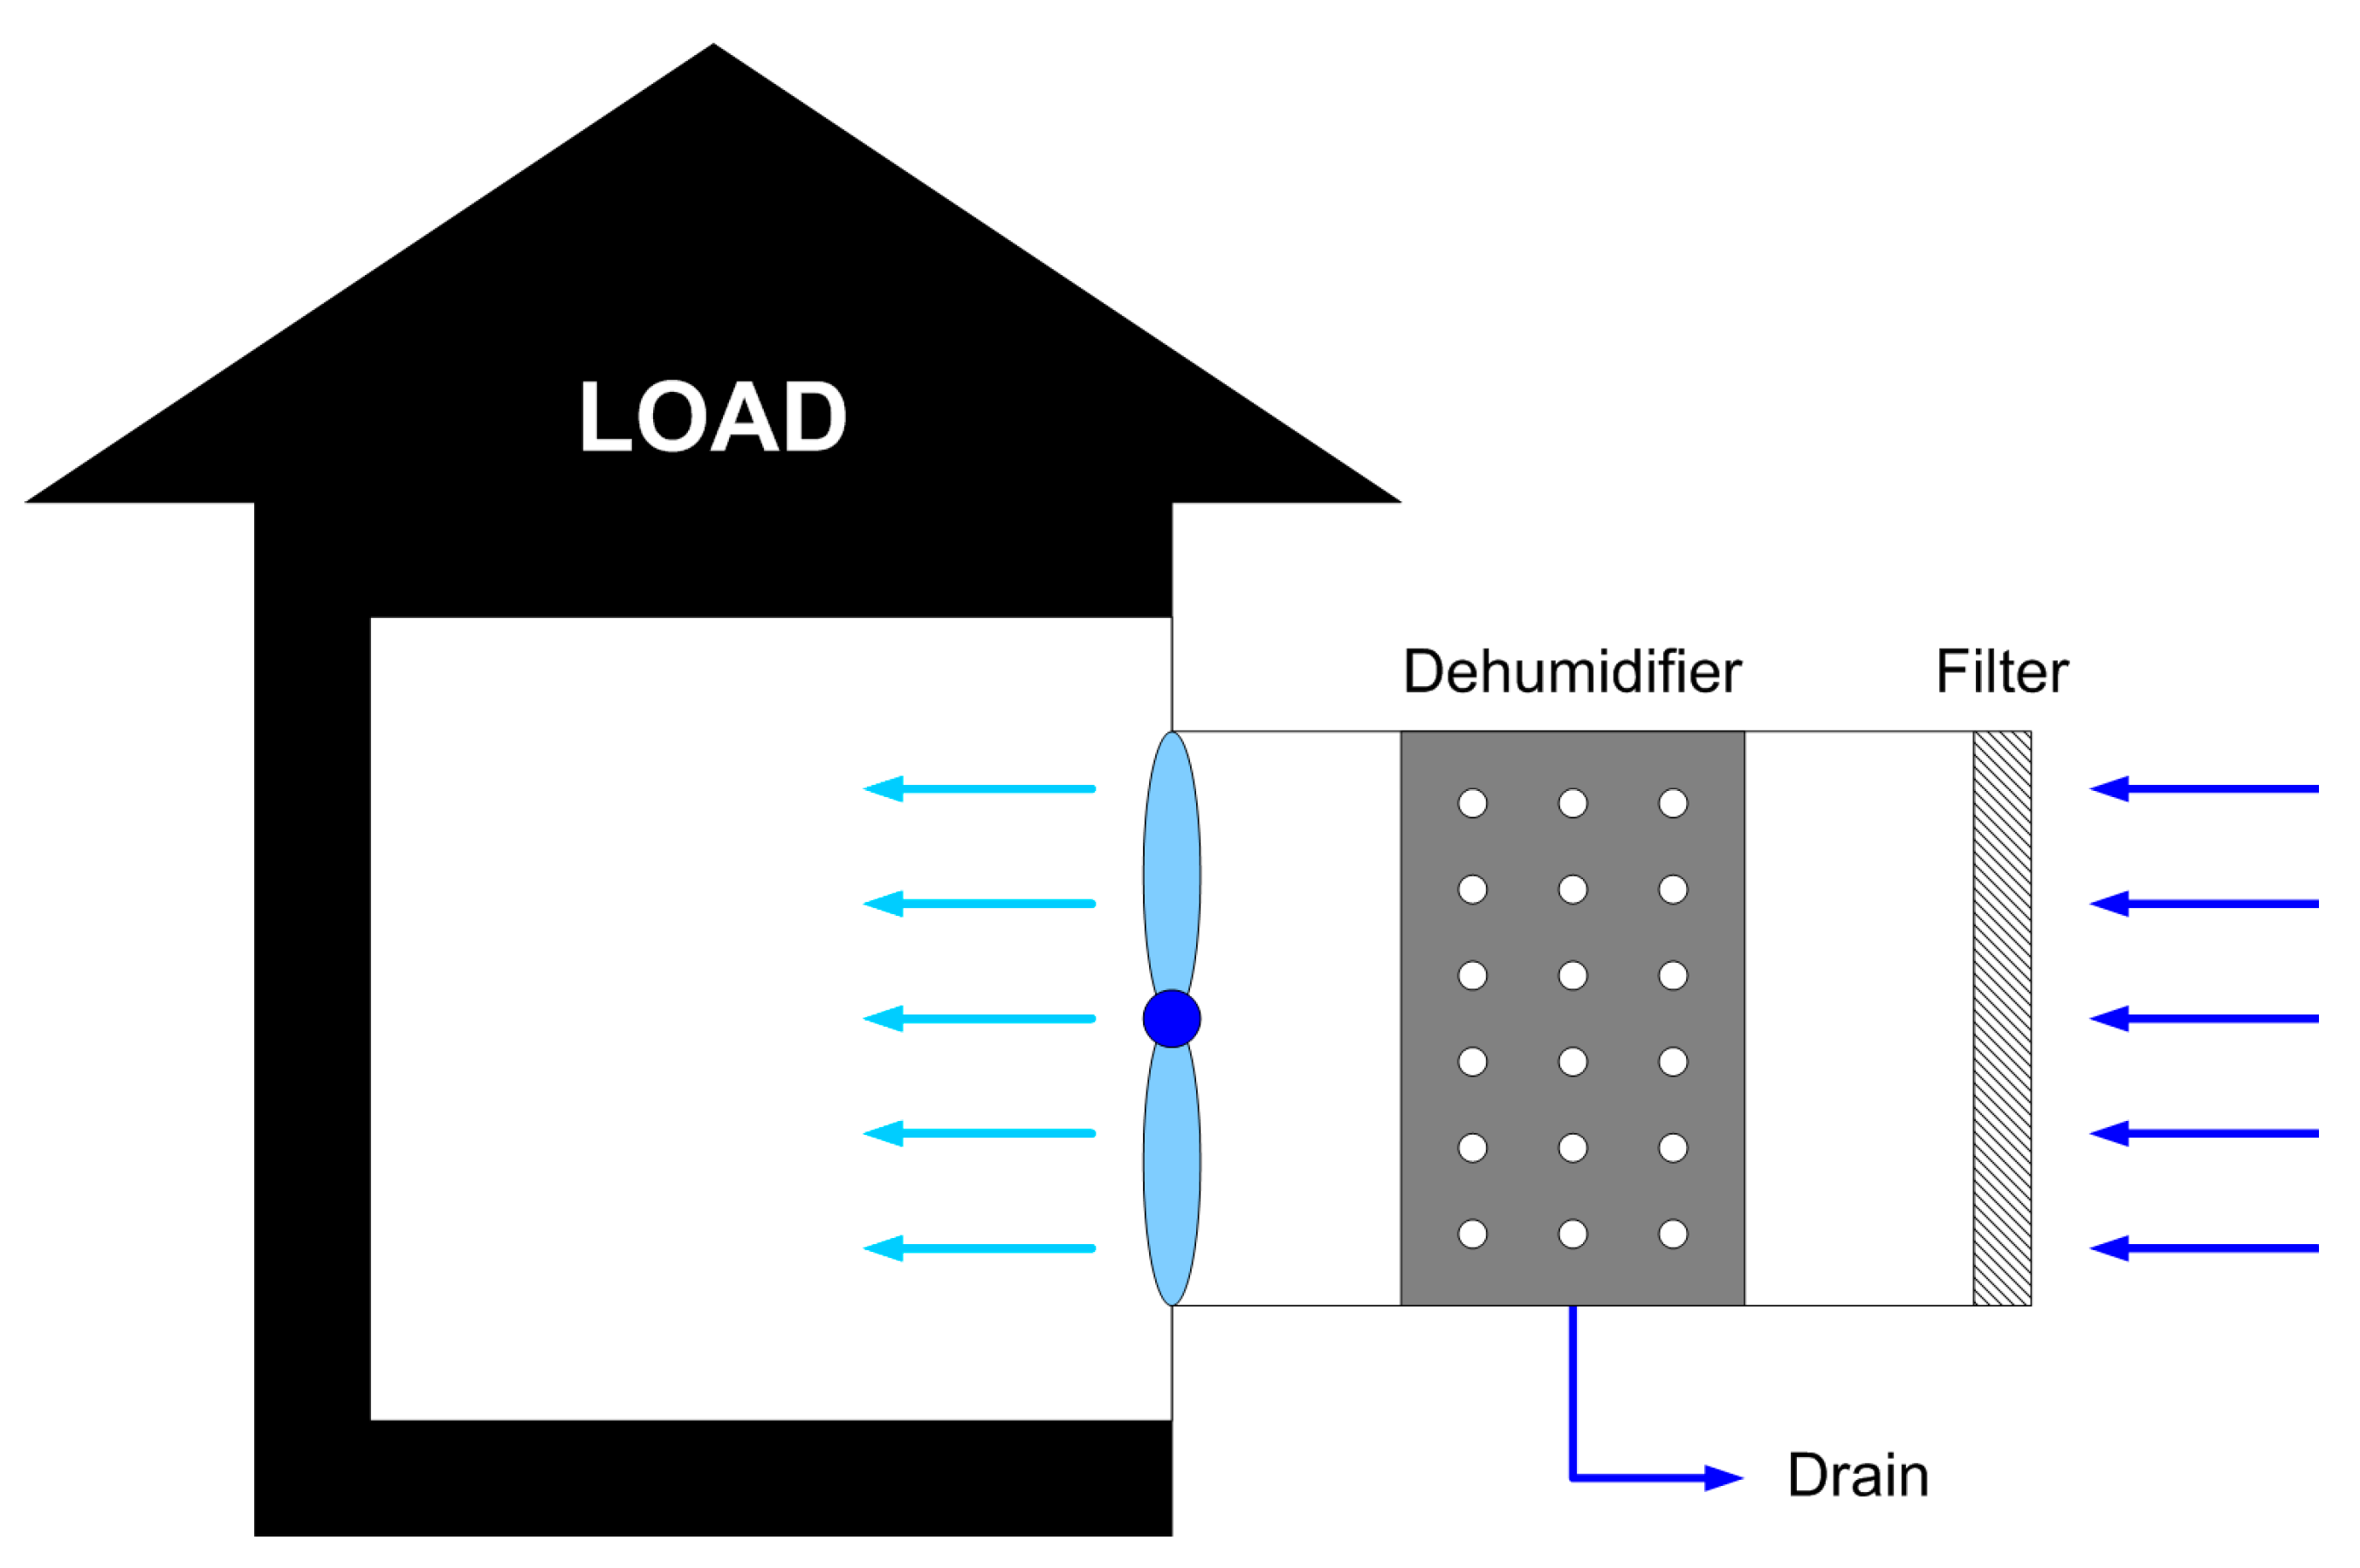
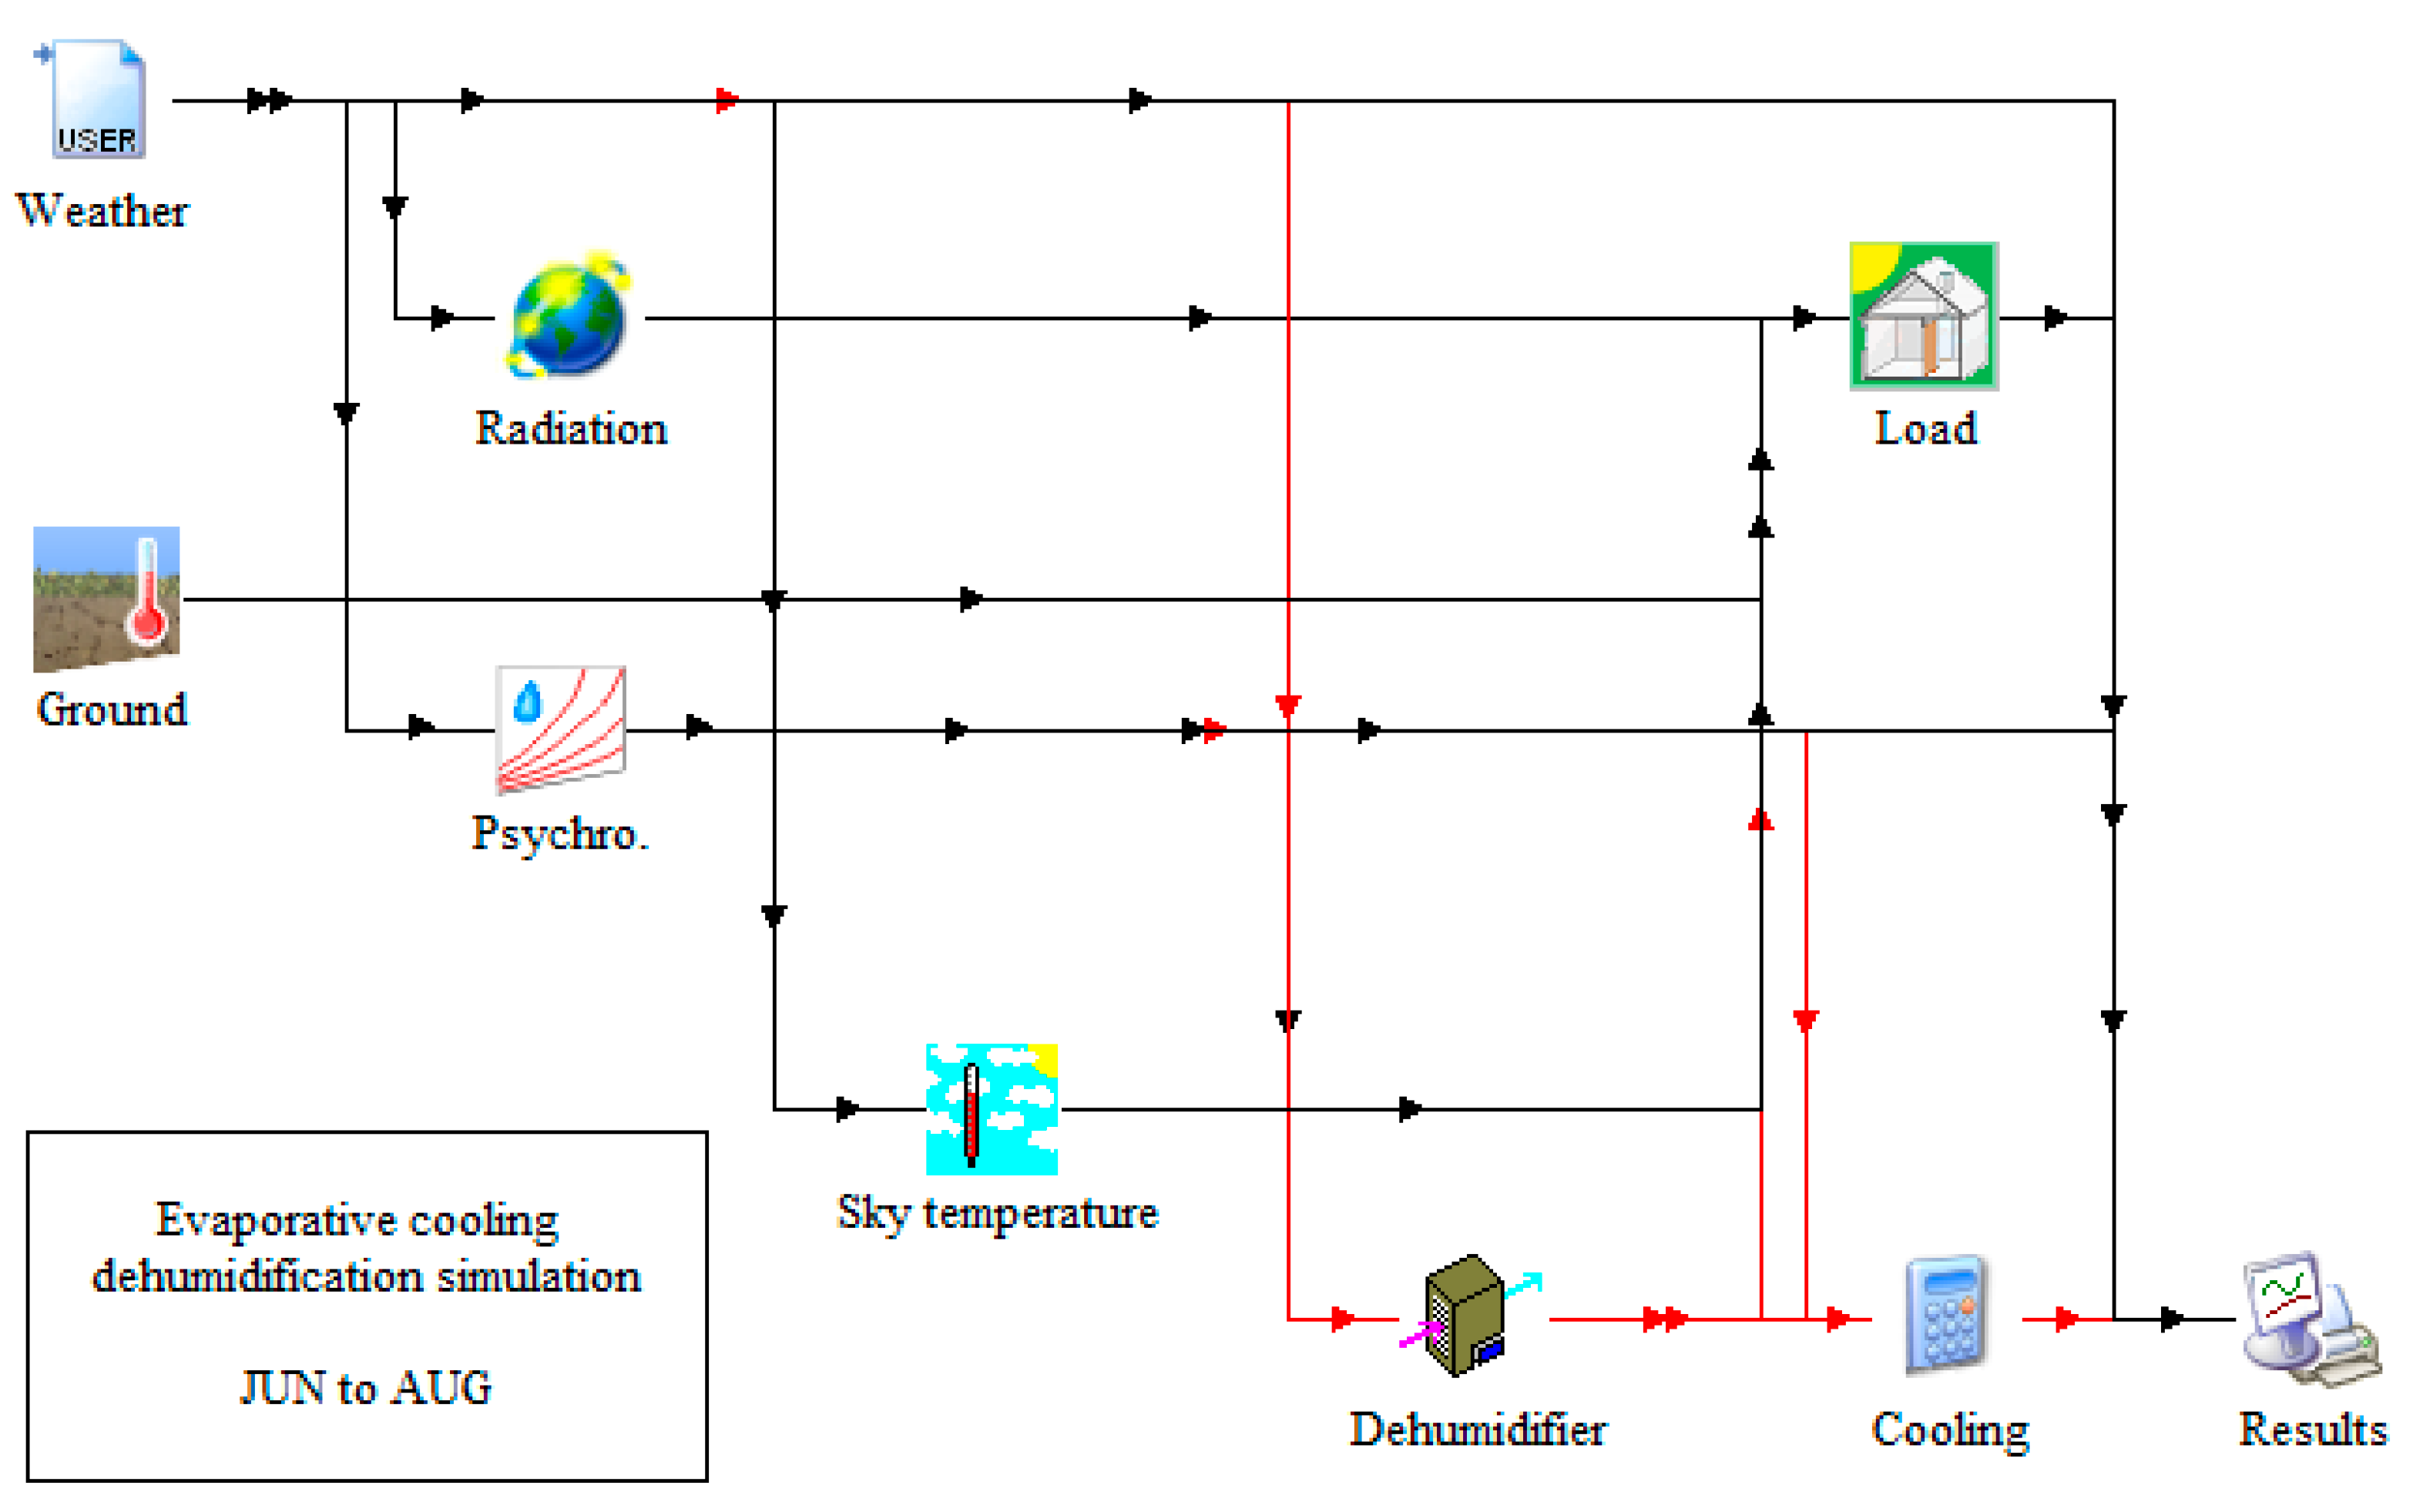
In the evaporative cooling dehumidification method, as shown in
Figure 2, the outside humid air passes through a filter and a dehumidifier before being supplied to a building (load). The dehumidified air from the dehumidifier arrives at the building (load) with a high temperature.
This study used a dehumidifier with the dehumidification efficiency (or dehumidification performance) of 2.68 kg/kWh. For a dry bulb temperature of 27 °C and a relative humidity of 60% [
9], the dry bulb temperature, relative humidity and flow rate at the dehumidifier outlet were measured and the capacity was calculated. The power consumption of the dehumidifier was assumed to be 295 W, as specified in the performance data. The power consumption of the fan was assumed to be a constant value, that is, 50 W.
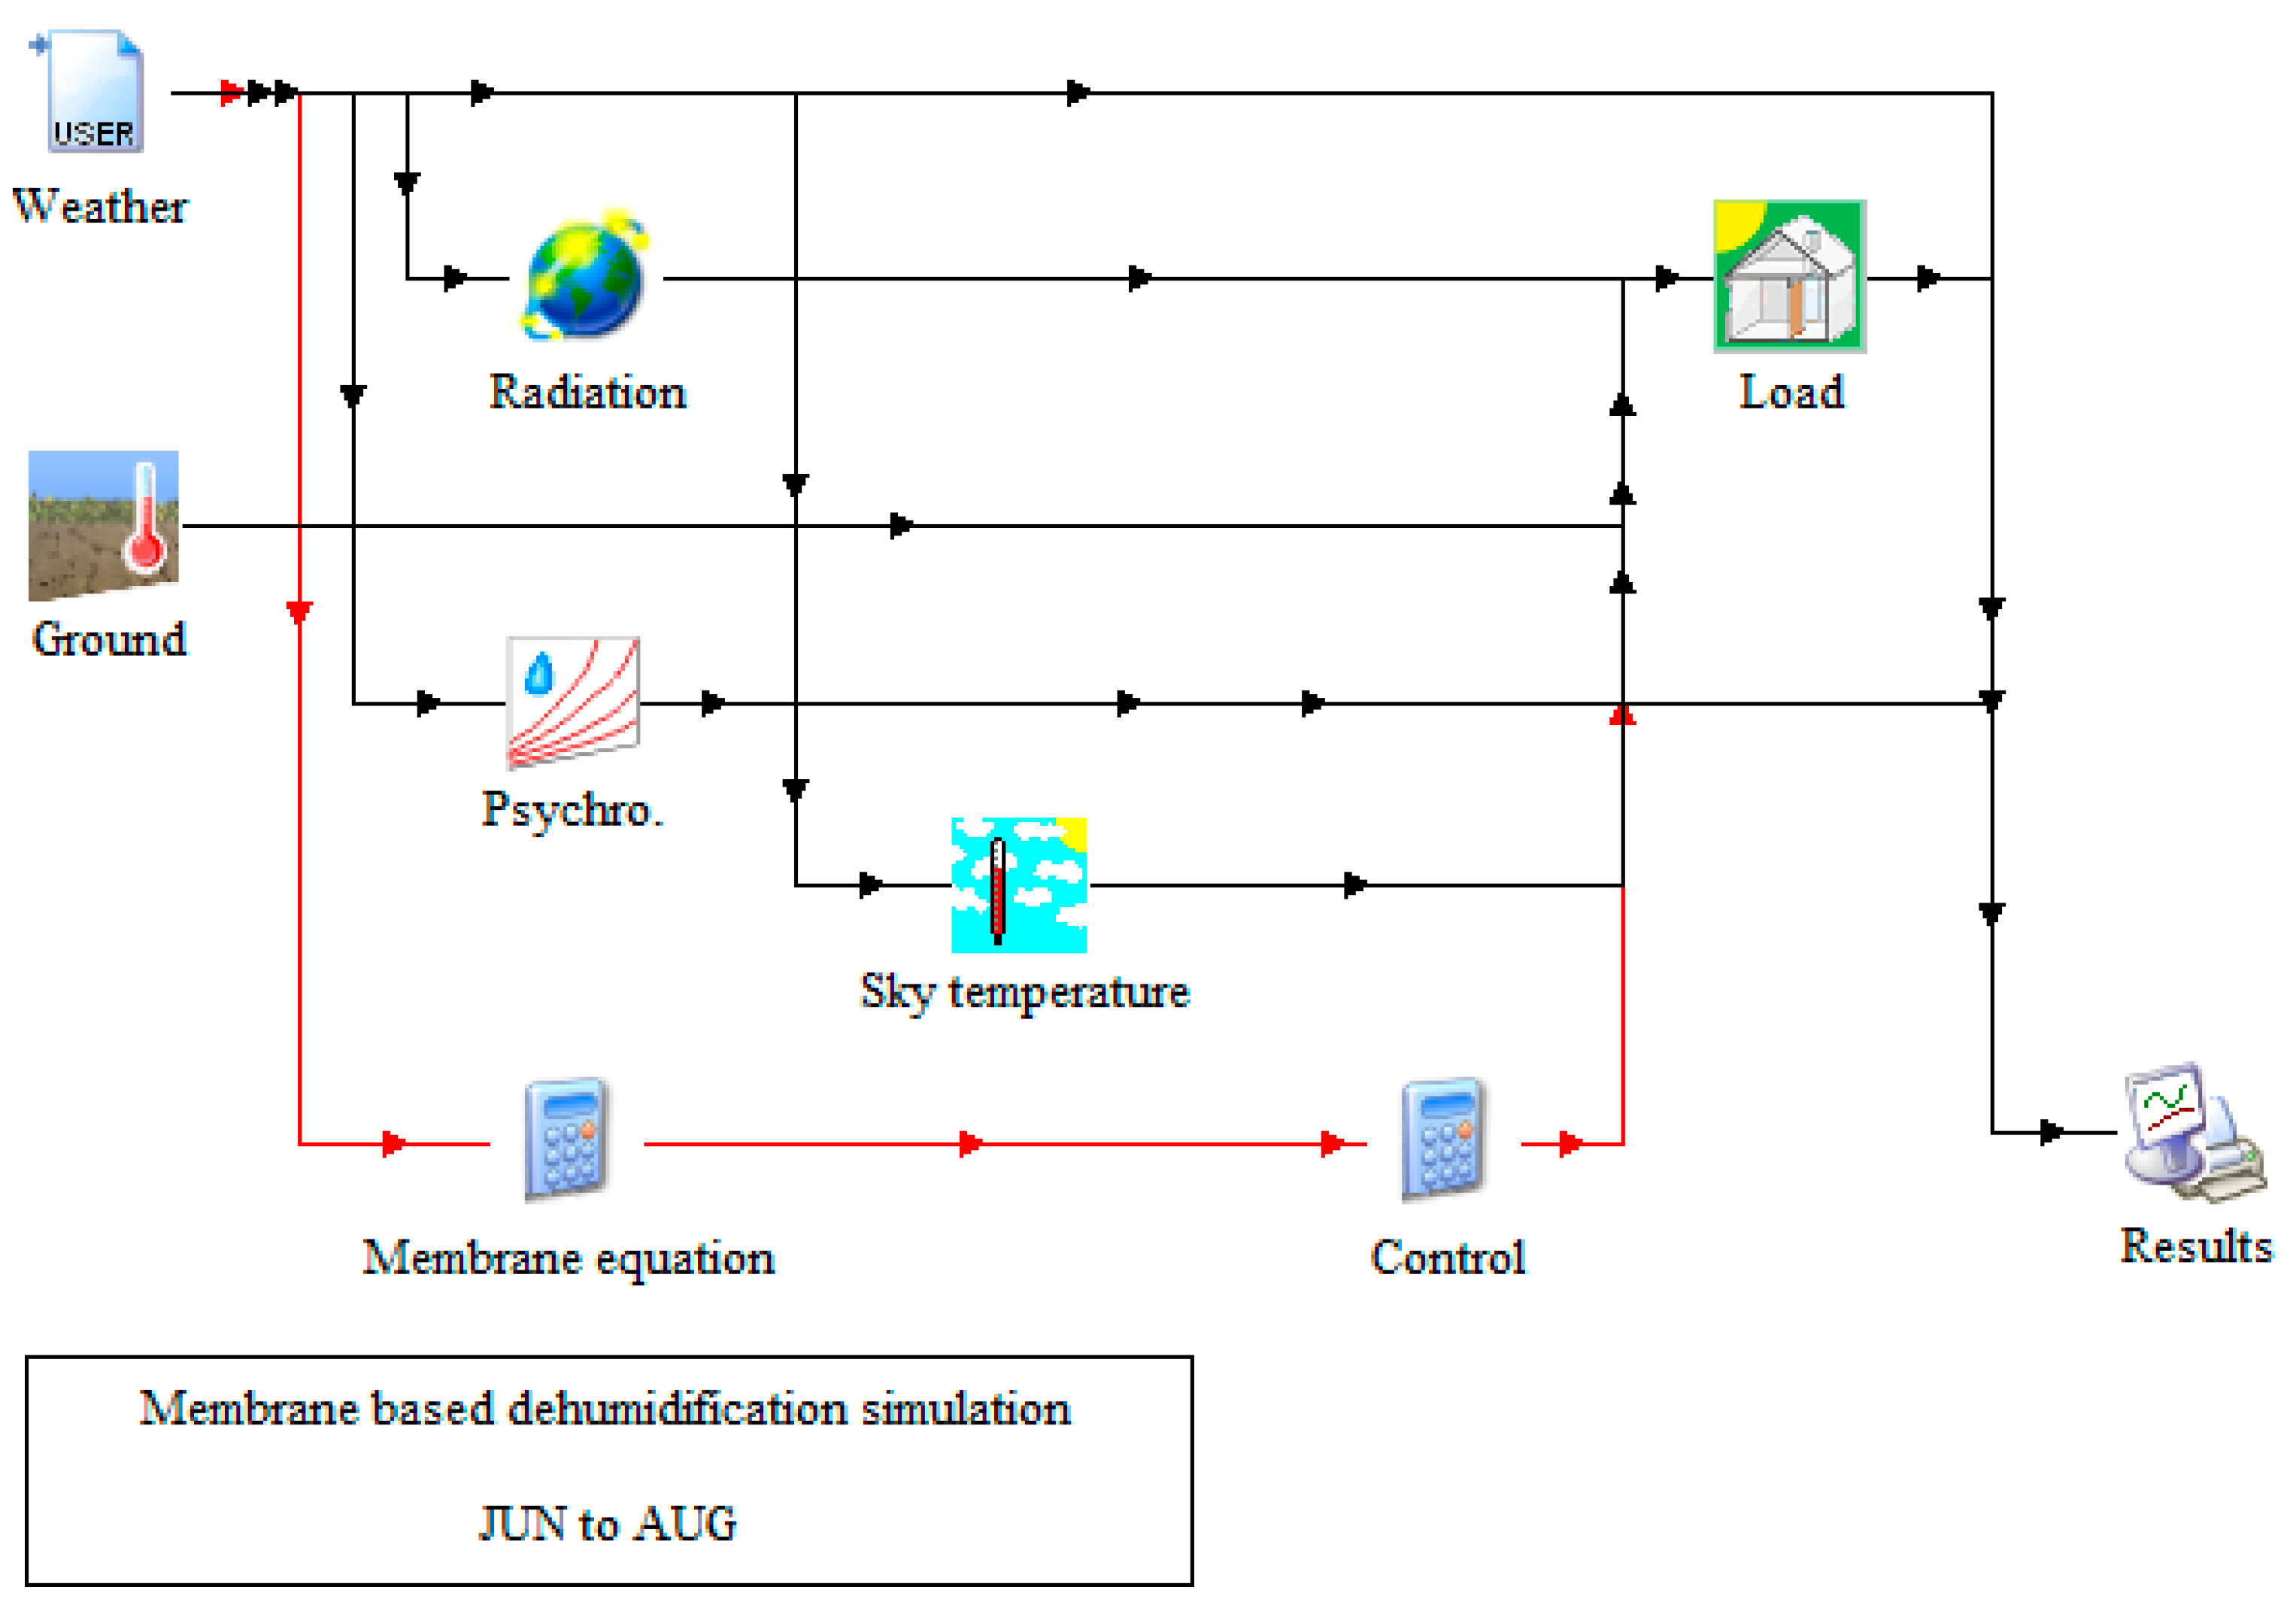
Regarding the membrane-based dehumidification method, the outside humid air is dehumidified as it passes a filter and a membrane-based dehumidifier before being supplied to a building (load), as shown in
Figure 3. The water vapor separated from the membrane using a vacuum pump is exhausted to the surrounding environment.
The dehumidification efficiency of the membrane-based dehumidifier was examined using a correlation equation that relates the dry bulb temperature and the relative humidity at the duct side, which were obtained from the experiment. The pressure at the permeate side was assumed to be a constant optimal condition (difference pressure: 5000 Pa), derived from the experiment. The power consumption of the vacuum pump was included in the dehumidification efficiency, which was also assumed to be constant. This is because the pressure difference, which is the driving force of the membrane, was constant. For the remaining parameters, the same values as those applied to the ECD method were used.
2.3. TRNSYS Model
This study implemented the TRNSYS Type 56 model to calculate the dehumidification load at the proposed building (load) [
10]. The set temperatures for cooling and heating were assumed to be 26 °C and 20 °C, respectively. The relative humidity inside the building was set to 60%. The parameters used in the simulation were as per the values recommended in ASHRAE 90.1, ASHRAE 62.1 and PNNL-18898, the details of which are listed in
Table 1 [
11,
12].
The metrological data used in the simulation were the average values of 1981 to 2010 in Seoul, the capital city of the Republic of Korea (registration number: 2010-Seoul-R-008). The period used for the simulation was set from June to August, corresponding to the rainy season in South Korea.
TRNSYS Type 688 was used as the dehumidifier model. For the performance data, a proportional equation was applied with a dry bulb temperature of 27 °C and a relative humidity of 60%. The energy demand for cooling was calculated using the difference in the dry bulb temperature between the output and the input.
A correlation equation based on the experimental results was used for the MDS system. Moreover, the water vapor obtained using the membrane was expressed in terms of the water flux per unit area. Ultimately, the absolute humidity of the obtained water flux was reduced to make the dehumidified air enter the building. The equations used for the simulation are expressed as follows (Equations (1)–(4)) [
13].
where
is the saturated vapor pressure and the coefficient used in the temperature range of −20–+50 °C was used in the correlation equation. In addition, the dehumidification efficiency is experimentally expressed using Equation (5) that relates the dry bulb temperature and the relative humidity of the duct.
where
= −1.99610693 × 10
1,
= 1.17949824 × 10
0,
= 1.99075958 × 10
−2,
= 2.69409771 × 10
−4,
= −1.56527305 × 10
−4 and
= 2.57611293 × 10
−4.
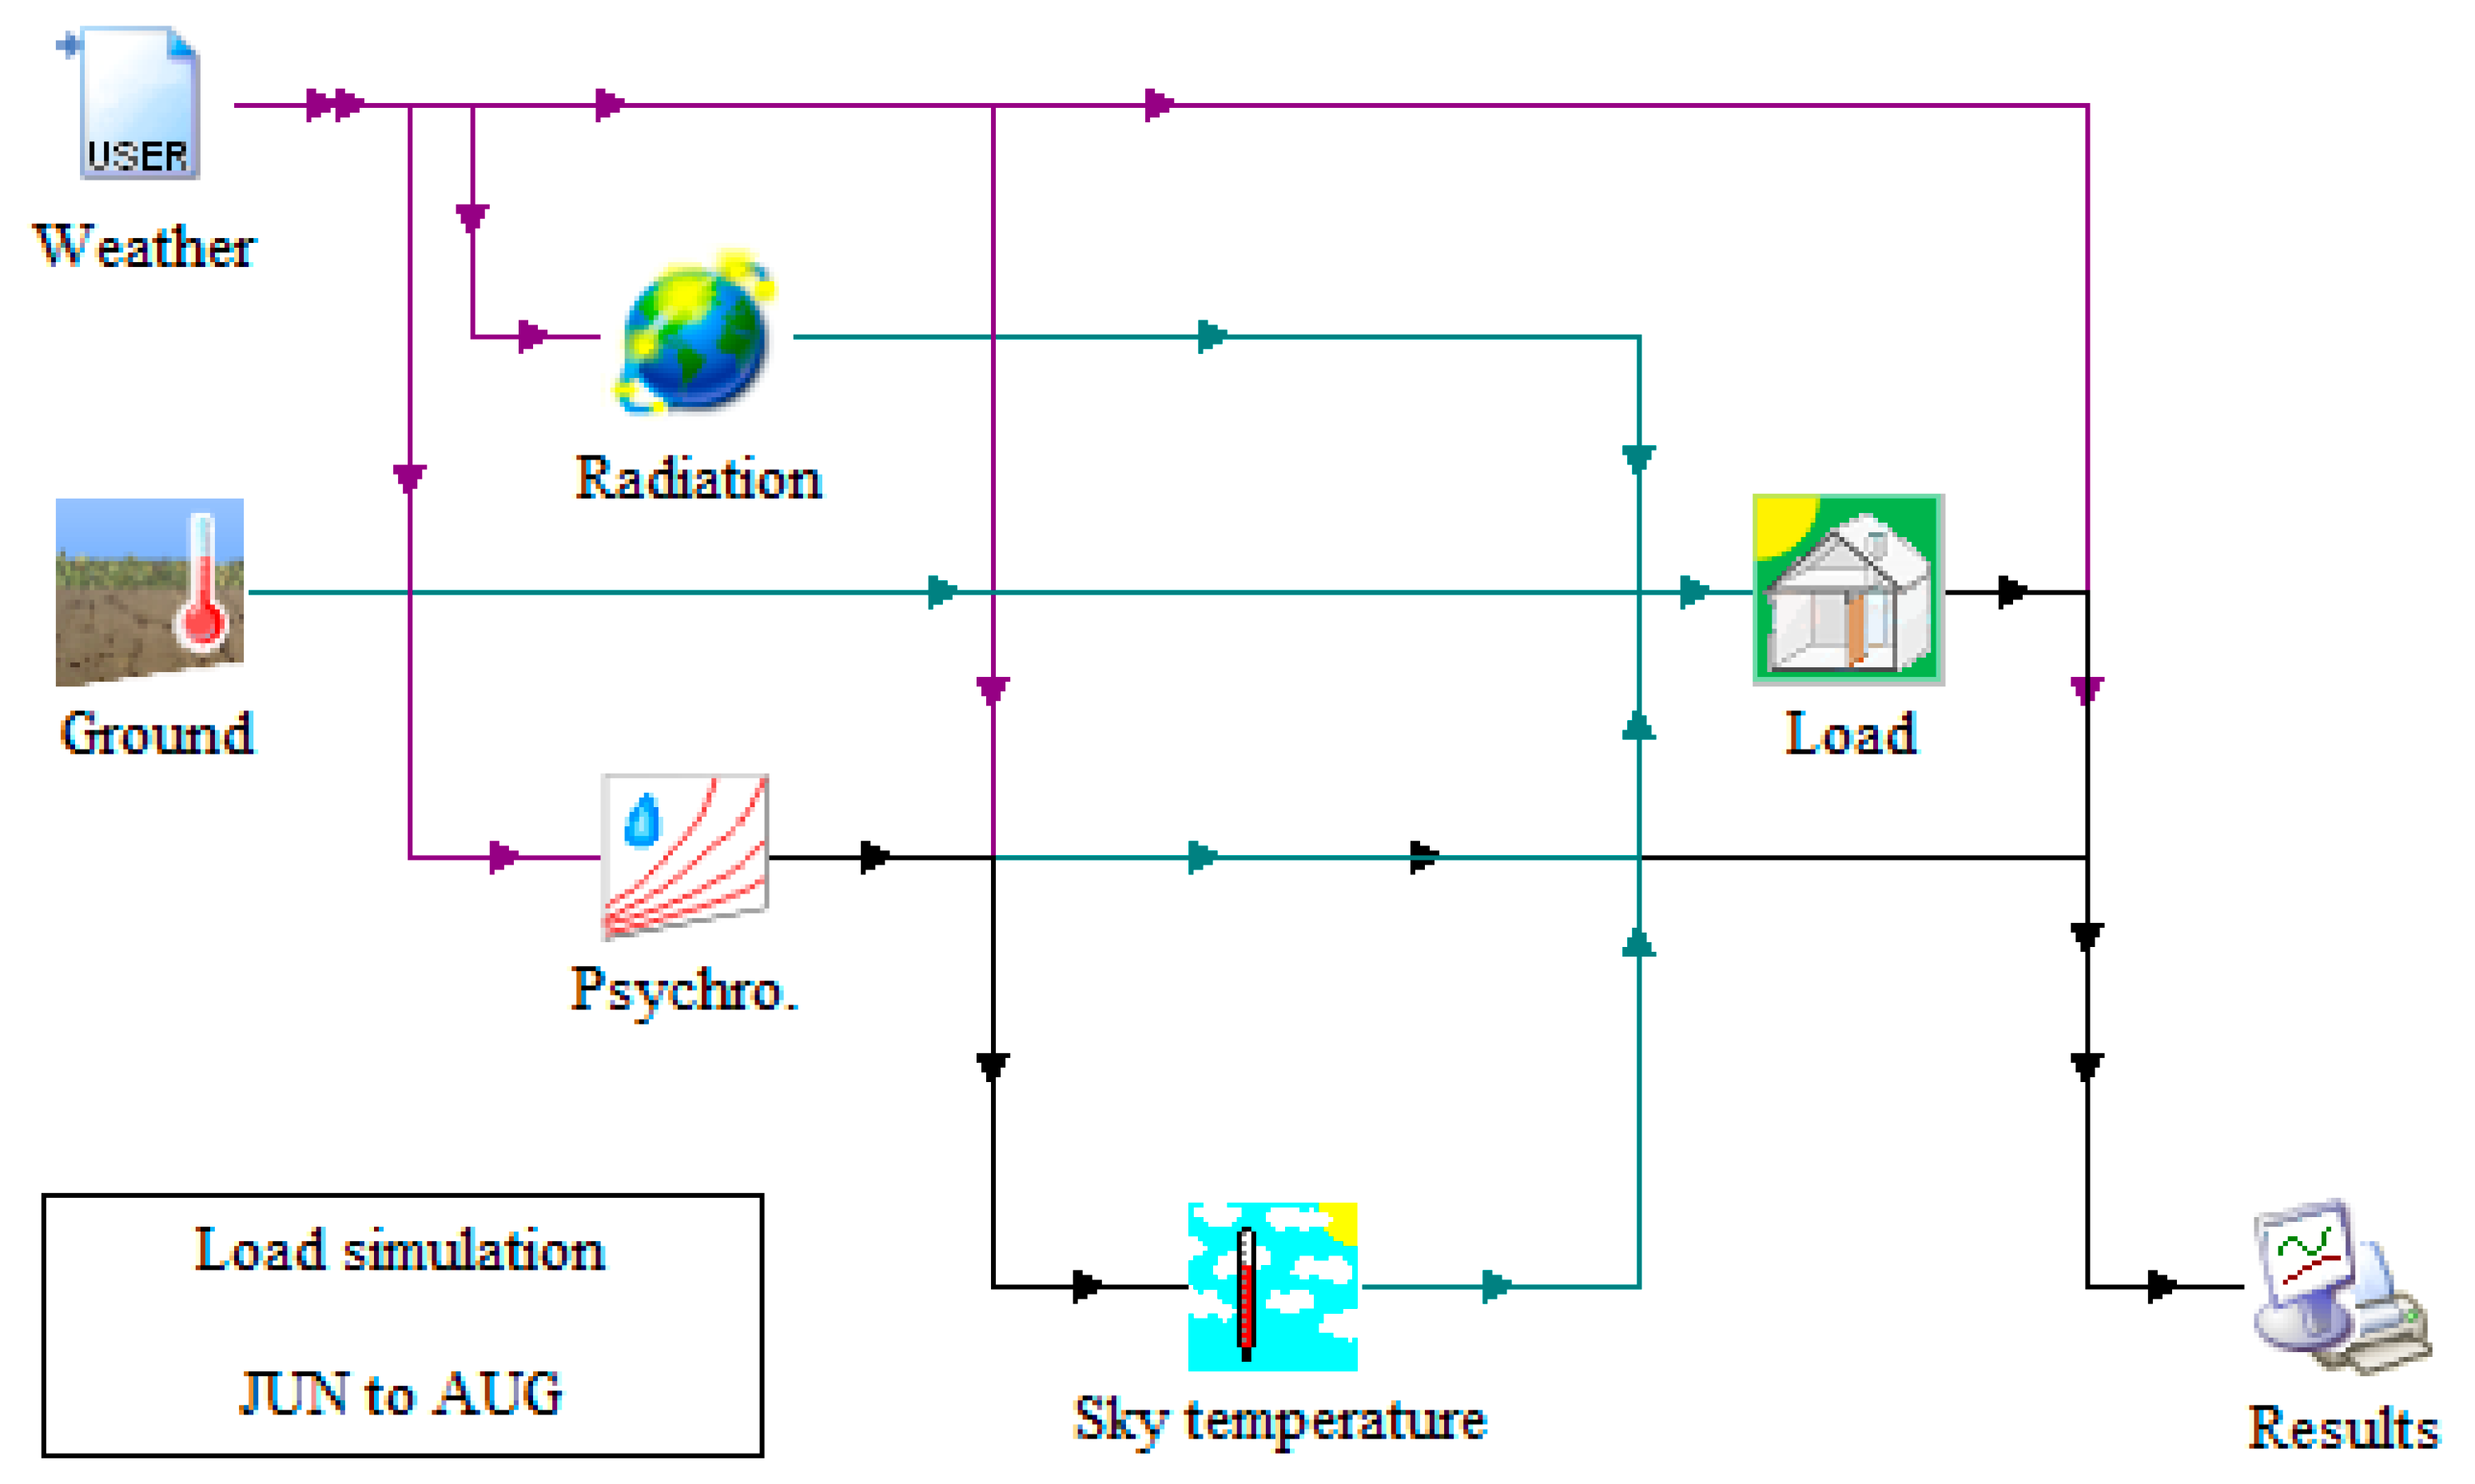
Figure 4 shows the dehumidification load model encoded to calculate the dehumidification load. The weather data employed were the 30-year average data for Seoul. The type 16a model was used to convert the radiation on the horizontal plane into each surface. The output was inputted into the load side. The input values, which were required at the load side, were obtained from the psychrometric calculator (Type 33e), sky temperature (Type 575c) and ground temperature (Type 77).
Figure 5 shows the simulation model of the ECD system. The load condition was configured in the same manner. The dehumidified air flows from the dehumidifier into the load.
Figure 6 shows the simulation model of the MDS where the dehumidified air flows into the load. The energy demand for cooling was calculated separately.
3. Experimental Test
The dehumidification efficiency of the membrane dehumidifier was evaluated, where each element was measured after the steady state. In addition, the pipe type grid was installed for uniform flow in the duct and the uniform flow was confirmed through the smog test before the evaluation.
3.1. Membrane Description
A membrane separates a material (in this paper, H
2O) by using a difference in pressure or concentration. Types of membranes include the spiral wound type, the tubular type, the hollow fiber type and the plate and frame type [
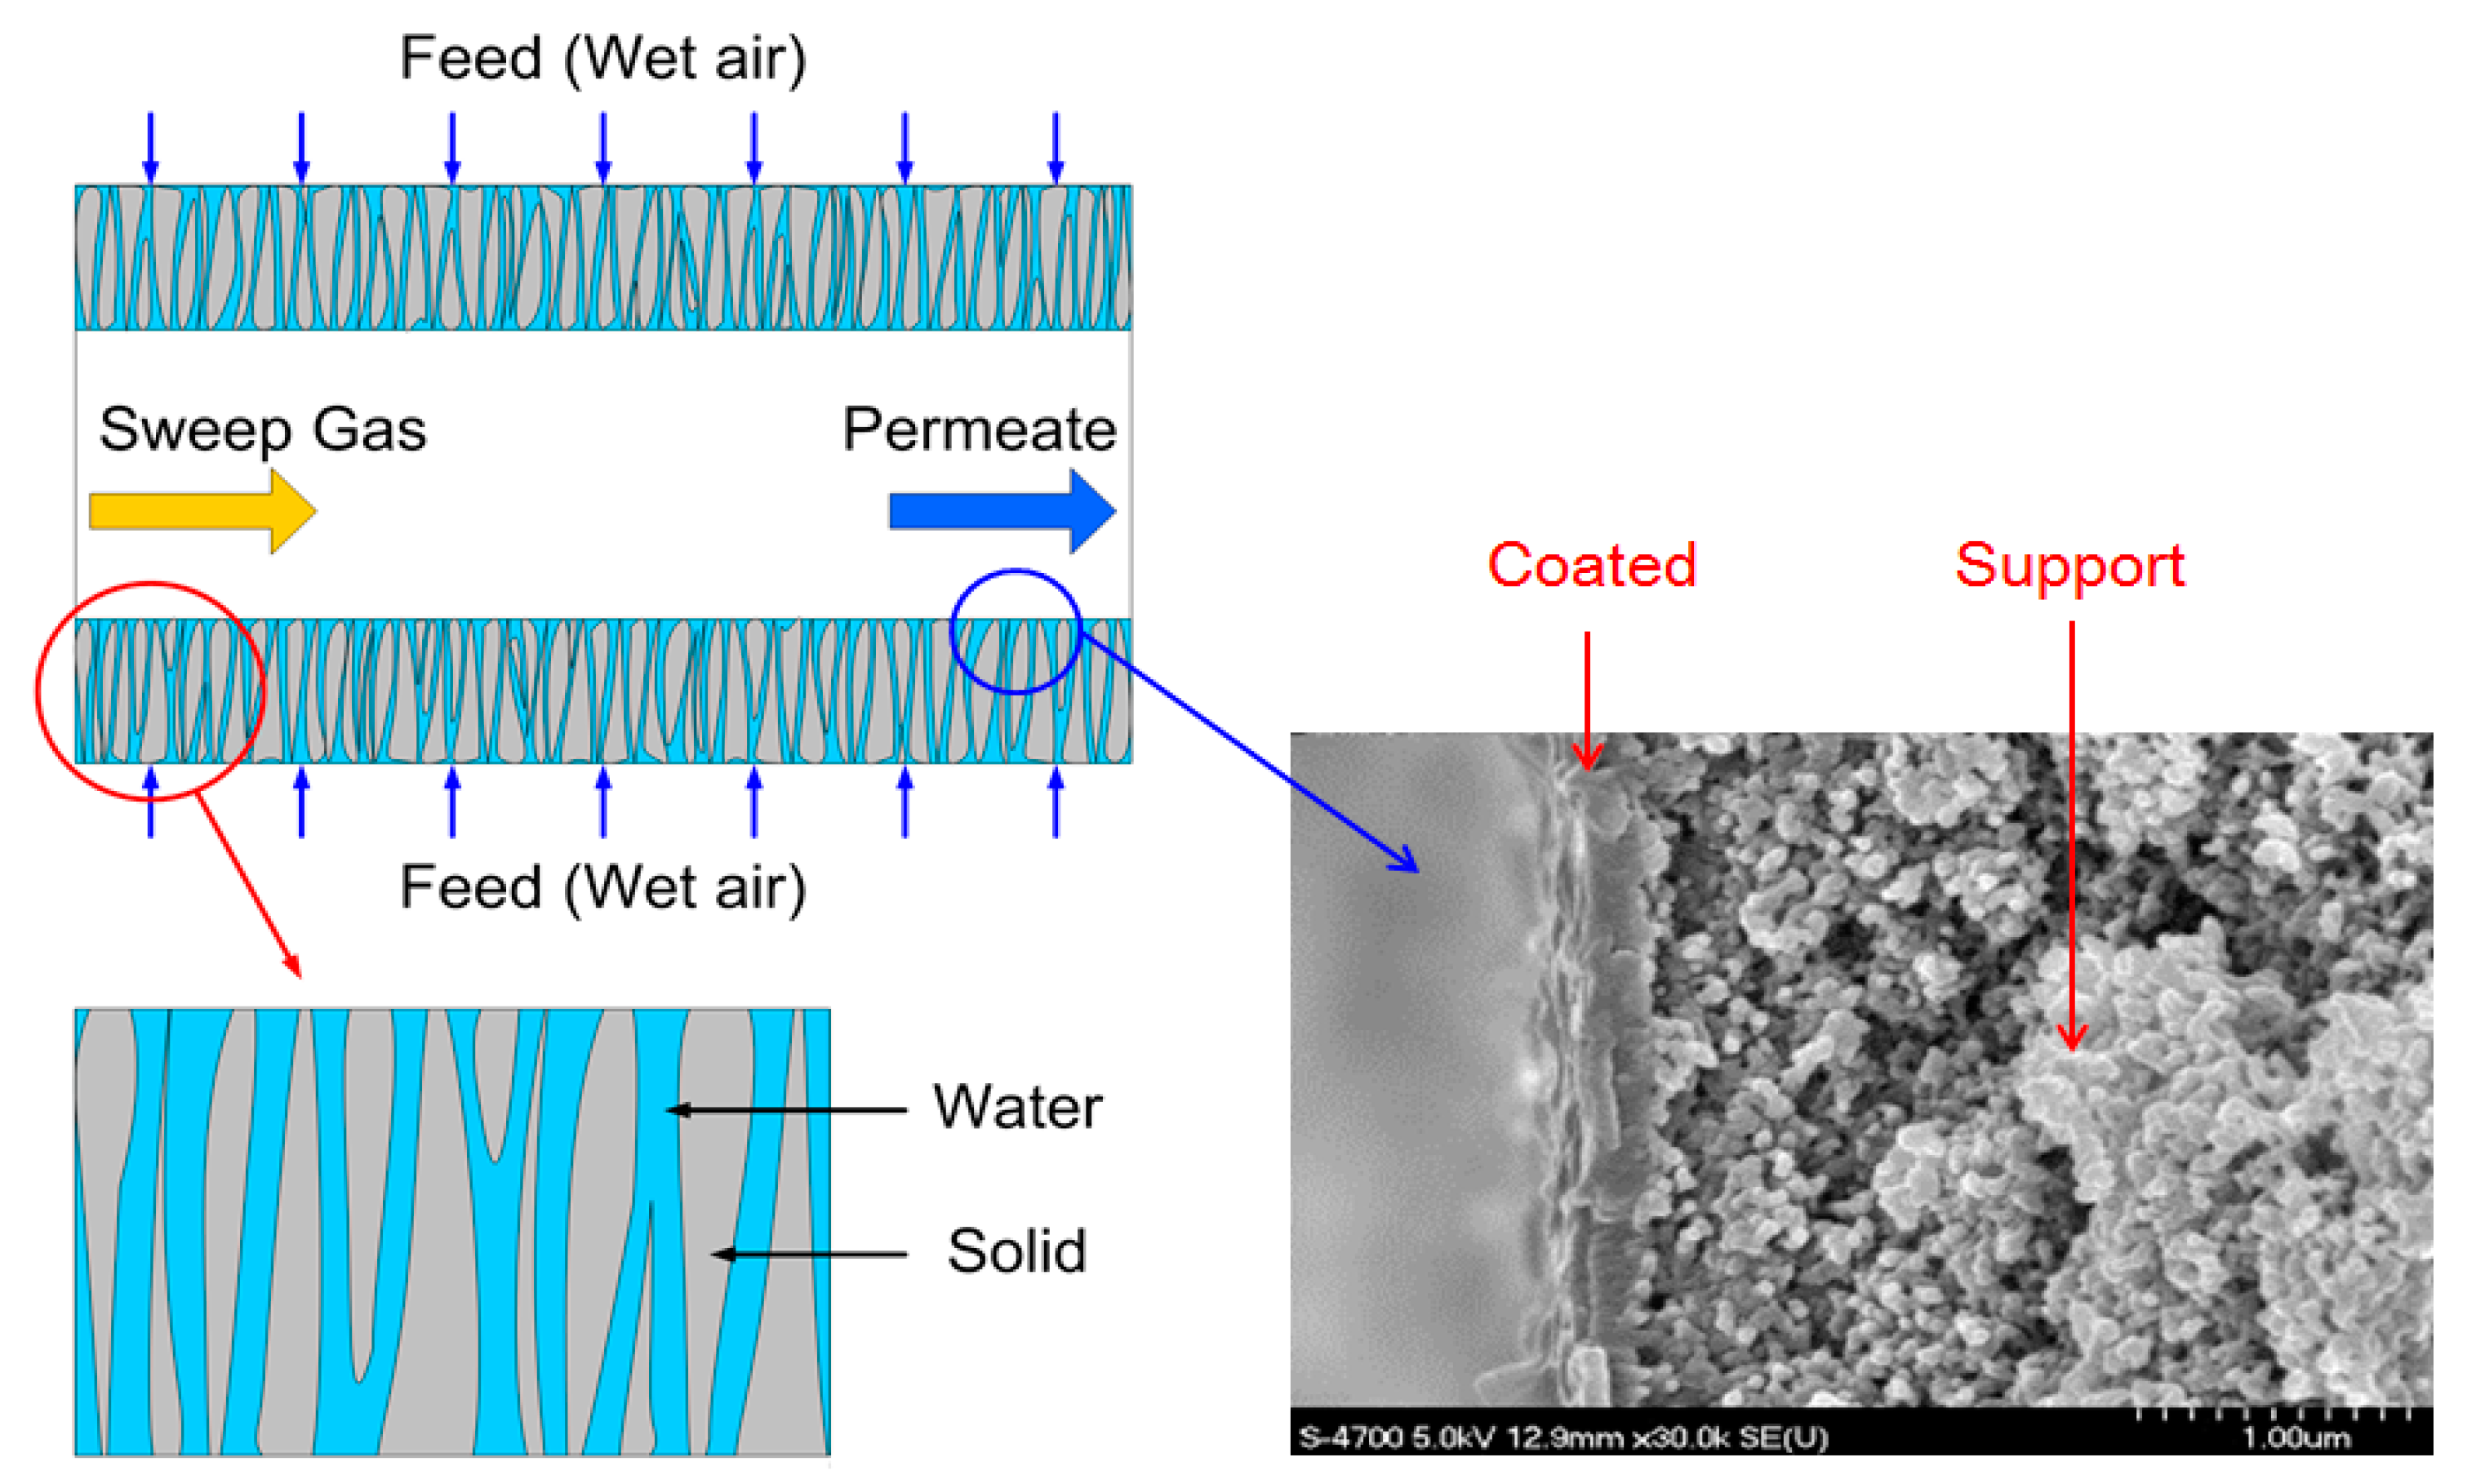
7]. These types have been classified according to purposes of use. Since the hollow fiber membrane (HFM), which was used in this study, has a wider contact area with air than the plate type, it shows a higher moisture removal efficiency. In particular, when wet air permeates HFM, only moisture is brought in, which lowers the humidity. If there is no flux in the membrane, the moisture remains. For this reason, sweep gas was used to release the moisture to the permeate side (
Figure 7).
This study selected a membrane with carboxylated TiO
2 nanoparticles coated on polyamide, which was polymerized by reacting with 3,5-diaminobenzoic acid (DABA). The inner and outer diameters of the membrane were 450 µm and 685 µm, respectively. The porosity was approximately 70% and the thickness of the coating was in the range of 100–200 nm. Here, the maximum water vapor permeance of the membrane used in the experiment was 1396 GPU and the selectivity was 510 [
14].
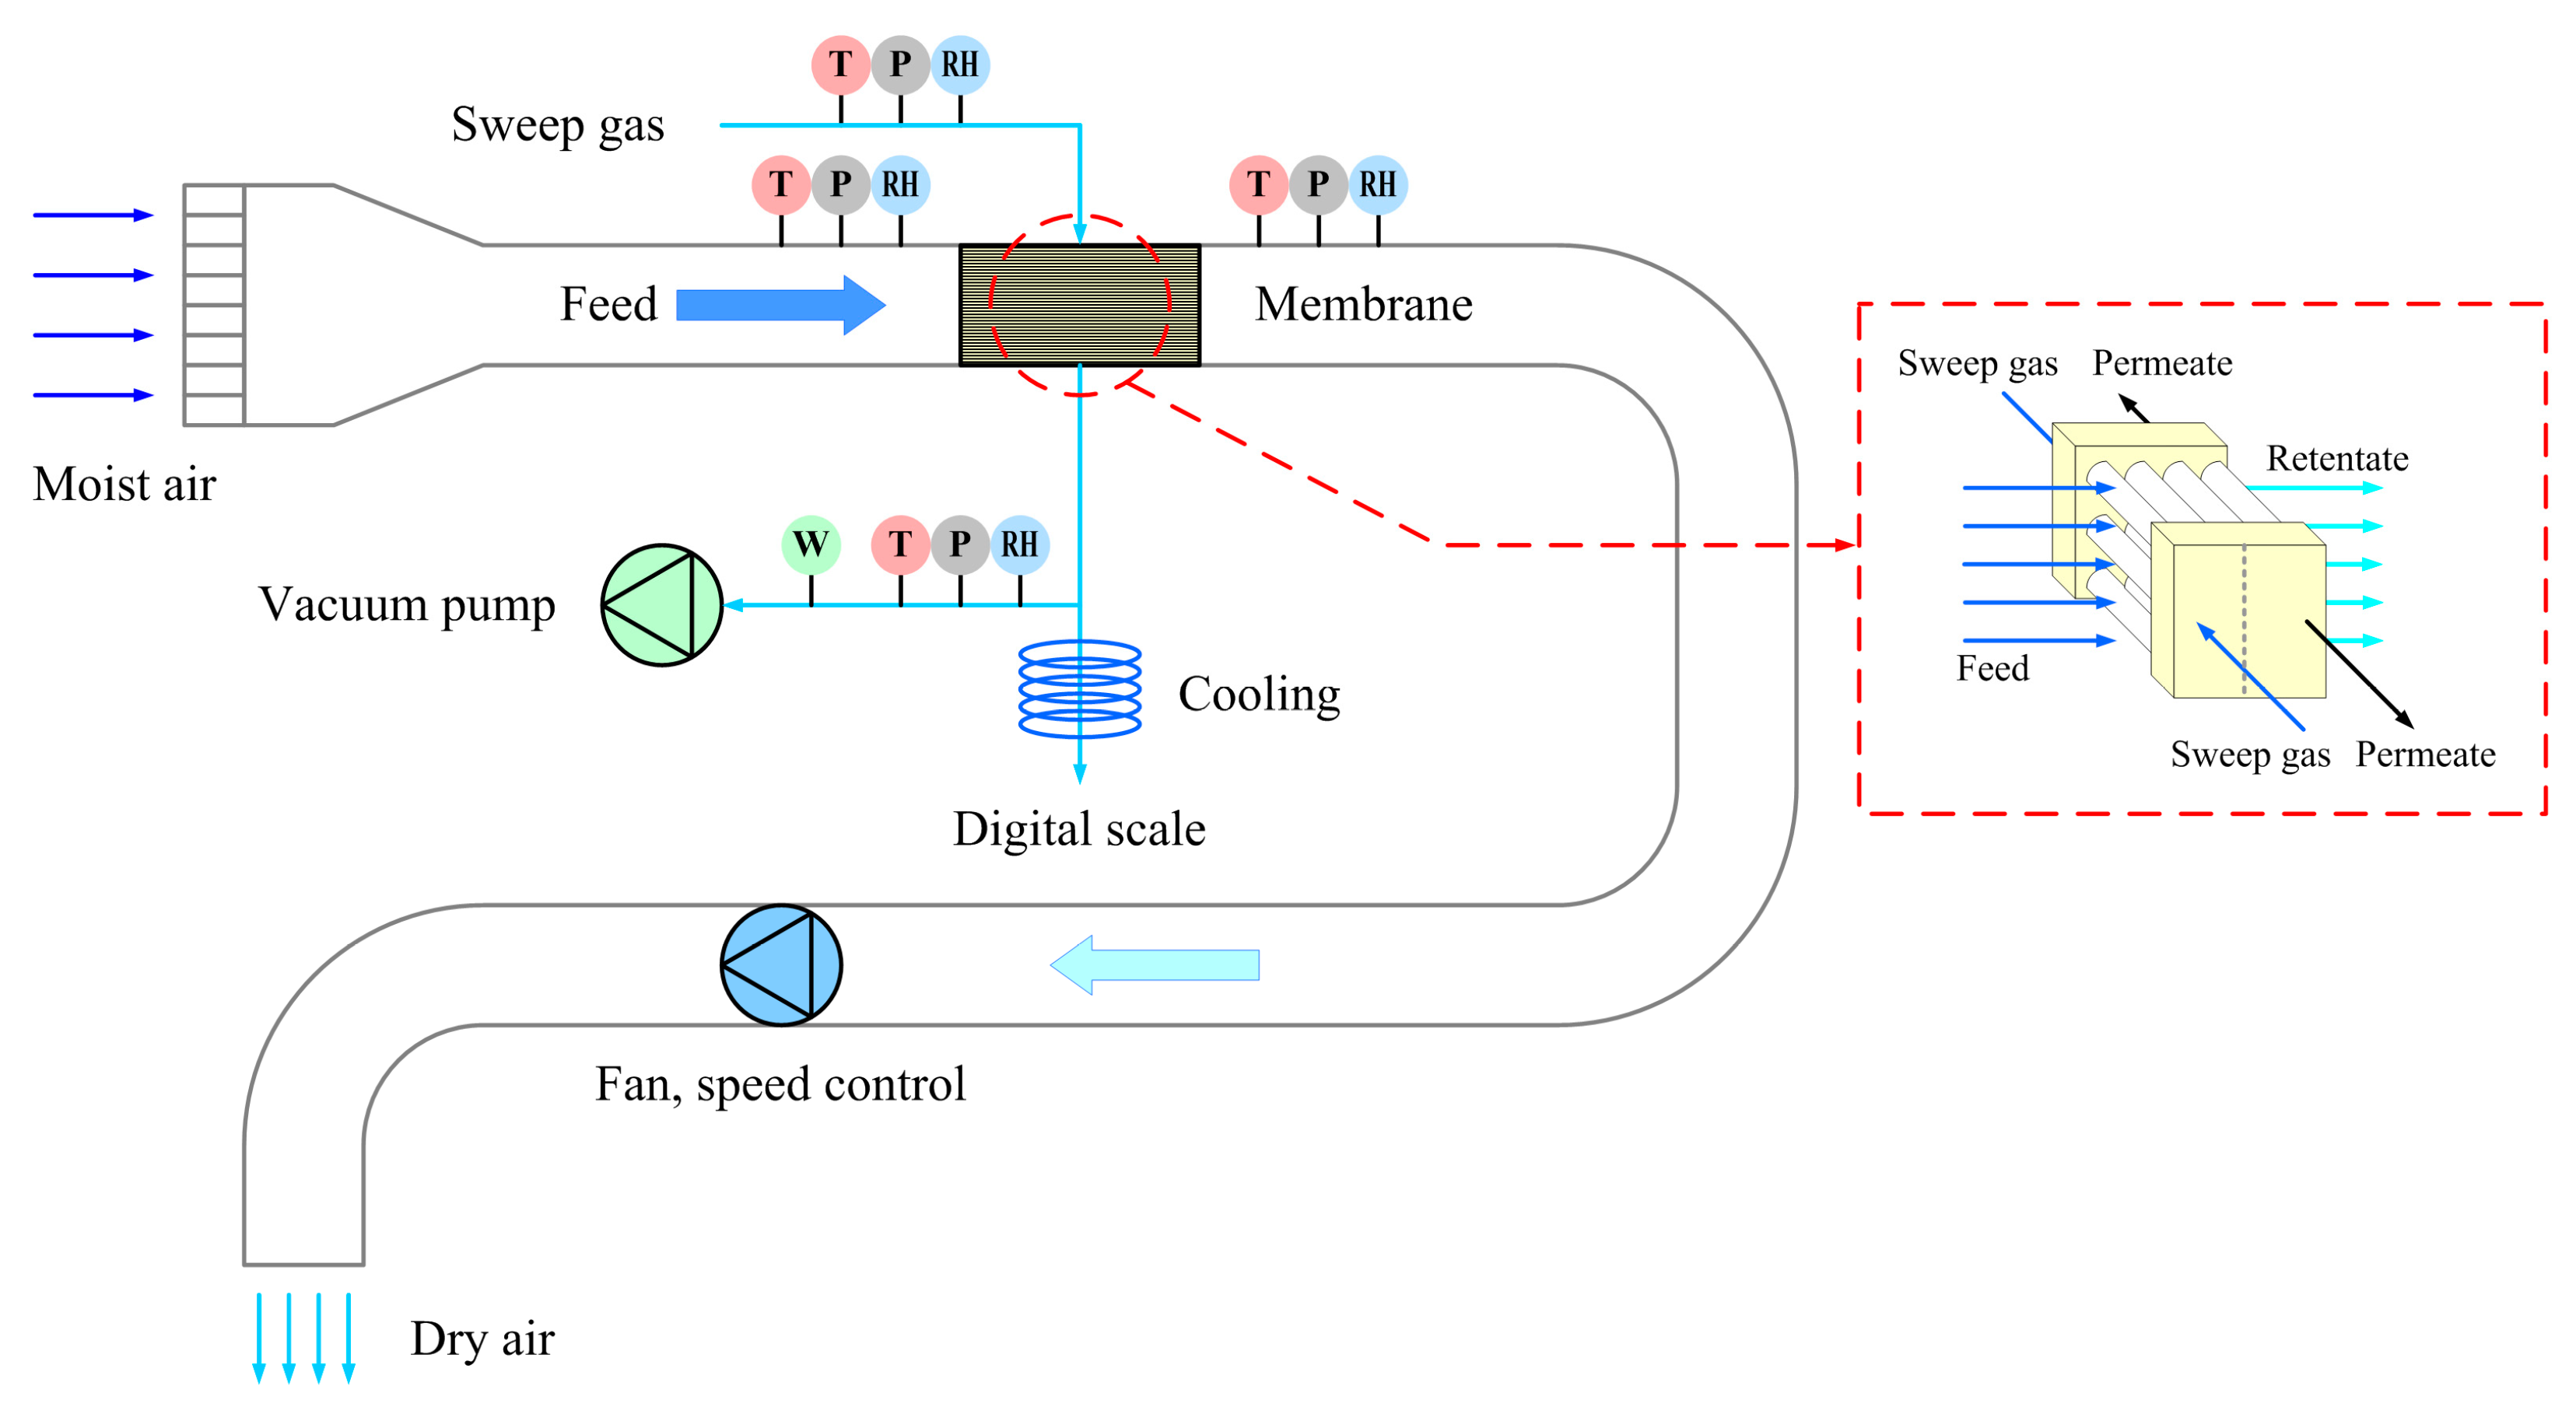
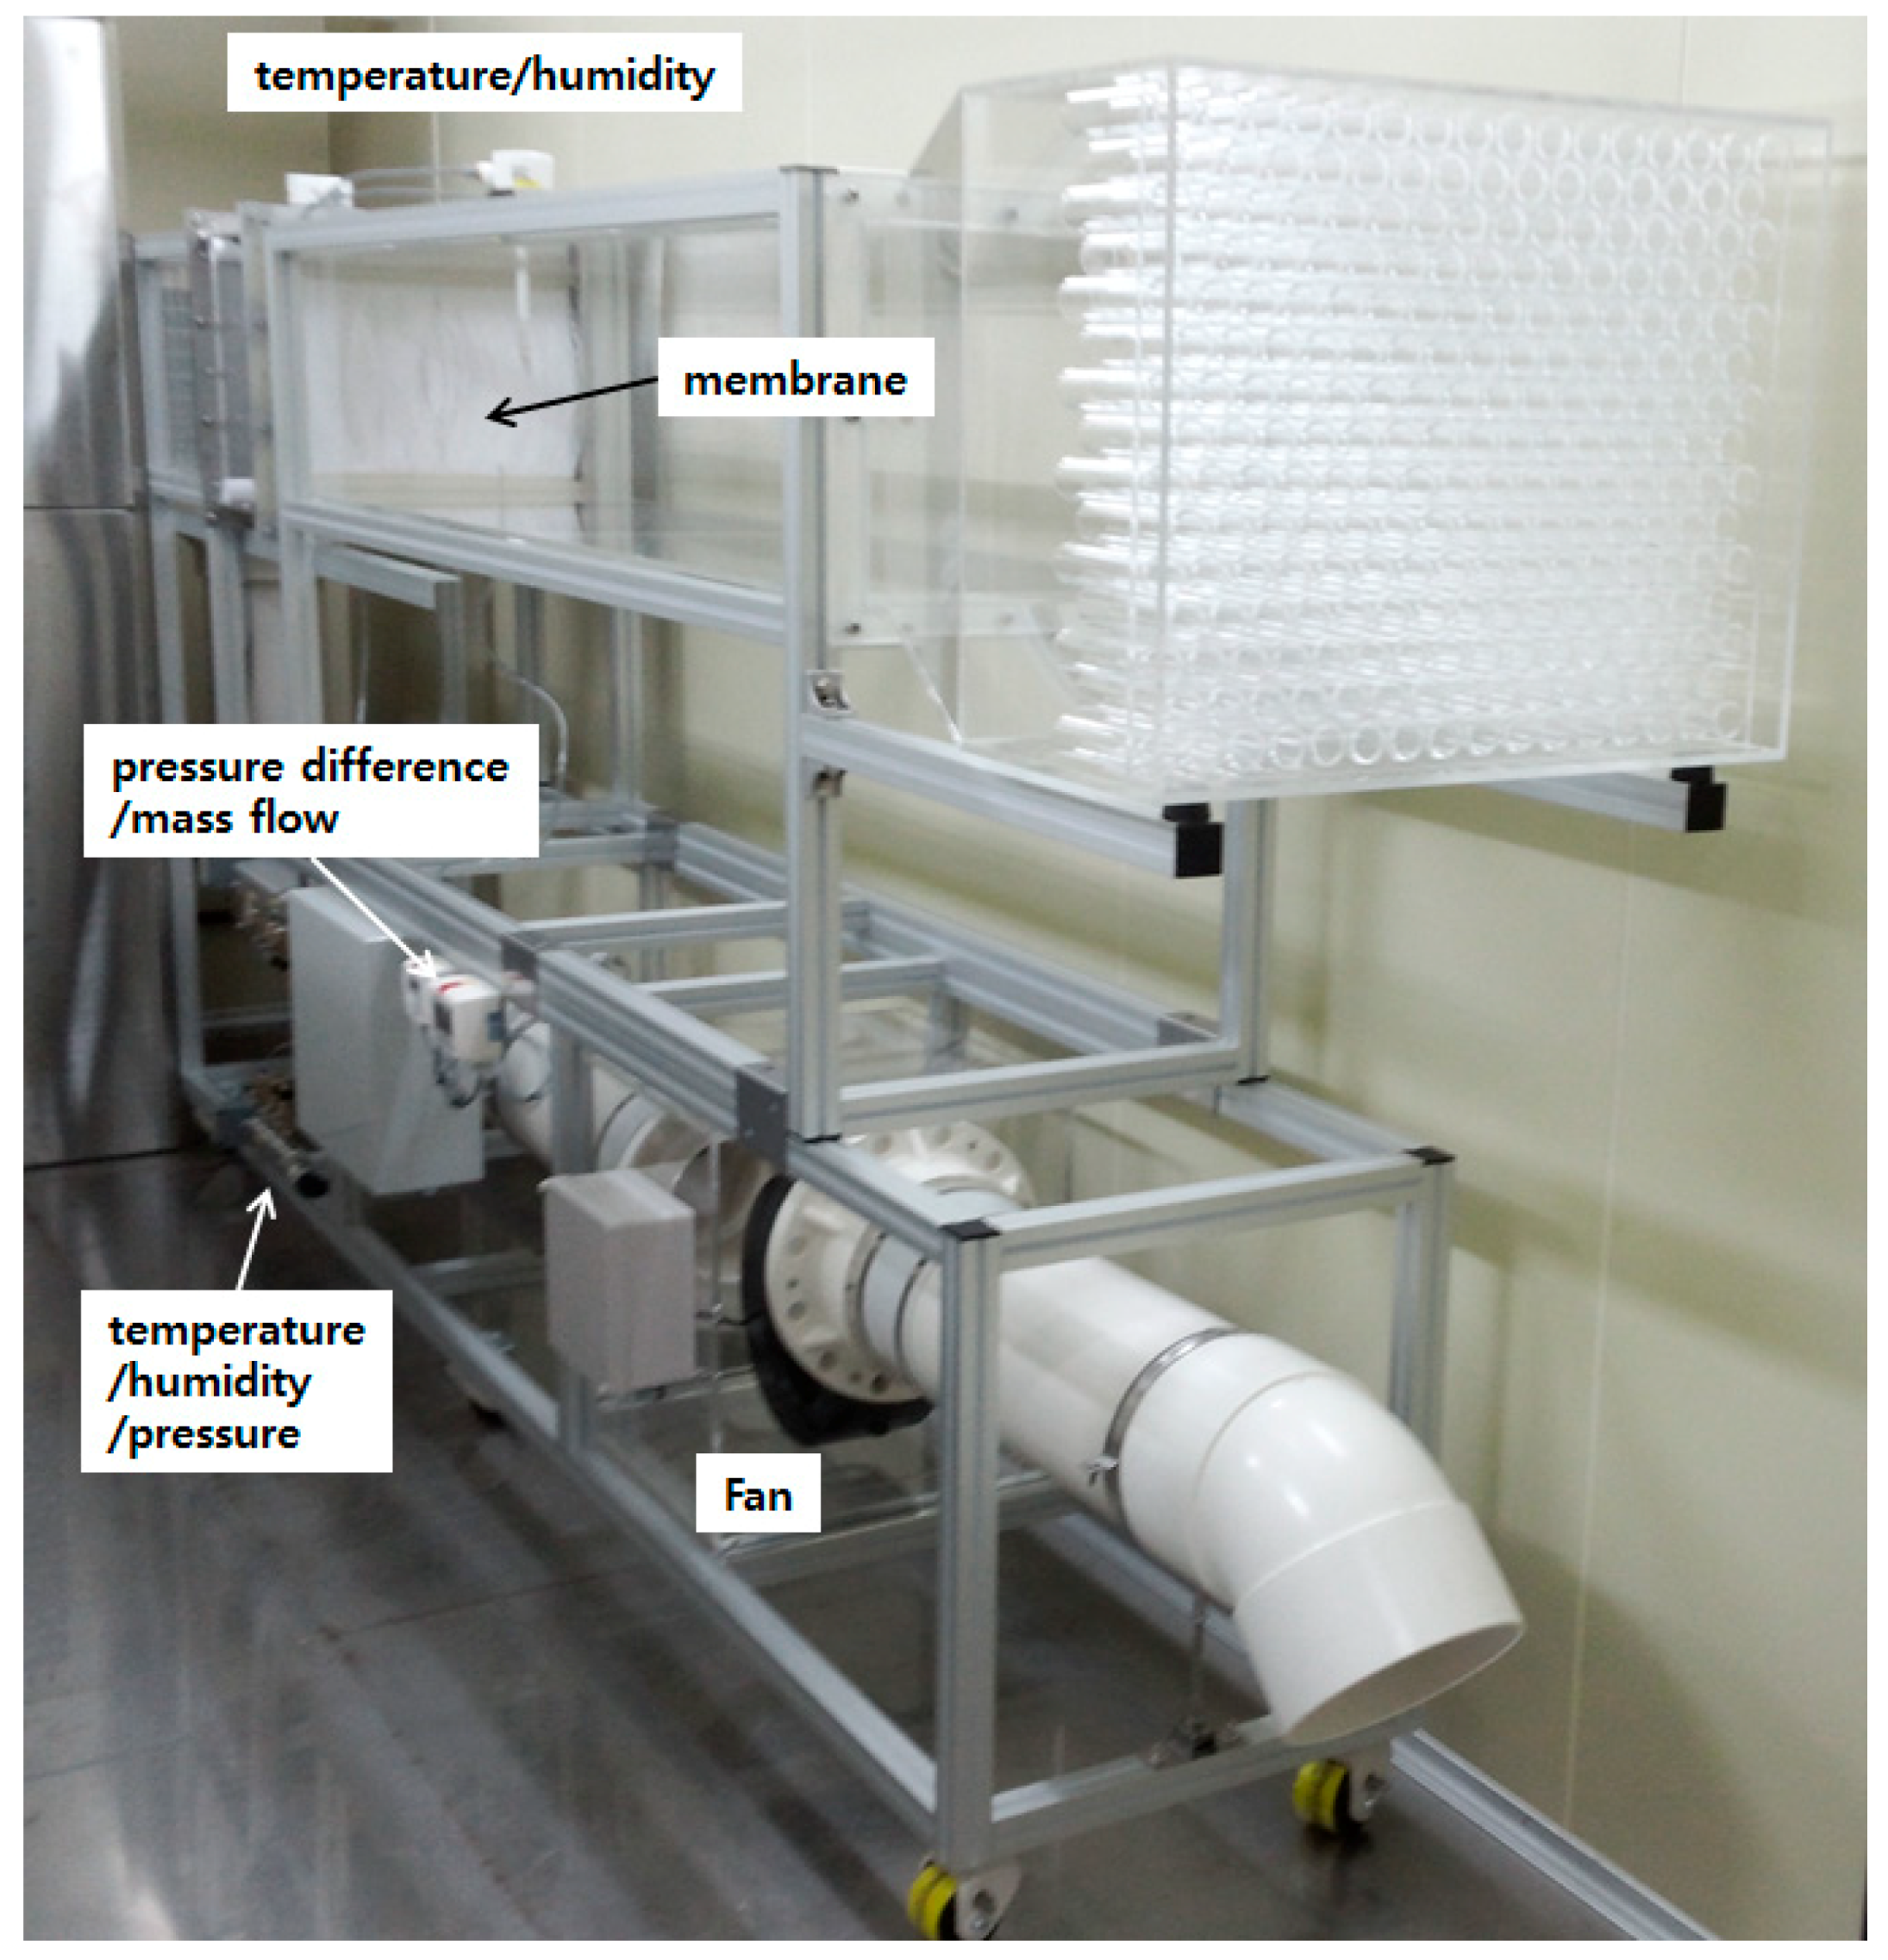
The hollow fiber type membrane was configured to be a cartridge type so that it could be used in a duct. Moreover, the membrane could be separated between the ducts. A performance tester was installed inside the chamber, as shown in
Figure 8 and
Figure 9, to determine the performance of the membrane cartridge. The dehumidification efficiencies under the dehumidification condition were compared by setting the dry bulb temperature and relative humidity. This study defined the dehumidification efficiency using Equation (6). This was obtained by dividing an hourly dehumidification amount by power consumption. The DE becomes higher as the energy consumption becomes less.
3.2. Membrane-Based Dehumidification System
Humid air was allowed to flow uniformly through the duct inlet and the length at the inlet of the duct was calculated using Equation (7) [
15]:
As the duct outlet did not have enough space for a chamber, the fluid was made to flow through the membrane cartridge and a guide vane was installed at the joint so that the fluid flowed uniformly. In the outlet of the sweep gas side (permeate side), the water vapor penetrating the membrane was reduced below the dew point using a cooling device to convert it into a liquid state. The test was conducted for 30 min in each case and the mean values were considered for the experimental results.
The dry bulb temperature, relative humidity and absolute pressure were measured at the inlet of the primary fluid (at the duct side), the outlet of the primary fluid (at the sweep gas side) and the outlet of the secondary fluid (at the sweep gas side), respectively; the membrane cartridge was taken as the reference point. The power consumption of the vacuum pump was also measured. Water was separately put in the rear part of the cooling device and the weight was measured after the 30-min test.
Table 2 lists the detailed specifications of the sensor used in the tester.
4. Results and Discussion
The major variables of the MDS were evaluated considering the actual filed conditions; then, using those results, it was simulated with the TRNSYS program.
4.1. Experimental Results
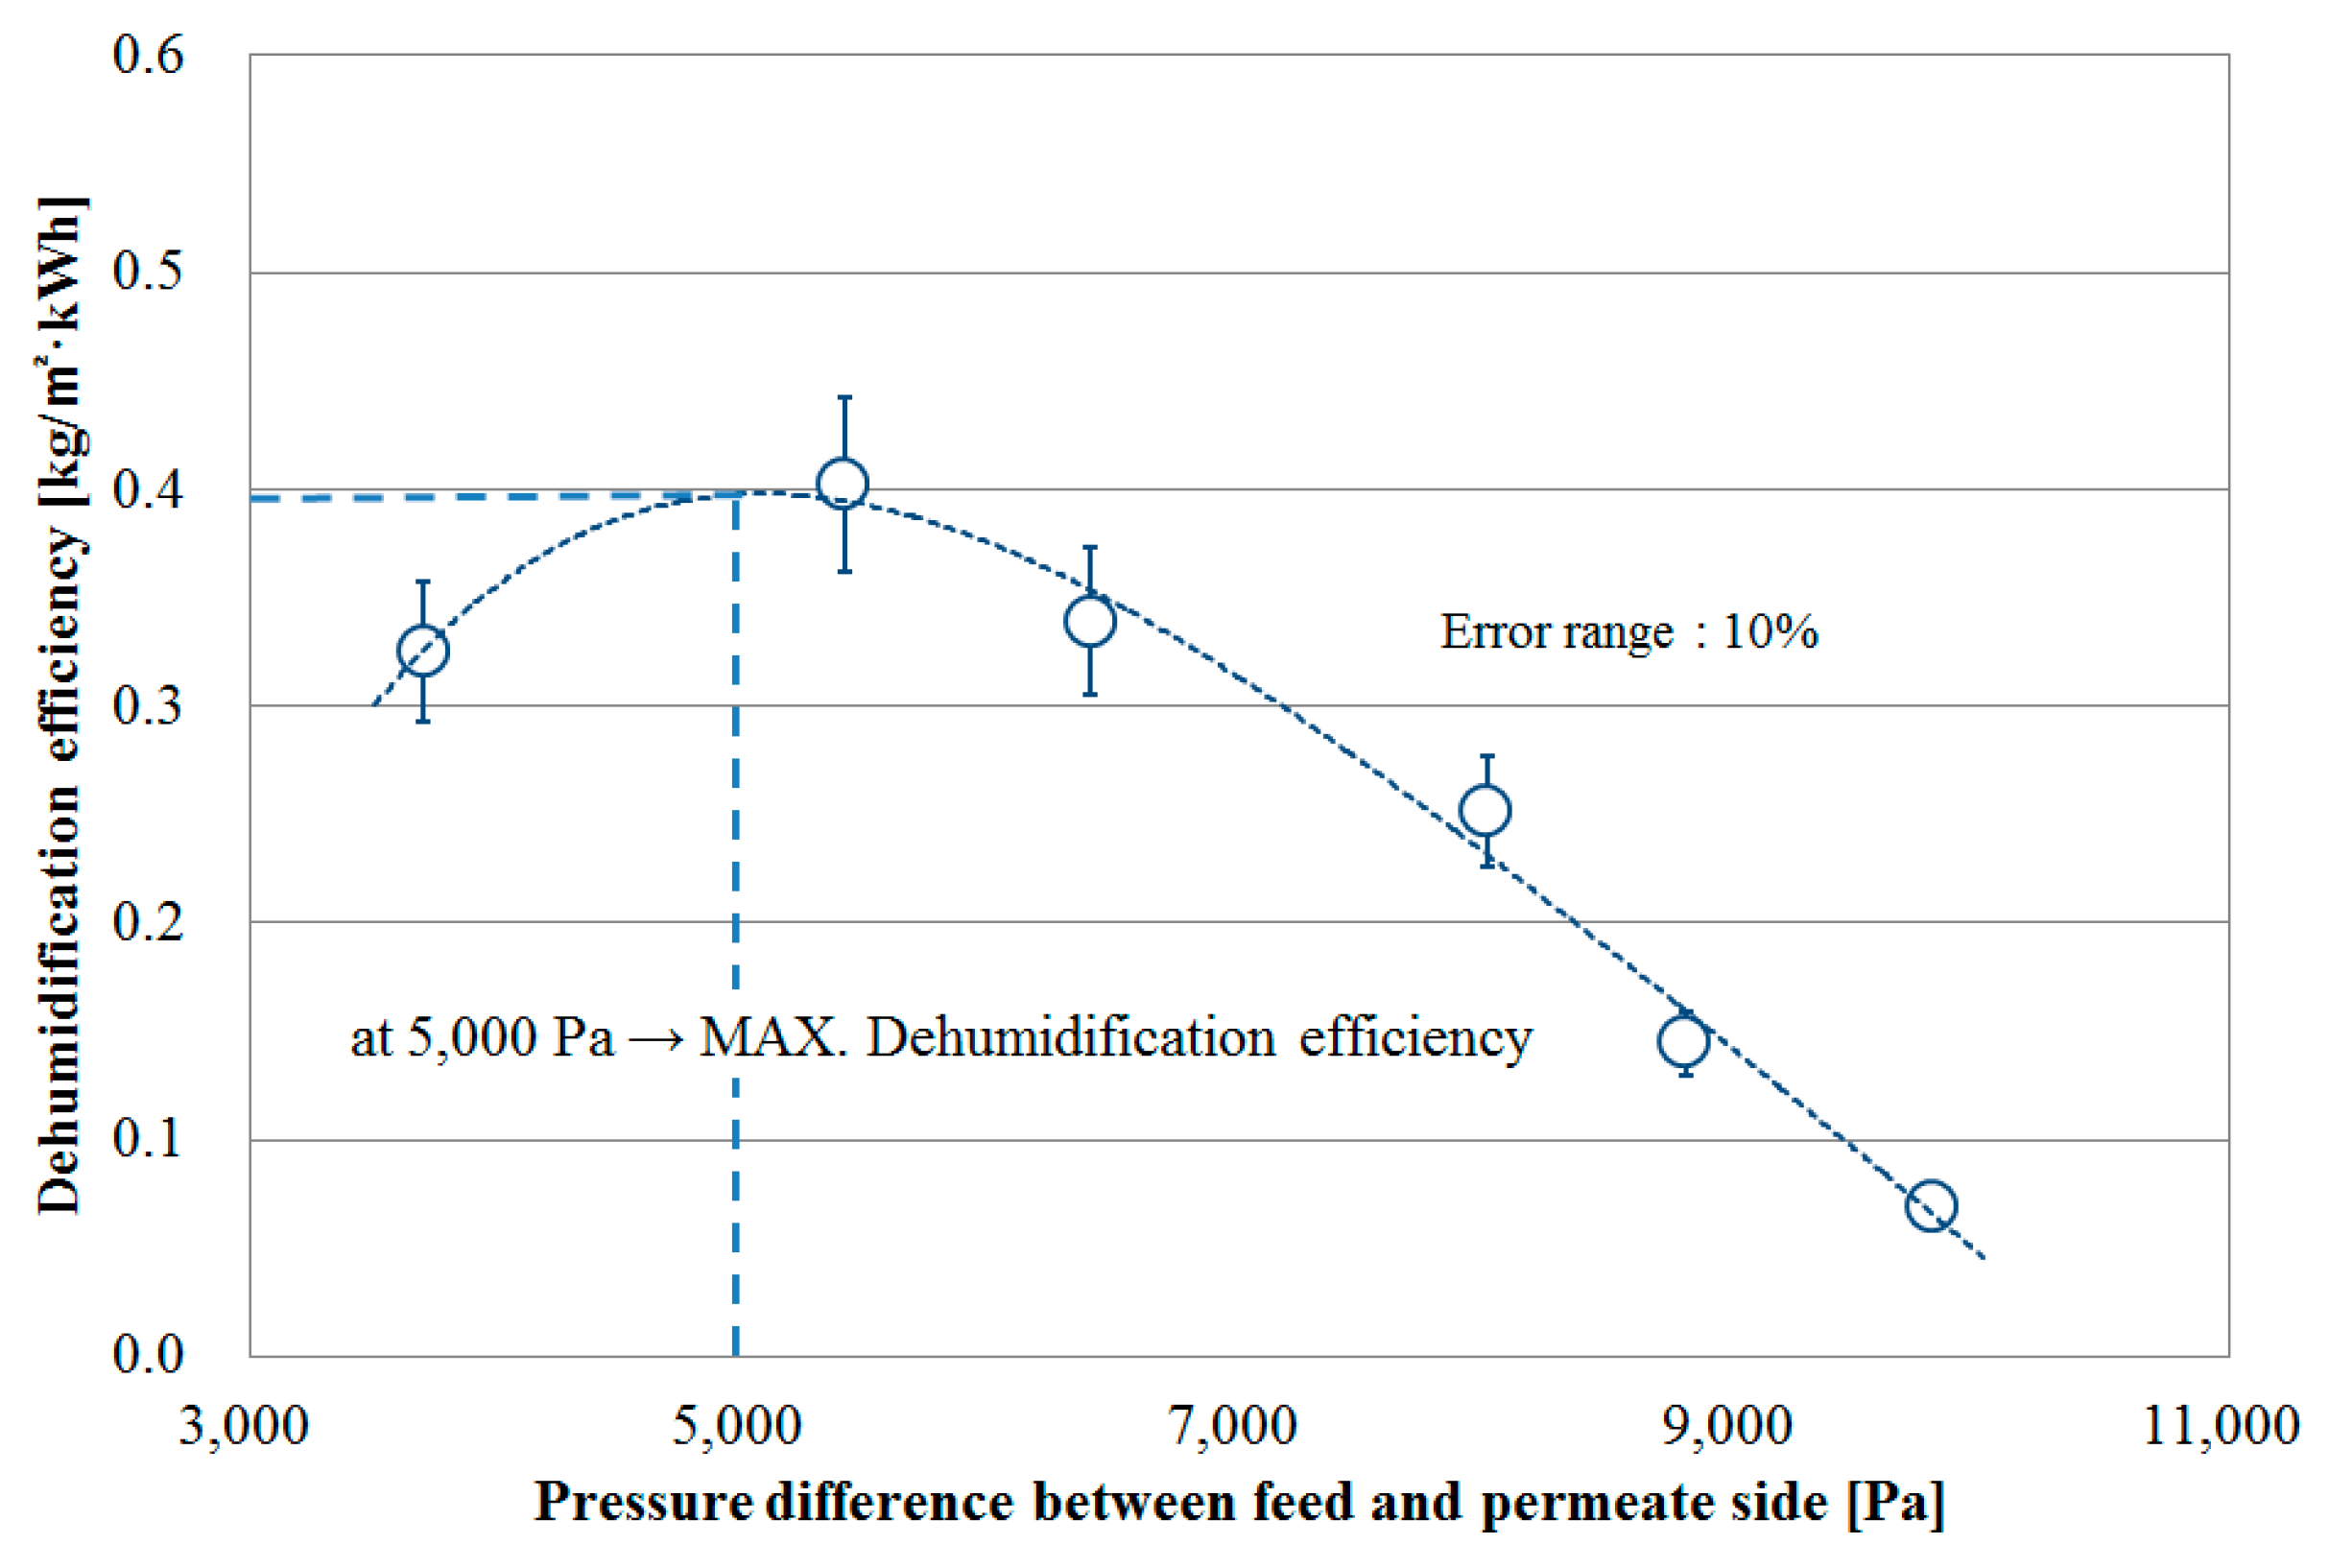
The variation in dehumidification efficiency was observed by changing the pressure difference between the feed side and the permeate side. As shown in
Figure 10, the dehumidification efficiency was maximized at a pressure difference of around 5000 Pa. This was because, when the pressure difference increased, the dehumidification rate also increased but the power consumption showed a further rise. Accordingly, the simulation applied the pressure difference of 5000 Pa and also assumed that the corresponding power consumption was constant.
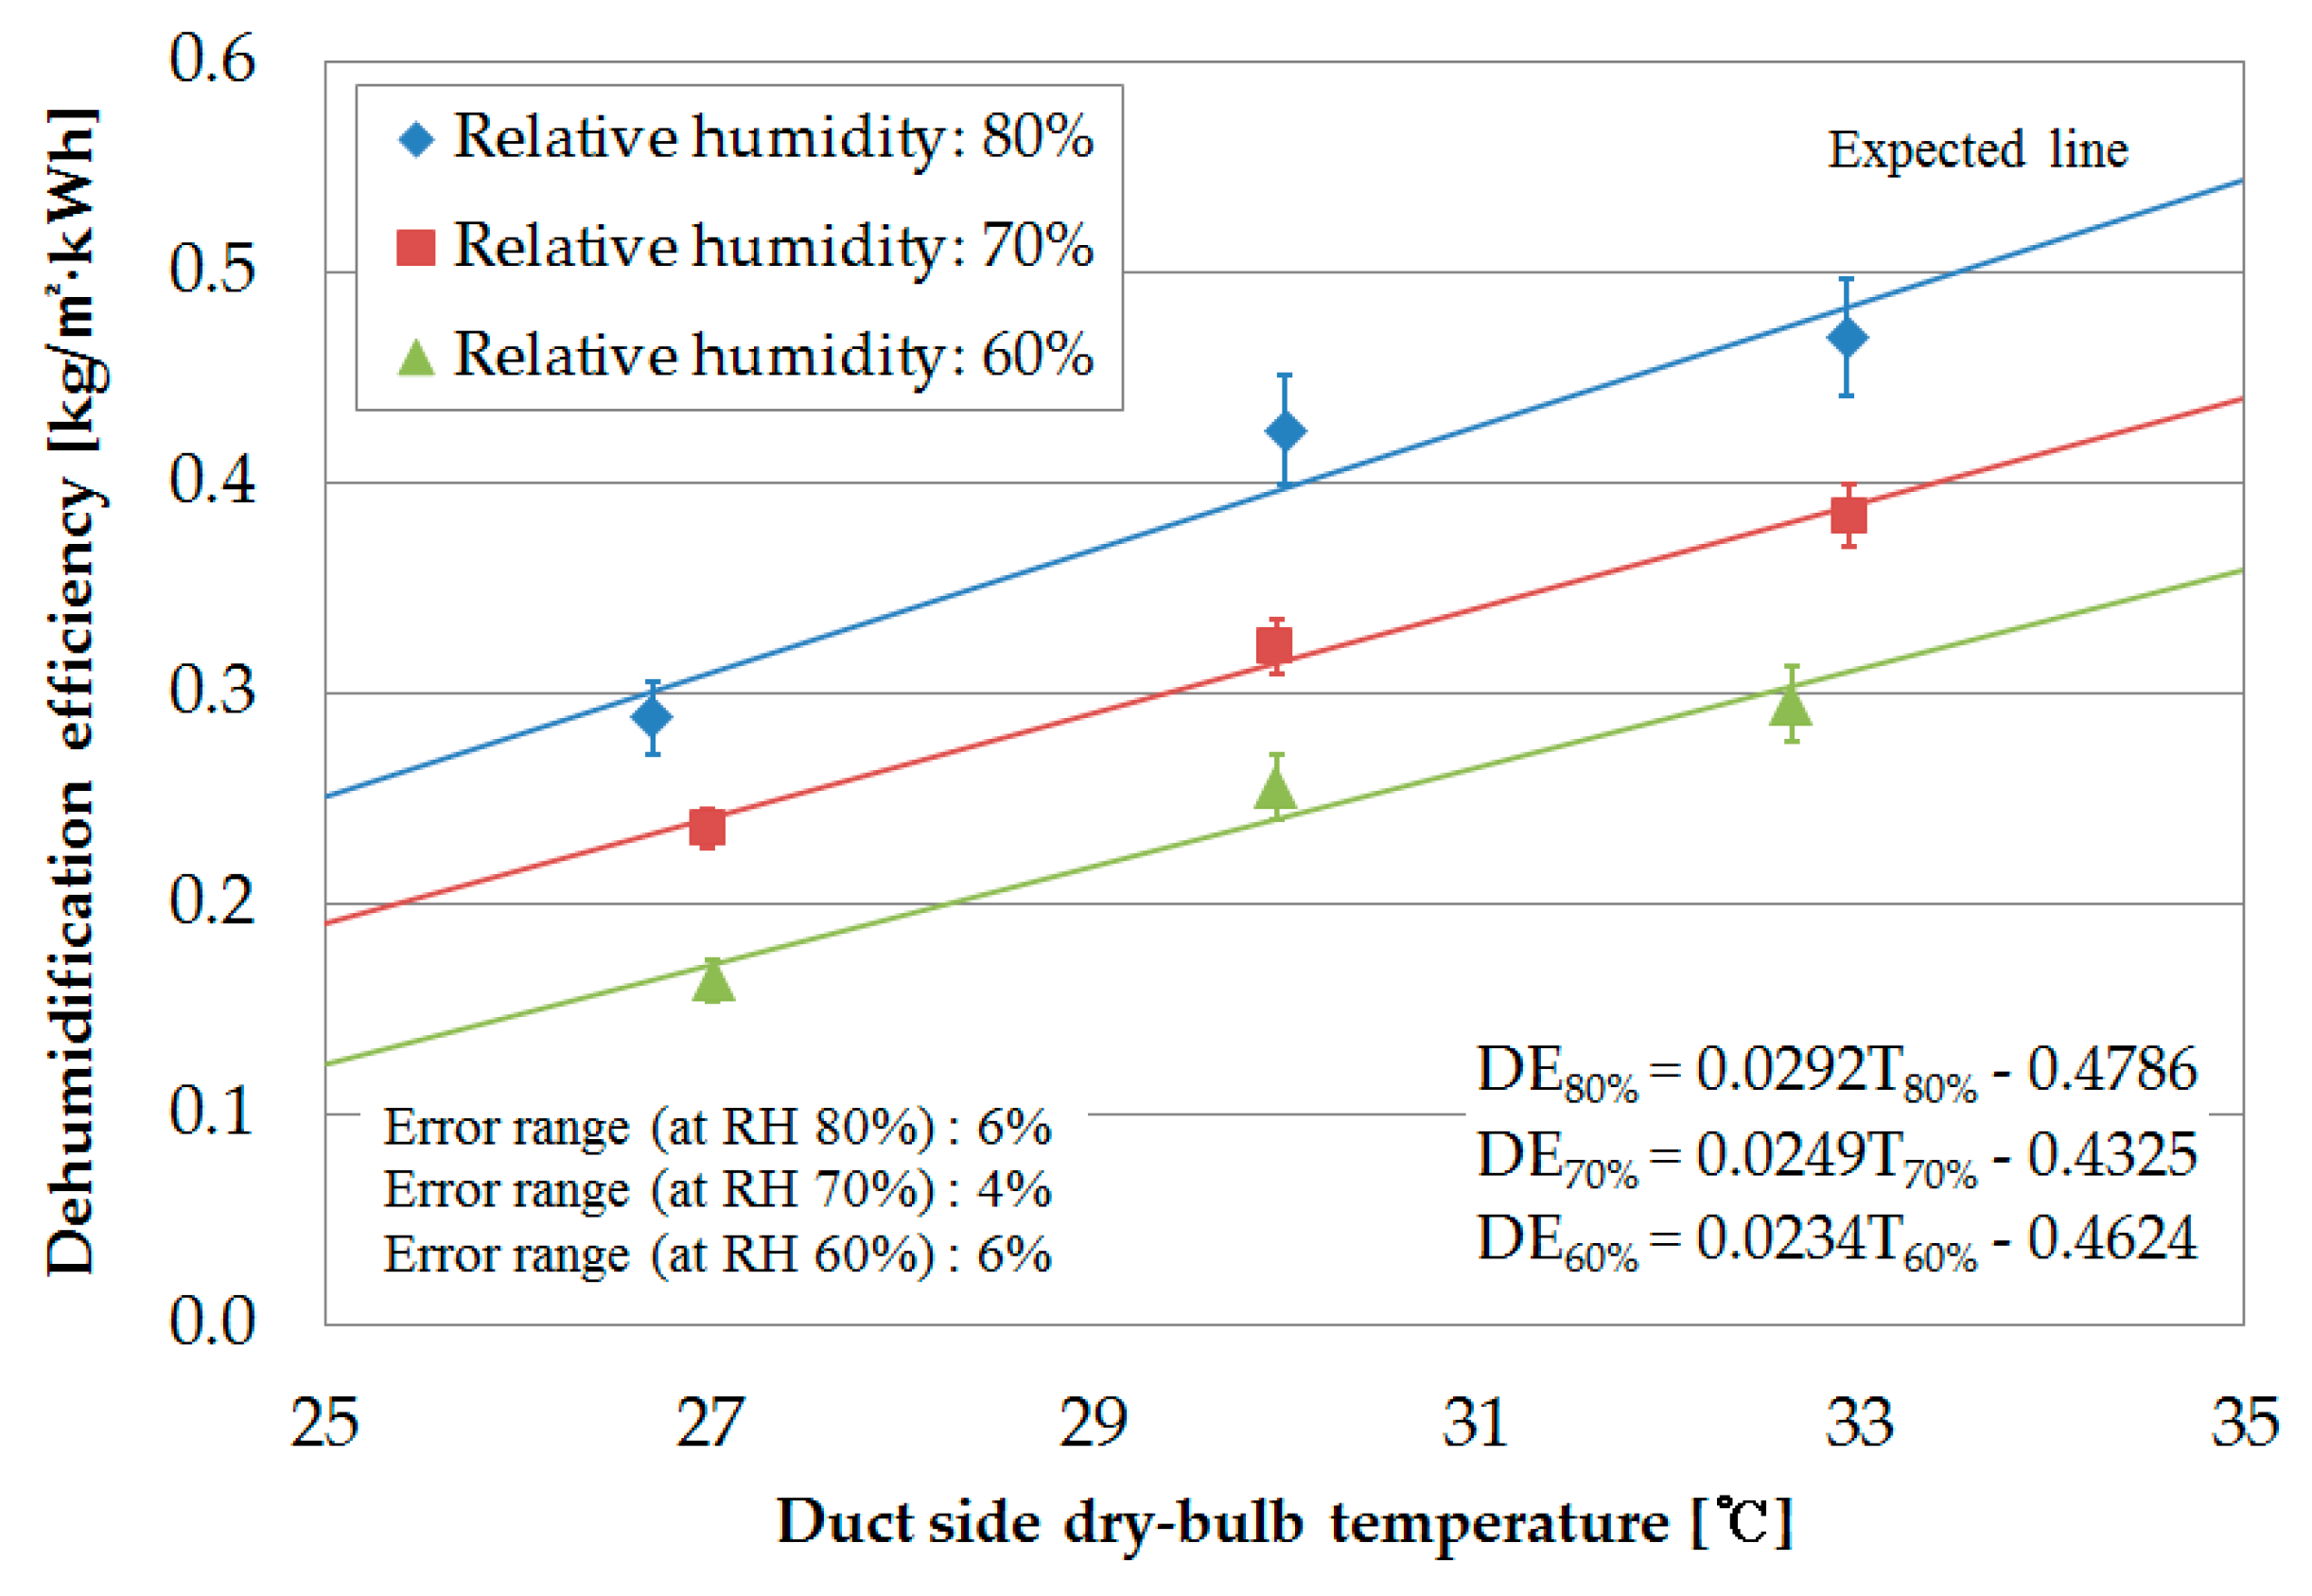
For the comparison analysis of the MDS performance, the correlation of dehumidification efficiency was obtained using the TRNSYS (Type 688) dehumidifier model.
Figure 11 shows the comparison results in terms of the dehumidification efficiency (performance) per unit area of the membrane, obtained by changing the dry bulb temperature at the duct side. The membrane performance improved with the increase in the dry bulb temperature.
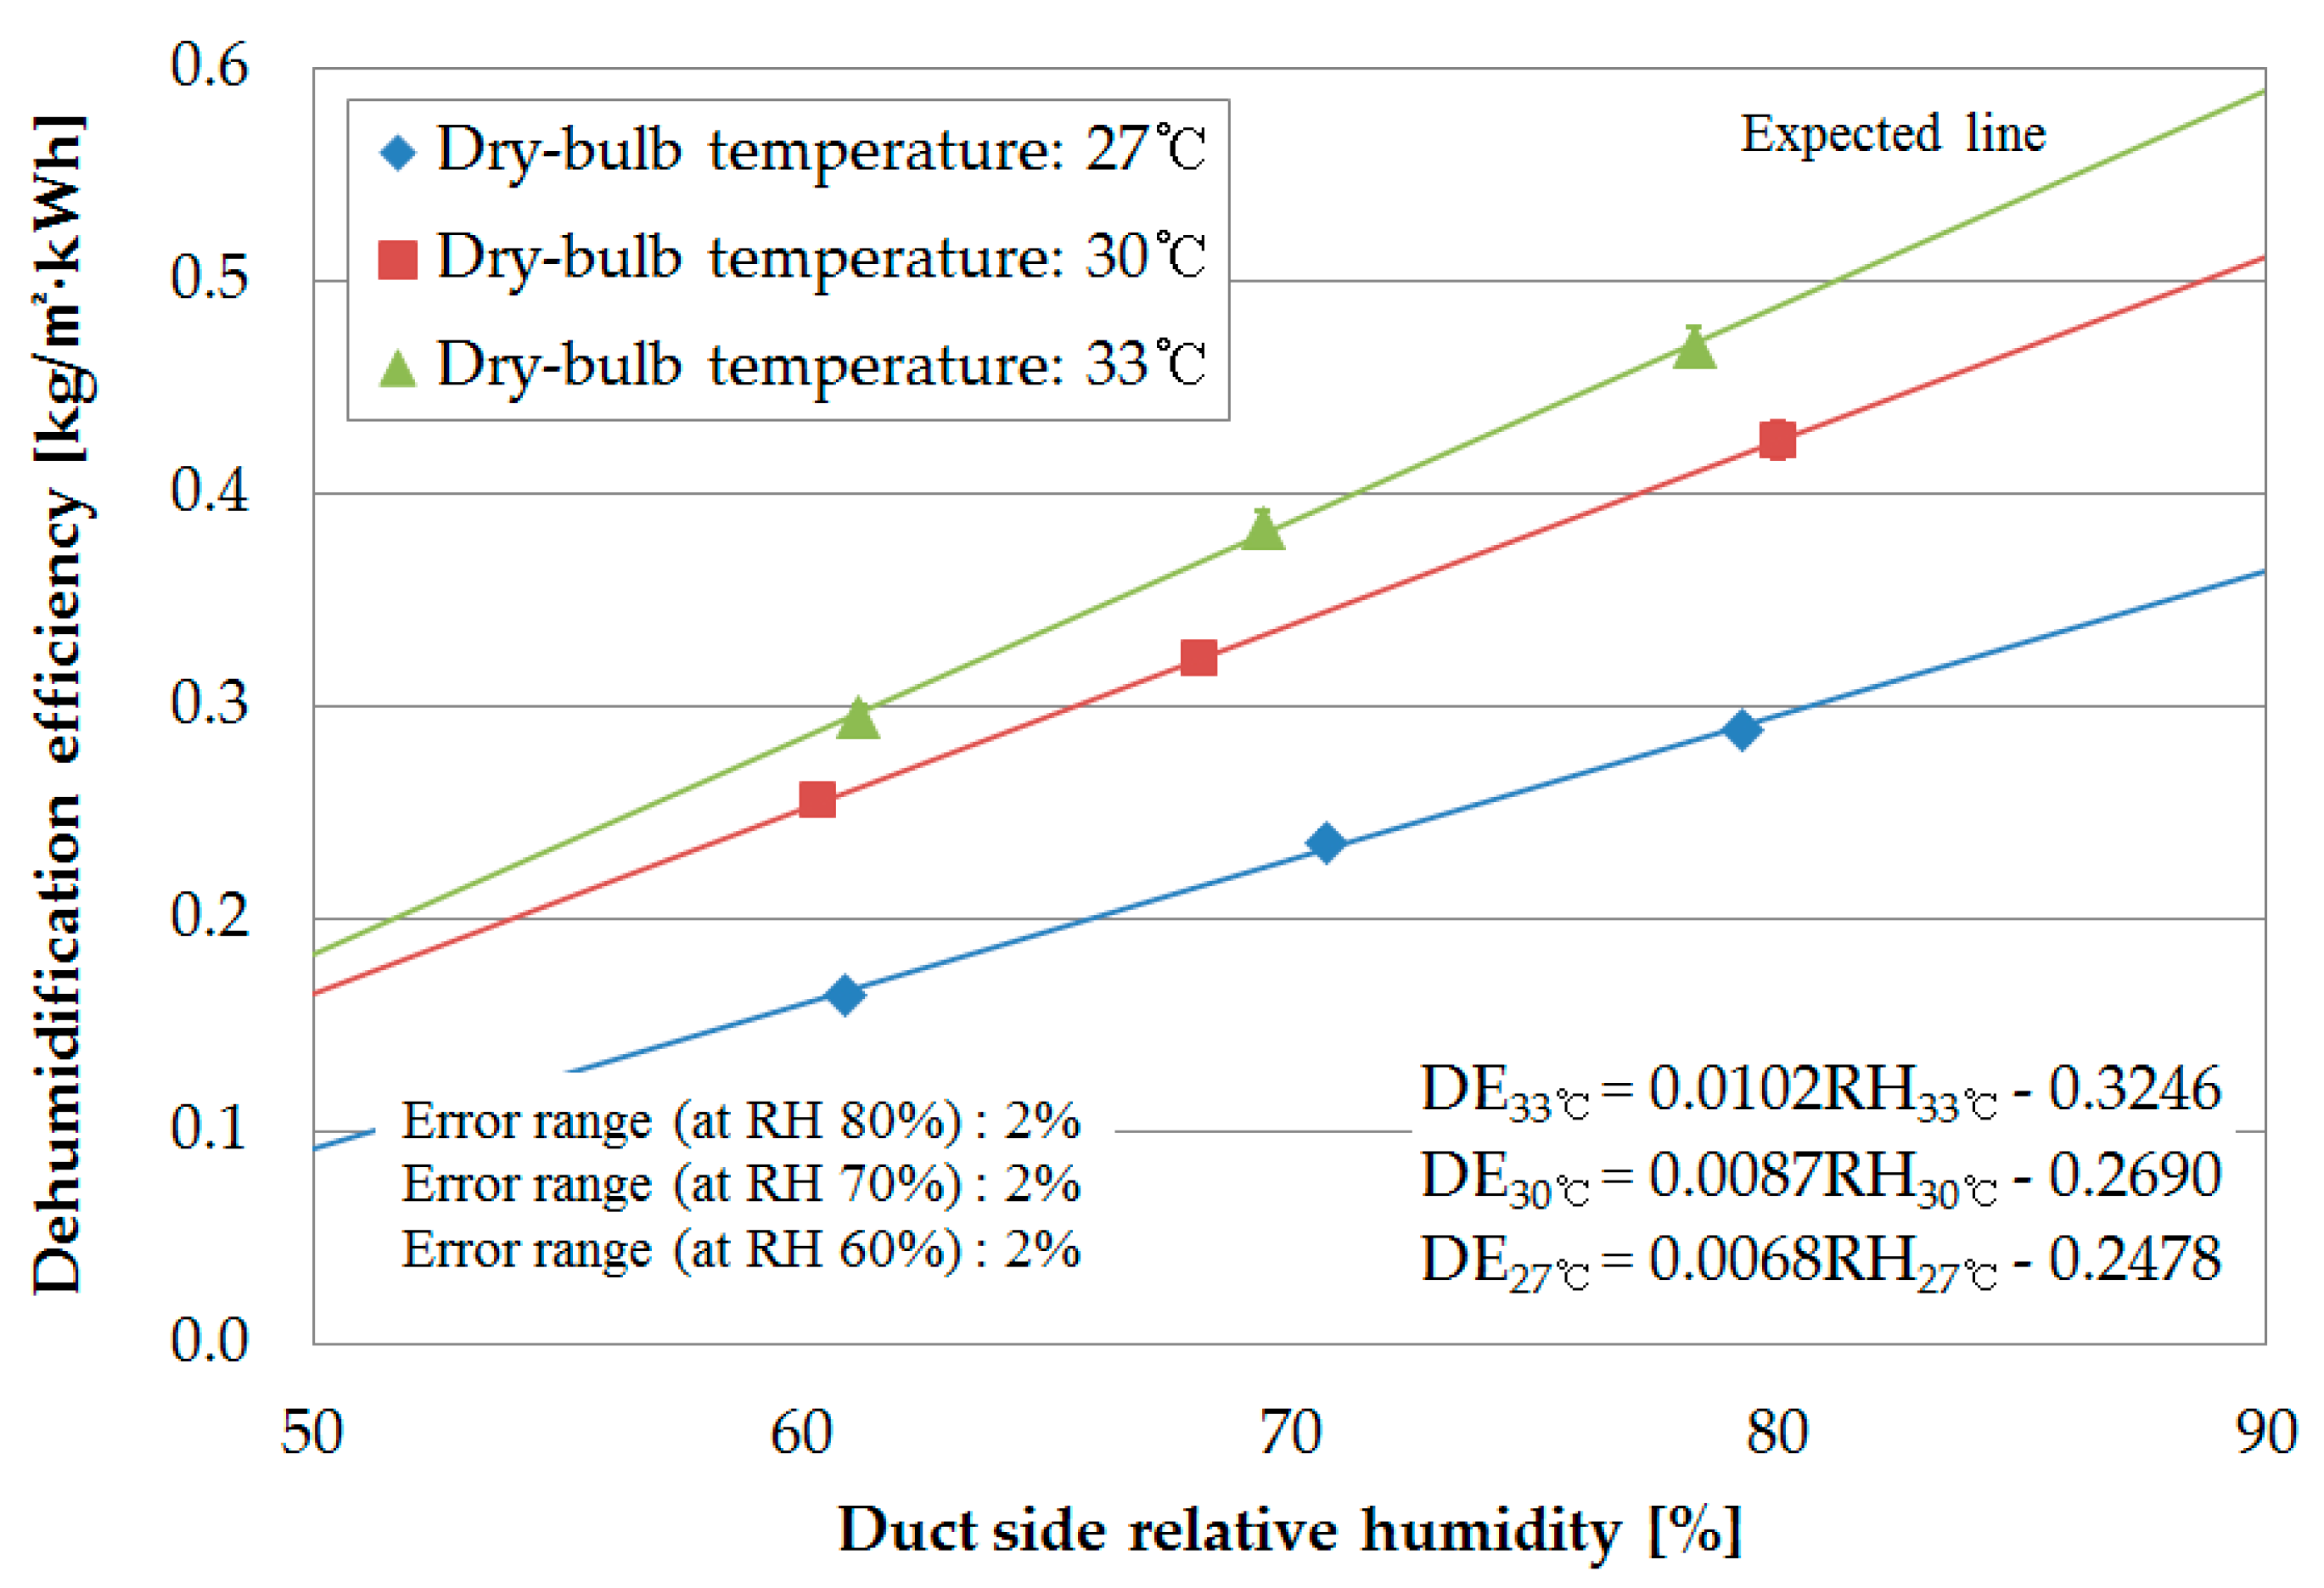
Figure 12 shows the variation in the dehumidification efficiency per unit area of the membrane, obtained by changing the relative humidity at the duct side. The results showed that the dehumidification efficiency increased linearly with the increase in the relative humidity. The dehumidification efficiency of the membrane was related to the variation in the dry bulb temperature and relative humidity at the primary side (duct side). It can be seen that the increase in the dehumidification efficiency as the dry bulb temperature increased resulted in a change in the diffusion coefficient that increases the activation energy and the increase of the dehumidification efficiency due to the increase in the relative humidity caused by the increase of the water flux rate in the membrane.
4.2. Simulation Results
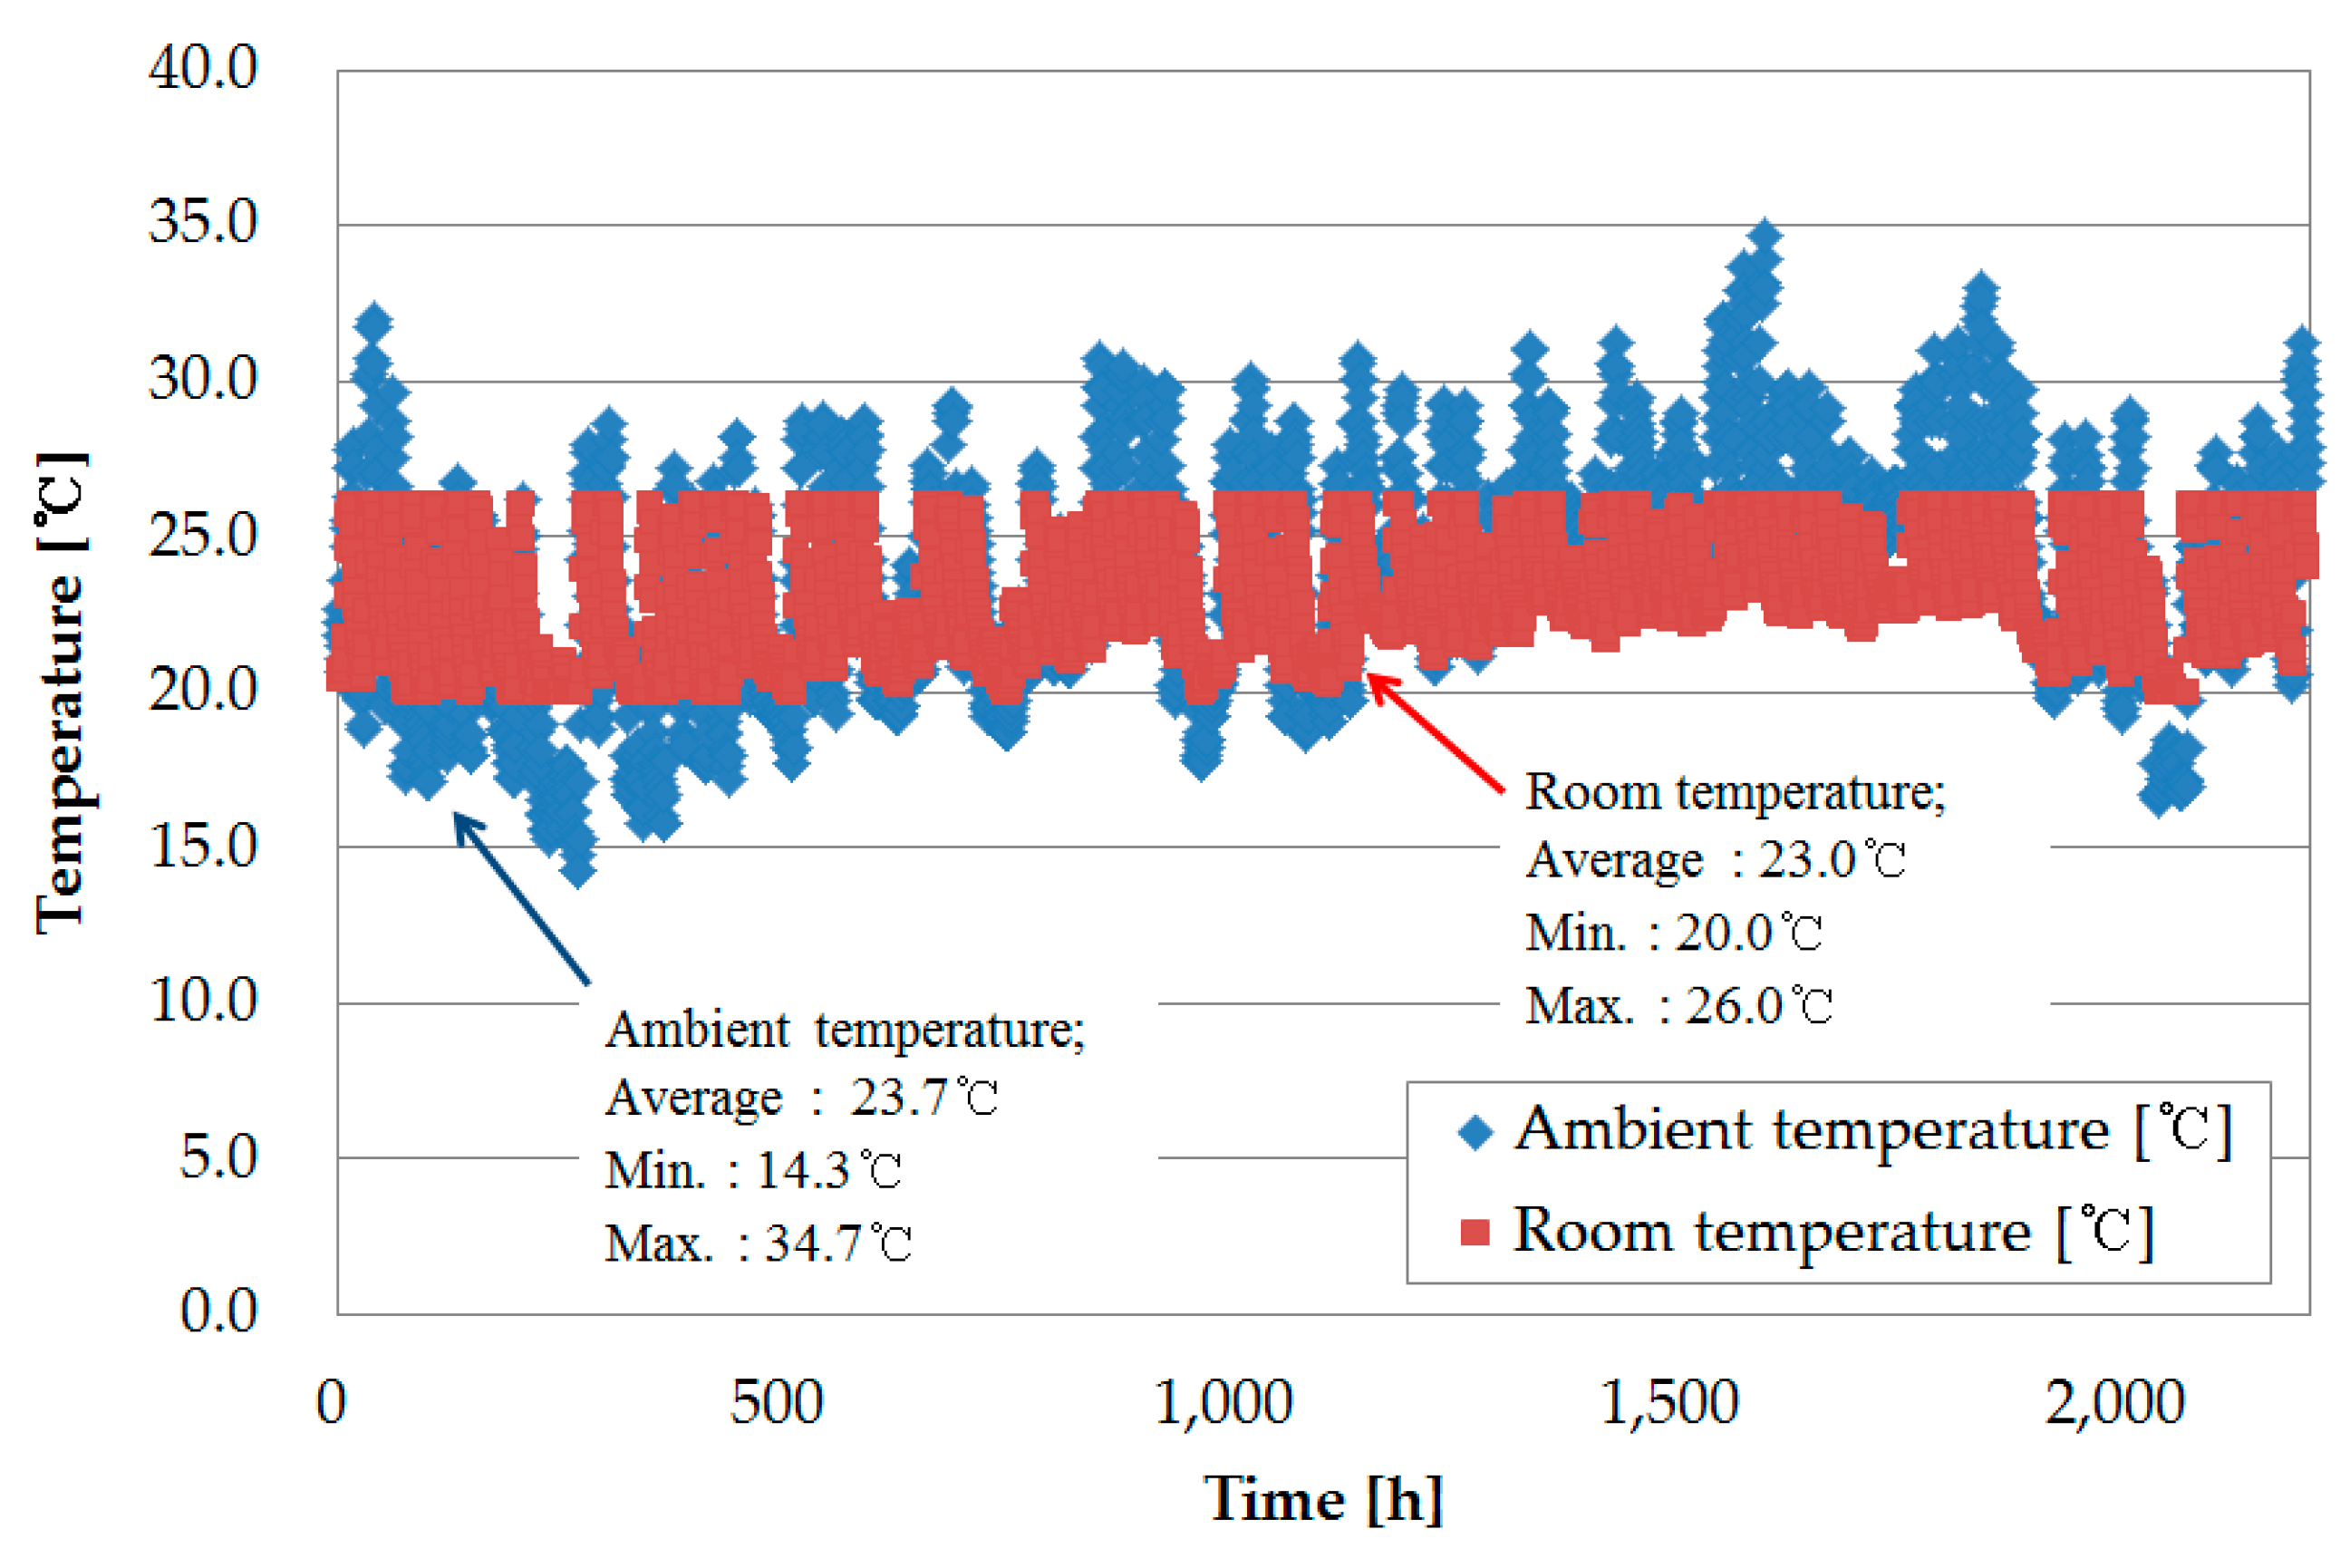
The dry bulb temperature and relative humidity for cooling were set to 26 °C and 60%, respectively, to calculate the dehumidification load necessary for the rainy season.
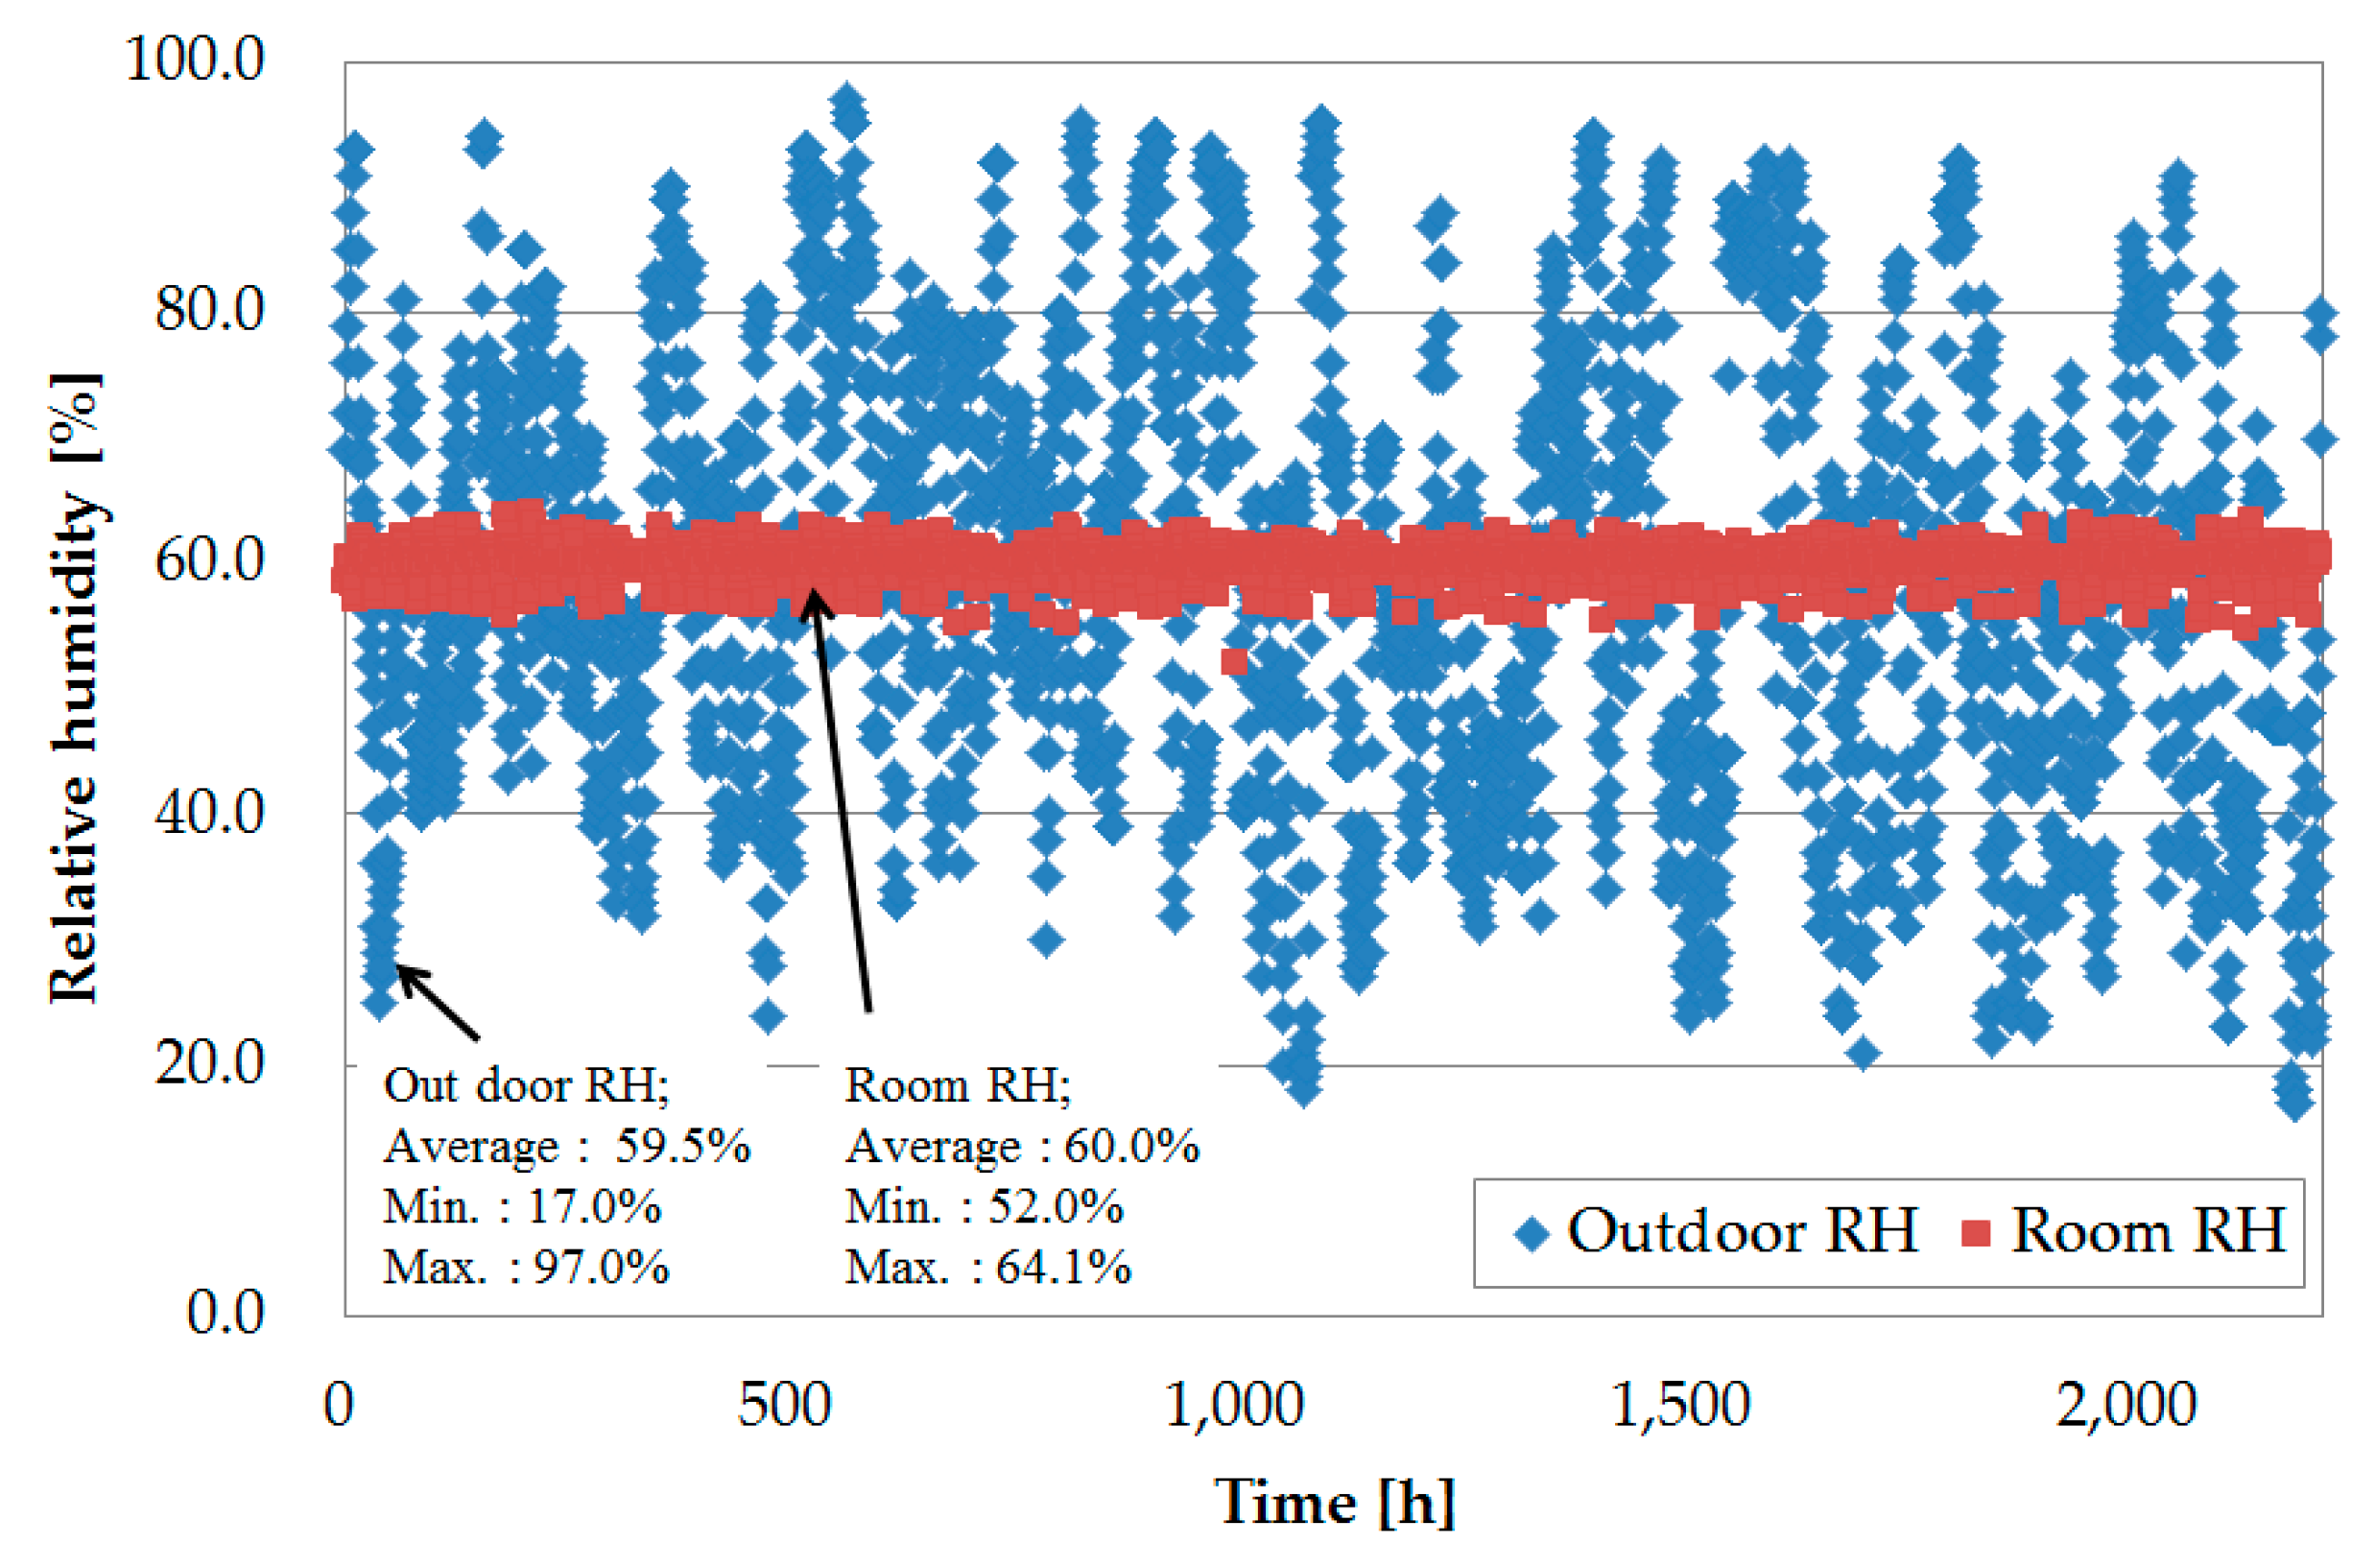
Figure 13 shows the variations in the dry bulb temperature (inside the load) and the outdoor temperature. It is clear that the temperature inside the load was maintained between 20 °C (set temperature for heating) and 26 °C. In addition, the relative humidity inside the load was kept at approximately 60%, as shown in
Figure 14. As the relative humidity and dry bulb temperature inside the load were controlled, the load necessary for dehumidification was calculated. The evaporative cooling dehumidifier helped in supplying the necessary load to determine the energy needed to decrease the raised temperature due to the high temperature of the dehumidifier outlet.
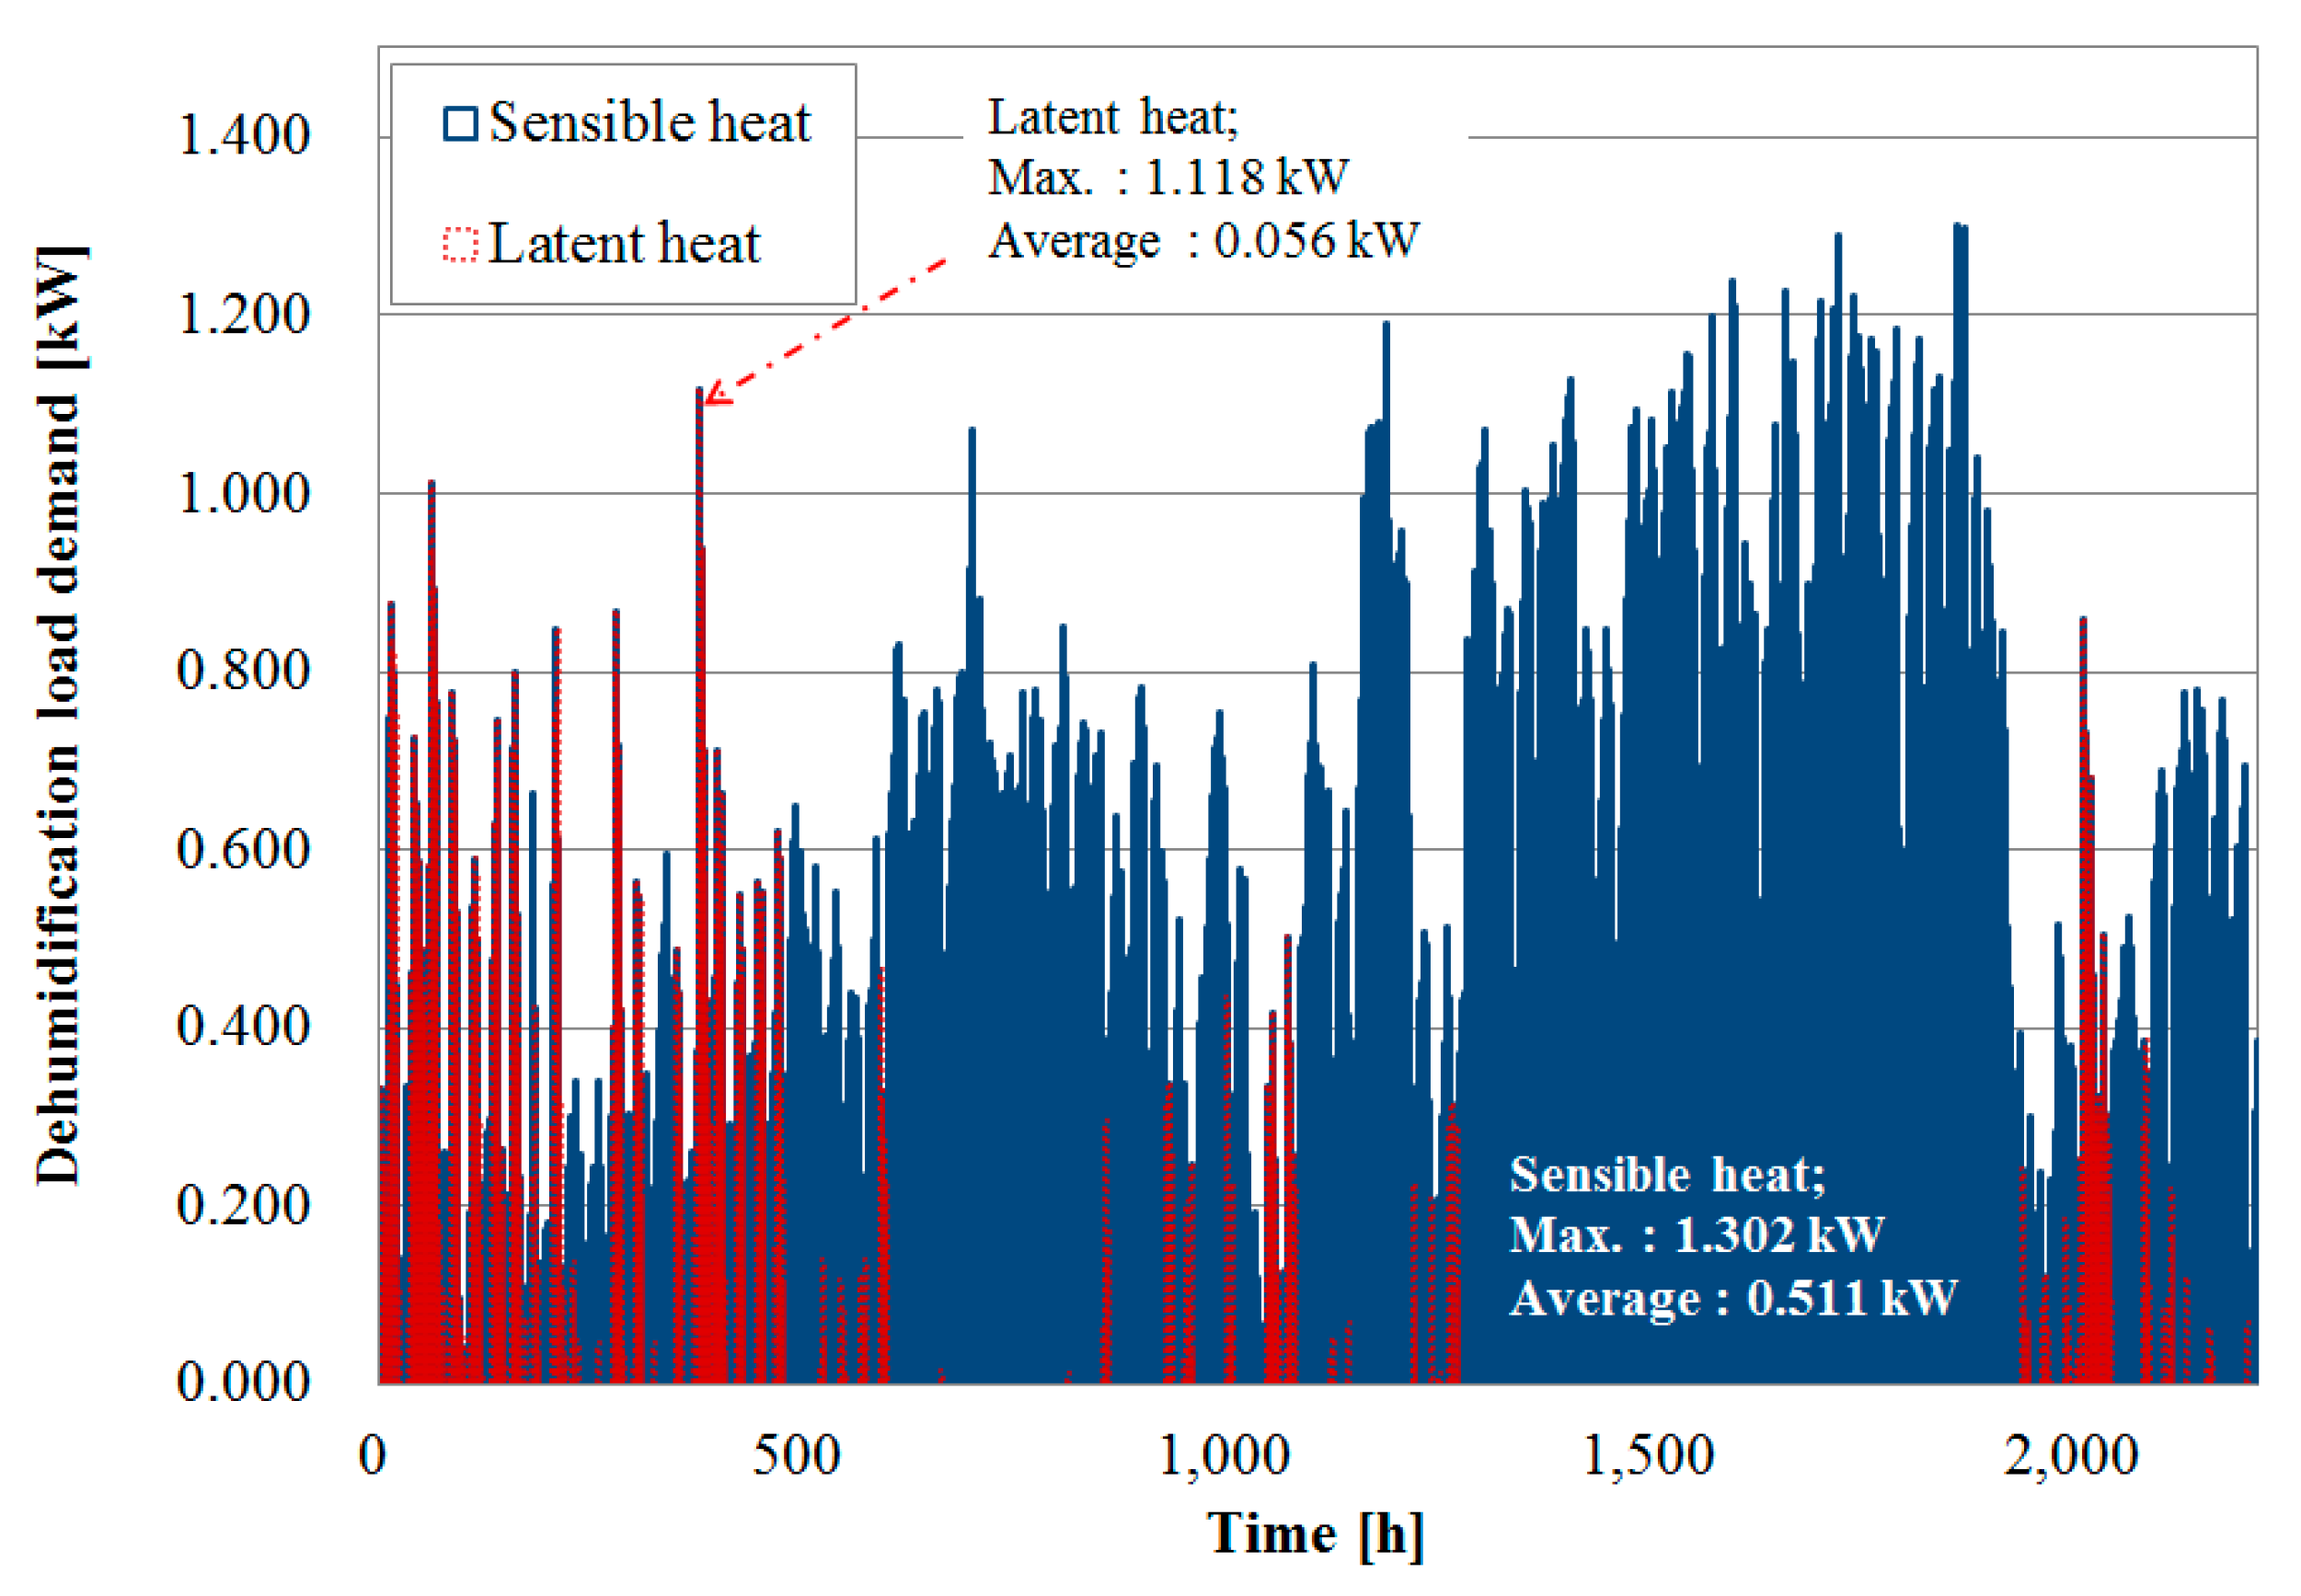
Figure 15 shows the amounts of sensible heat (or load) and latent heat in the dehumidification load, which was generated from the proposed load. The sum of sensible and latent heats is the dehumidification load demand of the building. It turned out that the sensible heat was dominant in the proposed load.
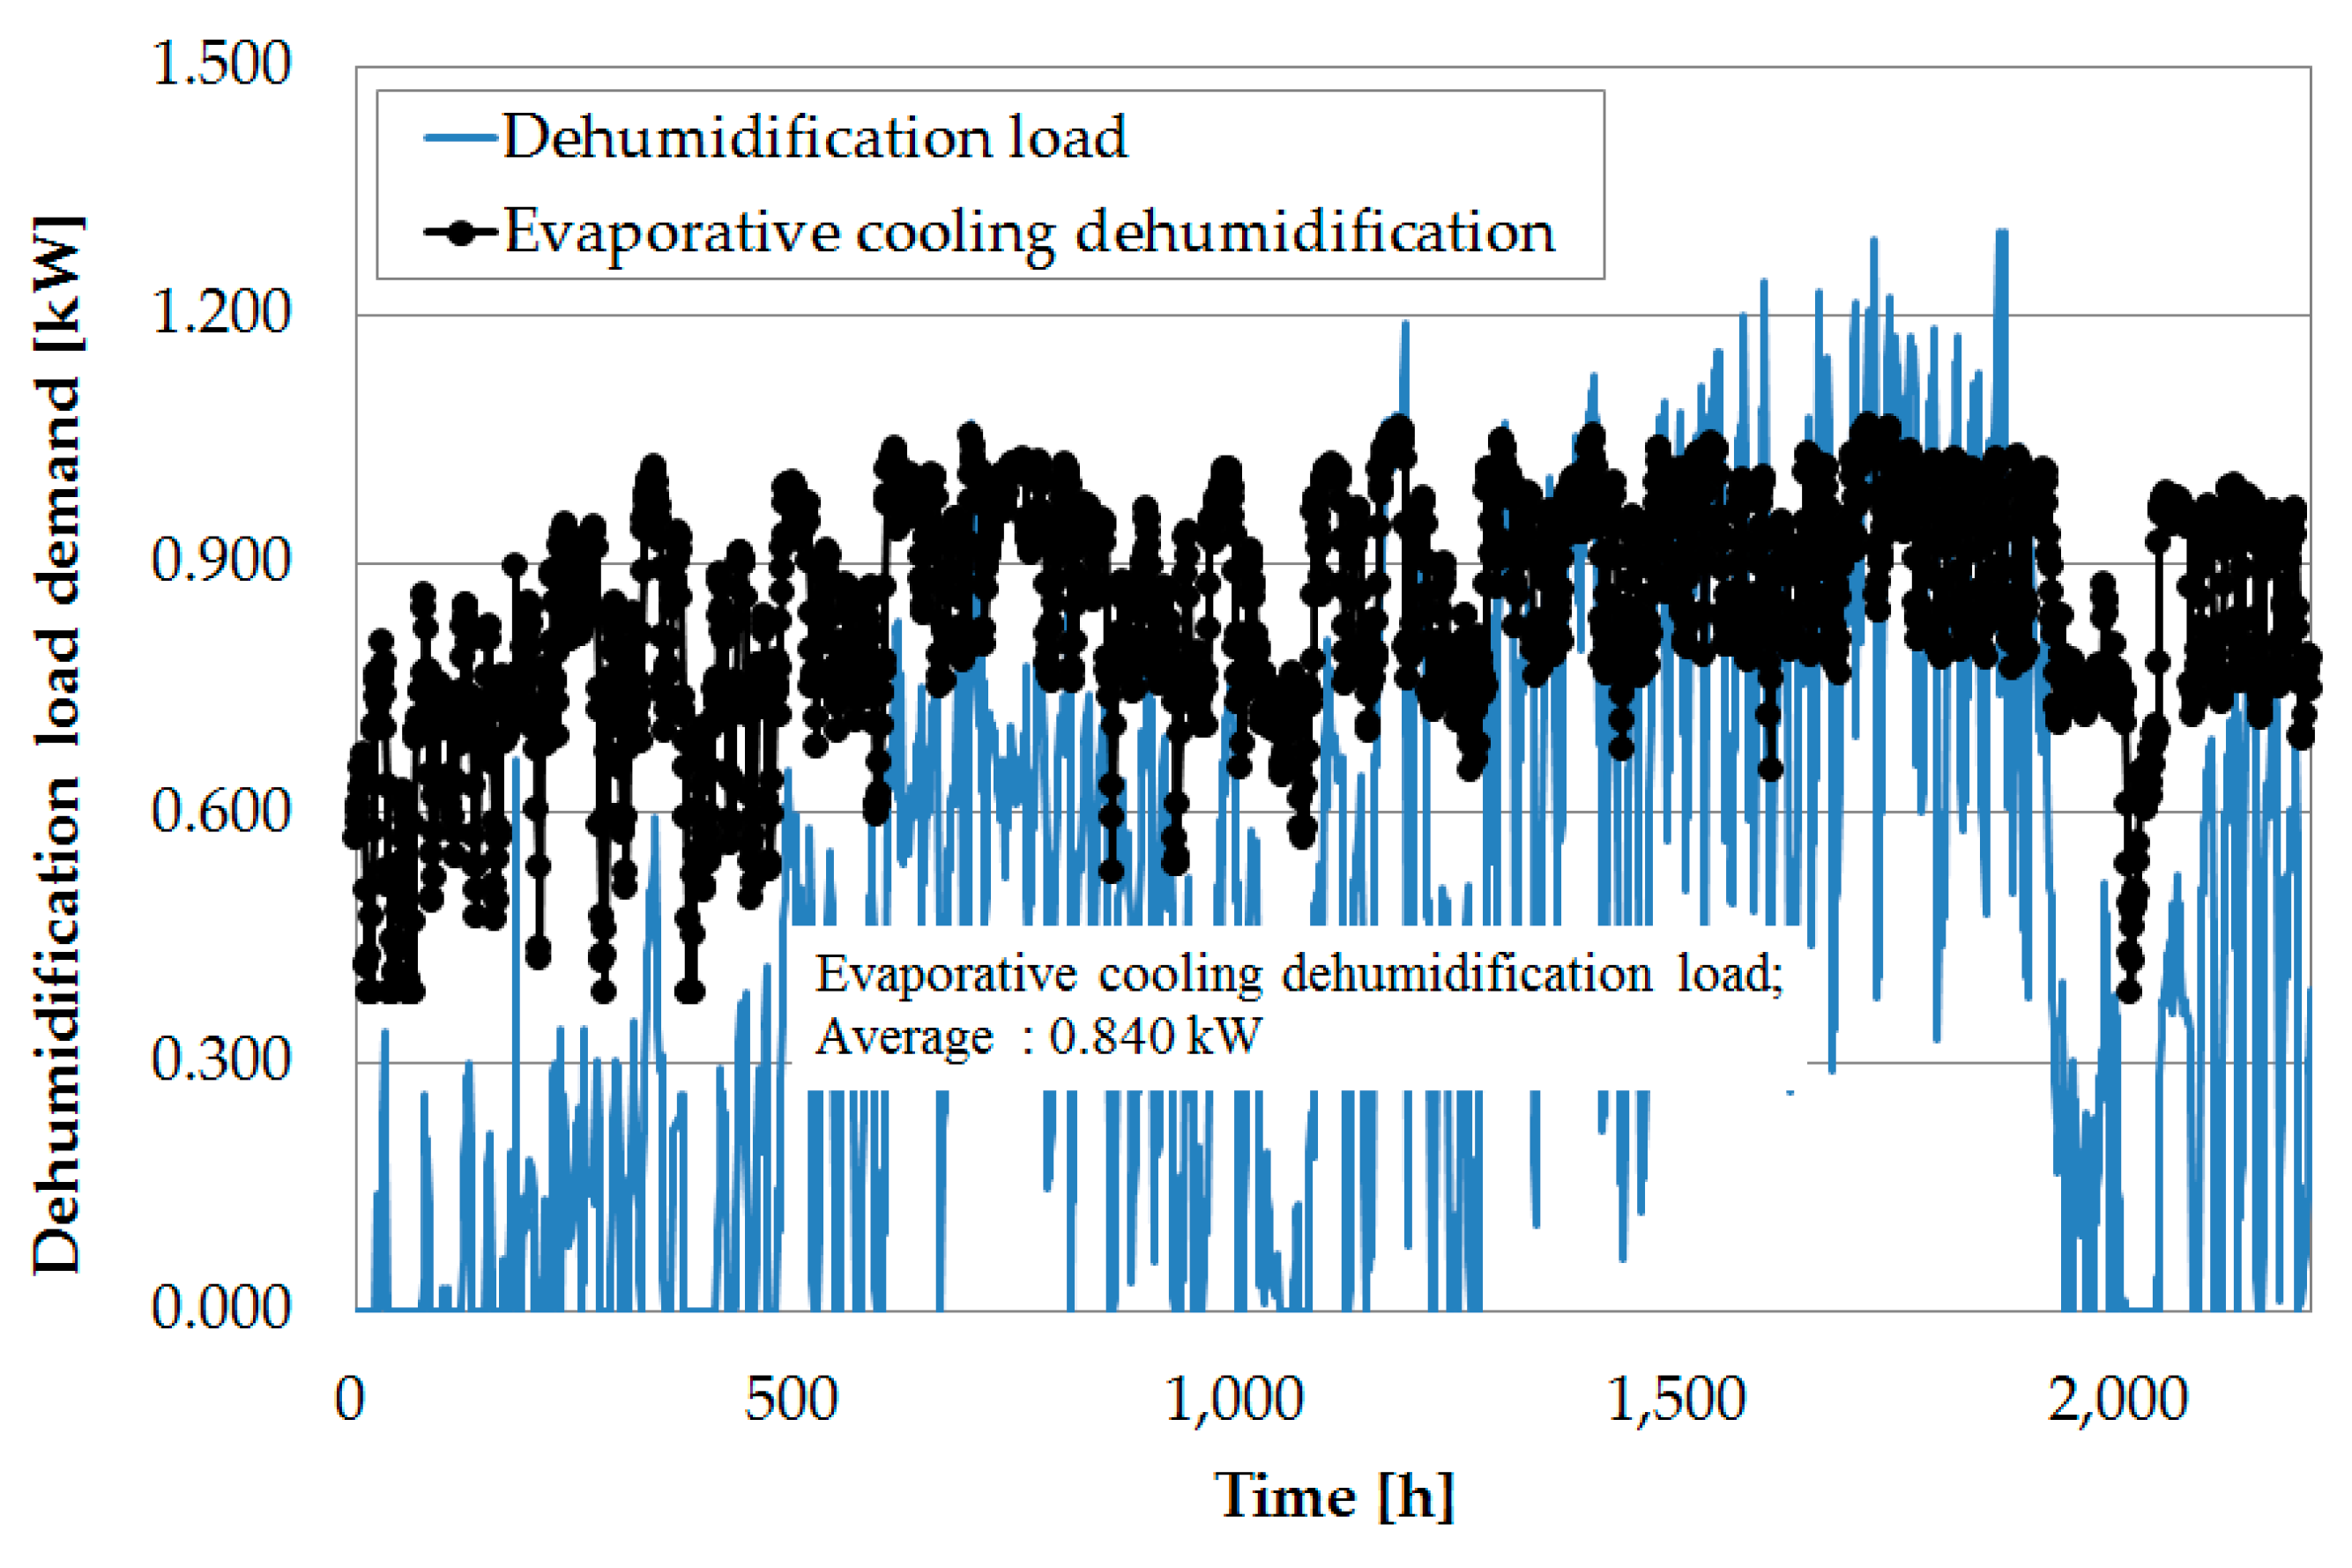
Figure 16 shows the energy demand for reducing the dry bulb temperature at the outlet of the evaporative cooling dehumidifier when compared to the dehumidification load over time. The total dehumidification load was 1004.9 kW, whereas the total energy demand was calculated to be 1853.7 kW.
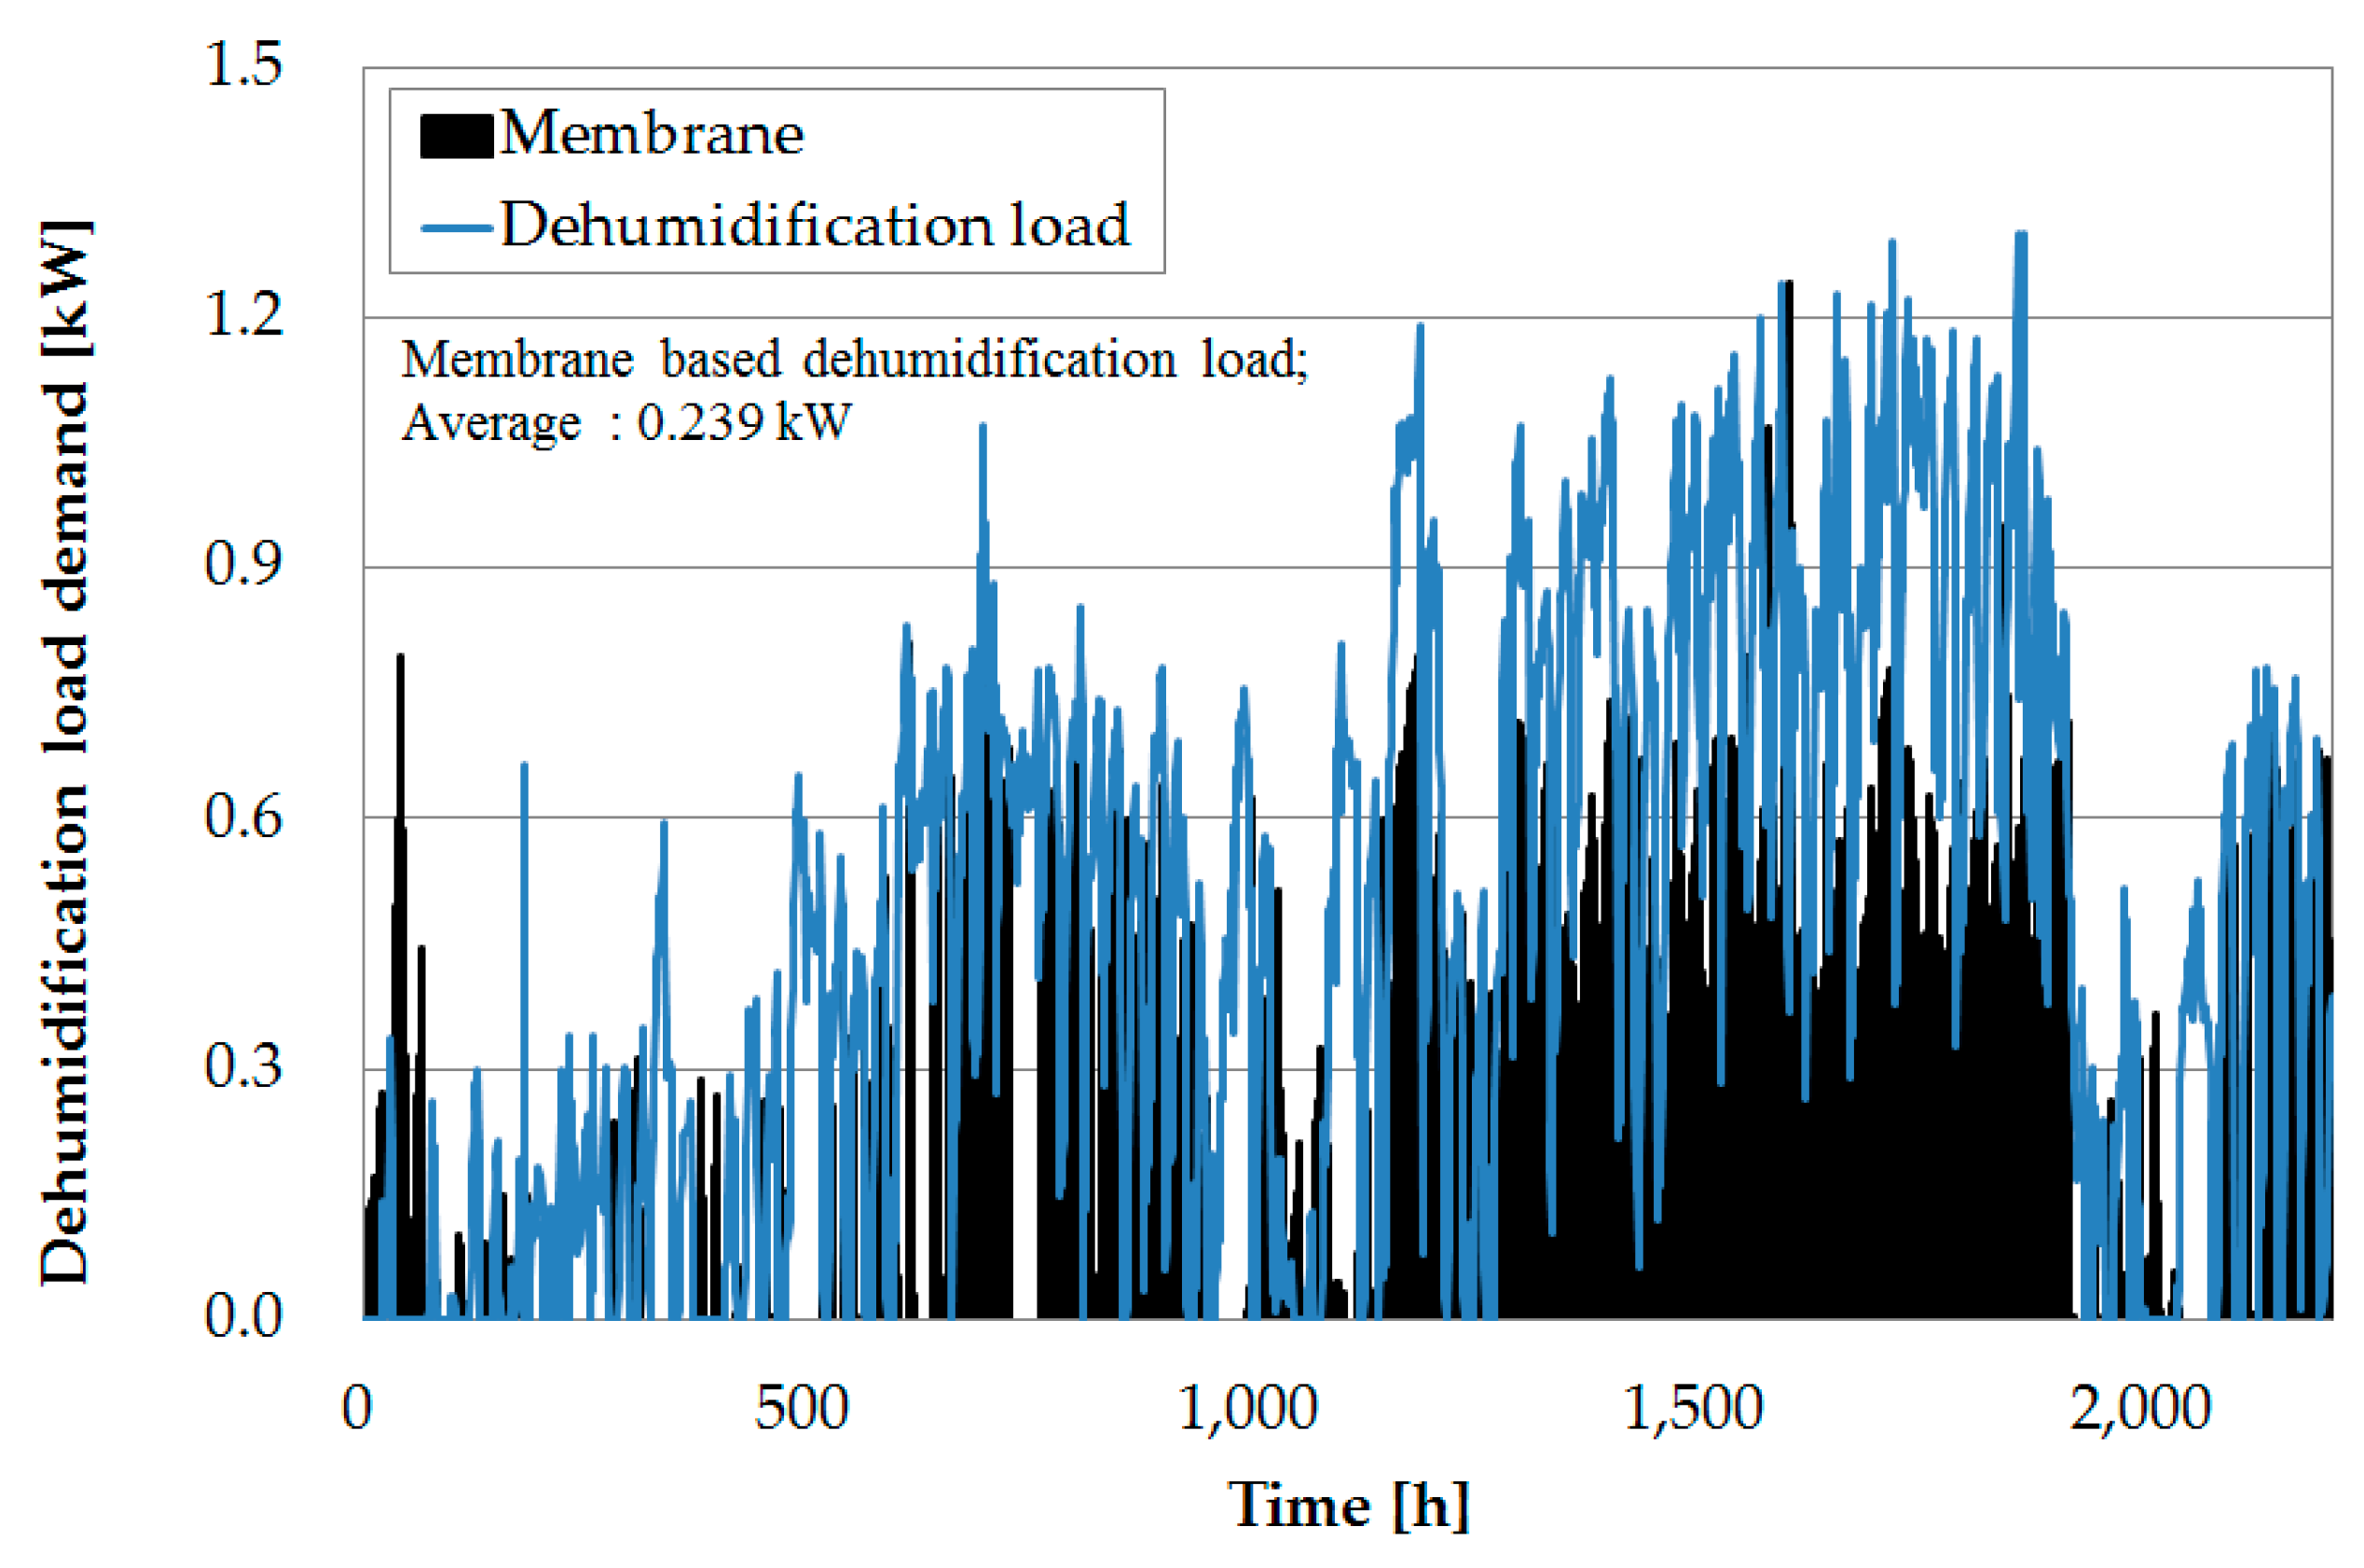
Figure 17 shows the simulation results for the case where the moist air is dehumidified using the membrane-based dehumidifier and flows into the load. The membrane-based dehumidifier helped to reduce the total dehumidification load to 527 kW, which was approximately half of the above value (Total dehumidification load).
Figure 13 and
Figure 14 show that the MDS uses very little energy when compared to ECD. This is because, in the case of ECD, additional cooling energy is required to maintain the temperature. However, the MDS can reduce energy consumption as it does not cause temperature changes.
5. Conclusions
This study constructed a dehumidification system using a hollow fiber membrane and evaluated the performance of this system by comparing it with the conventional ECD system in terms of energy demand. The dehumidification efficiency of the MDS was examined using a correlation equation that related the dry bulb temperature and the relative humidity. The pressure difference between the feed side (duct) and the permeate side was fixed at 5000 Pa, ensuring the optimal dehumidification quantity for power consumption. As the energy load increased, the available area of the membrane increased and the pressure increase appeared to be linear.
The simulation results are summarized as follows. When the dehumidification load was 1004.9 kW, the energy for cooling the elevated outlet temperature after the ECD operation was 1853.7 kW, which represented an approximately 84.5% increase due to the energy used in the dehumidifying load. In the case of dehumidification using the MDS under the same conditions, it was found that the energy used for dehumidification was 527 kW, which reduced the power consumption by 47.6%; when the outdoor-air was cooled, the energy demand for the proposed duration increased by about 0.33%.
Thus, the membrane-based dehumidification systems showed a better performance at dehumidification-free locations without temperature changes. Although the dry bulb temperature and the relative humidity varies from place to place, results similar to those achieved in this study can be obtained in places with similar conditions to hot summer continental climates (Dwa). In conclusion, the MDS is highly efficient as a dehumidification system and can be expected to save more energy in hotter, humid places.


