Article

Variations of PV Panel Performance Installed over a Vegetated Roof and a Conventional Black Roof

School of Architecture & Design, The University of Kansas, Lawrence, KS 66045, USA
*
Author to whom correspondence should be addressed.
Energies 2018, 11(5), 1110; https://doi.org/10.3390/en11051110
Submission received: 7 March 2018 / Revised: 24 April 2018 / Accepted: 26 April 2018 / Published: 1 May 2018
(This article belongs to the Special Issue PV System Design and Performance)

Abstract

:
The total worldwide photovoltaic (PV) capacity has been growing from about 1 GW at the beginning of the twenty-first century to over 300 GW in 2016 and is expected to reach 740 GW by 2022. PV panel efficiency is reported by PV manufacturers based on laboratory testing under Standard Testing Condition with a specific temperature of 25 °C and solar irradiation of 1000 W/m2. This research investigated the thermal interactions between the building roof surface and PV panels by examining the differences in PV panel temperature and energy output for those installed over a green roof (PV-Green) and those installed over a black roof (PV-Black). A year-long experimental study was conducted over the roof of an educational building with roof mounted PV panels with a system capacity of 4.3 kW to measure PV underside surface temperature (PV-UST), ambient air temperature between PV panel and building roof (PV-AT), and PV energy production (PV-EP). The results show that during the summer the PV-Green consistently recorded lower PV-UST and PV-AT temperatures and more PV-EP than PV-Black. The average hourly PV-EP difference was about 0.045 kWh while the maximum PV-EP difference was about 0.075 kWh, which represents roughly a 3.3% and 5.3% increase in PV-EP. For the entire study period, EP-Green produced 19.4 kWh more energy, which represents 1.4% more than EP-Black.

1. Introduction

The global building sector accounts for more than one-fifth of total worldwide energy consumption and is expected to increase by 38% from 2010 to 2040 [1]. Buildings in the United States consume 41% of primary energy in the country and 7% of total primary energy worldwide [2,3]. The challenge is that three-fourths of the world’s energy infrastructure heavily depends on fossil fuels. The challenge with fossil fuels as a source of energy is that they are considered a major producer of greenhouse gases and humans deplete them faster than they are generated. Although the worldwide fuel sources used to generate electricity have changed over the last decades, coal and natural gas accounted for more than 60% of the overall worldwide electricity production in 2010 [4].
Solar energy is a promising energy source that has received greater public attention in the last decade. The total worldwide installed photovoltaic (PV) capacity was about 1 GW in 2000 and it surpassed 138 GW of installed power in 2013 [1]. In 2014, around 40 GW of PV power was added to reach a global total capacity of 177 GW [5]. The total PV capacity exceeded 300 GW in 2016 with an addition of over 74 GW to the global capacity, which grew faster than any other fuel source [6,7]. The total global PV capacity is expected to reach 740 GW by 2022 [6].
Building roofs in general are ideal spaces for solar technology because they are usually larger in size, contiguous, and have minimal shade. Also, when electricity is generated on the roof and consumed in the building, the average losses of 7% from transmission and distribution lines can be avoided [8]. According to the National Renewable Energy Laboratory (NREL), rooftop mounted systems accounted for 74% of the installed PV generation capacity in the United States in 2008 [9]. According to the U.S. Energy Information Administration (EIA), the electricity generation from solar power in the building sector was around 5000 GWh in 2010 and reached around 15,000 GWh in 2015 and is expected to reach 100,000 GWh in 2040 [10].
The growth in the PV market is due to several factors; such as government incentives, environmental concerns, and increase in PV efficiency and decrease in cost [11,12,13]. The conversion efficiency of crystalline silicon, which represents over 85% of the market share, is 20% to 27%. The conversion efficiency of a PV module is tested in laboratories under a controlled environment using a specific procedure called Standard Test Conditions (STC). Standard Test Conditions create uniform test conditions which make it possible to conduct uniform comparisons of photovoltaic modules by different manufacturers. Ratings under the STC involve a constant temperature of 25 °C, a constant solar irradiance of 1000 W/m2, and a constant sunlight spectrum of AM (air mass) 1.5 G (global). However, the conversion efficiency of field installed PV modules is lower than that measured under the STC due to several factors, such as: electrical circuit resistance, dirt and dust accumulation, shade, a range of operating temperatures, solar irradiances, and sunlight spectra. The operation temperature of PV modules has an impact on the conversion efficiency. Therefore, PV manufacturers publish temperature coefficients relating losses in efficiency for each degree the temperature fluctuates from the base of 25 °C.
There are several roofing types that have a range of thermal performance. Conventional roofing materials during summer months can reach temperatures of 80 °C while a green roof, also known as vegetated roof, stays below 50 °C [14]. Green roof temperatures depend on the roof’s composition, moisture content, geographic location, and solar exposure [15]. Most green roof surfaces stay cooler than conventional rooftops under summertime conditions because of plant shading and evapotranspiration. Conventional roofing materials have higher surface temperatures during summertime because the material’s solar reflectance ranges between 5% and 25%, which means 75–95% of the Sun’s energy is absorbed [16]. An experimental study conducted in Chicago, IL during the summer compared the roof surface and ambient air temperatures of a green roof to a conventional roof and it found that the ambient air temperature over the conventional roof measured about 45.5 °C while the green roof was 41.6 °C. The green roof surface temperature ranged from 32.7 °C to 48.3 °C while the black roof was 76 °C [17].
PV panels installed over building roofs have a thermal interaction with the roof surface. This study investigated the thermal interactions between PV panels and roof surface for PV panels installed over a green roof and PV panels installed over a conventional roof. The PV panels over both roof types were the same type, with the same height, tilt, racking system, and inverter. The main goal is to quantify the differences in PV operation temperatures and energy out-put as an impact of different roofing materials. A few studies have examined the impact of roofing choice on the performance of PV panels. Several of these studies, such as the studies of [18,19,20] compared the performance of PV panels over green roofs with PV panels over black roofs while the studies of [21,22] compared the performance of PV panels over green roofs with PV panels over gravel roofs. These works report that PV panels installed over a green roof have output increase ranging from 0.5% to 4.8% in reference to PV panels over conventional roofing materials; however, none of these works had compared full scale identical installation over a long period of time. Both studies of [18,20] conducted a long term study with full scale installations but in ref. [18] study the PV panels were not identical in terms of number and type and in ref. [20] study the distances from the roof surface to the PV panels were not identical. The experiment measurements for ref. [22] study were conducted for a couple of months and for [19] the study was conducted only for several hours. Also, the PV panel installations in [21,22] studies were at laboratory scale. This study improves on previous literature by quantifying the relationship between roof surface temperatures and PV electrical output by comparing the performance of PV-Green and PV-Black through a 12-month experiment with the same PV panel type, tilt, inverter, racking system, and heights. Investigating the performance of PV-Green and PV-Black through an experimental study will help to fill the lack of quantitative data that identifies the impact of roofing materials on the performance of PV panels.

2. Method

2.1. Experimental Bed Setting

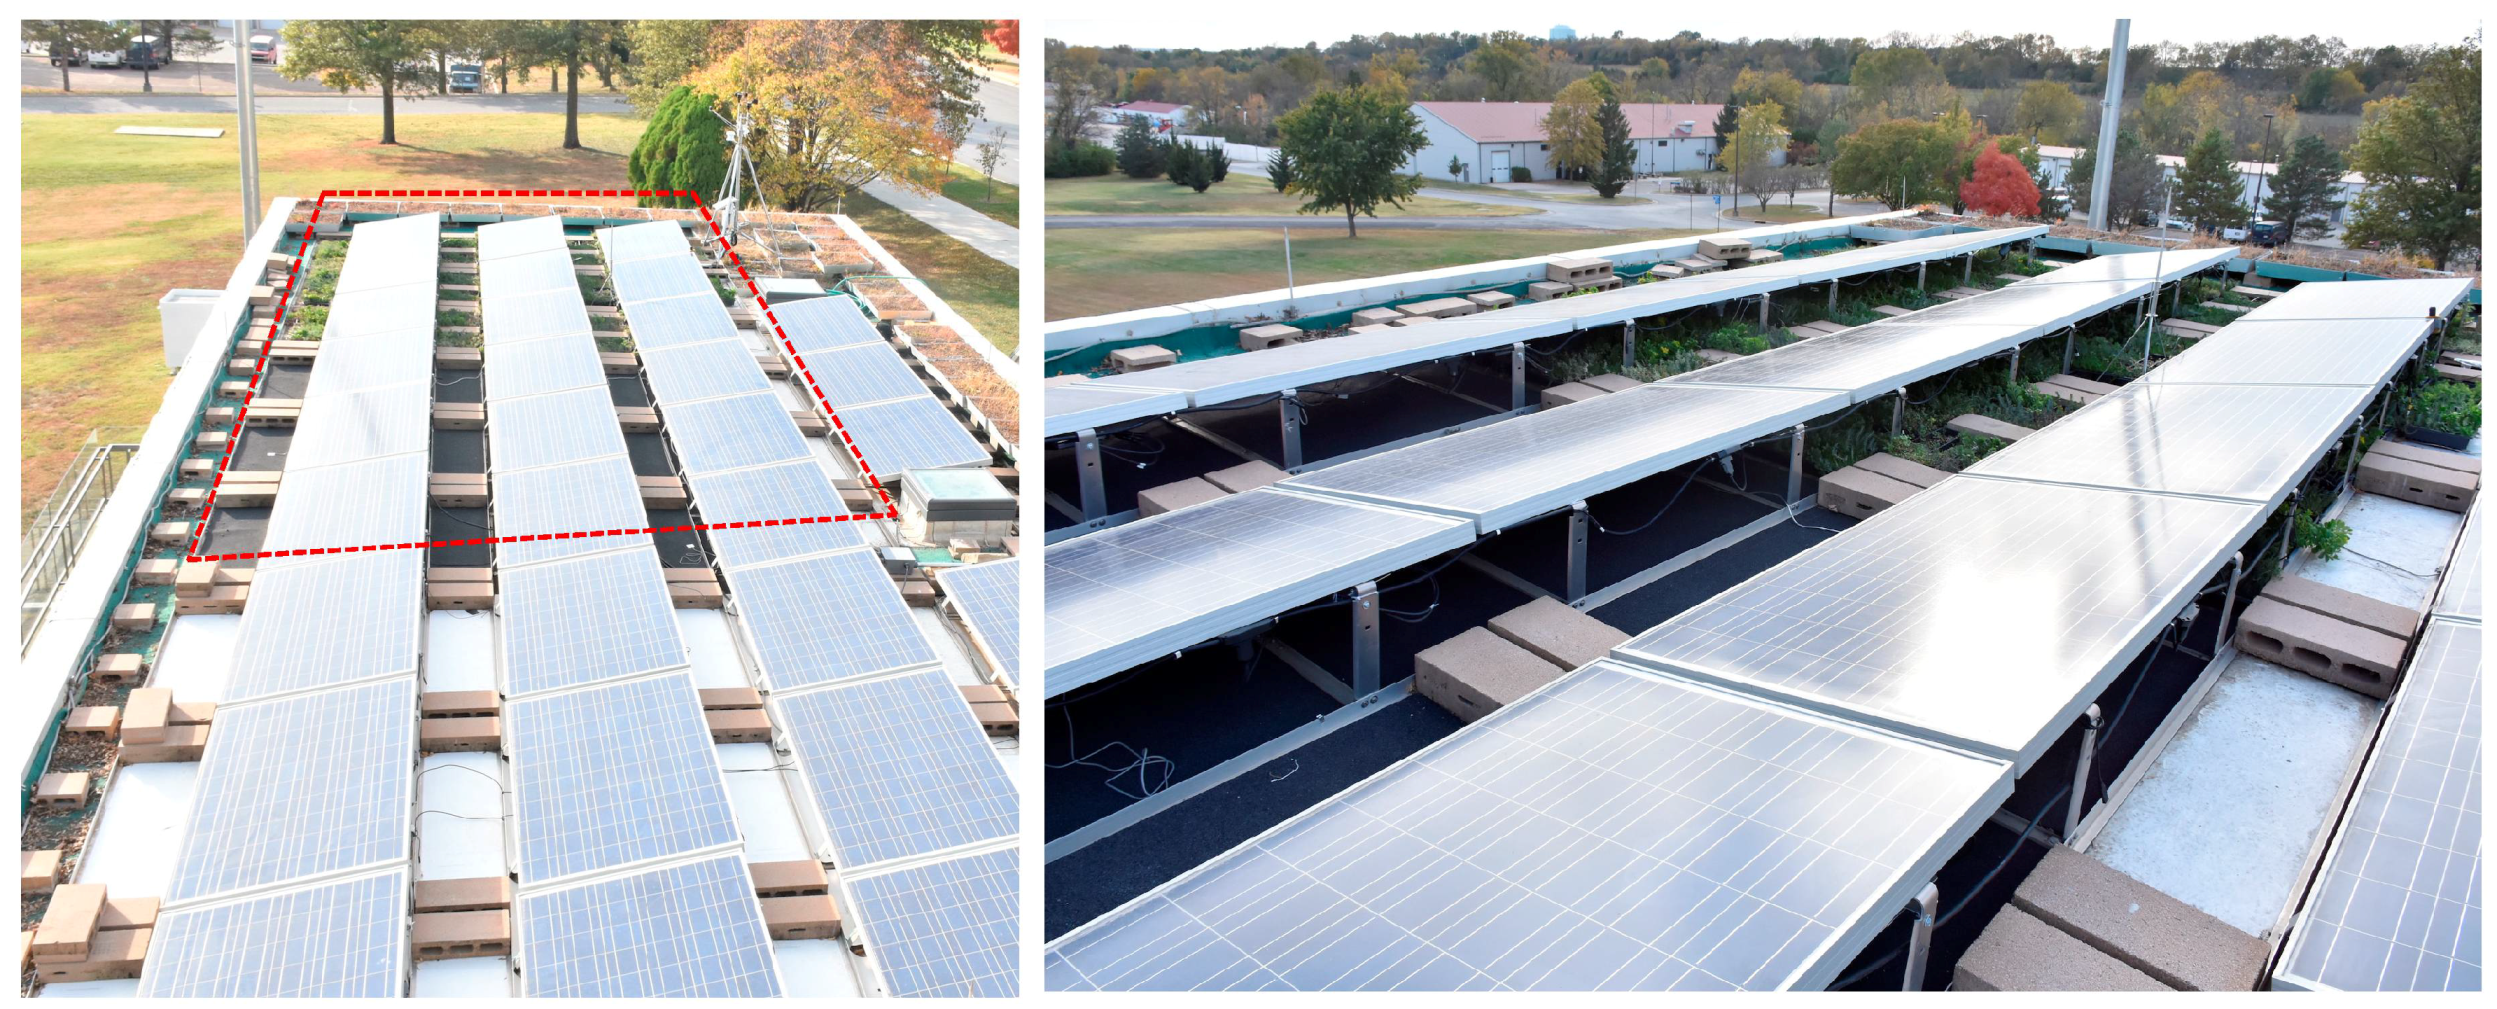
A field experimental study was conducted to investigate the thermal interaction between building roofing materials and PV panels. This research examined the performance of PV panels over a green roof (PV-Green) to the performance of PV panels over a black roof (PV-Black). The roof of the Center for Design Research (CDR) at the University of Kansas in Lawrence, Kansas, USA was used to conduct the study. The CDR has roof mounted Yingi Solar 235 W PV panels. The total system capacity is 4.23 kW. Nine panels are over a green roof and nine others are over a black roof as shown in Figure 1. The PV modules’ electrical features are presented in Table 1. The tilt angle for all the panels was fixed at 10° facing south. The PV panel dimensions are 1.65 m by 0.99 m and mounted in landscape orientation. The height of the panels’ bottom frame, with respect to the roofing system, is 0.2 m. The distance between each row of PVs is 0.4 m.
The green roof portion is a tray-based green system. Concerns were raised regarding the survival of the vegetated roof under the PV panels. The native sedum plants that were selected need a minimal amount of solar radiation and irrigation. There were no major issues with the plants growing under the PV panels. The black roof membrane is a bitumen membrane. The roof configuration is shown in Figure 2. Enphase M250 Microinverters were installed under each PV panel to monitor the energy production of each individual solar panel. Enphase Energy Inc. is an energy technology company headquartered in Petaluma, CA, USA. The Enphase Microinverter specifications are presented in Table 2.

2.2. Data Aquisition

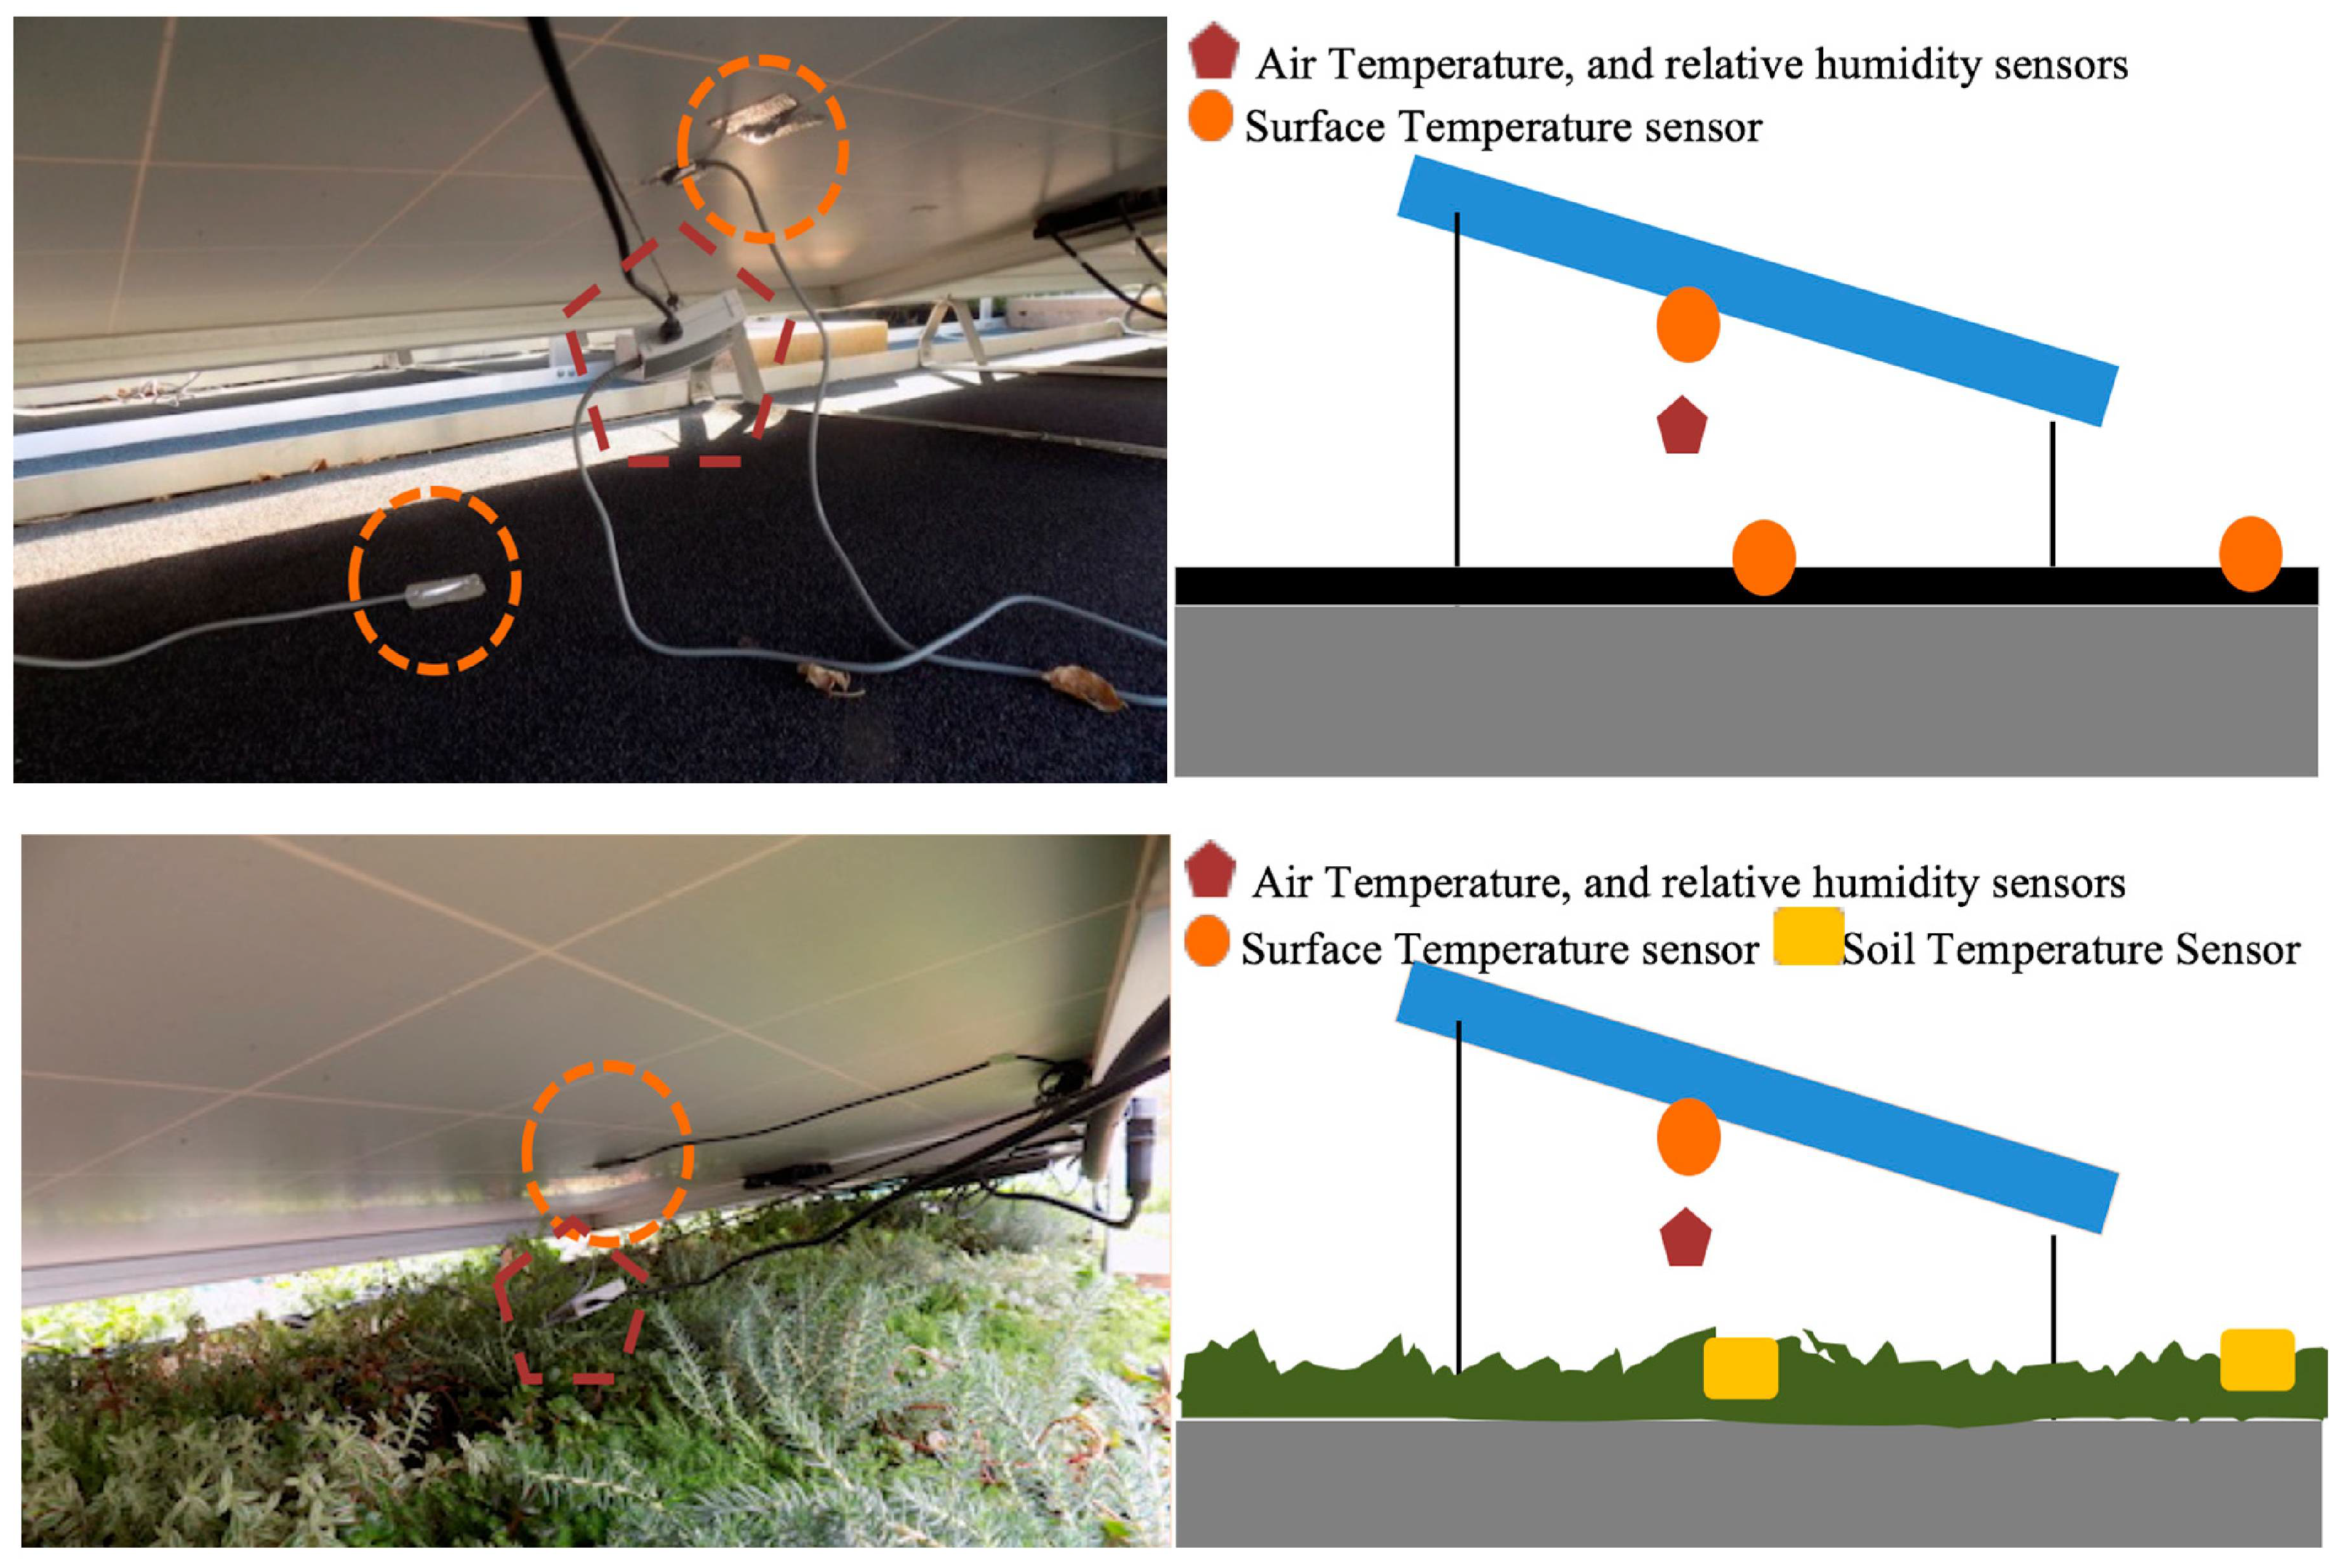
An Onset HOBO U30 weather station was installed over the CDR roof to record data on wind speed and direction, solar radiation, ambient temperature, and relative humidity. In addition, Onset HOBO U12 data loggers were mounted under each panel to measure ambient air temperature, roof surface temperature, relative humidity, and PV panel underside surface temperature. The data acquisition technical specifications are listed in Table 3. The PV underside surface temperature (UST) sensors were attached at the center of each PV panel. The ambient temperature (AT) sensors were placed at the center of each PV panel between the roof surface and the PV panel. The roof surface temperature (RST) sensors were also placed at the center of each PV panel and not exposed to direct solar irradiation. The green roof soil temperature and moisture content were monitored using Onset Hobo soil temperature sensors and EC-5 smart sensors. The sensor locations and types are shown in Figure 3. All monitored data were collected every five minutes; however, the data were averaged hourly to minimize the effects caused by sudden changes in wind speed or passing clouds.

2.3. Calibration Tests

Calibration tests were performed for two months (June and July) to verify that the experimental bed had similar thermal performance before applying any treatment. The ambient temperature (AT), underside surface temperature (UST), and PV panel power output of each panel were measured prior to any treatments. For the pre-treatment test period, the sensors were placed at the same locations that are shown in Figure 3. The ambient temperatures (AT) under the PV panels had small differences during the peak of hot days but were otherwise similar. Since temperature fluctuation happens only when high temperatures occur, the average ambient temperature of days with high temperatures were selected to quantify the fluctuation difference. For the majority of the pre-treatment test period, all the monitoring points recorded almost the same ambient temperature with maximum differences of less than 1 °C. During days with high ambient temperature, the differences in ambient temperature happened during the peak of the day with an average difference of less than 2 °C. The maximum average temperature was 37.6 °C and the minimum average temperature was 35.9 °C, which means that all the monitoring points fit between these two values. The difference between the maximum and minimum temperature is about 1.7 °C. The peak differences occurred during the hottest day of the pre-treatment test period. This test verified that the experimental bed performed almost similarly before any treatments were applied.

3. Results

3.1. Overall Performance Analysis

The performance of PV-Green was compared with the performance of PV-Black to measure the hourly energy production (EP), ambient temperature (AT), and underside surface temperature (UST) differences for an entire year. The hours of the year that EP-Green produced more power than EP-Black are shown in Figure 4. The average hourly energy production difference was about 45 Wh while the maximum energy production difference was about 75 Wh, which represents roughly a 3.3% and 5.3% increase in energy production. The fluctuations in power output happened more during hot days and the maximum differences occurred during the day’s peak temperature. EP-Green produced more energy for a few hours during the cold days than EP-Black with an average difference of about 30 Wh, which represents about a 2.4% increase in energy production.
The hours of the year that AT-Black recorded higher ambient temperatures than AT-Green are shown in Figure 5. The average hourly ambient temperature difference was about 2.5 °C whereas the maximum ambient temperature difference was about 5 °C. Similar to the energy production, the fluctuations in ambient temperature happened more during hot days, and the maximum differences occurred during the peak temperature of the day.
The hours of the year that UST-Black recorded higher underside surface temperature than UST-Green are show in Figure 6. The average hourly underside surface temperature difference was about 3 °C whereas the maximum underside surface temperature was approximately 6 °C. The underside surface temperature differences are consistent with the ambient temperature differences. The maximum differences happened during the peak temperature of the day. As shown in the figure, for a few hours during the cold days, UST-Black’s underside surface temperature was higher than UST-Green. The average difference during cold days was about 1 °C.
The previous figures show the correlation between the differences in air and underside surface temperature and PV energy production. However, the differences in the temperatures do not always impact the energy production differences as explained in the following detailed performance analysis. There are hours of the year that recorded temperature differences between the two roofing types and the differences in energy production were minimal. It is also important to mention that a couple of days in early May and late August have slightly higher temperature differences, but fewer differences in energy production. During these specific periods, some work took place over the building roof that cast shade over some of the PV panels for an extended period of time. In addition, the percentage of energy production differences during cold periods, like December, seemed to be high because the actual energy production was low and small differences recorded a high percentage. For about 6% of the year, EP-Black was slightly higher than EP-Green by an average of 15 Wh. These occurrences were scattered throughout the day but did not occur during the day’s peak times. The average ambient temperature difference was 0.3 °C and the average underside surface temperature difference was 0.8 °C.

3.2. Detailed Performance Analysis

Detailed analyses for several days represent the peak and the average differences throughout the year in energy production and thermal performance. Previous figures show only the energy production, ambient temperature, and underside surface temperature differences. Therefore, this section studies in detail the trends in energy production and temperature change over time. The time period selected for the detailed performance analysis was based on the times that showed the peak, average, and lowest performance differences.
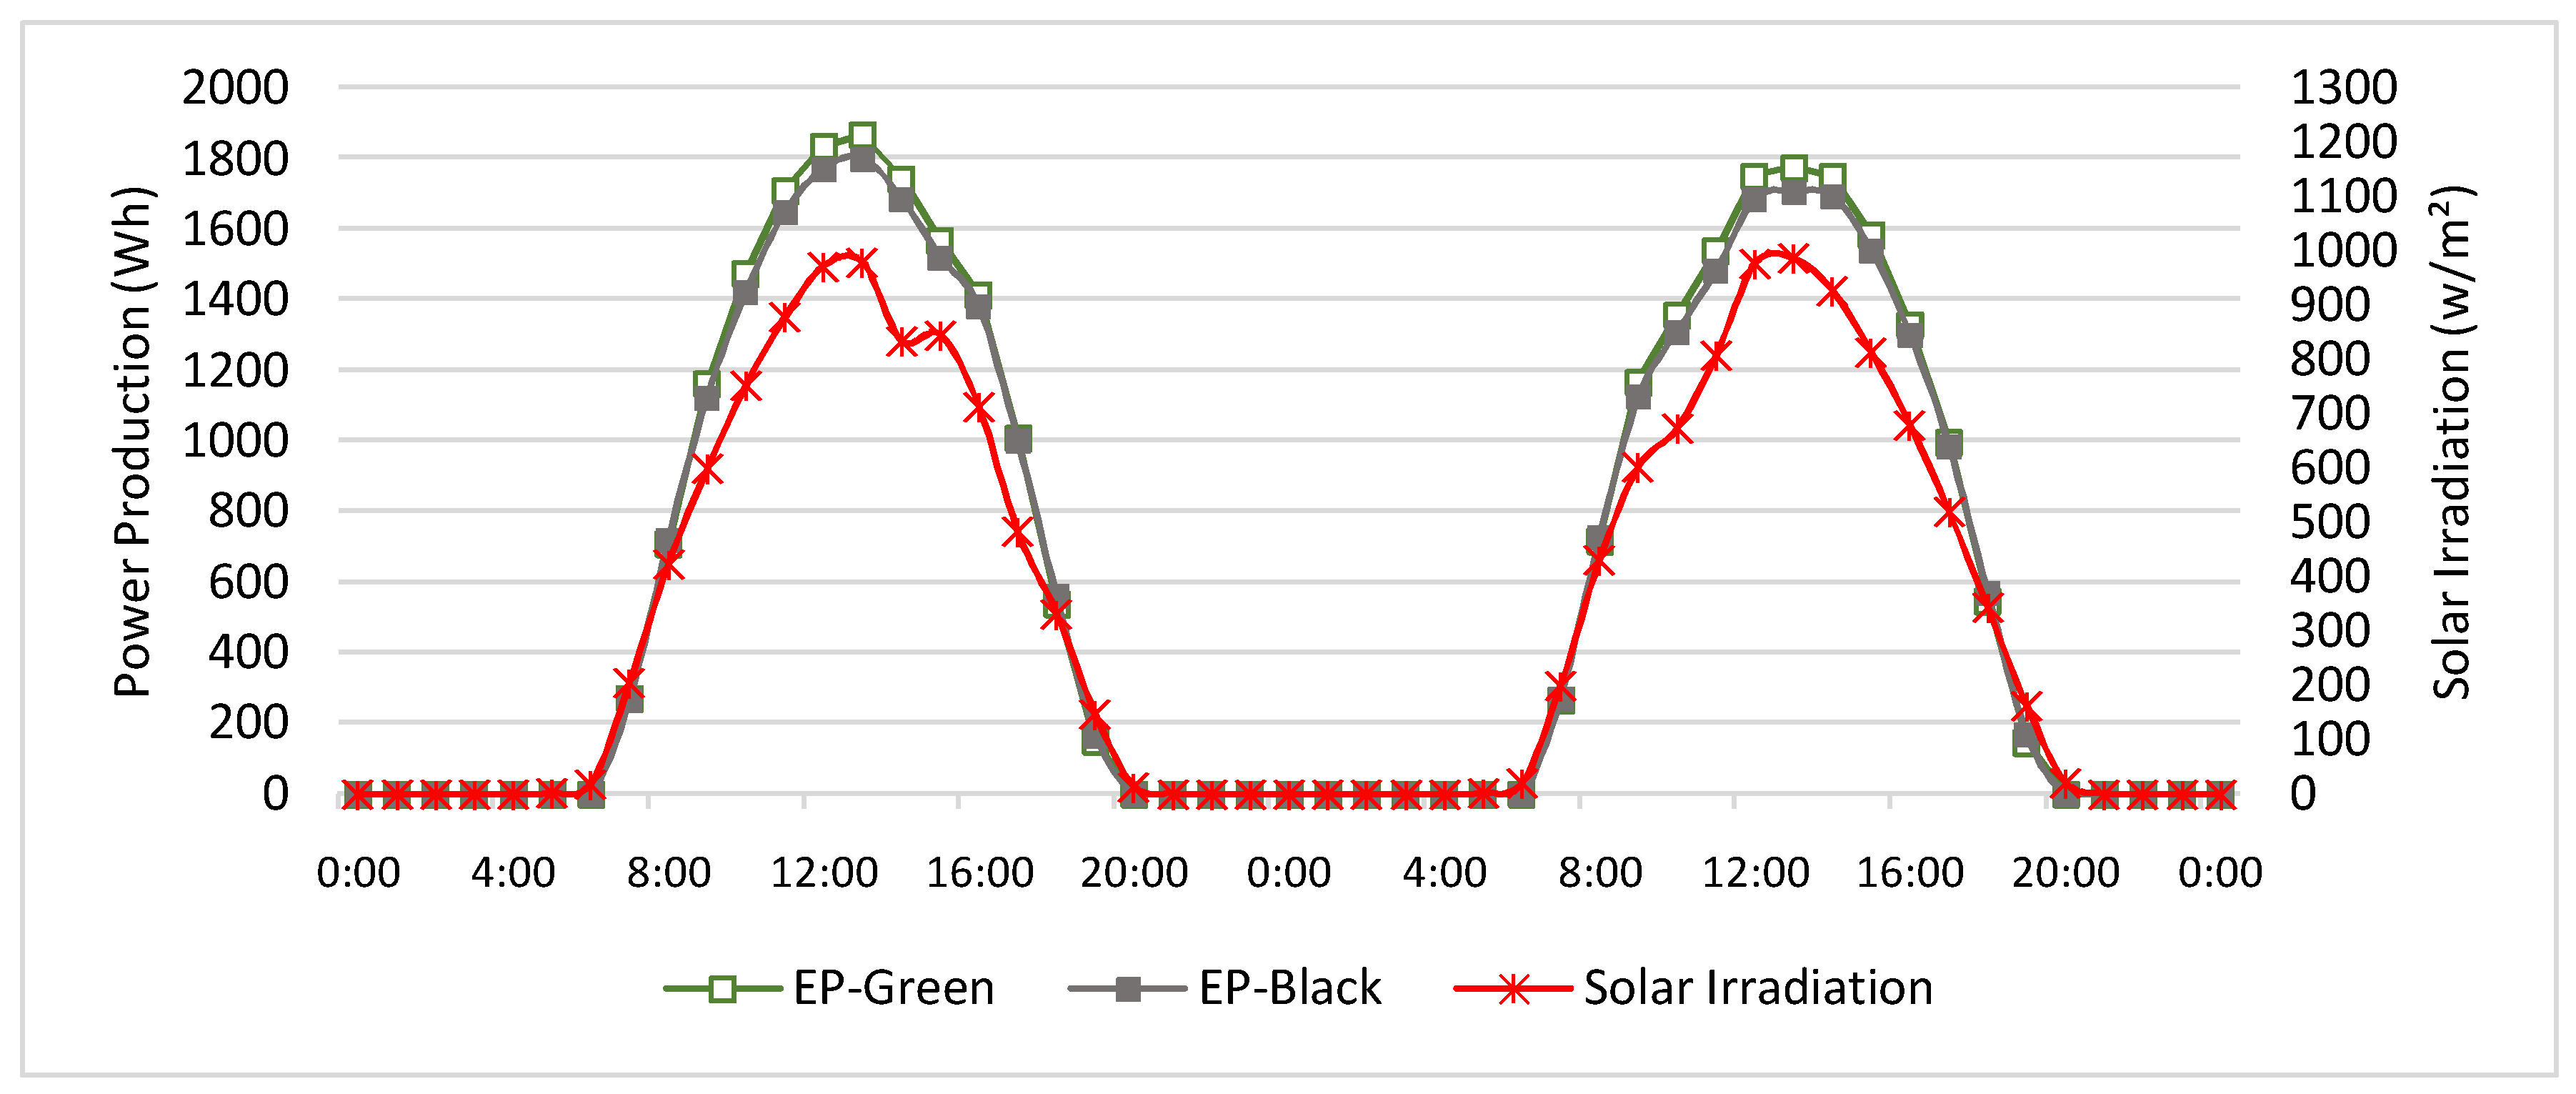
Figure 7 shows the energy production profiles for two days, 4–5 June. On the first day, the maximum energy production by EP-Green at peak hours was 1868 Wh, and EP-Black was 1801 Wh. On the second day, the maximum energy production by EP11-Green at peak hours was 1777 Wh, and EP17-Black was 1707 Wh. The energy production profiles show maximum temperature differences of roughly 67 Wh and 70 Wh at the peak production for the first day and the second day, respectively. This translates to differences of 3.7% and 4.1% between EP-Green and EP-Black in the peak energy production values. The solar irradiation and energy production profiles show similar patterns. The peak solar irradiation values were 972 W/m2 on the first day and 976 W/m2 on the second day.
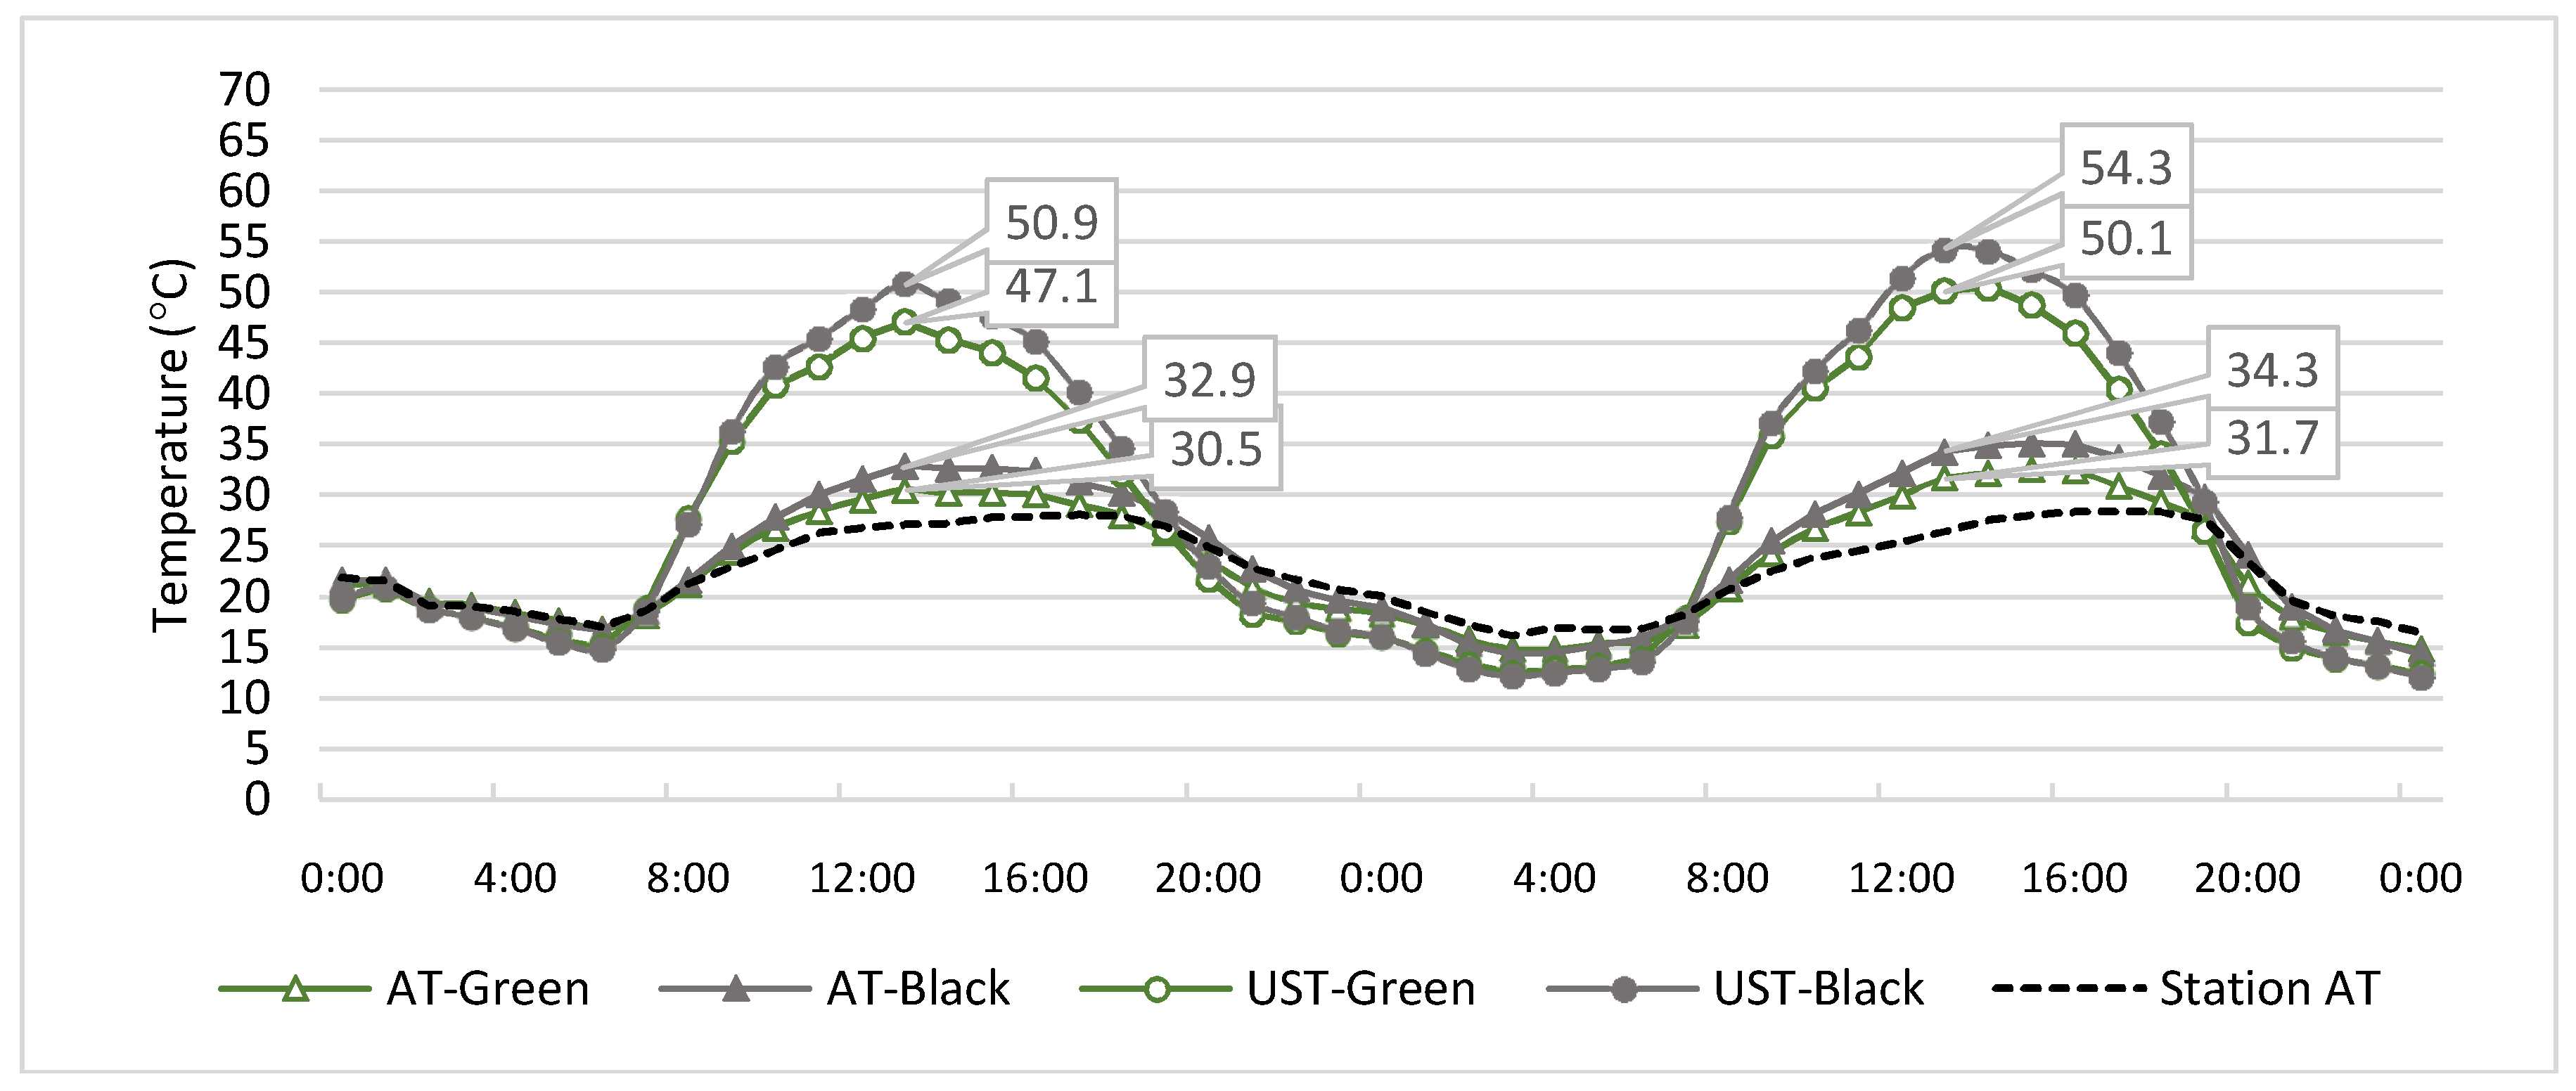
The ambient temperature and the underside surface temperature comparisons between the AT Green and the AT-Black and between UST-Green and the UST-Black are shown in Figure 8. On the first day, the ambient temperature profiles at the peak show a maximum temperature difference of 2.4 °C. The AT-Green reached a peak temperature of 30.5 °C whereas the AT-Black reached a peak temperature of 32.9 °C. The ambient temperature from the weather station (Station AT) was 27.2 °C. The AT-Green and the AT-Black at the peak were 3.3 °C and 5.7 °C hotter than Station AT, respectively. The underside surface temperature profile shows maximum temperature differences of 3.8 °C at the peak temperature. The UST-Green and the UST-Black reached a peak temperature of 47.1 °C and 50.9 °C. On the second day, the ambient temperature profiles at the peak show a maximum temperature difference of 2.6 °C. The AT-Green reached a peak temperature of 31.7 °C, whereas the AT-Black reached a peak temperature of 34.4 °C. The ambient temperature from the weather station was 27.6 °C. The AT-Green and the AT-Black at the peak were 4.1 °C and 6.8 °C hotter than Station AT, respectively. The underside surface temperature profile shows maximum temperature differences of 4.2 °C at the peak temperature. The UST-Green and the UST-Black reached a peak temperature of 50.1 °C and 54.3 °C.
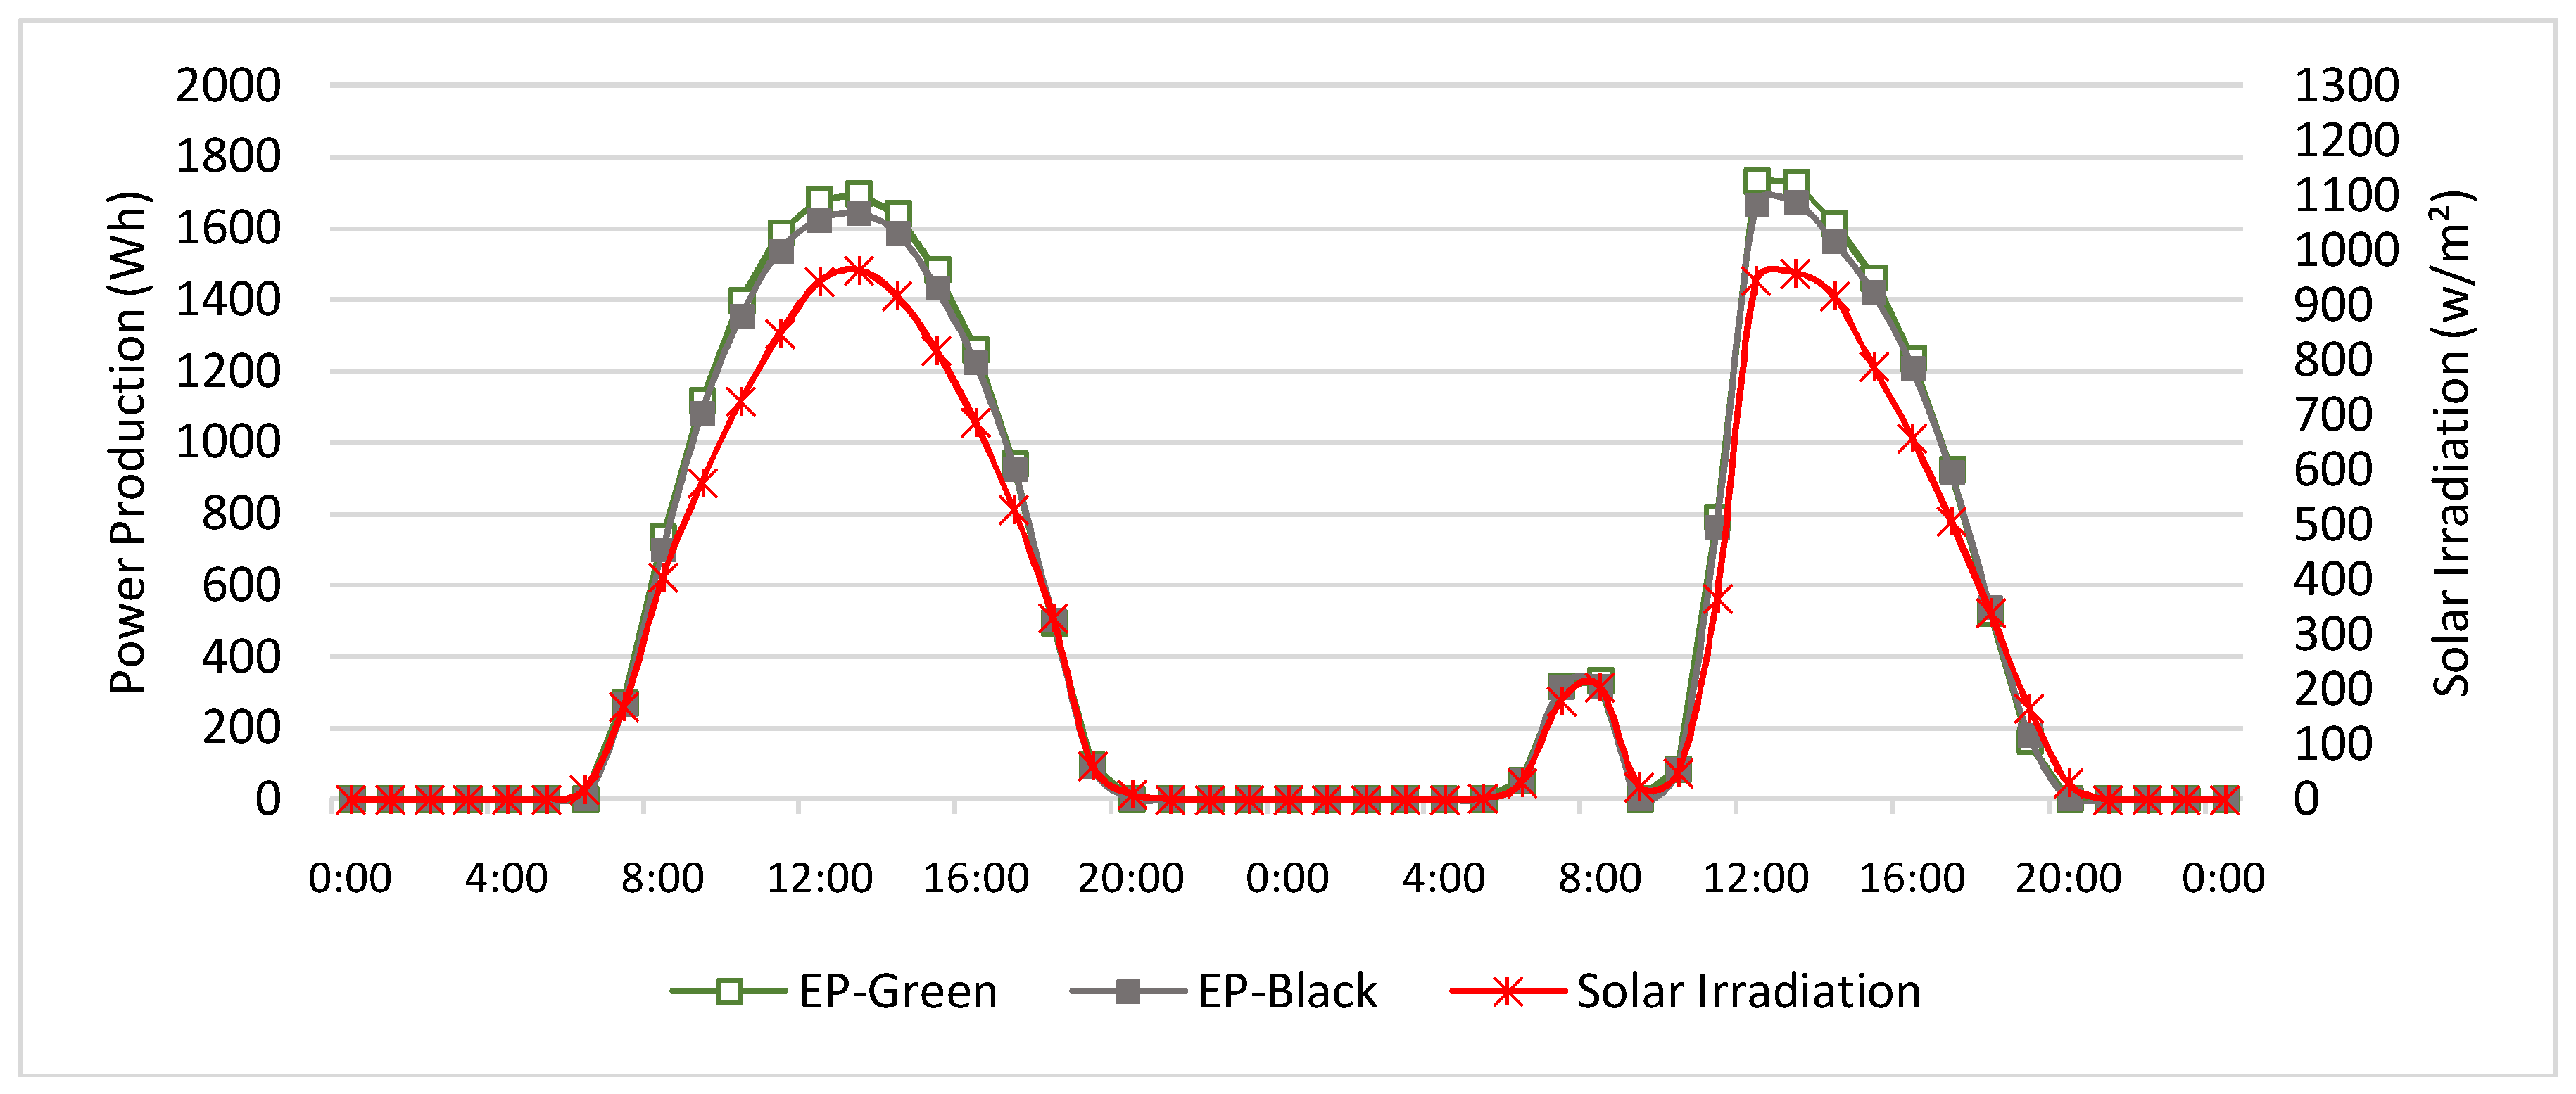
The energy production profiles for 15–16 June are shown in Figure 9. On the first day, the maximum energy production by EP-Green at peak hours was 1695 Wh, and EP-Black was 1641 Wh. On the second day, the maximum energy production by EP-Green at peak hours was 1733 Wh, and EP-Black was 1666 Wh. The energy production profiles show maximum temperature differences of about 54 Wh and 67 Wh at the peak production for the first day and the second day, respectively. This translates to differences of 3.3% and 4% between EP-Green and EP-Black in peak energy production values. The solar irradiation and energy production profiles show similar patterns and the peak solar irradiation values were 964 W/m2 on the first day and 959 W/m2 on the second day.
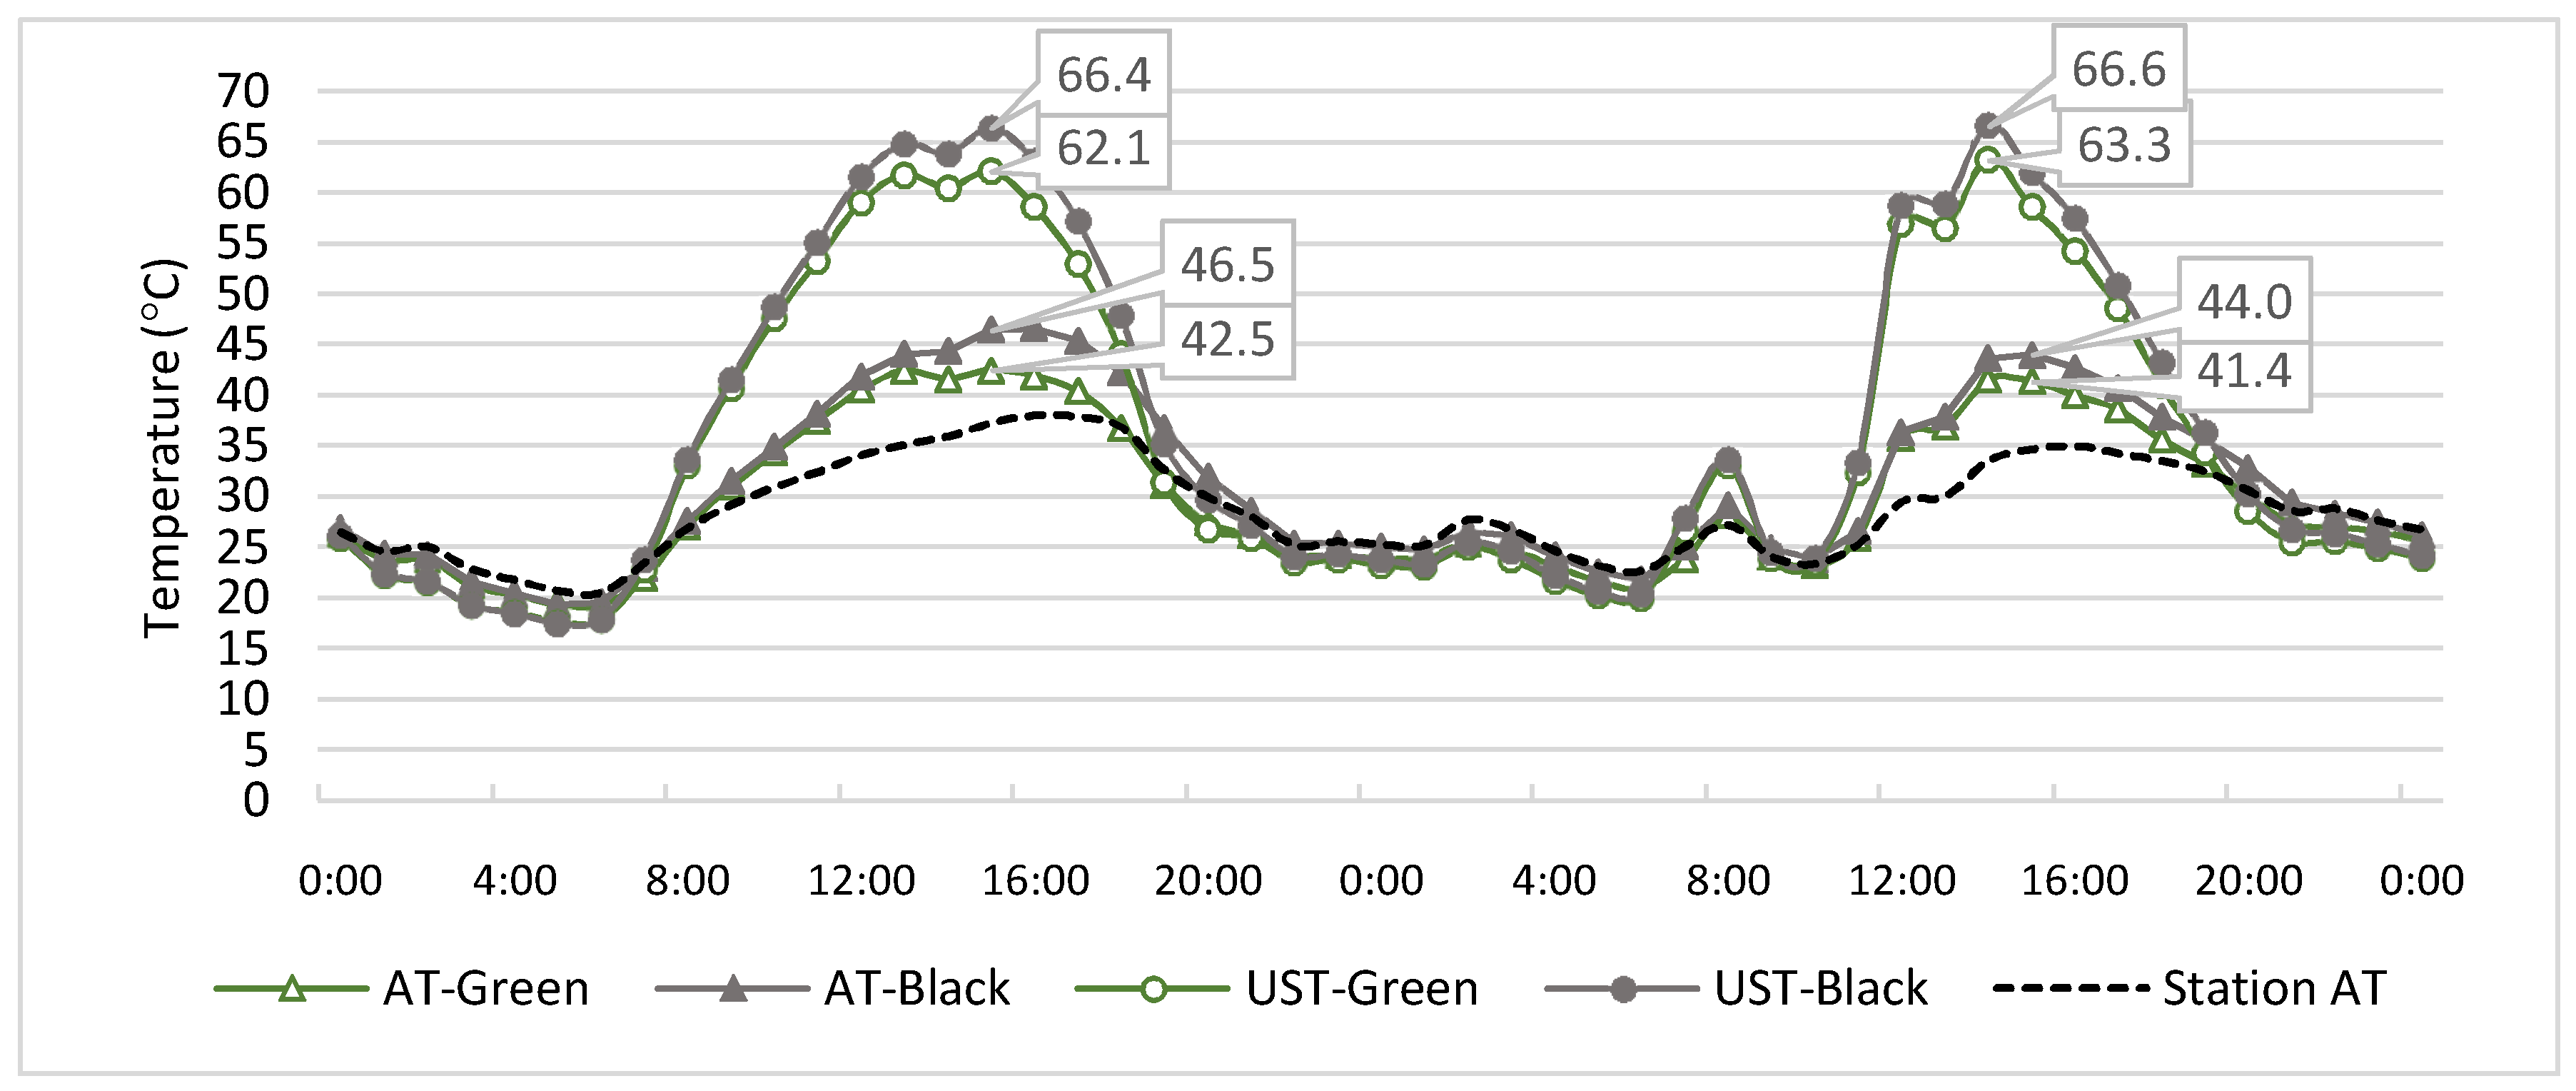
The ambient temperature and underside surface temperature comparisons between the AT-Green and AT-Black and between UST-Green and the UST-Black are shown in Figure 10. On the first day, the ambient temperature profiles at the peak show a maximum temperature difference of 4 °C. The AT-Green reached a peak temperature of 42.5 °C while the AT-Black reached a peak temperature of 46.5 °C. The ambient temperature from the weather station was 37.2 °C. The AT-Green and the AT-Black at the peak were 5.3 °C and 9.3 °C hotter than Station AT, respectively. The underside surface temperature profile shows maximum temperature differences of 4.3 °C at the peak temperature. The UST-Green and UST-Black reached a peak temperature of 62.1 °C and 66.4 °C, respectively. On the second day, the ambient temperature profiles at the peak show a maximum temperature difference of 2.6 °C. The AT-Green reached a peak temperature of 41.5 °C whereas the AT-Black reached a peak temperature of 44 °C and the ambient temperature from the weather station was 34.7 °C. The AT-Green and AT-Black at the peak were 6.8 °C and 9.3 °C hotter than Station AT. The underside surface temperature profile showed a maximum temperature difference of 3.3 °C at the peak temperature. The UST-Green and the UST-Black reached a peak temperature of 63.3 °C and 66.6 °C, as evidenced in the data.
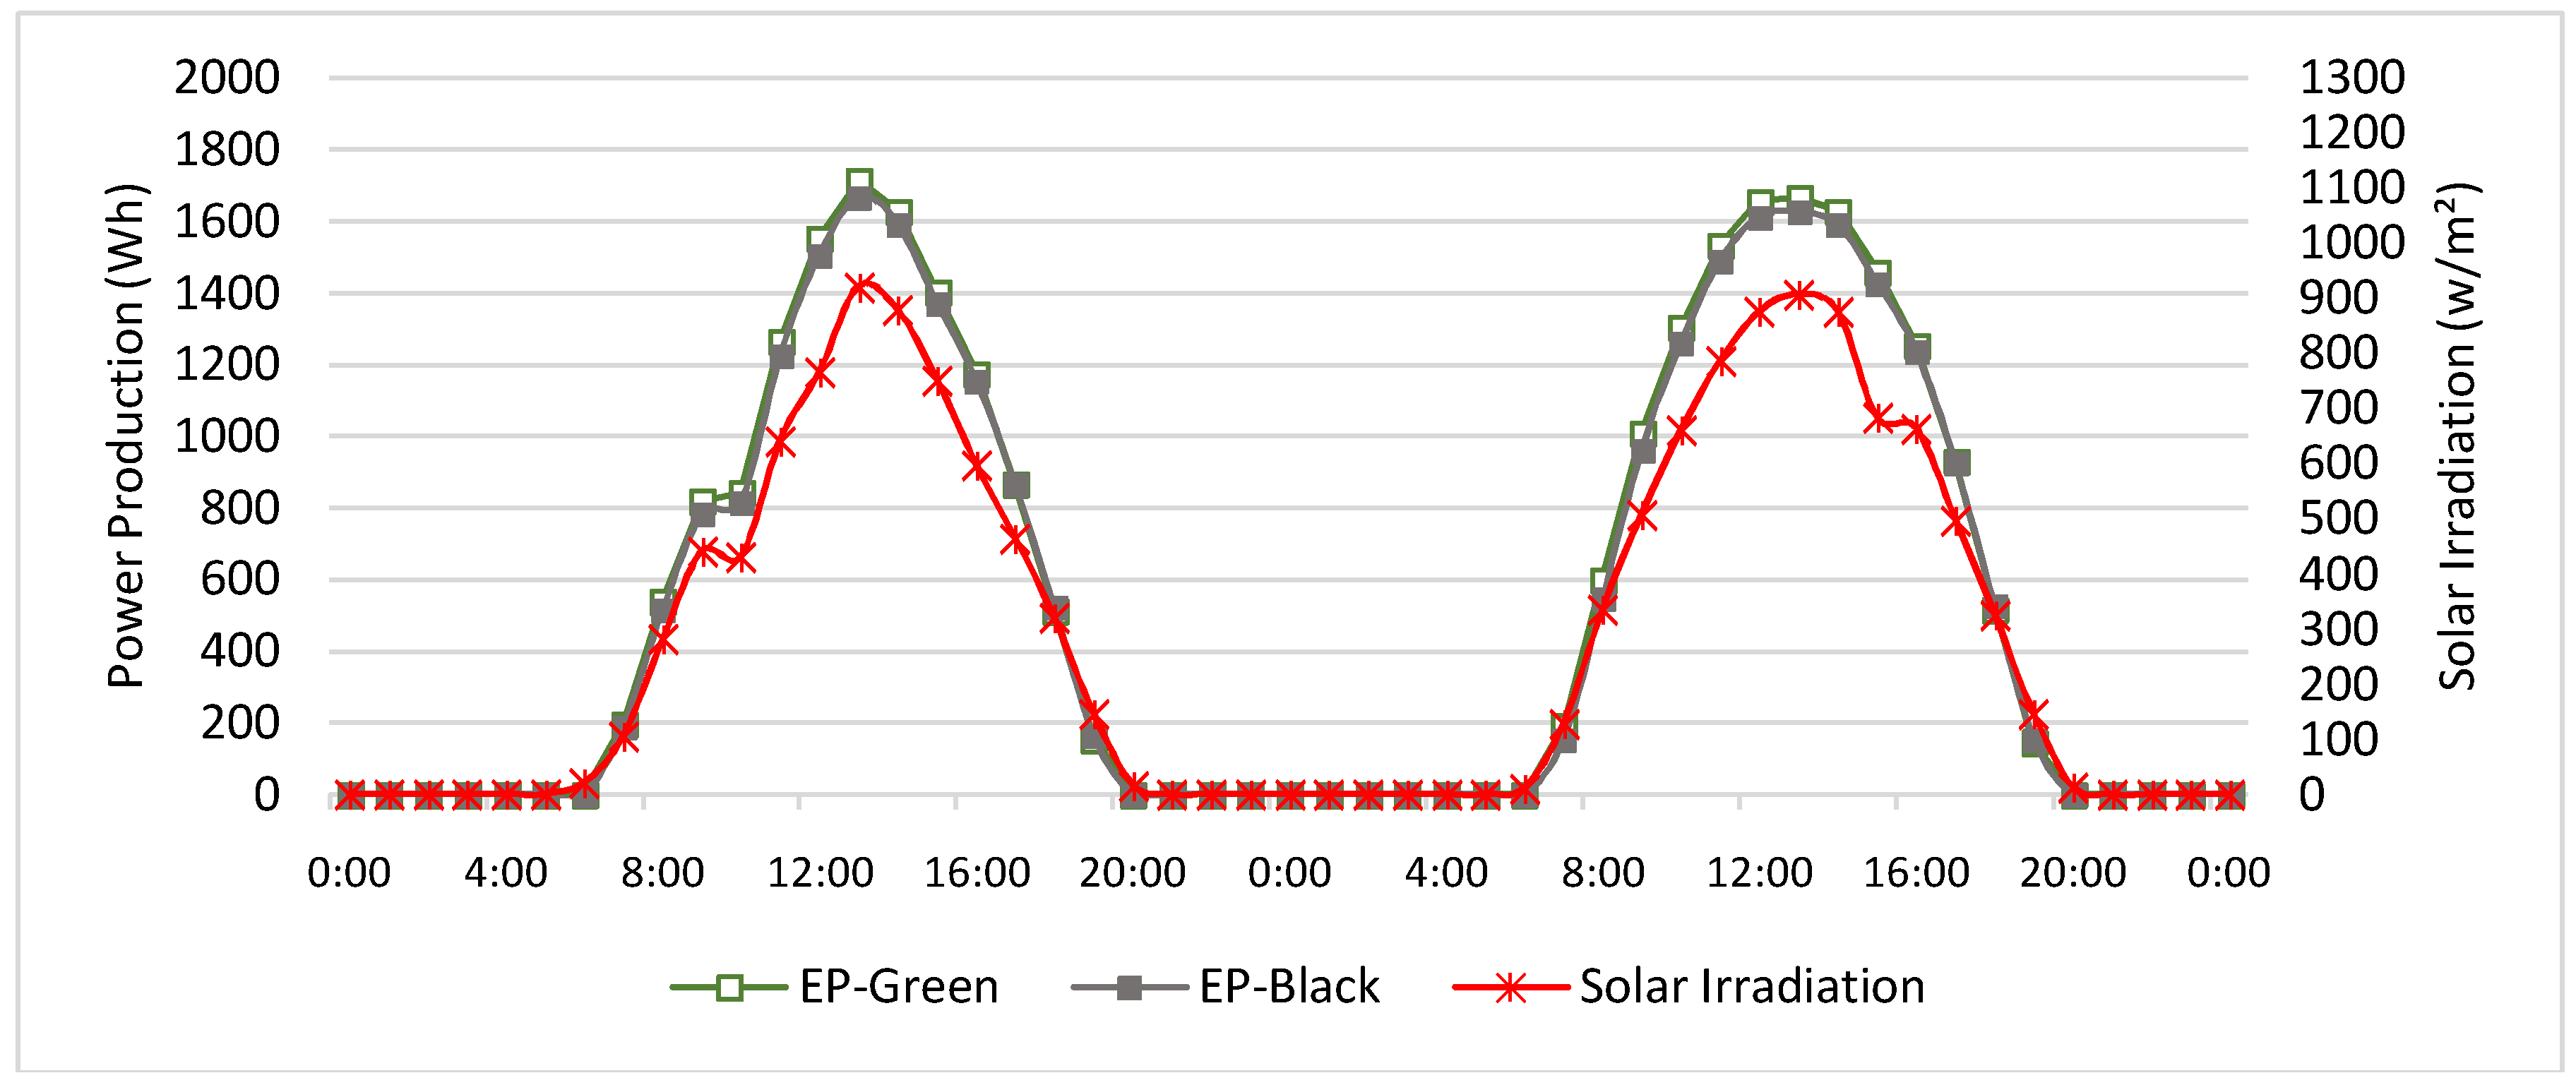
The energy production profiles for 19–20 July are shown in Figure 11. On the first day, the maximum energy production by EP-Green at peak hours was 1715 Wh, and EP-Black was 1698 Wh. On the second day, the maximum energy production by EP-Green at peak hours was 1667 Wh, while EP-Black was 1627 Wh. The energy production profiles show maximum temperature differences of about 47 Wh and 40 Wh at the peak production for the first day and the second day, respectively. This translates to differences of 2.8% and 2.5% between EP-Green and EP-Black in the peak energy production values. The solar irradiation and energy production profiles show similar patterns and the peak solar irradiation values were 922 W/m2 on the first day and 908 W/m2 on the second day.
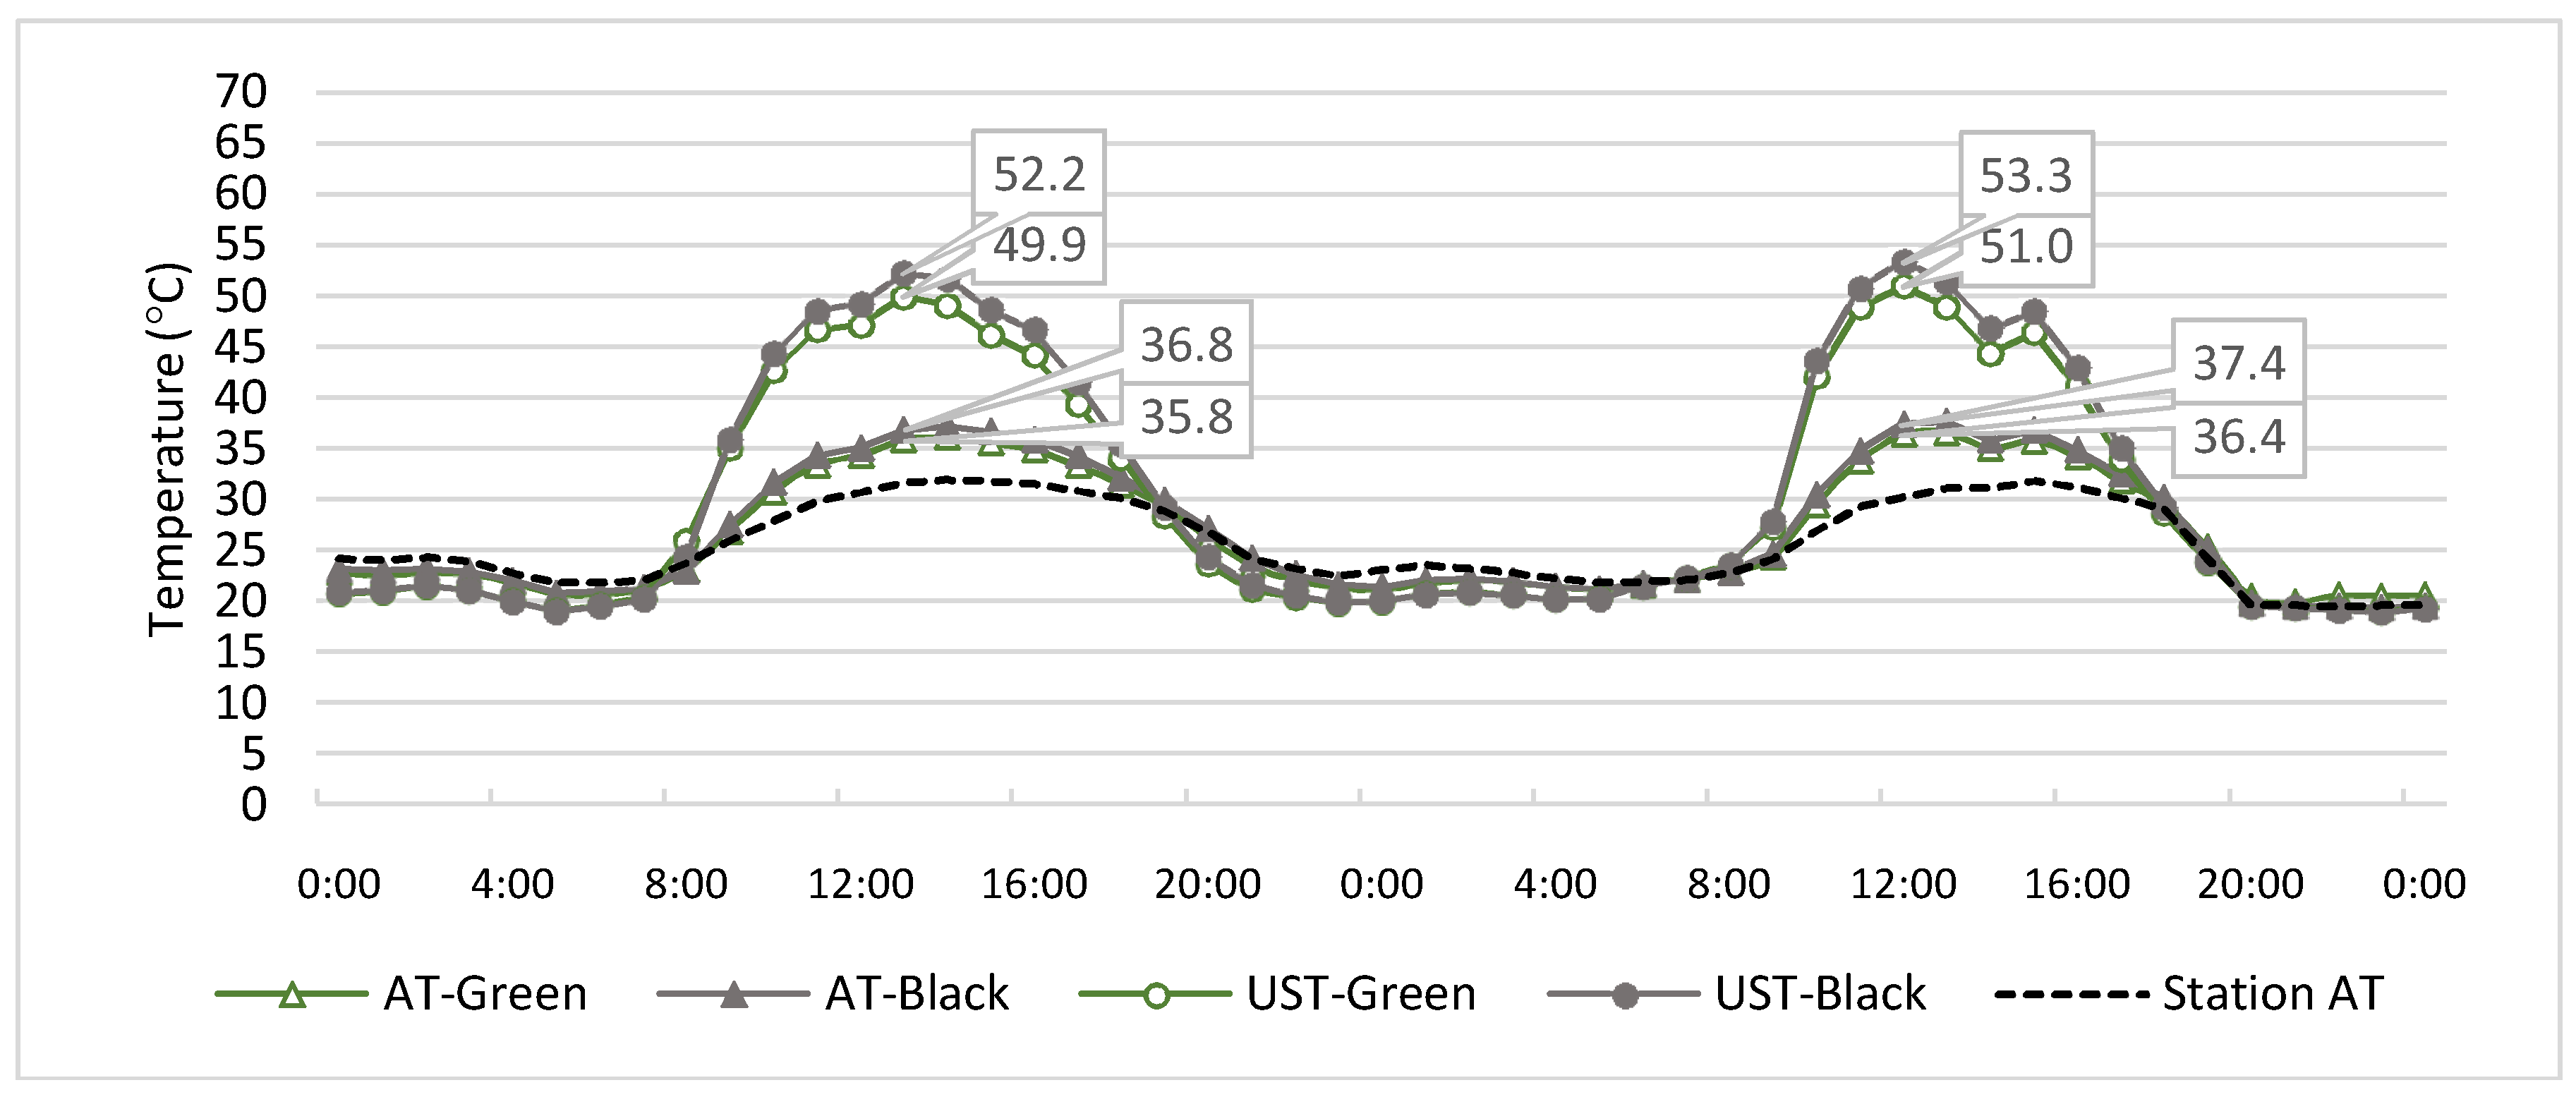
The ambient temperature and the underside surface temperature comparisons between AT-Green and AT-Black and between UST-Green and UST-Black are shown in Figure 12. On the first day, the ambient temperature profiles at the peak show a maximum temperature difference of 0.5 °C. The AT-Green reached a peak temperature of 39.9 °C while the AT-Black reached a peak temperature of 40.4 °C and the ambient temperature from the weather station was 33.4 °C. The AT-Green and AT-Black at the peak were 6.5 °C and 7 °C hotter than Station AT, respectively. The underside surface temperature profile showed maximum temperature differences of 1.9 °C at the peak temperature. The UST-Green and the UST-Black reached a peak temperature of 56.3 °C and 58.2 °C, respectively. On the second day, the ambient temperature profiles at the peak show a maximum temperature difference of 0.5 °C. The AT-Green reached a peak temperature of 40.3 °C whereas the AT-Black reached a peak temperature of 40.8 °C. The ambient temperature from the weather station was 34.9 °C. The AT11-Green and the AT-Black at the peak were 5.4 °C and 5.9 °C hotter than Station AT, respectively. The underside surface temperature profile showed maximum temperature differences of 2 °C at the peak temperature. In addition, the UST-Green and UST-Black reached a peak temperature of 54.2 °C and 56.2 °C.
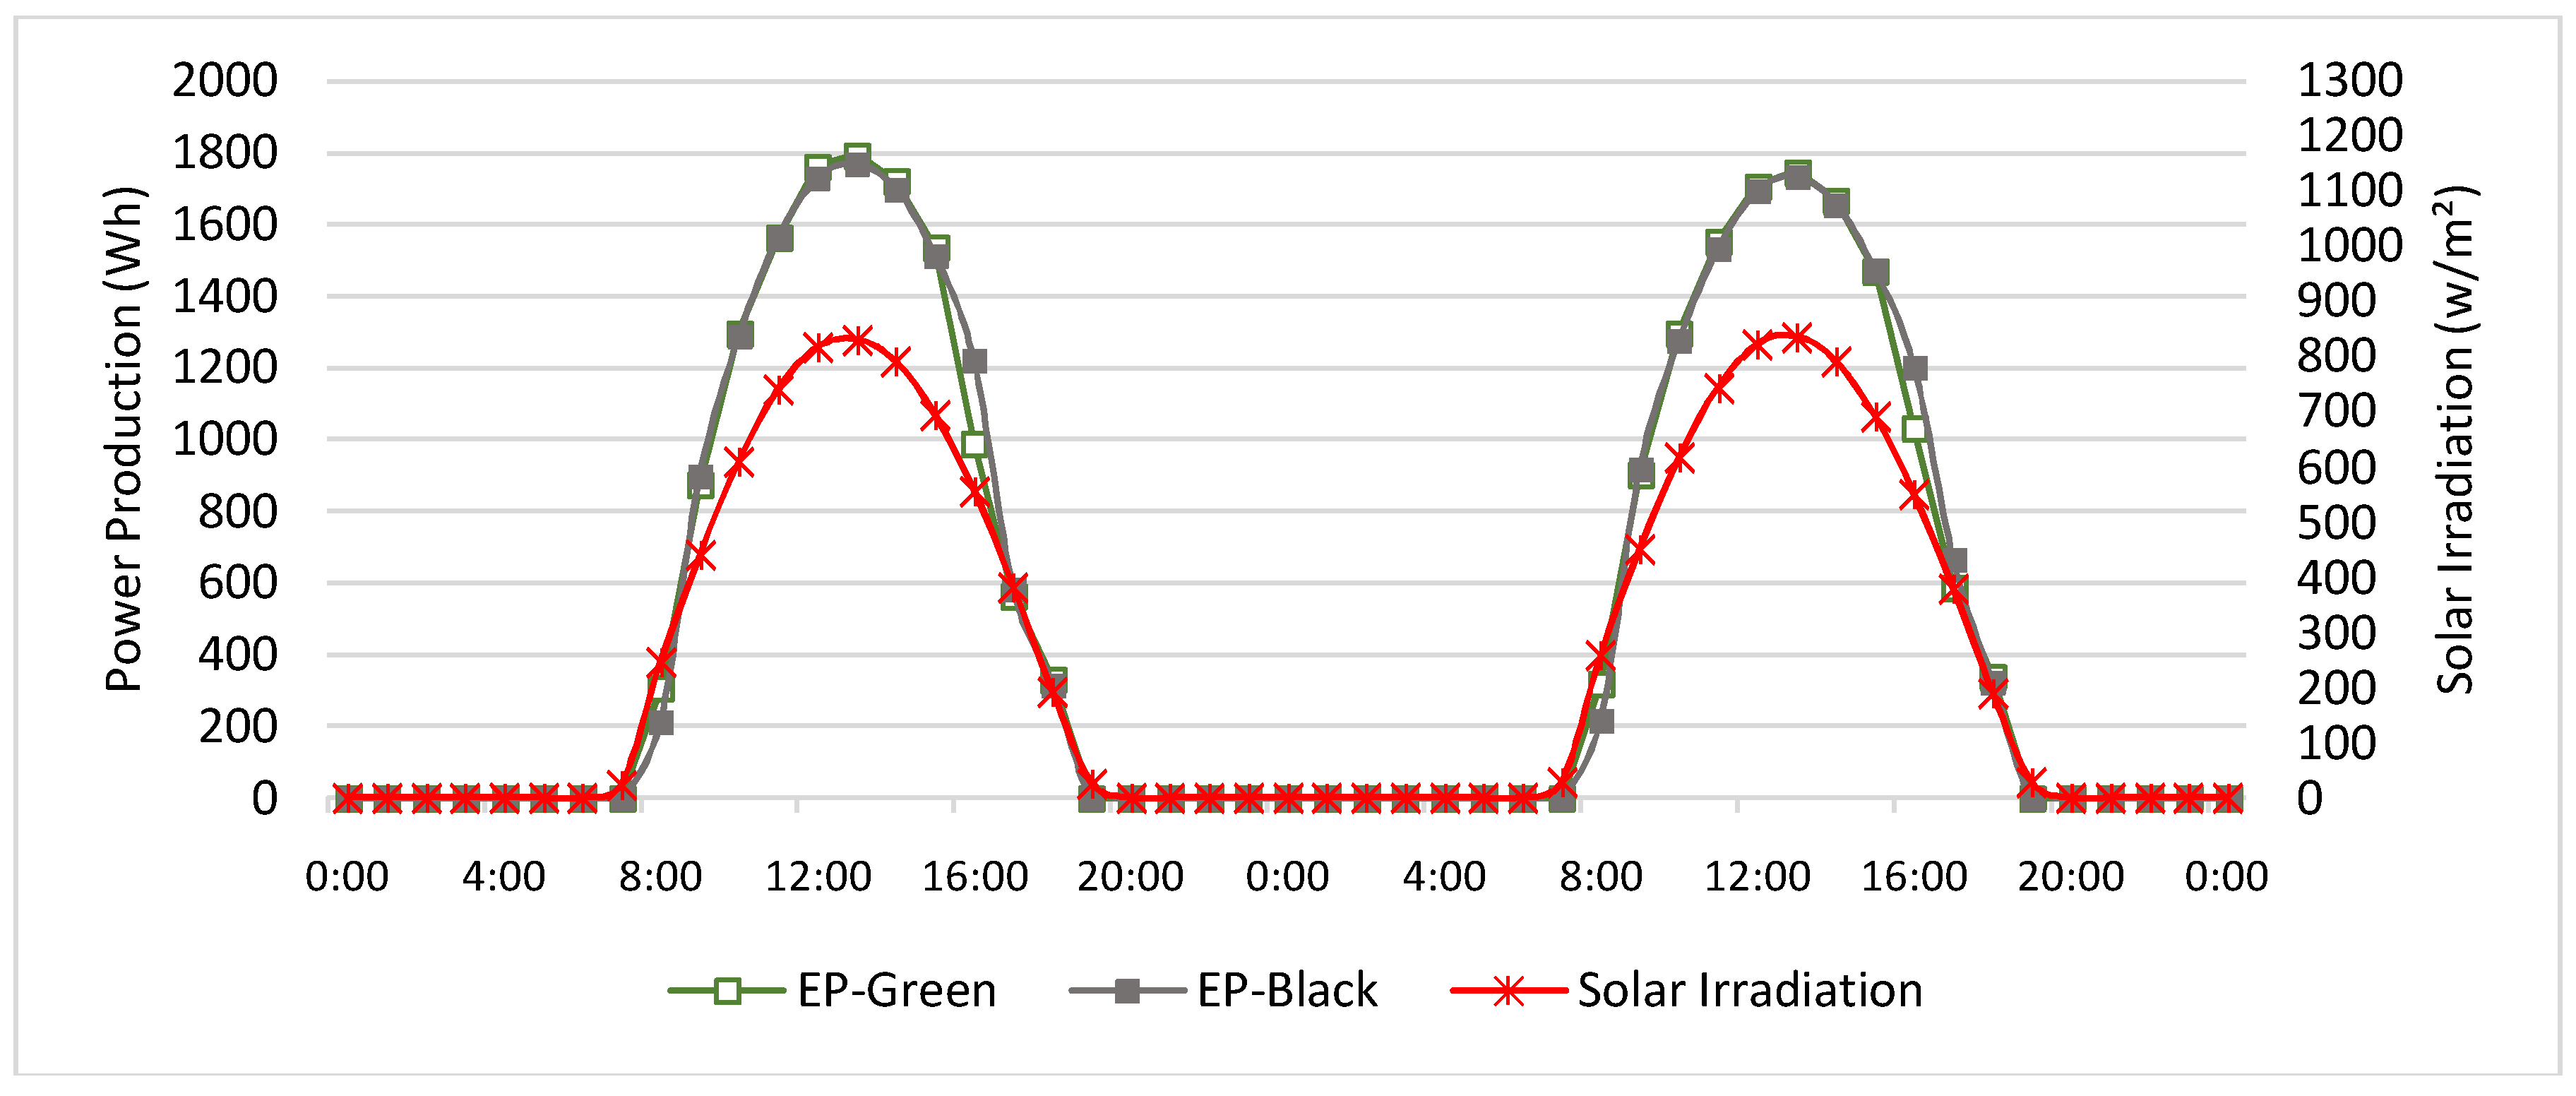
The energy production profiles for 3–4 April are shown in Figure 13. On the first day, the maximum energy production by EP-Green at peak hours was 1795 Wh, and EP-Black was 1769 Wh. On the second day, the maximum energy production by EP-Green at the peak hours was 1748 Wh, and EP-Black was 1735 Wh. The energy production profiles show maximum temperature differences of about 26 Wh and 13 Wh at the peak production for the first day and the second day, respectively. This translates to differences of 1.5% and 0.8% between EP-Green and EP-Black in the peak energy production values. The solar irradiation and energy production profiles show similar patterns and the peak solar irradiation values were 832 W/m2 on the first day and 838 W/m2 on the second day.
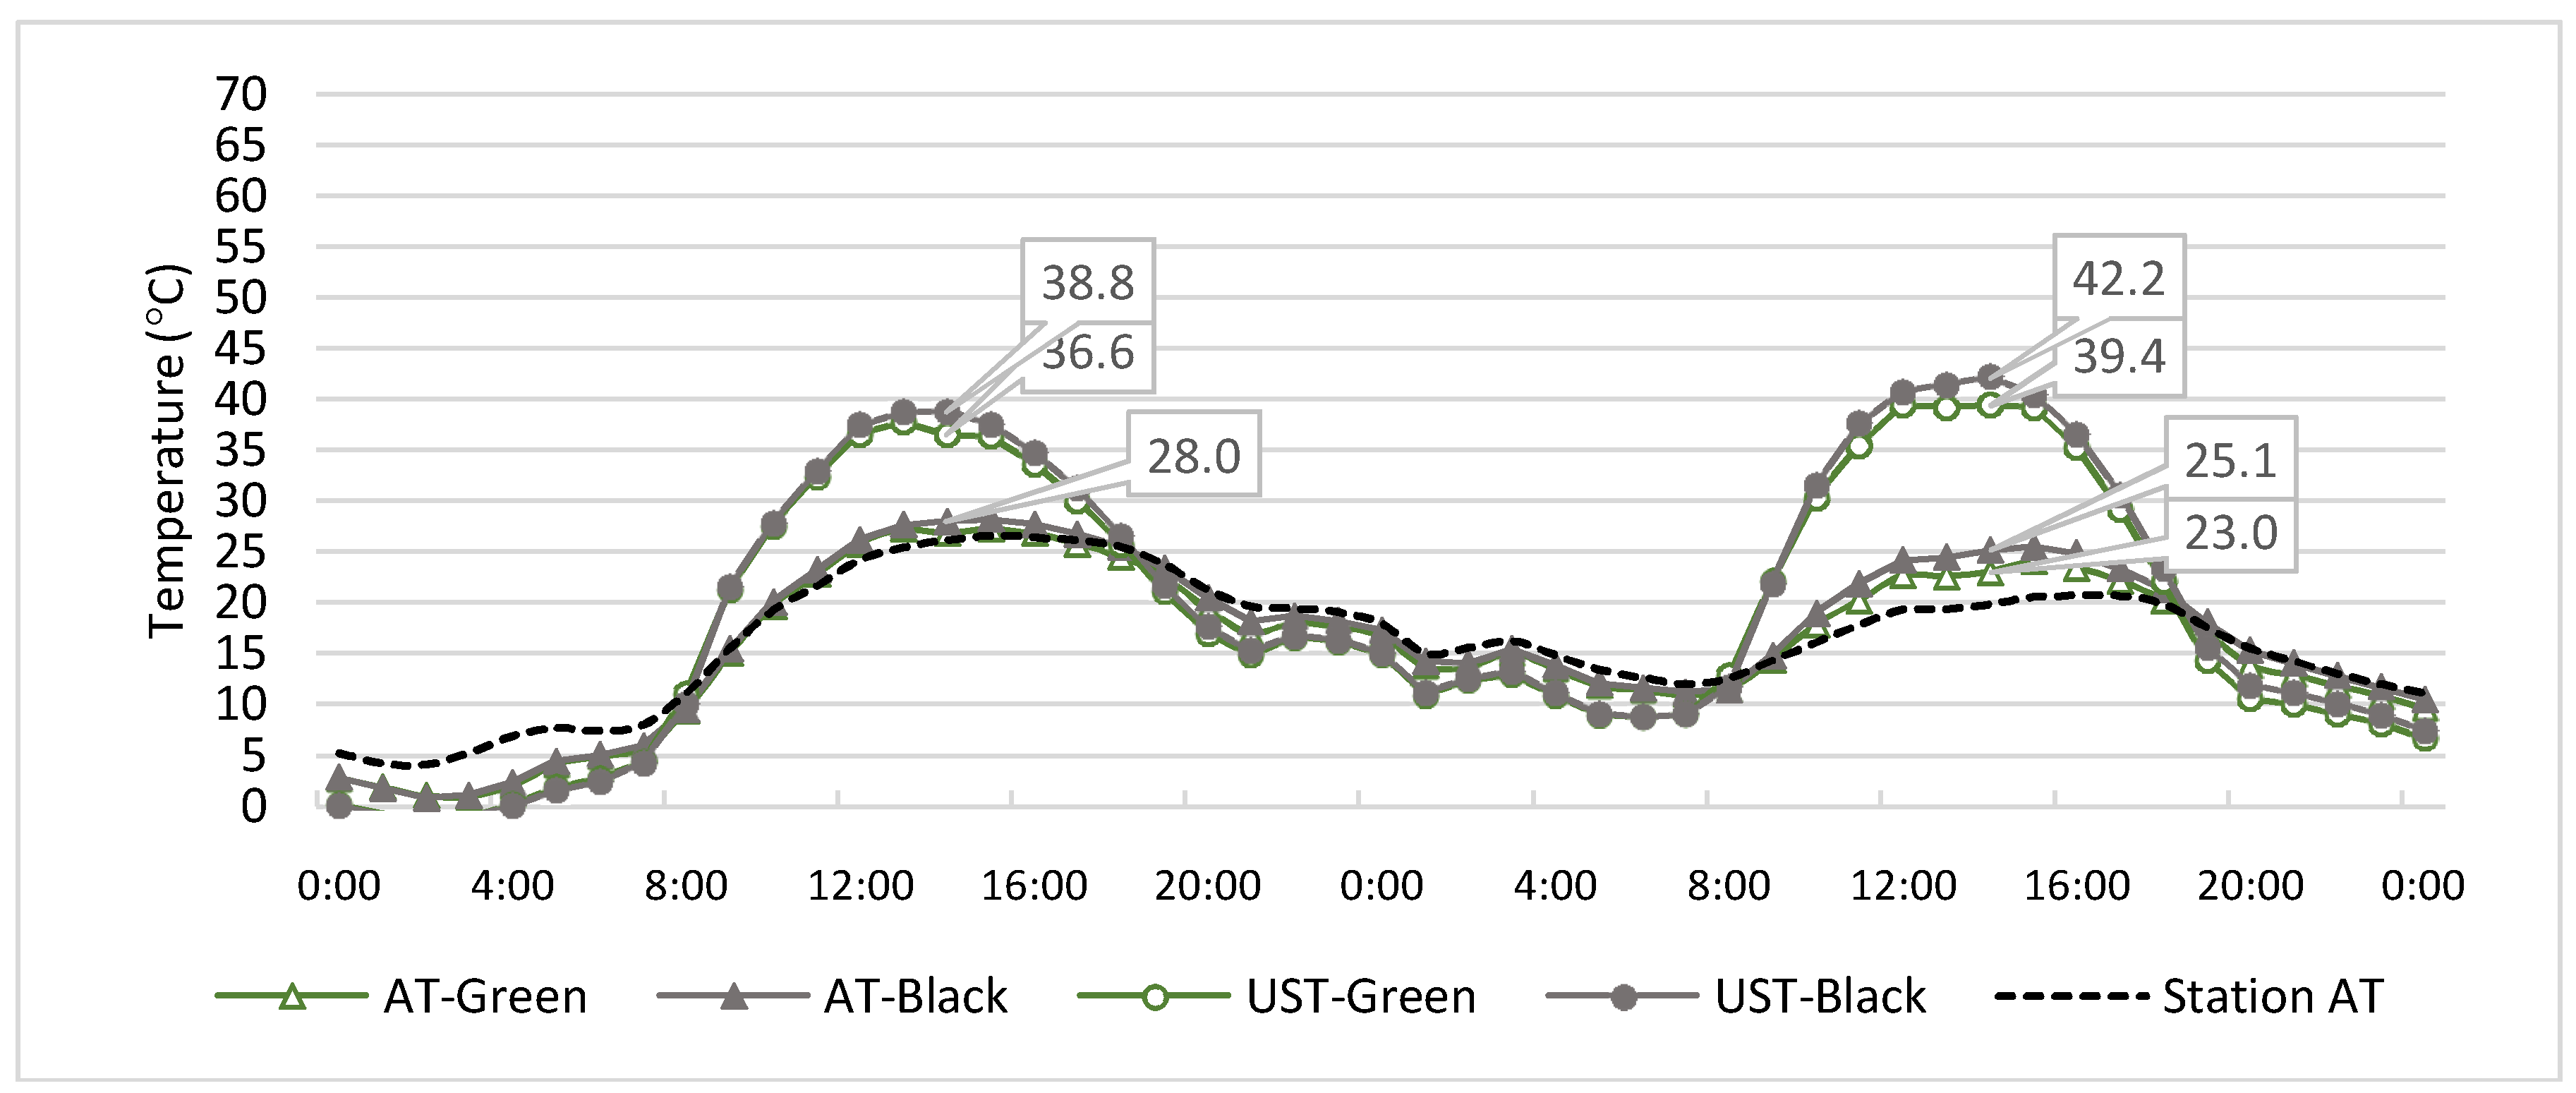
The ambient temperature and the underside surface temperature comparisons between the AT-Green and AT-Black and between UST-Green and UST-Black are shown in Figure 14. On the first day, the ambient temperature profiles at the peak show a maximum temperature difference of 1.4 °C. The AT-Green reached a peak temperature of 26.8 °C, whereas the AT-Black reached a peak temperature of 28.2 °C. The ambient temperature from the weather station was 26.7 °C. The AT-Green and AT-Black at the peak were 0.1 °C and 1.5 °C hotter than Station AT, respectively. The underside surface temperature profile shows maximum temperature differences of 2.2 °C at the peak temperature. The UST-Green and the UST-Black reached a peak temperature of 36.6 °C and 38.8 °C. On the second day, the ambient temperature profiles at the peak show a maximum temperature difference of 2.1 °C. The AT-Green reached a peak temperature of 23 °C whereas the AT-Black reached a peak temperature of 25.1 °C. The ambient temperature from the weather station was 20.7 °C. The AT-Green and the AT-Black at the peak were 2.3 °C and 4.4 °C hotter than Station AT, respectively. The underside surface temperature profile showed maximum temperature differences of 2.8 °C at the peak temperature. The UST-Green and the UST-Black reached a peak temperature of 39.4 °C and 42.2 °C, respectively.

4. Conclusions and Discussion

Building roof surface types have an impact on the performance of PV panels. The variations of roof surface temperatures and ambient air above the roof impact the PV panel underside surface temperature which also impacts energy production. Since the green roof recorded lower surface temperatures than the conventional roof, PV panels over the green roof produced more energy than the PV panels over the conventional roof. The differences in energy production between the two systems are correlated with ambient air temperature. During hot days of the year, the magnitude of energy production differences is greater as shown in Table 4.
The performance differences varied across the analysis period as shown in Table 4. The larger differences occurred during the peak temperature of the day. During the cooler climate conditions, there were slight temperature differences across the three roofing types. For temperatures below 0 °C, the average AT-Green and average UST-Green were less than 1 °C warmer than AT-Black and UST-Black. For temperatures above 20 °C, the average AT-Black ranged from 0.6 °C to 2.3 °C hotter than the average AT-Green. The average ambient temperature peaks were 42.3 °C for AT-Black and 40 °C for AT-Green when the ambient temperatures from the weather station were above 38 °C. The average UST-Black ranged from 1.1 °C to 2.3 °C hotter than the average AT-Green for temperatures above 20 °C. The average underside surface temperature peaks were 52.6 °C for UST-White and 50.3 °C for UST-Green.
For the entire analysis period, EP-Green produced 19.4 kWh, which represents 1.4%, more electricity than EP-Black. In June, the EP-Green produced 5.7 kWh more electricity than EP-Black, which represents 2.4% more kWh output as shown in Table 4. In January, the EP-Green produced 0.51 kWh more electricity than EP-Black, which represent 1.1% more kWh output. The difference in December was 0.96 kWh, which represents 2.7%. Even though the actual production difference was less than 1 kWh, the percentage was higher than other months with greater production differences.
For this study, the highest ambient air temperatures were during June and July and the greatest variations in energy productions were also during these months. The impact of roofing types on the performance of PV panels is expected to be higher for sites with more days of ambient air temperatures above 25 °C. The height of PV panels from the roof surface was constant in the implementation of this study. The distance between the PV panels and the roof surface can also impact the thermal interaction. For a future study, it is recommended to study the performance of PV panels over a green roof and a conventional roof with different distances from the roof surface.

Author Contributions

Jae D. Chang and Mohammed J. Alshayeb worked together to form the project idea, research methodology, and execution plan. Mohammed J. Alshayeb was responsible for the daily activities and for preparing the experimental bed, monitoring, collecting and analyzing data. Jae D. Chang supervised the project, ensured the quality of the work, and accuracy of the data.

Acknowledgments

This project was supported in part by Enphase Energy Inc. (Petaluma, CA, USA) through their donation of Enphase Microinvertors which were used to monitor the performance of each PV panel. The Center for Design Research provided the researchers access to their PV panels.

Conflicts of Interest

The authors declare no conflict of interest.

References

  1. Department of Energy (DOE). International Energy Outlook 2013; Report Number: DOE/EIA-0484; US Energy Information Administration (EIA): Washington, DC, USA, 2013.
  2. Franklin, C.; Chang, J. Energy Consumption Monitors: Building Occupant Understanding and Behavior. In Proceedings of the ARCC Conference Repository, University of North Carolina, Charlotte, NC, USA, 27–30 March 2013. [Google Scholar]
  3. Architecture2030. The 2030 Challenge; Architecture2030: Santa Fe, NM, USA, 2016. [Google Scholar]
  4. Department of Energy (DOE). International Energy Outlook 2014; Report Number: DOE/EIA-0484; US Energy Information Administration (EIA): Washington, DC, USA, 2014.
  5. Renewable Energy Policy Network for the 21st Century. Renewables 2015 Global Status Report: Renewables 2015 Global Status Report; REN 21: Paris, France, 2015; ISBN 978-3-9815934-6-4. [Google Scholar]
  6. International Energy Agency (IEA). Renewables 2017 Analysis and Forecasts to 2022; Organisation for Economic Co-operation and Development (OECD)/IEA: Paris, France, 2017. [Google Scholar]
  7. International Energy Agency (IEA). Renewables Energy Medium-Term Market Report 2022; OECD/IEA: Paris, France, 2016. [Google Scholar]
  8. Nagengast, A.; Hendrickson, C.; Matthews, S.H. Variations in photovoltaic performance due to climate and low-slope roof choice. Energy Build. 2013, 64, 493–502. [Google Scholar] [CrossRef]
  9. Scherba, A.; Sailor, D.J.; Rosenstiel, T.N.; Wamser, C.C. Modeling impacts of roof reflectivity, integrated photovoltaic panels and green roof systems on sensible heat flux into the urban environment. Build. Environ. 2011, 46, 2542–2551. [Google Scholar] [CrossRef]
  10. US Energy Information Administration. Annual Energy Outlook 2016: With Projections to 2040; US Energy Information Administration, Office of Energy Analysis, US Department of Energy: Washington, DC, USA, 2016.
  11. Zheng, C.; Kammen, D.M. An innovation-focused roadmap for a sustainable global photovoltaic industry. Energy Policy 2014, 67, 159–169. [Google Scholar] [CrossRef]
  12. Zhang, F.; Gallagher, K.S. Innovation and technology transfer through global value chains: Evidence from China’s PV industry. Energy Policy 2016, 94, 191–203. [Google Scholar] [CrossRef]
  13. Huang, P.; Negro, S.O.; Hekkert, M.P.; Bi, K. How China became a leader in solar PV: An innovation system analysis. Renew. Sustain. Energy Rev. 2016, 64, 777–789. [Google Scholar] [CrossRef]
  14. Gartland, L. Heat Islands: Understanding and Mitigating Heat in Urban Areas; Routledge: Abingdon, UK, 2010. [Google Scholar]
  15. Wong, E.; Akbari, H.; Bell, R.; Cole, D. Reducing Urban Heat Islands: Compendium of Strategies; Environmental Protection Agency: Washington, DC, USA, 2011. [Google Scholar]
  16. Ferguson, B.; Fisher, K.; Golden, J.; Hair, L.; Haselbach, L.; Hitchcock, D.; Kaloush, K.; Pomerantz, M.; Tran, N.; Waye, D. Reducing Urban Heat Islands: Compendium of Strategies-Cool Pavements; Environmental Protection Agency: Washington, DC, USA, 2008. [Google Scholar]
  17. Scholz-Barth, K.; Tanner, S. Green Roofs: Federal Energy Management (FEMP) Federal Technology Alert; National Renewable Energy Lab: Golden, CO, USA, 2004. [Google Scholar]
  18. Köhler, M.; Wiartalla, W.; Feige, R. Interaction between PV-systems and extensive green roofs. In Proceedings of the 5th North American Green Roof Conference: Greening Rooftops for Sustainable Communities, Boston, MA, USA, 29 April–1 May 2007. [Google Scholar]
  19. Hui, S.C.; Chan, S.C. Integration of green roof and solar photovoltaic systems. In Proceedings of the Joint Symposium 2011: Integrated Building Design in the New Era of Sustainability, Hong Kong, China, 22 November 2011. [Google Scholar]
  20. Nagengast, A.L. Energy Performance Impacts from Competing Low-Slope Roofing Choices and Photovoltaic Technologies. Ph.D. Thesis, Carnegie Mellon University, Pittsburgh, PA, USA, 2013. [Google Scholar]
  21. Perez, M.J.; Wight, N.; Fthenakis, V.; Ho, C. Green-roof integrated PV canopies—An empirical study and teaching tool for low income students in the South Bronx. ASES 2012, 4, 6. [Google Scholar]
  22. Chemisana, D.; Lamnatou, C. Photovoltaic-green roofs: An experimental evaluation of system performance. Appl. Energy 2014, 119, 246–256. [Google Scholar] [CrossRef]
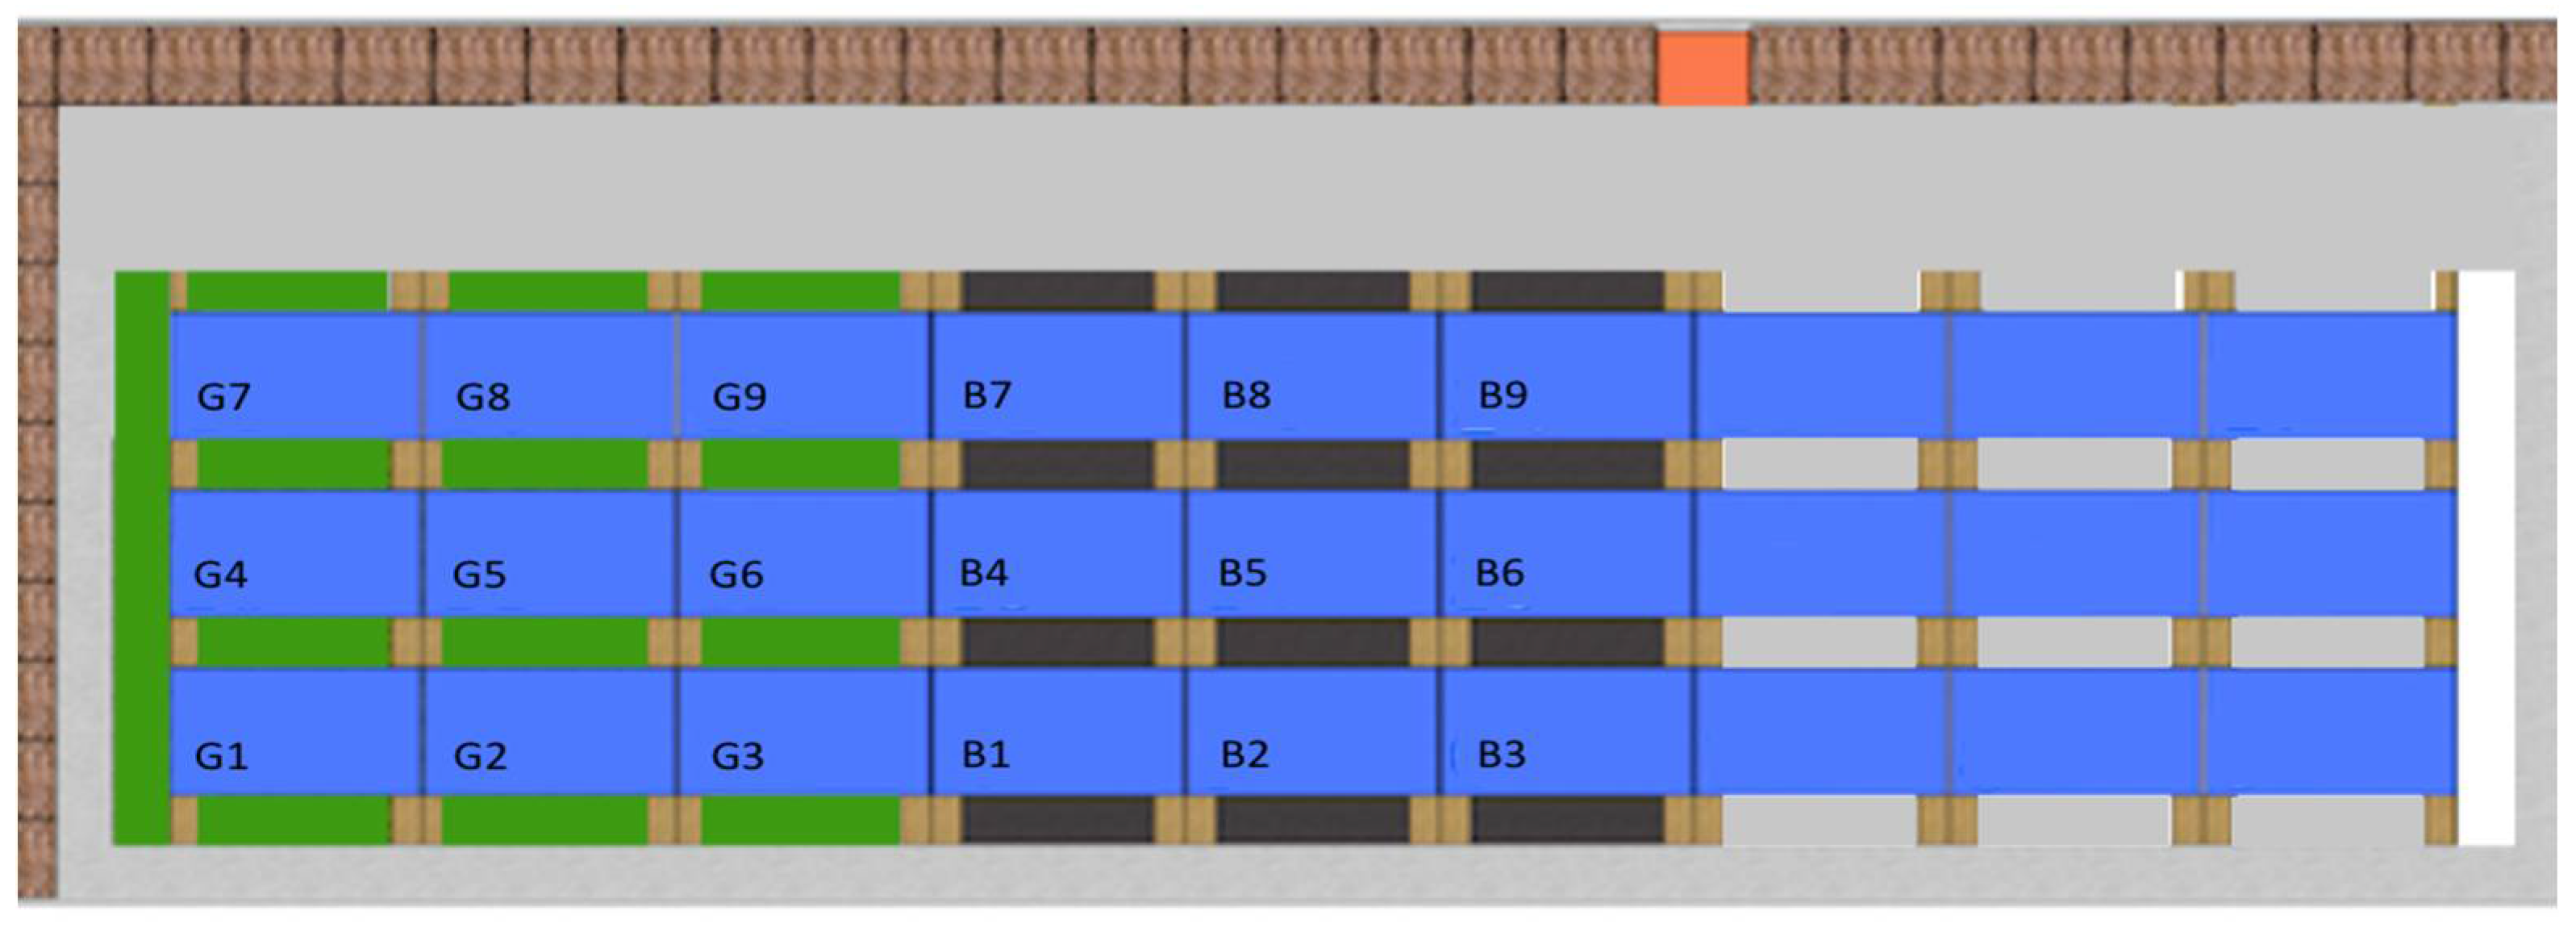
Figure 1. PV panel configurations schematic.
Energies 11 01110 g001
Figure 2. Experimental bed configurations.
Energies 11 01110 g002
Figure 3. Sensor locations (left) and schematic of sensor types and locations (right).
Energies 11 01110 g003
Figure 4. Hourly energy production differences of EP-Green vs. EP-Black.
Energies 11 01110 g004
Figure 5. Hourly ambient temperature differences of AT-Green vs. AT-Black.
Energies 11 01110 g005
Figure 6. Hourly underside surface temperature differences of UST-Green vs. UST-Black.
Energies 11 01110 g006
Figure 7. Energy production performance of EP-Green vs. EP-Black (4–5 June).
Energies 11 01110 g007
Figure 8. Thermal performance of AT-Green and UST-Green vs. AT-Black and UST-Black (4–5 June).
Energies 11 01110 g008
Figure 9. Energy production performance of EP-Green vs. EP-Black (15–16 June).
Energies 11 01110 g009
Figure 10. Thermal performance of AT-Green and UST-Green vs. AT-Black and UST-Black.
Energies 11 01110 g010
Figure 11. Energy production performance of EP-Green vs. EP-Black (19–20 July).
Energies 11 01110 g011
Figure 12. Thermal performance of AT-Green and UST-Green versus AT-Black and UST-Black.
Energies 11 01110 g012
Figure 13. Energy production performance of EP-Green versus EP-Black (3–4 April).
Energies 11 01110 g013
Figure 14. Thermal performance of AT-Green and UST-Green versus AT-Black and UST-Black.
Energies 11 01110 g014
Table 1. PV module electrical features.
CharacteristicsUnitValue
Maximum Power Output at STC(W)235
Module Efficiency(%)14.4
Nominal Operating Cell Temperature (NOCT)(°C)46 ± 2
Temperature coefficient of Voc(V/°C)−0.0037
Temperature coefficient of Isc(I/°C)+0.0006
Temperature coefficient of Pmpp(W/°C)−0.0045
Table 2. Enphase microinverter specifications.
CharacteristicsUnitValue
Peak Output Power(W)250
Maximum continuous output power(W)240
Peak inverter efficiency(%)96.5
Static maximum power point tracking (MPPT) efficiency(%)99.4
Ambient temperature range(°C)−40 to +65
Table 3. Data acquisition technical specifications.
Sensor TypeAccuracyOperating Temperature
Onset Hobo Data Logger—U30±8 s/month−40 °C to 60 °C
Onset Hobo Data Logger—U12±0.35 °C−20 °C to 70 °C
Onset Hobo Temp Smart Sensors±0.2 °C−40 °C to 100 °C
Air/Water/Soil Temperature Sensor±0.25 °C−40 °C to 100 °C
Onset Hobo Pyrometer±10 W/m2−40 °C to 75 °C
Onset Hobo Wind Speed/Gust±1.1 m/s−40 °C to 75 °C
Onset Hobo Wind Direction±5 degrees−40 °C to 70 °C
Table 4. Monthly energy production and differences for EP-Green and EP-Black.
MonthEP-Green (kWh)EP-Black (kWh)Difference (kWh)Difference (%)Ambient Temperature (°C)
MinAvgMax
January48.1847.670.511.1%−14.83.120.0
February102.86102.470.390.4%−7.48.924.5
March84.3683.930.420.5%−0.314.525.5
April141.82141.86−0.040.0%7.818.226.7
May141.59139.771.821.3%9.422.130.9
June245.52239.795.732.4%14.630.238.2
July198.87194.873.992.0%17.630.136.9
August165.85163.132.721.7%19.228.836.7
Sepetember131.14130.530.610.5%15.027.233.6
Octorber94.2892.861.411.5%2.321.030.0
November48.5647.650.911.9%−0.817.225.0
December36.3235.360.962.7%−2.08.618.6
Annual Total1439.341419.9019.431.4%---