Variations of PV Panel Performance Installed over a Vegetated Roof and a Conventional Black Roof

Abstract
:1. Introduction
2. Method
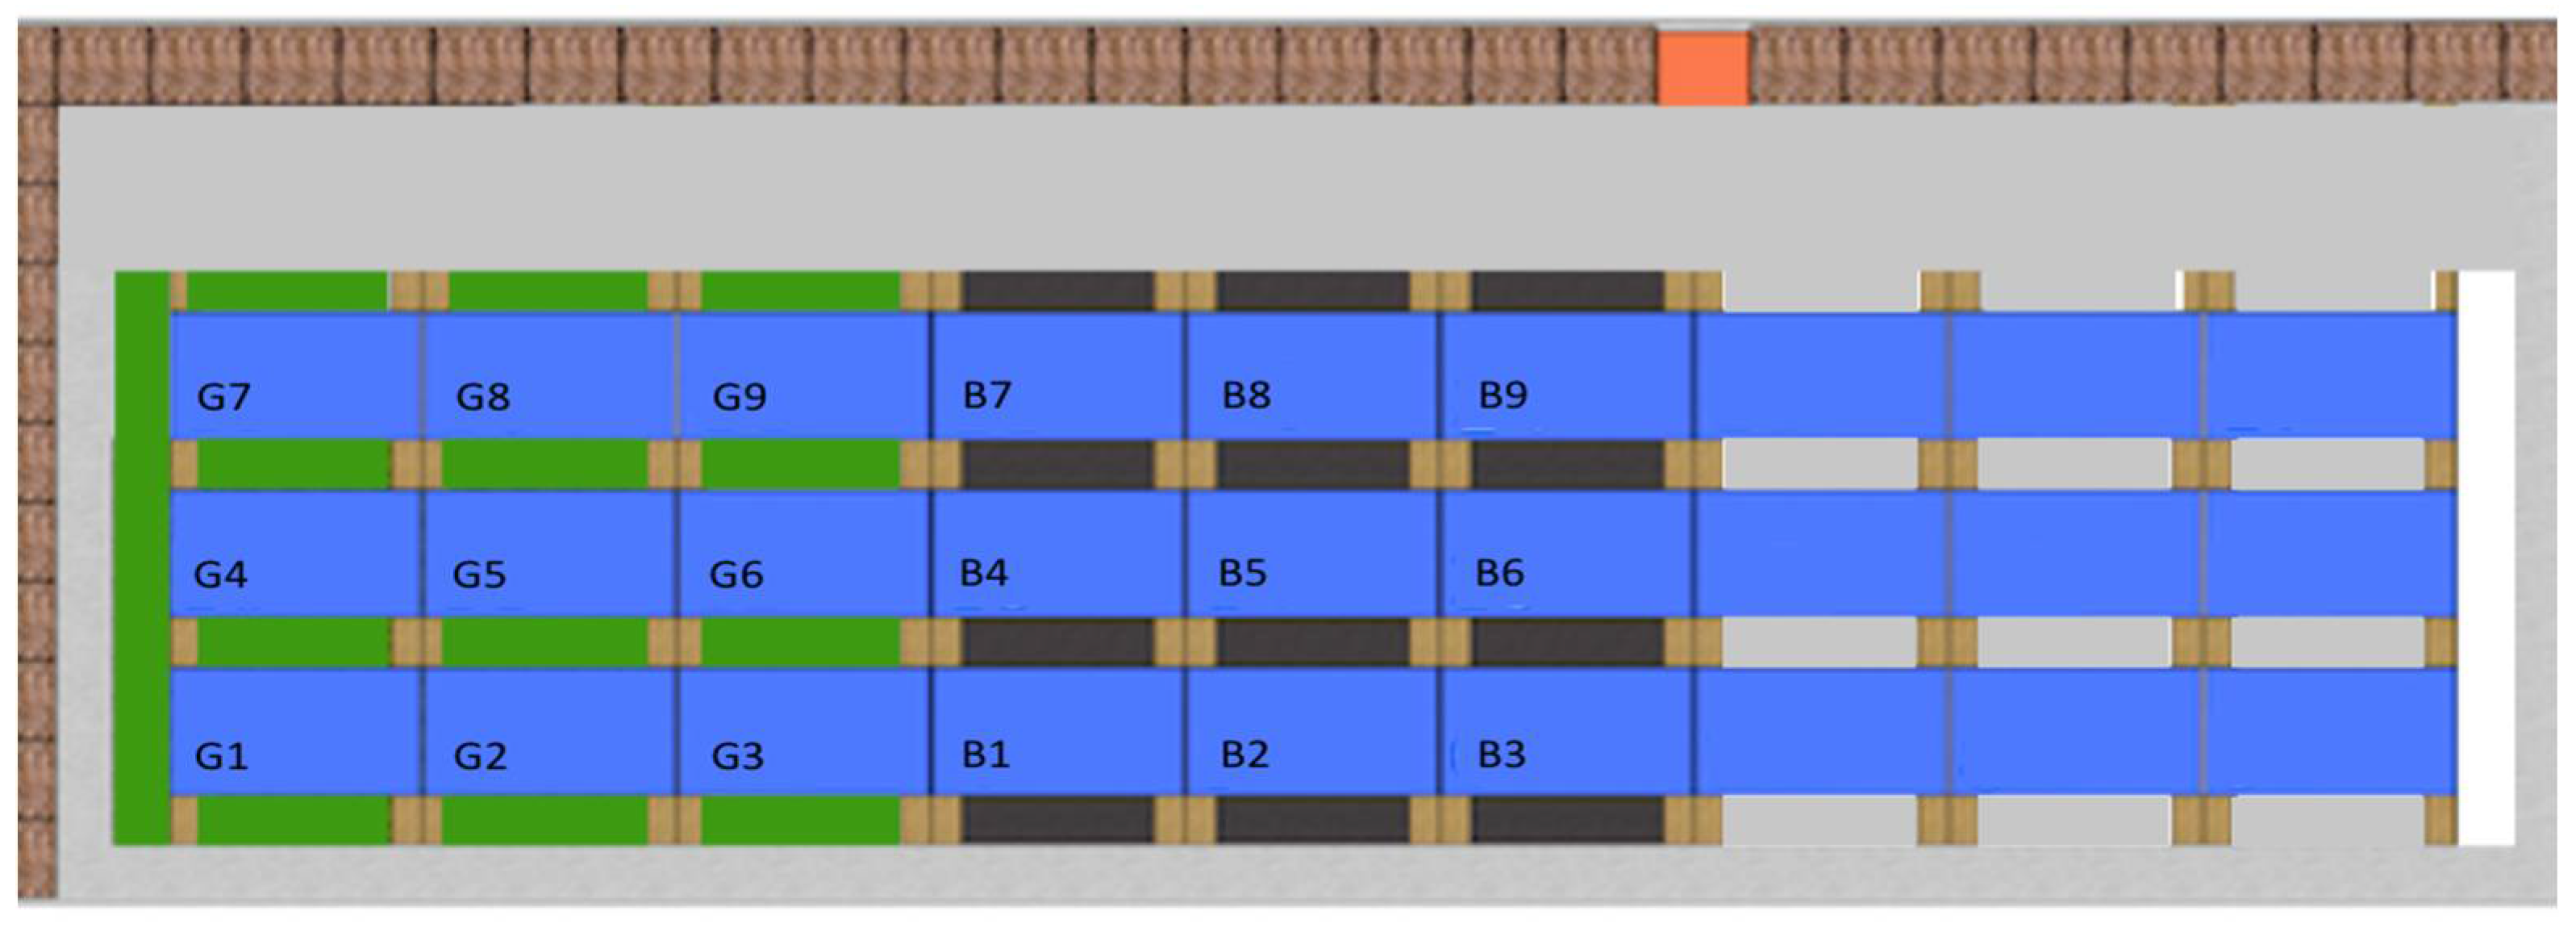
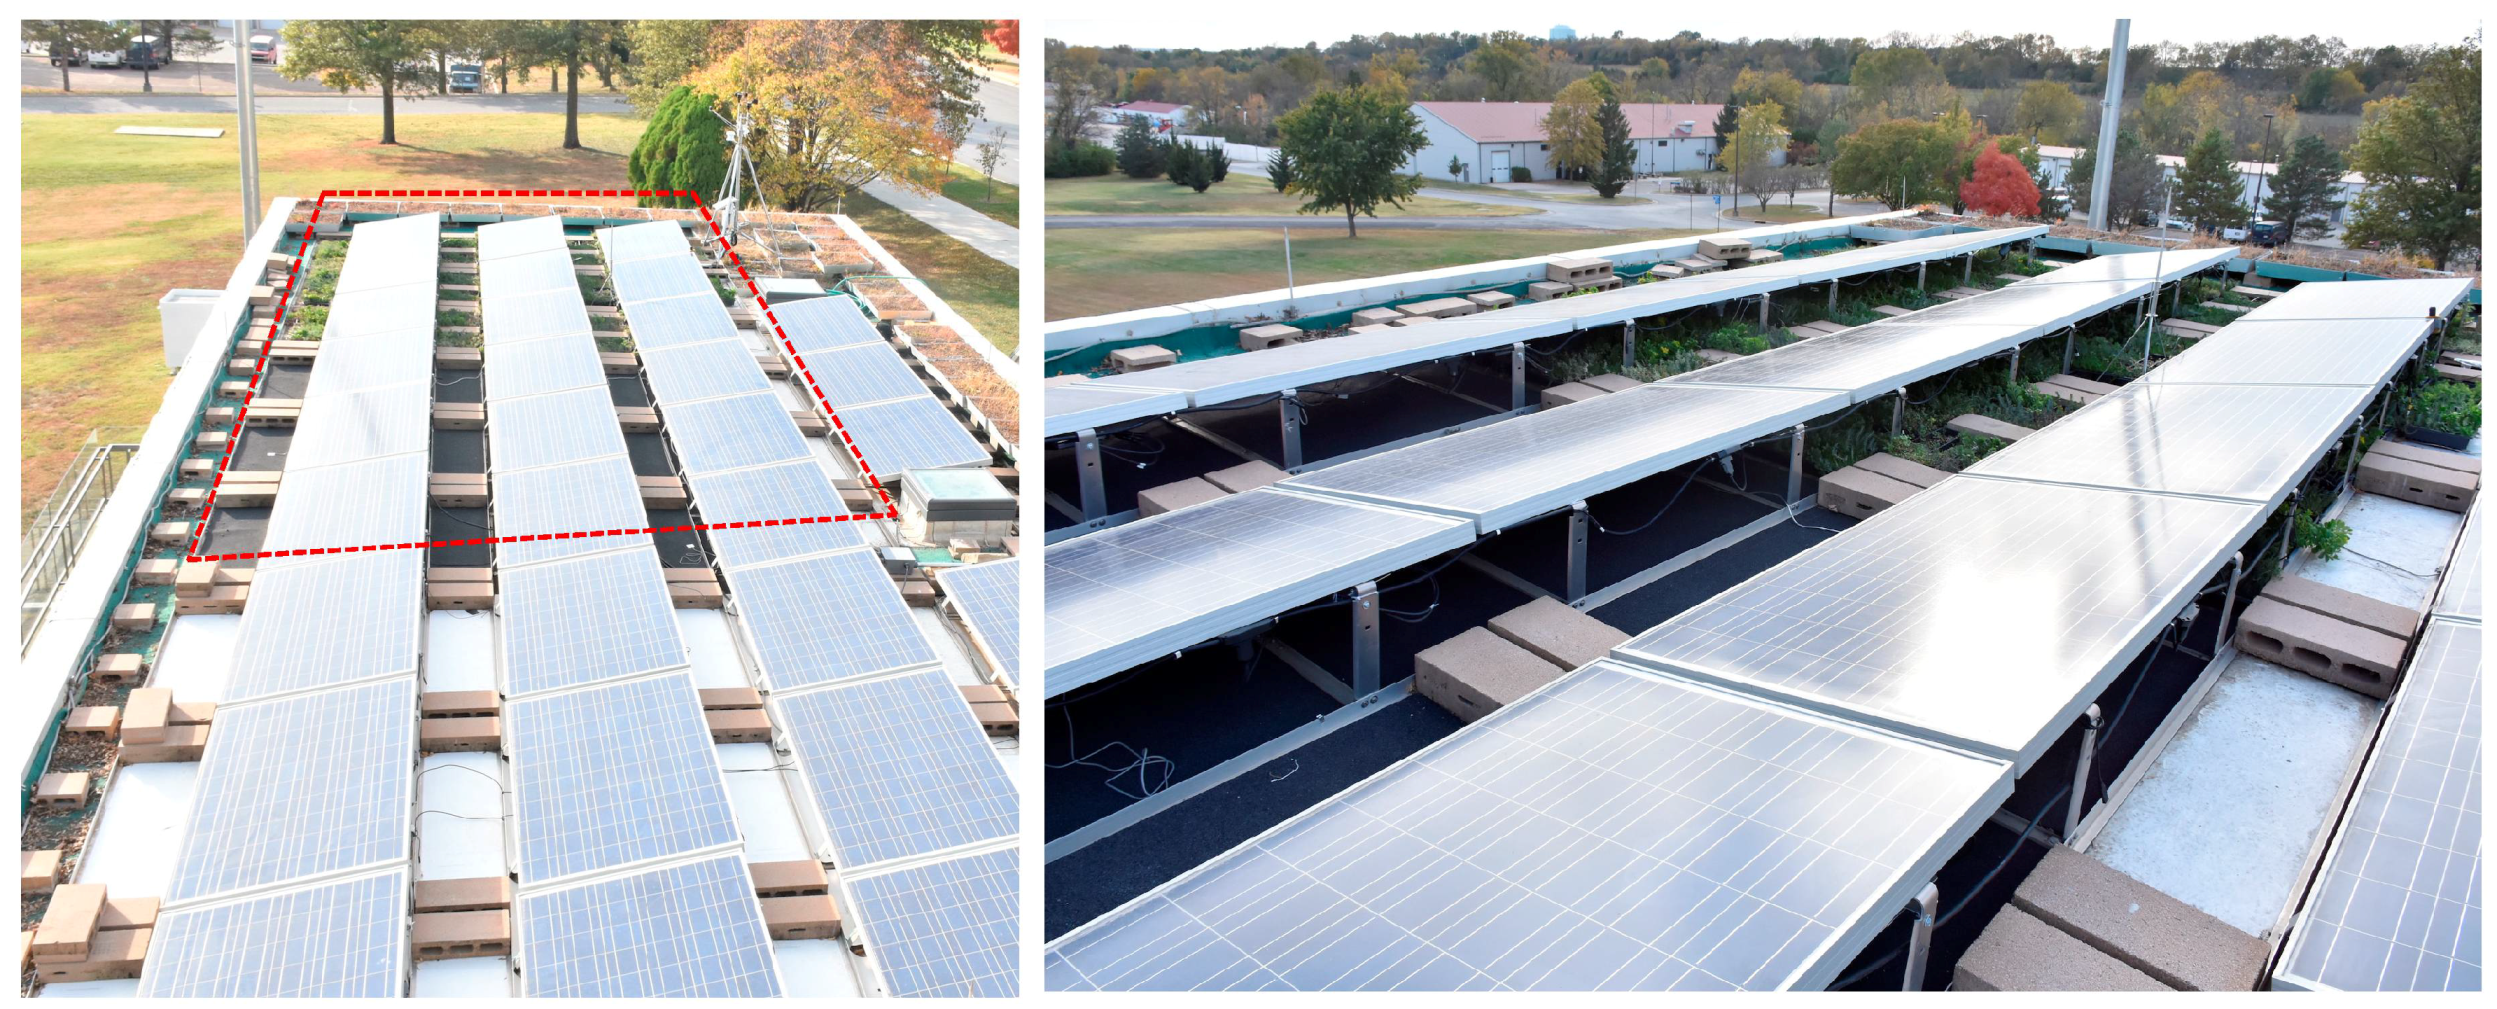
2.1. Experimental Bed Setting
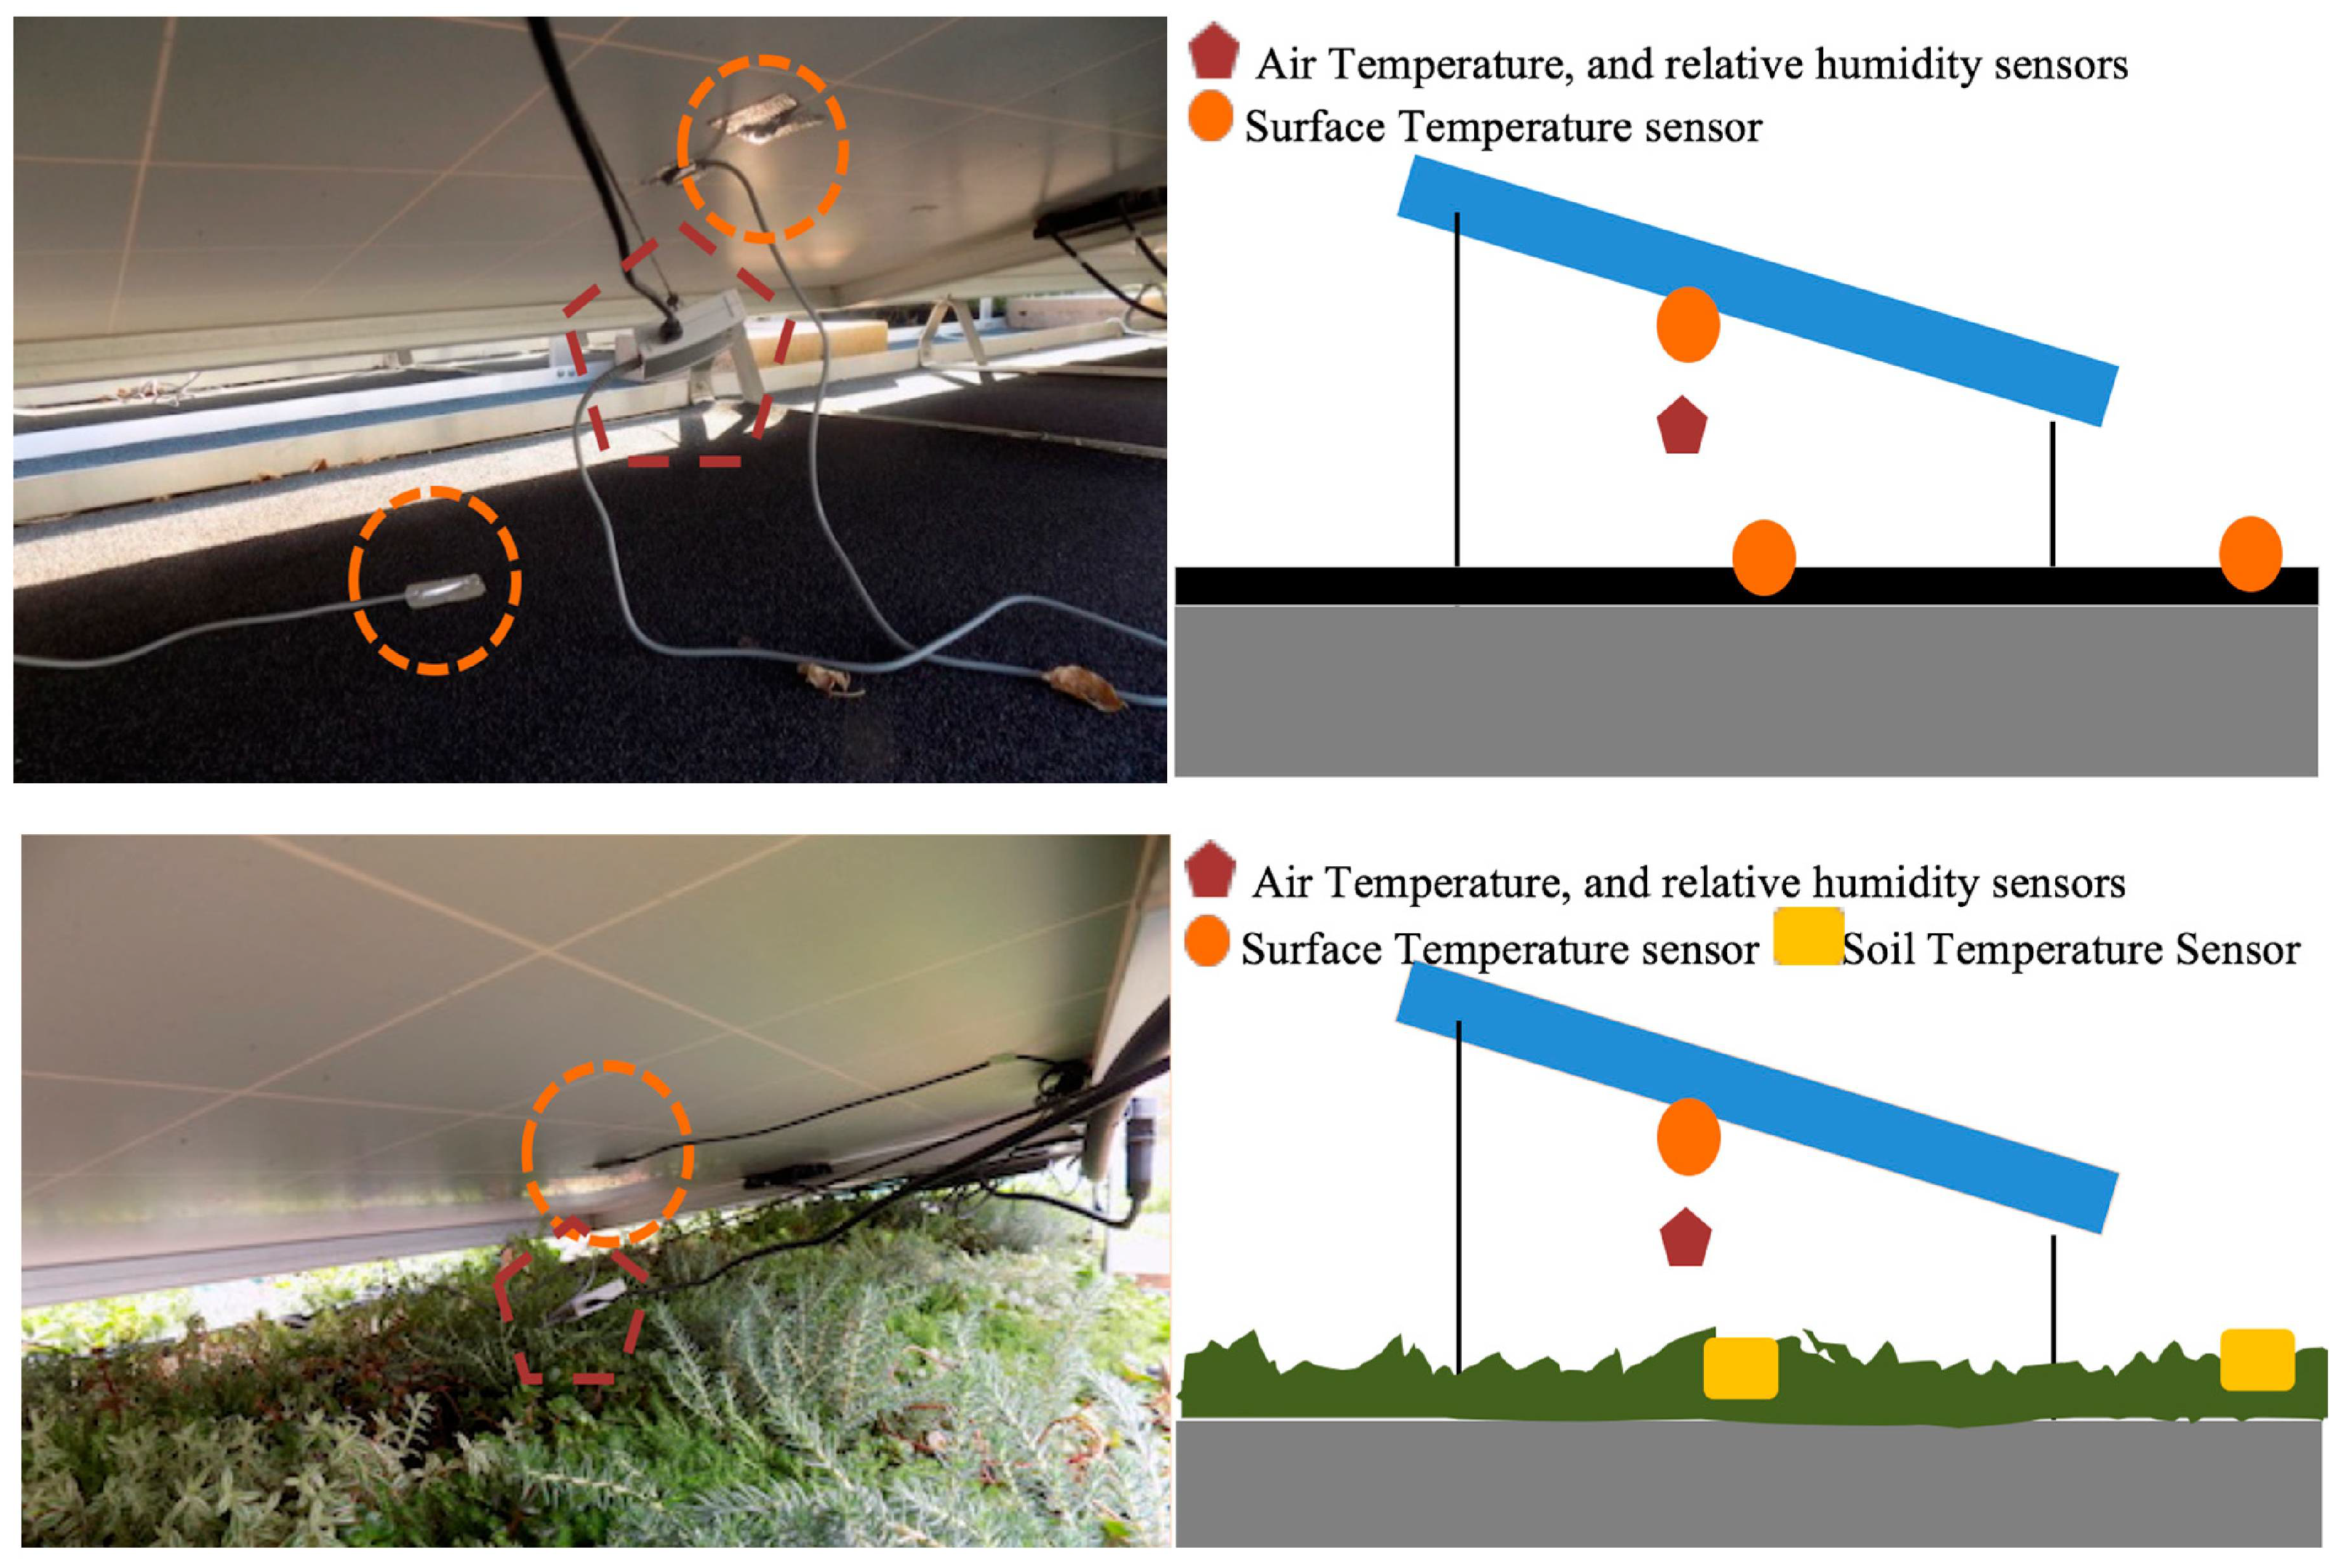
2.2. Data Aquisition
2.3. Calibration Tests
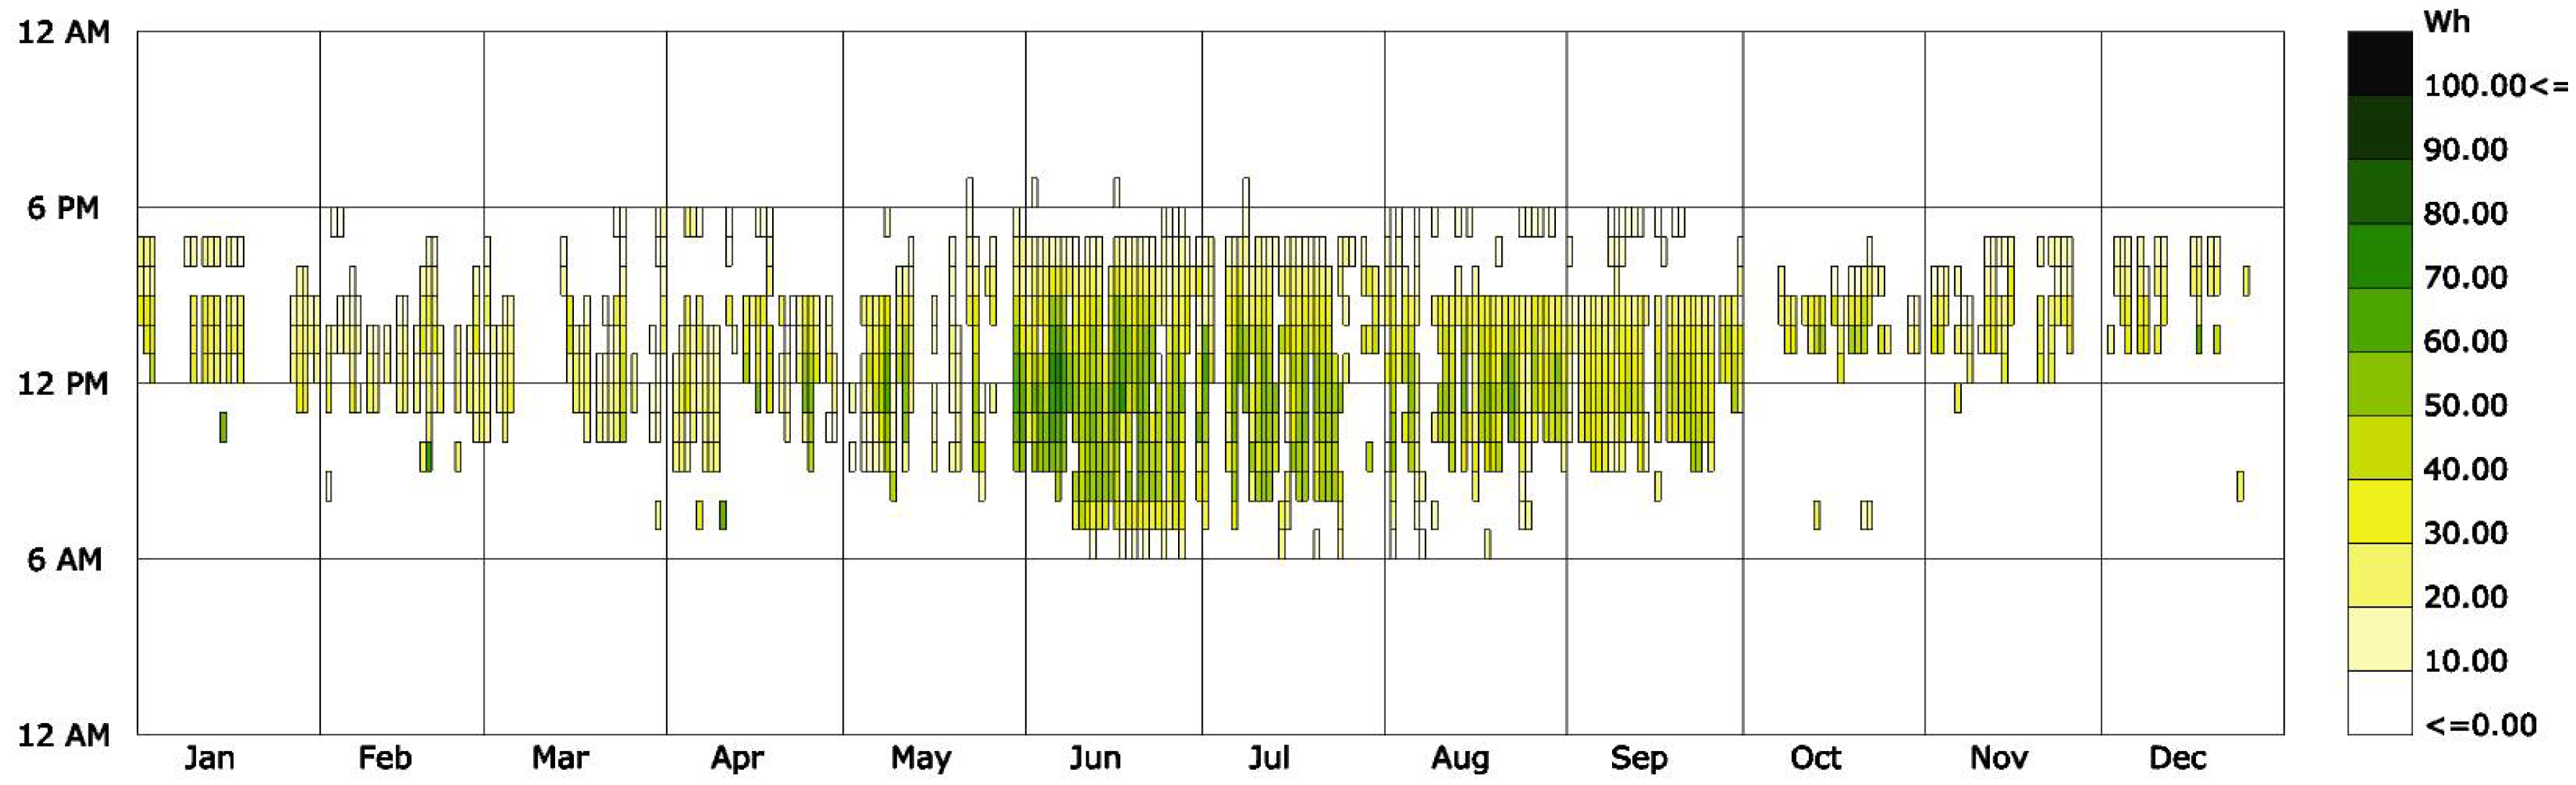
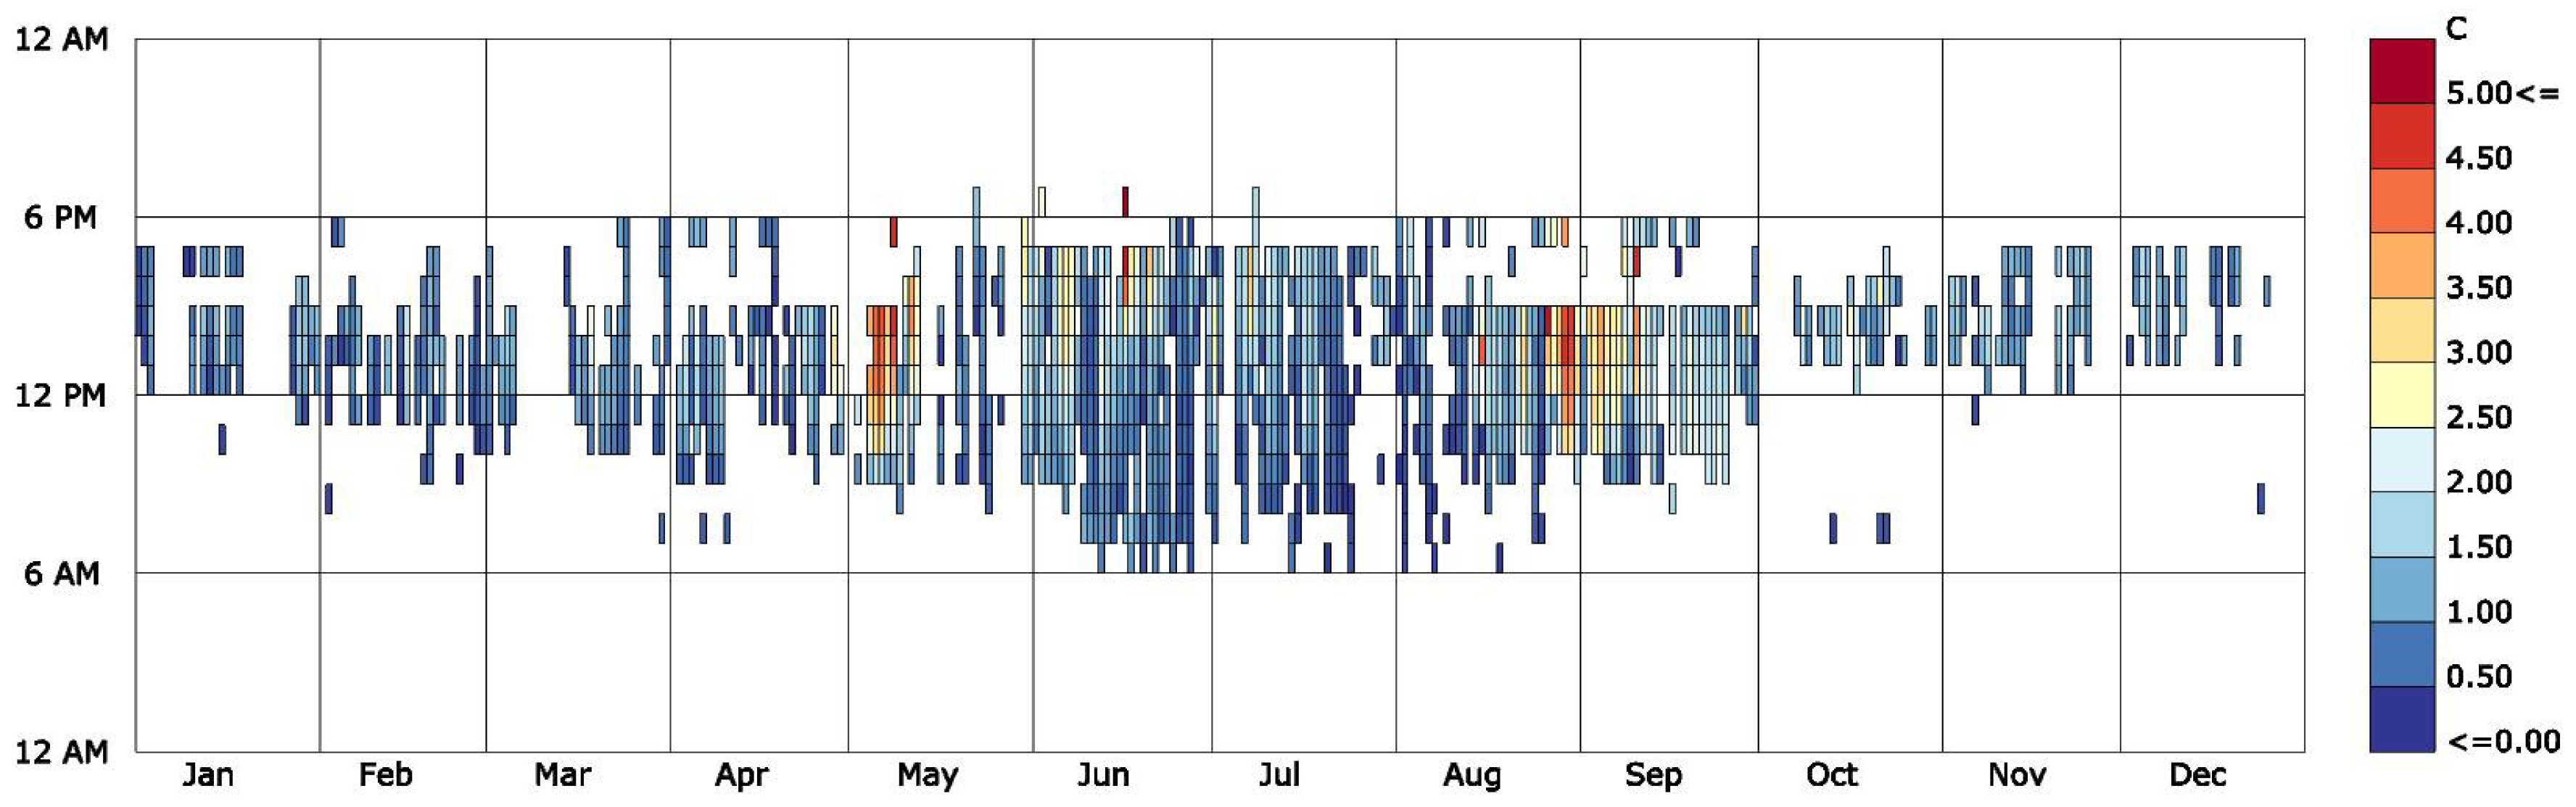
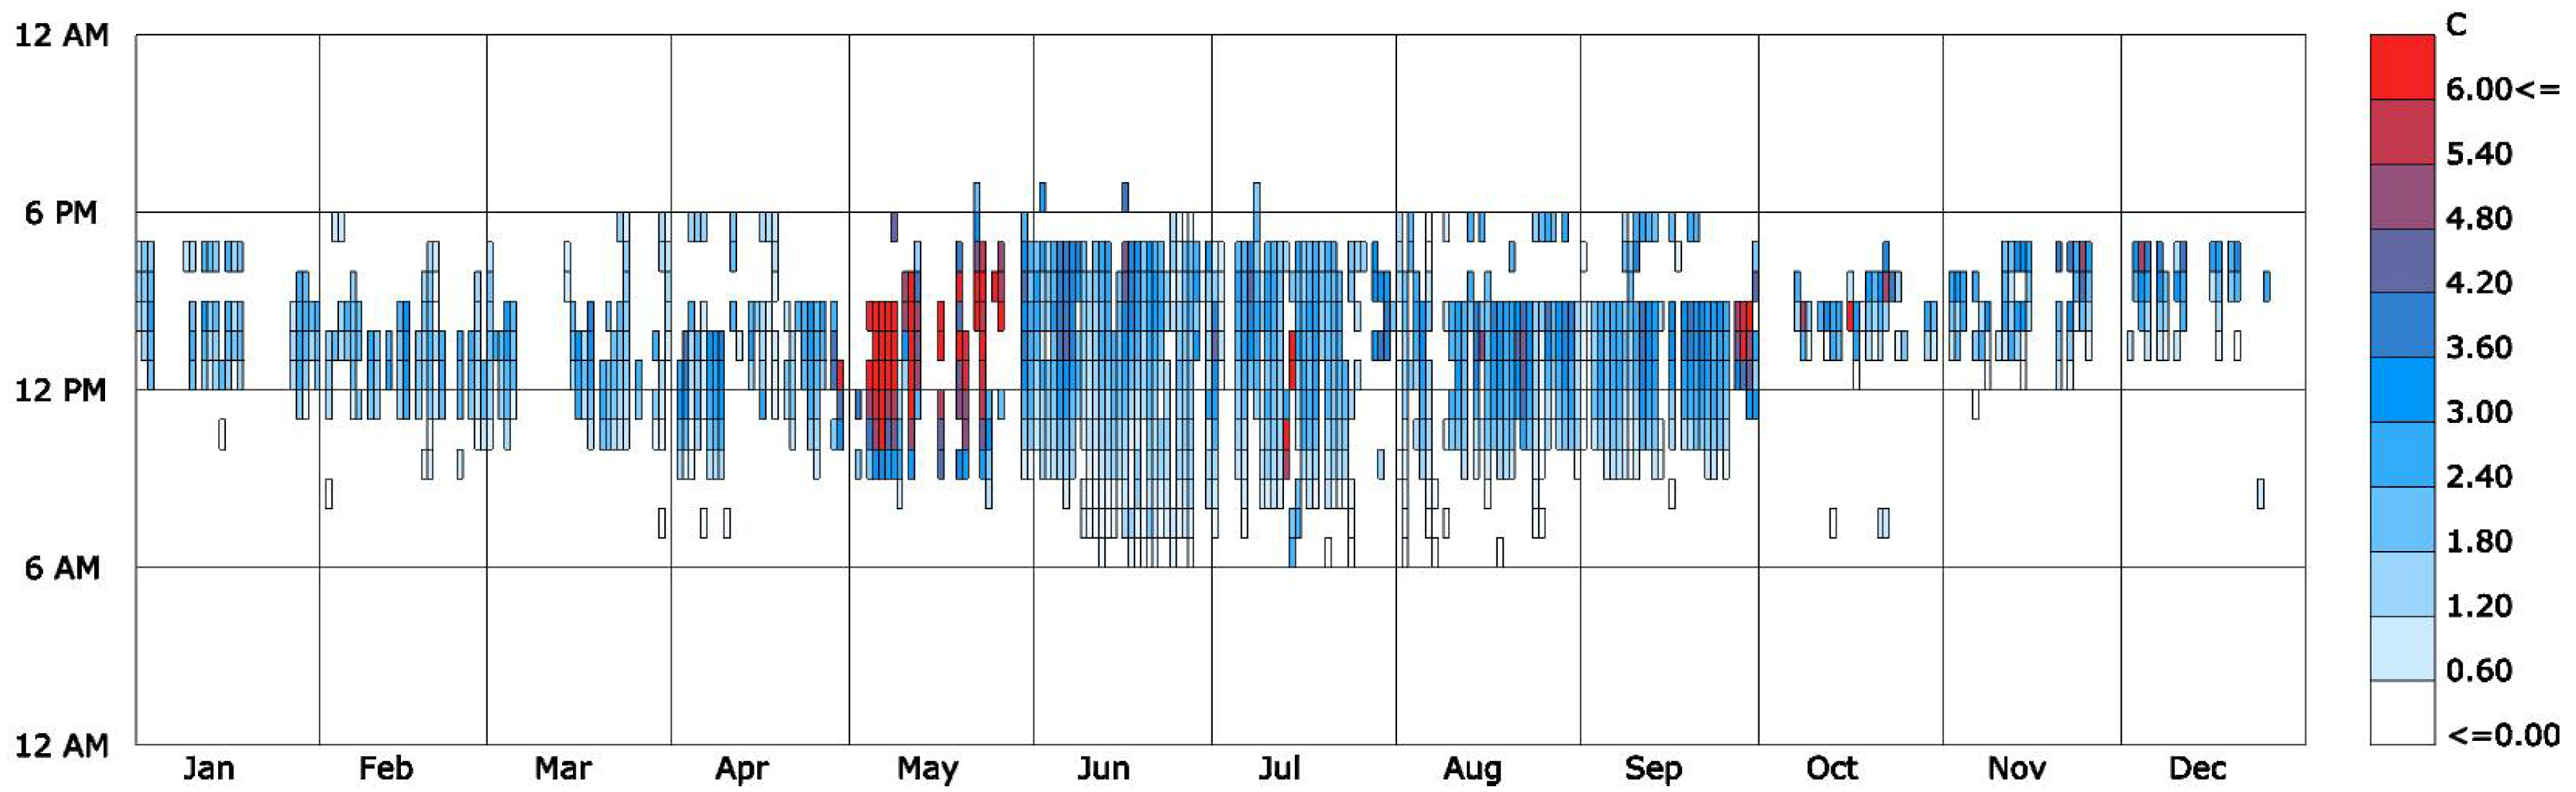
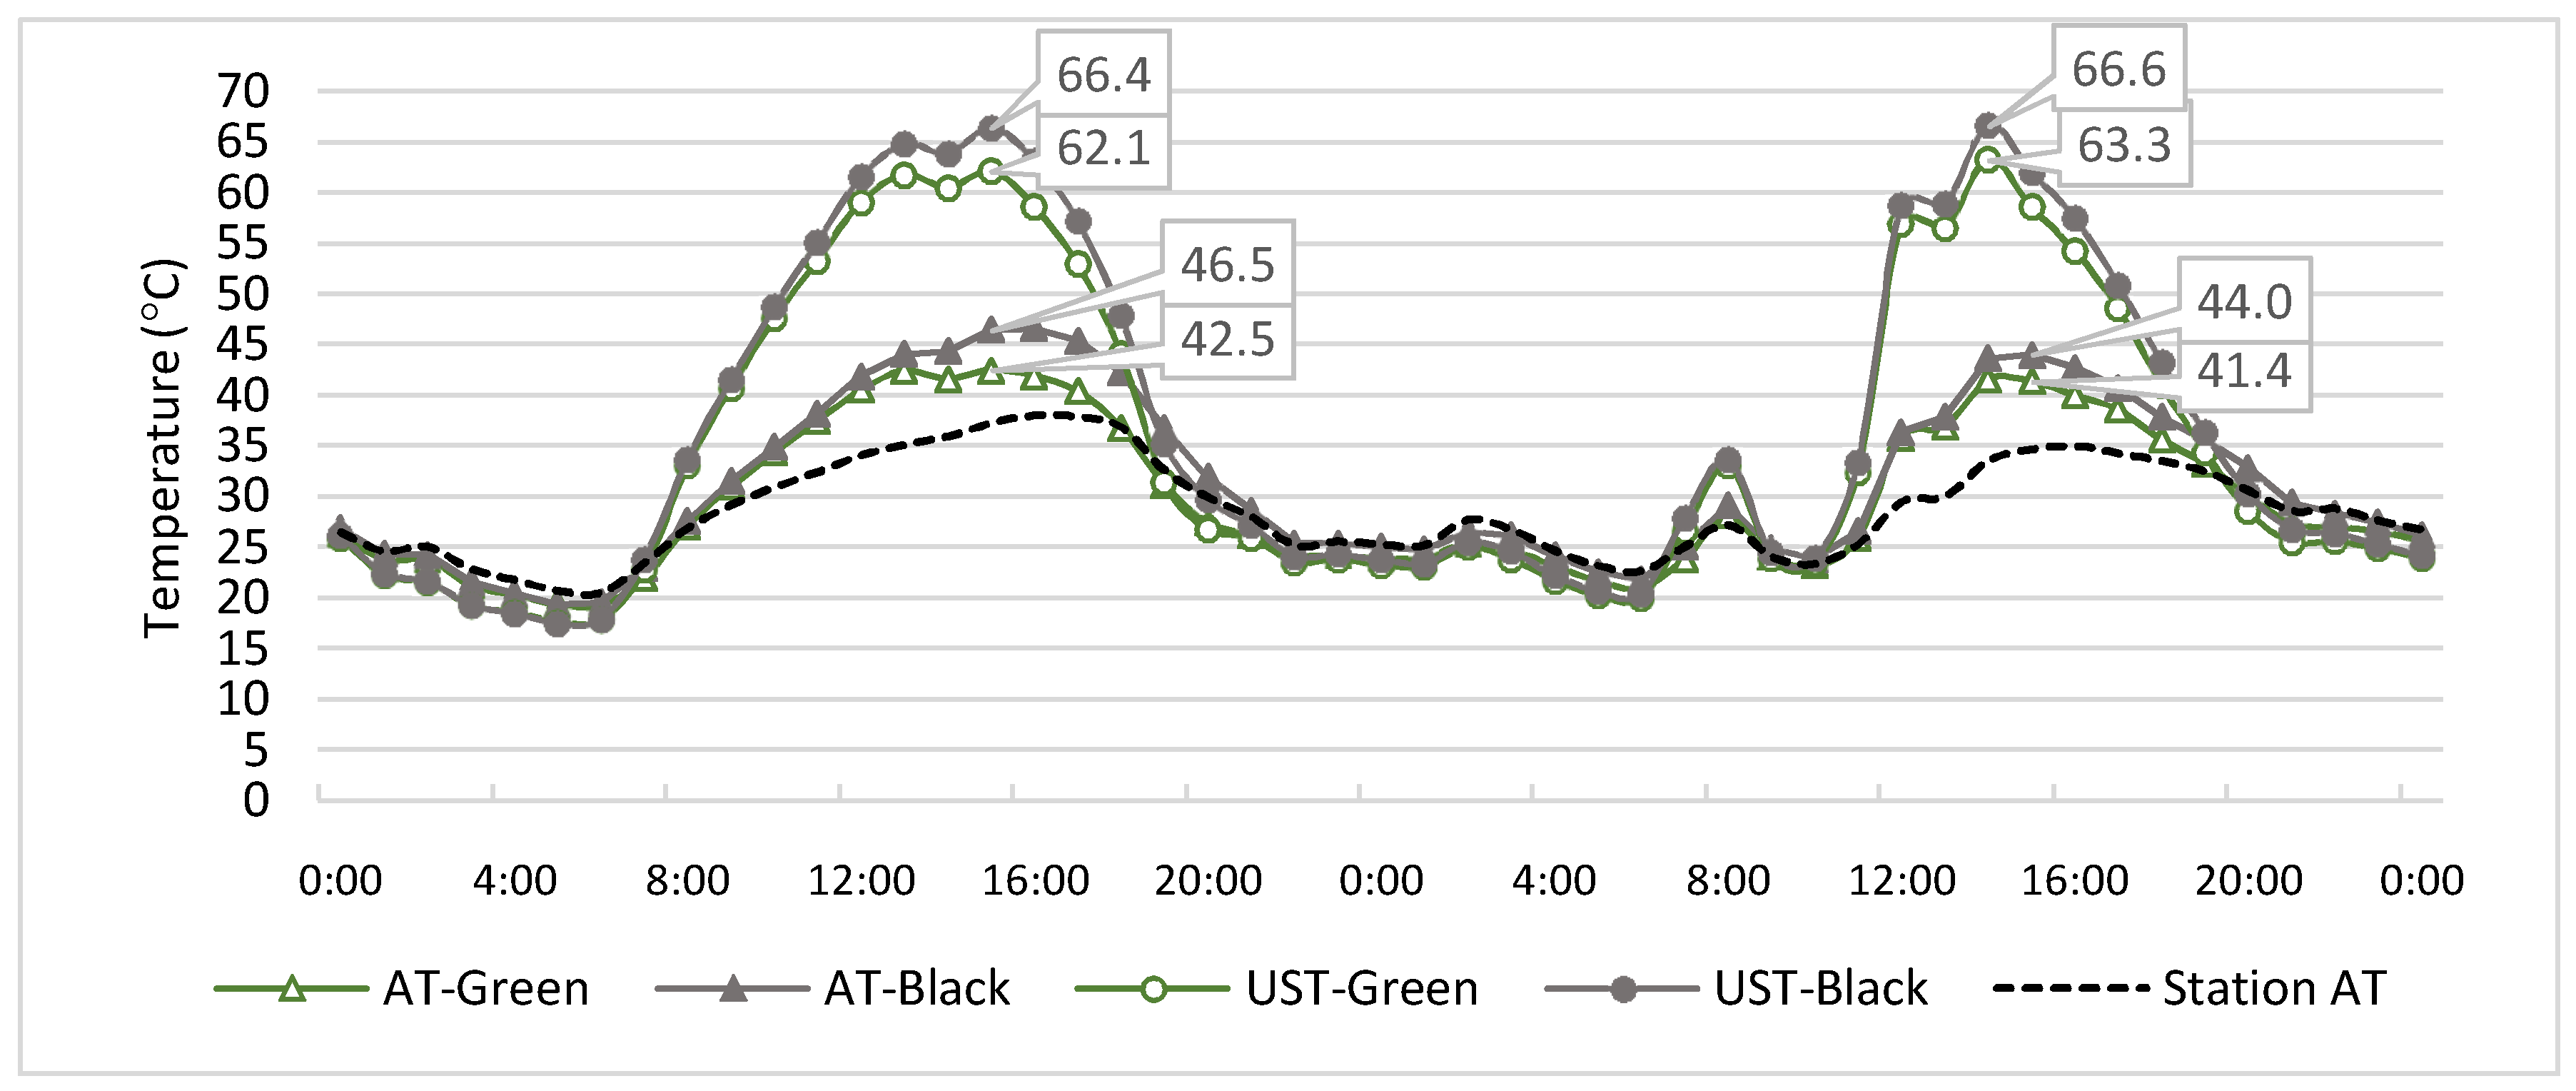
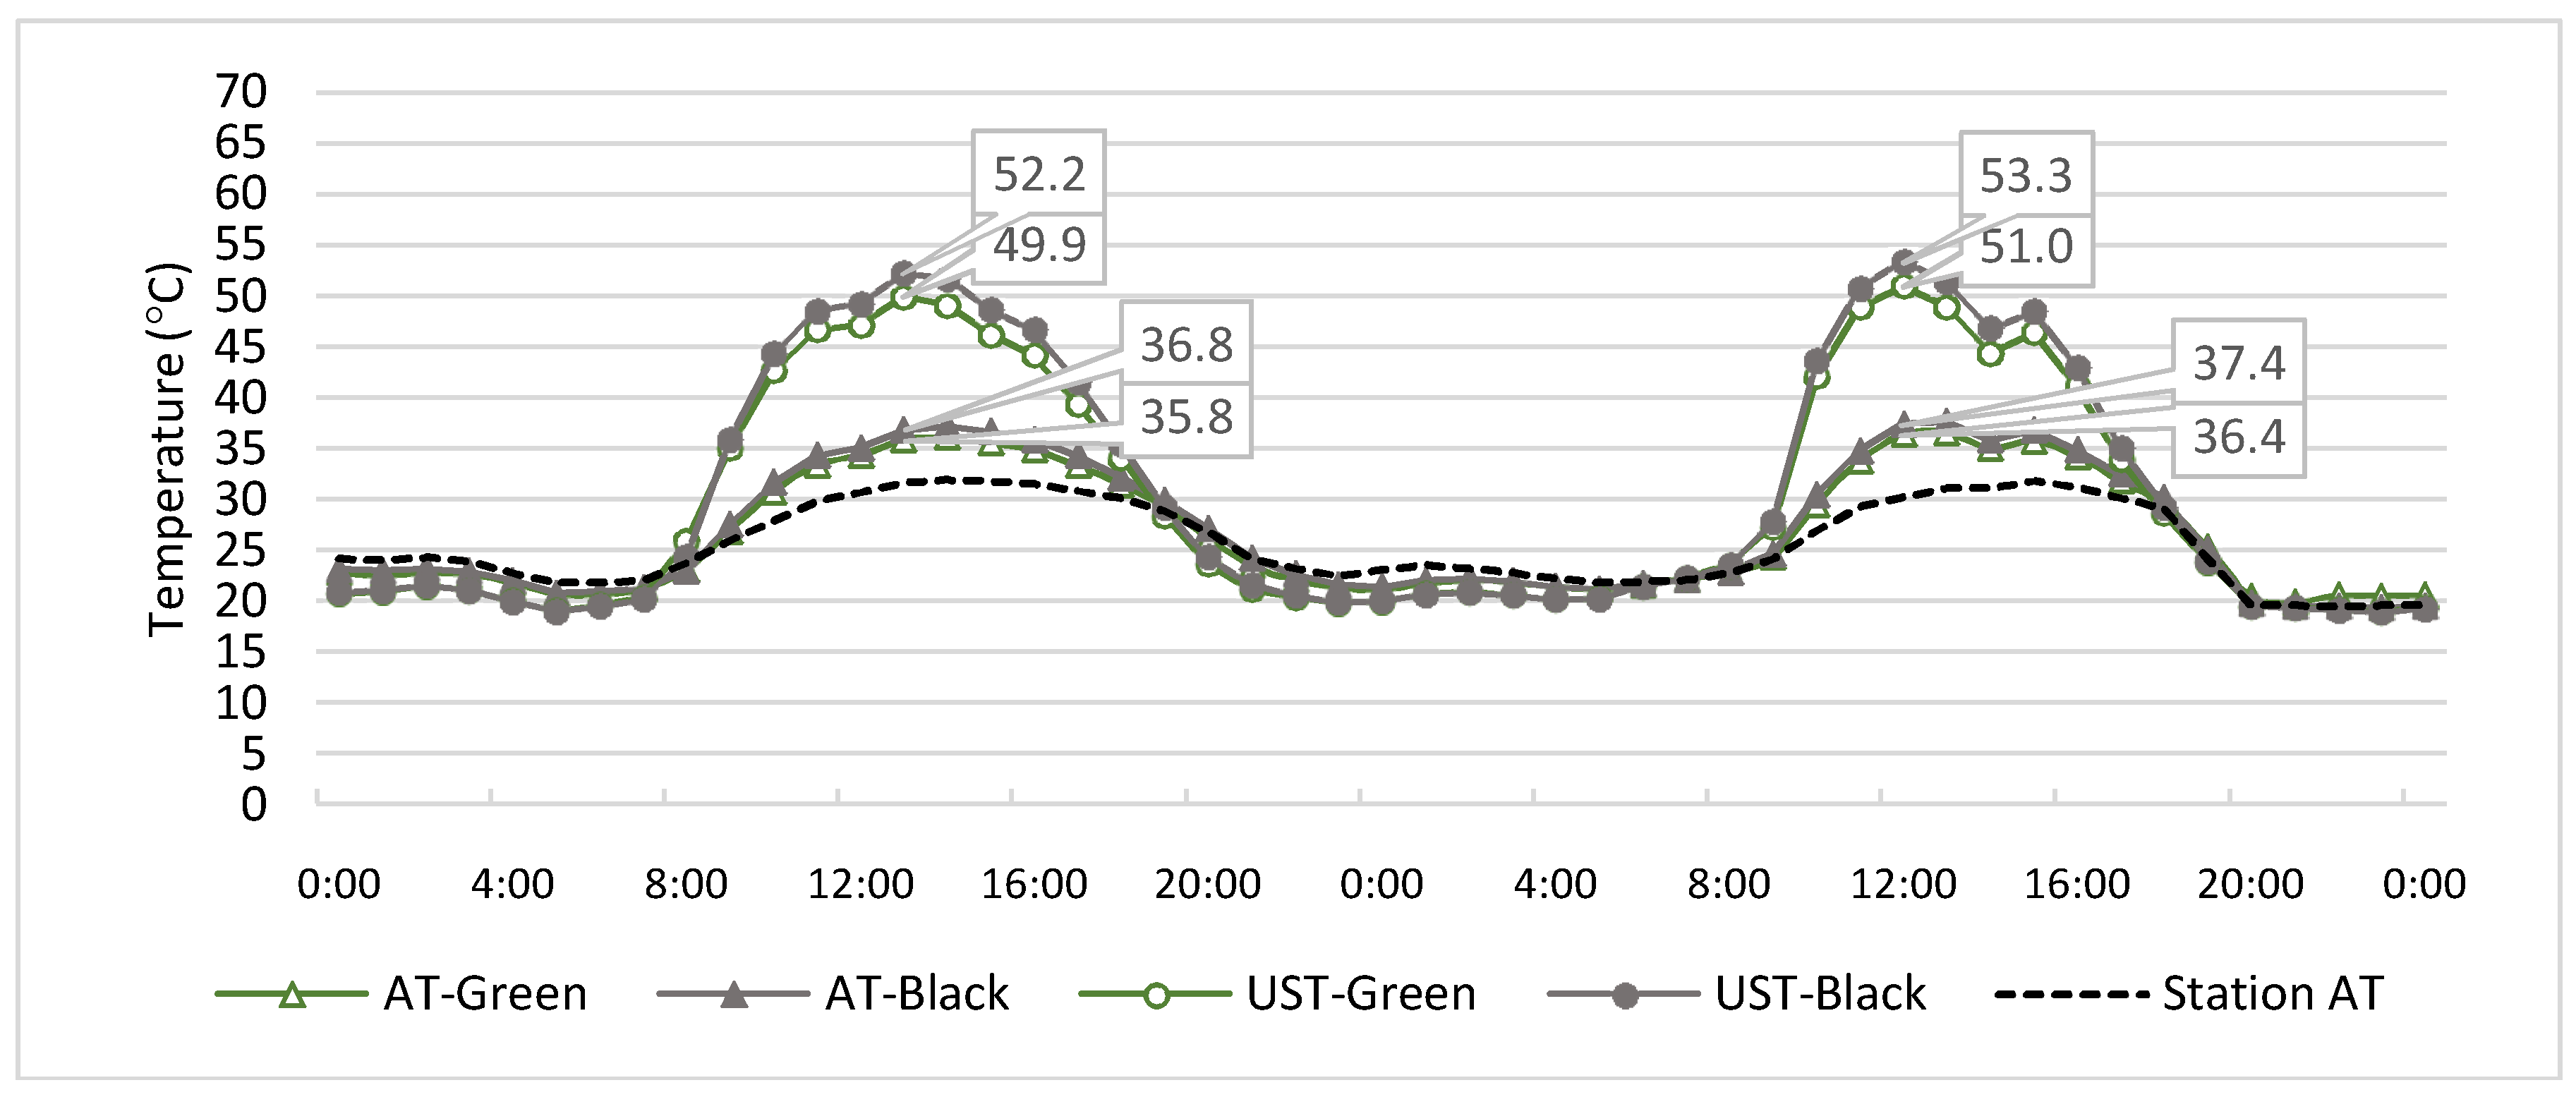
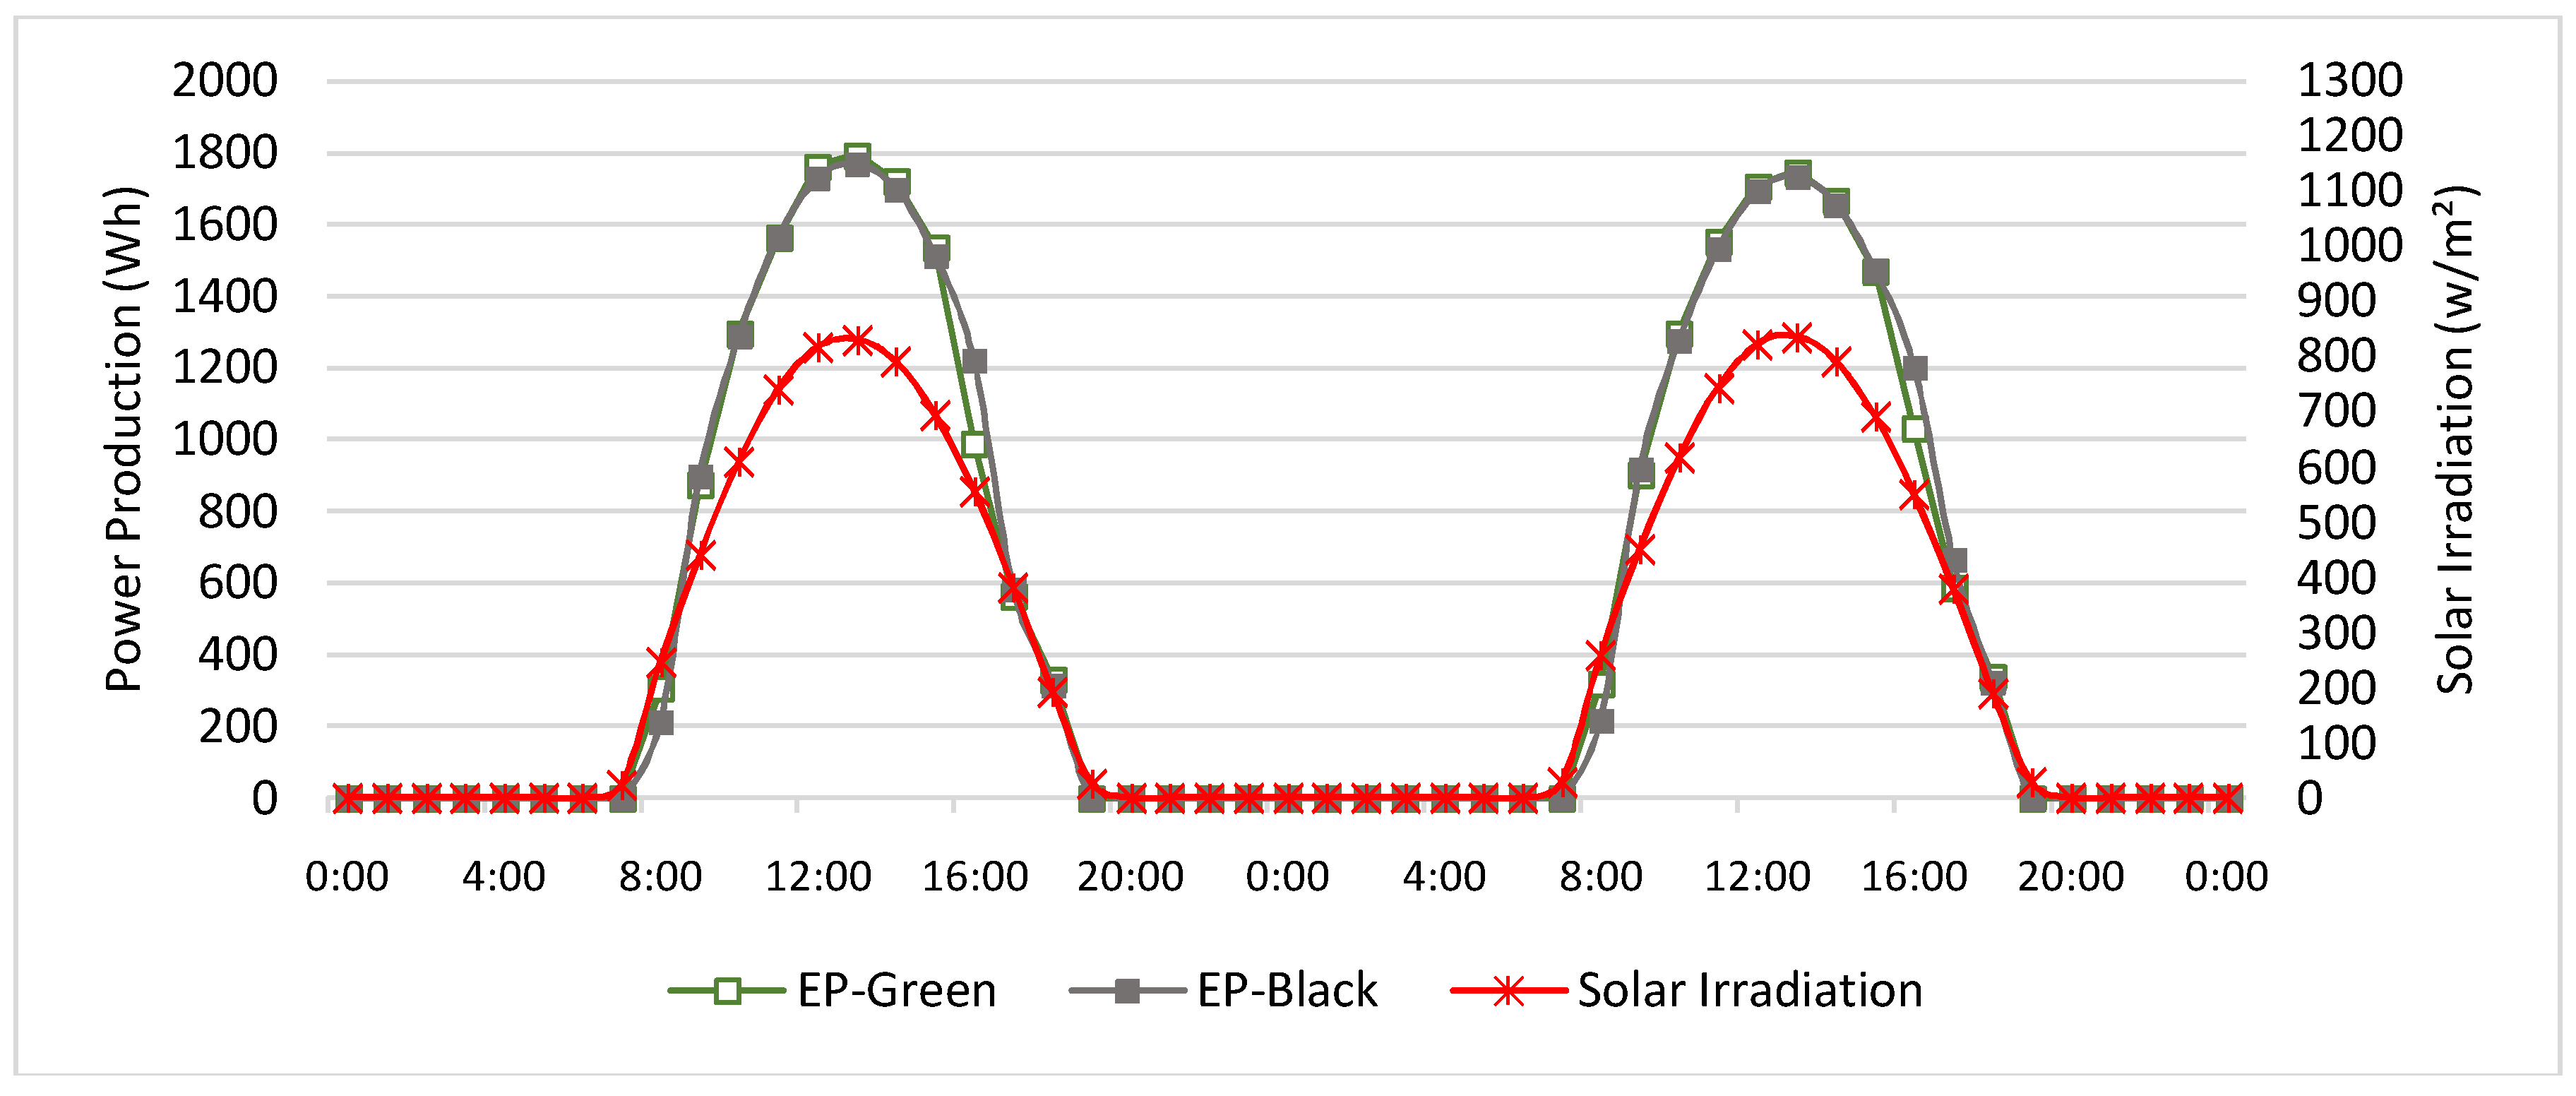
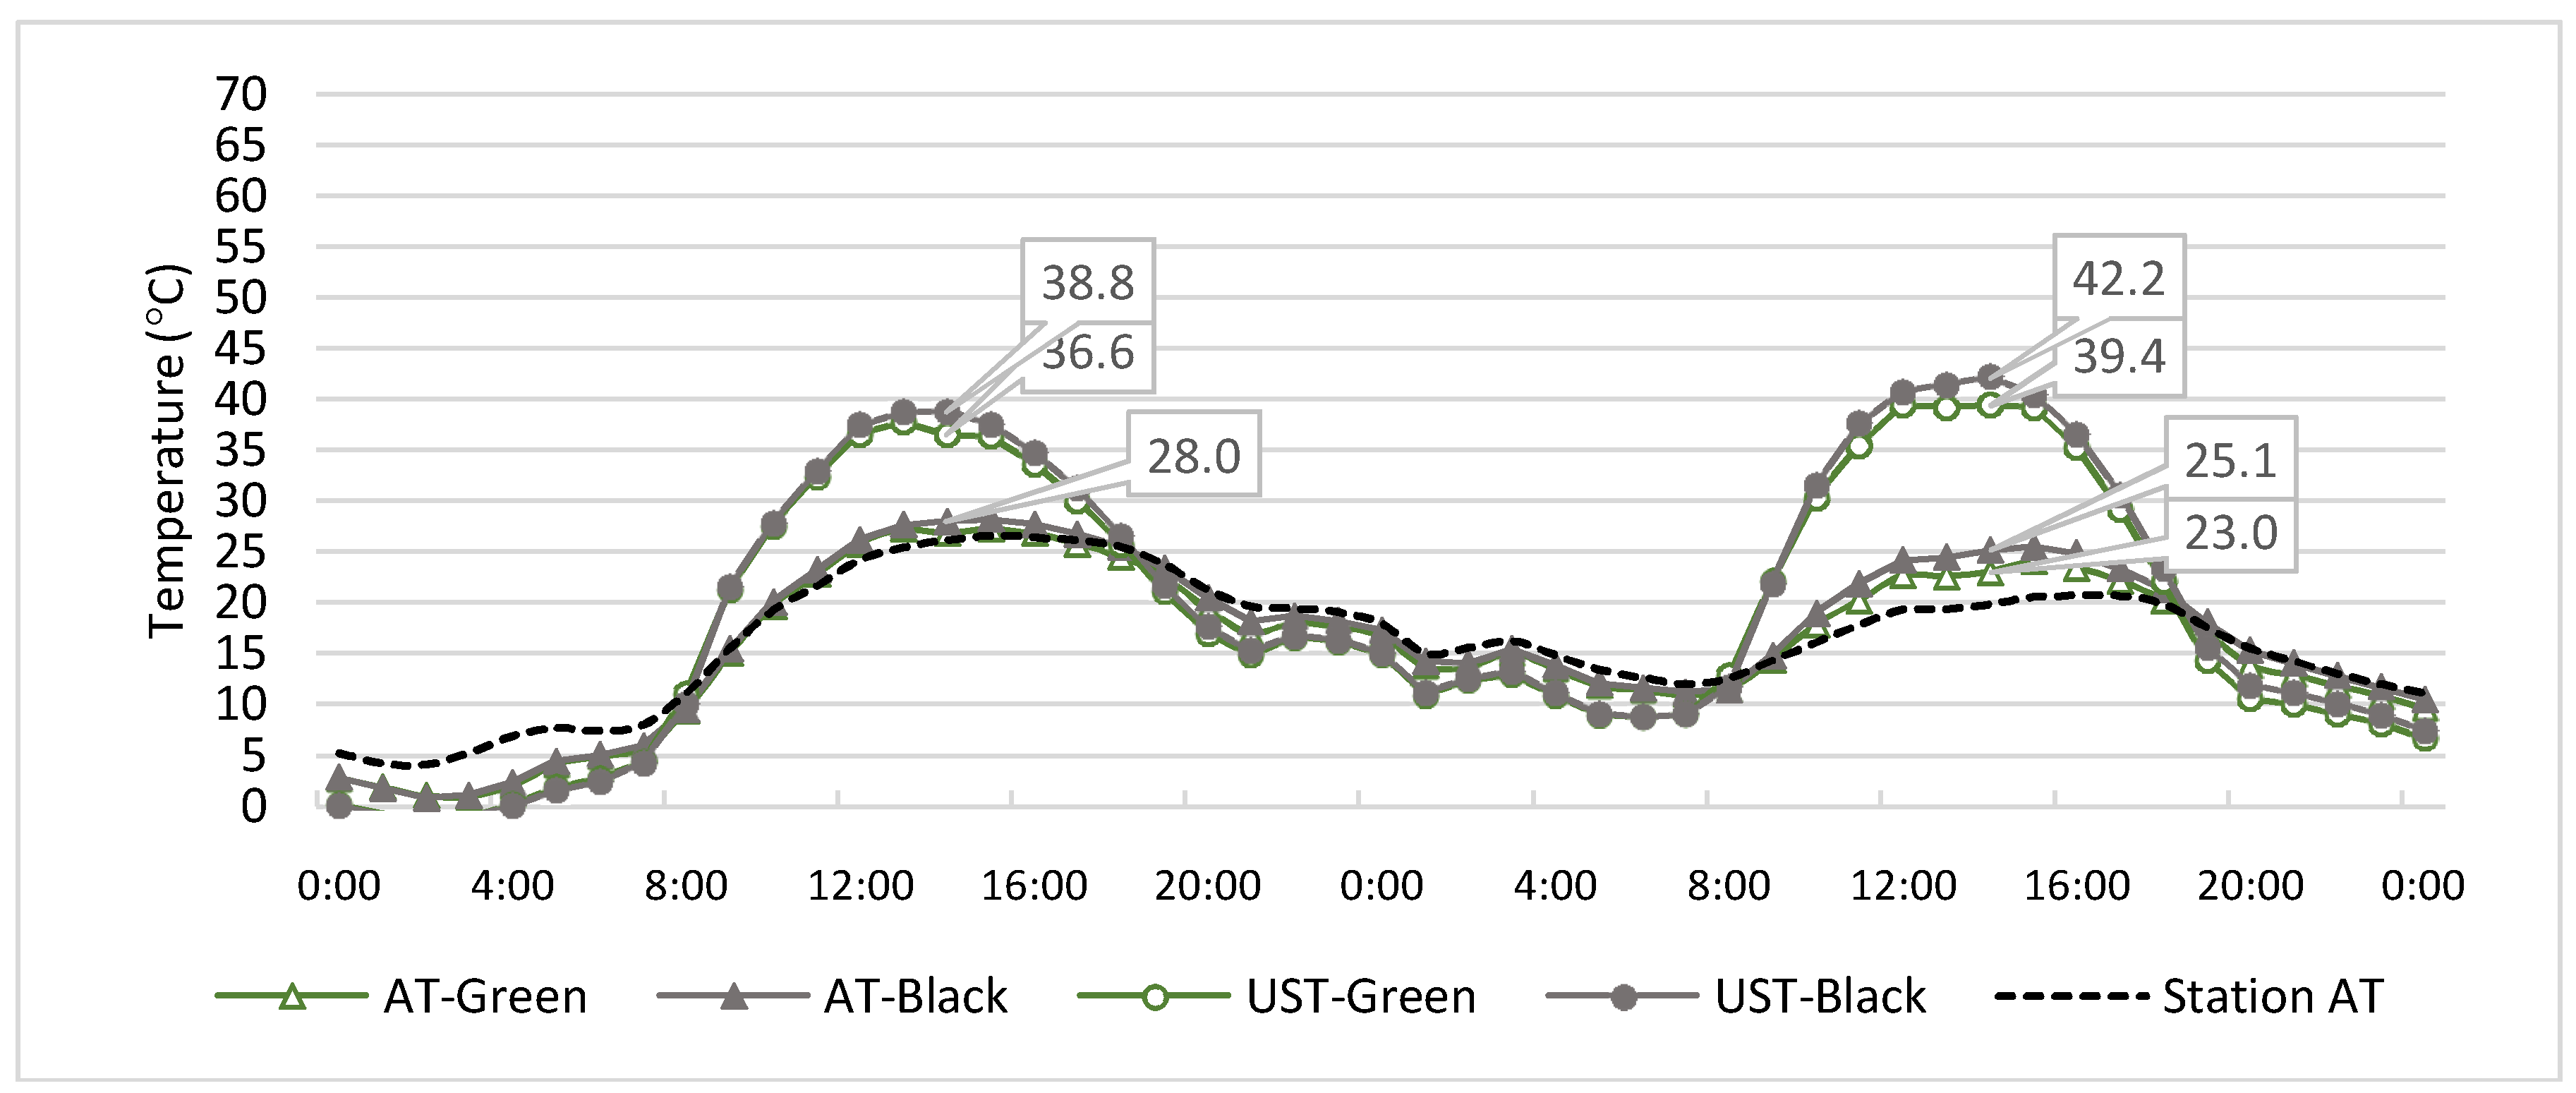
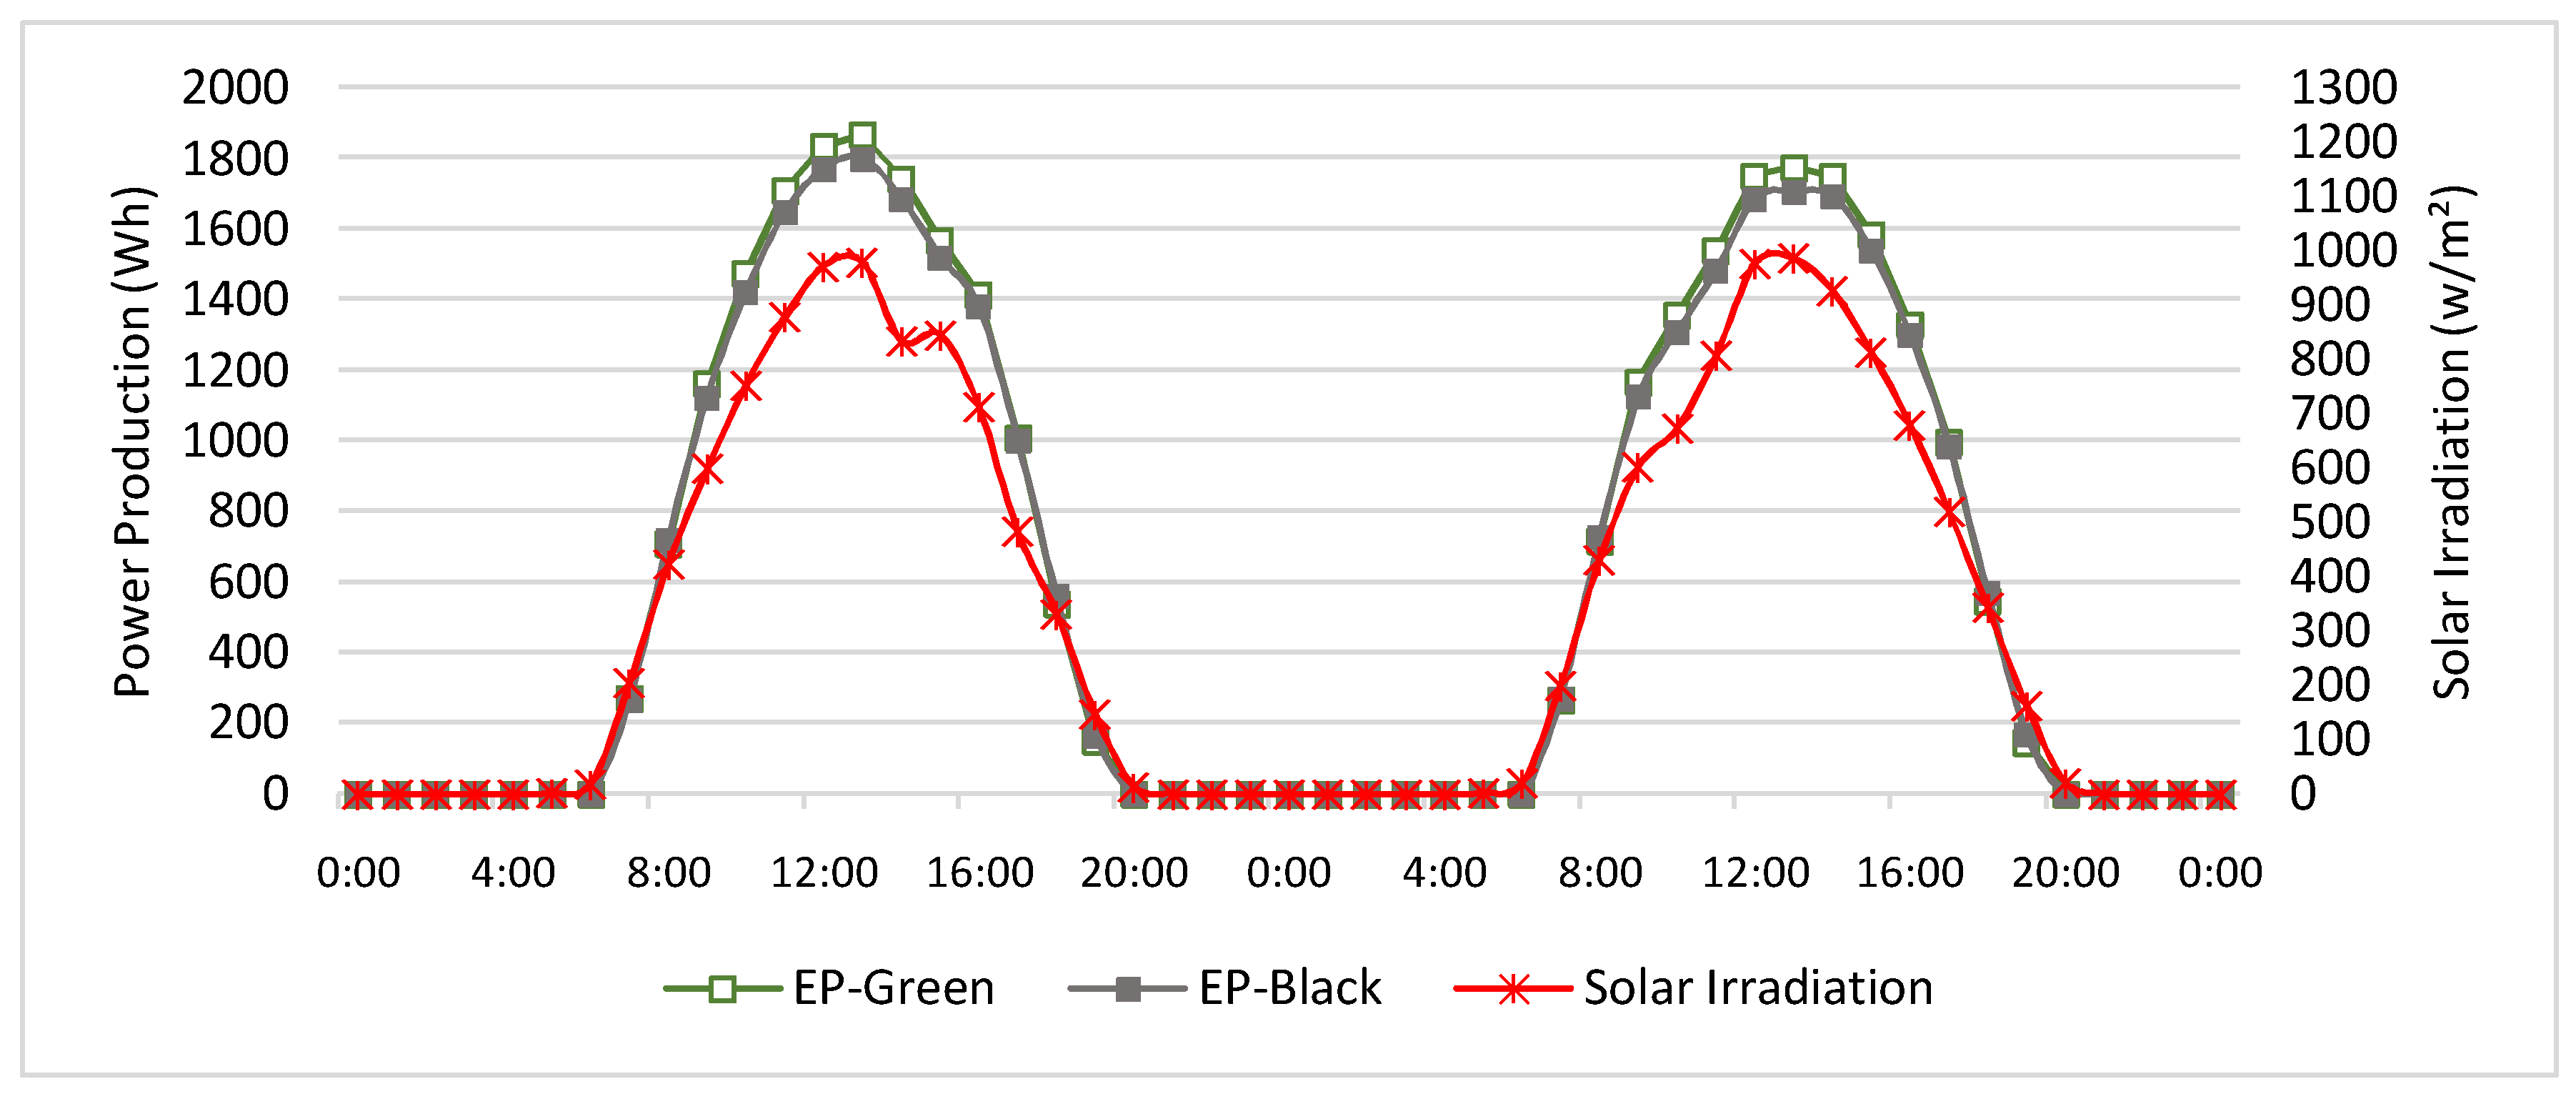
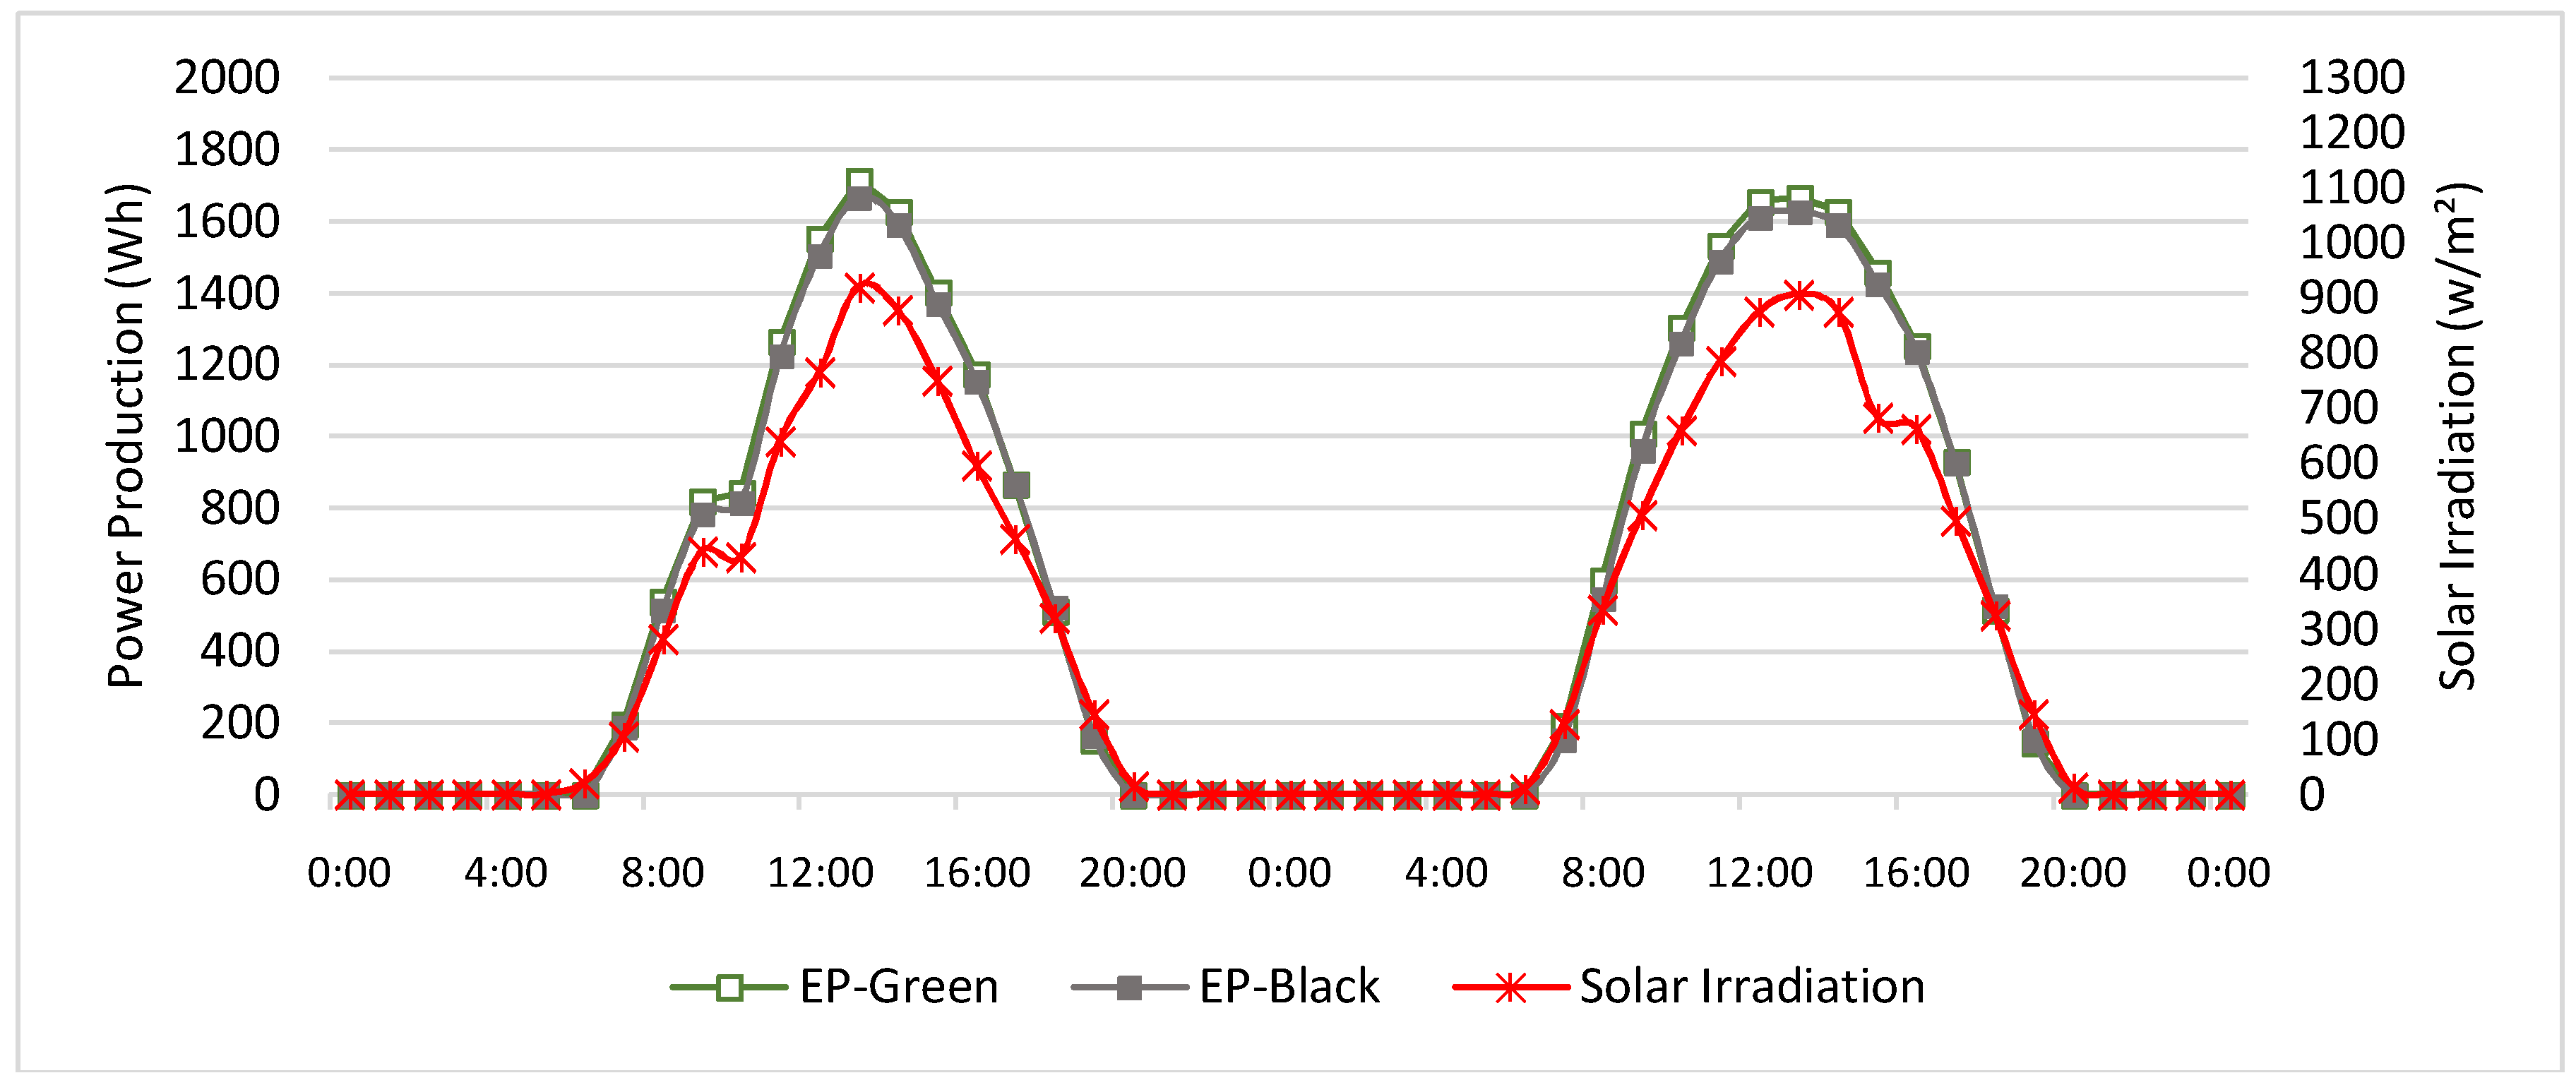
3. Results
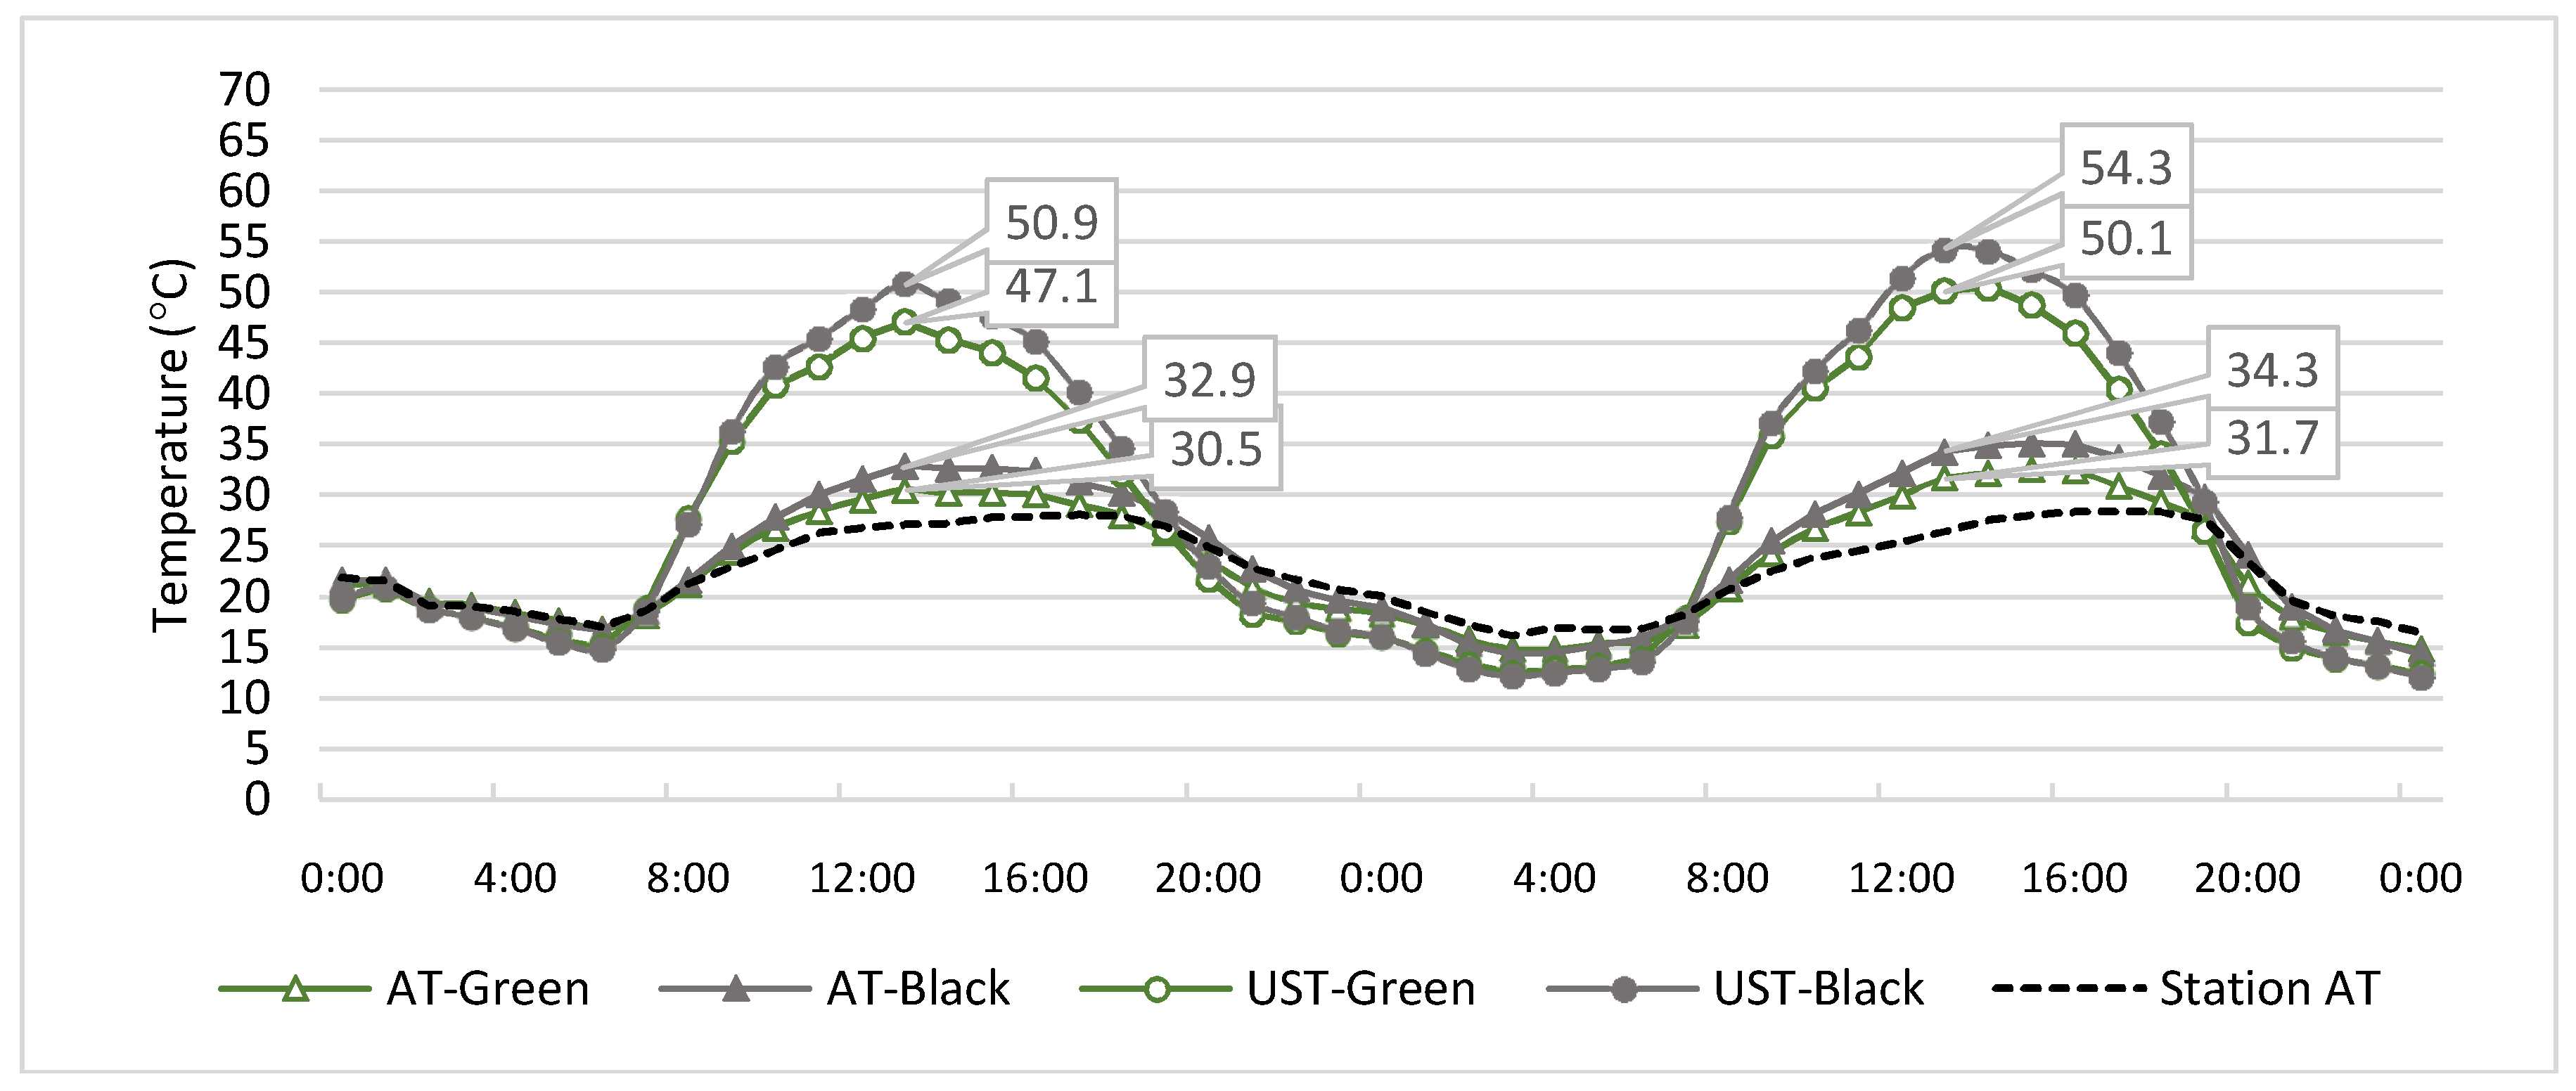
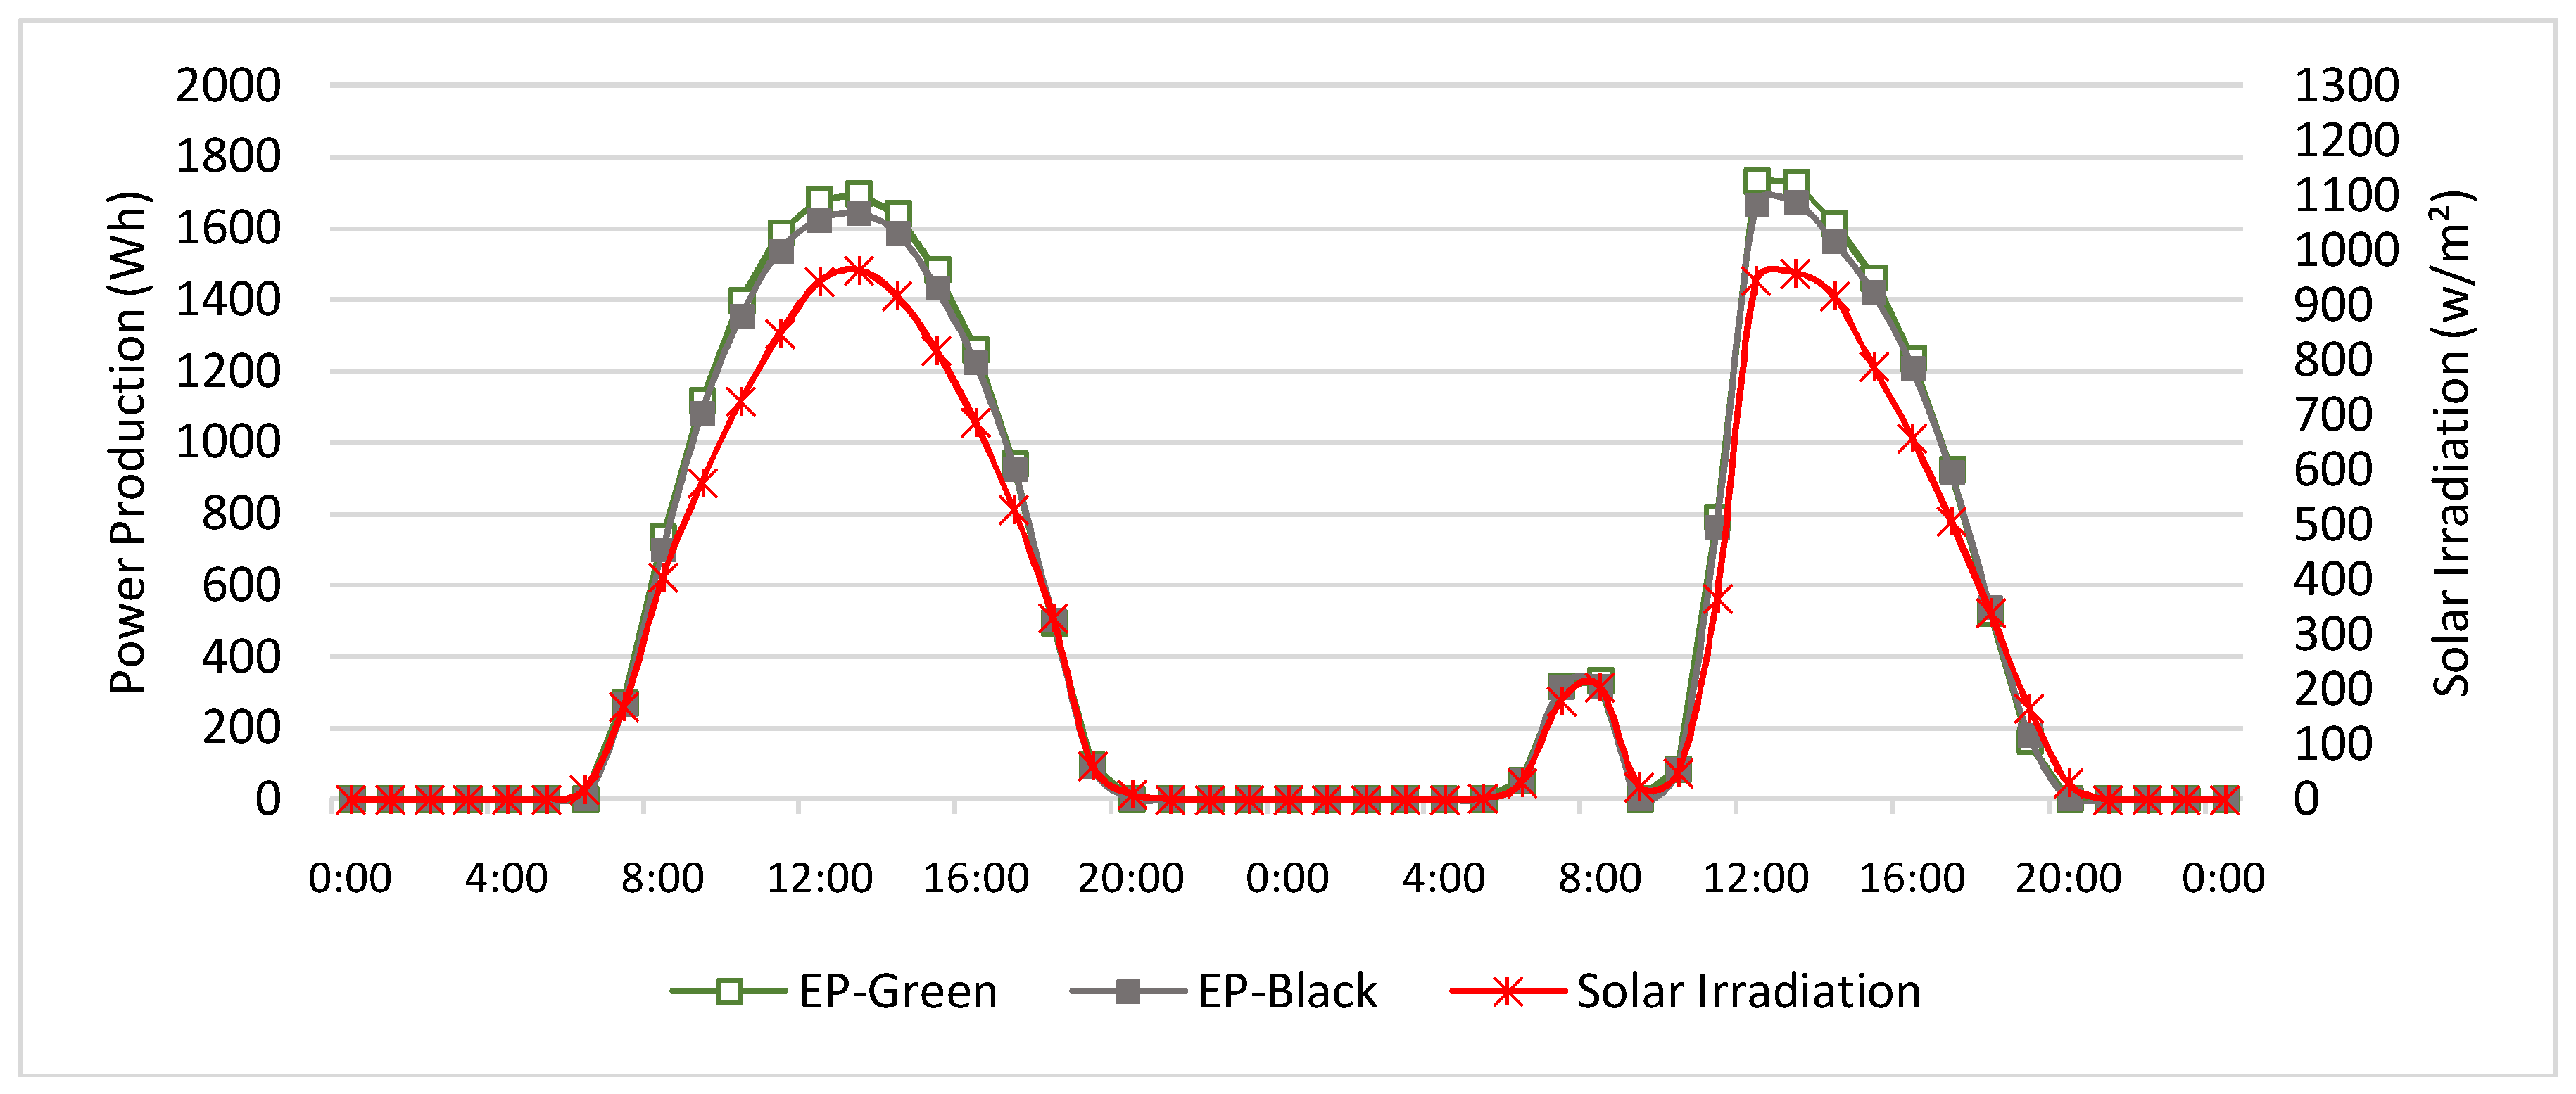
3.1. Overall Performance Analysis
3.2. Detailed Performance Analysis
4. Conclusions and Discussion
Author Contributions
Acknowledgments
Conflicts of Interest
References
- Department of Energy (DOE). International Energy Outlook 2013; Report Number: DOE/EIA-0484; US Energy Information Administration (EIA): Washington, DC, USA, 2013.
- Franklin, C.; Chang, J. Energy Consumption Monitors: Building Occupant Understanding and Behavior. In Proceedings of the ARCC Conference Repository, University of North Carolina, Charlotte, NC, USA, 27–30 March 2013. [Google Scholar]
- Architecture2030. The 2030 Challenge; Architecture2030: Santa Fe, NM, USA, 2016. [Google Scholar]
- Department of Energy (DOE). International Energy Outlook 2014; Report Number: DOE/EIA-0484; US Energy Information Administration (EIA): Washington, DC, USA, 2014.
- Renewable Energy Policy Network for the 21st Century. Renewables 2015 Global Status Report: Renewables 2015 Global Status Report; REN 21: Paris, France, 2015; ISBN 978-3-9815934-6-4. [Google Scholar]
- International Energy Agency (IEA). Renewables 2017 Analysis and Forecasts to 2022; Organisation for Economic Co-operation and Development (OECD)/IEA: Paris, France, 2017. [Google Scholar]
- International Energy Agency (IEA). Renewables Energy Medium-Term Market Report 2022; OECD/IEA: Paris, France, 2016. [Google Scholar]
- Nagengast, A.; Hendrickson, C.; Matthews, S.H. Variations in photovoltaic performance due to climate and low-slope roof choice. Energy Build. 2013, 64, 493–502. [Google Scholar] [CrossRef]
- Scherba, A.; Sailor, D.J.; Rosenstiel, T.N.; Wamser, C.C. Modeling impacts of roof reflectivity, integrated photovoltaic panels and green roof systems on sensible heat flux into the urban environment. Build. Environ. 2011, 46, 2542–2551. [Google Scholar] [CrossRef]
- US Energy Information Administration. Annual Energy Outlook 2016: With Projections to 2040; US Energy Information Administration, Office of Energy Analysis, US Department of Energy: Washington, DC, USA, 2016.
- Zheng, C.; Kammen, D.M. An innovation-focused roadmap for a sustainable global photovoltaic industry. Energy Policy 2014, 67, 159–169. [Google Scholar] [CrossRef]
- Zhang, F.; Gallagher, K.S. Innovation and technology transfer through global value chains: Evidence from China’s PV industry. Energy Policy 2016, 94, 191–203. [Google Scholar] [CrossRef]
- Huang, P.; Negro, S.O.; Hekkert, M.P.; Bi, K. How China became a leader in solar PV: An innovation system analysis. Renew. Sustain. Energy Rev. 2016, 64, 777–789. [Google Scholar] [CrossRef]
- Gartland, L. Heat Islands: Understanding and Mitigating Heat in Urban Areas; Routledge: Abingdon, UK, 2010. [Google Scholar]
- Wong, E.; Akbari, H.; Bell, R.; Cole, D. Reducing Urban Heat Islands: Compendium of Strategies; Environmental Protection Agency: Washington, DC, USA, 2011. [Google Scholar]
- Ferguson, B.; Fisher, K.; Golden, J.; Hair, L.; Haselbach, L.; Hitchcock, D.; Kaloush, K.; Pomerantz, M.; Tran, N.; Waye, D. Reducing Urban Heat Islands: Compendium of Strategies-Cool Pavements; Environmental Protection Agency: Washington, DC, USA, 2008. [Google Scholar]
- Scholz-Barth, K.; Tanner, S. Green Roofs: Federal Energy Management (FEMP) Federal Technology Alert; National Renewable Energy Lab: Golden, CO, USA, 2004. [Google Scholar]
- Köhler, M.; Wiartalla, W.; Feige, R. Interaction between PV-systems and extensive green roofs. In Proceedings of the 5th North American Green Roof Conference: Greening Rooftops for Sustainable Communities, Boston, MA, USA, 29 April–1 May 2007. [Google Scholar]
- Hui, S.C.; Chan, S.C. Integration of green roof and solar photovoltaic systems. In Proceedings of the Joint Symposium 2011: Integrated Building Design in the New Era of Sustainability, Hong Kong, China, 22 November 2011. [Google Scholar]
- Nagengast, A.L. Energy Performance Impacts from Competing Low-Slope Roofing Choices and Photovoltaic Technologies. Ph.D. Thesis, Carnegie Mellon University, Pittsburgh, PA, USA, 2013. [Google Scholar]
- Perez, M.J.; Wight, N.; Fthenakis, V.; Ho, C. Green-roof integrated PV canopies—An empirical study and teaching tool for low income students in the South Bronx. ASES 2012, 4, 6. [Google Scholar]
- Chemisana, D.; Lamnatou, C. Photovoltaic-green roofs: An experimental evaluation of system performance. Appl. Energy 2014, 119, 246–256. [Google Scholar] [CrossRef]


| Characteristics | Unit | Value |
|---|---|---|
| Maximum Power Output at STC | (W) | 235 |
| Module Efficiency | (%) | 14.4 |
| Nominal Operating Cell Temperature (NOCT) | (°C) | 46 ± 2 |
| Temperature coefficient of Voc | (V/°C) | −0.0037 |
| Temperature coefficient of Isc | (I/°C) | +0.0006 |
| Temperature coefficient of Pmpp | (W/°C) | −0.0045 |
| Characteristics | Unit | Value |
|---|---|---|
| Peak Output Power | (W) | 250 |
| Maximum continuous output power | (W) | 240 |
| Peak inverter efficiency | (%) | 96.5 |
| Static maximum power point tracking (MPPT) efficiency | (%) | 99.4 |
| Ambient temperature range | (°C) | −40 to +65 |
| Sensor Type | Accuracy | Operating Temperature |
|---|---|---|
| Onset Hobo Data Logger—U30 | ±8 s/month | −40 °C to 60 °C |
| Onset Hobo Data Logger—U12 | ±0.35 °C | −20 °C to 70 °C |
| Onset Hobo Temp Smart Sensors | ±0.2 °C | −40 °C to 100 °C |
| Air/Water/Soil Temperature Sensor | ±0.25 °C | −40 °C to 100 °C |
| Onset Hobo Pyrometer | ±10 W/m2 | −40 °C to 75 °C |
| Onset Hobo Wind Speed/Gust | ±1.1 m/s | −40 °C to 75 °C |
| Onset Hobo Wind Direction | ±5 degrees | −40 °C to 70 °C |
| Month | EP-Green (kWh) | EP-Black (kWh) | Difference (kWh) | Difference (%) | Ambient Temperature (°C) | ||
|---|---|---|---|---|---|---|---|
| Min | Avg | Max | |||||
| January | 48.18 | 47.67 | 0.51 | 1.1% | −14.8 | 3.1 | 20.0 |
| February | 102.86 | 102.47 | 0.39 | 0.4% | −7.4 | 8.9 | 24.5 |
| March | 84.36 | 83.93 | 0.42 | 0.5% | −0.3 | 14.5 | 25.5 |
| April | 141.82 | 141.86 | −0.04 | 0.0% | 7.8 | 18.2 | 26.7 |
| May | 141.59 | 139.77 | 1.82 | 1.3% | 9.4 | 22.1 | 30.9 |
| June | 245.52 | 239.79 | 5.73 | 2.4% | 14.6 | 30.2 | 38.2 |
| July | 198.87 | 194.87 | 3.99 | 2.0% | 17.6 | 30.1 | 36.9 |
| August | 165.85 | 163.13 | 2.72 | 1.7% | 19.2 | 28.8 | 36.7 |
| Sepetember | 131.14 | 130.53 | 0.61 | 0.5% | 15.0 | 27.2 | 33.6 |
| Octorber | 94.28 | 92.86 | 1.41 | 1.5% | 2.3 | 21.0 | 30.0 |
| November | 48.56 | 47.65 | 0.91 | 1.9% | −0.8 | 17.2 | 25.0 |
| December | 36.32 | 35.36 | 0.96 | 2.7% | −2.0 | 8.6 | 18.6 |
| Annual Total | 1439.34 | 1419.90 | 19.43 | 1.4% | - | - | - |
© 2018 by the authors. Licensee MDPI, Basel, Switzerland. This article is an open access article distributed under the terms and conditions of the Creative Commons Attribution (CC BY) license (http://creativecommons.org/licenses/by/4.0/).
Share and Cite
Alshayeb, M.J.; Chang, J.D. Variations of PV Panel Performance Installed over a Vegetated Roof and a Conventional Black Roof. Energies 2018, 11, 1110. https://doi.org/10.3390/en11051110
Alshayeb MJ, Chang JD. Variations of PV Panel Performance Installed over a Vegetated Roof and a Conventional Black Roof. Energies. 2018; 11(5):1110. https://doi.org/10.3390/en11051110
Chicago/Turabian StyleAlshayeb, Mohammed J., and Jae D. Chang. 2018. "Variations of PV Panel Performance Installed over a Vegetated Roof and a Conventional Black Roof" Energies 11, no. 5: 1110. https://doi.org/10.3390/en11051110
APA StyleAlshayeb, M. J., & Chang, J. D. (2018). Variations of PV Panel Performance Installed over a Vegetated Roof and a Conventional Black Roof. Energies, 11(5), 1110. https://doi.org/10.3390/en11051110