Article

Geological Factors and Reservoir Properties Affecting the Gas Content of Coal Seams in the Gujiao Area, Northwest Qinshui Basin, China

1
School of Energy Resources, China University of Geosciences, Beijing 100083, China
2
Coal Reservoir Laboratory of National Engineering Research Center of CBM Development & Utilization, China University of Geosciences, Beijing 100083, China
*
Author to whom correspondence should be addressed.
Energies 2018, 11(5), 1044; https://doi.org/10.3390/en11051044
Submission received: 28 March 2018 / Revised: 20 April 2018 / Accepted: 23 April 2018 / Published: 24 April 2018
(This article belongs to the Section L: Energy Sources)

Abstract

:
Coalbed methane (CBM) well drilling and logging data together with geological data were adopted to provide insights into controlling mechanism of gas content in major coal seams and establish gas accumulation models in the Gujiao area, Northwest Qinshui Basin, China. Gas content of targeted coals is various in the Gujiao area with their burial depth ranging from 295 to 859 m. Highly variable gas content of coals should be derived from the differences among tectonism, magmatism, hydrodynamism, and sedimentation. Gas content preserved in the Gujiao area is divided into two parts by the geological structure. Gas tends to accumulate in the groundwater stagnant zone with a total dissolved solids (TDS) value of 1300–1700 ppm due to water pressure in the Gujiao area. Reservoir properties including moisture content, minerals, and pore structure also significantly result in gas content variability. Subsequently, the gray correlation statistic method was adopted to determine the most important factors controlling gas content. Coal metamorphism and geological structure had marked control on gas content for the targeted coals. Finally, the favorable CBM exploitation areas were comprehensively evaluated in the Gujiao area. The results showed that the most favorable CBM exploitation areas were in the mid-south part of the Gujiao area (Block I).

1. Introduction

Coalbed methane (CBM) as an unconventional natural gas is a key energy resource, and its recovery can reduce both greenhouse gas emission and mining explosions [1,2]. With the increase in gas demand, CBM has been paid more attention, so an evaluation of gas resources and gas controlling factors has been required [3].
Gas content in coal seams is critical for gas resource assessment during CBM exploration and exploitation. The generation, migration, and accumulation of CBM in coal seams are affected by multiple factors including coal rank, geological structure, burial depth, hydrological condition, coal properties, and reservoir characteristics [4,5,6,7,8]. A heterogeneous gas content distribution originates from composed controlling factors. Geological factors, hydrological factors, and reservoir properties affecting gas content in coals have been normally interlinked [9,10]. For instance, gas content in the eastern Surat Basin did not simply increase with burial depth or hydrostatic pressure. Methane adsorption capacity changed in a “U-shape” with the increase in coal rank [3,11,12]. In contrast, gas content may increase first and then decrease sharply when coal rank reaches anthracites, as found in coal samples from 160 coalmines of China [13]. Thick coal seams extend the path of gas transport, as is the case when gas diffuses from inside coals to the roof or floor, which is conducive to gas preservation [14]. A negative relationship was found between inertinite and gas content, but vitrinite and gas content had a positive one [12]. Methane adsorption capacity showed linear [15,16] or non-linear [17] decreases with increases in moisture. Unexpectedly, ash yield has no significant relationship with gas content, whereas coal with high ash yield tends to reserve more gases [18].
Gas in the Qinshui Basin assumes approximately 3.28 × 10¹² m3. This basin is a well developed CBM area in China. The gas content from anthracites with vitrinite reflectance of 2.2–4.5% in the southern Qinshui Basin (SQB) is relatively high [19,20] and varies with geological structures and hydrodynamics [21,22]. The CBM reservoir has relatively low permeability (0.047–1.337 mD) [23], which will significantly affect CBM production performance [24]. Studies [19,21,25,26,27] on tectonic and sedimentary evolution, CBM reservoir characteristics, and CBM potential have been conducted in the SQB. However, few works have been conducted in the northern Qinshui Basin in terms of geology, reservoir, or gas potential, especially in the Gujiao area. The Gujiao area is located in the northwestern Xishan coalfield, lying in the north of the Qinshui Basin, which is becoming a CBM commercial pilot site with resources of approximately 82 billion m3 [28]. Previous studies in the Gujiao area have covered the pressure system of CBM reservoirs [29], key factors affecting gas production [30,31], coal facies and structures [32,33,34], and CBM potential evaluation [35]. Until now, little research on factors controlling gas content in the Gujiao area has been done [36,37], and the quantitative evaluation on gas content was neglected. Therefore, the geological and reservoir factors (among other factors) controlling gas content in different coals need to be determined. This study is meant to establish a more detailed quantitative evaluation of CBM enrichment vertically and regionally in the Gujiao area.
This work begins with a mini-review of the geologic background in the Gujiao area and of the factors affecting gas content. Furthermore, the gray correlation method is adopted to quantitatively determine the key factors affecting the gas content of coal seams in the Gujiao area. Finally, gas accumulation models of different coal seams were established. The results are expected to have several implications for CBM exploration and development in the northern Qinshui Basin.

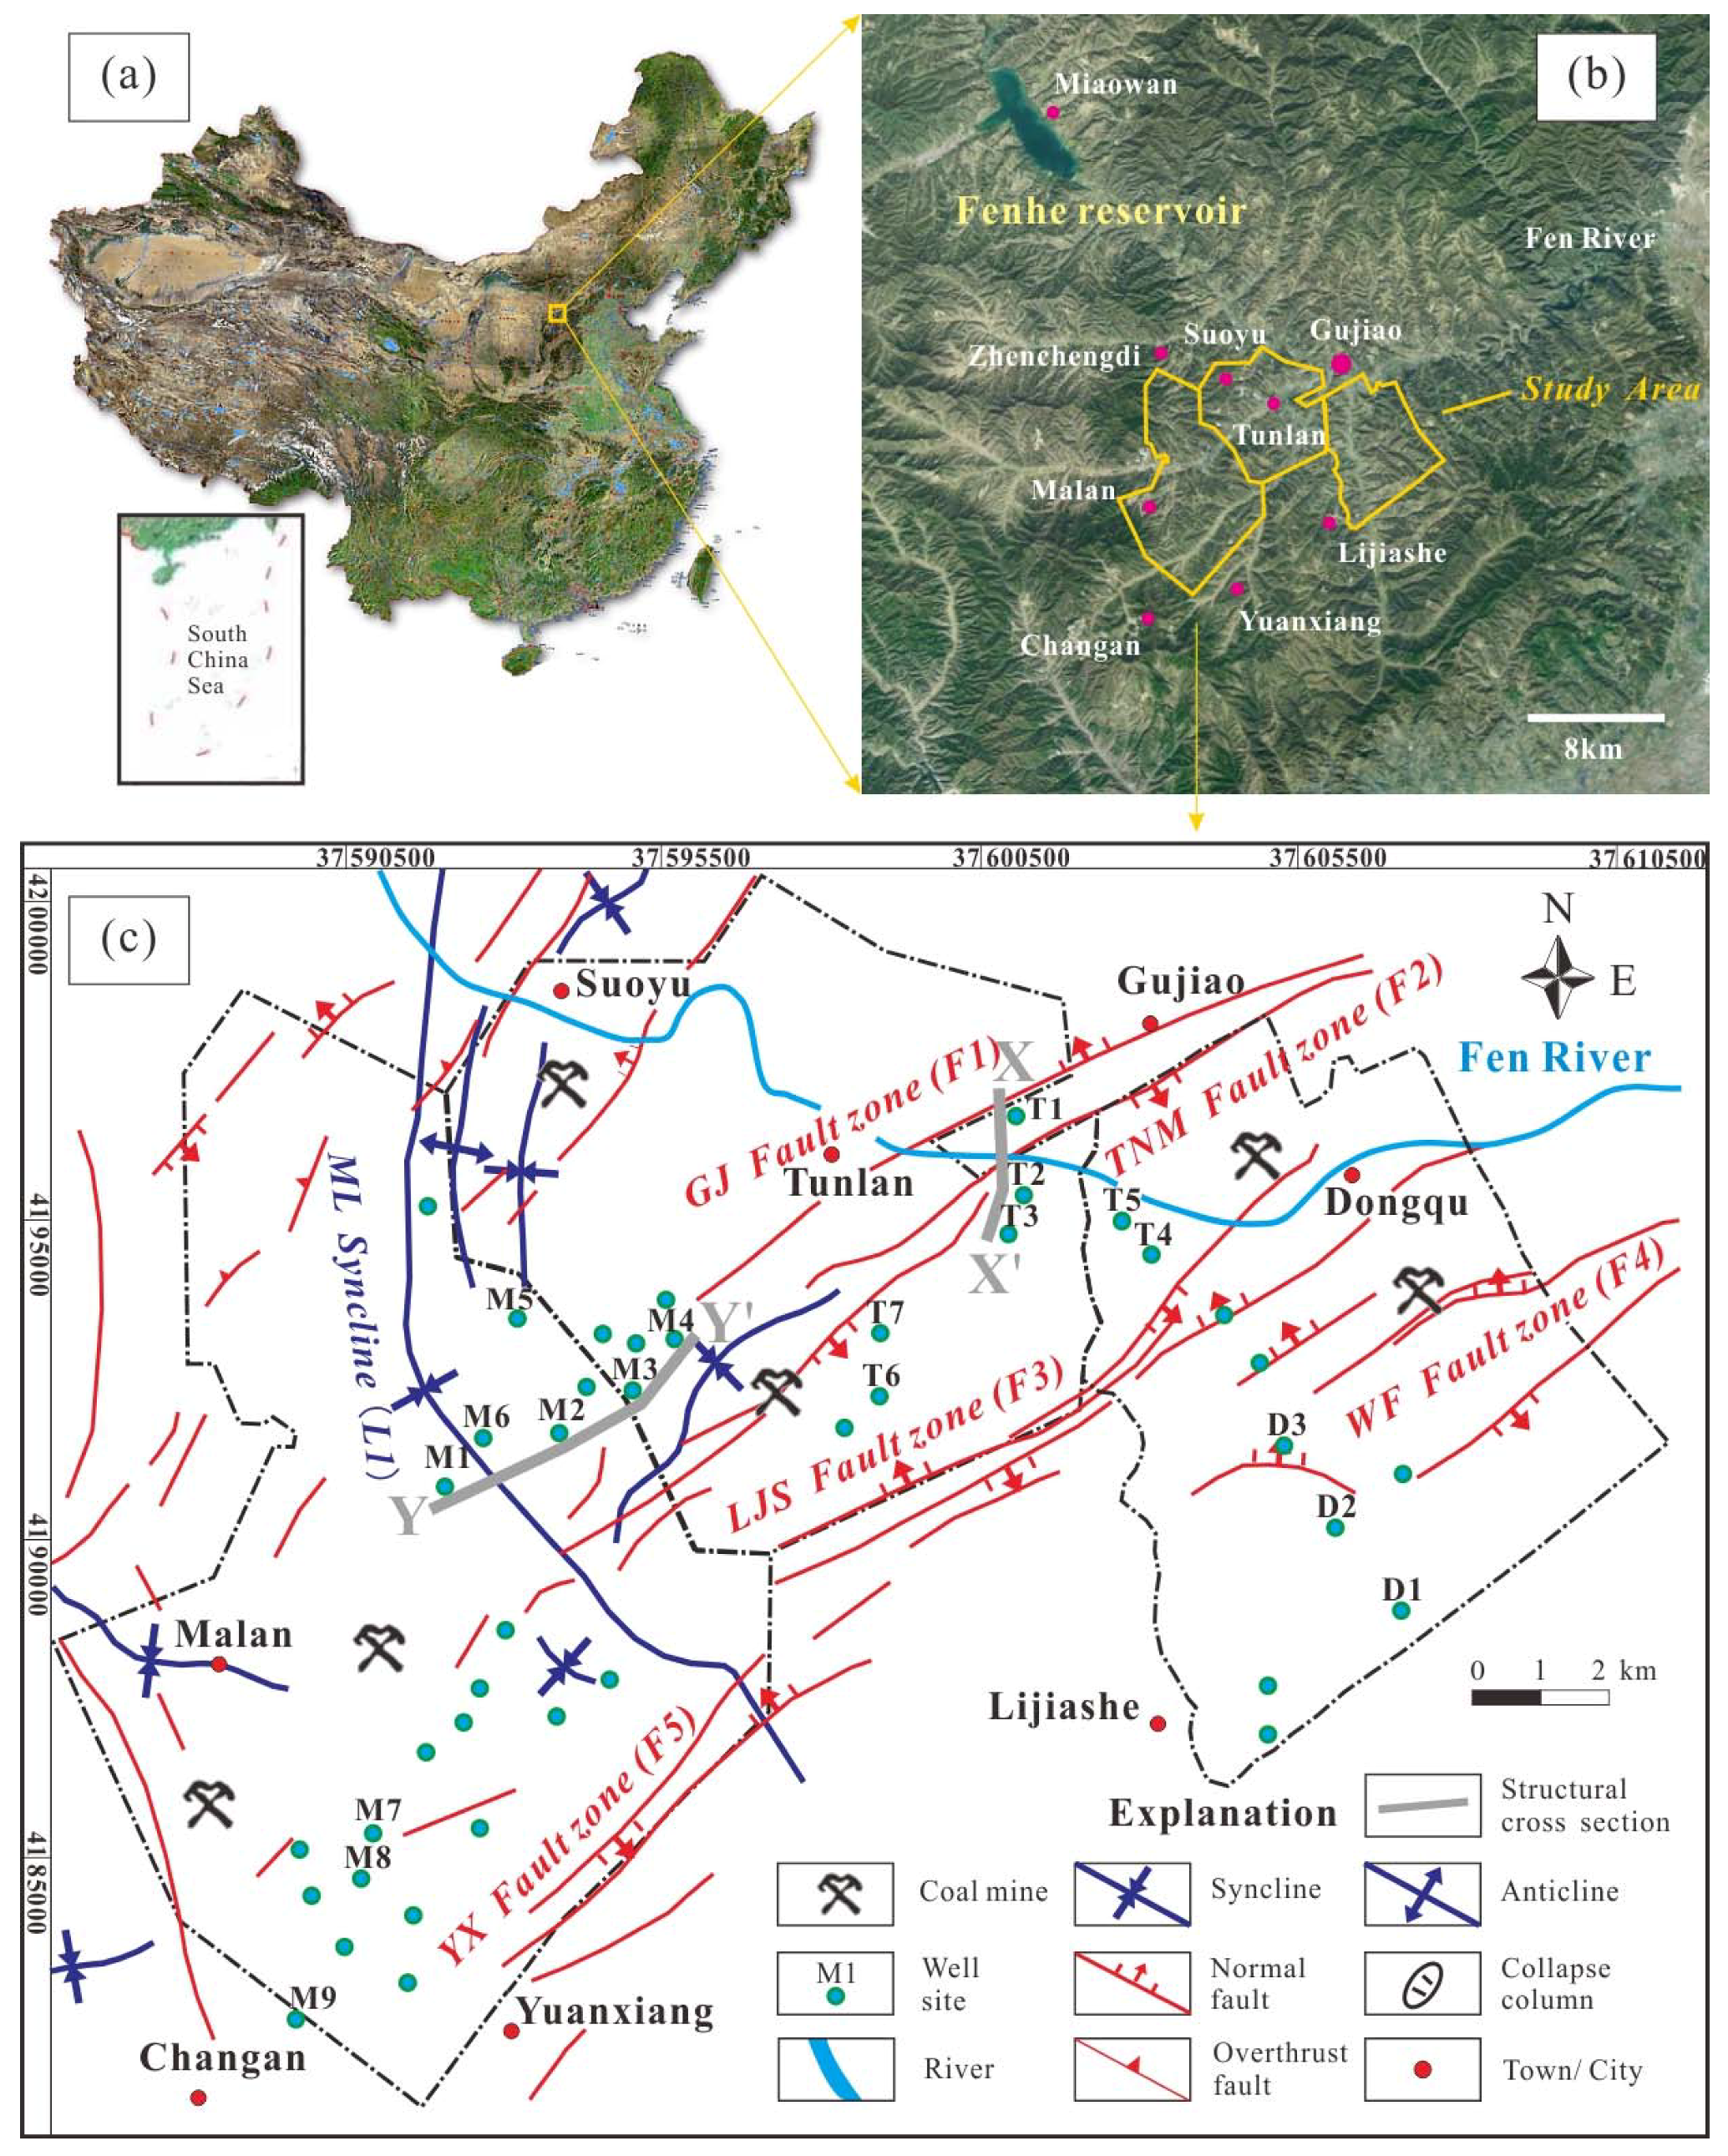
2. Geological Setting

The Xishan coalfield is located in the northern Qinshui Basin, which is generally controlled by an extended syncline that presents an “inverted pear” in geomorphology. The Qinshui Basin is a large-scale inclined basin with an NNE–SSW strike, which originated from the late Paleozoic Craton basin. The overall structure of the basin is relatively simple and has well developed folds and fewer faults. Large faults have developed along the basin edge [25].
The Gujiao area is located in the northwestern Xishan coalfield, which contains three coalmines: Malan, Tunlan, and Dongqu. Due to early Yanshanian Northwest-Southeast compressional stress, strata was uplifted and eroded, and folds with axial striking of N–S in the Gujiao area formed. Until the early Himalayan NW–SE tensile stress developed, the Gujiao area produced a series of normal faults with NE–SW axial striking [38]. The folds are mainly distributed in the middle and west of the Gujiao area. Malan syncline (L1) is widely spread with a steep west wing and a gentle east wing that traverses the Gujiao area (Figure 1), which controls the tectonic framework in the western Gujiao area. Faults extended in the middle and eastern area (Figure 1). A series of faults, including the Gujiao fault (F1), the Tounanmao fault (F2), the Lijiashe fault (F3), and the Wangfeng fault (F4), developed. The southern Gujiao area mainly developed the Yuanxiang fault (F5). These faults (F1, F2, F3, F4, and F5) are mainly composed of high-angle normal faults that distributed in the forms of terrain, such as graben or ladder. For instance, a graben developed in the middle Dongqu mine (Figure 1).
The Pennsylvanian-Permian strata in the Gujiao area include the Pennsylvanian Benxi (C2b), Taiyuan formations (C2t), the Permian Shanxi (P1s), lower shihezi (P1x), upper shihezi (P2s), and Shiqianfeng (P2sh) formations. The main coal-bearing strata in the Gujiao area are the upper Pennsylvanian Taiyuan formation and the lower Permian Shanxi formation [25,39]. The Shanxi formation (P1s), with a thickness of ~53 m, is composed of sandy mudstone, mudstone, medium and fine sandstone, and coal seams, including the stable targeted No. 2 coal seam (Figure 2), which formed from a delta environment with shallow water. The Taiyuan formation (C2t), with a thickness of ~104 m, is mainly composed of sandy mudstone, fine sandstone, siltstone, limestone, and variable coal seams, including targeted Nos. 8 and 9 coal seams. Coastal plains and lagoon environments led to marine carbonate beds in the Taiyuan formation [40].

3. Experiments and Methods

3.1. Samples and Experiments

Logging and drilling data of ~600 CBM wells from the Xishan Lanyan CBM Limited Company unveiled well locations, strata distribution, and CBM reservoir properties. Coal samples from Nos. 2, 8, and 9 coal seams were directly collected from the CBM wells. Field works included coring and gas desorption, after which laboratory works were carried out. The works were as follows: (1) Gas content was determined in accordance with U.S. Bureau of Mines (USBM) direct measurement protocol [41,42]. Total gas content consists of lost gas, desorbed gas, and residual gas. Lost gas content can be obtained by plotting the square root of time against cumulative gas desorbed for initial measurements with sealed canisters from the field desorption test [42]. Subsequently, the canisters were delivered to the laboratory to complete gas desorption, which takes about one month in this work. Residual gas was measured by crushing all samples in the canister to approximately 8 mesh (2.4 mm maximum particle size), performing a second desorption analysis. In this work, gas content is expressed in terms of a dry ash-free base at standard temperature and pressure (STP). (2) Gas composition was analyzed in accordance with the China National Standard GB/T 13610-2003 of natural gas composition analysis in gas chromatography, to obtain CH4, CO2, N2, and other hydrocarbon concentrations. (3) Proximate analysis (moisture, volatile matter, ash yield, and fixed carbon) followed the ASTM standard D7582-10. In addition, the adsorption capacity of coals was obtained by CH4 isothermal adsorption experiment with the Langmuir adsorption model:
V = a b P 1 + b P
where V is the volume of adsorbed gas per unit mass on solid surface under a constant temperature of T (K) and a constant pressure of P (MPa) (mL/g); a is the ultimate adsorption capacity on dry ash free basis of coal (m3/t); b is an adsorption constant (MPa−1).

3.2. Principle of Grey Correlation

The principle of the gray correlation method is to determine the similarity of two array curves to establish the correlations [43,44], which has been widely and successfully applied to various systems [1]. For CBM, the gray correlation method has been used to evaluate the factors controlling CBM production [24,30,44], coal deformation [45], and gas content [46]. This method has some advantages in less specific requirements [44].
In this work, the gray correlation method is adopted to evaluate the factors affecting gas content in the Gujiao area. Gas content is a parameter that is affected by various factors, which can be considered as a gray system. Here, the gas content is made as the reference sequence (controller sequence) x 0 , and factors affecting the gas content are considered as the comparison sequence (sub sequence) x i .
x 0 = { x 0 ( 1 ) , x 0 ( 2 ) , , x 0 ( k ) }
x i = { x i ( 1 ) , x i ( 2 ) , , x i ( k ) }
where x 0 ( k ) is the gas content of the coal seam corresponding to the k-th sampling site, and x i ( k ) is the value of the i-th geological factor at the k-th sampling site, (k = 1, 2, …, 10: i = 1, 2, …, 8). The controlling factors consist of geological structure, burial depth, roof thickness, coal metamorphism, hydrodynamics, coal thickness, moisture, ash yield, and reservoir properties. Finally, the key factors affecting gas content can be evaluated. The specific steps are as follows:
(1)
Normalized treatment. This paper deals with the raw data by means of the homogenization method. The formula is as shown in Equation (4):
x i ( k ) = x i ( k ) 1 N k = 1 N x i ( k )
where x i ( k ) is transformed from x i ( k ) , i = 1, 2, …, 8: k = 1, 2, …, 10. x i ( k ) is the value of the i-th geological factor at the k-th sampling site.
(2)
Acquisition of the correlation coefficient. The correlations between controlling factors and gas content in the Nos. 2, 8, and 9 coal seams at different sampling sites are obtained by Equation (5).
ε o i ( k ) = m i n i   m i n k | x 0 ( k ) x i ( k ) | + ρ   m a x i   m a x k | x 0 ( k ) x i ( k ) | | x 0 ( k ) x i ( k ) | + ρ   m a x i   m a x k | x 0 ( k ) x i ( k ) |
where ε o i ( k ) is the correlation coefficient between the gas content and the i-th controlling factor at the k-th sampling site, | x 0 ( k ) x i ( k ) | is the absolute value acquired from the reference sequence and the comparison sequence; m a x i   m a x k | x 0 ( k ) x i ( k ) | and m i n i   m i n k | x 0 ( k ) x i ( k ) | are the maximum absolute difference and minimum absolute difference between the reference sequence and the comparison sequence, i = 1, 2, …, 8: k = 1, 2, …, 10; ρ is the resolution coefficient, in the range of 0–1, and 0.5 is normal.
(3)
Evaluation of the correlation degree. For comparison, the average correlation coefficient of the reference sequence can be calculated by Equation (6), whereby the correlation between each influencing factor and gas content is obtained. Furthermore, the order of correlation can be provided in the order of large values to small values.
r o i = 1 n k = 1 n ε o i ( k )
where r o i is the degree of correlation between the gas content and the i-th influencing factor, and n is the number of samples.

4. Results and Discussion
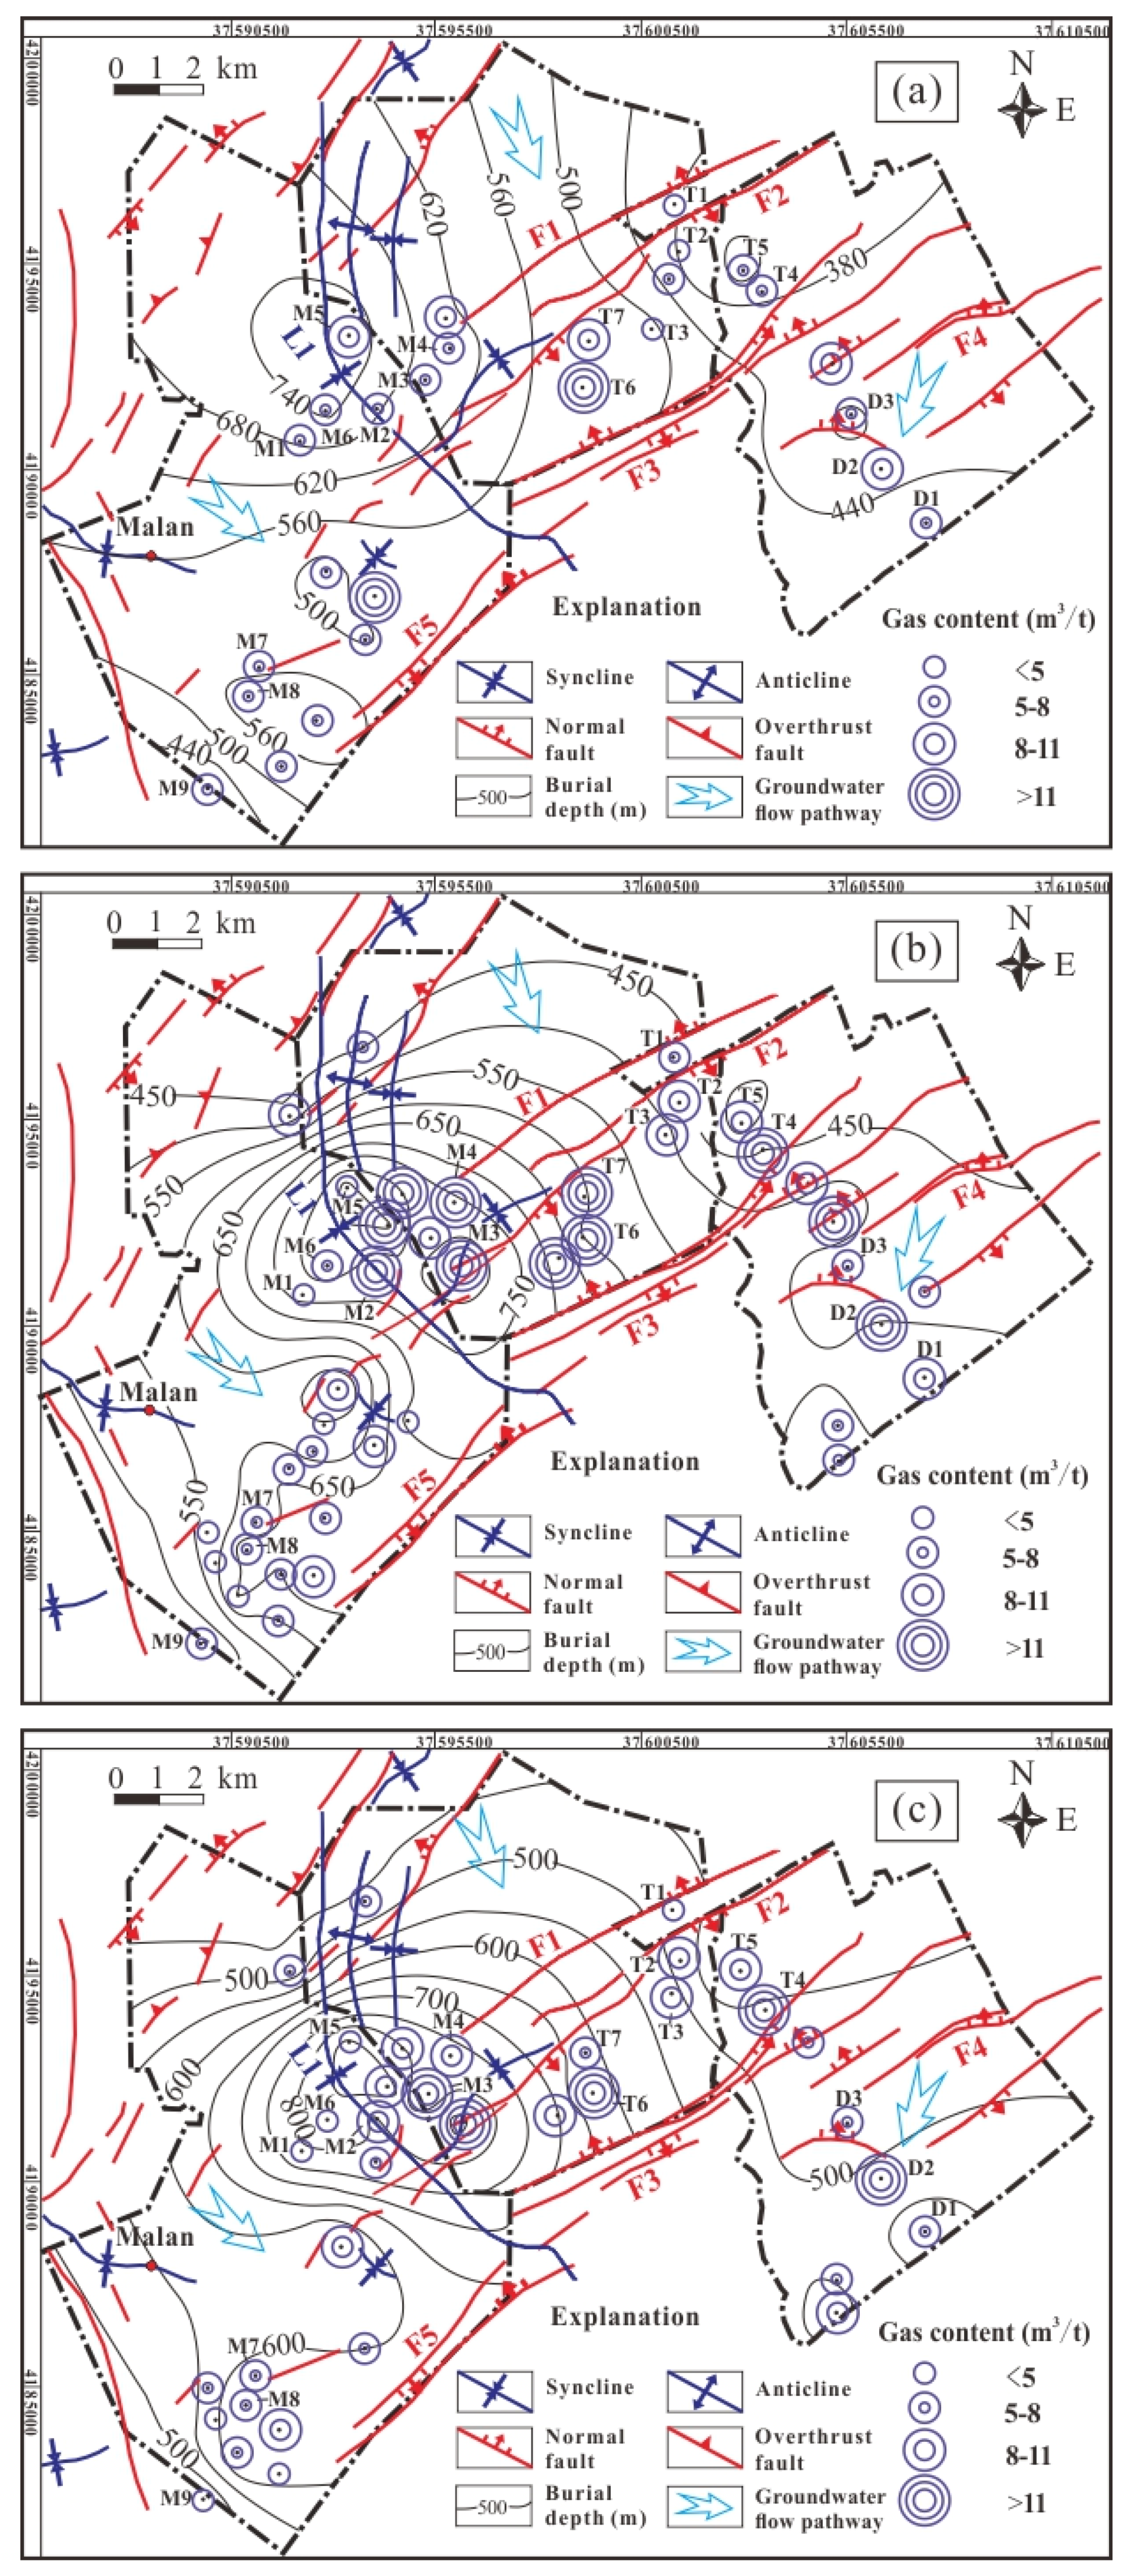
4.1. Gas Content

Through the above-mentioned experiments, gas content, and CH4 concentration of Nos. 2, 8, and 9 coal seams in the Gujiao area are listed in Table 1. Generally, the gas content of the No .8 coal seam is the highest; the No. 2 coal seam has the lowest (Figure 3), which are consistent with the previous study [36]. Gas content presents strong heterogeneity in different areas, and Tunlan area has the highest (Figure 3). The CH4 concentration is generally high (~90%), which indicates favorable conditions for CBM preservation. The gas content distribution in the main coal seams is shown in Figure 4, which increases from the north to the south part in the Gujiao area. In the southwestern Gujiao area, the gas content shows the relative low gas content compared with that in the middle and eastern Gujiao area, which varies from 4 to 8 m3/t. Normally, the gas is enriched in the deep burial area. For instance, the gas content in the axis of Malan Syncline (L1) is mainly between 9 and 14 m3/t. Generally, gas content is widely affected by sedimentologic, structural, petrologic, geothermal, and hydrogeologic variables [9,47]. Therefore, geological factors and reservoir properties controlling gas content are summarized in the following sub-sections.

4.2. Geological Factors Affecting on Gas Content

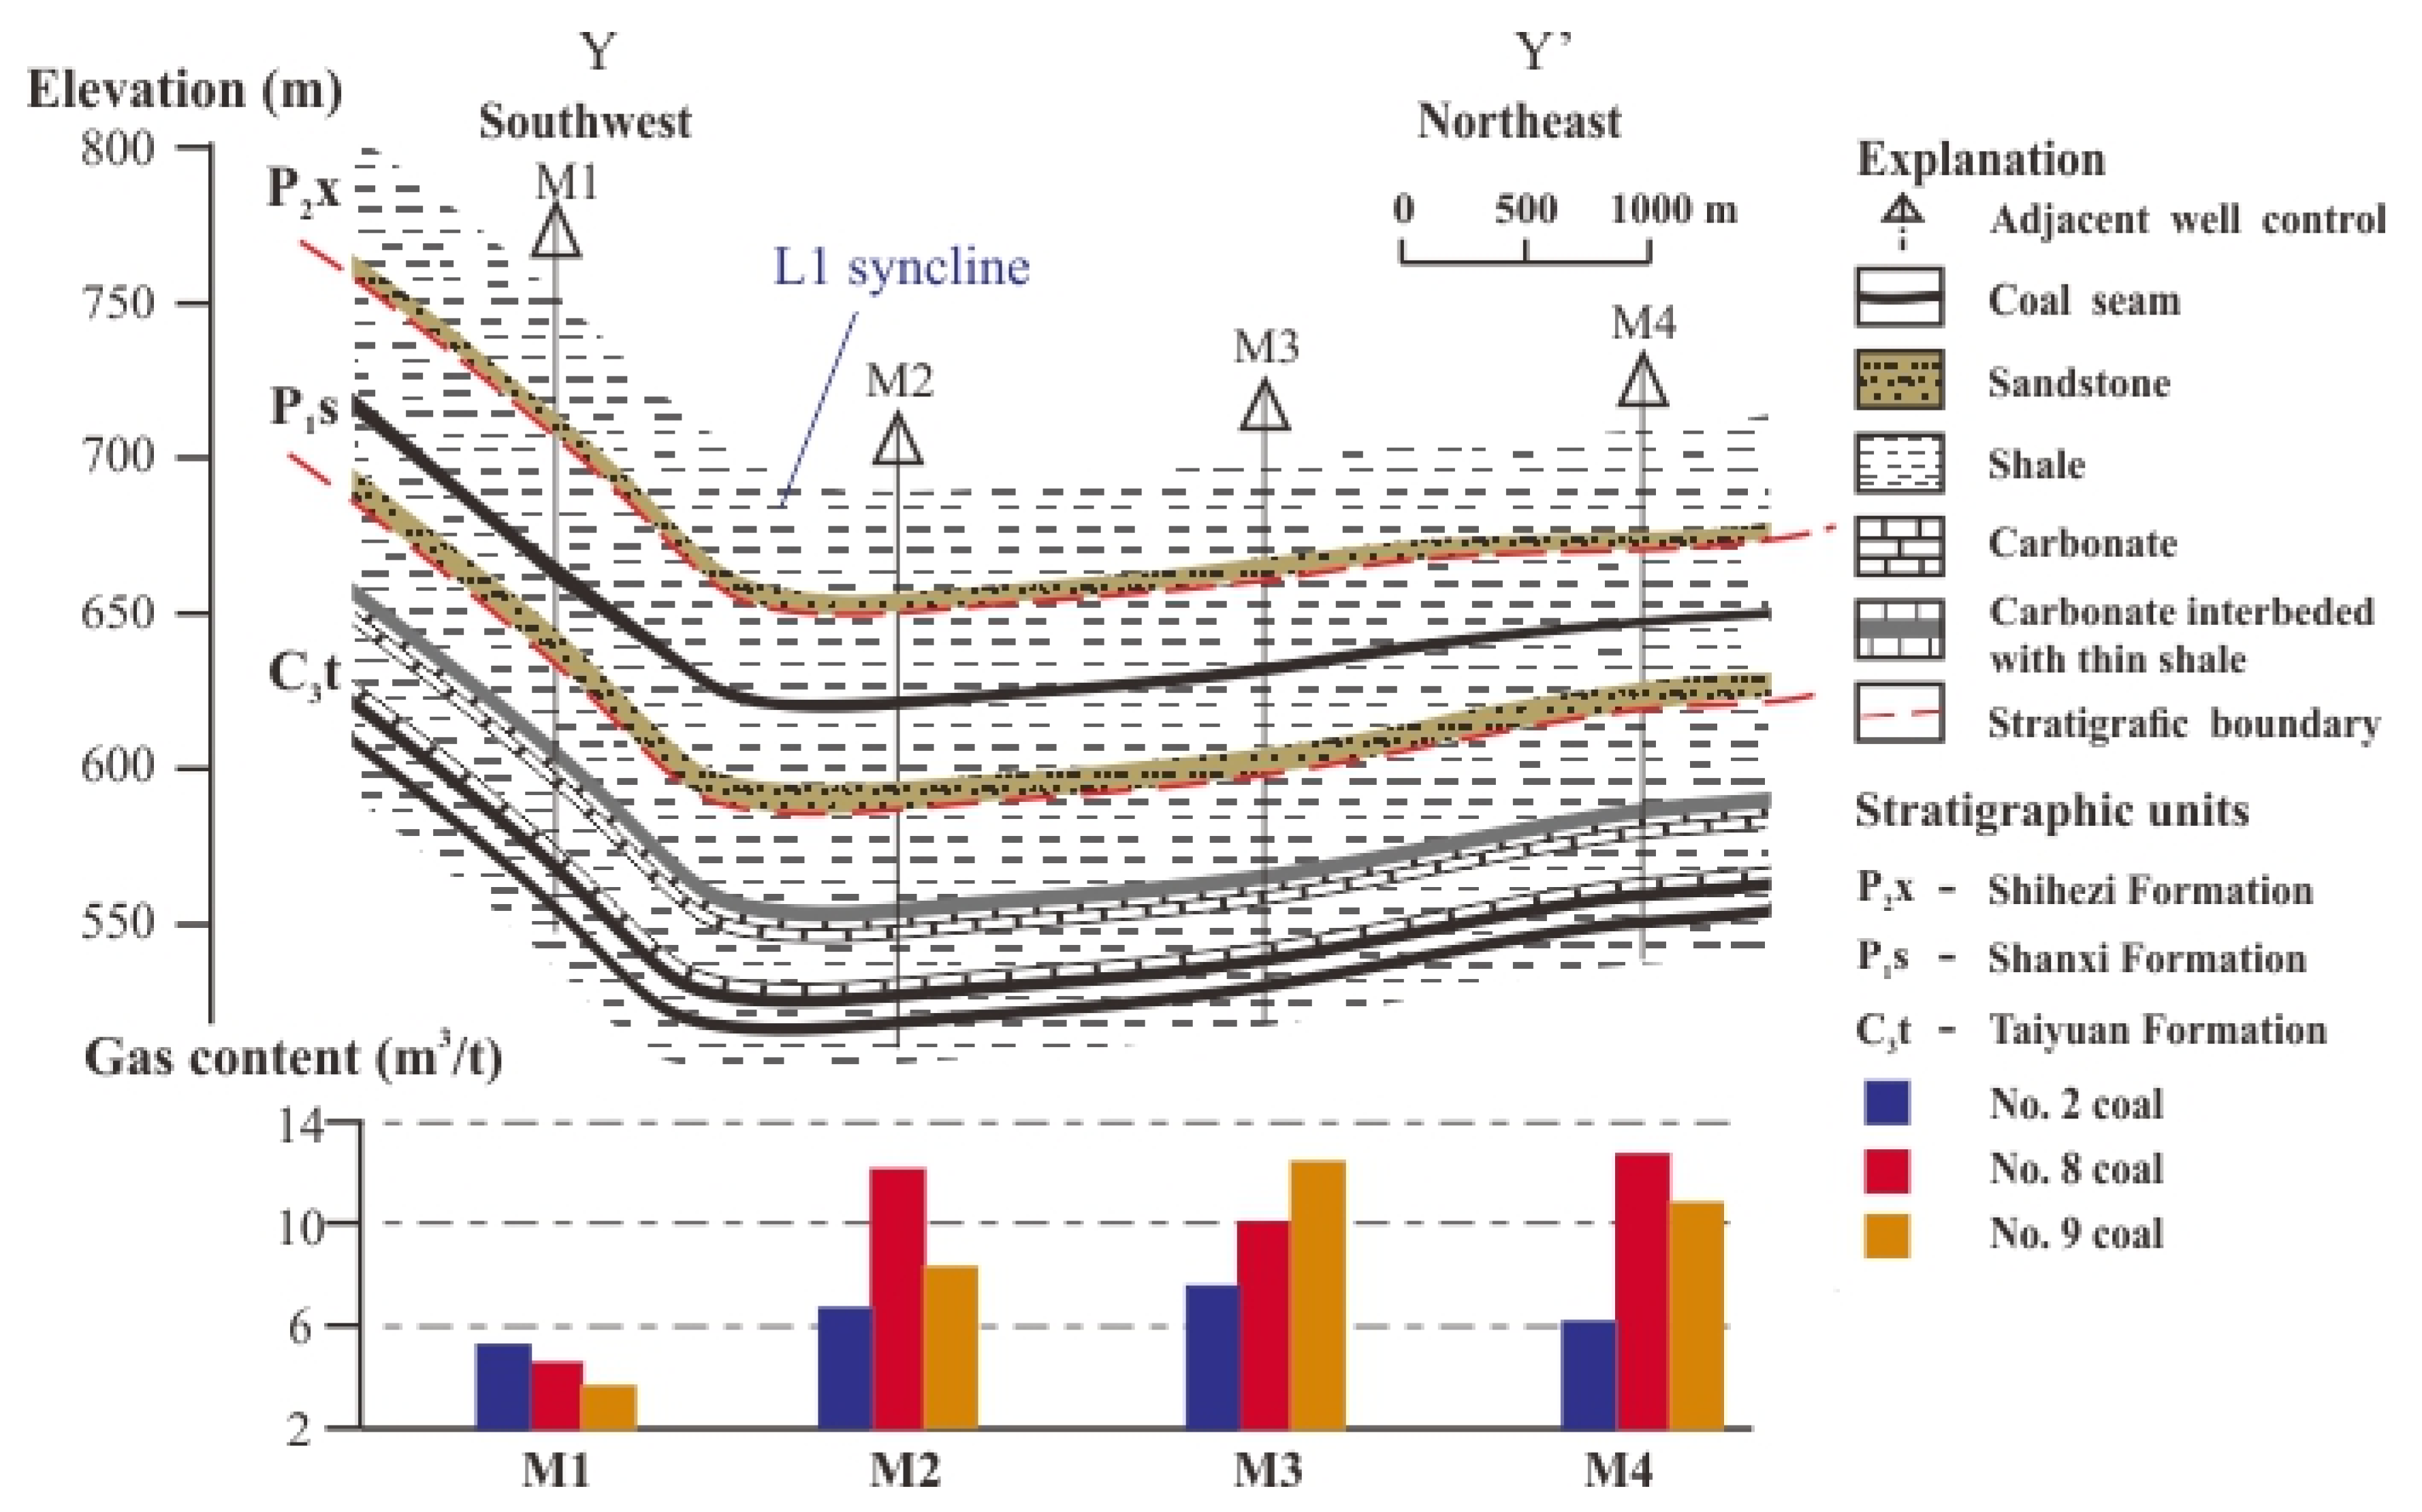
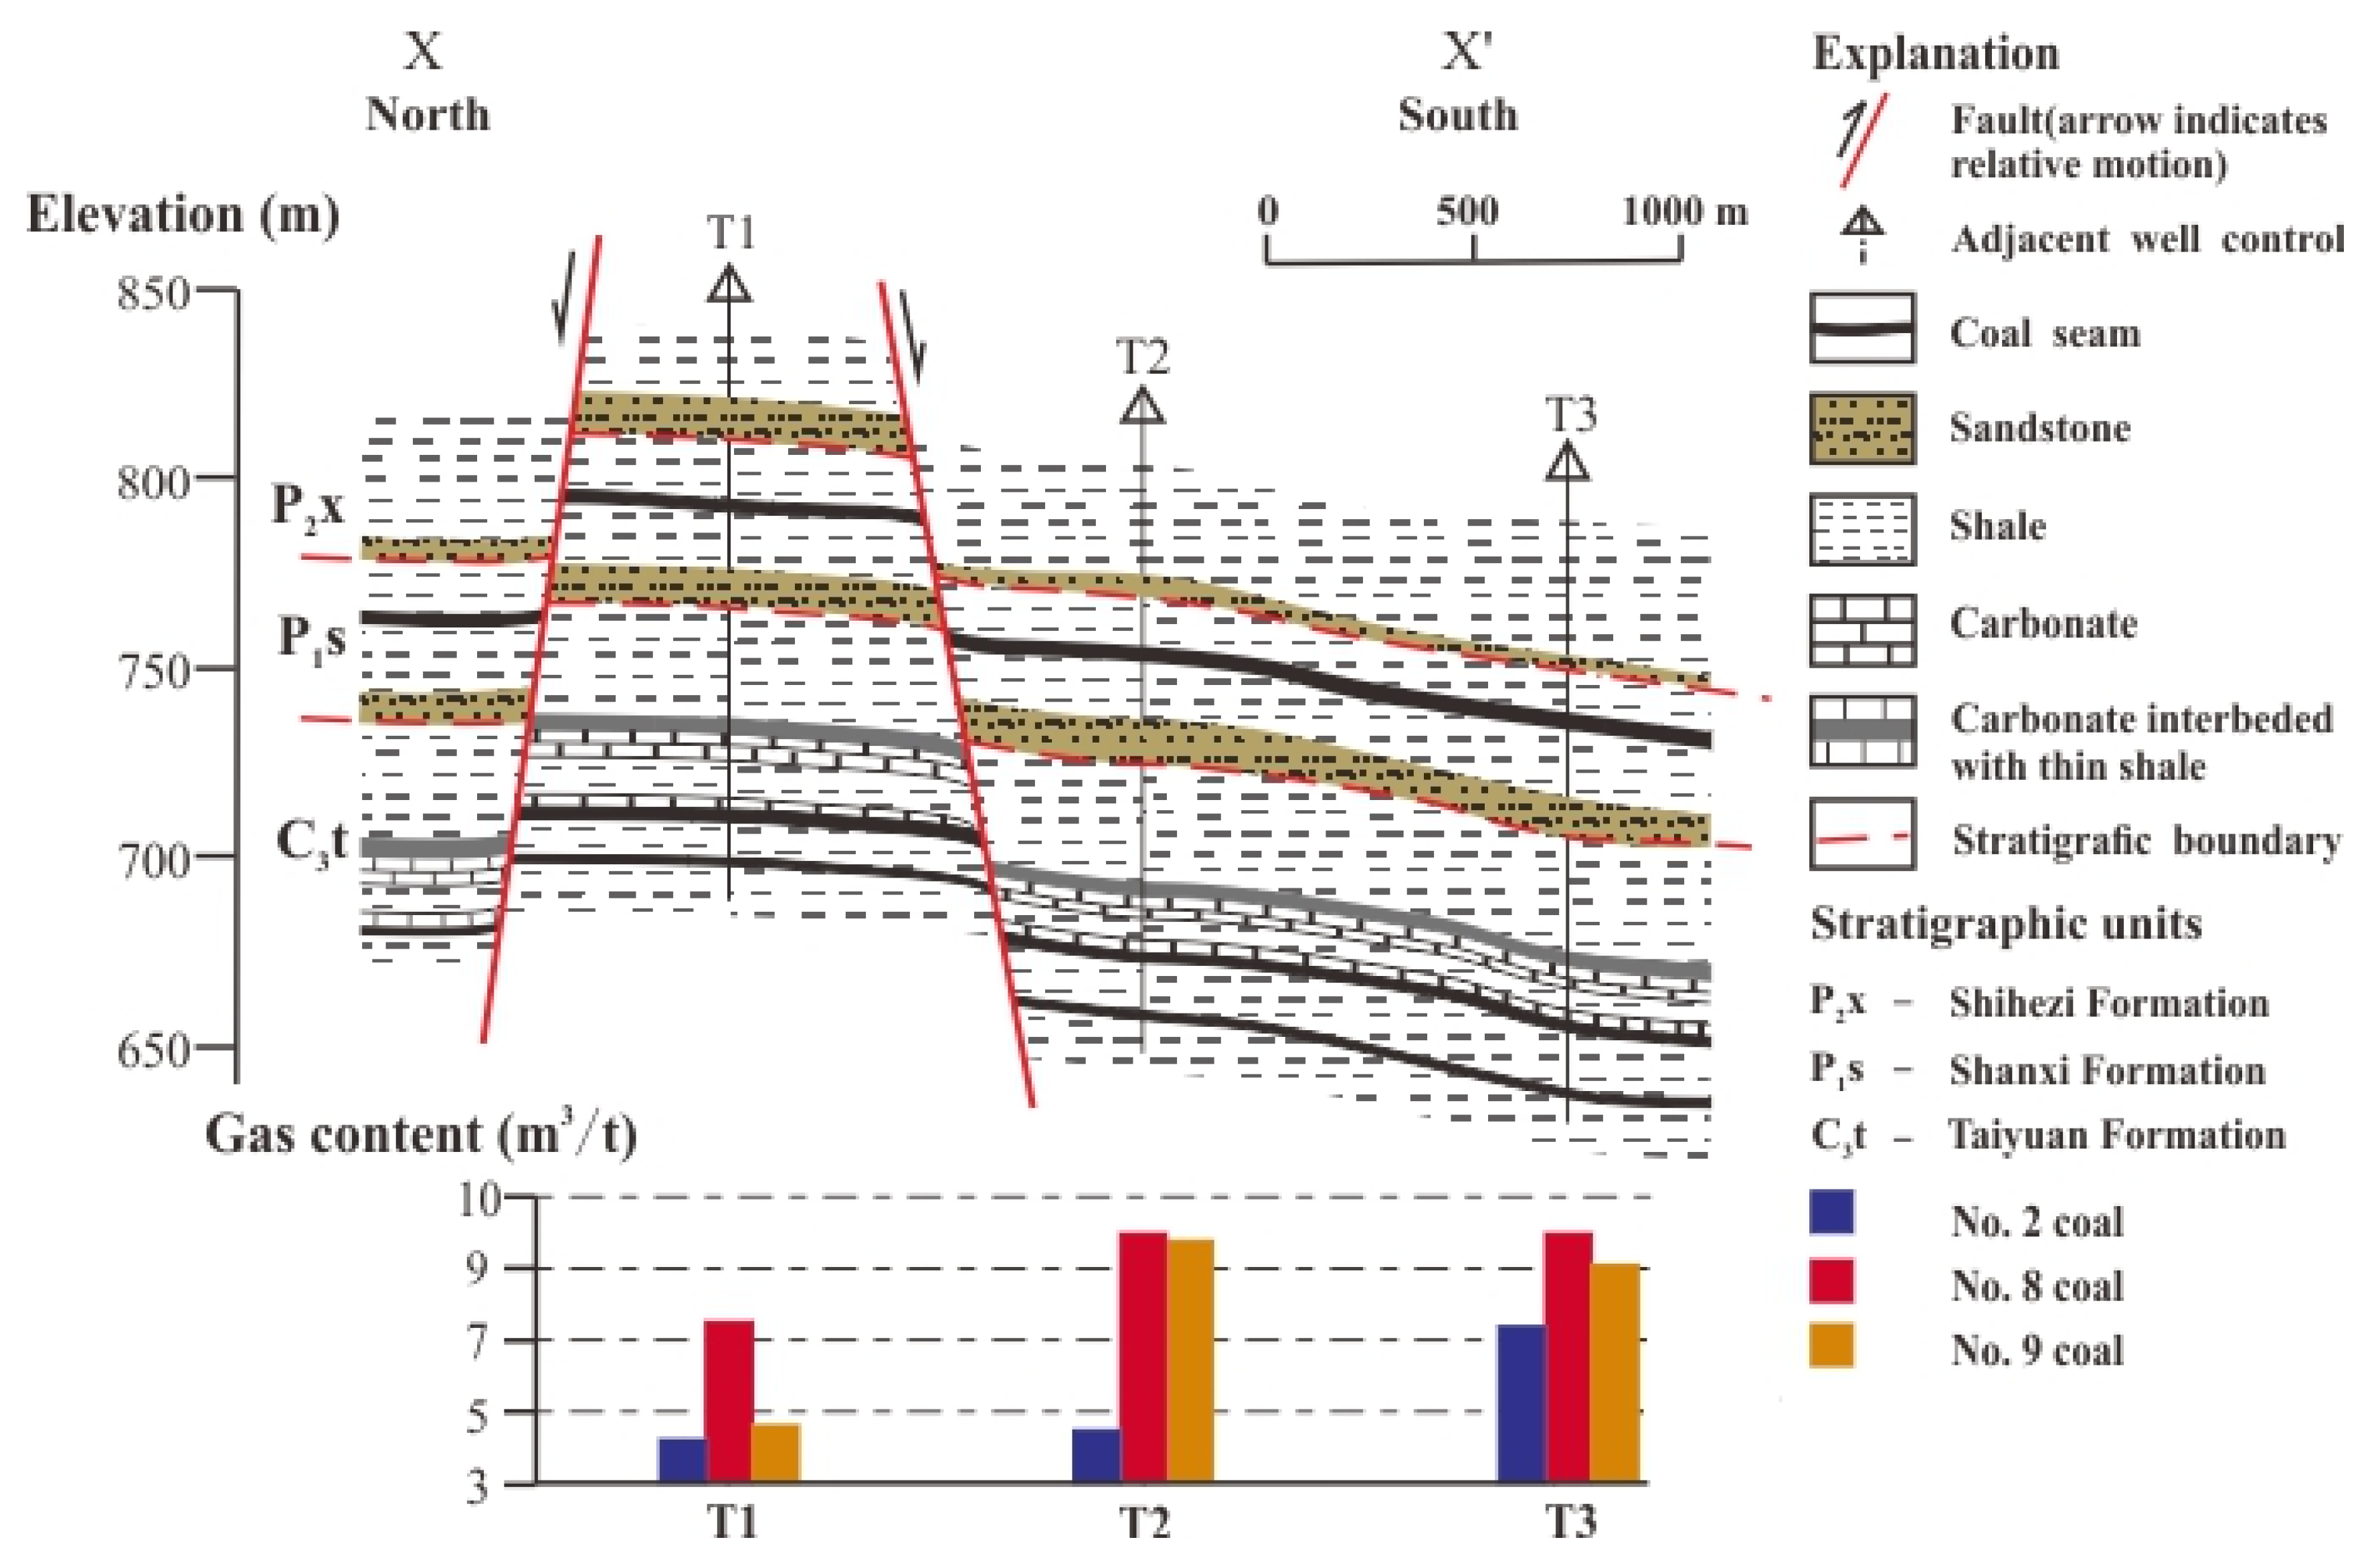
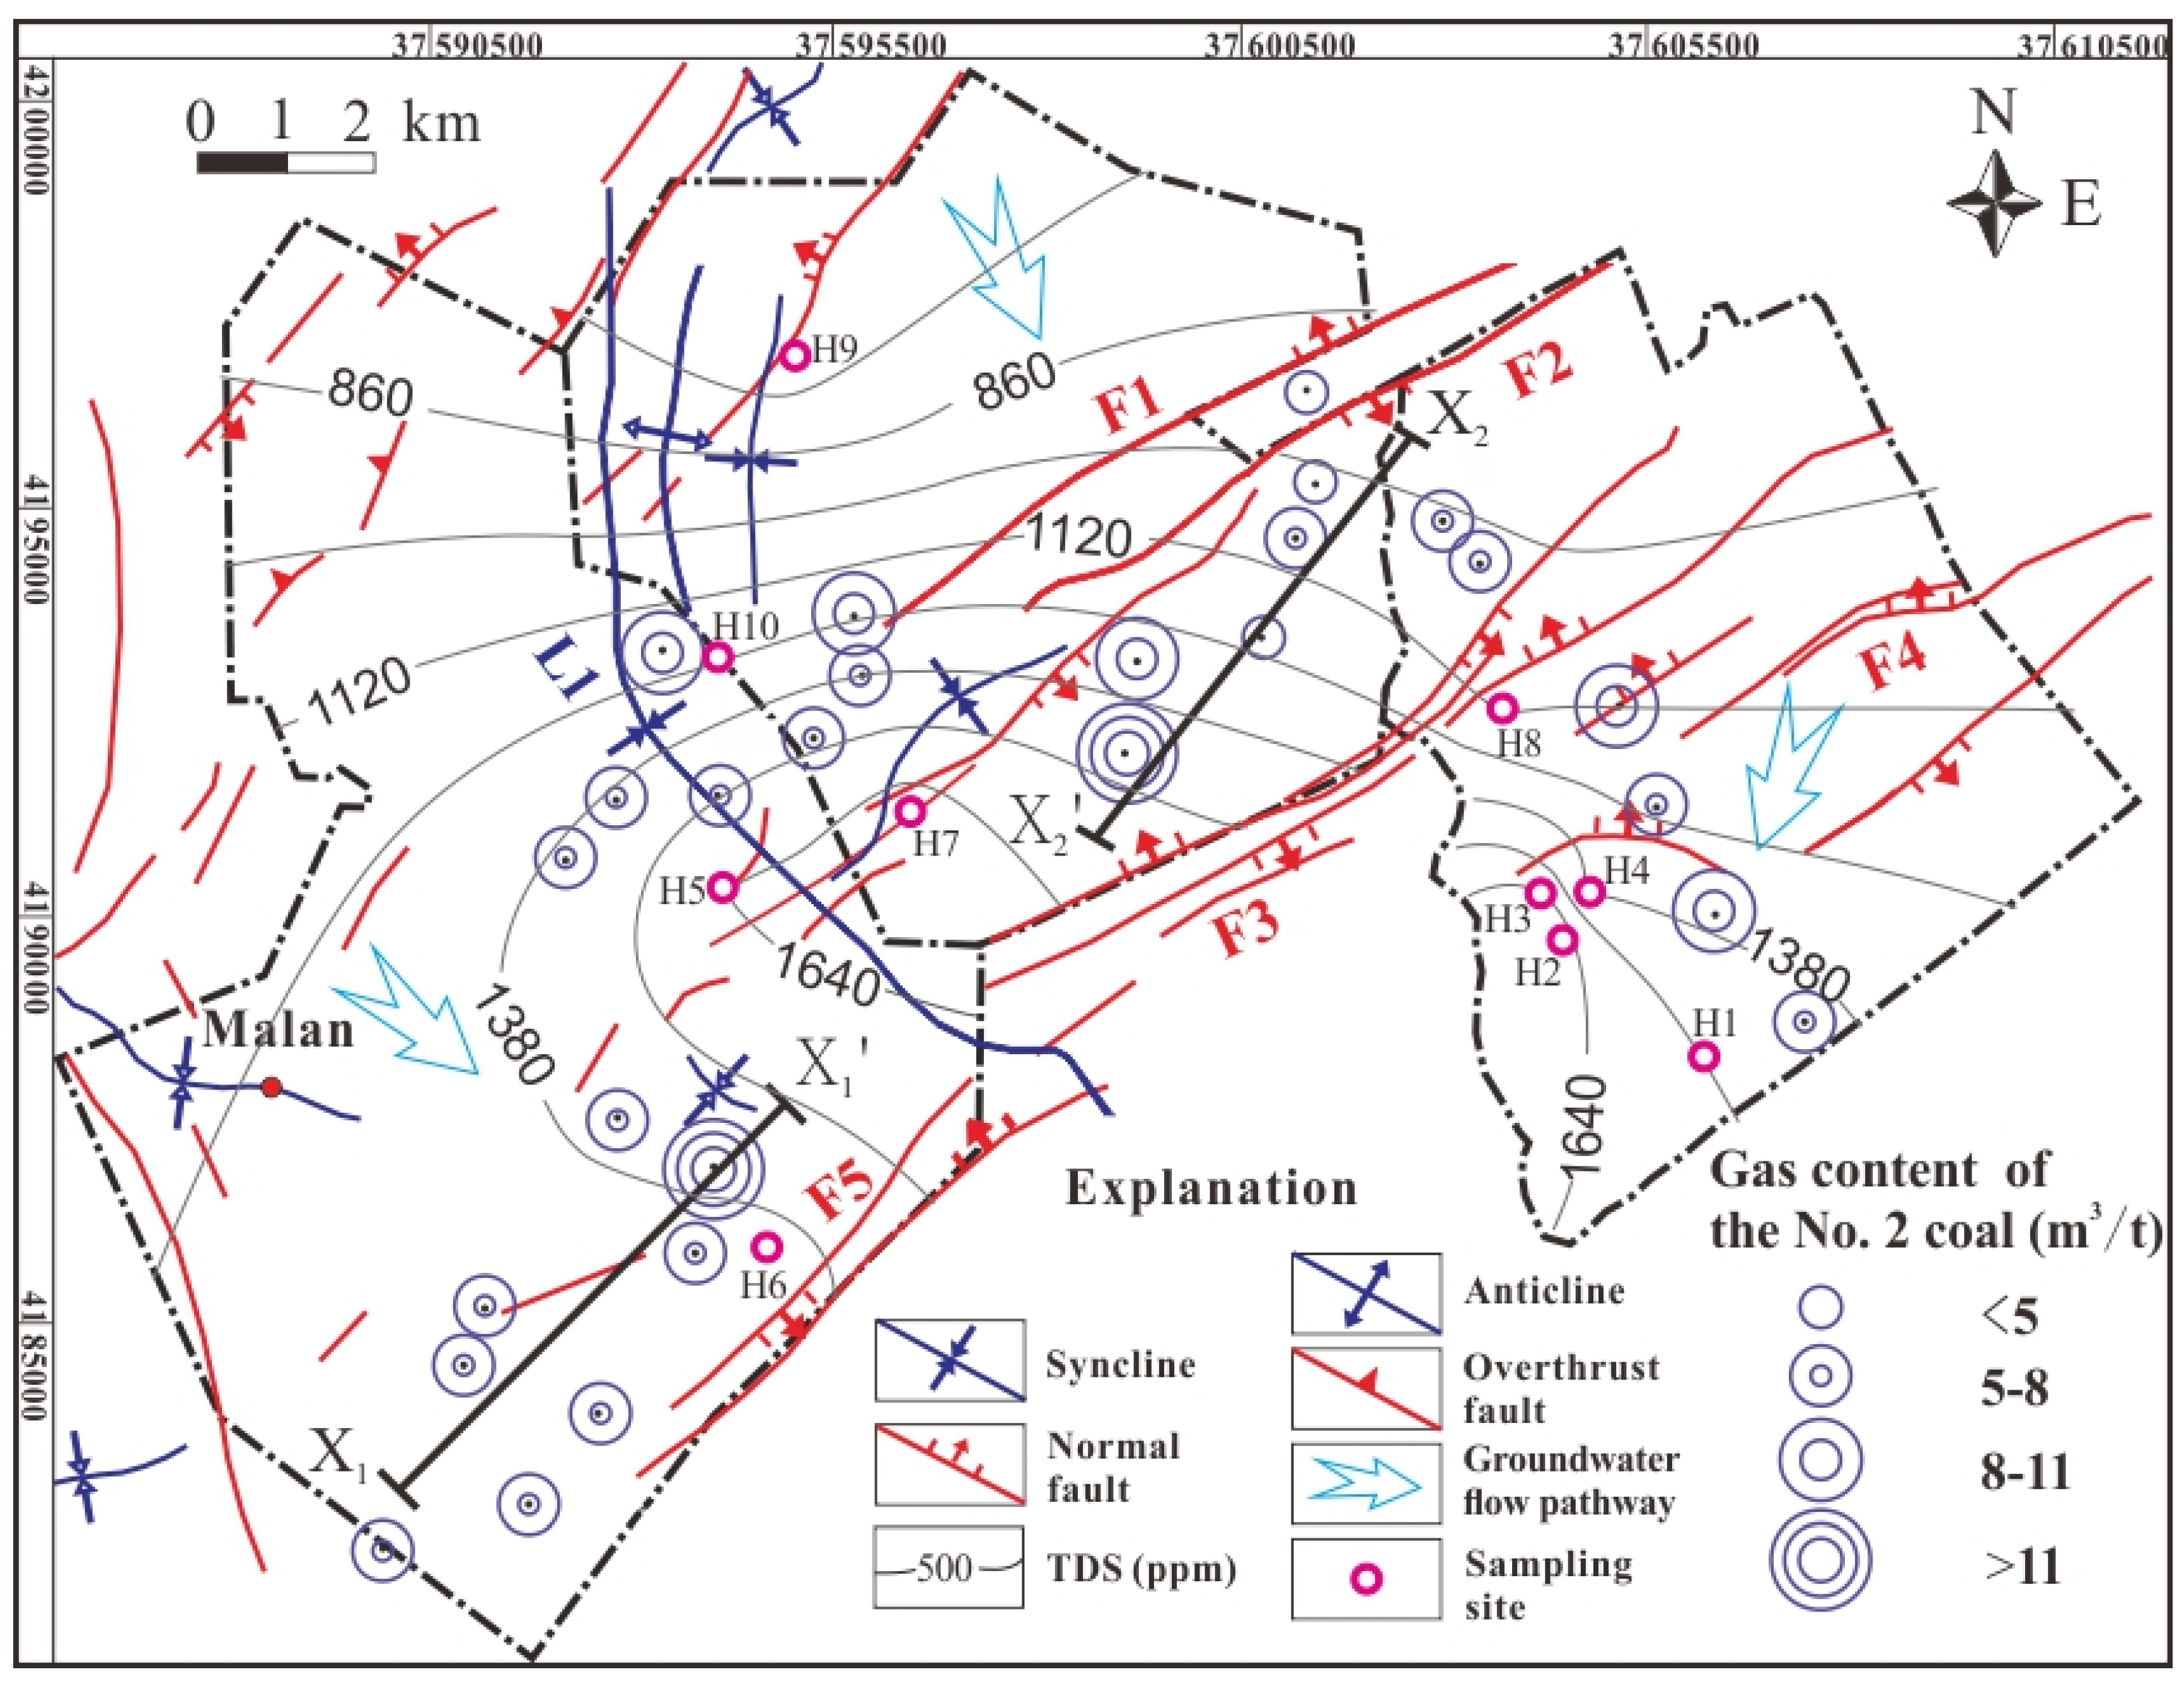
4.2.1. Geological Structure

The Gujiao area is divided into two geological units: western folds and eastern faults. In the western part, the Malan syncline (L1) goes through the research area from north to south. In the eastern part, a series of normal faults develop along the northeast–southwest axis. Synclines can be advantageous for CBM preservation due to the gas held by fluid pressure [25,48]. In section Y–Y’, the east wing of the Malan syncline (L1) is deeper and gentler, where the gas content of the three targeted coal seams in wells M2, M3, and M4 is much higher than that in well M1 in the west wing. Vertically, the gas content of No. 2 coal seam is slightly increased in the axis and the deep wing of L1, commonly lower than 8 m3/t, whereas the gas content of Nos. 8 and 9 coal seams grows intensely, up to ~10 m3/t (Figure 5). There is a possible gas enrichment in Nos. 8 and 9 coal seams in the south of L1 due to the maximum burial depth and high fluid pressure (Figure 4).
The secondary gas enrichment area is located between the Tounanmao fault (F2) and Lijiashe fault (F3) in the Gujiao area. In terms of fault sealing, as two plates of the fault move, the mudstone, as the caprock, may smear amid normal faults, which can cause a strong vertical sealing ability [49,50]. In section X–X’, the gas content of the downthrown side of the normal fault is higher than that of the upthrown side in the F2 faulting area (Figure 6), which means that the downthrown plate is more seriously damaged than the upthrown plate, which makes gas escape difficult.

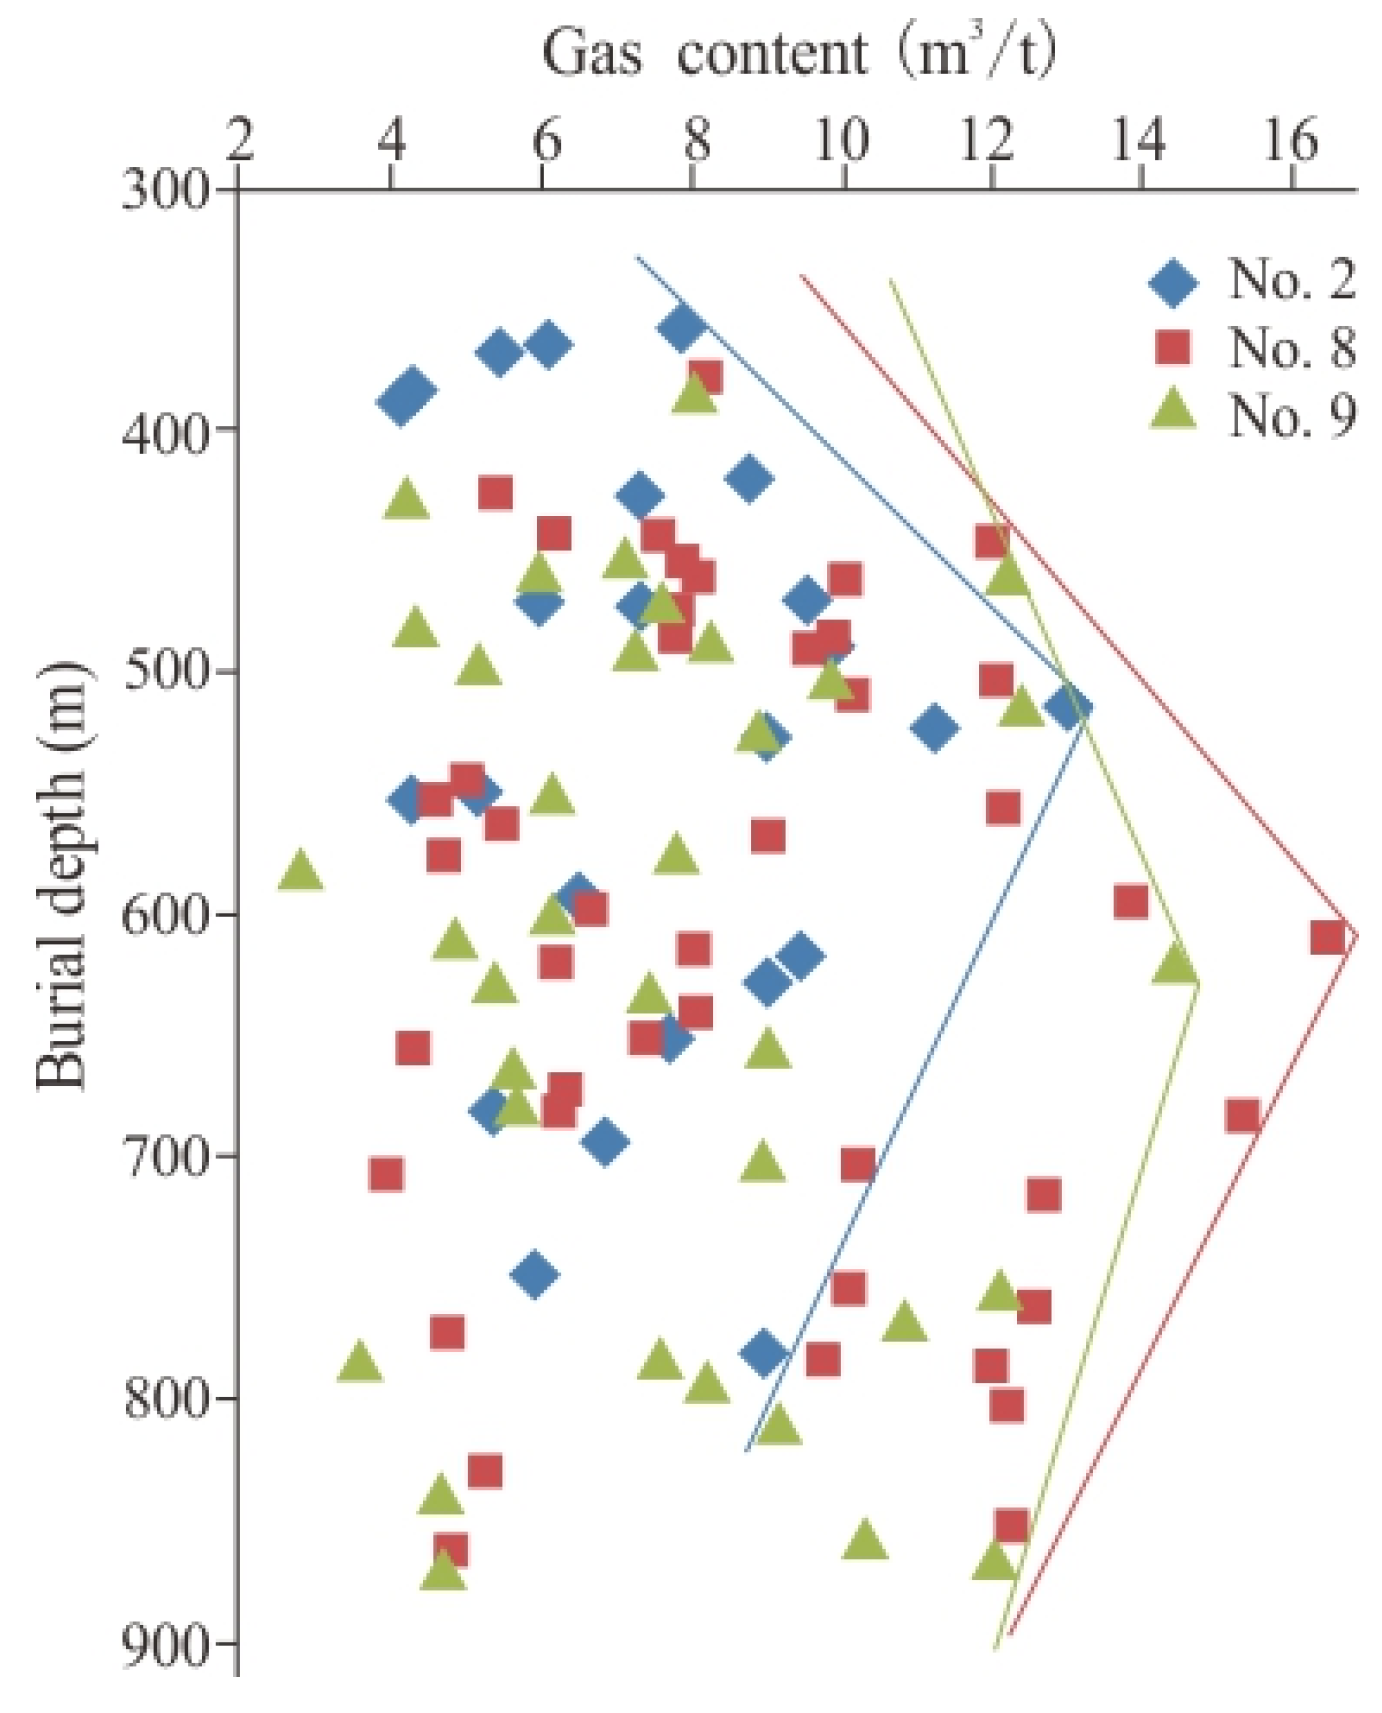
4.2.2. Burial Depth of Coal Seams

The burial depth of No. 2 coal is in the range of 295–780 m and gradually increases from the east to the west (Figure 4). The depth of No. 8 coal is in the range of 425–859 m, ~86 m below the No. 2 coal seam. The depth of No. 9 coal is in the range of 428–869 m. The depths of No. 8 and No. 9 coal seams show similarity since the distance between them is only about 10 m, increasing from north to south and from the sides to the middle. The burial depth of the three coal seams is basically controlled by the Malan syncline (L1) and changes rapidly in the western part and gently in the eastern part. The gas content of the three coal seams generally correlates well with burial depth (Figure 7). The maximum values are distributed at a depth of ~500 m for the No. 2 coal seam and ~620 m for the No. 8 and No. 9 coal seams, which are in accordance with the geological structure. The results show that the burial depth has a far lower influence on gas content than do geological structures.

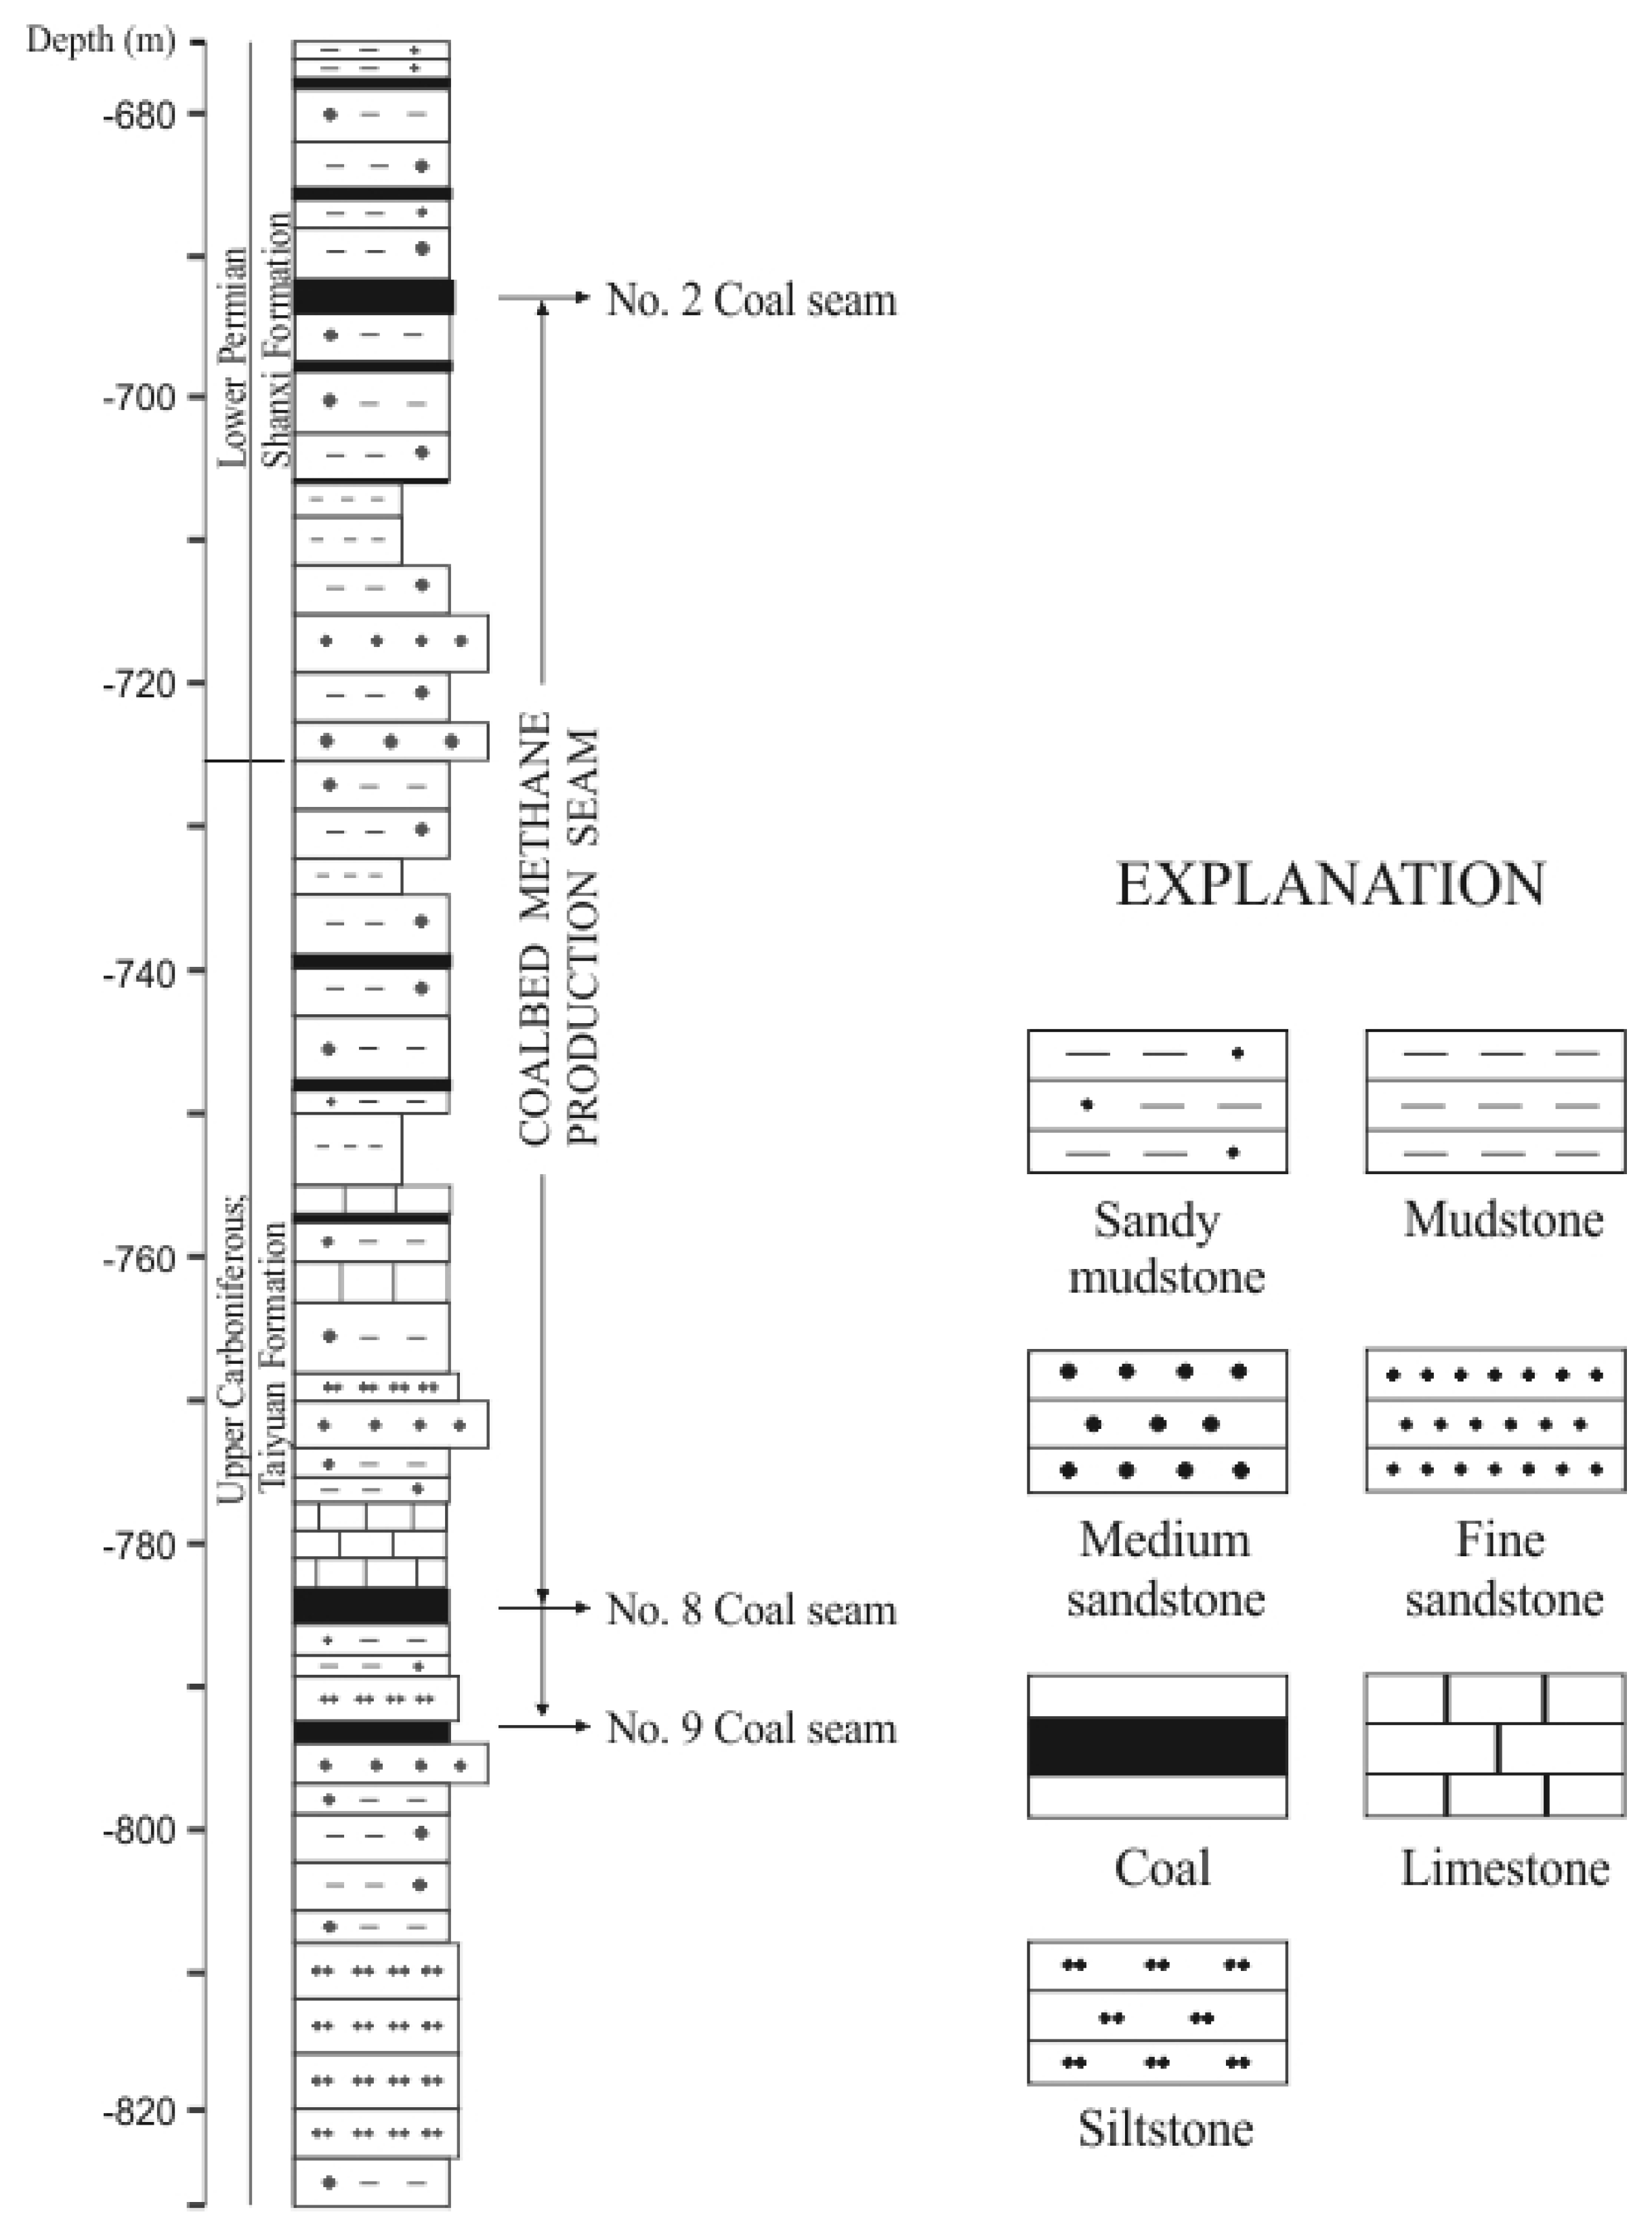
4.2.3. Roof Lithology and Thickness

Lithology of reservoirs is controlled by sedimentary environment, which will change the gas transport and preservation. The No. 2 coal seam was deposited under the peat swamp, which produce thick and stable coals. The roof and floor formed in the natural levee and floodplain environment, which were mainly composed of sandstone and sandy mudstone as shown in Figure 2. The No. 8 and No. 9 coal seams were formed in the lagoon-tidal flat-barrier island environment, and the roof of the No. 8 coal seam was mainly composed of the Miaogou limestone that deposited in a carbonate platform environment [29]. The roof of the No. 9 coal seam developed from the sand flat environment, which was mainly composed of sandstone and siltstone with inferior sealing capability (Figure 8). Therefore, roof lithology could be one of the reasons for the relatively high gas content in the No. 8 coal seam. The roof thickness of the No. 2 coal seam ranges from 1 to 6.54 m, with an average of 2.4 m, which is thicker than the roofs of No. 8 (0.91 m) and No. 9 (0.98 m) coal seams. In this work, the roof thicknesses of Nos. 2, 8, and 9 coal seams and gas content have a relatively subtle correlation.

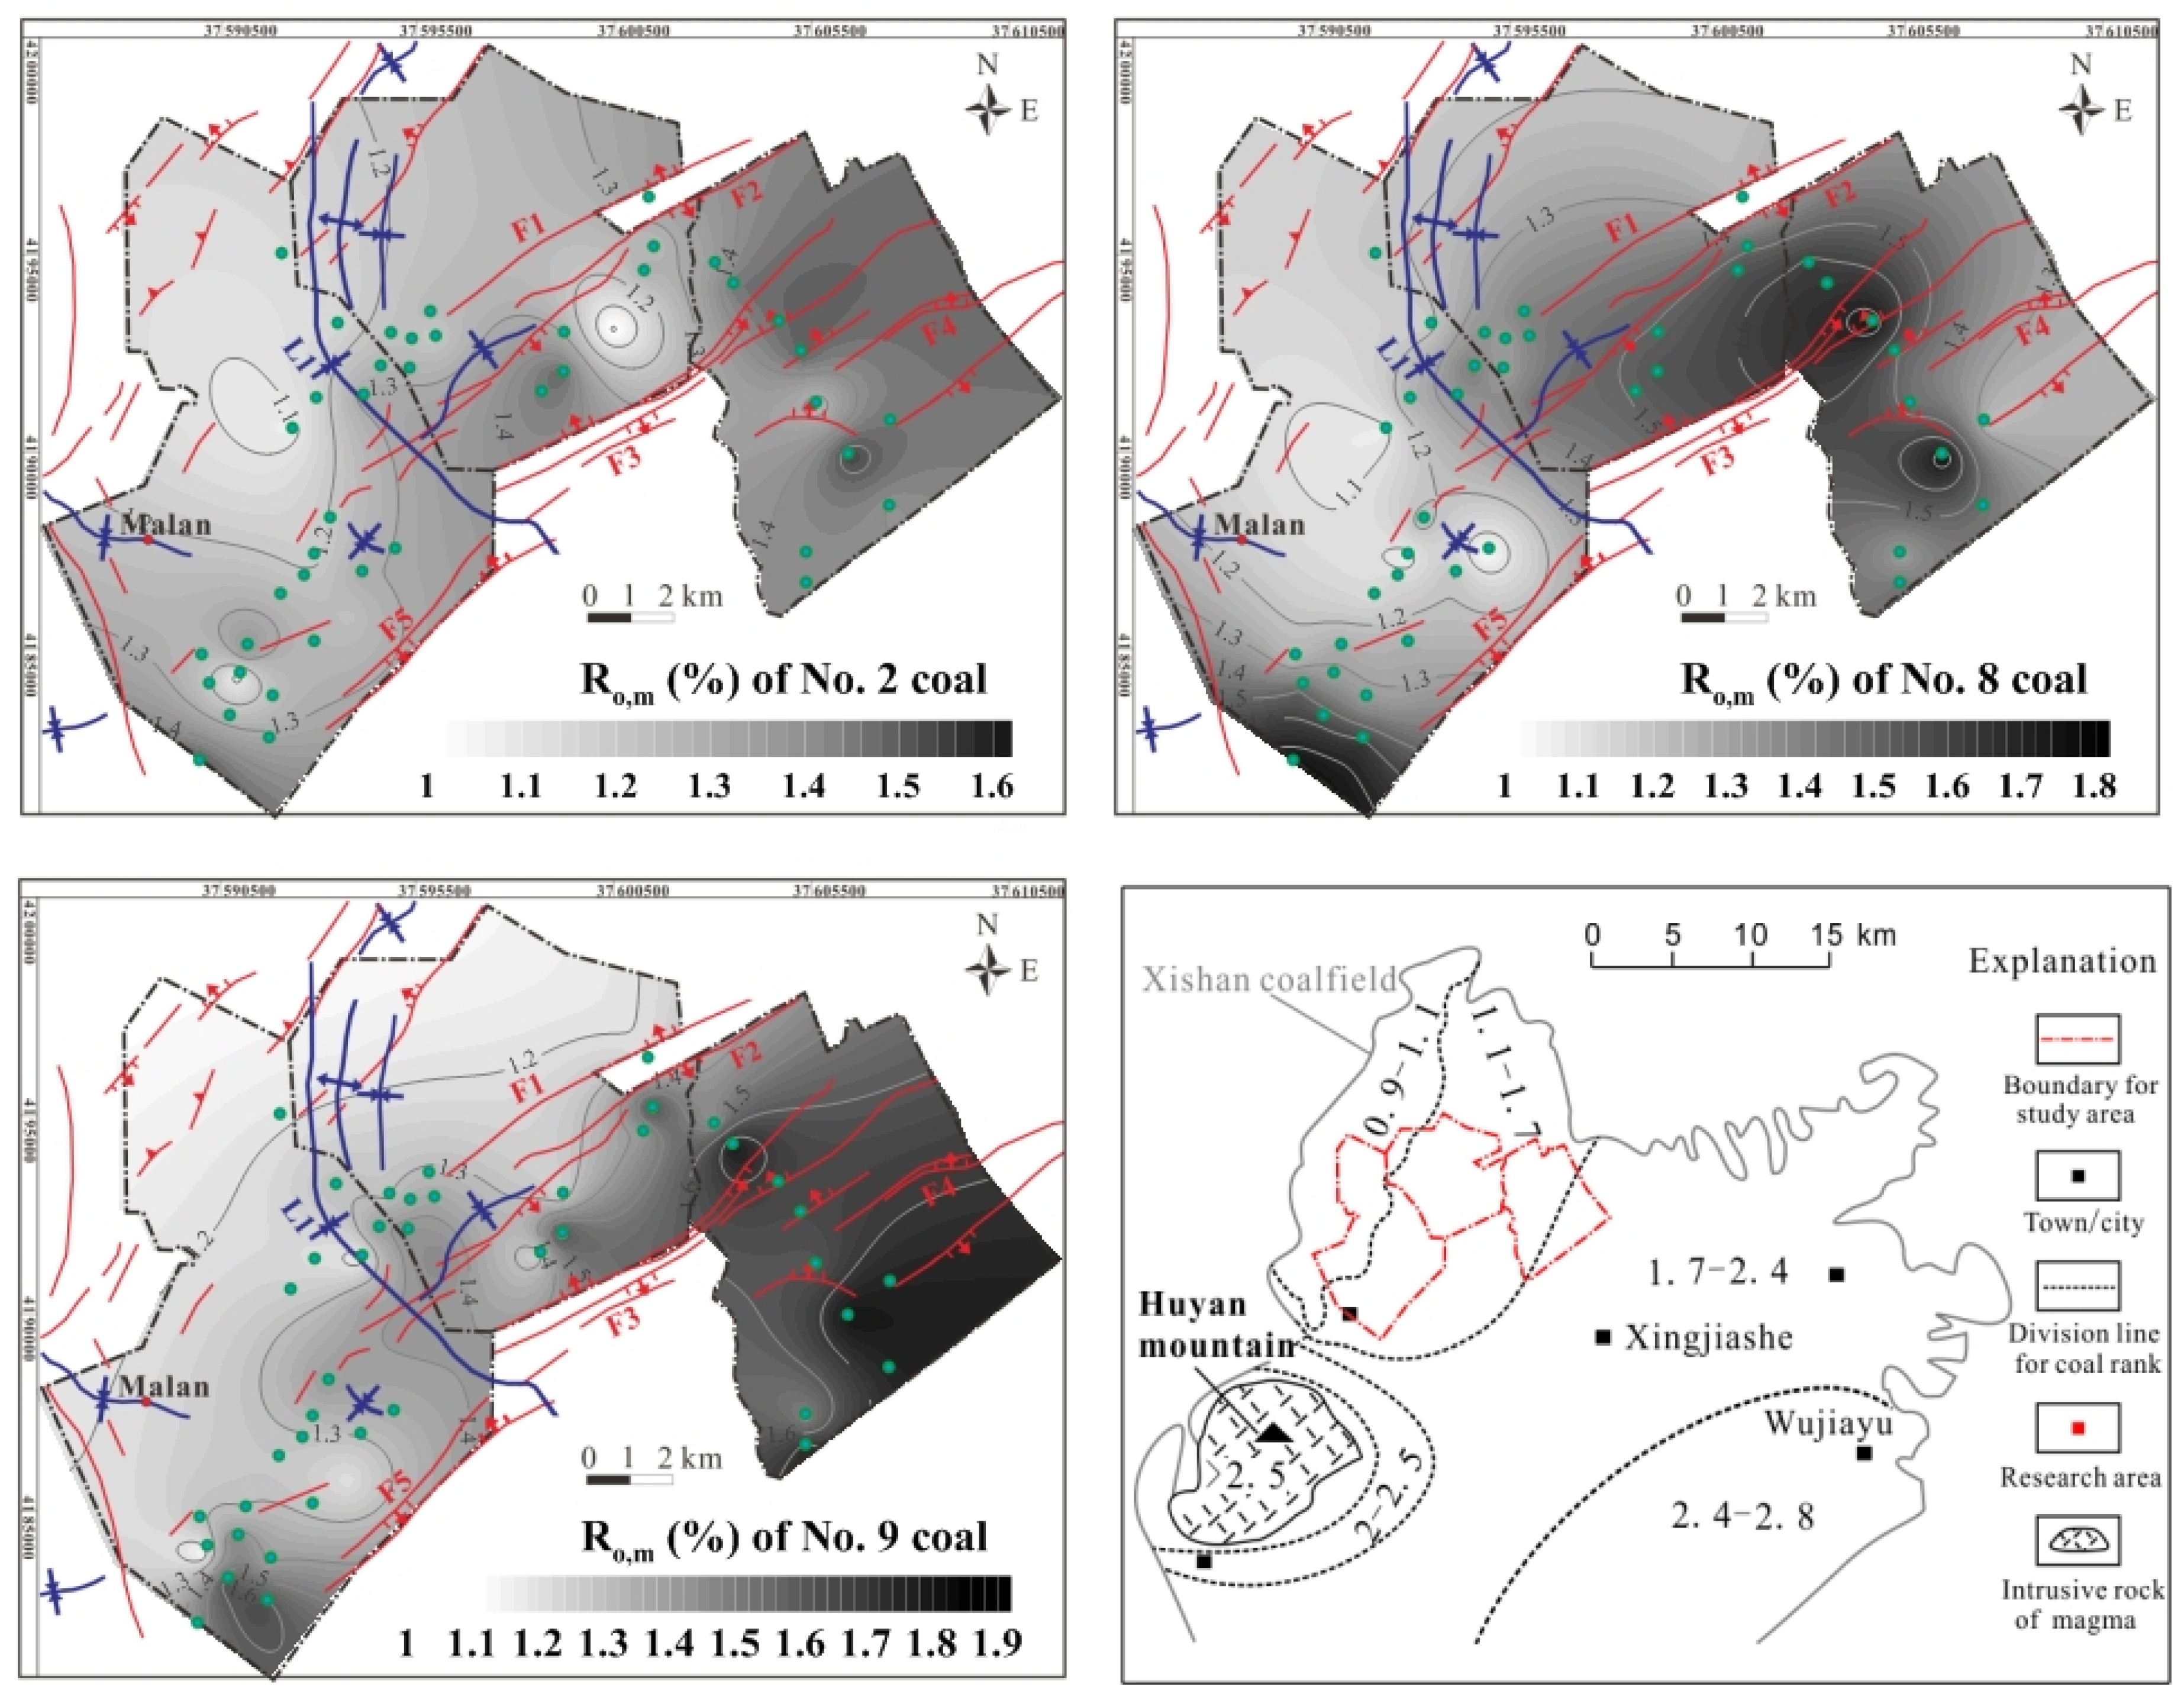
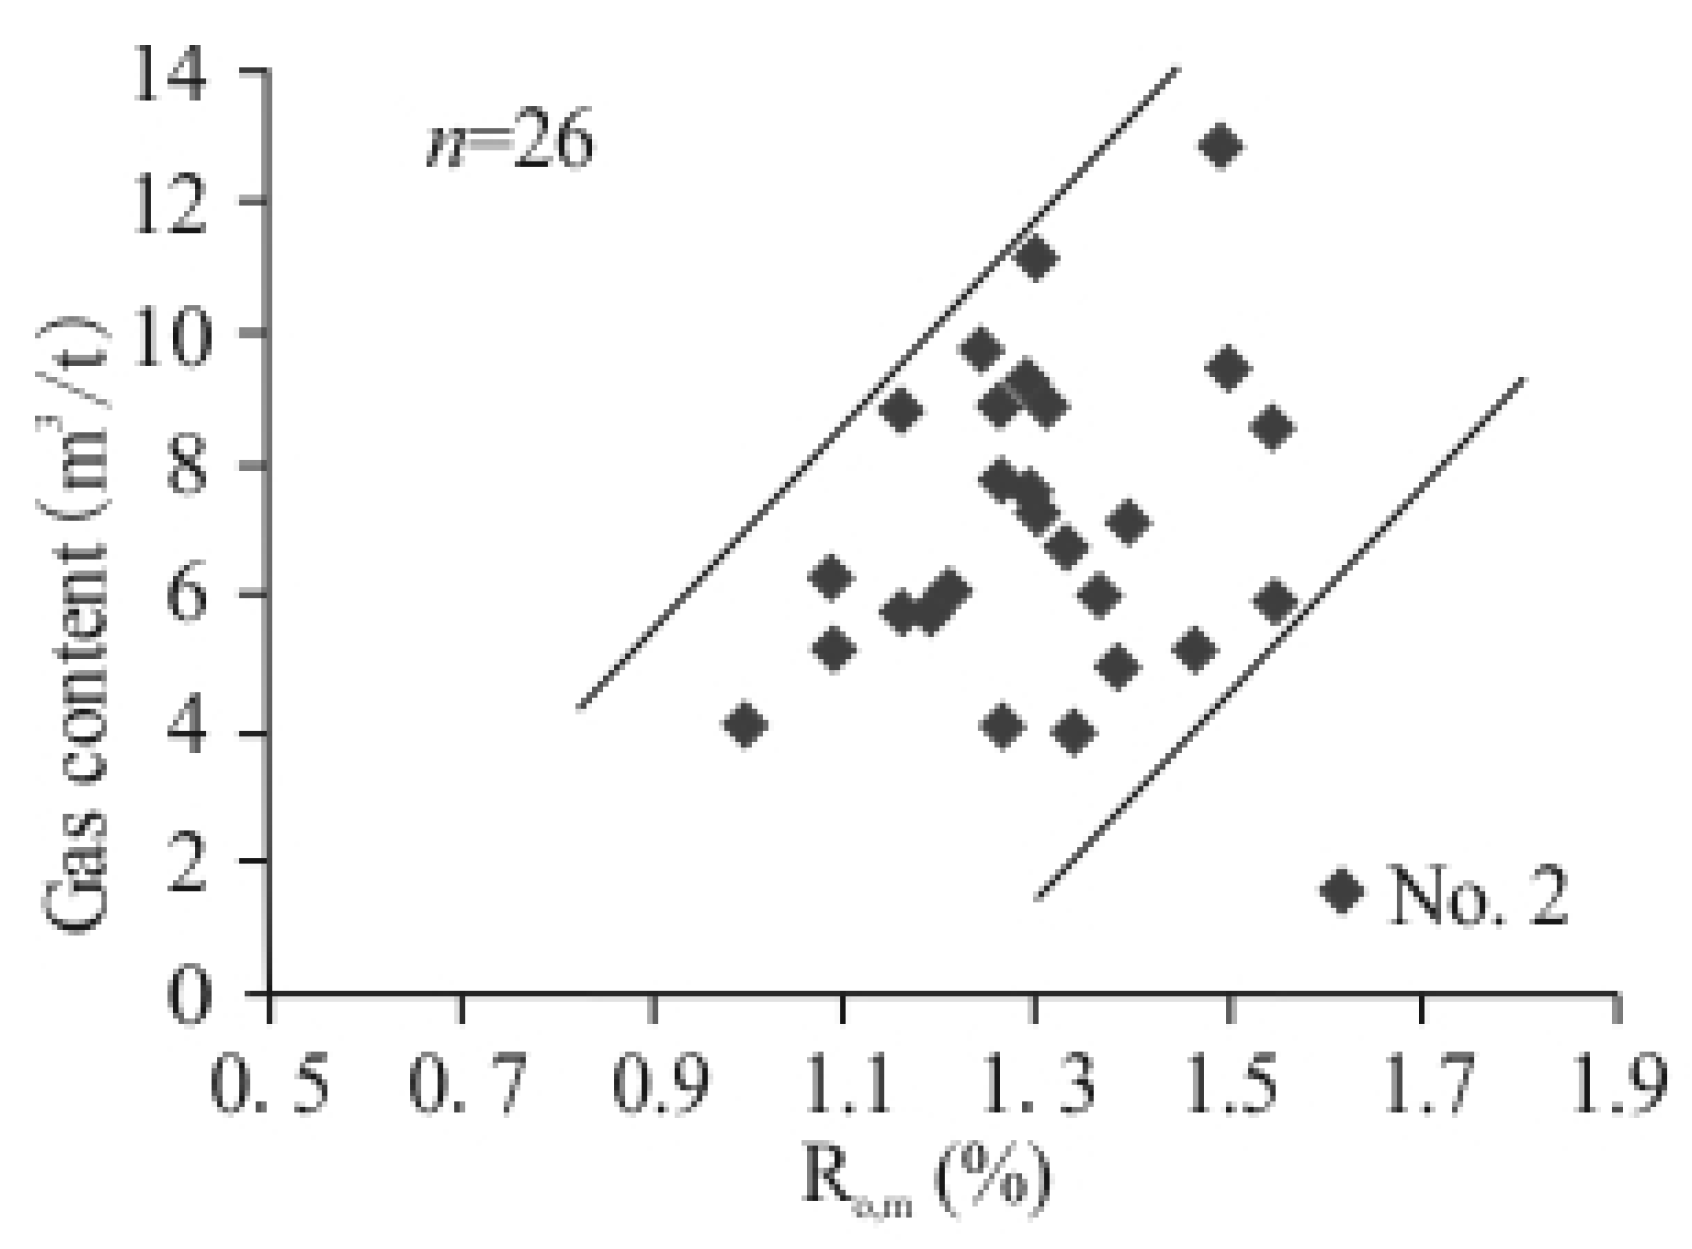
4.2.4. Coal Metamorphism

Coal metamorphism is also an important factor for CBM generation and storage [51]. In the Gujiao area, formations were once dominated by plutonic metamorphism and then, during the Yanshanian, subjected to several magma intrusions with magmatic thermal metamorphism [52]. The magma intrusions are located in Huyan in the west and in Qixian in the southeast Xishan coalfield [52], and caused a banded change in coal metamorphism that varied from high volatile bituminous coals to semi-anthracites. These intrusions increase from the northwest to the southeast (Figure 9). In the Gujiao area, the maximum vitrinite reflectance of No. 2 coal is 0.99–1.54%, with an average of 1.29%, and of No. 8 and No. 9 coals are 1.03–1.78% and 1.18–1.80%, with averages of 1.38% and 1.42%, respectively. The coals in the study area are locally affected by the magma intrusions. There is a sharp increase in vitrinite reflectance in the southwestern Gujiao area due to the magma intrusion at Huyan Mountain (Figure 9).
In the Gujiao area, gas content of coals from Nos. 2, 8, and 9 coal seams has positive relationships with coal metamorphism (Figure 10). The enlargement in micropores and specific surfaces from lignites to bituminous coals cause gas adsorption capacity of coals grow. Normally, the area with the maximum vitrinite reflectance indicates the CBM enrichment [12].

4.2.5. Coal Thickness

Although the thick coal seams can extend the path of gas transport, for example, in the diffusion of gas from the inside coals to the roof or floor [14], there is no obvious correlation between coal thickness and gas content in the Gujiao area. The average thicknesses of Nos. 2, 8, and 9 coal seams are 2.33, 3.39, and 1.77 m, respectively. The gas content in coal seams varies largely under the same thickness, which indicates that coal thickness less effectively controls gas content in the coal seam.

4.2.6. Hydrodynamics

In the Gujiao area, the flow of groundwater is driven by topography. The strata in the Gujiao area are tilted in the north, and the burial depth gradually increased southward. The groundwater recharges in the area located in the north and west Xishan coalfield with precipitation and surface water to supply. The total dissolved solids (TDS) of the groundwater for Nos. 2, 8, and 9 coals in the Gujiao area are in the range of 638–1713 ppm, with NaHCO3 [29]. The relationship between hydrodynamics and gas content shows that gas content of No. 2 coal steeply grow with increasing TDS to the Malan syncline (L1) core in the X1–X1’ profile and the X2–X2’ profile (Figure 11), the same for the No. 8 and No. 9 coals. L1 controls the flow of groundwater presented with various TDS values [9,21]. For the parts away from the Malan syncline core, the lower gas content is the same due to hydrologic flushing and gas solutions [47], though with high Ro,m as shown in the X1–X1’ profile and the X2–X2’ profile. Therefore, the hydrological conditions have an influence on gas content in the Gujiao area.

4.3. Factors of CBM Reservoirs Affecting on Gas Content

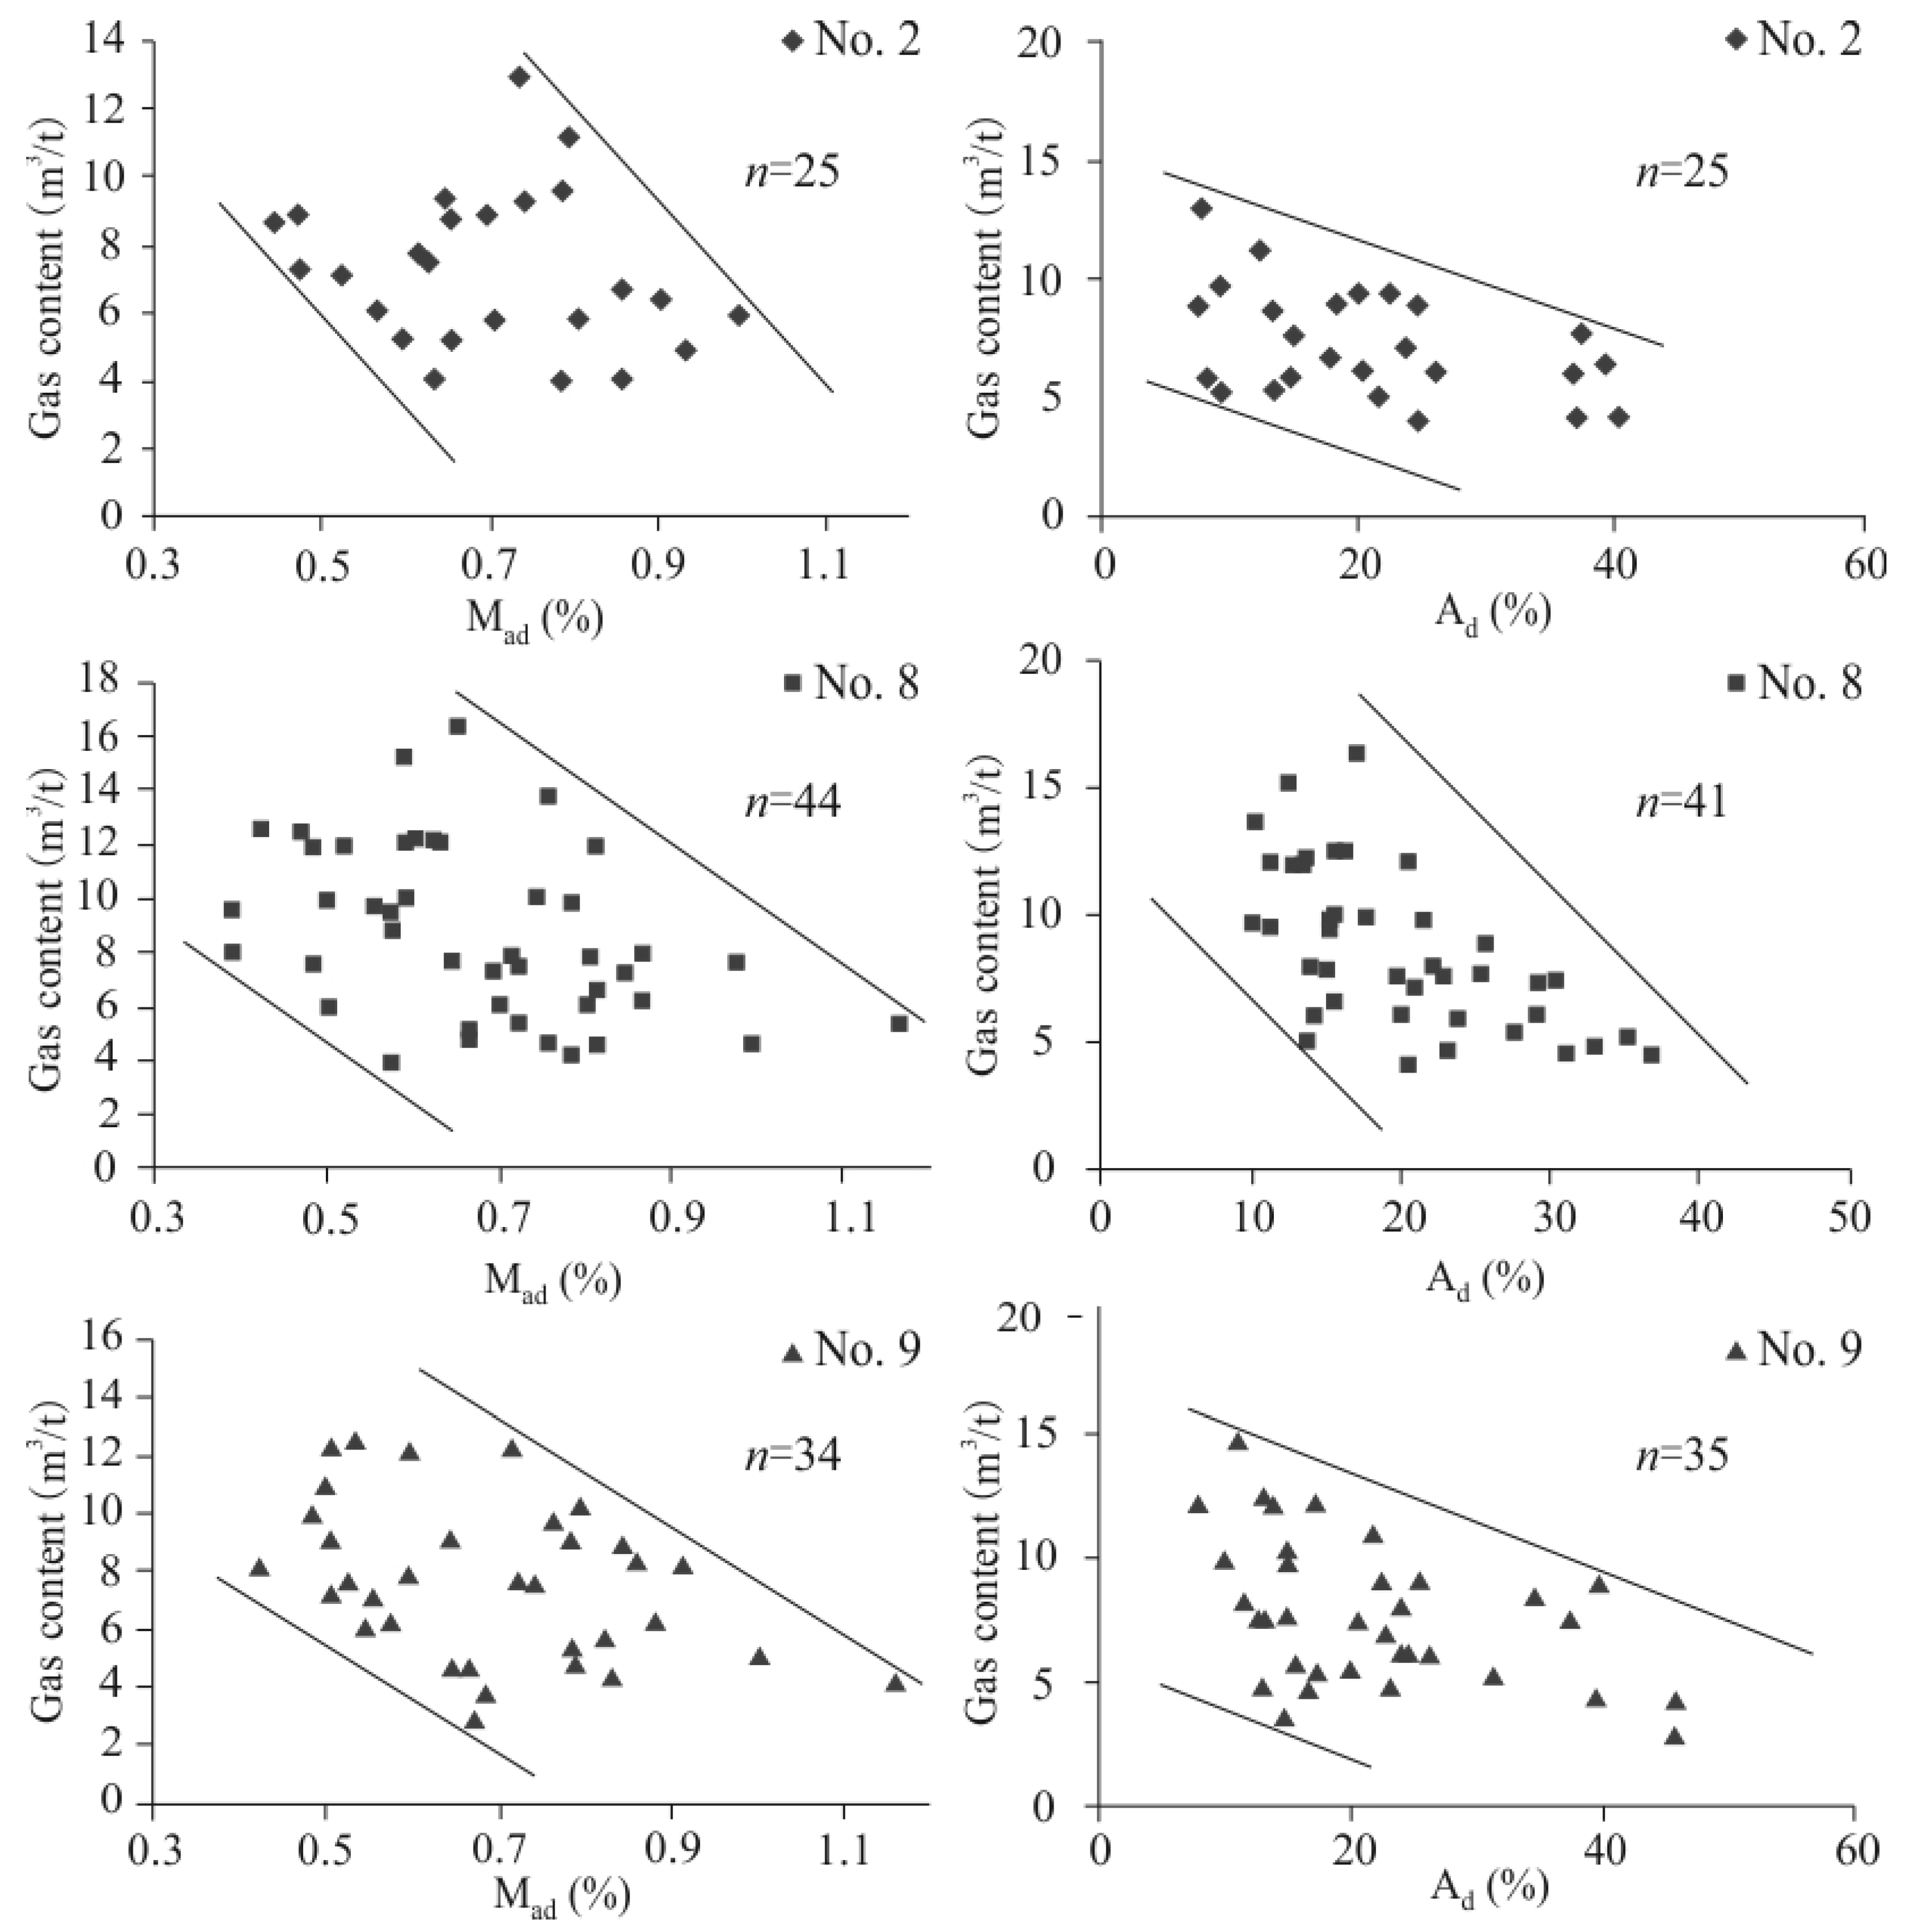
4.3.1. Moisture and Ash Yield

The average moisture content of Nos. 2, 8, and 9 coals in the Gujiao area is 0.68%, 0.67%, and 0.7%, respectively. Gas content has a roughly negative relationship with moisture content in a broad strip (Figure 12). Moisture in coals has marked effects on gas adsorption capacity, which can compete with gases at the adsorption point in coals to expel CBM out of the pores [53]. The moisture may have a greater or lesser effect on methane adsorption due to the contiguous moisture in each coal. It is difficult to isolate moisture influence on gas content possibly associated with coal composition and metamorphism [54].
In the Gujiao area, the average ash yield of Nos. 2, 8, and 9 coals is 20.76%, 20.76%, and 21.46%, respectively. Ash yield from the three coal seams presents negative correlations with gas content in general (Figure 12). In addition, ash yield also reflects inorganic matters, such as clay minerals [22], which may affect the macropore structure in coals resulting in low gas content.

4.3.2. Porosity and Permeability

The average porosity for the Nos. 2, 8, and 9 coal seams in the Gujiao area is 5.43%, 5.63%, and 5.74%, respectively. The average permeability of the Nos. 2, 8, and 9 coal seams in the Gujiao area is 0.18, 0.38, and 0.11 mD, respectively [29,55], which is attributed to the low permeability CBM reservoirs in general. In the Gujiao area, the porosity, specific surface area, and permeability of coal seams gradually increase from the west to the east [55]. These parameters were markedly influenced by geological structures. The porosity and permeability are obviously reduced around the Malan syncline in the western part due to compressive stress. In the eastern part, normal faults develop well, which can improve pore connectivity and permeability. In addition, the permeability of coal seams in the southern areas showed a downward trend with increasing burial depth. The eastern faulting area should be favorable for CBM production due to the preferable permeability and higher gas content.

4.3.3. Adsorption Capacity of Coals

Adsorption capacity of coals can be measured, which is directly related to gas content [28]. The Langmuir volume (VL) of Nos. 2, 8, and 9 coals in dry air base is 19.35 m3/t, 25.64 m3/t, and 21.34 m3/t, and the Langmuir pressure (PL) is 2.72 MPa, 1.93 MPa, and 2.71 MPa, respectively [28,32]. The No. 8 coal has the largest Langmuir volume and the lowest Langmuir pressure, which indicates maximum CH4 adsorption capacity. Interestingly, the Langmuir volume of the No. 9 coal is relatively small, followed by the No. 2 coal. The middle No. 8 coal seam has the greatest average Langmuir volume, which implies that coal composition also has significant effects on the CH4 adsorption capacity of coals in the Gujiao area.

4.4. Gray Correlative Evaluation of Factors Affecting Gas Content

4.4.1. Evaluation Results

Gray correlation was used to quantitatively evaluate the correlation between controlling factors and gas content in the three coal seams. Evaluation indices including multiple factors (e.g., geological structure, hydrodynamics, coal thickness, and reservoir properties) affecting gas content were adopted to quantitatively rank the key factors controlling gas content in coal seams. The effects of geological structures, including folds and faults, and TDS on gas content were semiquantitatively evaluated by assigning specific values (e.g., 4 for a syncline axis, 3 for a gently inclined zone, and 2 for a steeply inclined zone). For faults, they are assigned values from 1 to 4 according to the assemblage of faults; for example, 1 is assigned to horsts, and 3–4 to garbens (Table 2).
Table 3 shows that the correlations between controlling factors and gas content of the three coal seams are all above 0.55, indicating that both geological factors and reservoir properties have effects on gas content. The values of factors affecting the gas content in No. 2 coal is 0.61–0.73, and for Nos. 8 and 9 coal seams, they are in the range of 0.59–0.72 and 0.61–0.69, respectively. Based on the evaluation result in Table 3, the main factors affecting the gas content in the No. 2 coal seam are coal metamorphism, followed by burial depth and ash yield. For the Nos. 8 and 9 coal seams, the geological structure has the greatest effect on gas content, followed by moisture content and ash yield.

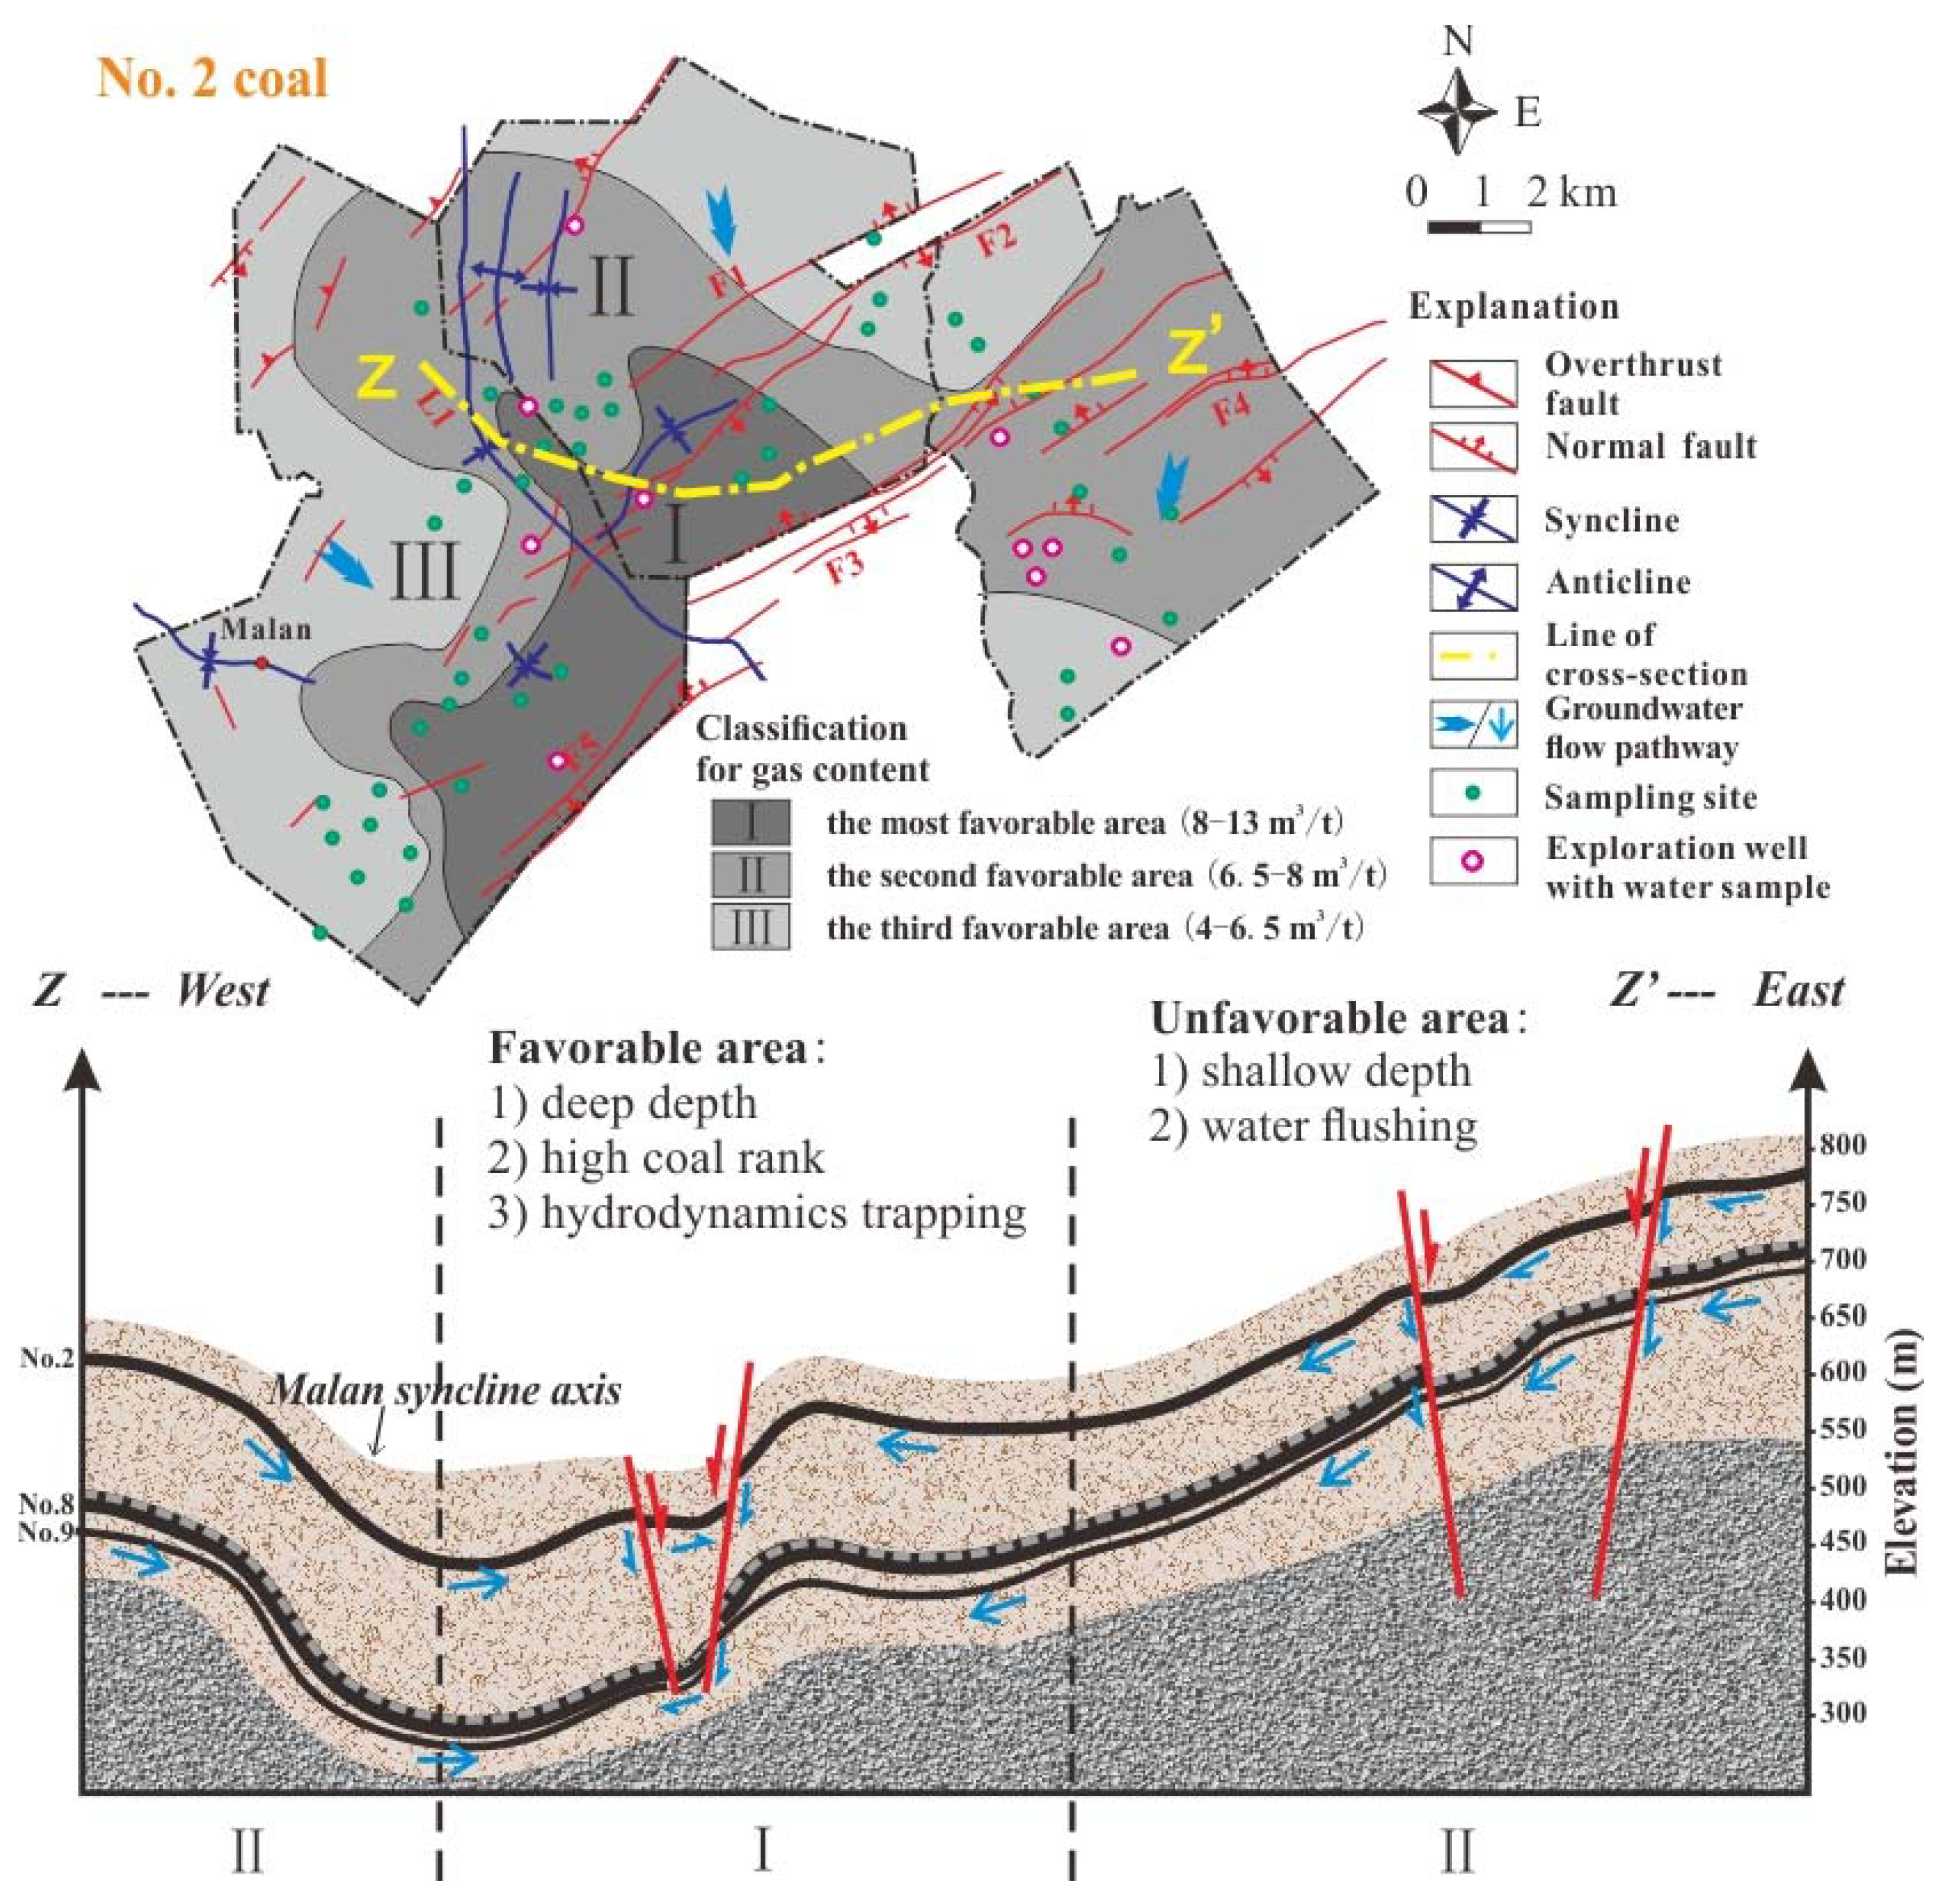
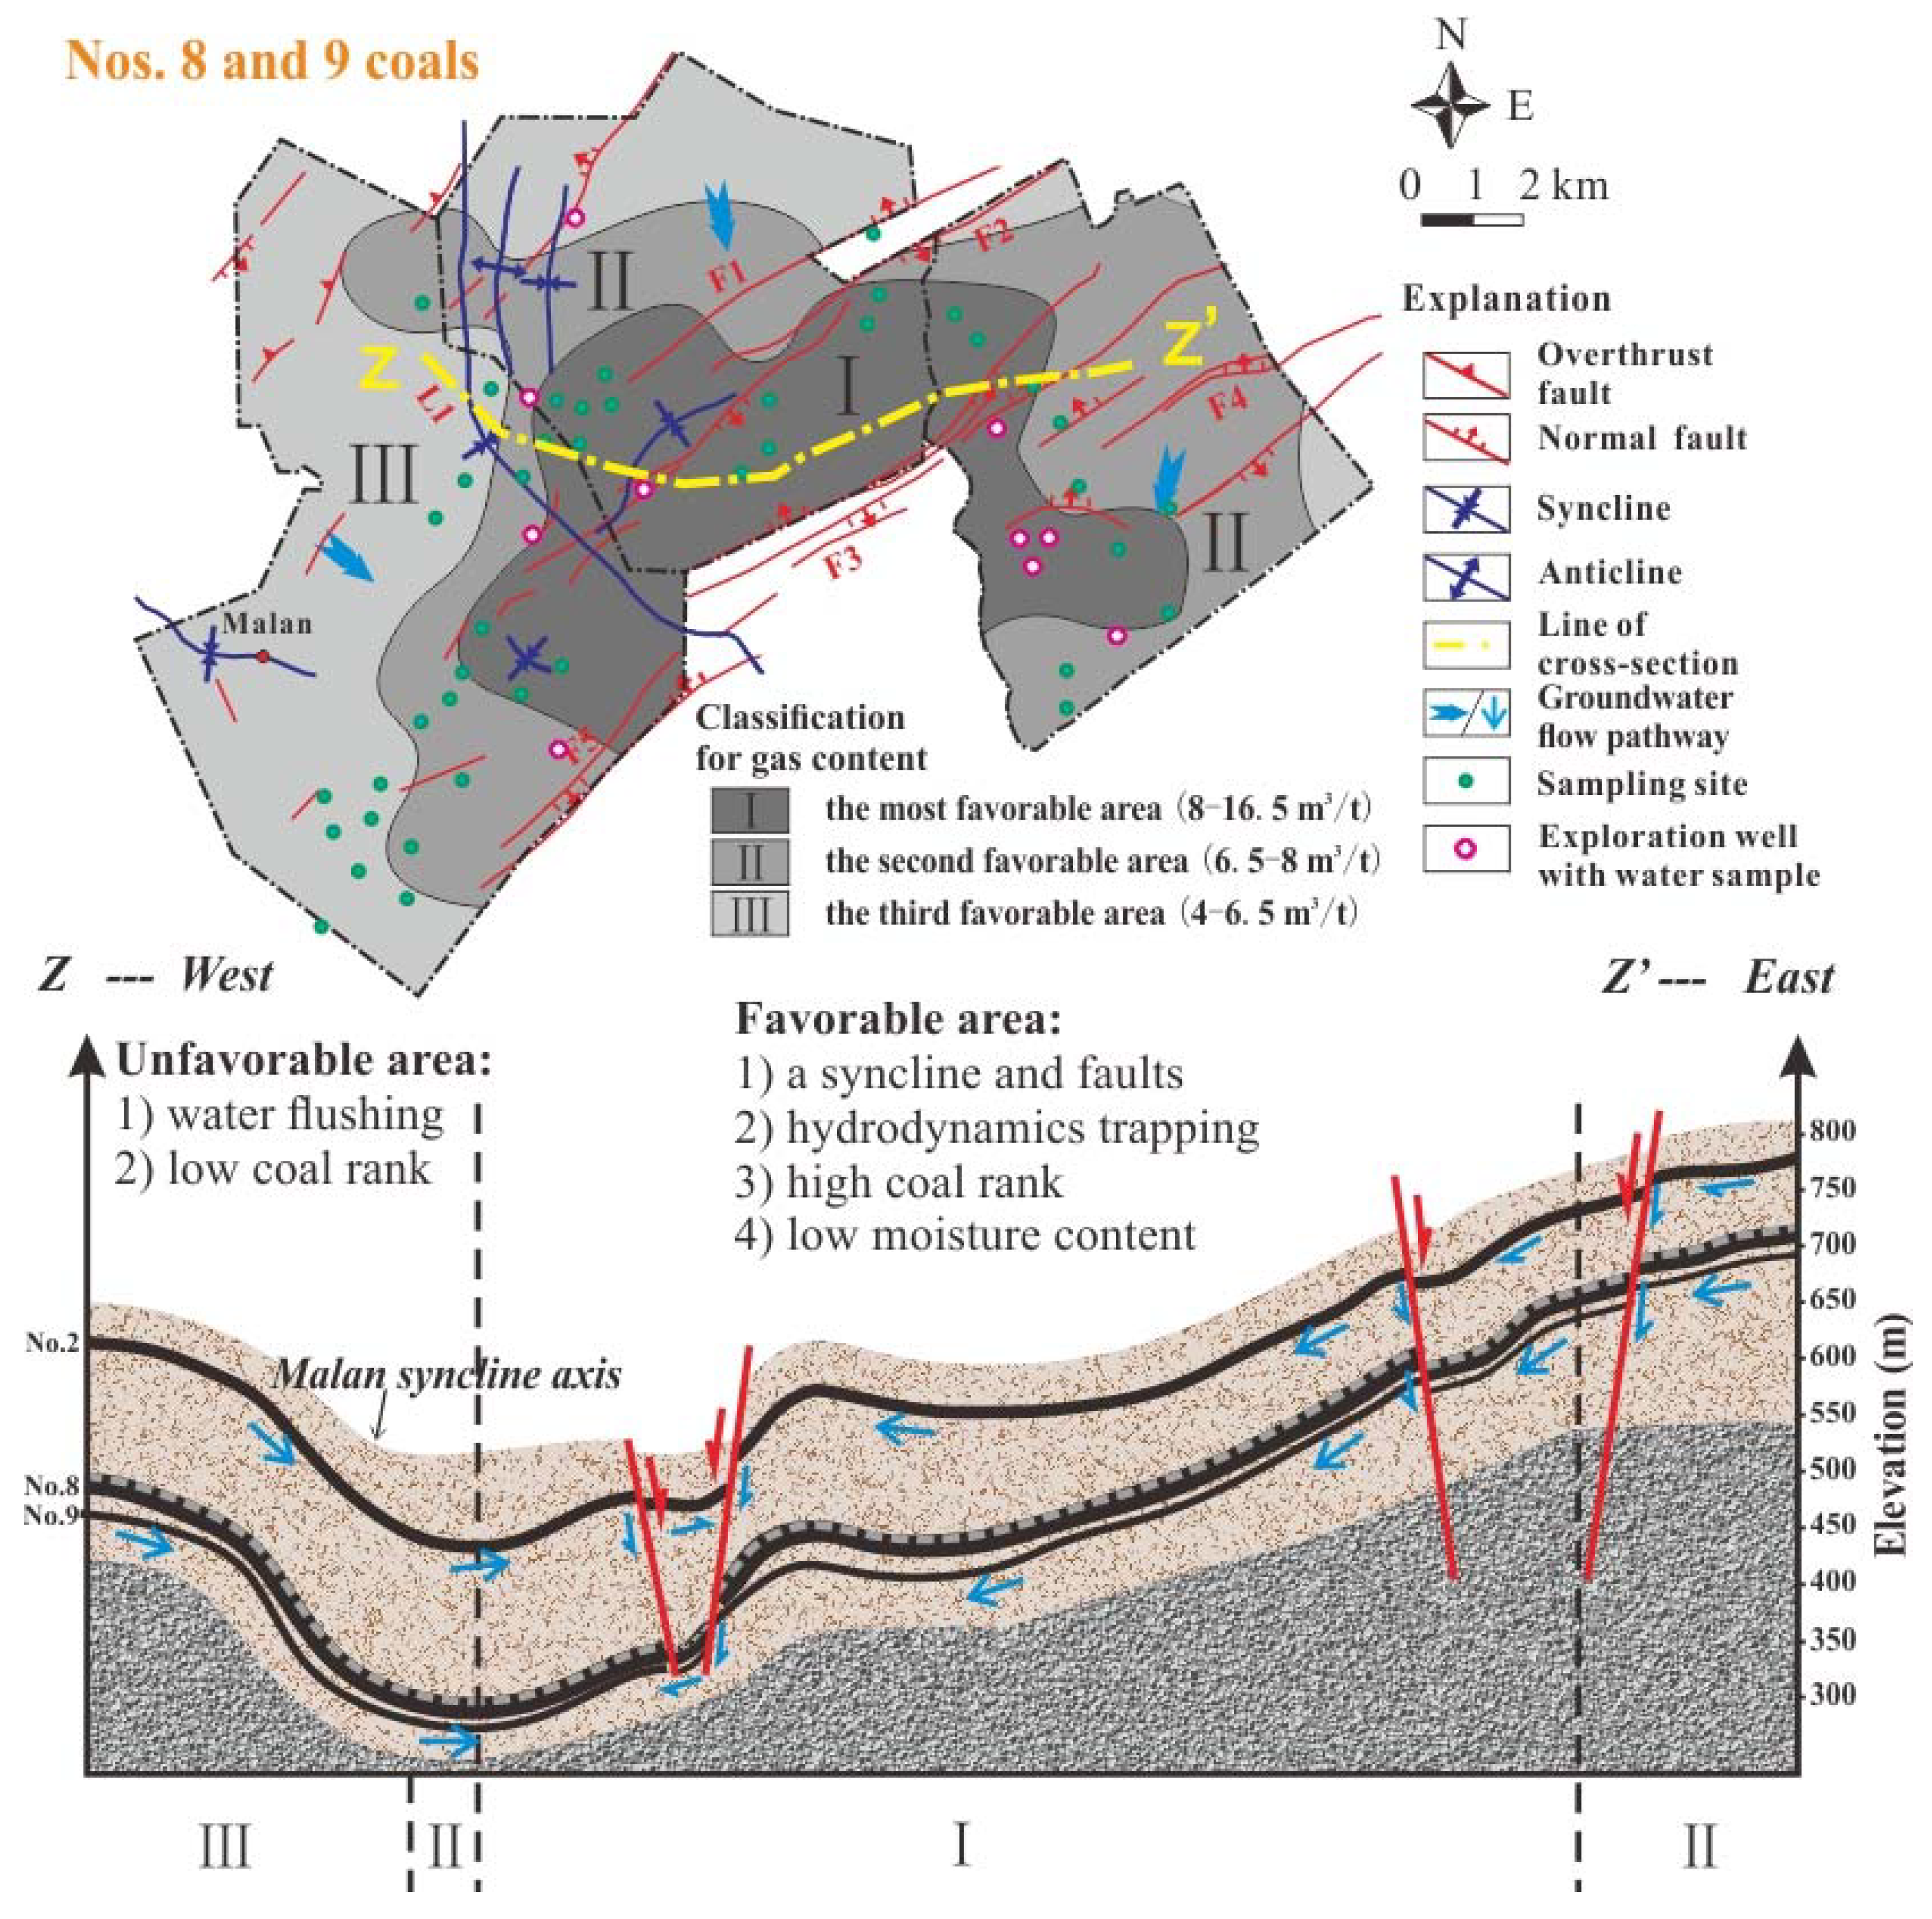
4.4.2. Classification of Gas Enrichment

Based on the quantitative results (Table 3), faults and folds in the Gujiao area significantly control gas content in the Nos. 8 and 9 coal seams. The favorable CBM enrichment regions are in the axis of the Malan syncline (L1) and the normal faulting area with good sealing. Coal metamorphism associated with burial depth has marked control on gas content in the No. 2 coal seam. The unfavorable CBM enrichment regions with low gas content shows in the eastern faulting area with shallow depth in the No. 2 coal seam.
The gas content is classified into three blocks: Block I has favorable CBM enrichment with the highest gas content, and Block III has the lowest gas content due to different gas enrichment mechanisms (Figure 13). For the No. 2 coal seam, the main gas enrichment mechanism in Area I is preferred coal metamorphism and burial depth due to L1. Blocks II and III with unfavorable CBM enrichment with a lower gas content result from a shallow depth associated with low coal rank. In addition, a hydrologic condition is disadvantageous due to the groundwater flows.
For the Nos. 8 and 9 coals (Figure 14), the main gas enrichment mechanism should be geological structures including L1 and normal faults with good sealing capacity. In addition, low moisture content and ash yields of the No. 8 coal are favorable for gas preservation. In Blocks II and III, the main CBM enrichment mechanisms of roof lithology and hydrodynamics for Nos. 8 and 9 coal seams are far from effective to CBM preservation.

5. Conclusions

The Nos. 2, 8, and 9 coal seams in the Gujiao area have great potentials on CBM exploration and production. Gas content significantly varies from place to place. For the three major coal seams, the No. 8 coal seam has the highest gas content followed by the No. 9 coal seam and the No. 2 coal seam. The gas content variability derives from many geological factors and the nature of CBM reservoirs. Main conclusions can be made as follows:
(1)
The highly variable gas content of different coal seams in the Gujiao area reflects the differences among tectonism, magmatism, hydrodynamism, and sedimentation. The geological structure divides the Gujiao area into two parts: synclines and normal faults. The three targeted coal seams have experienced two stage magmatic activities. The gas content of coal seams distributes along the groundwater flow from the north to the south, accumulating in the mid-south part of the Gujiao area.
(2)
The correlations between controlling factors and gas content are quantitatively evaluated by the gray correlation analysis. The main factors affecting gas content vary in different coal seams. Although many synthetic factors affecting gas content, the coal metamorphism, and geological structure should be the common main factors controlling gas content for these three targeted coal seams.
(3)
In the Gujiao area, the most favorable area for CBM enrichment is Block I, which is controlled by the different gas concentrations between No. 2 coal and Nos. 8 and 9 coals. A moderate burial depth (~500–800 m) and a relatively high coal rank (~1.25–1.55%) could effectively promote gas enrichment in the No. 2 coal seam. However, for Nos. 8 and 9 coals, the presence of a syncline and normal faults with good sealing capability together with low moisture content (~0.4–0.8%) can become a favorable area for CBM enrichment.

Author Contributions

Dameng Liu and Yidong Cai conceived and designed the experiments; Zhuo Zou performed the experiments and wrote the paper; Yidong Cai and Zhuo Zou analyzed the data; Dameng Liu, Yidong Cai and Yingjin Wang revised the paper and provided language support; Yingjin Wang and Jiapeng Li provided technical support.

Acknowledgments

This research was funded by the National Natural Science Fund (Grant nos. 41772160 and 41602170), the National Major Research Program for Science and Technology of China (2016ZX05043-001), and Key Project of Coal-based Science and Technology in Shanxi Province (grant no. MQ2014-01). Thanks to PetroChina Huabei Oilfield Company for providing CBM wells data and sampling in field.

Conflicts of Interest

The authors declare no conflict of interest.

References

  1. Kayacan, E.; Ulutas, B.; Kaynak, O. Grey system theory-based models in time series prediction. Expert Syst. Appl. 2010, 37, 1784–1789. [Google Scholar] [CrossRef]
  2. Guo, H.; Ni, X.; Wang, Y.; Du, X.; Yu, T.; Feng, R. Experimental Study of CO2-Water-Mineral Interactions and Their Influence on the Permeability of Coking Coal and Implications for CO2-ECBM. Minerals 2018, 8, 117. [Google Scholar] [CrossRef]
  3. Cai, Y.; Liu, D.; Zhang, K.; Elsworth, D.; Yao, Y.; Tang, D. Preliminary evaluation of gas content of the no. 2 coal seam in the Yanchuannan area, southeast ordos basin, China. J. Petrol. Sci. Eng. 2014, 122, 675–689. [Google Scholar] [CrossRef]
  4. Hower, J.C.; Gayer, R.A. Mechanisms of coal metamorphism: Case studies from Paleozoic coalfields. Int. J. Coal Geol. 2002, 50, 215–245. [Google Scholar] [CrossRef]
  5. Hildenbrand, A.; Krooss, B.M.; Busch, A.; Gaschnitz, R. Evolution of methane sorption capacity of coal seams as a function of burial history—A case study from the Campine Basin, NE Belgium. Int. J. Coal Geol. 2006, 66, 179–203. [Google Scholar] [CrossRef]
  6. Pashin, J.C.; Mcintyre-Redden, M.R.; Mann, S.D.; Kopaska-Merkel, D.C.; Varonka, M.; Orem, W. Relationships between water and gas chemistry in mature coalbed methane reservoirs of the Black Warrior Basin. Int. J. Coal Geol. 2013, 126, 92–105. [Google Scholar] [CrossRef]
  7. Yan, T.T.; Yao, Y.B.; Liu, D.M. Critical tectonic events and their geological controls on gas generation, migration, and accumulation in the Weibei coalbed methane coalfield, southeast Ordos basin. J. Nat. Gas Sci. Eng. 2015, 27, 1367–1380. [Google Scholar] [CrossRef]
  8. Hou, S.H.; Wang, X.M.; Wang, X.J.; Yuan, Y.D.; Zhuang, X.G. Geological controls on gas saturation in the Yanchuannan coalbed methane field, southeastern Ordos Basin, China. Mar. Pet. Geol. 2016, 78, 254–270. [Google Scholar] [CrossRef]
  9. Scott, A.R. Hydrogeologic factors affecting gas content distribution in coal beds. Int. J. Coal Geol. 2002, 50, 363–387. [Google Scholar] [CrossRef]
  10. Scott, S.; Anderson, B.; Crosdale, P.; Dingwall, J.; Leblang, G. Coal petrology and coal seam gas contents of the Walloon Subgroup—Surat Basin, Queensland, Australia. Int. J. Coal Geol. 2007, 70, 209–222. [Google Scholar] [CrossRef]
  11. Laxminarayana, C.; Crosdale, P.J. Role of coal type and rank on methane sorption characteristics of Bowen Basin, Australia coals. Int. J. Coal Geol. 1999, 40, 309–325. [Google Scholar] [CrossRef]
  12. Crosdale, P.J.; Beamish, B.B.; Valix, M. Coalbed methane sorption related to coal composition. Int. J. Coal Geol. 1998, 35, 147–158. [Google Scholar] [CrossRef]
  13. Qin, Y.; Fu, X.; Ye, J.; Lin, D.; Tang, S.; Li, G. Geological controls and their mechanisms of coal-reservoir petrography and physics of coalbed methane occurrence in China. J. China Univ. Min. Technol. 1999, 28, 14–19. (In Chinese) [Google Scholar]
  14. Wei, C.; Qin, Y.; Wang, G.; Fu, X.; Zhang, Z. Numerical simulation of coalbed methane generation, dissipation and retention in SE edge of Ordos Basin, China. Int. J. Coal Geol. 2010, 82, 147–159. [Google Scholar] [CrossRef]
  15. Levy, J.; Day, S.J.; Killingley, J.S. Methane capacity of Bowen Basin coals related to coal properties. Fuel 1997, 76, 813–819. [Google Scholar] [CrossRef]
  16. Draper, J.J.; Boreham, C.J. Geological controls on exploitable coal seam gas distribution in Queensland. APPEA J. 2006, 46, 343–366. [Google Scholar] [CrossRef]
  17. Crosdale, P.J.; Moore, T.A.; Mares, T.E. Influence of moisture content and temperature on methane adsorption isotherm analysis for coals from a low-rank, biogenically-sourced gas reservoir. Int. J. Coal Geol. 2008, 76, 166–174. [Google Scholar] [CrossRef]
  18. Scott, S.; Anderson, B.; Crosdale, P.; Dingwall, J.; Leblang, G. Revised geology and coal seam gas characteristics of the Walloon Subgroup—Surat Basin, Queensland. In Eastern Australasian Basins Symposium II: Petroleum Exploration Society of Australia; Boult, P.J., Johns, D.R., Lang, S.C., Eds.; PESA: Adelaide, Autralia, 2004; pp. 345–355. [Google Scholar]
  19. Su, X.; Lin, X.; Liu, S.; Zhao, M.; Song, Y. Geology of coalbedmethane reservoirs in the Southeast Qinshui Basin of China. Int. J. Coal Geol. 2005, 62, 197–210. [Google Scholar] [CrossRef]
  20. Lv, Y.; Tang, D.; Xu, H.; Luo, H. Production characteristics and the key factors in high-rank coalbed methane fields: A case study on the Fanzhuang Block, Southern Qinshui Basin, China. Int. J. Coal Geol. 2012, 96–97, 93–108. [Google Scholar] [CrossRef]
  21. Liu, H.; Sang, S.; Wang, G.G.; Li, M.; Xu, H.; Liu, S.; Li, J.; Ren, B.; Zhao, Z.; Xie, Y. Block scale investigation on gas content of coalbed methane reservoirs in Southern Qinshui Basin with statistical model and visual map. J. Pet. Sci. Eng. 2014, 114, 1–14. [Google Scholar] [CrossRef]
  22. Peng, C.; Zou, C.; Zhou, T.; Li, K.; Yang, Y.; Zhang, G.; Wang, W. Factors affecting coalbed methane (CBM) well productivity in the Shizhuangnan block of southern Qinshui basin, North China: Investigation by geophysical log, experiment and production data. Fuel 2017, 191, 427–441. [Google Scholar] [CrossRef]
  23. Li, J.; Liu, D.; Yao, Y.; Cai, Y.; Qiu, Y. Evaluation of the reservoir permeability of anthracite coals by geophysical logging data. Int. J. Coal Geol. 2011, 87, 121–127. [Google Scholar] [CrossRef]
  24. Tao, S.; Tang, D.; Xu, H.; Gao, L.; Fang, Y. Factors controlling high-yield coalbed methane vertical wells in the Fanzhuang Block, Southern Qinshui Basin. Int. J. Coal Geol. 2014, 134–135, 38–45. [Google Scholar] [CrossRef]
  25. Cai, Y.D.; Liu, D.M.; Yao, Y.B.; Li, J.Q.; Qiu, Y.K. Geological controls on prediction of coalbed methane of No. 3 coal seam in Southern Qinshui Basin, North China. Int. J. Coal Geol. 2011, 88, 101–112. [Google Scholar] [CrossRef]
  26. Xu, H.; Tang, D.; Tang, S.; Zhao, J.; Meng, Y.; Tao, S. A dynamic prediction model for gas-water effective permeability based on coalbed methane production data. Int. J. Coal Geol. 2014, 121, 44–52. [Google Scholar] [CrossRef]
  27. Teng, J.; Yao, Y.; Liu, D.; Cai, Y. Evaluation of coal texture distributions in the southern Qinshui basin, North China: Investigation by a multiple geophysical logging method. Int. J. Coal Geol. 2015, 140, 9–22. [Google Scholar] [CrossRef]
  28. Mo, R.; Zhao, J.; Wang, Y. Current status and prospect of exploration and development of Gujiao CBM Project. China Coalbed Methane 2012, 5, 3–7. (In Chinese) [Google Scholar]
  29. Wang, G.; Qin, Y.; Xie, Y.W.; Shen, J.; Han, B.B.; Huang, B.; Zhao, L. The division and geologic controlling factors of a vertical superimposed coalbed methane system in the northern Gujiao blocks, China. J. Nat. Gas Sci. Eng. 2015, 24, 379–389. [Google Scholar] [CrossRef]
  30. Xia, P.; Zeng, F.; Song, X.; Meng, Y.; Li, K.; Wang, J. Structural block division for further deep research in coalbed methane development in the Gujiao area, Xishan coalfield, North China. Arabian J. Geosci. 2016, 9, 713. [Google Scholar] [CrossRef]
  31. Xia, P.; Zeng, F.; Song, X. Parameters controlling high-yield coalbed methane vertical wells in the B3 area, Xishan coal field, Shanxi, China. Energy Explor. Exploit. 2016, 34, 711–734. [Google Scholar] [CrossRef]
  32. Zhao, L.; Qin, Y.; Cai, C.; Xie, Y.; Wang, G.; Huang, B. Control of coal facies to adsorption-desorption divergence of coals: A case from the Xiqu Drainage Area, Gujiao CBM Block, North China. Int. J. Coal Geol. 2017, 171, 169–184. [Google Scholar] [CrossRef]
  33. Huang, B.; Qin, Y.; Zhao, W.; Wang, G. Identification of the coal structure and prediction of the fracturability in the No. 8 coal reservoir, Gujiao block, China. Energy Explor. Exploit. 2018, 36, 204–209. [Google Scholar] [CrossRef]
  34. Wang, Y.; Liu, D.; Cai, Y.; Yao, Y.; Zhou, Y. Evaluation of structured coal evolution and distribution by geophysical logging methods in the Gujiao Block, northwest Qinshui basin, China. J. Nat. Gas Sci. Eng. 2018, 51, 210–222. [Google Scholar] [CrossRef]
  35. Wang, G.; Qin, Y.; Xie, Y.; Shen, J.; Zhao, L.; Huang, B.; Zhao, W. Coalbed methane system potential evaluation and favourable area prediction of Gujiao blocks, Xishan coalfield, based on multi-level fuzzy mathematical analysis. J. Petrol. Sci. Eng. 2018. [Google Scholar] [CrossRef]
  36. Li, Z.T.; Liu, D.M.; Ranjith, P.G.; Cai, Y.D.; Wang, Y.J. Geological controls on variable gas concentrations: A case study of the northern Gujiao Block, northwestern Qinshui Basin, China. Mar. Pet. Geol. 2017. [Google Scholar] [CrossRef]
  37. Xia, P.; Zeng, F.; Song, X.; Li, K.; Wang, J.; Feng, S.; Sun, B. Geologic structural controls on coalbed methane content of the no. 8 coal seam, gujiao area, Shanxi, China. Appl. Ecol. Environ. Res. 2017, 15, 51–68. [Google Scholar] [CrossRef]
  38. Qin, Y.; Jiang, B.; Wang, J.Y.; Wu, C.F.; Fu, X.H.; Wei, C.T. Coupling Control of Tectonic Dynamical Conditions to Coalbed Methane Reservoir Formation in the Qinshui Basin, Shanxi, China. Acta Geol. Sin. 2008, 82, 1355–1362. (In Chinese) [Google Scholar]
  39. Ping, J.; Yan, S.; Gu, P.; Wu, Z.; Hu, C. Application of MIKE SHE to study the impact of coal mining on river runoff in Gujiao mining area, Shanxi, China. PLoS ONE 2017, 12. [Google Scholar] [CrossRef] [PubMed]
  40. Yao, Y.; Liu, D.; Tang, D.; Tang, S.; Yao, C.; Huang, W. Preliminary evaluation of the coalbed methane production potential and its geological controls in the Weibei Coalfield, Southeastern Ordos Basin, China. Int. J. Coal Geol. 2009, 78, 1–15. [Google Scholar] [CrossRef]
  41. Diamond, W.P.; Levine, J.R. Direct Method Determination of the Gas Content of Coal: Procedures and Results; US Bureau of Mines: Washington, DC, USA, 1994.
  42. Diamond, W.P.; Schatzel, S.J. Measuring the gas content of coal: A review. Int. J. Coal Geol. 1998, 35, 311–331. [Google Scholar] [CrossRef]
  43. Deng, J.L. Introduction to Grey system theory. J. Grey Syst. 1989, 1, 1–24. [Google Scholar]
  44. Zhao, J.; Tang, D.; Xu, H.; Lv, Y.; Tao, S. High production indexes and the key factors in coalbed methane production: A case in the Hancheng block, southeastern Ordos Basin, China. J. Petrol. Sci. Eng. 2015, 130, 55–67. [Google Scholar] [CrossRef]
  45. Wang, Q.; Liu, G.; Wang, X. Gray correlation degree analysis of controlling factors on coal deformation. Energy Explor. Exploit. 2011, 29, 205–216. [Google Scholar] [CrossRef]
  46. Lu, J.; Chen, P.; Shen, J.; Liang, Z.; Yang, H. Study on the Prediction of Gas Content Based on Grey Relational Analysis and BP Neural Network. In Proceedings of the Eighth International Conference on Bio-Inspired Computing: Theories and Applications (BIC-TA), Huangshan, China, 12–14 July 2013; Springer: Berlin/Heidelberg, Germany, 2013; pp. 677–685. [Google Scholar]
  47. Pashin, J.C. Variable gas saturation in coalbed methane reservoirs of the Black Warrior Basin: Implications for exploration and production. Int. J. Coal Geol. 2010, 82, 135–146. [Google Scholar] [CrossRef]
  48. Ayers, W.B.J. Coalbed gas systems, resources, and production and a review of contrasting cases from the San Juan and Powder River basins. AAPG Bull. 2002, 86, 1853–1890. [Google Scholar]
  49. Sperrevik, S.; Færseth, R.B.; Gabrielsen, R.H. Experiments on clay smear formation along faults. Pet. Geosci. 2000, 6, 113–123. [Google Scholar] [CrossRef]
  50. Fu, H.; Tang, D.; Xu, H.; Xu, T.; Chen, B.; Hu, P.; Yin, Z.; Wu, P.; He, G. Geological characteristics and CBM exploration potential evaluation: A case study in the middle of the southern Junggar Basin, NW China. J. Nat. Gas Sci. Eng. 2016, 30, 557–570. [Google Scholar] [CrossRef]
  51. Mardon, S.M.; Eble, C.F.; Hower, J.C.; Takacs, K.; Mastalerz, M.; Bustin, R.M. Organic petrology, geochemistry, gas content and gas composition of Middle Pennsylvanian age coal beds in the Eastern Interior (Illinois) Basin: Implications for CBM development and carbon sequestration. Int. J. Coal Geol. 2014, 127, 56–74. [Google Scholar] [CrossRef]
  52. Liu, H.; Wang, H.; Zhao, G.; Li, G.; Yang, F.; Liu, H. Influence of the tectonic thermal events in Yanshan epoch on coalbed methane enrichment and high-productivity in Xishan coal field in Taiyuan. Nat. Gas Ind. 2005, 25, 29–32. (In Chinese) [Google Scholar]
  53. Yee, D.; Seidle, J.P.; Hanson, W.B. Gas sorption on coal and measurement of gas content. Hydrocarb. Coal AAPG Stud. Geol. 1993, 38, 203–218. [Google Scholar]
  54. Bustin, R.M.; Clarkson, C.R. Geological controls on coalbed methane reservoir capacity and gas content. Int. J. Coal Geol. 1998, 38, 3–26. [Google Scholar] [CrossRef]
  55. Han, B.B. Porosity, Permeability and favorable Production Region of Coal Reservoirs in Gujiao Block, Xishan. Master’s Thesis, China University of Mining and Technology, Xuzhou, China, 2015. (In Chinese). [Google Scholar]
Figure 1. Location of the Gujiao area in the northern Qinshui basin, North China. (a) The general position of the Gujiao area in China. (b) Topography and river system of research area and its adjacent areas. (c) Geological structures, river systems, and well sites are distributed in the Gujiao area and along section lines X–X’ and Y–Y’.
Energies 11 01044 g001
Figure 2. Lithology of the coal-bearing strata from Upper Carboniferous to Lower Permian in the Gujiao area.
Energies 11 01044 g002
Figure 3. Variable gas content from the CBM wells of the explored Nos. 2, 8, and 9 coals.
Energies 11 01044 g003
Figure 4. Gas content associated with burial depth for coal seams in the Gujiao area. (a) No. 2 coal; (b) No. 8 coal; (c) No. 9 coal.
Energies 11 01044 g004
Figure 5. A SW–NE structural cross section of the Malan syncline. Gas content distribution refers to profile Y–Y’ in Figure 1.
Energies 11 01044 g005
Figure 6. A N–S structural cross section of the normal faults. Gas content distribution refers to profile X–X’ in Figure 1.
Energies 11 01044 g006
Figure 7. Initially increasing and then decreasing trends of gas content with the increase in burial depth for Nos. 2, 8, and 9 coals due to temperature and pressure.
Energies 11 01044 g007
Figure 8. An E–W stratigraphic cross section showing vertical and lateral varieties in lithology of the Gujiao area associated with variable gas content of the major coal seams.
Energies 11 01044 g008
Figure 9. Maximum vitrinite reflectance (Ro,m) of Nos. 2, 8, and 9 coals in the Gujiao area and the maximum vitrinite reflectance of the circumjacent Xishan coalfield [52].
Energies 11 01044 g009
Figure 10. Increasing trends of gas content with the increase in the maximum vitrinite reflectance (Ro,m) for Nos. 2, 8, and 9 coal seams in the Gujiao area.
Energies 11 01044 g010aEnergies 11 01044 g010b
Figure 11. Total dissolved solids (TDS) of groundwater associated with the gas content of the No. 2 coal seam in the Gujiao area (TDS refers to [29]), Lines X1–X1’ and X2–X2’ are the hydrodynamics profiles.
Energies 11 01044 g011
Figure 12. Decreasing trends of gas content with the increase in moisture content (Mad) and ash yield (Ad) for Nos. 2, 8, and 9 coal seams in the Gujiao area.
Energies 11 01044 g012
Figure 13. Evaluation for gas content in the No. 2 coal classified into Areas I, II, and III associated with stratigraphic profile Z–Z’, blue arrows is the flow direction.
Energies 11 01044 g013
Figure 14. Evaluation for gas content in the Nos. 8 and 9 coals classified into Areas I, II, and III associated with stratigraphic profile Z–Z’, blue arrows is the flow direction.
Energies 11 01044 g014
Table 1. Statistical gas content and composition of the main coal seams in the Gujiao area.
Coal SeamSample NumberGas Content (m3/t)Cas Composition (%)
MaximumMinimumAverageCH4CO2N2
22613.054.137.3792.110.876.61
84516.463.978.7493.011.045.51
93614.593.747.8490.841.177.55
Table 2. Basic parameters for evaluating factors controlling gas content.
Well IDCoal No.Geologic StructureDepth
m
Roof Thickness
m
Ro,m
%
TDS
mg/L
Coal Thickness
m
Mad
%
Aad
%
Gas Content
m3/t
M122679.91 1.80 1.08 1430 2.60 0.65 9.24 5.36
M24692.41 1.35 1.19 1510 2.66 0.85 17.52 6.84
M43674.161.171.20 1370 2.64 0.56 25.94 6.23
M72547.45 1.70 1.38 1350 1.70 0.93 21.48 5.11
M82.5593.19 1.35 1.07 1310 1.43 0.90 39.19 6.53
T43367.84 2.57 1.47 1020 2.35 0.59 13.10 5.41
T64513.62 2.27 1.48 1490 2.40 0.73 7.47 13.05
T73525.52 4.76 1.31 1300 2.31 0.69 24.54 9.04
T11389.45 2.49 1.34 930 3.90 0.78 24.50 4.13
D23419.73 3.49 1.54 1350 1.45 0.44 12.88 8.81
M18 2771.98 0.19 1.08 1430 4.03 0.81 31.03 4.74
M24783.47 0.74 1.33 1510 4.40 0.90 13.07 12.09
M43759.83 0.79 1.39 1370 4.56 0.47 15.28 12.59
M72620.61 0.31 1.29 1350 3.22 0.70 13.97 6.22
M82.5672.65 0.48 1.33 1310 3.15 0.86 28.87 6.31
T43446.561.091.68 1020 3.260.5212.6712.03
T64593.25 0.40 1.55 1490 1.36 0.75 10.19 13.94
T73609.12 0.50 1.51 1300 2.10 0.65 16.87 16.46
T11472.25 0.61 1.23 930 3.45 0.69 28.88 7.45
D23502.63 1.24 1.75 1350 3.40 0.48 12.52 12.10
M192786.331.33 1.25 1430 1.760.6814.253.74
M24793.680.85 1.36 1510 1.80.8634.318.38
M43769.160.541.37 1370 1.440.4921.3510.94
M72626.611.00 1.31 1350 0.770.78155.48
M82.5681.30.58 1.47 1310 1.80.8215.225.74
T43458.931.651.78 1020 2.070.57.7612.31
T64622.012.441.64 1490 1.480.7710.5814.59
T73633.9511.59 1300 1.940.7437.287.62
T11485.251.021.22 930 1.830.8339.284.41
D23514.930.681.80 1350 4.160.5312.5712.53
Table 3. The correlation degree between the reference sequence and the compared sequence associated with an ordering of correlation degree for Nos. 2, 8, and 9 coal seams.
Coal SeamDegree/OrderGeologic StructureDepth Roof ThicknessRoHydrologic ConditionCoal ThicknessMadAad
2Degree0.620.710.610.720.670.620.660.68
Order62814753
8Degree0.720.600.600.620.610.590.670.66
Order16745823
9Degree0.690.620.610.630.670.620.630.63
Order16832745
Note: Mad, moisture content, air-dry basis; Aad, ash yield, air-dry basis.

