Fostering Renewables into the Cold Chain: How Photovoltaics Affect Design and Performance of Refrigerated Automated Warehouses


Abstract
1. Introduction
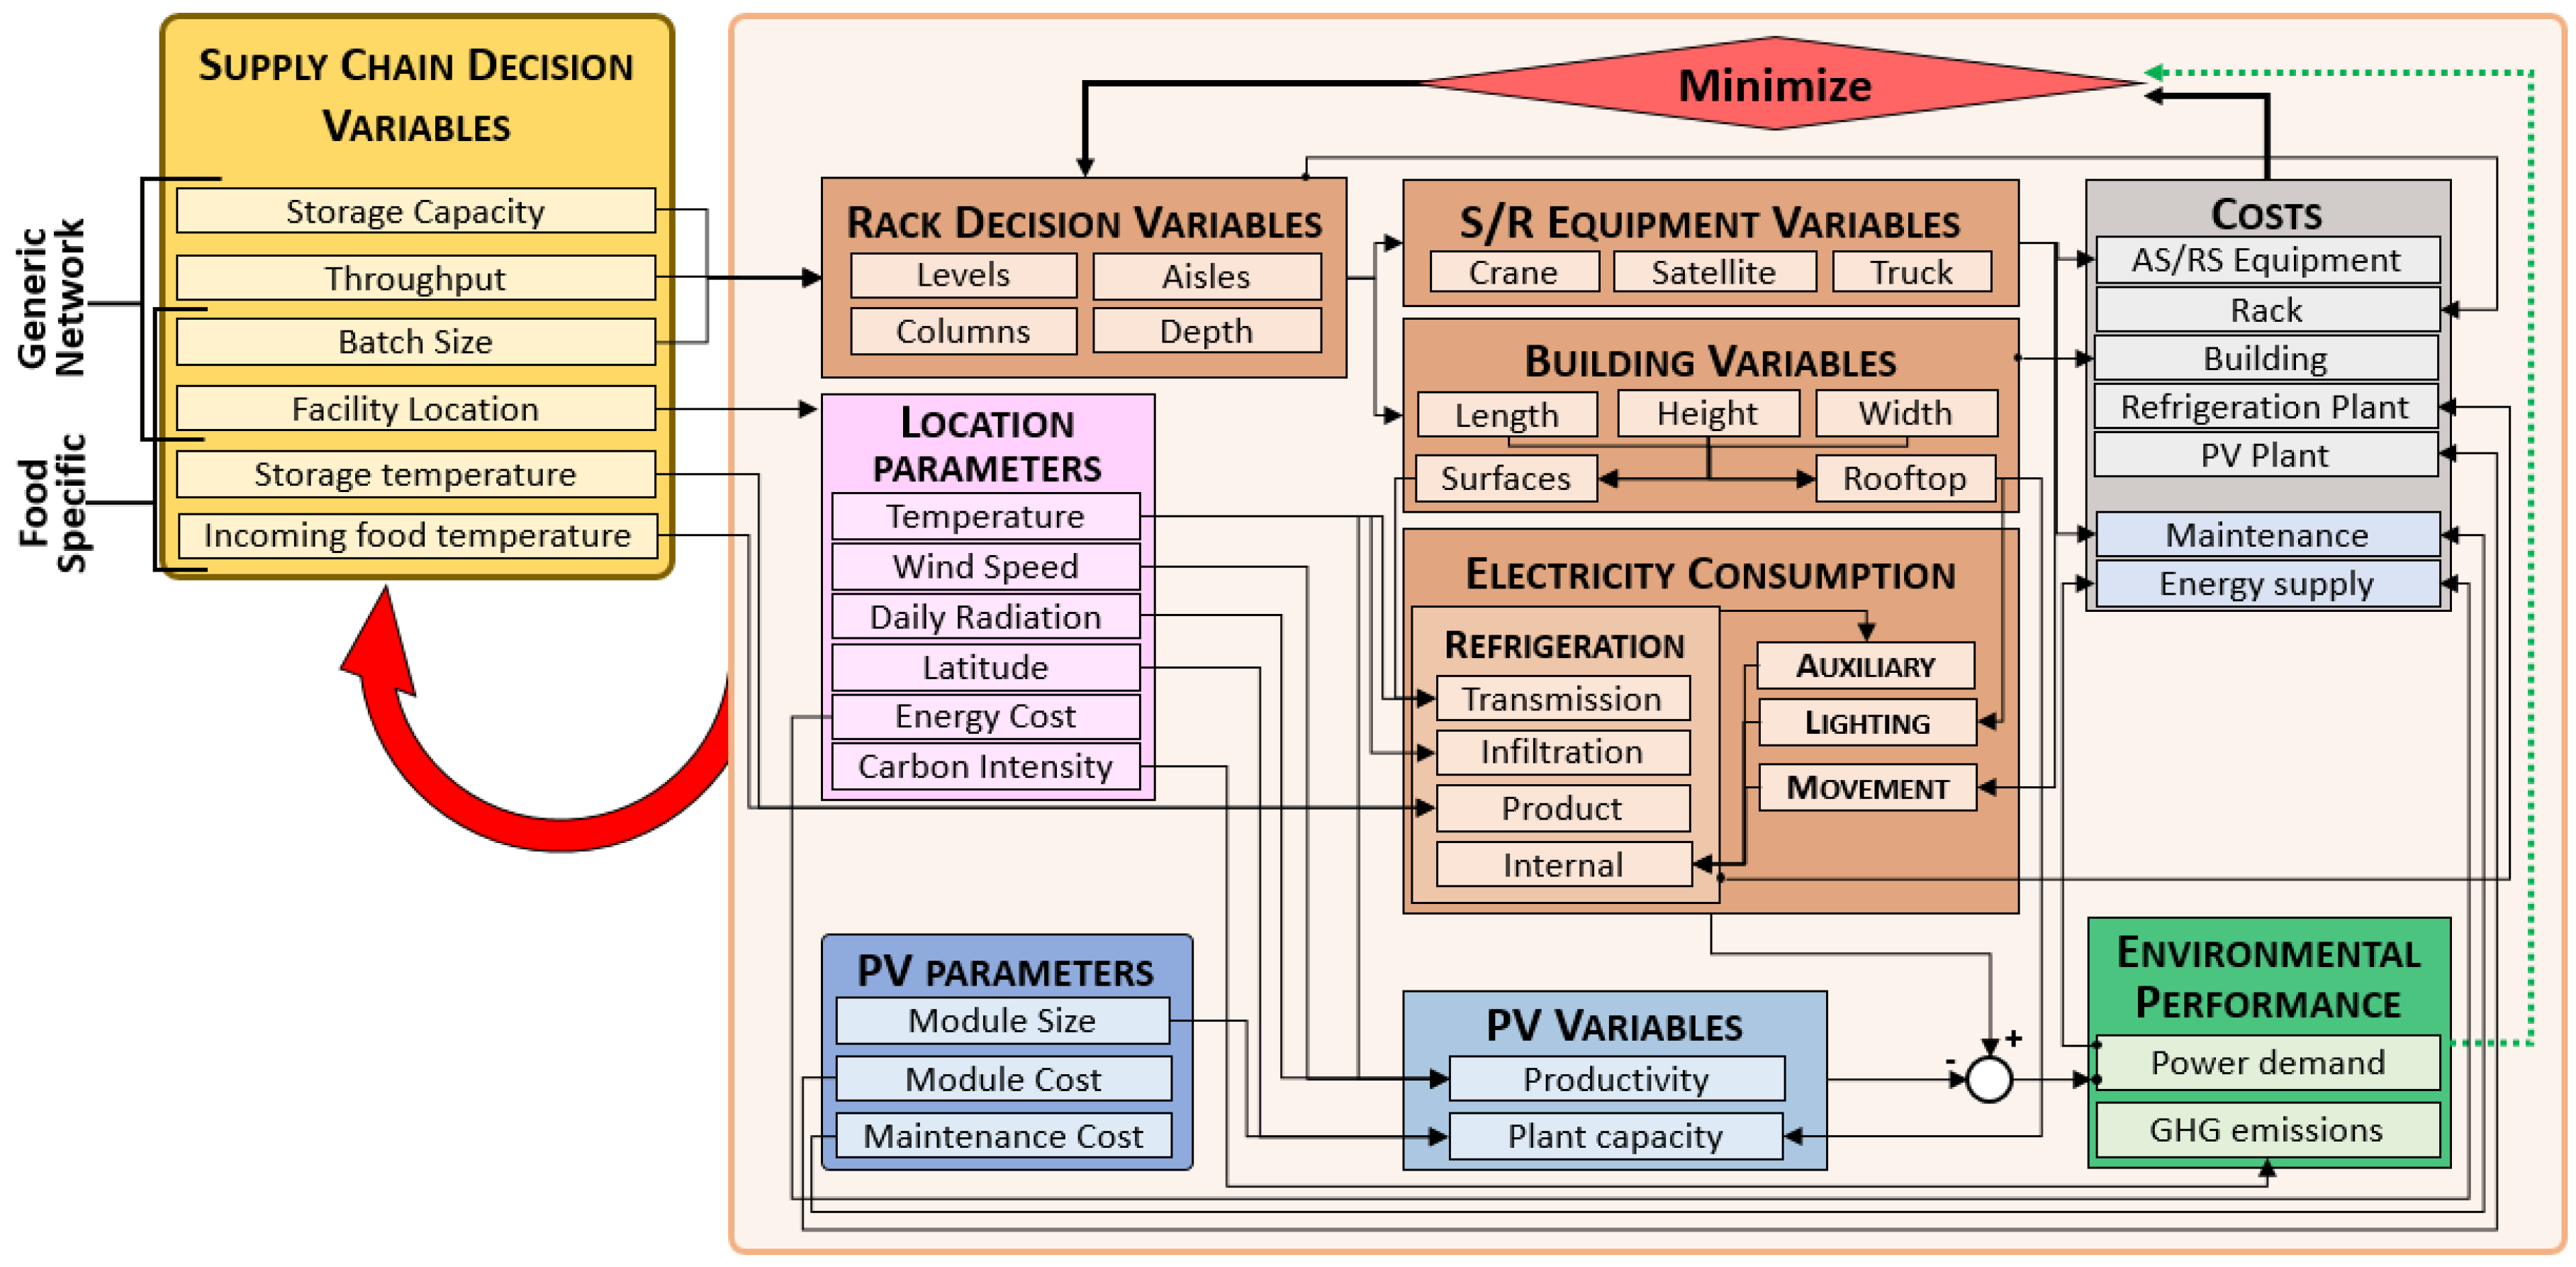
2. A Framework for PV, R-AS/RS, and Cold Chain Interactions
3. The Design Optimization Model for R-AS/RS with PV
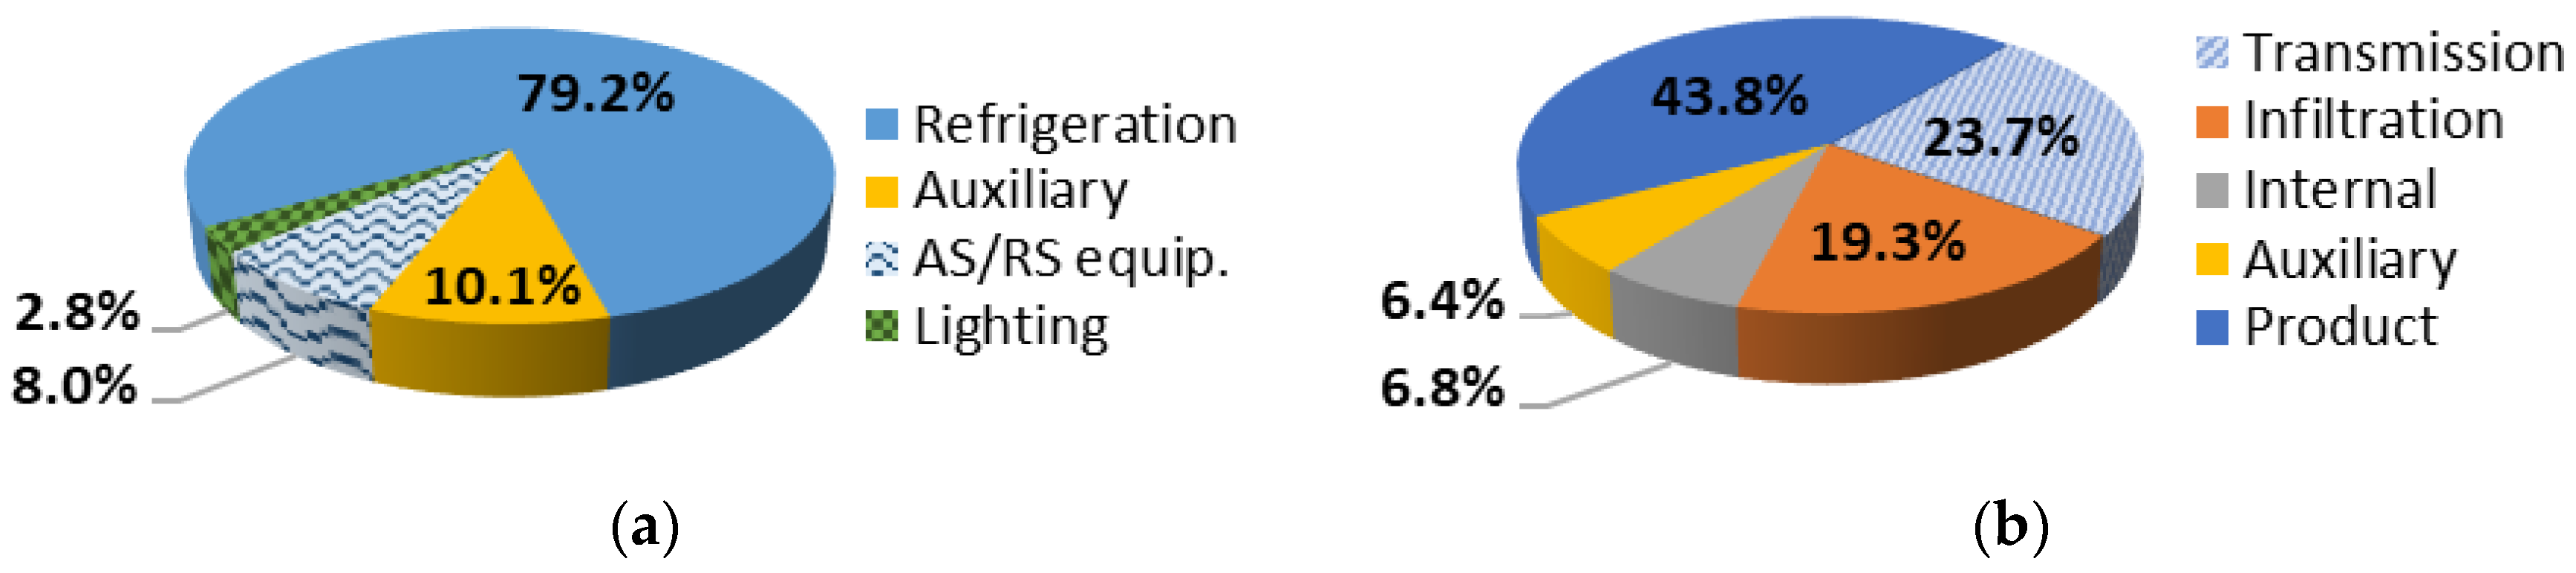
3.1. Refrigerated Automated Warehouse Energy Model
3.2. Photovoltaic Plant and Power Generation Model
3.2.1. Input Data
- Optimal tilt angle βo, which is the inclination angle of the PV module that gives the highest energy output for the whole year. Its calculation is based on the plant location latitude Φ;
- In-plane irradiance G on a surface facing south (i.e., azimuth angle α = 0°) and having an inclination angle equal to βo;
- Ambient Temperature Tamb;
- Wind speed v.
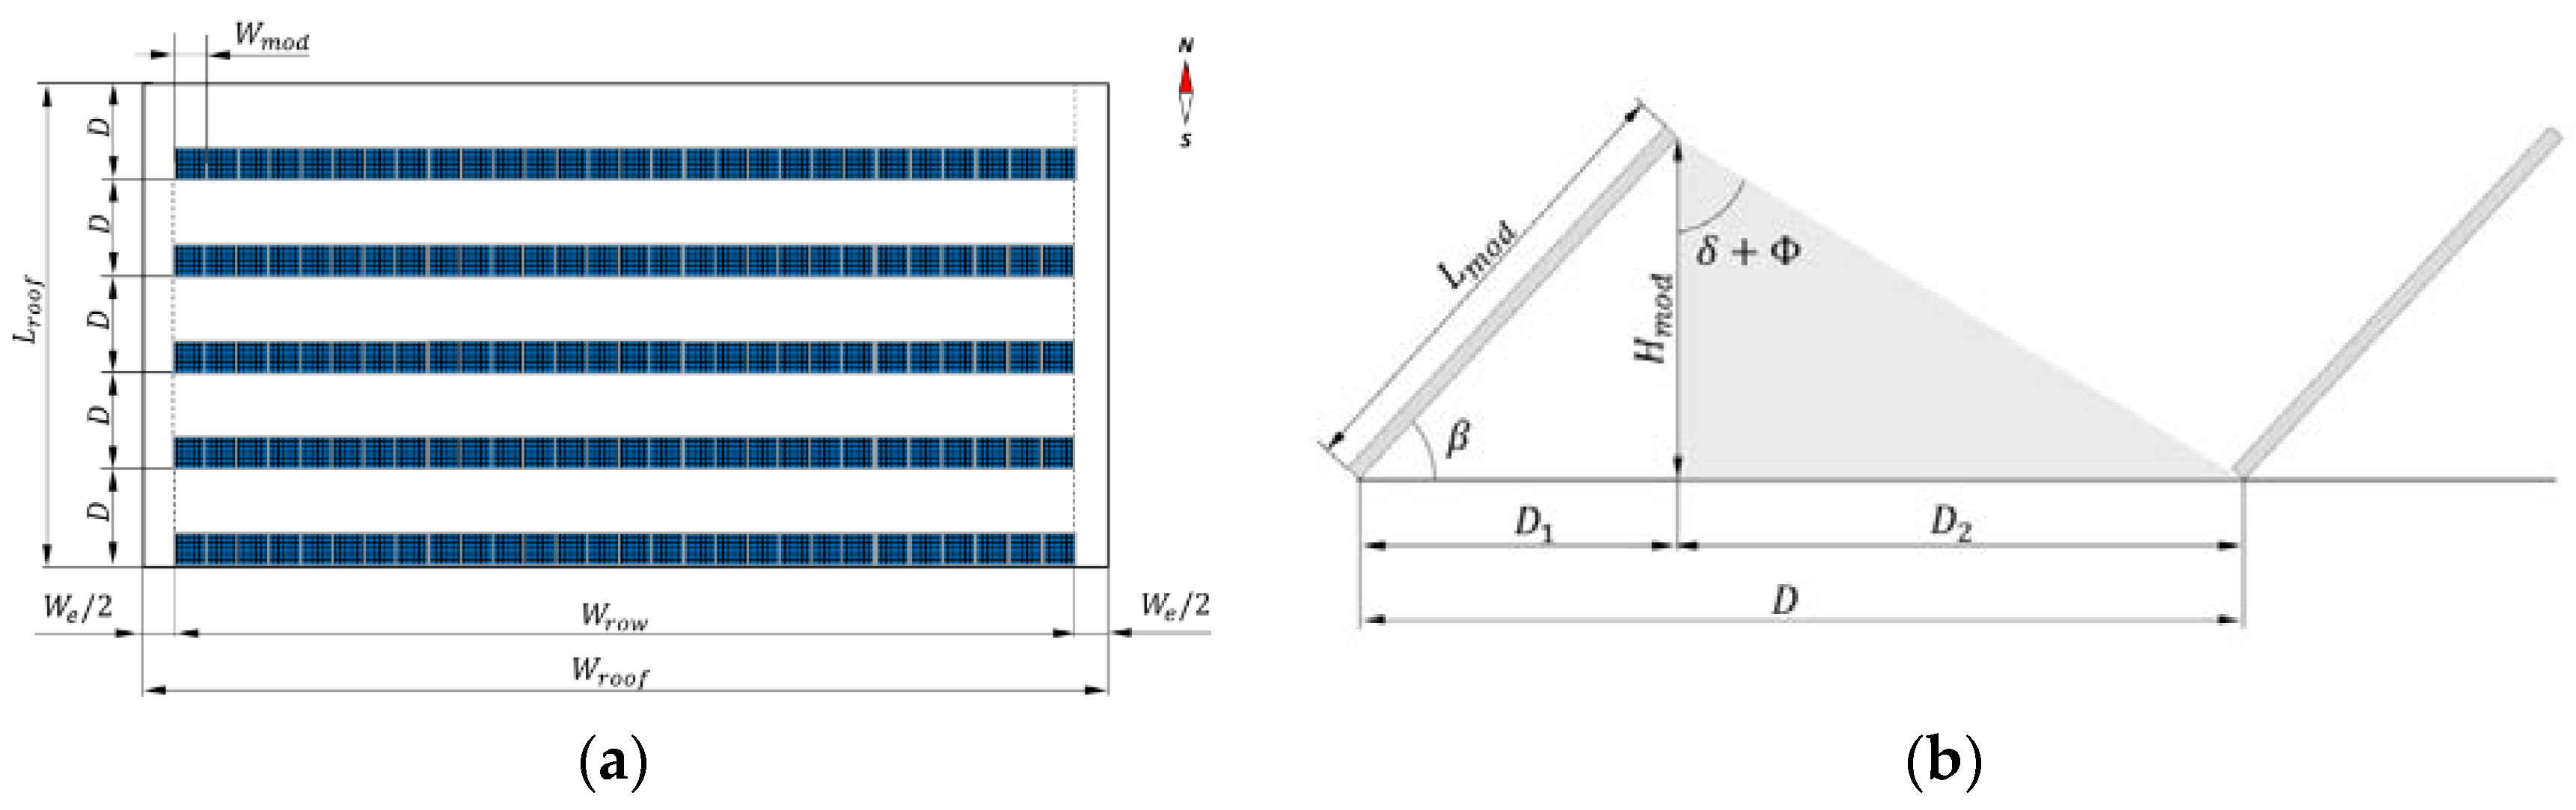
3.2.2. Photovoltaic Field Geometry
3.2.3. Energy Production
4. Results
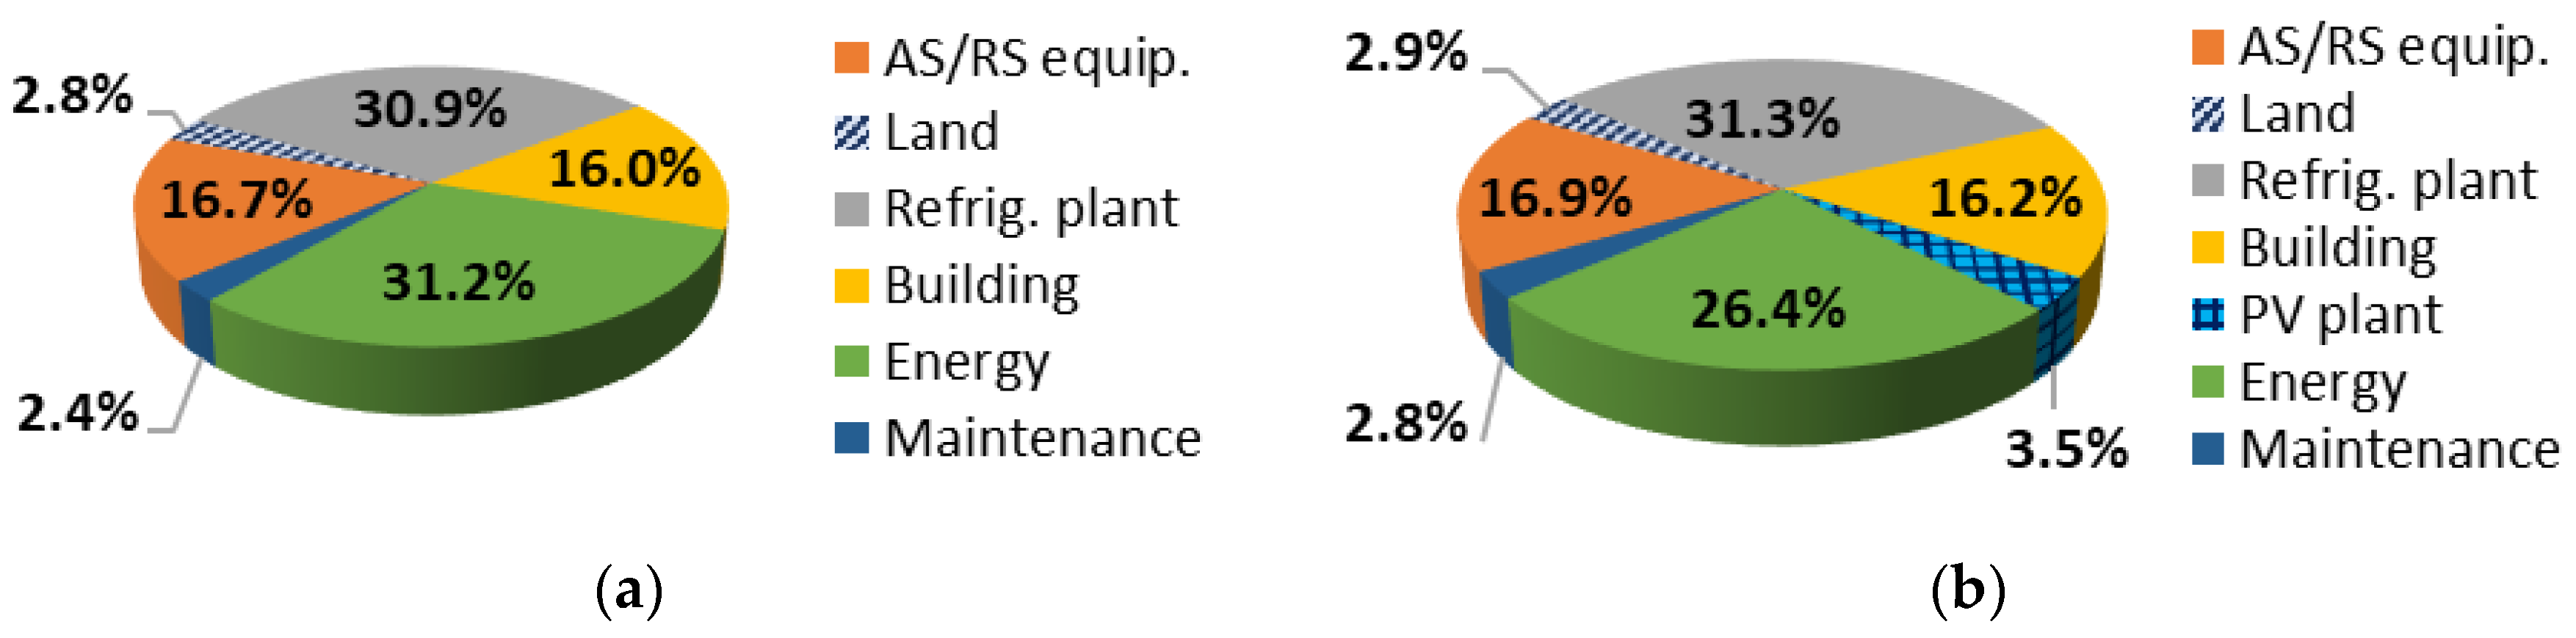
4.1. The Reference Case: Minimising Yearly Total Cost
4.2. The Reference Case: Minimizing Energy Demand from the Electric Grid
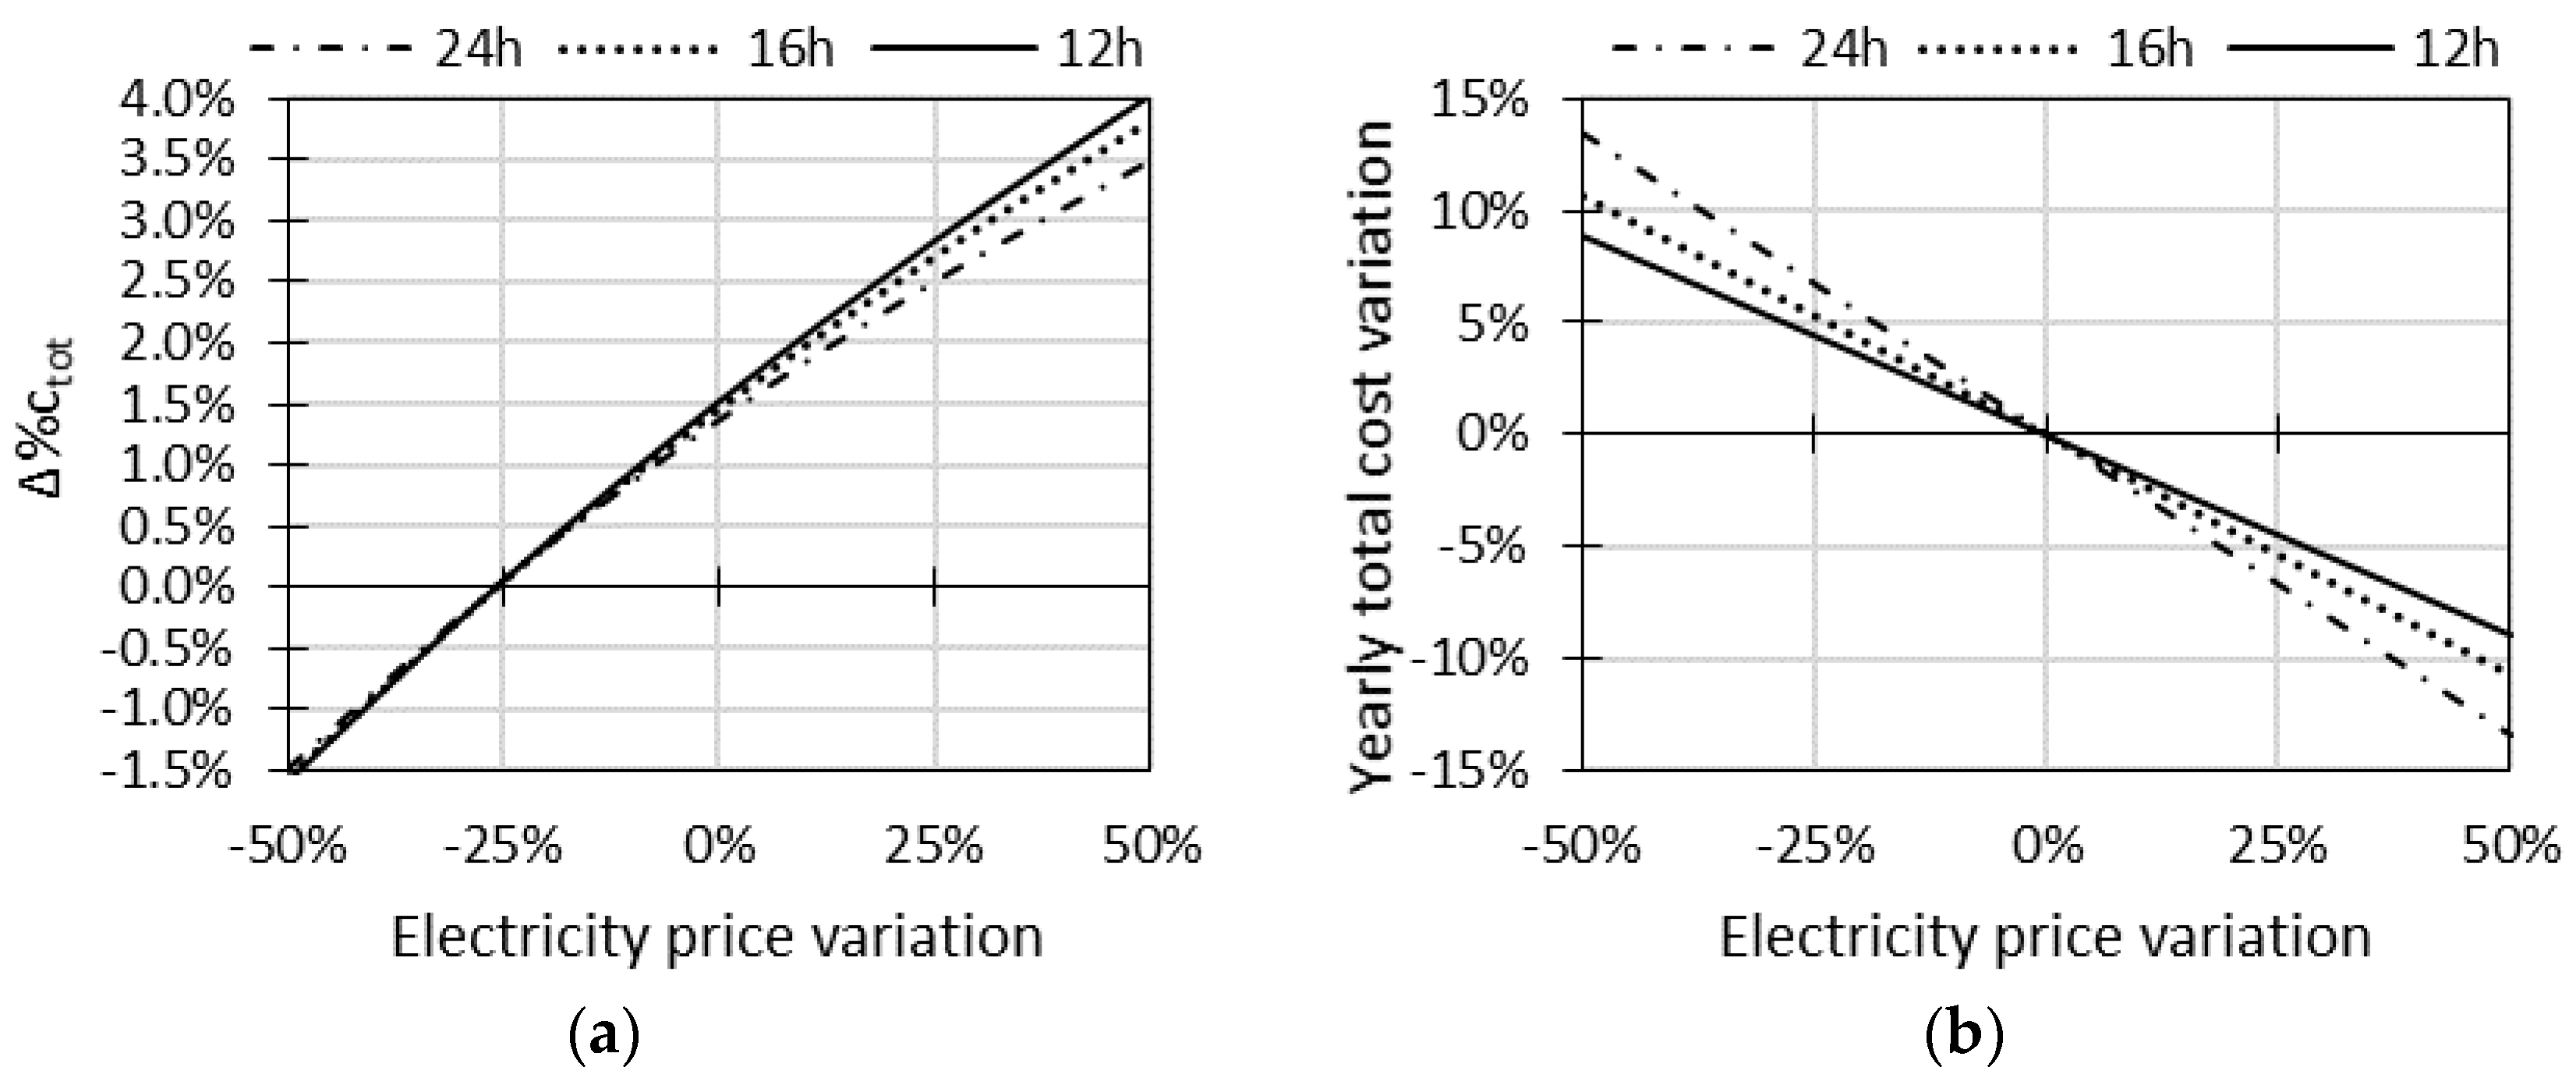
4.3. Sensitivity Analysis on the Reference Case: Energy Price Impact
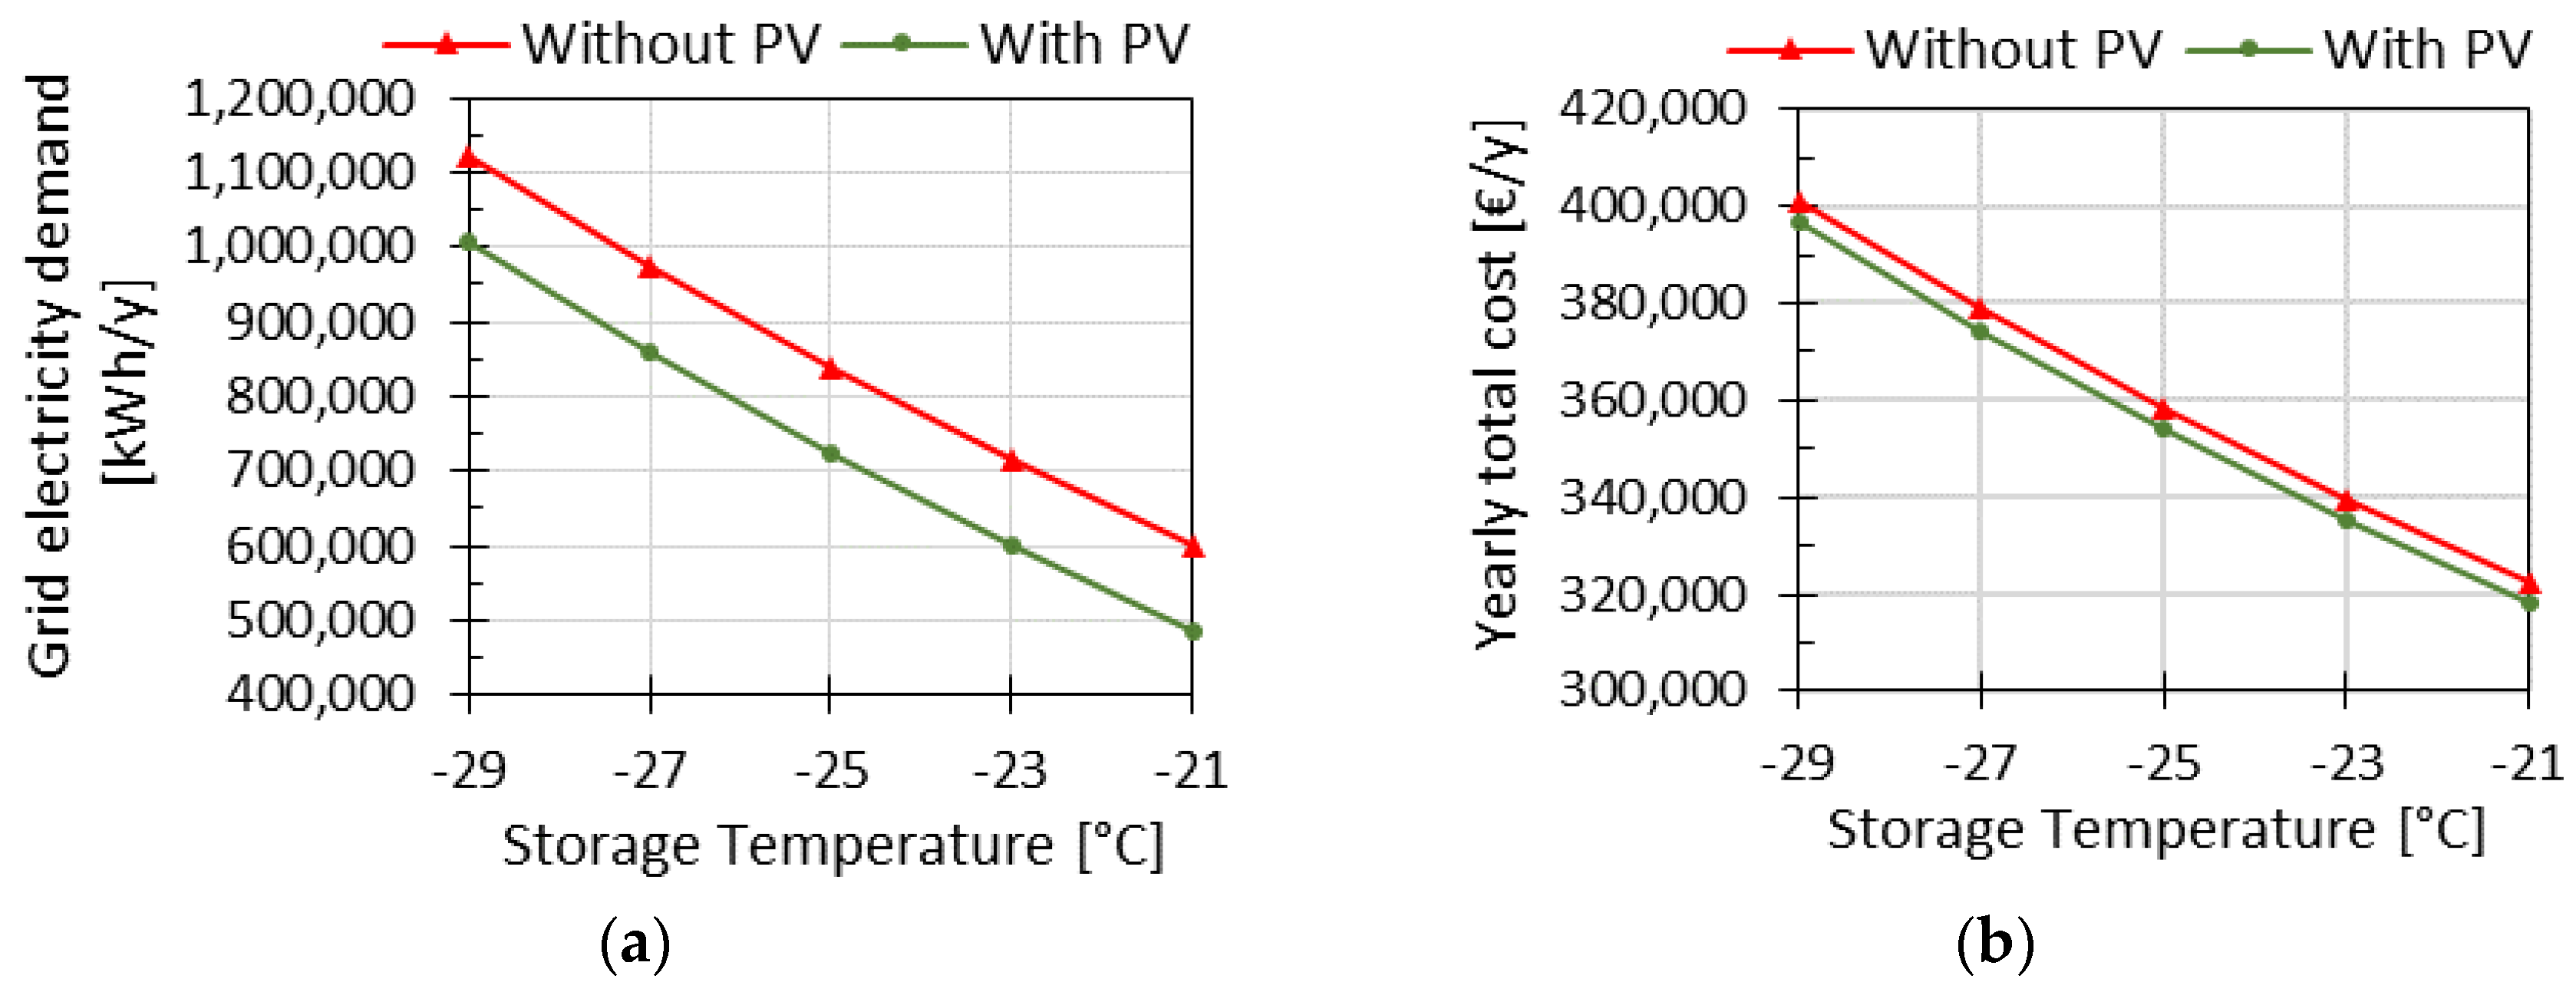
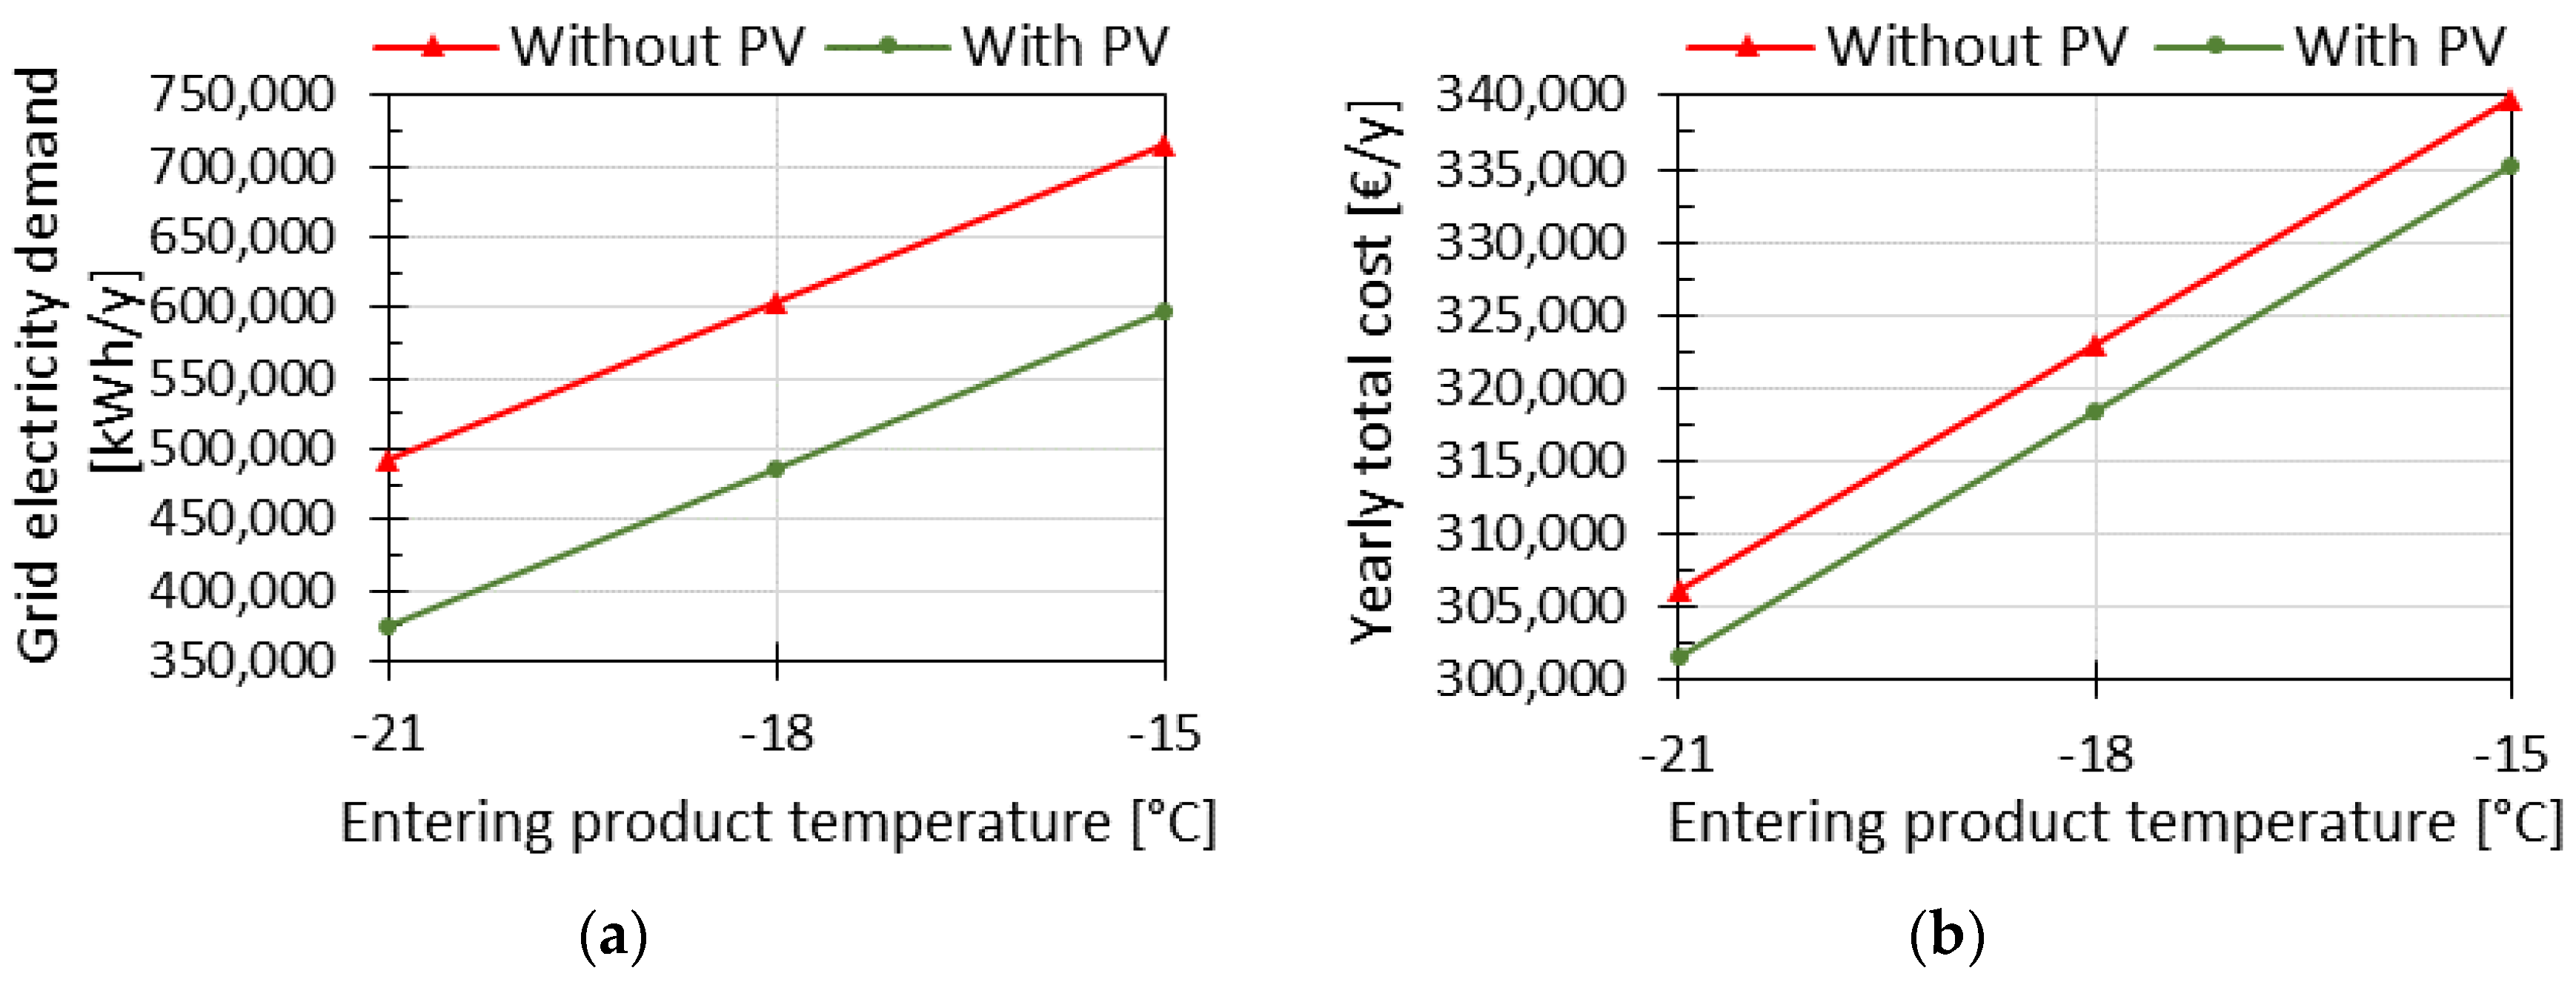
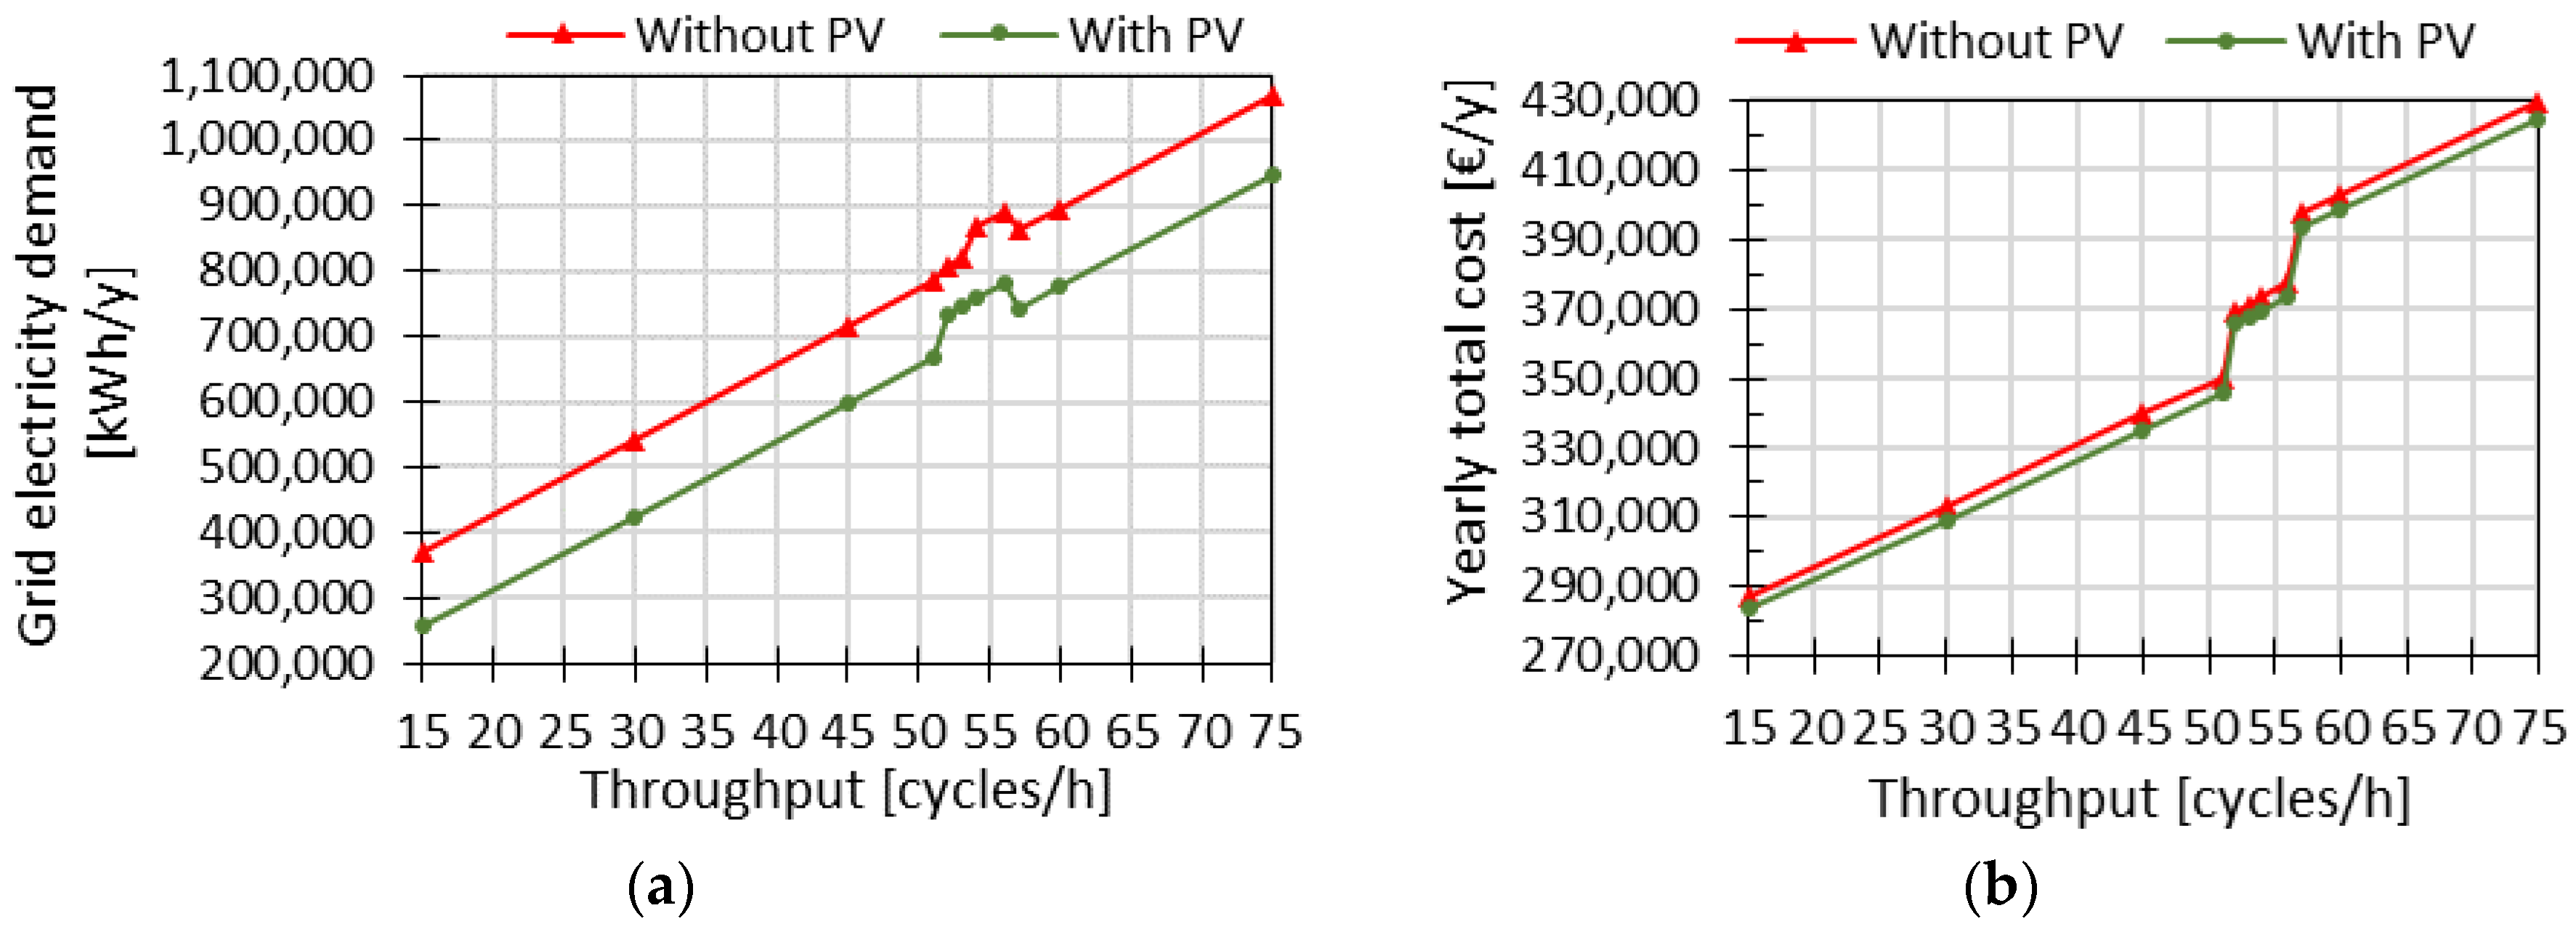
4.4. Sensitivity Analysis and Discussion on Food Supply Chain Decision Variables
5. Conclusions
Author Contributions
Conflicts of Interest
References
- Elkington, J. Cannibals with Forks: The Triple Bottom Line of the 21st Century; New Society Publishers: Stoney Creek, ON, Canada, 1998. [Google Scholar]
- Schirone, L.; Pellitteri, F. Energy Policies and Sustainable Management of Energy Sources. Sustainability 2017, 9, 2321. [Google Scholar] [CrossRef]
- Gielen, D.; Saygin, D.; Wagner, N.; Petrichenko, K.; Tsakiris, A. Synergies Between Renewable Energy and Energy Efficiency; a Working Paper Based on Remap 2030; IRENA: Copenaghen, Denmark, 2015; Volume 1. [Google Scholar]
- Verzijlbergh, R.A.; Lukszo, Z. Conceptual model of a cold storage warehouse with PV generation in a smart grid setting. In Proceedings of the 10th IEEE International Conference on Networking, Sensing and Control, Evry, France, 10–12 April 2013; pp. 889–894. [Google Scholar]
- Marchi, B.; Zanoni, S. Supply Chain Management for Improved Energy Efficiency: Review and Opportunities. Energies 2017, 10, 1618. [Google Scholar] [CrossRef]
- Fikiin, K.; Stankov, B.; Evans, J.; Maidment, G.; Foster, A.; Brown, T.; Radcliffe, J.; Youbi-Idrissi, M.; Alford, A.; Varga, L.; et al. Refrigerated warehouses as intelligent hubs to integrate renewable energy in industrial food refrigeration and to enhance power grid sustainability. Trends Food Sci. Technol. 2017, 60, 96–103. [Google Scholar] [CrossRef]
- James, S.J.; James, C. The food cold-chain and climate change. Food Res. Int. 2010, 43, 1944–1956. [Google Scholar] [CrossRef]
- Monforti-Ferrario, F.; Dallemand, J.-F.; Pascua, I.P.; Motola, V.; Banja, M.; Scarlat, N.; Medarac, H.; Castellazzi, L.; Labanca, N.; Bertoldi, P.; et al. Energy Use in the EU Food Sector: State of Play and Opportunities for Improvement; European Commission: Brussels, Belgium, 2015. [Google Scholar]
- James, S.J.; James, C. Improving energy efficiency within the food cold-chain. In Proceedings of the 11th International Congress on Engineering and Food, Athens, Greece, 22–26 May 2011. [Google Scholar]
- Zhu, Z.; Chu, F.; Dolgui, A.; Chu, C.; Zhou, W.; Piramuthu, S. Recent advances and opportunities in sustainable food supply chain: A model-oriented review. Int. J. Prod. Res. 2018, 1–23. [Google Scholar] [CrossRef]
- MHIA Automated Storage Systems Make a Play for Sustainability. AS/RS Quarterly Report. Available online: http://www.mhia.org/industrygroups/as-rs/news (accessed on 15 January 2018).
- Meneghetti, A.; Monti, L. Greening the food supply chain: An optimisation model for sustainable design of refrigerated automated warehouses. Int. J. Prod. Res. 2015, 53, 6567–6587. [Google Scholar] [CrossRef]
- Zanoni, S.; Zavanella, L. Chilled or frozen? Decision strategies for sustainable food supply chains. Int. J. Prod. Econ. 2012, 140, 731–736. [Google Scholar] [CrossRef]
- Owen, T.; Mark, S. Refrigerated-facility loads. In The 2010 ASHRAE Handbook: Refrigeration; ASHRAE: Atlanta, GA, USA, 2010. [Google Scholar]
- Luthander, R.; Widén, J.; Nilsson, D.; Palm, J. Photovoltaic self-consumption in buildings: A review. Appl. Energy 2015, 142, 80–94. [Google Scholar] [CrossRef]
- Merei, G.; Moshövel, J.; Magnor, D.; Sauer, D.U. Optimization of self-consumption and techno-economic analysis of PV-battery systems in commercial applications. Appl. Energy 2016, 168, 171–178. [Google Scholar] [CrossRef]
- Chiaroni, D.; Chiesa, V.; Franzò, S.; Frattini, F. Evaluating battery energy storage systems: An analysis of their adoption with photovoltaic plants in Italy. In Proceedings of the 2016 IEEE 16th International Conference on Environment and Electrical Engineering (EEEIC), Florence, Italy, 7–10 June 2016. [Google Scholar]
- Beck, T.; Kondziella, H.; Huard, G.; Bruckner, T. Assessing the influence of the temporal resolution of electrical load and PV generation profiles on self-consumption and sizing of PV-battery systems. Appl. Energy 2016, 173, 331–342. [Google Scholar] [CrossRef]
- Khalilpour, R.; Vassallo, A. Planning and operation scheduling of PV-battery systems: A novel methodology. Renew. Sustain. Energy Rev. 2016, 53, 194–208. [Google Scholar] [CrossRef]
- Khalilpour, K.R.; Vassallo, A. Technoeconomic parametric analysis of PV-battery systems. Renew. Energy 2016, 97, 757–768. [Google Scholar] [CrossRef]
- Marchi, B.; Zanoni, S.; Pasetti, M. A techno-economic analysis of Li-ion battery energy storage systems in support of PV distributed generation. In Proceedings of the 21st Summer School Francesco Turco, Naples, Italy, 13–15 September 2016; AIDI—Italian Association of Industrial Operations Professors: Naples, Italy, 2016. [Google Scholar]
- Nagaraju, J.; Vikash, K.; Krishna Murthy, M.V. Photovoltaic-powered cold store and its performance. Int. J. Energy Res. 2001, 25, 389–396. [Google Scholar] [CrossRef]
- Rossi, F.; Van Beek, P.; Walsh, T. Handbook of Constraint Programming; Elsevier Science: New York, NY, USA, 2006; ISBN 0444527265. [Google Scholar]
- Van Hentenryck, P.; Laurent, M. Constraint-Based Local Search; MIT Press: Cambridge, MA, USA, 2005. [Google Scholar]
- Meneghetti, A.; Borgo, E.D.; Monti, L. Decision support optimisation models for design of sustainable automated warehouses. Int. J. Shipp. Transp. Logist. 2015, 7, 266. [Google Scholar] [CrossRef]
- Meneghetti, A.; Nardin, G. Enabling industrial symbiosis by a facilities management optimization approach. J. Clean. Prod. 2012, 35, 263–273. [Google Scholar] [CrossRef]
- Seuring, S. A review of modeling approaches for sustainable supply chain management. Decis. Support Syst. 2013, 54, 1513–1520. [Google Scholar] [CrossRef]
- Tassou, S.A.; Lewis, J.S.; Ge, Y.T.; Hadawey, A.; Chaer, I. A review of emerging technologies for food refrigeration applications. Appl. Therm. Eng. 2010, 30, 263–276. [Google Scholar] [CrossRef]
- Meneghetti, A.; Monti, L. Sustainable storage assignment and dwell-point policies for automated storage and retrieval systems. Prod. Plan. Control 2013, 24, 511–520. [Google Scholar] [CrossRef]
- Meneghetti, A.; Monti, L. Multiple-weight unit load storage assignment strategies for energy-efficient automated warehouses. Int. J. Logist. Res. Appl. 2014, 17, 304–322. [Google Scholar] [CrossRef]
- Hwang, H.; Lee, S.B. Travel-time models considering the operating characteristics of the storage and retrieval machine. Int. J. Prod. Res. 1990, 28, 1779–1789. [Google Scholar] [CrossRef]
- Meneghetti, A.; Dal Borgo, E.; Monti, L. Rack shape and energy efficient operations in automated storage and retrieval systems. Int. J. Prod. Res. 2015, 53, 7090–7103. [Google Scholar] [CrossRef]
- European Commission Photovoltaic Geographical Information System. Available online: http://re.jrc.ec.europa.eu/pvg_tools/en/tools.html (accessed on 18 January 2018).
- Huld, T.; Amillo, A. Estimating PV Module Performance over Large Geographical Regions: The Role of Irradiance, Air Temperature, Wind Speed and Solar Spectrum. Energies 2015, 8, 5159–5181. [Google Scholar] [CrossRef]
- Faiman, D. Assessing the outdoor operating temperature of photovoltaic modules. Prog. Photovolt. Res. Appl. 2008, 16, 307–315. [Google Scholar] [CrossRef]
- Koehl, M.; Heck, M.; Wiesmeier, S.; Wirth, J. Modeling of the nominal operating cell temperature based on outdoor weathering. Sol. Energy Mater. Sol. Cells 2011, 95, 1638–1646. [Google Scholar] [CrossRef]
- Huld, T.; Friesen, G.; Skoczek, A.; Kenny, R.P.; Sample, T.; Field, M.; Dunlop, E.D. A power-rating model for crystalline silicon PV modules. Sol. Energy Mater. Sol. Cells 2011, 95, 3359–3369. [Google Scholar] [CrossRef]
- Fu, R.; Feldman, D.J.; Margolis, R.M.; Woodhouse, M.A.; Ardani, K.B. U.S. Solar Photovoltaic System Cost Benchmark: Q1 2017; National Renewable Energy Laboratory: Golden, CO, USA, 2017. [Google Scholar]
- Eurostat Electricity Price Statistics. Available online: http://ec.europa.eu/eurostat/statistics-explained/index.php/Electricity_price_statistics (accessed on 10 February 2018).
- Moro, A.; Lonza, L. Electricity carbon intensity in European Member States: Impacts on GHG emissions of electric vehicles. Transp. Res. Part D Transp. Environ. 2017. [Google Scholar] [CrossRef]
- Singapore’s Energy Market Authority Electricity Grid Emissions Factors and Upstream Fugitive Methane Emission Factor. Available online: https://www.ema.gov.sg/cmsmedia/Publications_and_Statistics/Statistics/18RSU.pdf (accessed on 14 February 2018).
- Singapore’s Energy Market Authority Electricity Tariffs—Industrial Consumers. Available online: Ttps://www.ema.gov.sg/Non_Residential_Programmes_Electricity_Tariffs.aspx (accessed on 14 February 2018).


| Coefficient | Value |
|---|---|
| −0.017237 | |
| −0.040465 | |
| −0.004702 | |
| 0.000149 | |
| 0.000170 | |
| 0.000005 |
| Investment cost [€/kW] | 1658 | |
| Yearly O&M expenses [€/kW] | 12.75 |
| Warehouse Configuration and Performance | Without PV | With PV |
|---|---|---|
| Columns | 25 | 25 |
| Levels | 6 | 6 |
| Lane depth | 16 | 16 |
| Aisle | 1 | 1 |
| Yearly total cost [€/y] | 339,258 | 334,727 |
| Grid electricity demand [kWh/y] | 712,776 | 595,536 |
| Warehouse Configuration and Performance | Without PV | With PV |
|---|---|---|
| Columns | 15 | 15 |
| Levels | 10 | 5 |
| Lane depth | 16 | 16 |
| Aisle | 1 | 2 |
| Yearly total cost [€/y] | 344,725 | 385,725 |
| Grid electricity demand [kWh/y] | 670,132 | 582,580 |
| Warehouse Configuration | Warehouse Features | System Throughput [Cycles/h] | ||||||||||
|---|---|---|---|---|---|---|---|---|---|---|---|---|
| 15 | 30 | 45 | 51 | 52 | 53 | 54 | 56 | 57 | 60 | 75 | ||
| Without PV | Columns | 25 | 25 | 25 | 25 | 30 | 30 | 43 | 43 | 25 | 25 | 25 |
| Levels | 6 | 6 | 6 | 6 | 10 | 10 | 7 | 7 | 6 | 6 | 6 | |
| Depth | 16 | 16 | 16 | 16 | 8 | 8 | 8 | 8 | 8 | 8 | 8 | |
| Aisle | 1 | 1 | 1 | 1 | 1 | 1 | 1 | 1 | 2 | 2 | 2 | |
| With PV | Columns | 25 | 25 | 25 | 25 | 43 | 43 | 43 | 43 | 25 | 25 | 25 |
| Levels | 6 | 6 | 6 | 6 | 7 | 7 | 7 | 7 | 6 | 6 | 6 | |
| Depth | 16 | 16 | 16 | 16 | 8 | 8 | 8 | 8 | 8 | 8 | 8 | |
| Aisle | 1 | 1 | 1 | 1 | 1 | 1 | 1 | 1 | 2 | 2 | 2 | |
| PV Modules | 352 | 352 | 352 | 324 | 324 | 324 | 324 | 324 | 363 | 363 | 363 | |
| Location | Climate Type | Latitude | Carbon Intensity [gCO2/kWh] | Ground Temp. [°C] | Electricity Price [€/kWh] |
|---|---|---|---|---|---|
| Pordenone (Italy) | Oceanic | 45.90° | 431 | 13.1 | 0.148 |
| Siracusa (Italy) | Mediterranean | 37.06° | 431 | 18.7 | 0.148 |
| Singapore (Singapore) | Tropical rainforest | 01.27° | 398 | 27.5 | 0.132 |
| Hamburg (Germany) | Oceanic | 53.58° | 615 | 9.6 | 0.152 |
| Helsinki (Finland) | Humid continental | 60.17° | 211 | 6.3 | 0.067 |
© 2018 by the authors. Licensee MDPI, Basel, Switzerland. This article is an open access article distributed under the terms and conditions of the Creative Commons Attribution (CC BY) license (http://creativecommons.org/licenses/by/4.0/).
Share and Cite
Meneghetti, A.; Dal Magro, F.; Simeoni, P. Fostering Renewables into the Cold Chain: How Photovoltaics Affect Design and Performance of Refrigerated Automated Warehouses. Energies 2018, 11, 1029. https://doi.org/10.3390/en11051029
Meneghetti A, Dal Magro F, Simeoni P. Fostering Renewables into the Cold Chain: How Photovoltaics Affect Design and Performance of Refrigerated Automated Warehouses. Energies. 2018; 11(5):1029. https://doi.org/10.3390/en11051029
Chicago/Turabian StyleMeneghetti, Antonella, Fabio Dal Magro, and Patrizia Simeoni. 2018. "Fostering Renewables into the Cold Chain: How Photovoltaics Affect Design and Performance of Refrigerated Automated Warehouses" Energies 11, no. 5: 1029. https://doi.org/10.3390/en11051029
APA StyleMeneghetti, A., Dal Magro, F., & Simeoni, P. (2018). Fostering Renewables into the Cold Chain: How Photovoltaics Affect Design and Performance of Refrigerated Automated Warehouses. Energies, 11(5), 1029. https://doi.org/10.3390/en11051029