1. Introduction
The development of zero-emissions public transport vehicles is one of the EU’s horizontal policies. The total amount of urban transport CO
2 emissions generated by road traffic in Europe currently accounts for 40% [
1]. The transport sector is responsible for 30% of total energy consumption and 27% of greenhouse gas emissions. Among all sectors that emit CO
2, the transport sector is the fastest growing one, second only to the industrial sector [
2]. Therefore, by 2050, greenhouse gas emissions will have to be reduced by 60%. In addition, the instability of liquid fuel prices has a strongly negative effect on the economy [
3]. It thus becomes imperative to raise the level of usability of alternative energy sources in public transport [
4]. Solar energy is one of the most promising renewable energy sources for urban transport.
Several renewable energy sources like solar energy (PV) or wind can be used to generate electricity. Their applications are numerous. Most of these sources are focused on supply of the building facilities for PV panels or producing energy for energy systems. Public municipal transport systems (trams, trolleybuses) are also important consumers of electricity. Among their characteristics there are the unevenness of the movement, and consequently, the unevenness of the load on the energy system. This creates difficult conditions for the cooperation of renewable energy sources with the traction power supply. However, in many cases in urban areas it is possible to build photovoltaic systems on the roofs of buildings. The energy produced by photovoltaic panel can be used to power transport systems. The use of photovoltaic energy for public transport purposes becomes a feasible option in case when energy sales to the energy system are not viable or are problematic. In many situations, using energy for one’s own needs is more profitable than selling it.
Previous studies of other authors point to several factors that make it difficult to use solar energy in some applications [
5,
6,
7,
8,
9,
10,
11,
12]. Moreover, systems based on renewable sources can be very useful in industrial systems and in the charging of electric vehicles [
12]. These studies have shown that the use of renewable energy sources reduces economic costs and environmental impact. However, a very few studies deal with the use of energy for urban electric traction. Tram, trolleybus and light rail systems, being in the peak of its wide popularization, can become the major consumers of renewable energy.
Many simulations and optimizations of off-grid hybrid systems (usually photovoltaic panels, turbines and combustion chambers) have been simulated and optimized with energy storage (mainly batteries). Typically, optimization is considered to minimize levelised cost of energy, but in some cases two or more optimization variables are included [
13].
In earliest studies, optimization was considered to be deterministic. Randomization of input data was not taken into consideration. Nevertheless, some studies have used a stochastic approach to system optimization, taking into account uncertainty of the work of renewable energy sources. For example, Kamjoo et al. [
14] showed the method based on risk-limited chance-constrained programming (CCP) used to optimize the PV battery system, including the uncertainty system of renewable sources, using the Monte Carlo simulation. Arun et al. [
15] have optimized the PV battery system using Monte Carlo simulations, taking into account the uncertainty associated with variable solar irradiation. In comparison to Monte Carlo simulation results, Kamjoo et al. use genetic algorithms to achieve objective optimization of wind power systems with chance-constrained programming (CCP) uncertainty. Maheri, in [
16], evaluated the reliability of various PV systems based on a deterministic project, taking into account two criteria: cost and reliability. In [
17] the same author proposed two algorithms (using Monte Carlo simulations) to obtain an optimal margin of safety.
The crucial aspect of the traction power supply is the load variability. This creates hindered conditions for simulating the use of PV power, as it becomes necessary to take into consideration the variable nature of the PV power generation and the variable nature of the load. Due to this reason, not the deterministic approach, but statistical methods should be applied. In the present paper, a new study method for the optimisation of traction supply system with PV panels is shown. For the consideration of the uncertainties in the traction load the study method includes a probabilistic optimisation by means of Monte Carlo simulation. It allows stochastic optimisation of complex hybrid traction supply system with a high level of accuracy in the model of the system.
This study method is applied for the analysis of PV system connected to traction trolleybus supply system. The trolleybus network in Gdynia (Poland) was analyzed in order to present the benefits of the applied method. The two different PV systems were taken into account in the analysis:
- (1)
Big one, with a 5000 m2 PV panel area. This corresponds to the roof surface of the trolleybus depot. The maximal peak power available from such PV system is 400 kWp.
- (2)
Small one, with a 500 m2 PV panel area. This corresponds to the roof surface of the public building.
The first case corresponds to buildings with large roof surfaces. The second one can be applicable more widely, in the case of buildings like schools or public administration buildings. In many situations such objects are not able to consume all energy generated in a PV system. Due to this reason, connecting to the trolleybus network and returning of the surplus energy is justified.
It is necessary to consider the consumption requirements in different topology of supply system. The structure of traction network and characteristic of traffic influence the load of traction network. Consequently, it affects the possibility of generated energy consumption. In case of large supply area of substation or/and the high density of traffic, it is significant for the electric load to create a good condition for PV energy absorption. That way the three case studies were analysed:
- (1)
Connection of the PV system to a substation with a large supply area
- (2)
Connection of the PV system to a substation with a small supply area
- (3)
Connection of the PV system to the weak point of a supply system (ending of the supply section, far away from substation).
These three case studies correspond to different possible structures of the supply system. The bases of trolleybus traction supply systems and their cooperation with photovoltaic systems in the analysed case studies are presented in
Section 2.
Section 3 presents the simulation model based on the Monte Carlo method. The results of simulations along with the corresponding discussion are shown in
Section 4. The findings can be found in
Section 5 2. The Photovoltaic System in Urban Transport Energy System
The electrified means of public transport are supplied from the public power grid, however, the development of alternative energy sources makes it possible to use them for the supply of urban transport systems. This allows diversification of power sources and reduction of environmental impact. The potential possibility of such a system will be presented on the example of a trolleybus network in Gdynia.
2.1. Trolleybus Power Supply System
Trolleybuses are electric road vehicles powered by an overhead, dual-pole DC traction network. The traction network is divided into power supply sections. The individual sections are powered by power wires (so-called feeders) from a traction substation (TS). The transformation of AC to DC occurs in the traction substation. Voltage is decreased, substations are usually powered by power grids with a voltage at the level between 6 and 35 kV. The nominal voltage of DC amounts to 600 V or 725 V. Due to voltage drop, the nominal output voltage is 10% higher than the input voltage of the vehicle, i.e., 660 V or 825 V [
18].
The feature of the traction power supply system is the load variability, both on a long-term and short-term scale. On the long-term scale, it results from the varying frequency of transport routes at different times of the day, as well as at particular times of the week or year. During the day, there are two traffic peaks: morning and afternoon. On a weekly basis, traffic loads are generally higher on working days and lower at the weekend. Annually, it is possible to make more use of public transport during the school year than during holidays. However, there may be exceptions to these rules. The trend for the difference between rush hours and the rest of the day is now noticeable. In addition, in tourist cities (i.e., coastal cities), the demand for public transport can be high also during holidays. The impact of weather conditions on energy consumption is significant, and at low temperatures, energy consumption for heating purposes may even exceed the demand for traction. That is why in the wintertime there is a noticeable increase in energy consumption. Currently, the increase in energy consumption is also visible in the summer because of the increasingly used air conditioning equipment. On the short-term scale, load variability is related to the occurrence of traffic congestion. It is particularly visible in the case of trolleybus transport, which is sensitive to traffic disruption. Momentary congestion and other impediments may, for example, cause moments of complete absence of energy (all vehicles are standing simultaneously) and increased energy intake caused by starting of groups of vehicles. As a result, the load of the electrification power supply system is of random character. This creates specific conditions for cooperation with a photovoltaic supply system, whose energy generation is also of a random nature.
2.2. Photovoltaic and Traction Power Supply System’s Cooperation
Solar energy can become one of the sources of the electrified transport system. The variability of the load, especially on a short-term scale, however, limits the possibility of full use of the energy generated by the photovoltaic system. At times of low load, the generated energy will remain unused. The nature of the electrification power supply system depends to a great extent on the traffic conditions and the topology of the power supply system. More traffic intensity is associated with greater, and above all, more regular consumption of energy [
19]. Analogously, increasing the size of the area supplied by the substation means an increase in the number of powered vehicles. This results in more vehicles, i.e., potential energy consumers, and more regular load of the substation.
The classic power supply system of the traction network is characterized by unilateral power supply and lack of energy storage. In the case of direct connection of the photovoltaic system to the traction substation, in order to fully utilize the generated energy, apart from the energy transmission losses, the power P
TS of the traction substation load must be greater than the P
PV output generated by the photovoltaic system. This can be expressed by the relation:
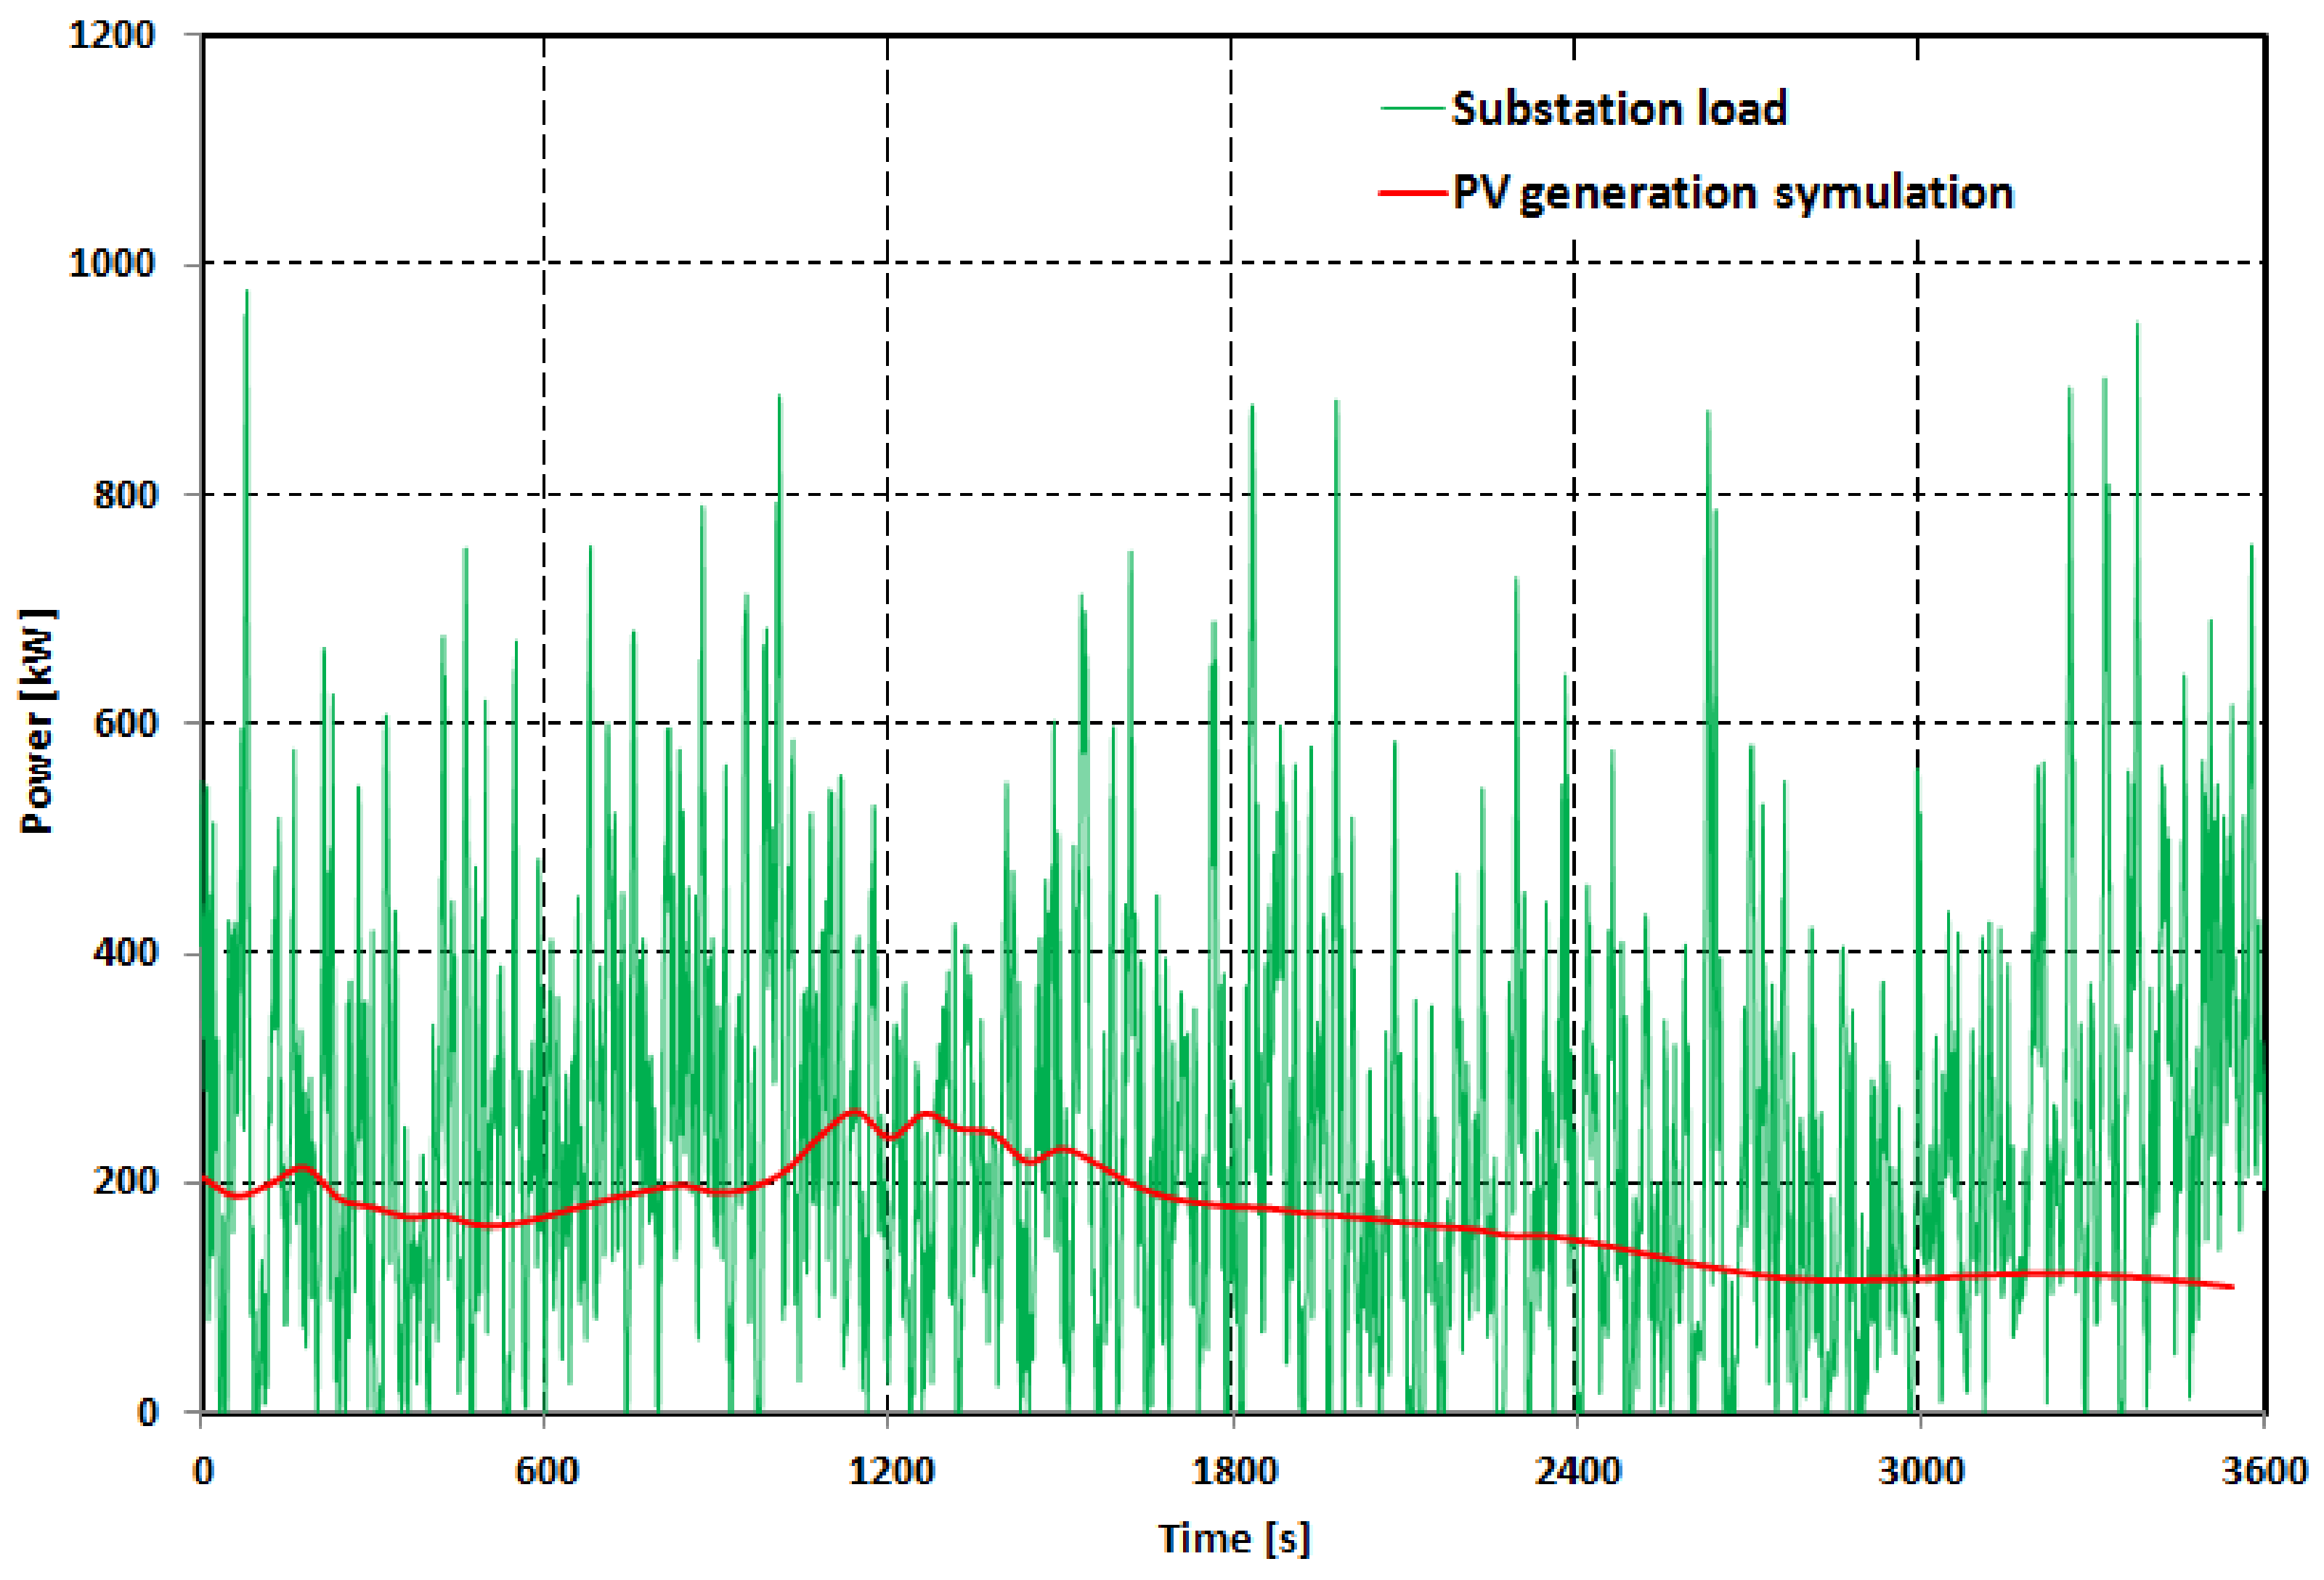
Figure 1 shows the load of the traction substation on an hourly scale and exemplary energy generation profile for a 500 kW photovoltaic system.
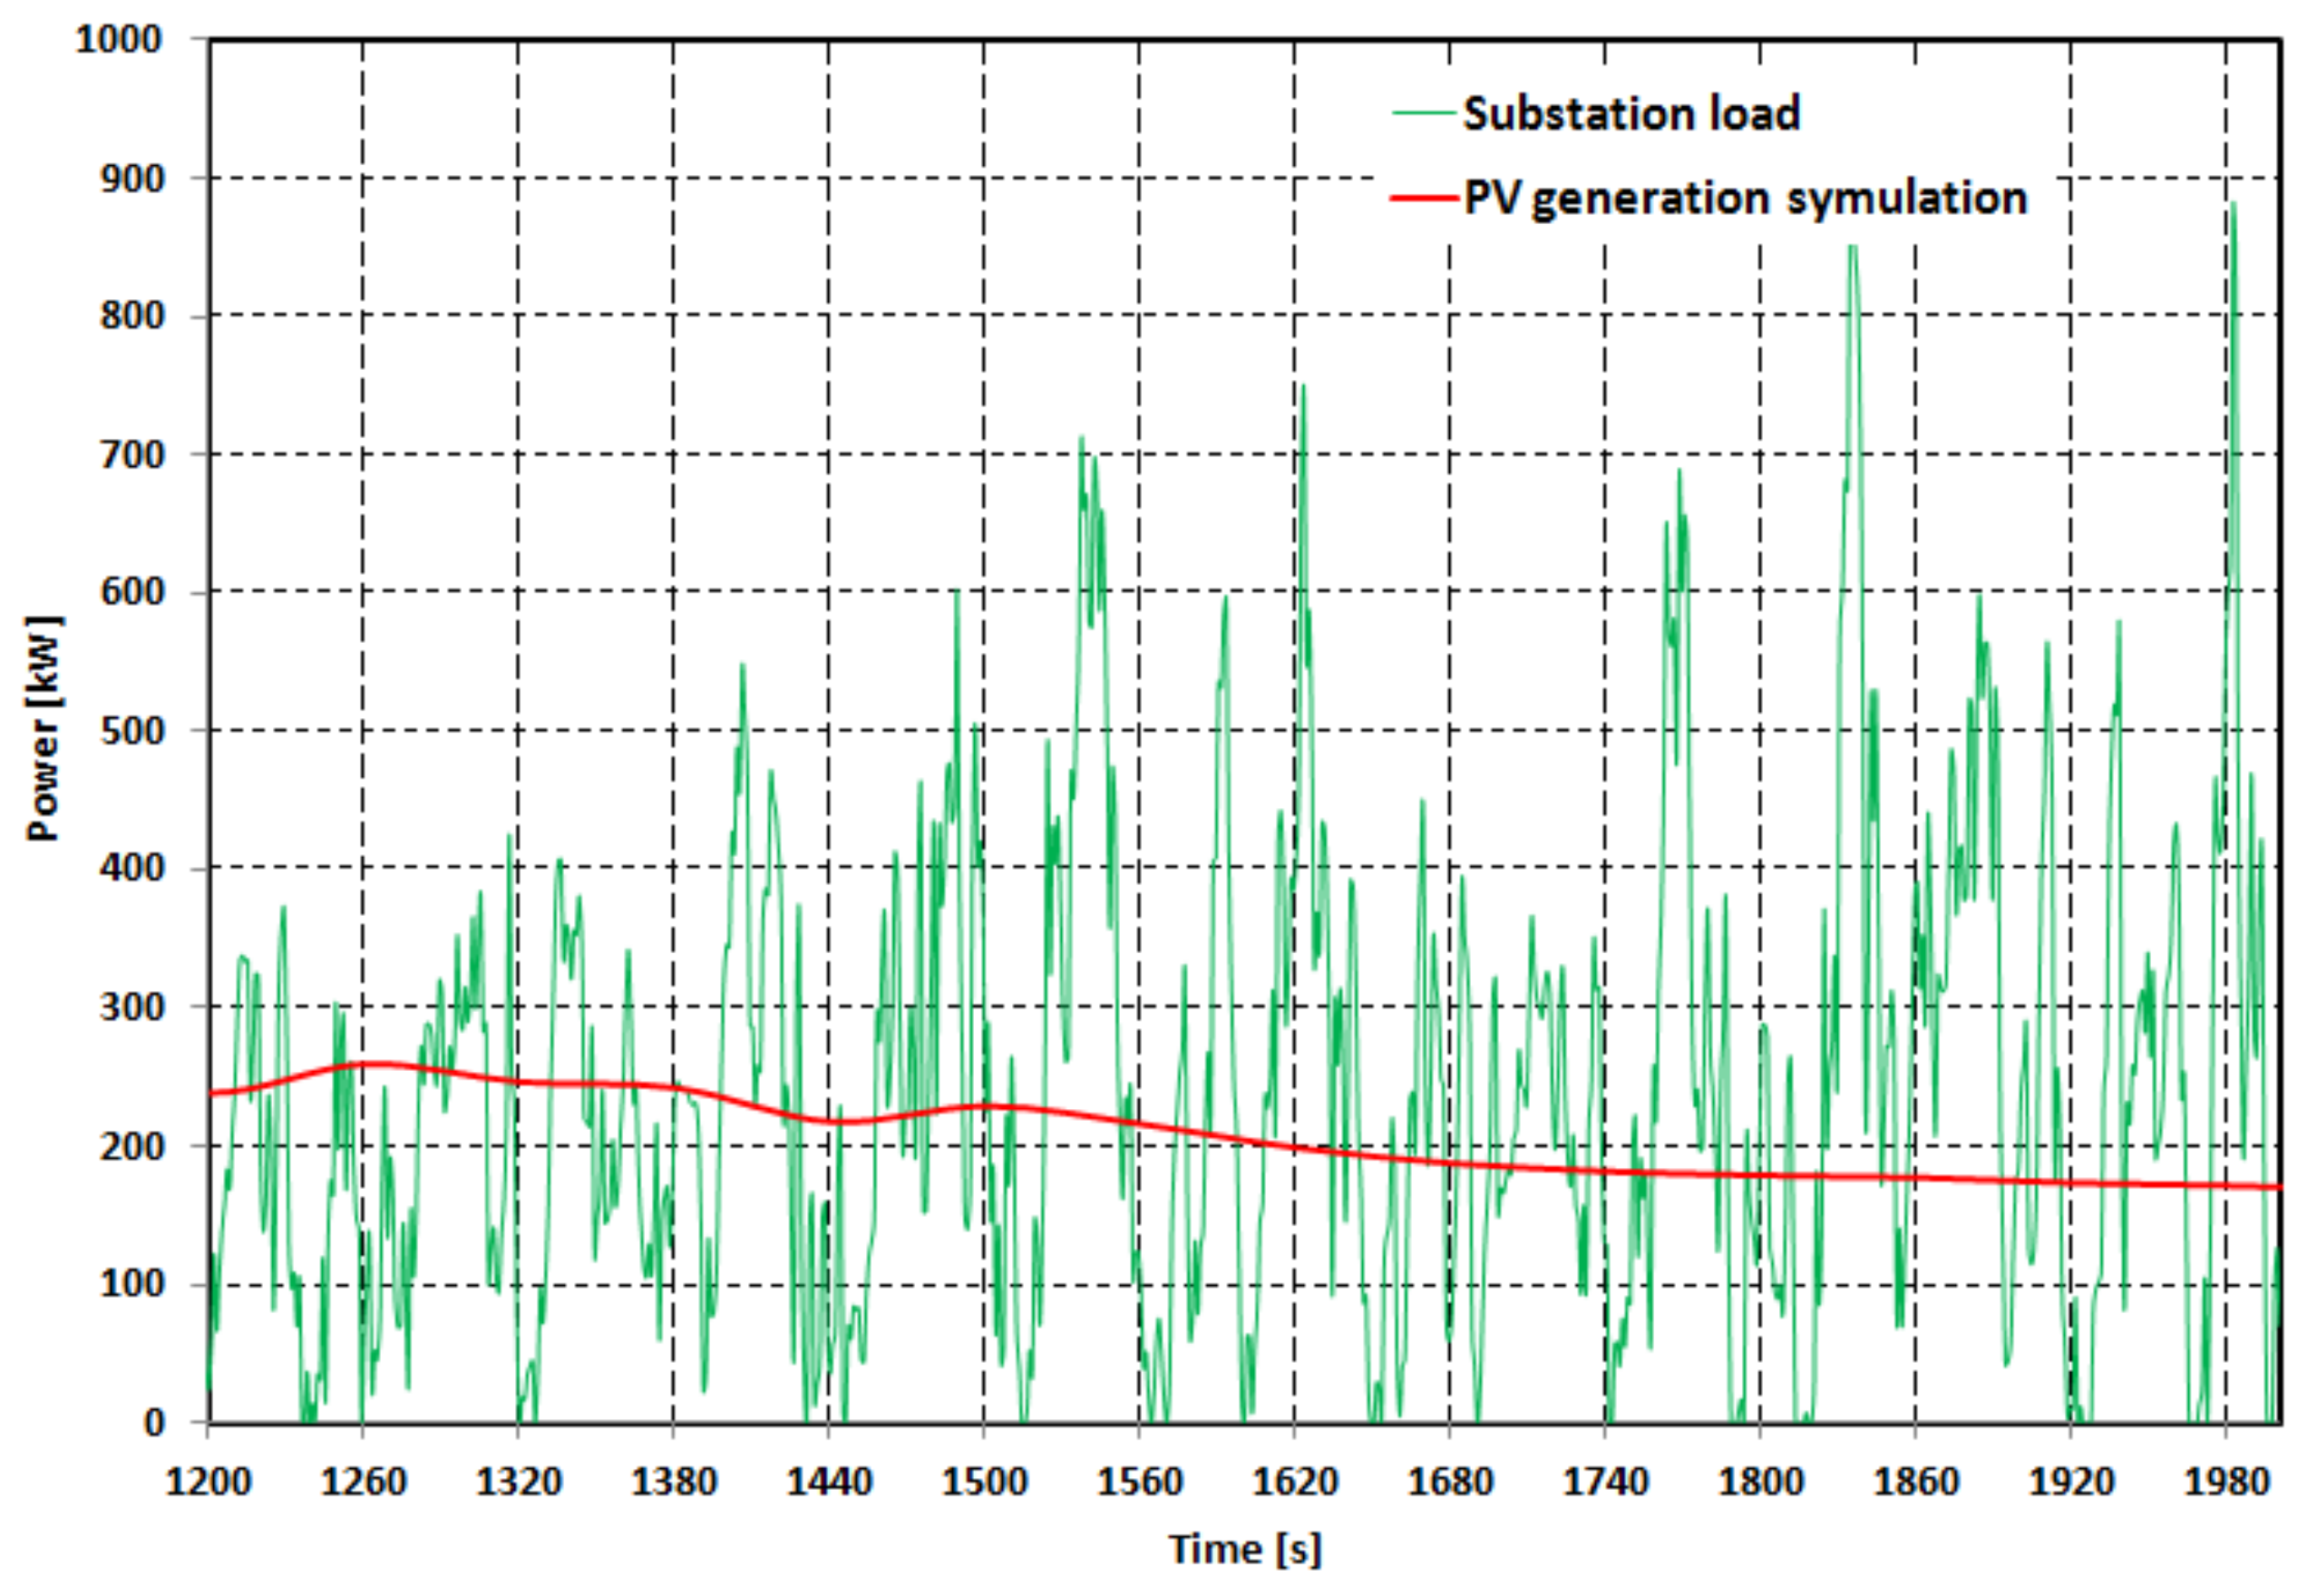
Figure 2 shows a detailed section of this chart. To illustrate the influence of traffic intensity on the load of the power supply system,
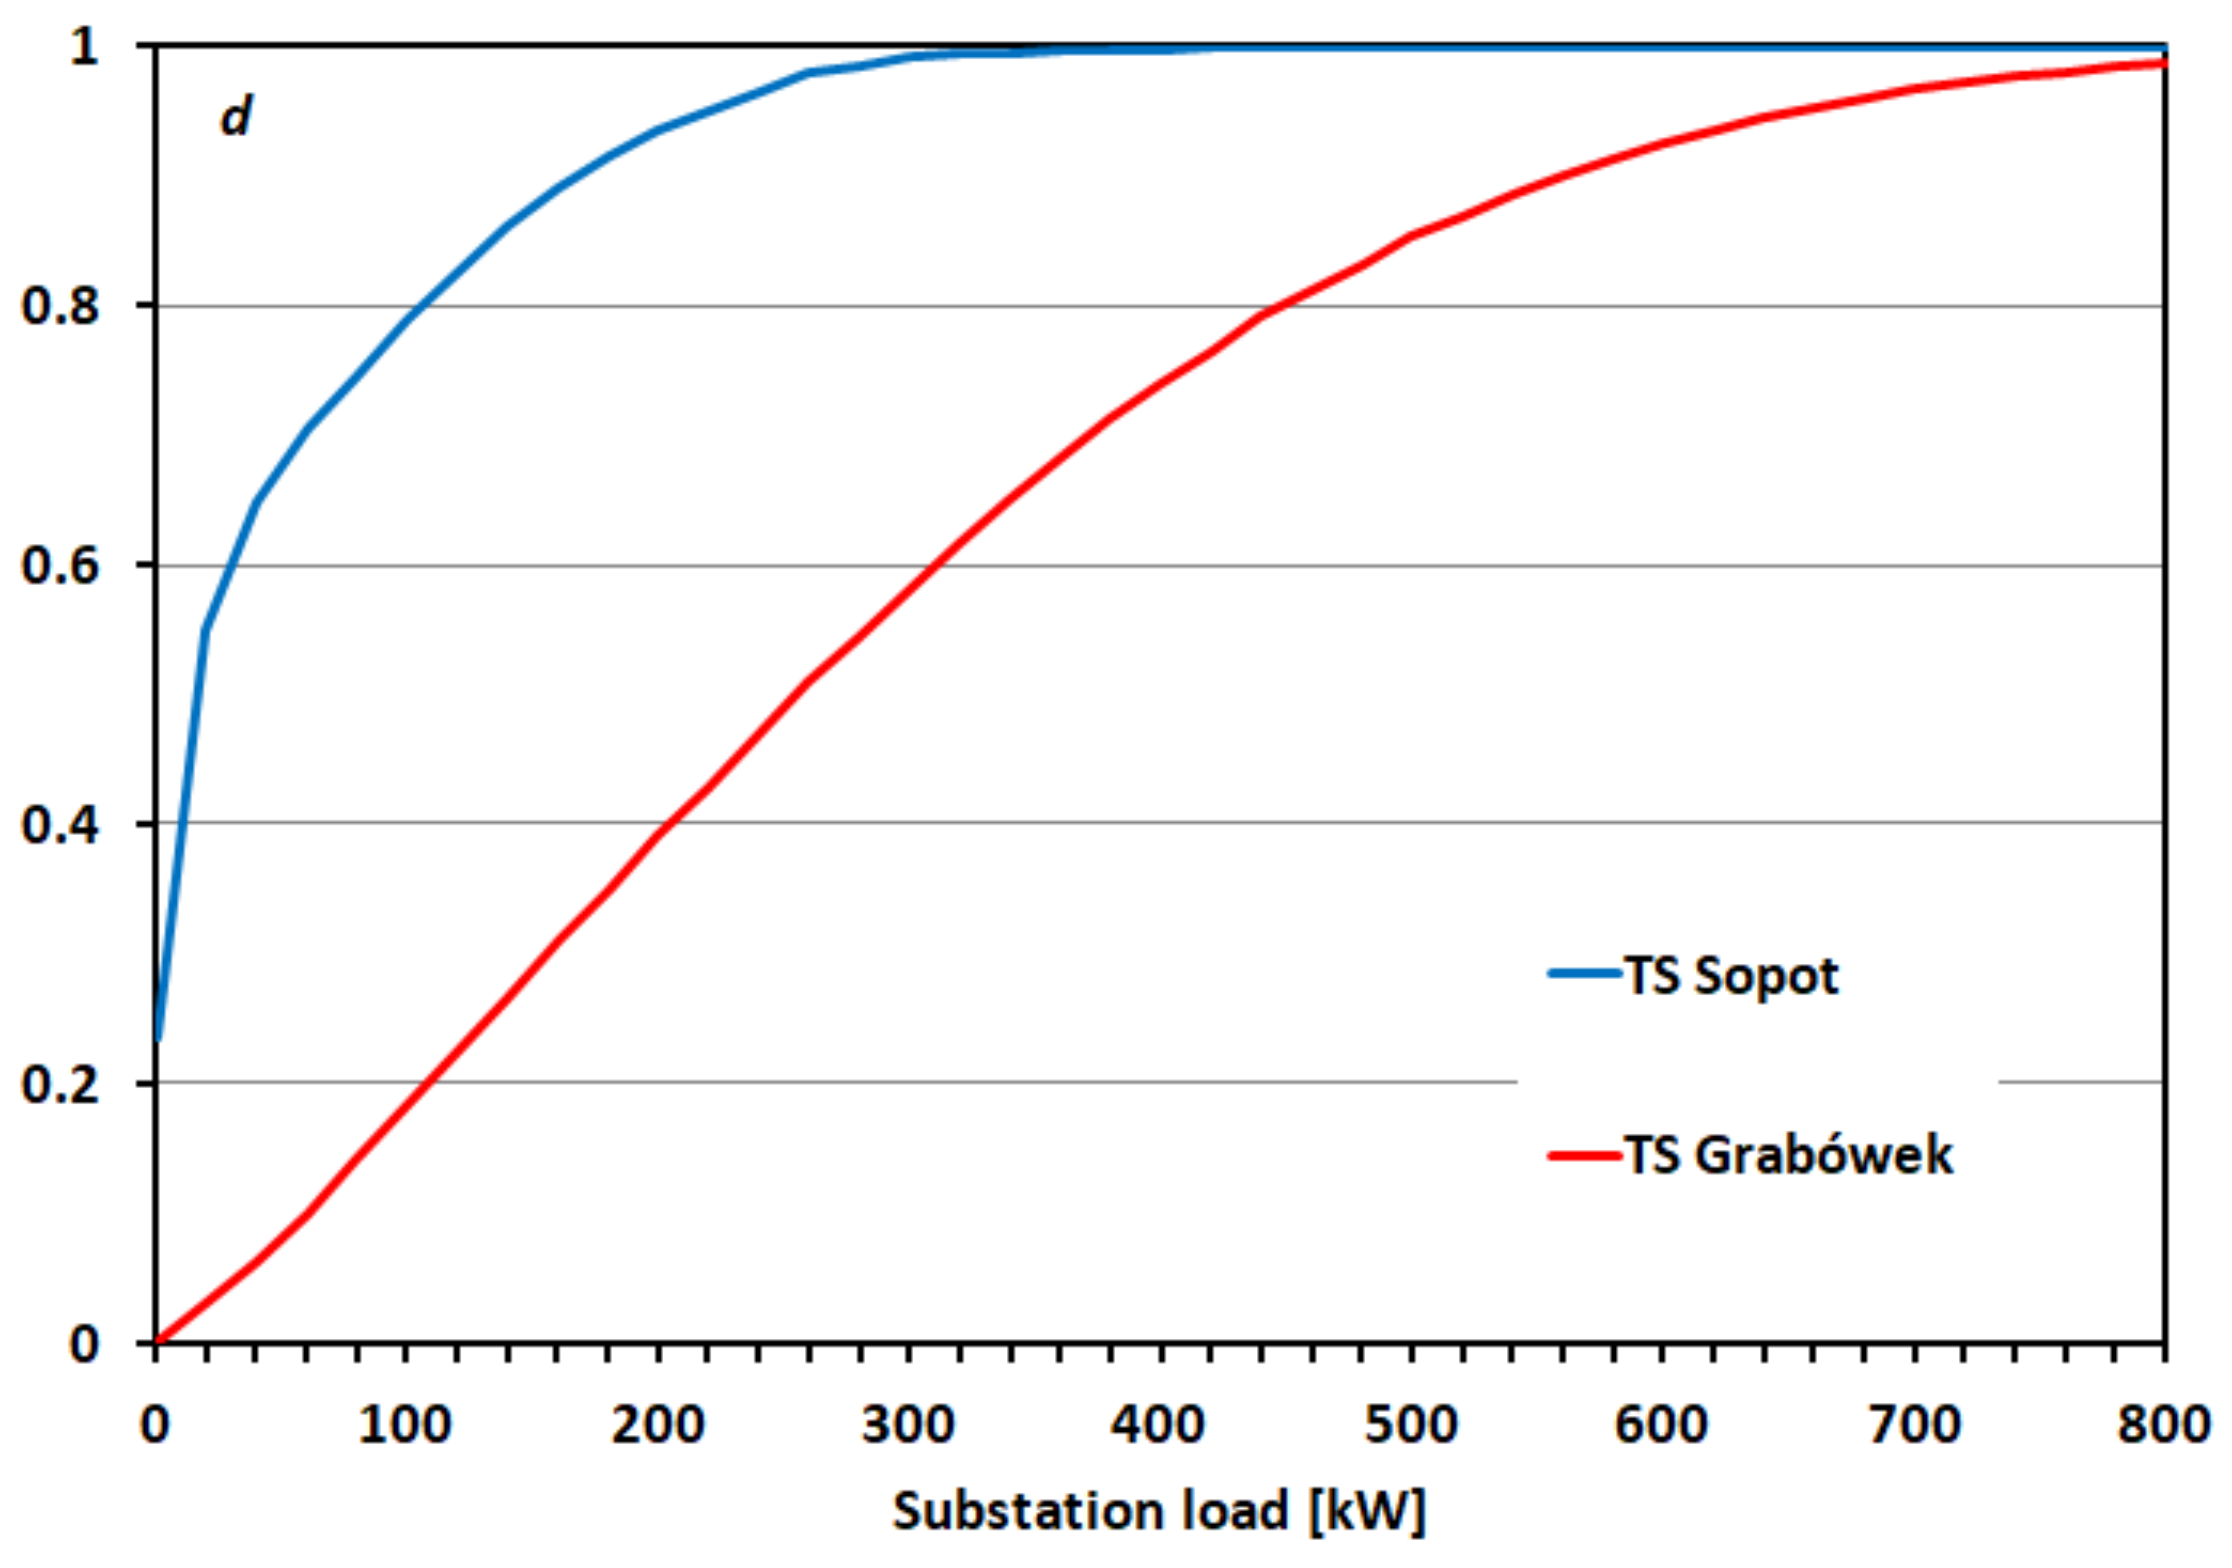
Figure 3 presents the load chart of the TS Grabówek and TS Sopot, which was prepared on the basis of measurements. These two substations are characterized by extremely different traffic conditions: TS Grabówek supplies the main trolleybus lines with high traffic, while TS Sopot supplies a very small part of the city. Different character of the movement is reflected in the shape of charts. In the case of Sopot, the low traffic intensity results in a small load of the substation, so most of the bars are on the left, while for the heavily loaded TS Grabówek, the majority of the bars are on the right side of the chart.
Fulfilment of Condition (1) can be analysed on the basis of the distribution of traction substation load (
Figure 3). The d distribution value corresponding to the
P power means that the substation load will be less than the value of
p with probability
d. This means that for energy generation with the
p value it will be used in the
d degree. Looking at the distribution charts shown in
Figure 4, it can be stated that, for example, with energy generation of 200 kW for the TS Grabówek it will be used in over 90%. In the case of the TS Sopot—only 40%. It is also possible to partially use the generated energy, so in practice these values may be higher, but they do not affect the nature of the dependence of traffic intensity and energy use.
In the case of direct use of the energy generated by the photovoltaic system for powering the electric traction network, the structure of the power supply system is an important element influencing the absorption potential of the generated energy. One possibility to increase the number of potential recipients, i.e., vehicles, is to modify the structure of the traction network in order to increase the possibility of energy flow. In a classic power supply system the areas of the individual traction substations are isolated from one another, which blocks the flow of energy between them. Therefore, it is possible to use bilateral power supply of the traction network, i.e., to connect adjacent power supply sections from different substations, which increases the area of potential energy use beyond the area of the substation [
19]. Another solution is to expand the power system by building additional power supplies that allow the flow of generated energy. Such substations can, for example, connect the various traction substations. This is a costly solution, but there are often unused backup power supplies in the electrification power supply system. They can be used to facilitate the flow of energy.
In the case of extended power systems with a bilateral power supply system, the voltage drop in the traction network and the feeders may be limited by the power dissipation. For this reason, the voltage generated by the photovoltaic system connected to the grid should be as large as possible and the idle bus bars voltage of the substation should be limited to the minimum. The more voltage of the photovoltaic power station exceeds the voltage of the traction substations, the more the PV station will be charged to the traction substations. This brings with it an increase in the use of generated energy.
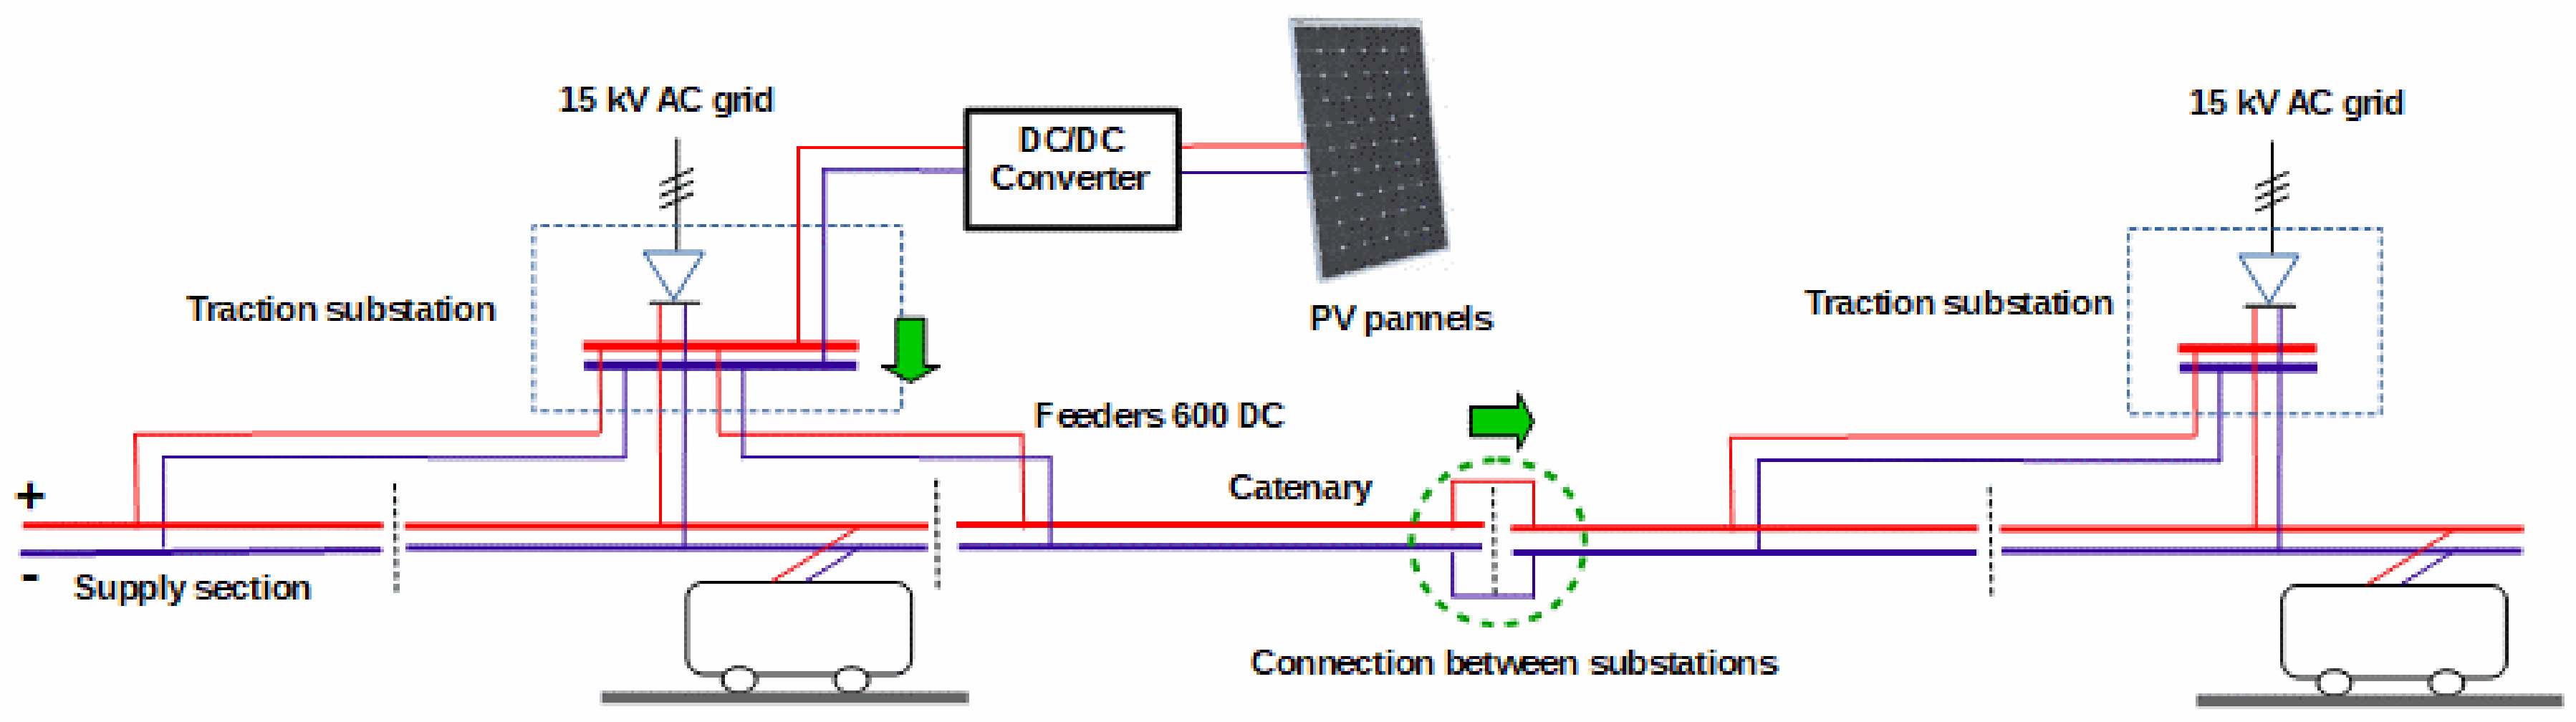
Figure 5 presents the structure of supply system. In order to ensure the photovoltaic system cooperation with the traction power supply system, it is necessary to use a separating DC/DC converter. Traction power supply system is characterized by high voltages.
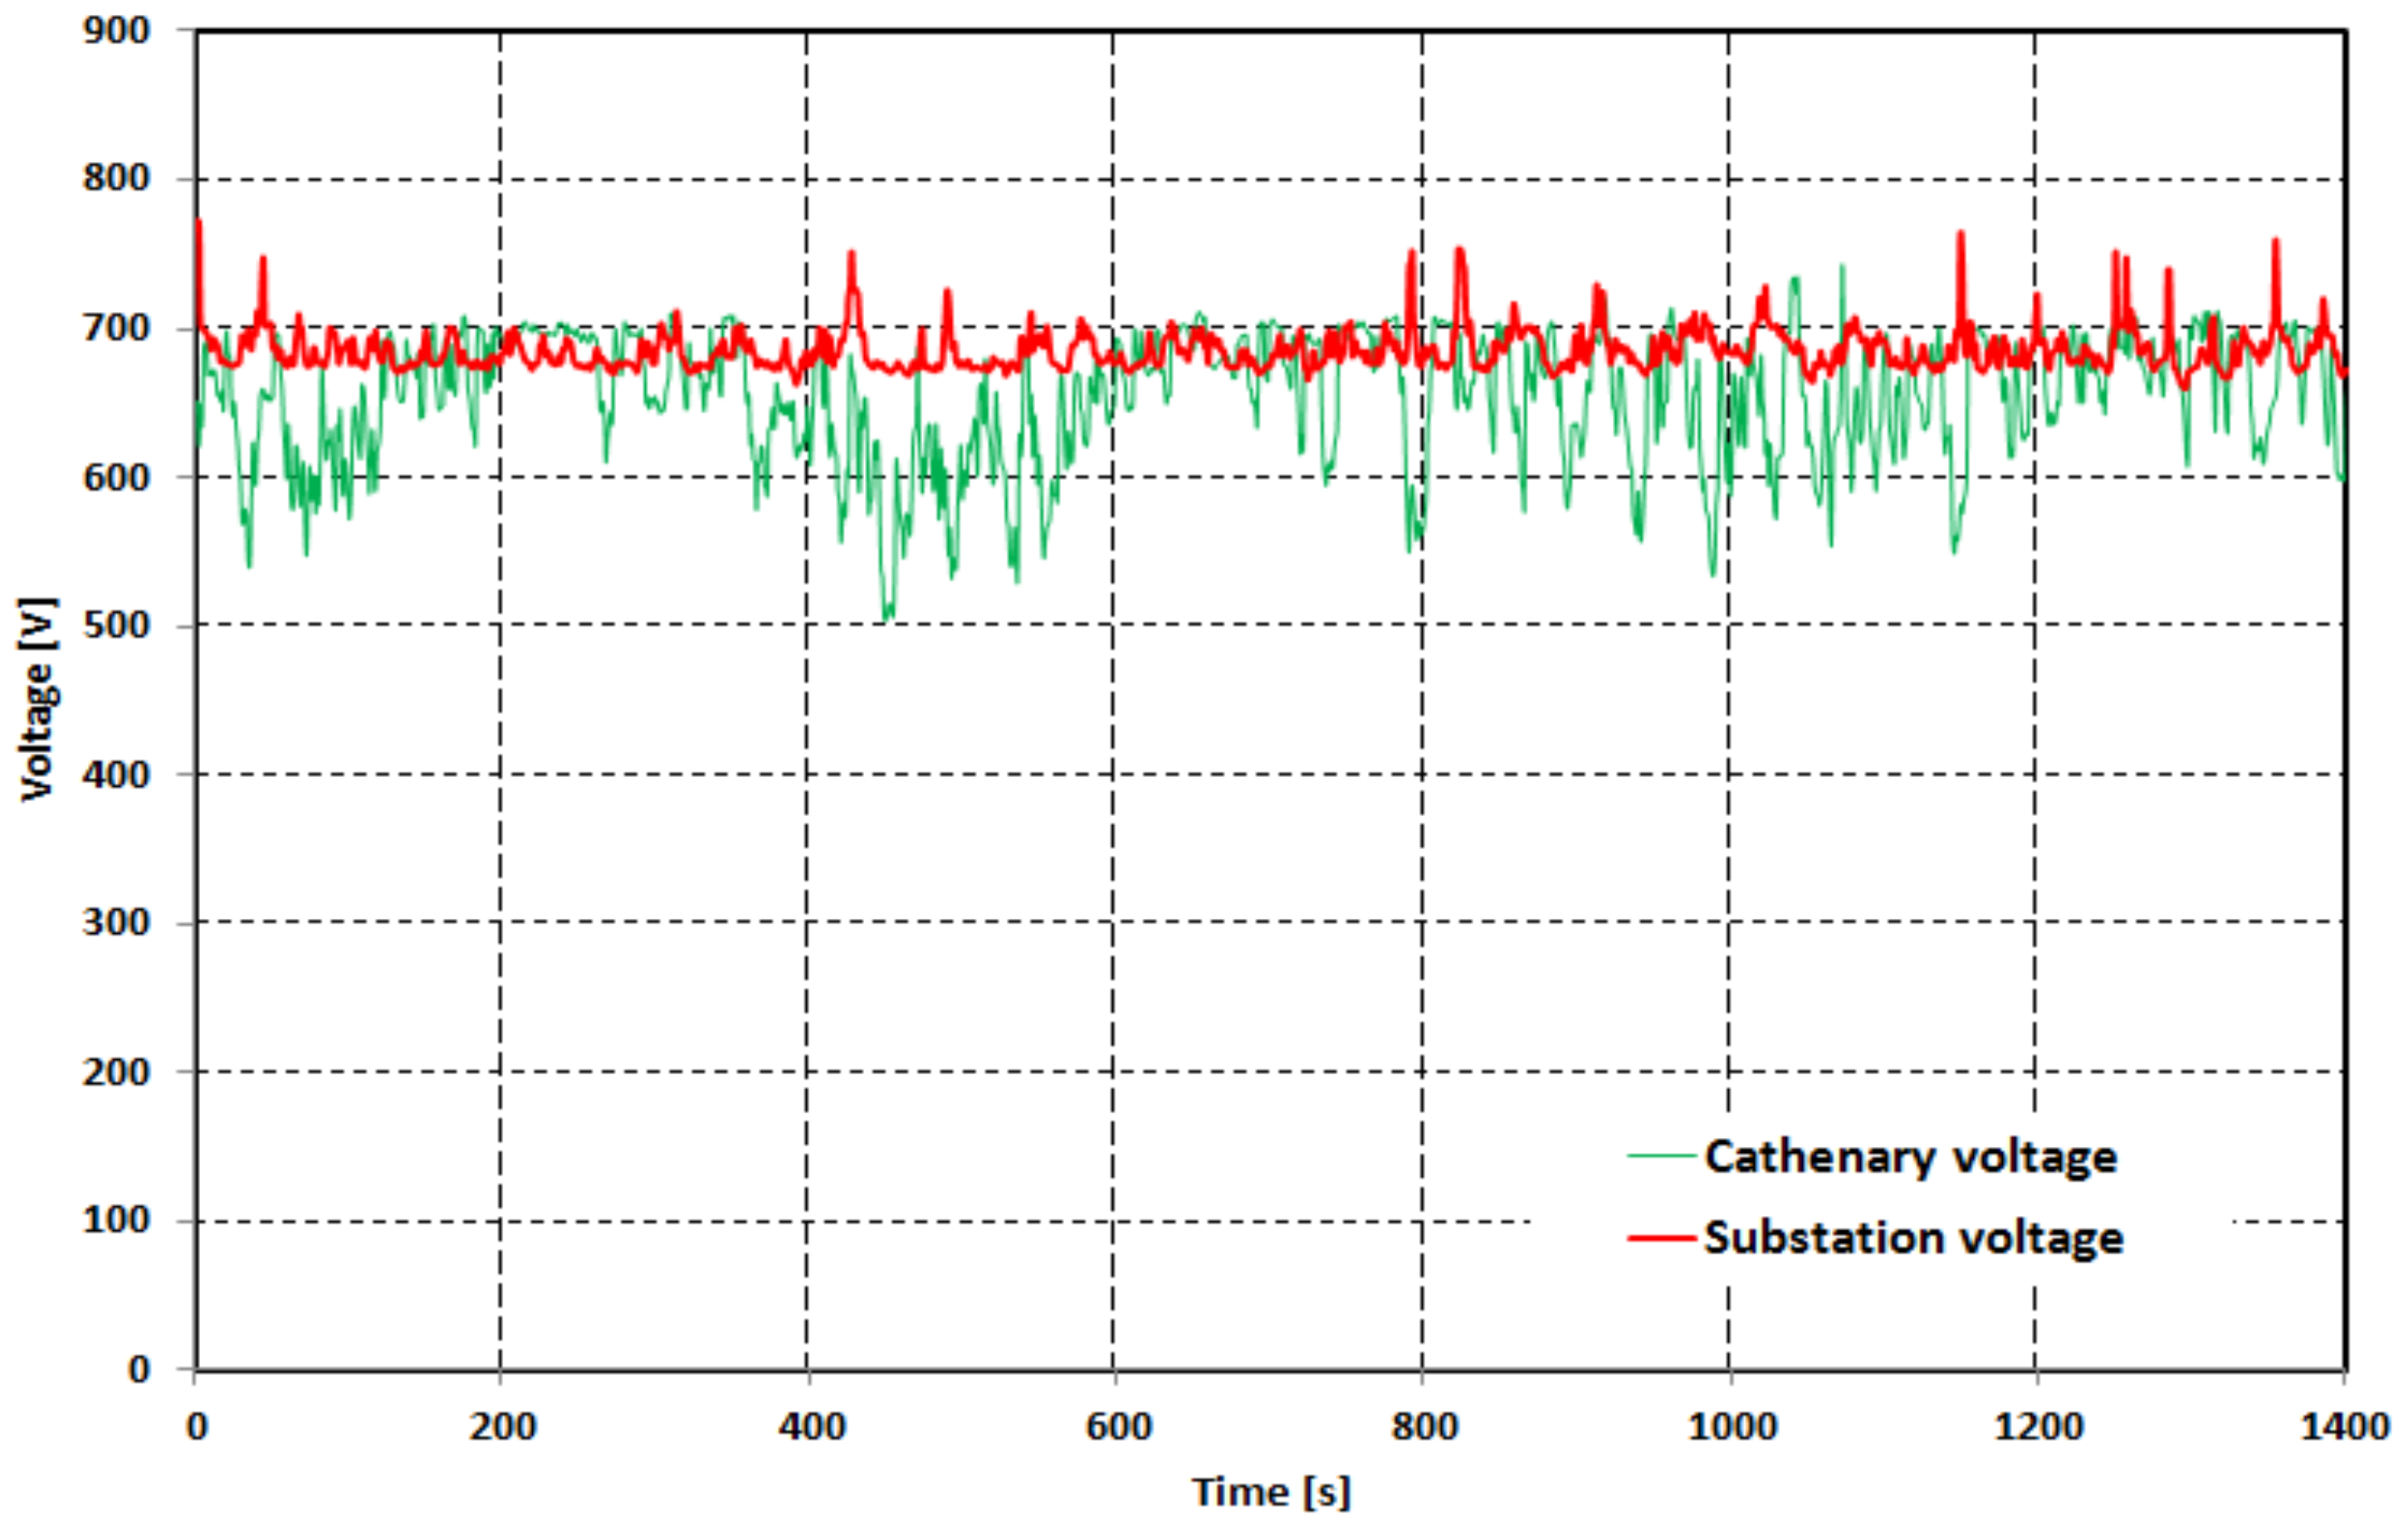
Figure 6 shows an example of the bus bar voltage charts in the traction substation and the voltage at the final point of the power supply section. Particularly in the second case, significant voltage value fluctuations are noticeable. The DC/DC converter must be adapted to modulate the voltage and current values on both sides: on the side of the traction power supply system it must adjust to varying voltages and the photovoltaic system must work at the optimum PV point.
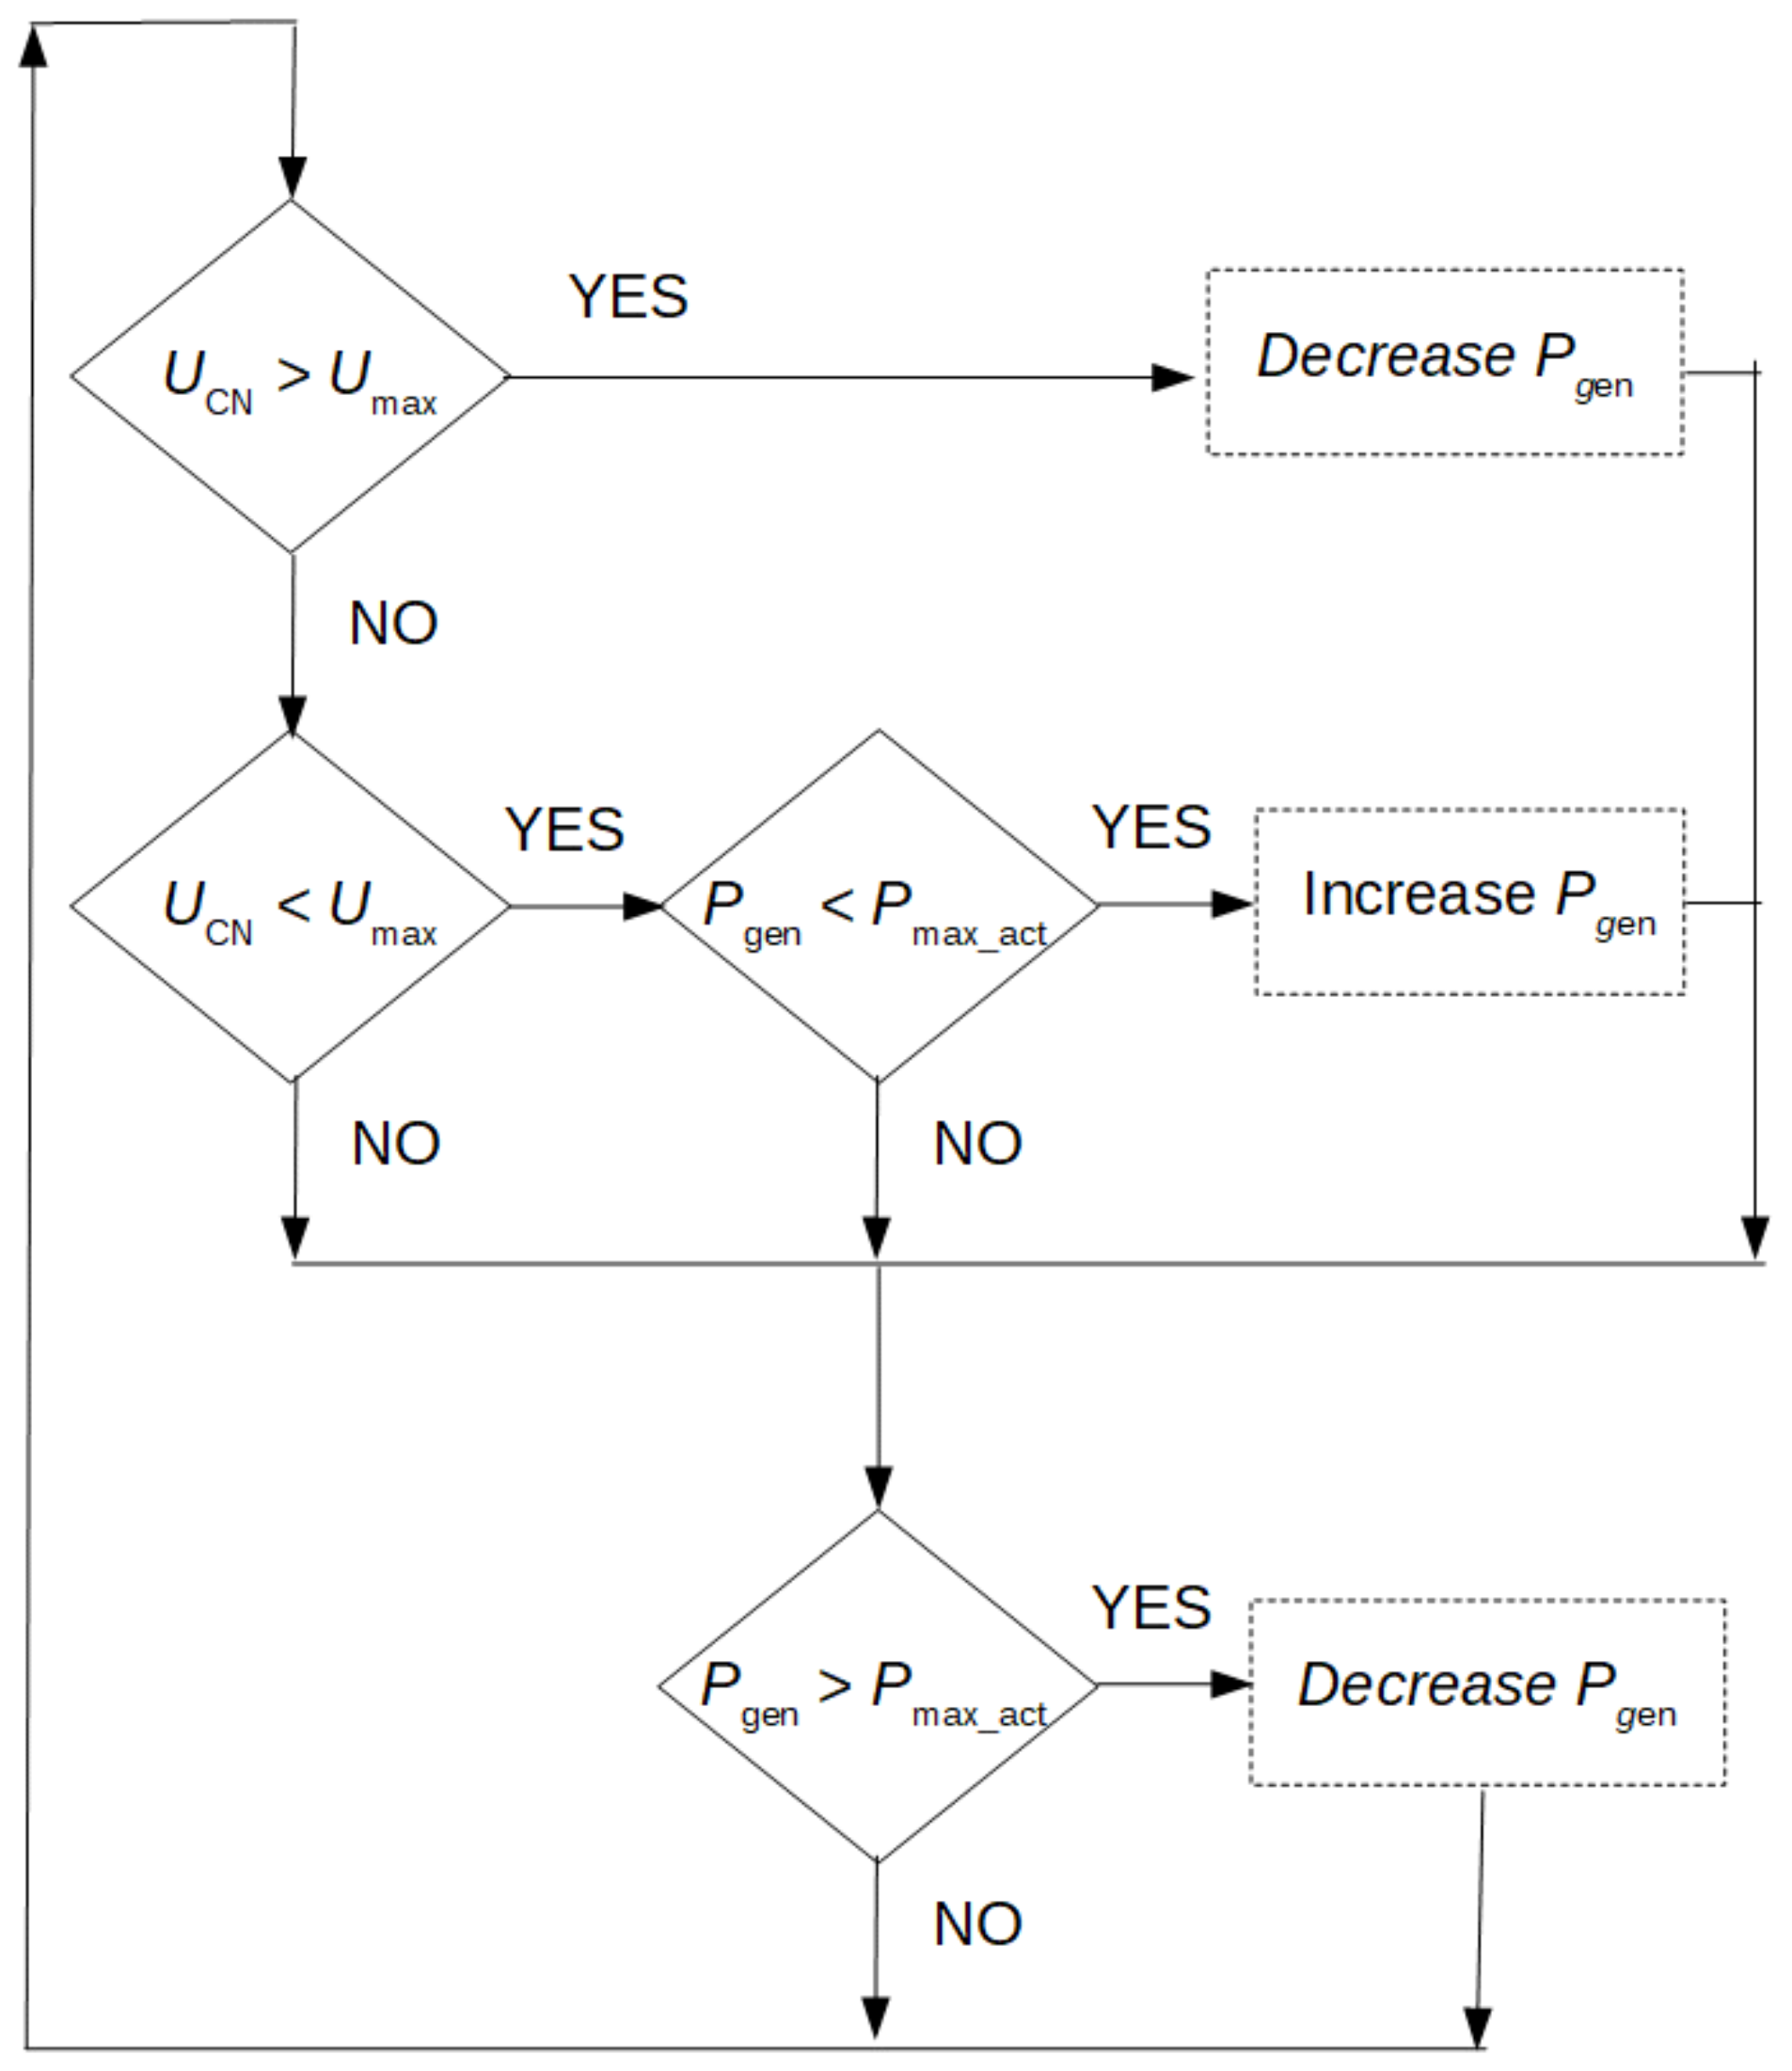
Figure 7 shows a schematic diagram of a photovoltaic converter control system. Power control should be based on the current measurement of the
UCN voltage across the traction network. If it is less than the
Umax maximal permissible voltage and the system does not work at its maximum parameters (
Pmax_act), then the system will not be able to increase its
Pgen power output. If the value of the
UCN voltage generated exceeds the maximum allowable value, the generated energy must be reduced. In the case of direct connection of the PV system to the traction substation, it is possible to extend the control algorithm by monitoring the substation load value.
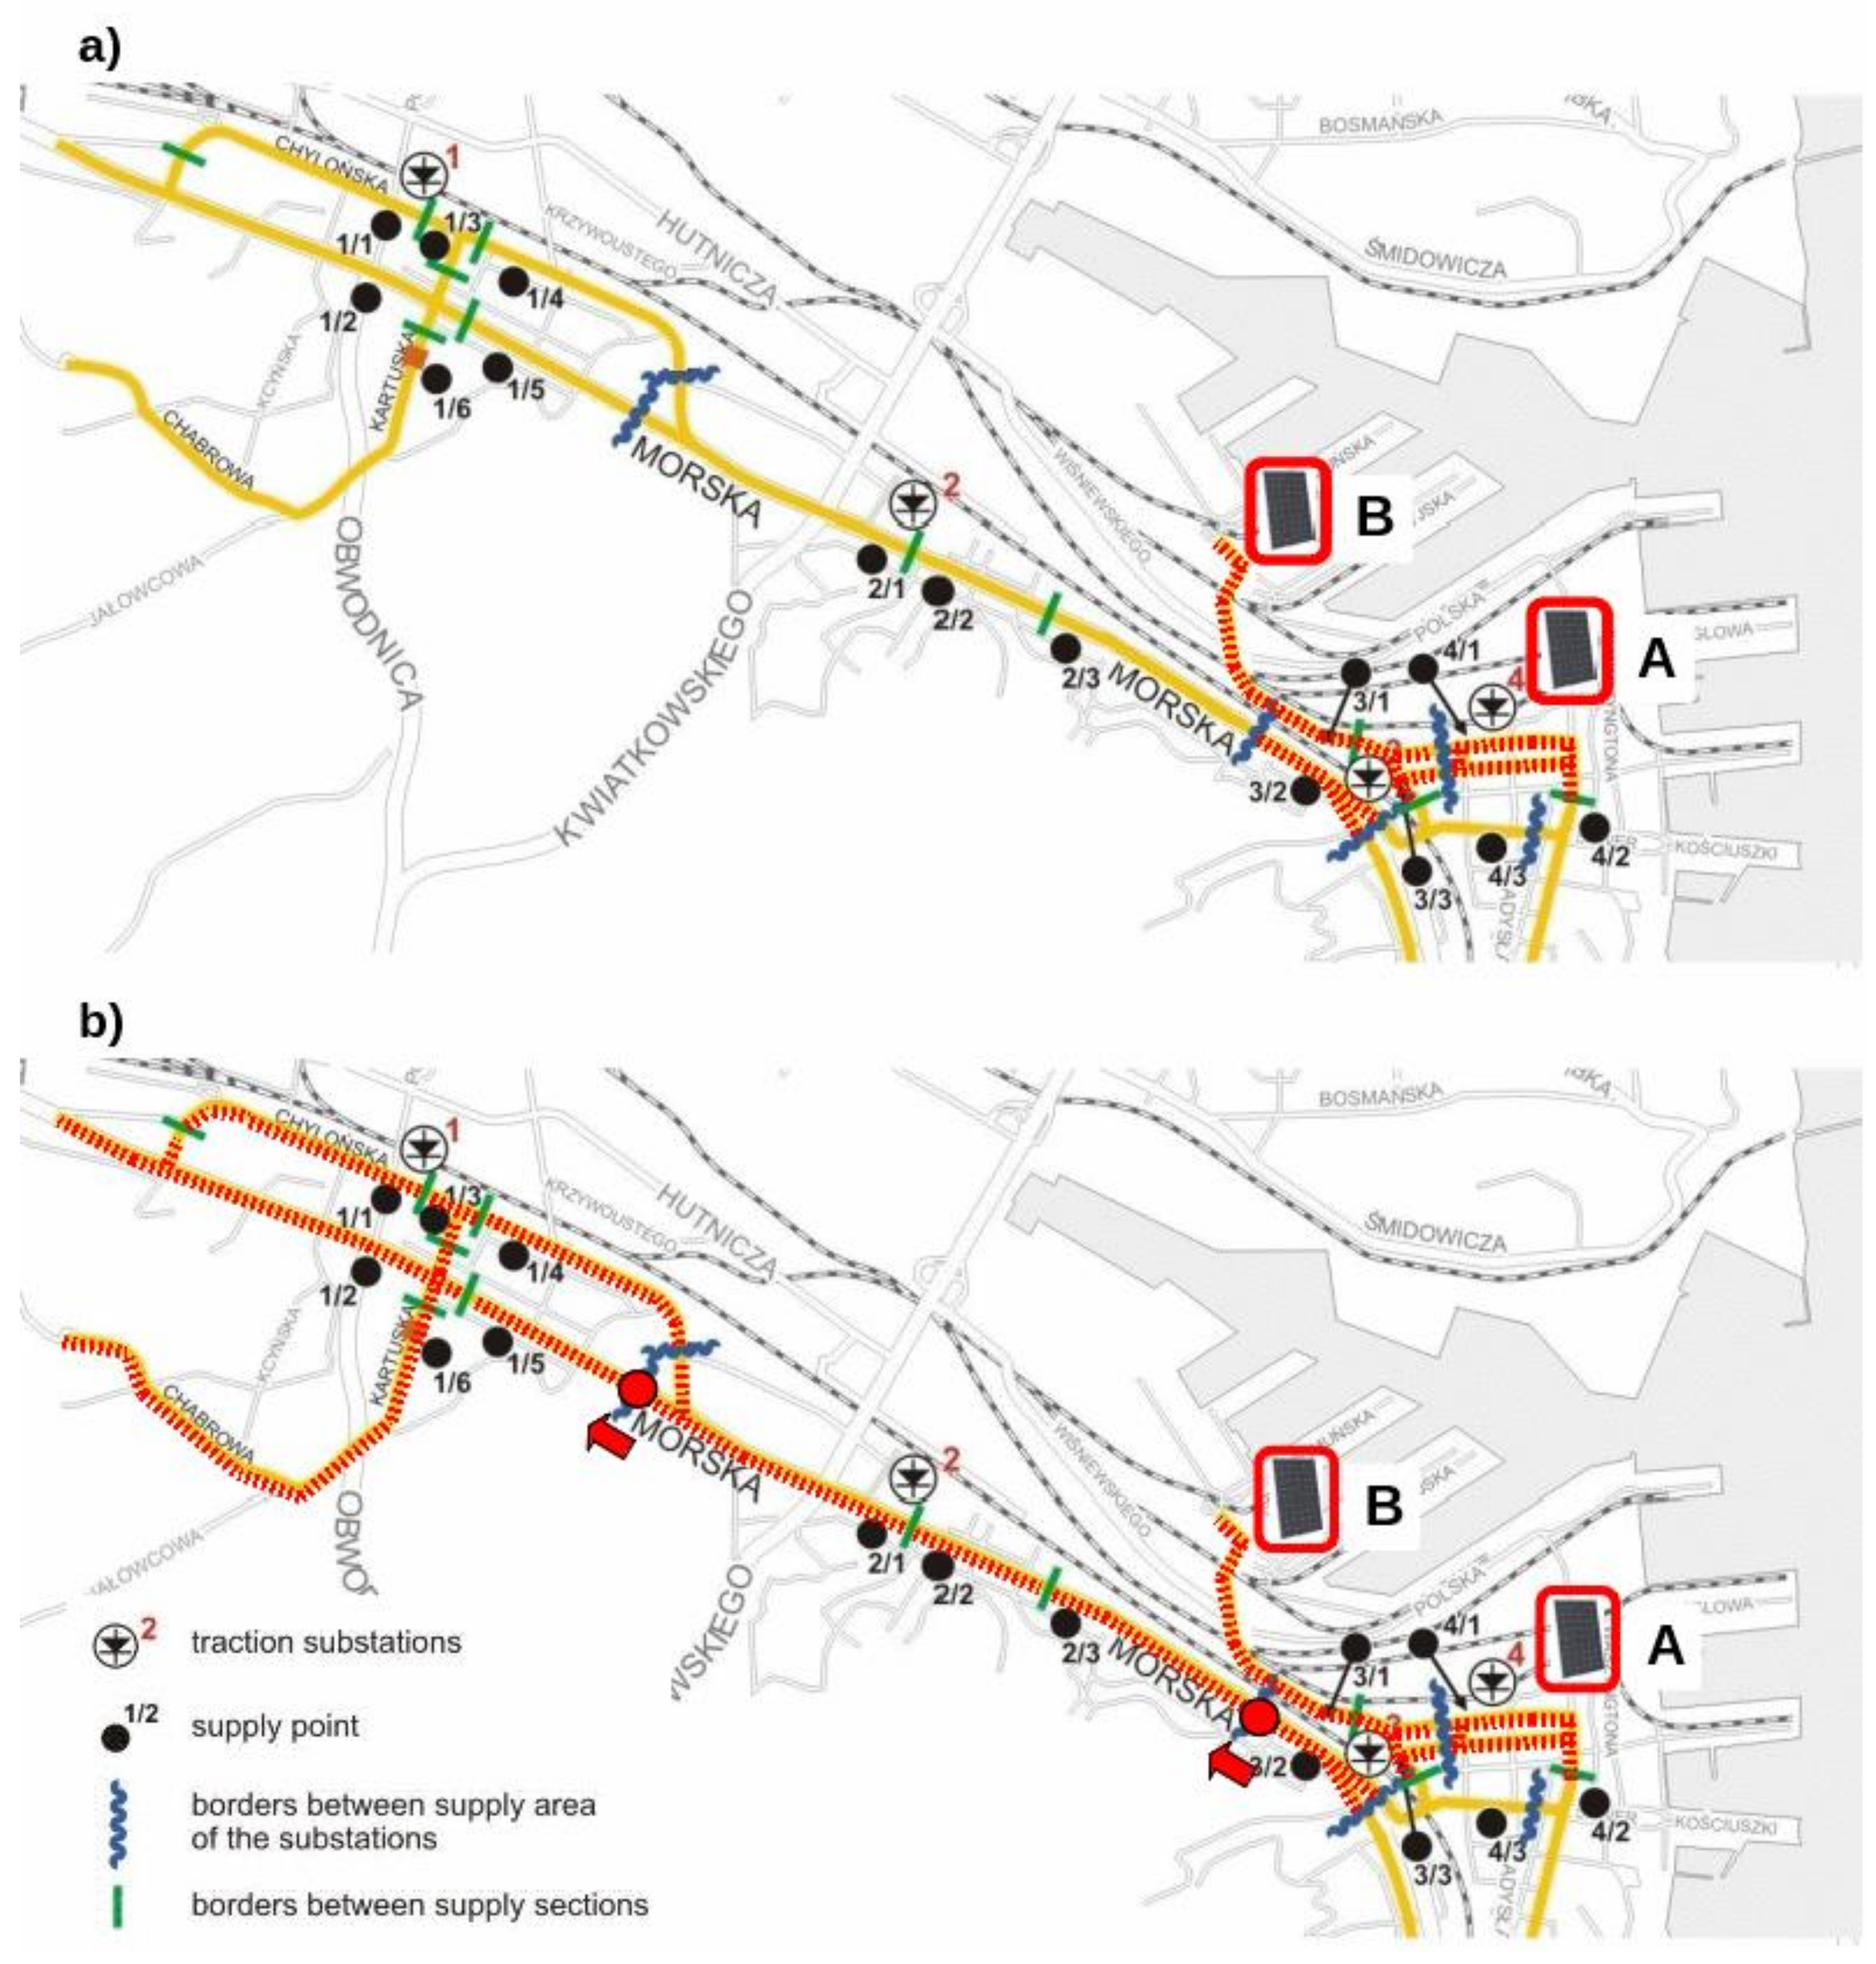
2.3. Case Study of the Photovoltaic System Application in Urban Transport Supply
Practical possibilities of using the photovoltaic system for supplying urban transport system will be presented on the example of Gdynia trolleybus network. Gdynia is a harbour city at the Baltic Sea with a population of 250,000. Its trolleybus network was put into operation in 1943, and gradually developed, to later become the largest in Poland. Gdynia’s trolleybus carrier, Przedsiębiorstwo Komunikacji Trolejbusowej (PKT), currently operates a fleet of 85 trolleybuses on 12 service routes in a network, the length of which reaches almost 50 km. Gdynia’s trolleybus network is powered by 600 V from 10 traction substations in a unidirectional supply system. The traction substations differ with respect to the size of areas to which electricity is supplied and the number of rectifier sets, each substation powers one to six sections. Gdynia’s trolleybus system consumes nearly 12 GWh of electrical energy per year and is considered one of the biggest energy consumers in the city. Therefore, one may reasonably expect that some steps towards reducing power consumption would be appropriate [
18].
Since 2001, PKT Gdynia has been involved in many activities related to the reduction of power consumption, both in terms of implementation and research and development. The former category includes putting vehicles with an energy-efficient drive into operation and the installation of supercapacitor energy storage in one of the traction substations, the latter studies on the potential for a further limitation of energy consumption and methods to achieve it. PKT Gdynia participates in two research and development programmes: Trolley and Dyn@mo, in addition to cooperating with Gdańsk University of Technology. Three variants of photovoltaic system installation are considered:
Variant I: Installing a photovoltaic system on the roof of a trolleybus depot. The total area of the shelter is 5000 m2, which allows the installation of a photovoltaic system with a peak power of 500 kW. Due to the proximity of the Grabówek substation, it is assumed that the photovoltaic system is connected to the busbars of this substation.
Variant II: Installation of a photovoltaic system on the roof of a school near the Dworzec traction substation. The roof surface allows installation of a 50 kW PV system. Due to the proximity of the Dworzec traction substation, it is assumed that the photovoltaic system is connected to the busbars of this substation.
Variant III: Installation of a photovoltaic system on the roof of a public building located near Stocznia, at the final point of the “Stocznia” power section (numbered 3/1). The section is powered by the Dworzec traction substation. The roof of the school allows installation of a 50 kW PV system. In this variant it is assumed to connect the PV system to the traction network.
The three variants presented correspond to three different scenarios of possible variants of PV system interaction with the traction network. The Grabówek substation (Variant I) supplies an area with significant traffic intensity and is characterized by a heavy load. Therefore it is possible to connect a relatively high power photovoltaic system. The Dworzec substation (Variant II) supplies a relatively small area, which results in lower load and it is unlikely to receive energy from the photovoltaic system. In Variant II the photovoltaic system is not connected in the traction substation but at the outlying unit of the traction network, which further limits the energy received due to the resistance of the power supply system. However, in reality, this situation may be the most common, as the optimal locations for the photovoltaic systems may not overlap substations.
In addition to the location of the photovoltaic system, the structure of the power supply system and its influence on the energy usage rates were also examined. The analysis covered the power supply area of the Dworzec, Grabówek substations and additionally the neighboring Północna substation. Two variants were examined:
Variant A: Power supply in the current circuit, i.e., with unilateral traction power supply—all substations work independently.
Variant B: Bilateral power supply. Power areas are interconnected by means of interconnections between the power supply sections and the use of the spare cable of Chylonia. This increases the number of energy flow paths.
The structures of supply system in several variants are shown on
Figure 8 and
Figure 9. The analyzed variants are compared in
Table 1.
3. Methods: The Simulation Monthe Carlo Method
In many cases the solution of a calculation issue is based on an algorithm (a sequence of operations), which allows for finding the searched
f value precisely or with a specified error [
20]. If
f1,
f2, …,
fn denote the results corresponding to subsequent accumulations of the algorithm operations, then:
Due to the finite number of operations, the calculation process is discontinued after a certain number of steps has been achieved. This is a strictly deterministic process: each of the calculation algorithms will result in the obtainment of an identical result.
There are problems, for which construction of such an algorithm is very complicated. In such cases the issue is modified, using the laws of large numbers from the probability theory. The
f1,
f2, …,
fn estimates of the searched
f variable are obtained based on stochastic analysis connected with the results of certain multiple random samples. In this case the random variable
fn must be stochastically consistent with the searched variable
f, i.e., for any ε > 0 there is a dependence:
where
P means the probability of occurrence of a certain event. The selection of the
f variable depends on the character of a given problem. In many cases the searched
f variable is regarded as the occurrence of a certain random event. Such calculation process is not deterministic, as it is defined by the results of random samples [
20].
The ways of solving issues, where random values are employed, are called the Monte Carlo method. The advantage of this method is the lack of necessity to know the exact dependencies between the data and the searched values. The required knowledge can be restricted to the circumstances in which a given phenomenon occurs.
The core of the Monte Carlo method is repetition of a stochastic experiment called replication, which consists in examining the behaviour of a system with randomly selected estimators of input parameters [
20]. The distribution of probability density with regard to input values is the result of calculations performed with the use of this method.
The Monte Carlo method makes it possible to analyse the influence of numerous random factors and is used to analyse complex stochastic systems, which are too complicated for analytical modelling (e.g., chains of stochastic processes) [
21,
22,
23,
24,
25]. However, it has to be mentioned that the application of the Monte Carlo method is not limited solely to stochastic processes. Originally, this method was elaborated for analysis of mathematical issues, such as solving simultaneous equations, inverting matrices, calculating multidimensional integrals or defining decimal expansions of π.
The simulation model is based on the following input data:
- (1)
Trolleybus timetables,
- (2)
Deviations in the implementation of timetables that are designated using studies of punctuality of public transport conducted by Zarząd Komunikacji Miejskiej w Gdyni,
- (3)
Trolleybus velocity profile—the relationship between the expected speed of vehicles and their location,
- (4)
Traction characteristics of trolleybuses,
- (5)
Histogram of power generated by the PV system.
A histogram of the probability of the number of vehicles located within a power supply section at the same time was established using timetables and deviations from their implementation. The velocity profile, i.e., the relationship between the location of vehicle s and its expected velocity
v(
s) was the basis for determining the probability distribution of the location of individual vehicles along the power supply section. This probability
p(
s) was inversely proportional to the expected velocity at a given location. The operating status of the drive unit and then the trolleybus current were determined using the derivative of the velocity profile. The currents and voltages in the power supply system were calculated iteratively using the node-voltage analysis until reaching the convergence of voltages
V in the calculation model.
Figure 10 provides a simplified diagram of the simulation model.
In order to reflect local conditions of sunlight, the simulation of the PV system was based on measurements of the existing photovoltaic system in northern Poland with the power of 33 kW (
Table 2). It is located on the roof of one of the private industrial building. The calculation by means of Monte Carlo method were based on the histogram
p(
P), which means that PV system will generate
P power with probability
p. The power values generated by this system have been scaled to the parameters required in the simulation model, according to the formula:
where
pbc (
P) and
psc (
P) means histogram’s probability of generated power for based and scaled PV system,
PSC means generated power,
ksc means the ratio between nominal power of the analyzed system and basic (33 kWp) system.
On its basis, a histogram of the power generated by the system was generated.
4. Results & Discussion
An analysis of the photovoltaic system cooperating with the trolleybus power system was carried out. The structure of the system were presented in
Section 2. Calculations were made for all combinations of the above options, i.e., for cumulative options IA, IB, IIA, IIB, IIIA, IIIC. Simulations were carried out on the assumption of the current shuttling frequency and utilization of the Solaris Trollino 12 MEDCOM trolleybuses.
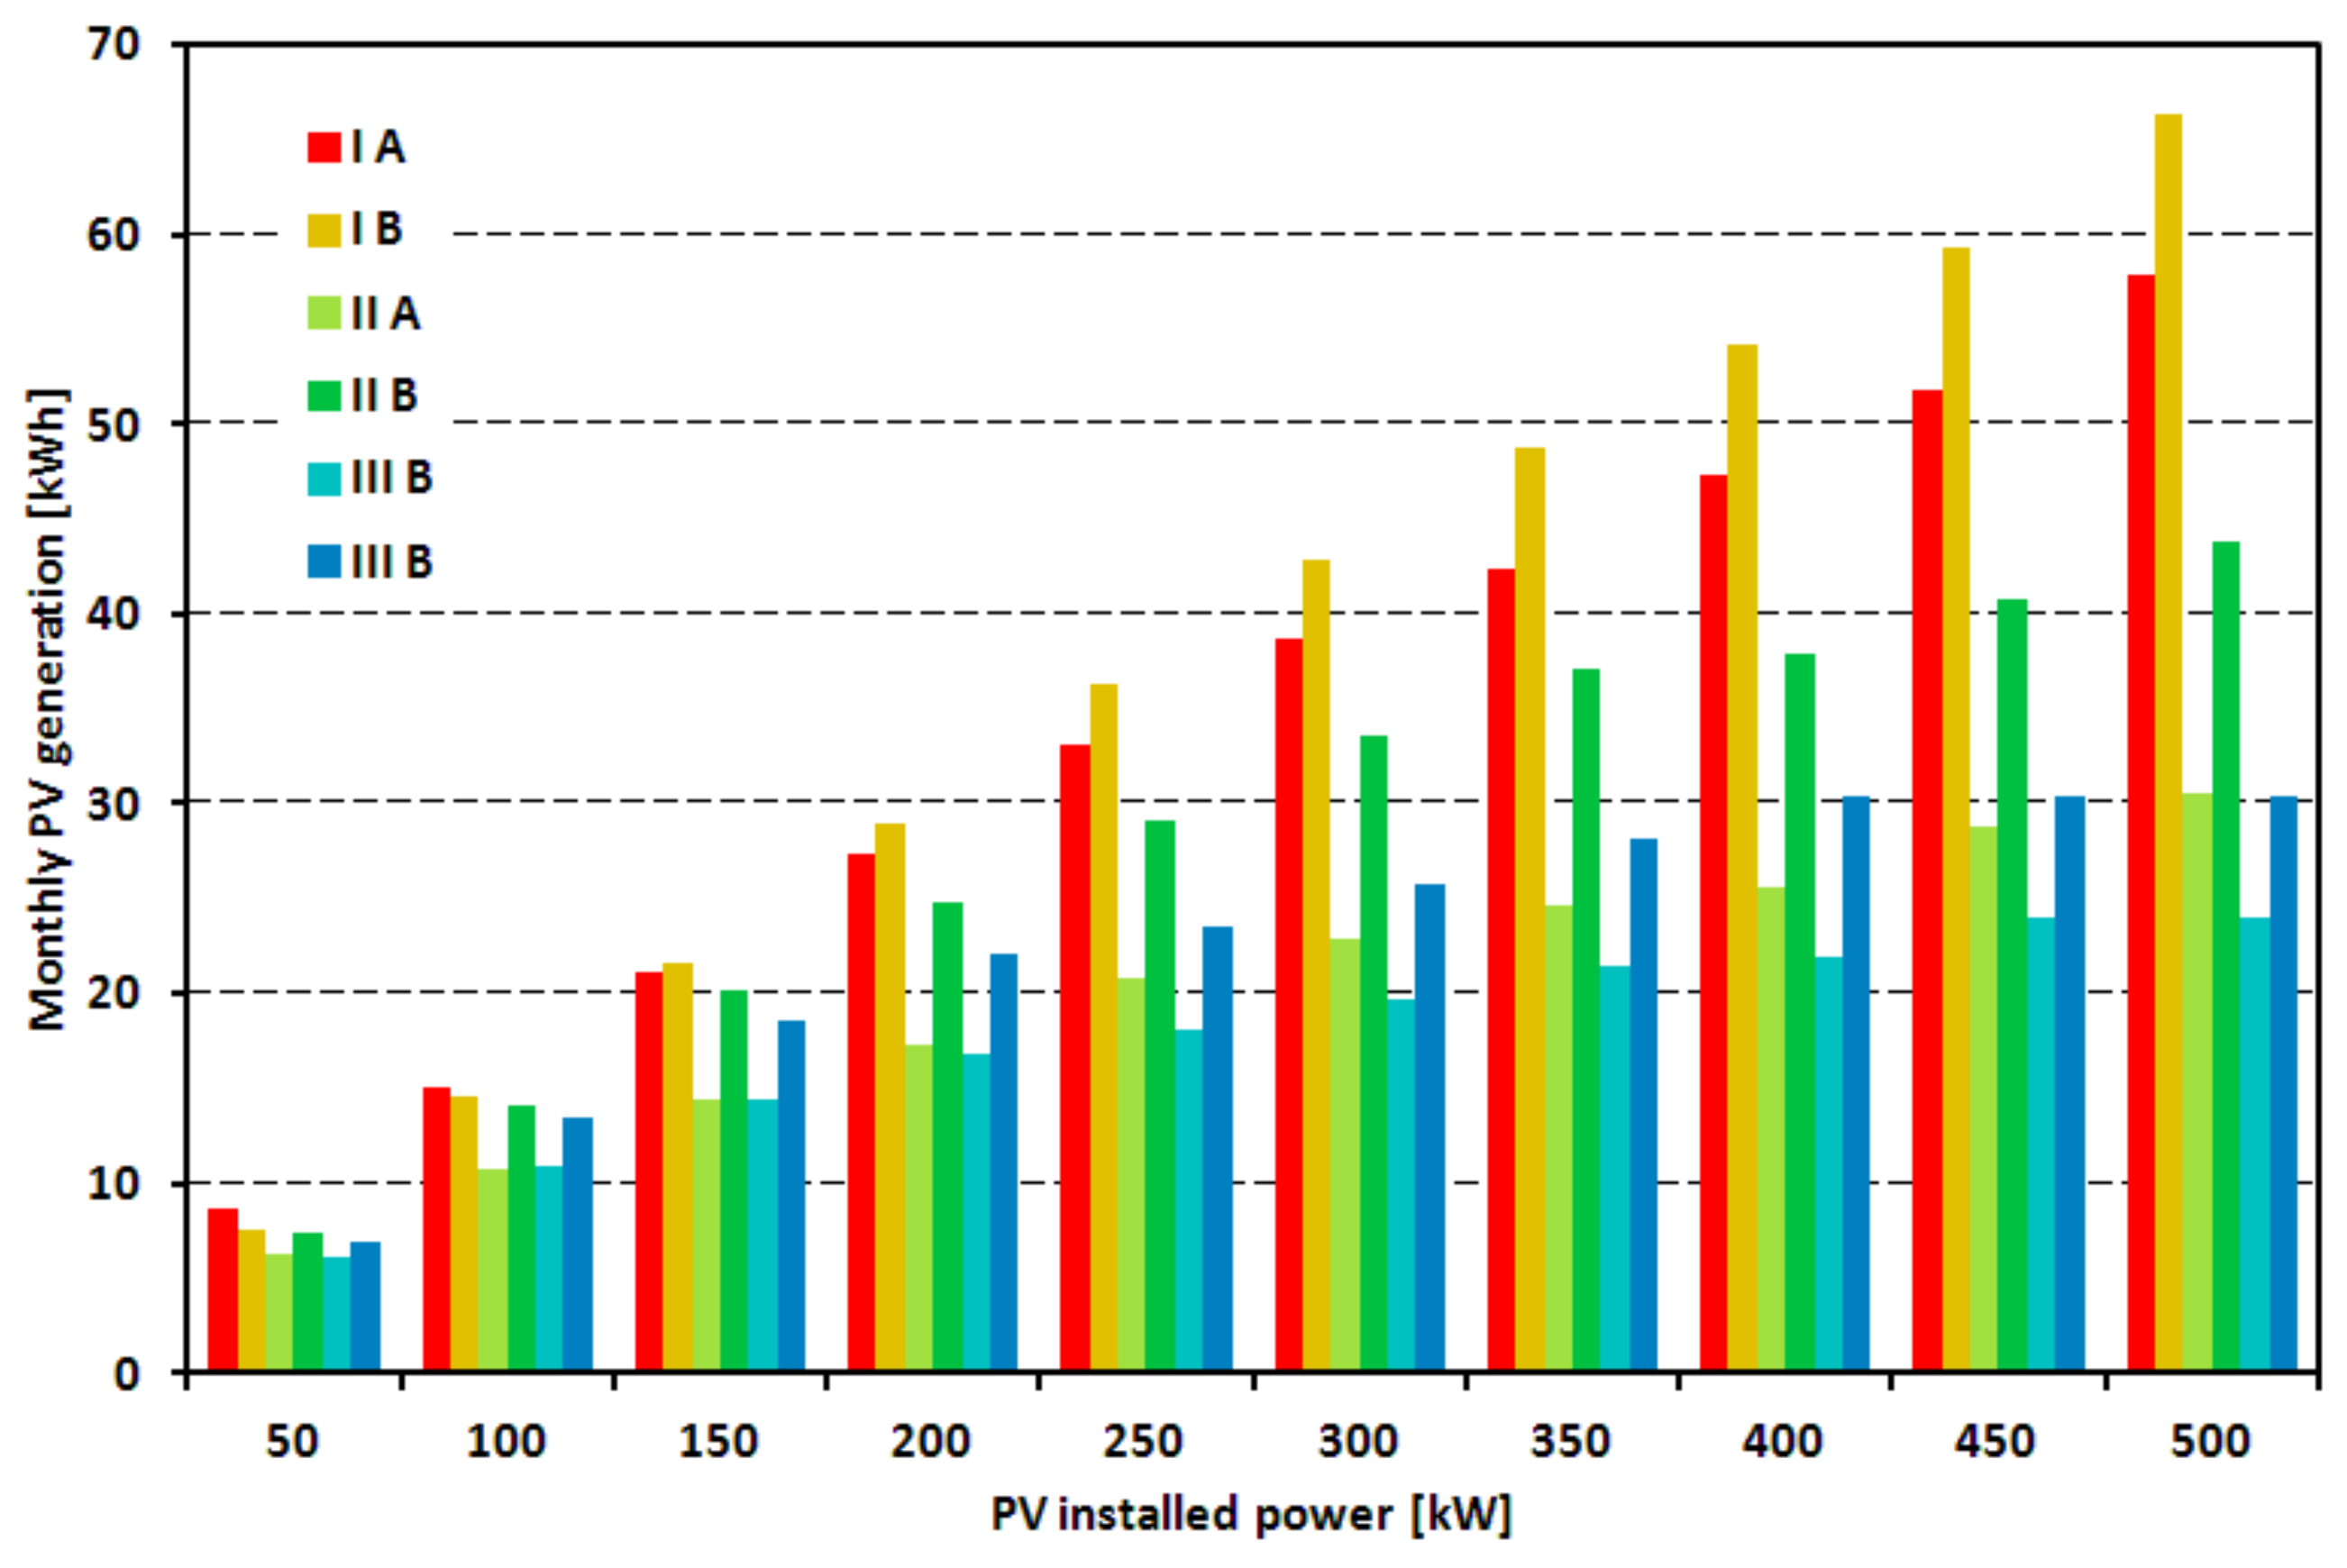
The first criterion is the analysis of the generation of electricity in the function of the installed PV system, as shown in
Figure 11.
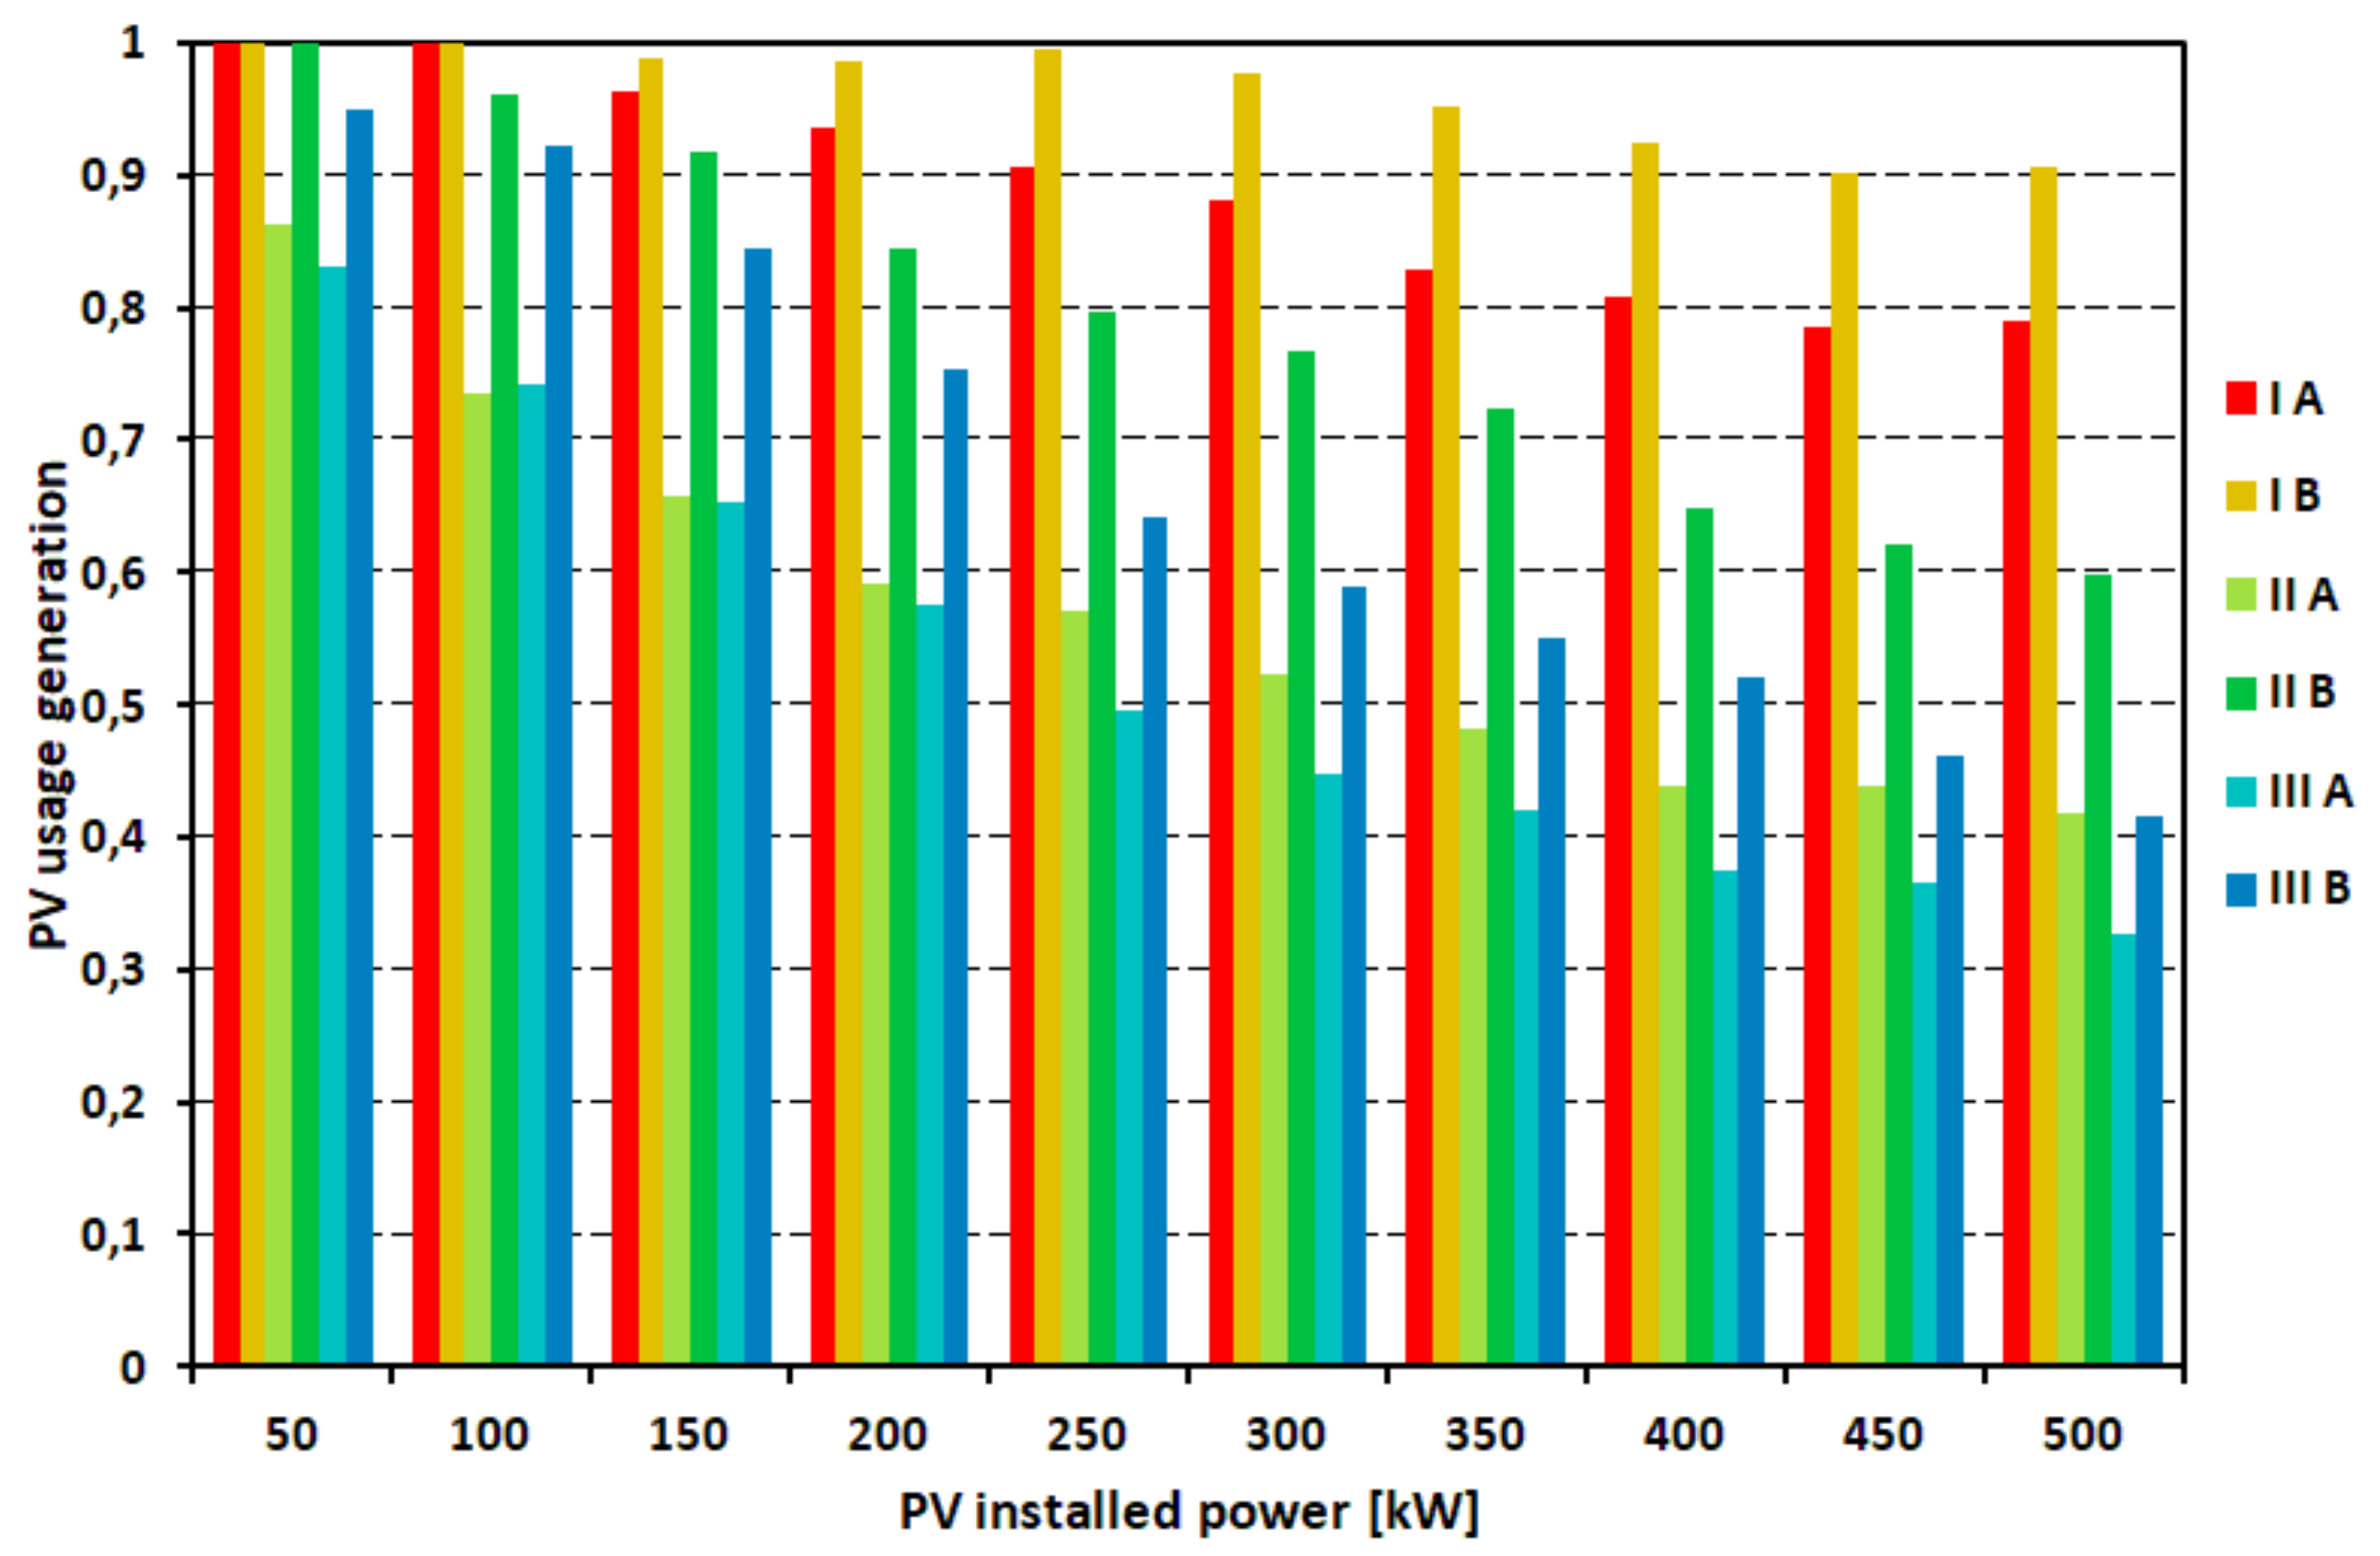
Figure 12 shows the monthly power generation rate for the maximum potential of its generation, i.e., when the generated energy is fully utilized. Calculations were done for June.
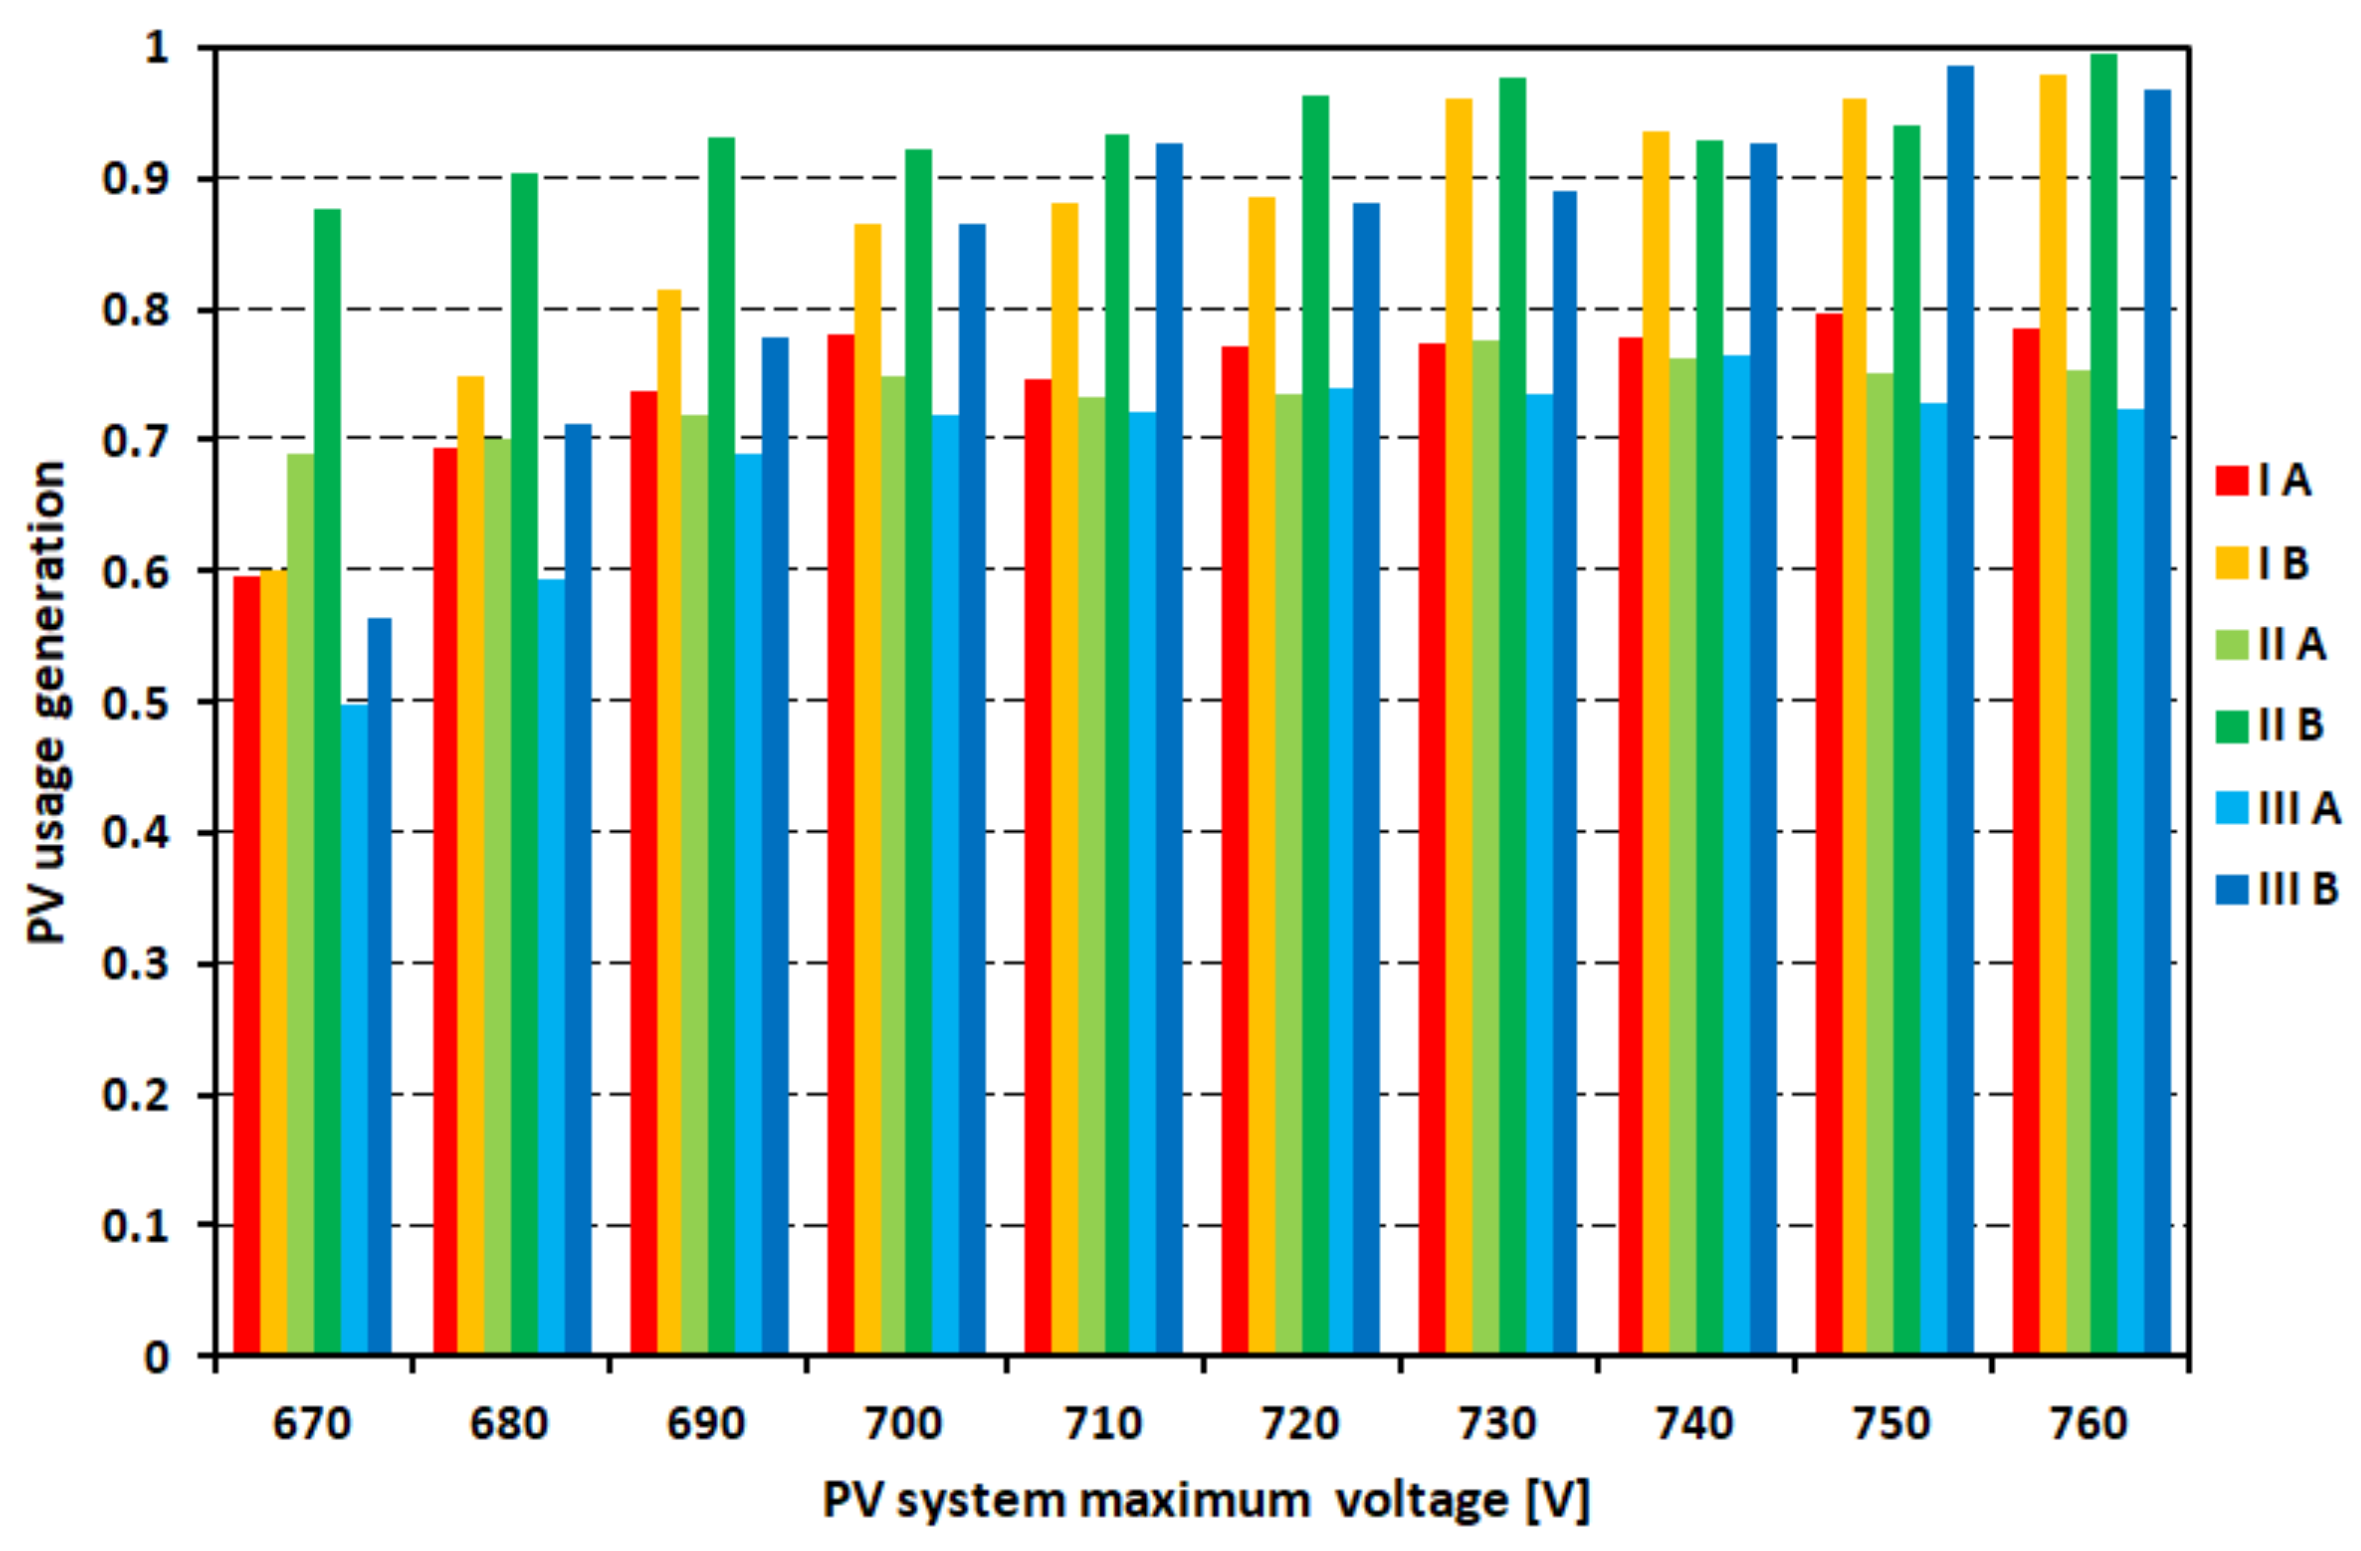
An important parameter influencing the ability to use generated energy by the PV system is the maximum voltage generation. Voltage increase allows better use of generated energy, due to its better spreadability.
Figure 13 shows the results of the use of generated energy in the voltage function.
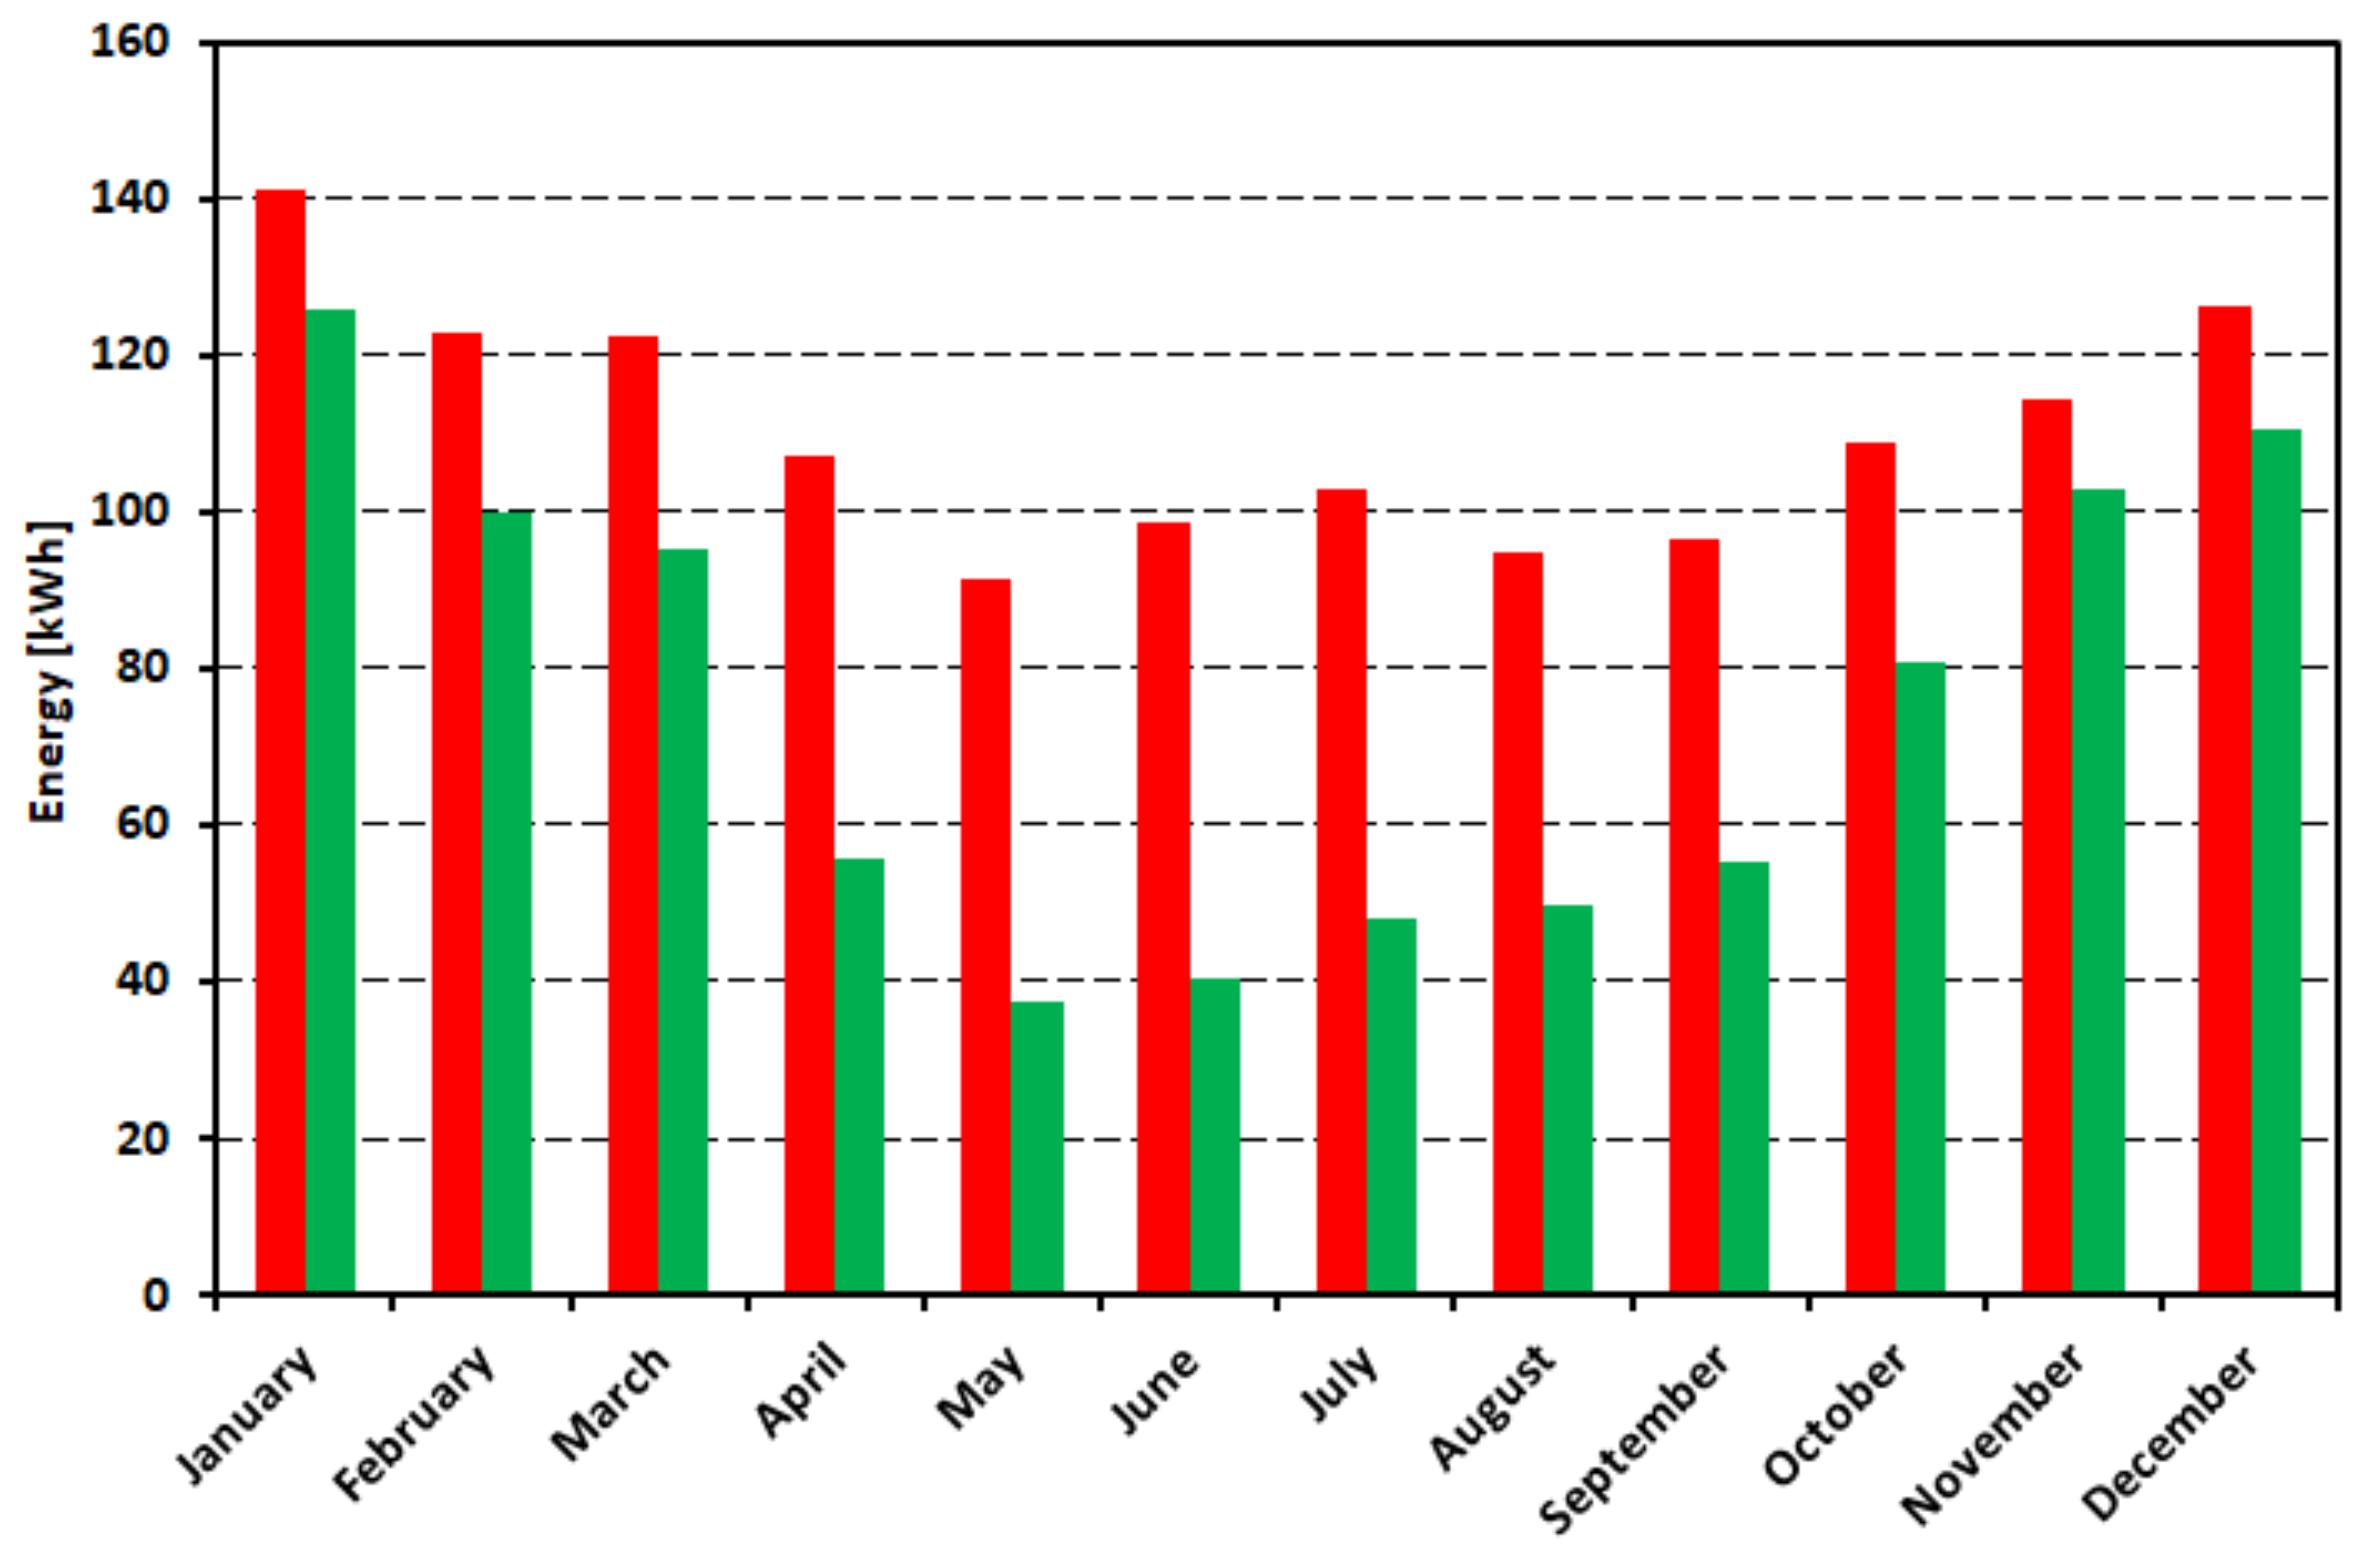
Generation of energy on a monthly scale is presented on the example of the Grabówek substation or options IA and IB.
Figure 14 shows the monthly energy consumption of the Grabówek substation before and after installation of the photovoltaic system.
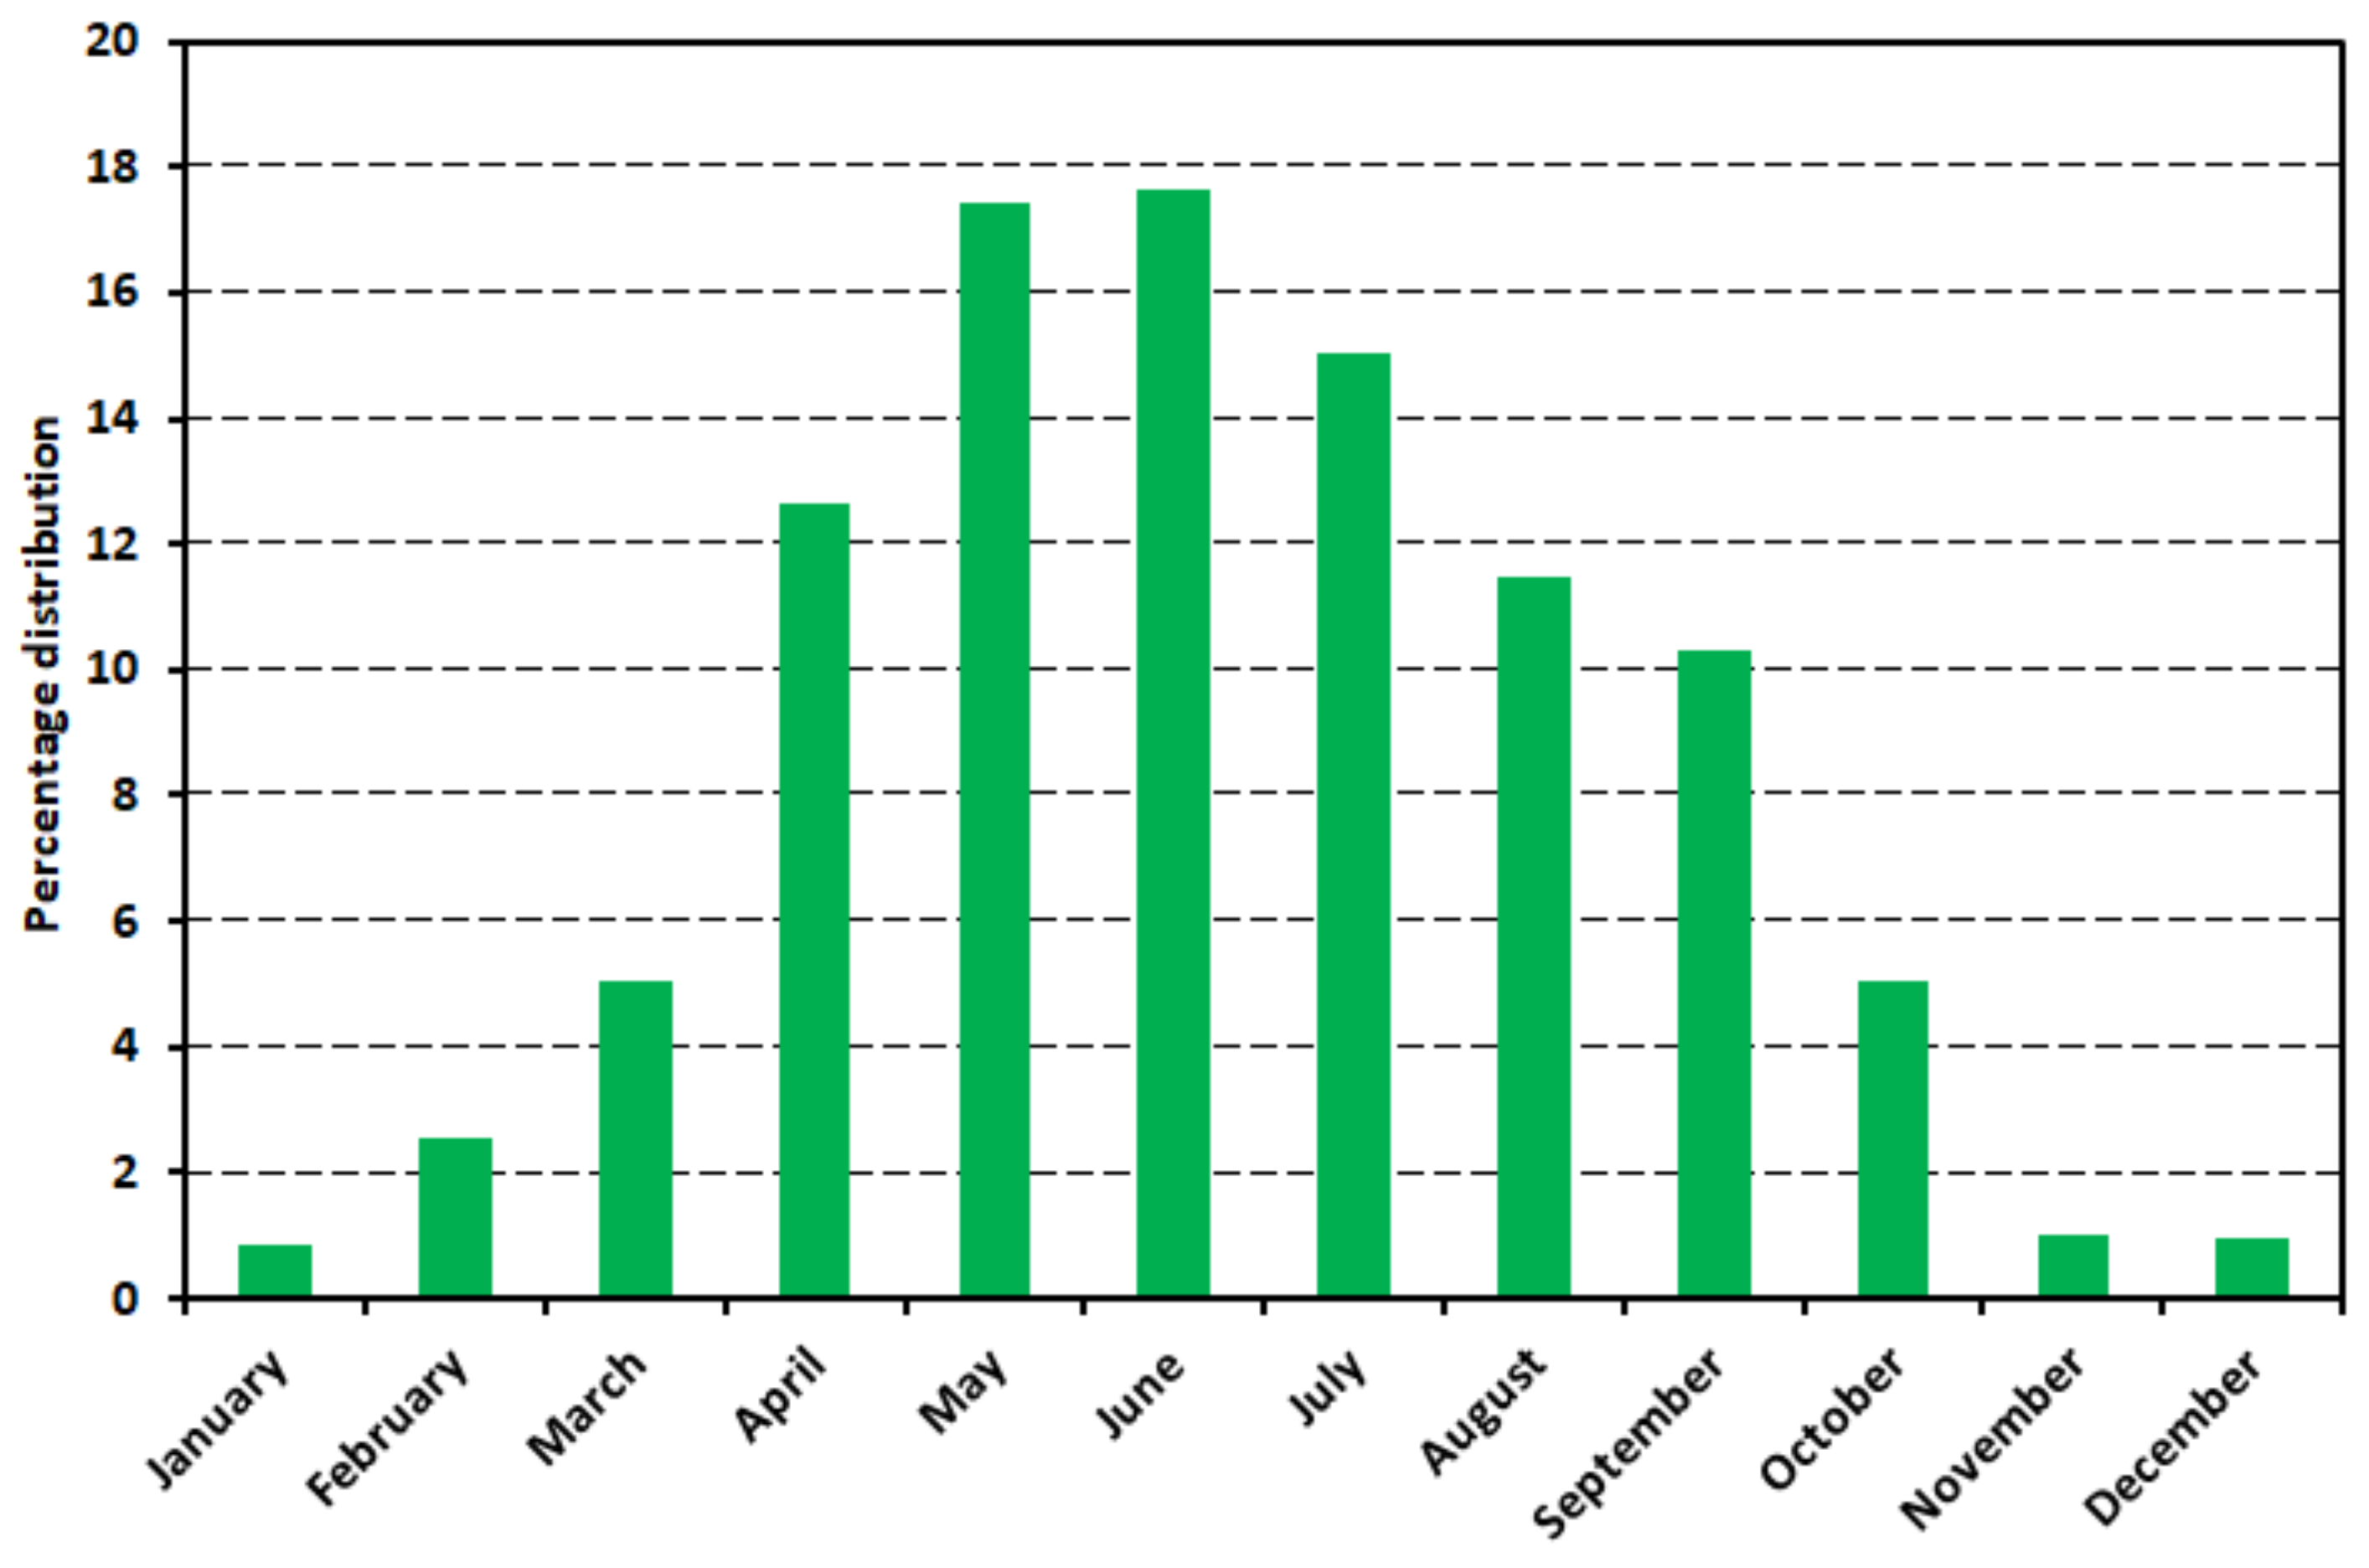
Figure 15 compares energy generation on a monthly basis in options IA and IB. Relative power distribution for each month is shown in
Figure 16.
The results of the simulations conducted on the power supply system confirm the preliminary prediction. As the substation load increases, the ability to absorb generated energy by the PV system increases. In the case of Grabówek, even with installed power of the PV system of 500 kW, it is possible to use more than 70% of energy that can be produced. In the case of the Dworzec substation, the use of the same energy is only possible with the PV system of 100–150 kW (
Figure 11). Introduction of a bilateral power supply (variant B) increases the ability to use energy. It has a noticeable impact on the Dworzec substation (variants II and III). As predicted, the use of the PV system energy potential depends on the upper limit of the generated voltage. This effect is as greater as the connection point of the PV system is weaker, and it is mostly noticeable for the variant IIIB. By analysing the monthly energy generation (
Figure 12,
Figure 13,
Figure 14 and
Figure 15), it can be noticed that the largest energy generation occurs in the months from May to July. At this time it is possible to cover most of the demand for the Grabówek substation by the PV system (
Figure 13). It should be added that the benefits of reconfiguration of the power supply (
Figure 14) are also most evident in these months.
5. Conclusions
In the presented paper, a new application of a PV energy system in public transportation is shown. It was proved that the solar energy can play significant role in the supply of traction systems. A Monte Carlo simulation is applied to consider the uncertainties of irradiation and random influence of road congestions.
Despite of uncertainties of irradiation and road congestion, the transportation system can consume more than 80% of the generated energy. The structure of the supply system plays an important role in solar energy absorption, because it determines the ability of absorption for generated energy. Whenever the bilateral supply of traction network is applied, it creates wider possibilities for generated energy flow. The generated output voltage of the PV system is another crucial factor for system efficiency. The optimal peak power of PV system depends on the local structure of traction system. The suggested values of PV system power depending on the traction system are shown in
Table 3. Presented values were calculated on the basis of the presented Monte Carlo model. In cases of lines with high density traffic and direct connection of PV systems to traction substations, the peak power of solar systems could be at the level of 400–500 kW. The solar systems can be connected to the traction supply systems in other places, but using less power. The power of the photovoltaic system should be matched to the structure and local operating conditions of the power supply system. In case of areas with weak network structure (e.g., long supply cables), transmission losses are significant and limit the absorption capacity to 40–50 kW. Summing up, the optimal solar system power depends in a wide range on the local structure of the power system and traffic conditions.
Thanks to smart grid solutions and PV systems electric traction supply systems are no longer passive energy receivers; they can become a dynamic link between the power systems. Public transport power systems may play an active role in creating power clusters, which constitute elements of modern intelligent power systems.


