Abstract
With the advent of Distribution Phasor Measurement Units (D-PMUs) and Micro-Synchrophasors (Micro-PMUs), the situational awareness in power distribution systems is going to the next level using time-synchronization. However, designing, analyzing, and testing of such accurate measurement devices are still challenging. Due to the lack of available knowledge and sufficient history for synchrophasors’ applications at the power distribution level, the realistic simulation, and validation environments are essential for D-PMU development and deployment. This paper presents a vendor agnostic PMU real-time simulation and hardware-in-the-Loop (PMU-RTS-HIL) testbed, which helps in multiple PMUs validation and studies. The network of real and virtual PMUs was built in a full time-synchronized environment for PMU applications’ validation. The proposed testbed also includes an emulated communication network (CNS) layer to replicate bandwidth, packet loss and collisions conditions inherent to the PMUs data streams’ issues. Experimental results demonstrate the flexibility and scalability of the developed PMU-RTS-HIL testbed by producing large amounts of measurements under typical normal and abnormal distribution grid operation conditions.
1. Introduction
The emergence of new cyber and physical technologies in smart grids including distributed energy resources, transportation electrification, and modern communication networks in connected environments, add more complexity to power distribution networks. Using high resolution and accurate measurement devices such as Distribution Phasor Measurement Units (D-PMU) and the recently introduced Micro-Synchrophasors (Micro-PMU) [1] expand the situational awareness toward distribution levels and the grid edges. Moreover, an effort for developing an open source low-cost PMU device is presented in [2,3]. The actual data from D-PMUs enable visualization and observation of phenomena, which were not observable with past technologies. This leads to novel applications in power distribution networks [4]. Recent works show the advantages of using D-PMU data for distribution network topology detection [5,6,7], distribution state estimation [8,9], phase label identification [10], fault detection [11,12], and network modeling [13].
Therefore, the emerging need for high resolution and time-synchronized measurement data brings more attention to the need for realistic simulation environments to designing, testing, and validating D-PMUs. As opposed to classic system studies, the implementation of hardware-in-the-loop (HIL) testbeds enables proof of concept and experimental validation of different hardware and software solutions [14]. These HIL configurations combine digital real-time simulators for calculation while interacting with the actual physical devices [15,16].
Few HIL testbeds have been developed for the purpose of testing synchrophasor devices being mostly at the transmission level. For example, in [17,18], a real-time hardware-in-the-loop setup is proposed for compliance testing, where reference signal is generated by a Simulink model and amplified to be sensed via potential transformer (PT) and current transformer (CT) for the device-under-test. This setup lacks time synchronization between signal source and the PMUs, leaving the overall procedure for static compliance testing unsynchronized. In the case of dynamic testing, PMUs are synchronized via Inter-Range Instrumentation Group-Time Code Format B (IRIG-B) signals from a grandmaster clock as a one time-synchronization source. An additional calibrator device is producing the reference phasors with a GPS clock accuracy of ±100 ns. Typical dynamic testing principles to obtain frequency error (FE), rate of change of frequency error (RFE), total vector error (TVE), as well as response related rates (e.g., delay, overshoot) are positive/negative frequency ramp and magnitude steps or unbalanced magnitude steps. The National SCADA testbed (NSTB) [19] focuses on potential cyber attacks to the communication infrastructure at the transmission level. The testbed has an HIL configuration with RTDS for simulating power systems along with established industry communication structures. The National Renewable Energy Laboratory (NREL) has developed a testbed that emulates the communication and power distribution networks able to interact with field equipment [20]. In [21], a wide-area-monitoring-system cyber-physical testbed was developed that has an HIL-based simulation with different communication protocols and PMU from different vendors. Tests were developed in a 9-bus transmission simulated system. A SCADA software/hardware testbed with RTDS and Opal-RT used as real-time simulators were proposed in [22]. The testbed has three real PMUs as part of their HIL configuration. It also has a variety of substations’ communication protocols and a number of PDCs for the measurements streams. The testbed in [23] includes substation communication layers for distribution and transmission networks. Work in [24] presents an HIL testbed using RTDS with real PMUs from different vendors with real-time streams to virtual PDCs. Another initiative is presented in [25], with a GPS signals and PMU streams that are fully simulated capable of streaming with different established communication protocols. A cyber-physical system was introduced in [26] where the communication layer and the power systems were virtually simulated with OPNET and RT-LAB (Opal-RT), respectively, while the cyber-physical structure was simulated with MATLAB. In [13], a PMU framework with real-field data was used to validate the synthesized network modeling proposed in [27]. Comparisons between a simulated model in Opal-RT and real-field measurements were presented.
From the discussion above, it can be observed that related works are based on an HIL configuration to emulate most of the real-field scenarios inherent to power systems and in some cases with the communication infrastructure that collects and distributes data and/or control signals to the different intelligent electronic devices (IEDs) in the network. However, to the knowledge of the authors, none of the available works have been specifically focused on time synchronization issues and the integration of actual and virtual PMUs for power distribution level while considering the impact of latencies in the communication infrastructure and multi-vendors GPS, PMU hardware and firmware interoperability issues. The deployed PMUs in the field and their data sets show many issues regarding data quality even under normal daily operation (e.g., loss of GPS synchronization, GPS antenna malfunction, firmware bugs, etc.) [4]. Moreover, different vendors present their PMU solutions with various firmware, time reference, and phasor computation algorithms with confidential setting for firmware. Therefore, the proposed HIL configurations in this paper with actual and virtual PMU streams helps with exploring the impact of data accuracy and quality of D-PMU measurement data. Additionally, the effect of data traffic and time latencies in PMU streams becomes important when typical smart grid challenges such as mitigating transient stability issues and performing state estimation have latency requirements of 100 ms to 1 s [28]. Adhikari et al. [21] suggest that the lack of suited HIL testbeds is an impediment for creating industry-level standards for hardware, software, PMU components, and protocols.
The experimental setup presented in this paper also builds realistic validation scenarios using distribution network models with real and virtual PMU data streams. Our testbed (hereafter referred to as PMU-RTS-HIL) is a fully time-synchronized network of commercial PMUs different vendors acquiring real-time measurements using Opal-RT real-time simulator and hardware-in-the-loop setup. Our main contributions are listed as follows:
- First, we have built a time-synchronized and scalable environment that includes multiple PMUs from different vendors coupled with multiple virtual PMUs, in a hybrid hardware-in-the-loop-software-in-the-loop (HIL-SIL) configuration. This is a non-trivial task as synchronization is required between the model in the real-time simulator (RTS), the input/output interfacing (FPGA), and the GPS clock signals of virtual and real PMUs. This setup replicates the interoperability between a fleet of PMUs in an effort to compare ideal/reference and real-field cases for resilient and reliable distribution monitoring systems.
- Second, we have developed the setup of a simulated communication layer that resembles the traffic and latencies inherent to our hybrid network of virtual and physical PMUs’ data streams. It is crucial to study the impact of time delays on synchrophasor data flows for operational applications by comparing ideal measurement devices (virtual PMUs) and the actual PMUs from different vendors. Moreover, additional latencies caused by different firmware, computing algorithms and time references may be observed.
- Third, the recent emphasis on PMU based applications for power distribution network brings more need for developing an environment to study different aspects of a cyber-physical network of PMU devices. The proposed PMU-RTS-HIL testbed will fill the gap for such developing environments and help researchers to create and test more PMU based algorithms.
- Fourth, the proposed PMU-RTS-HIL makes it possible to compare actual PMU from different vendors and validate their performance.
The rest of this paper is organized as follows: in Section 2, we give an overview of the components used and architecture for the development of the PMU-RTS-HIL testbed. Section 3 provides application results performed with the PMU-RTS-HIL testbed with detailed explanation and discussion of the testbed capabilities. We finalize the paper with our tests’ conclusions in Section 4.
2. PMU Real-Time Simulation Hardware-in-the-Loop (PMU-RTS-HIL) Testbed Architecture
This section presents the technical overview of the PMU-RTS-HIL testbed, the components used for the setup and capabilities beyond our preliminary experimental results. In general, the fundamentals of the PMU-RTS-HIL testbed consist of the following specifications:
- Real-time power system model setup: the PMU-RTS-HIL testbed consists of an experimental setup providing realistic scenarios in a distribution test feeder model with a network of time-synchronized actual and virtual PMU data streams using hybrid real-time simulation capabilities.
- Communication network: the PMU-RTS-HIL testbed includes a communication layer resembling wide area monitoring systems (WAMS) such as PMU, and a Phasor Data Concentrator (PDC) to emulate real-field measurements in distribution networks. More importantly, a simulated communication layer infrastructure was developed to measure and analyze latencies and traffic congestions of the PMU streams.
- Streaming Data Analysis and Data Repository: The ultimate goal of the PMU-RTS-HIL testbed is building a data repository for data mining and analysis from the real-time platform implemented in HIL and SIL. This stage includes the database setup for the storage of the events monitored.
2.1. PMU-RTS-HIL Setup Overview
Figure 1 shows the configuration of the evaluation framework for the experimental setup of real-time PMU data streaming under fault conditions. A real-time simulated distribution grid (e.g., IEEE test feeders [29]) was modeled in the multi-core Opal-RT real-time simulator provided by the SmartEST facilities. The RTS target is connected to three PMUs from different industry established vendors. Additionally, there are a total number of six virtual PMUs (vPMUs) using a PMU model provided by Opal-RT company that complies with the C37.118 communication protocol.
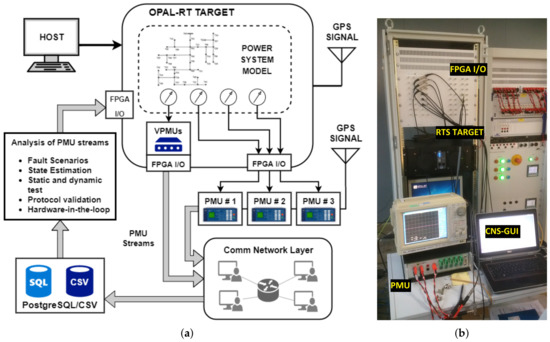
Figure 1.
PMU - Real Time Simulation - Hardware-in-the-Loop Testbed (PMU-RTS-HIL): (a) schematic connection diagram; (b) physical setup.
The network of virtual and actual PMUs operates under normal conditions prior to possible occurrence of different fault types (balanced and unbalanced), changes in frequencies, normal and abnormal switching, etc. To obtain random scenarios for analysis, detection and classification testing purposes. Signals coming from the real-time environment can be obtained from the FPGA OP5142 console on the target. Virtual and real PMUs stream under a full time-synchronized environment for measurement comparison purposes. The communication setup complies with the IEC 61850 and the phasor magnitude, and angle measurements are then streamed under the IEEE standard C37.118 protocol. In order to understand the communication dependencies of fault detection and/or other abnormal distribution side events, a communication network layer is simulated resembling the different physical latencies experienced when sending real-field measurement data. The PMU-RTS-HIL testbed used the network layer under the CORE environment provided by SmartEST. An open-source phasor data concentrator (i.e., OpenPDC) is used to retrieve the synchrophasor readings and store them in the database with support for free alternatives such as PostgreSQL. Figure 1b shows an actual picture of some components of the testbed: the RTS target and its FPGA I/O console, the graphical user interface for the CNS, and an actual PMU used for the experiments.
2.2. Reference Clock and Synchronization
In order to develop a HIL-SIL testbed environment, GPS and computational environment clock synchronization becomes key for the integration of real and virtual PMUs. A first attempt to have synchronized environment was using a one PPS-based signal from a GPS antenna via SMA connector, signaling using NMEA data stream to the serial PC port. However, the RTS drivers did not support the additional NMEA stream tagging the UTC timestamp for the card. Therefore, this setup was able to provide time synchronization within nanoseconds (ns), but without knowing any UTC time reference. Given this limitation, this setup was discarded.
A Precision Time Protocol (PTP)—defined in the IEEE 1588 standard—is a network-based standard that provides nanoseconds of synchronization making it a perfect fit for PMU synchronization applications. Therefore, one of the most used approaches for different time clocks synchronization is to utilize a GPS-locked PTP Master for generating a clock standardized signals while a network interface card synchronizes the different local hardware clocks [30]. In the PMU-RTS-HIL testbed, a RSG2488 Ruggedcom [31] functions as an IEEE 1588 master clock. In order to synchronize the Opal-RT real-time simulator (RTS) and the virtual PMUs with real PMUs, it is necessary to use a high precision oscillator like the Oregano syn1588® PCIe NIC with OCXO Oszillator PCI-express card. This enables the real-time target to use the IEEE 1588 based time synchronization of the given time clock (e.g., GPS) with the needed precision. This configuration makes the system more accurate than utilizing regular Network Time Protocol (NTP). Since the real-time simulation also uses FPGA output for the real PMUs to provide voltages and currents, the FPGA hardware is connected via an adapter card to the oscillator. Finally, when the real-time simulation is configured to use the FPGA clock, it enables the simulation (virtual PMU-C37.118 slave) and the analog output to be synchronized to the given external time source. As shown in Figure 2, the GPS antenna is directly wired to the Siemens Ruggedcom RSG2488, generating the PTP signal. The Oregano card syn1588® PCIe NIC was installed in the RTS target in order to provide the correct timestamps to the internal clock adapter. The clock signal is fed to the internal clock adapter and then transmitted through the Real-Time System Integrator, which is used to share and exchange timing and control signal between the devices and the simulation. The same clock signal is used by the FPGA OP5142 to produce a full-synced environment for virtual and real PMUs to be tested. As an example, Figure 3 depicts the phasors measurement before the Oregano card time-synchronization was integrated in the testbed. It can be observed that they are not in synch if the RTS system and the virtual PMU are not locked to the same clock.
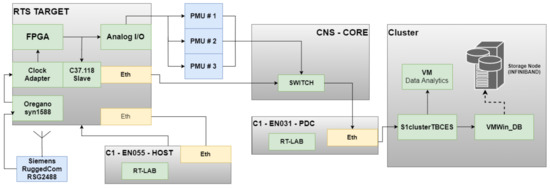
Figure 2.
Synchronization and communication network setup for synchronized simulation and analog output to GPS clock.
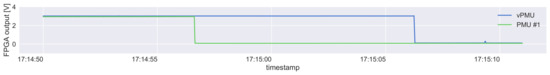
Figure 3.
Non-synchronized step response of virtual and real PMUs.
2.3. Communication Network Model
The PMU-RTS-HIL testbed is capable of streaming real-time data through a communication infrastructure as shown in Figure 2. The RTS target and host take charge of the real-time response computation of the power system model and transmit measurements via the FPGA I/O interface to the physical PMU devices while an Opal-RT PMU virtual block assigns an IP address to each one of the virtual PMUs in the power system model. Each stream complies with the C37.118 communication protocol and then goes through the communication network simulation (CNS). To make the behavior of the communication layer more realistic, the communication network emulator CORE (Common Open Research Emulator) [32] is used to model the network topology shown in Figure 4. The CORE is a powerful and feature rich emulator that was first developed by the Boeing Research and Technology and now is being maintained and further developed by the US Naval Research Laboratory. The CORE runs in real time and further provides the capability to connect the emulated network with a physical network. Under the hood, CORE exploits the virtualization capabilities available in most Linux-based operating systems and each of the components in a network model being emulated with the CORE is rendered as a Linux container (LXC/LXD).
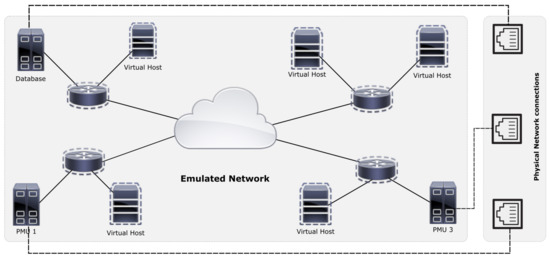
Figure 4.
The communication network model consisting of different subnets with virtual (dotted outlined) and real hosts. These subnets are connected to each other through routers. The cloud here is used to represent a wide area network. The Ethernet port schematic shows the nodes that are connected to the physical nodes.
The model (see Figure 4) consists of different subnets with virtual (represented with dotted outline) and real nodes. These subnets are connected to each other through (virtual) routers. The cloud represents a wide area network. For this setup, the model was developed with full IPv4 protocol stack. Furthermore, the three real nodes (labeled PMU 1, PMU 3 and Database) represent the PMU #1 and #3 and the OpnePDC database host, and are physically connected to them through the USB Ethernet adapters on the host machine. All traffic including the C37.118 streams from these physical nodes passes through the emulated network and thus the communication parameters set for the emulated network affect the communication behavior in the physical network. For PMU-RTS-HIL, we have used CORE to evaluate different network scenarios. Moreover, the CNS setup was implemented to emulate the real distribution network latencies. Bandwidth, packet loss and collisions may be applied to the PMU data streams in order to evaluate the impact on delay and availability of the data. Delay time are measured as time difference between creation (measurement timestamps) and creation of the tuple in the database. This feature was developed in order to test various effects such as the output adapter batch processing parameter, which has a direct influence on the round-trip time of the data streams. All data is gathered in a Phasor Data Concentrator (PDC), which arranges it for their storage in the database. Finally, a data repository environment was built in a virtual machine in a Cluster with a database managed through PostgreSQL along with a local CSV historian. This virtual machine also serves as a working station for data analytics.
2.4. Streaming Data Repository and Data Analysis
The streaming data repository and analysis are shown in Figure 5. The AIT Energy Cluster provided the necessary processing capabilities to store and analyze PMU data streams from OpenPDC or direct measurements. The scalable network file system is based on GlusterFS, a large distributed storage solution for data analytics and other bandwidth intensive tasks. Interconnection is provided via fast high bandwidth networks, based on Infiniband technology.
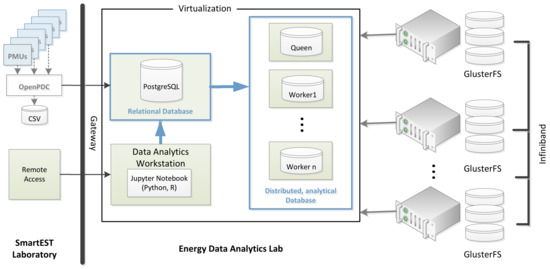
Figure 5.
Data processing in the AIT Energy Data Analytics Cluster, with a conventional relational and the option for distributed, analytical database for real-time processing capabilities.
The OpenPDC software was used for concentrating and streaming phasor data taking input streams from PMUs with various settings and protocol standards. It was also used to convert and stream PMU data to various connectors, namely PostgreSQL, local historian and CSV file. The graphical interface and visualization supports the setup and verification of the experiments performed. The cluster provides also a commercial distributed, analytical database for real-time analysis capabilities.
In order to analyze the data by performing statistical analysis and visualization, the user group used mainly two different open source software programs: Python and R. These tools provide live code, equations, visualization and comments on the codes used for the analysis. It is perfect for understanding and visualizing different programming languages in a fast and legible manner.
2.5. Scalability and Flexibility
In this section, we discuss the PMU-RTS-HIL has shown flexibility and scalability to model different power systems models and power quality events while supporting real PMU devices from diverse manufacturers.
Scalability of the testbed depends on the specific module as follows:
- Real time simulator: Relationship between the number of nodes vs. the number of cores is basically nonlinear as it depends on a lot of factors (e.g., simulation time step), especially with the usage of SSN (State Space Node) solver. Since this part of the testbed is a commercially available RTS, there are various options to scale up the necessary computational requirements for larger networks.
- Real PMUs: The connection to the RTS is realized via analog output channels of the system’s FPGA. In the case of 2 × 16 channels, a total of five real PMUs (six phasors per PMU) can be fully connected (voltage and current) or 10 PMUs if only the three phase voltages are connected.
- Virtual PMUs: There needs to be a distinction between the processing power to simulate the C37.118 slaves in real time and the bandwidth needed to communicate the streams. In the first case, it can be roughly assumed that 10 vPMUs can be handled per CPU core. In the latter case, again, a rough estimation for a report rate of 50, a need for 100 kbps, 200 kbps respective for a reporting rate of 100 per seconds can be assumed. This would theoretically lead to five PMU streams for a 10 Mbit network adapter or 50 PMUs for a 100 Mbit adapter [28]. If latency is also considered with respect to requirements of application requirements, it would be advisable to distribute streams among available adapters and limit them to a maximum of 10 per network card.
- Communication network simulation: CORE is practically scalable in the sense that a simulated network can be partitioned and distributed among multiple nodes, splitting and connecting them via network links. CORE is able to handle the emulation of several 100k packets per host.
- PMU Data Concentrator and database acess: OpenPDC is able to handle a reasonable number of phasors and can also be run on parallel hosts, thus scale is no problem. Handling the streaming to the database, it is a best practice to setup multiple output adapters in parallel, since each would have a separate database connector process. This makes it possible to parallelize database access as well.
Flexibility is possible by modeling different communication and electrical network scenarios. Besides the various ways of supporting tests as defined in the standard, the versatility is in the combination of different communication and electrical network scenarios and their impact on various applications. In [28], the latency and data requirements for smart grid applications give an idea of how the interdependency between communication and application influences the correct operation and how this testbed supports their validation. Further examples for flexible usage of the testbed are described in detail in the following Section 3.
3. Application Examples for the PMU-RTS-HIL Testbed Validation
In this section, we present some of the experimental setups performed to demonstrate the PMU-RTS-HIL testbed capabilities. We begin by presenting the synchronized phasor measurements. Then, we have included the analysis of use cases such as abnormal events (electrical faults), PMU streams’ latencies under the CNS, and the Rate of Change of Frequency (ROCOF). The use cases help in validating the PMU-RTS-HIL testbed by examining the D-PMUs performance in different applications. Table 1 summarizes the different experiments performed using the PMU-RTS-HIL testbed, which are detailed in the following sections.

Table 1.
PMU-RTS-HIL use cases’ capabilities.
3.1. Network of Synchronized PMU Measurements
The main goal of the PMU-RTS-HIL testbed is providing a fully GPS clock synchronized network of PMUs for measurement analysis. Figure 6 shows the different measurements obtained from the same phase by a vPMU and the three different physical PMUs used. The PTP signal is utilized to provide the same clock base between the physical PMUs connected to FPGA I/O console (HIL configuration) and the internal RTS clock streaming data coming from the vPMU.
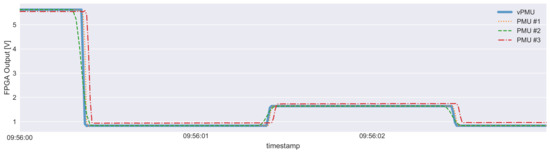
Figure 6.
Time synchronized magnitudes of one phase from one virtual and three real PMUs during a fault connected to the same node. The vPMU acts as the reference signal. Note: PMU #2 has a reporting rate of 50 and the other two a reporting rate of 100.
One of the challenges of setting up this configuration was encountered in the form of a ‘time gap’ of exactly 36 s between the virtual PMU and the real PMU measurements. Although they were perfectly synchronized with nanoseconds accuracy, they were not on the second base. This was due to the PTP using TAI as its time base—which includes leap seconds taking the slowdown of Earth’s rotation into account—whereas PMUs use UTC as their time base. Since the beginning of 2017, the UTC-TAI offset is −37 s [33], and older PTP driver stacks have still 36 s as in our setup. Even passing a parameter with an offset of 36 s to the Oregano driver will be ignored when running the oscillator card as a PTP slave. It was then discovered that the Grand Master Clock of the RSG2488 Ruggedcom becomes locked to the external GPS signal ignoring the UTCoffset configuration mentioned previously, and hence passing the TAI timestamp to the RTS. The problem was assessed in a post-processing step where the virtual PMUs were shifted backwards in time by 36 s in order to sync TAI and UTC based timestamps.
3.2. Sequence of Fault Events Simulation with Test Automation Script
The PMU-RTS-HIL testbed is able to simulate different power systems models and a number of fault events powered by an API Python environment. Test automation scripts control the number and type of faults created along with different parameters such as fault impedance, location and duration.
Presented first in [34], the IEEE 37-Nodes Test Feeder (see Figure 7) is part of a testbed composed of several real-life test feeders that provides the essential components and characteristics of a distribution system such as unbalanced load conditions and a considerable number of nodes and laterals. In order to show some of the capabilities of the PMU-RTS-HIL testbed, different experiments were performed using this test feeder model.
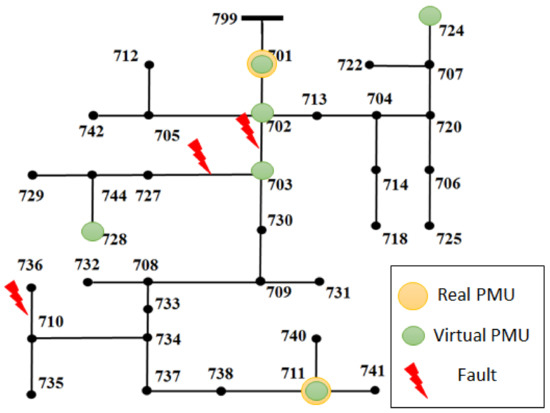
Figure 7.
One-line diagram of the IEEE 37-Nodes Test Feeder [34].
Figure 8 and Figure 9 show the IEEE 37-nodes test feeder model and the PMU models in RT-Lab/Simulink environment, respectively. The model consists of the Simulink prototype of the test feeder that uses the state-space nodal solver (SSN). As this solver uses state-space equations, it can be used for delay-free parallelization with higher order discretization [15]. Consequently, the SSN solver splits the model into sections, each assigned to one core in the RTS target.
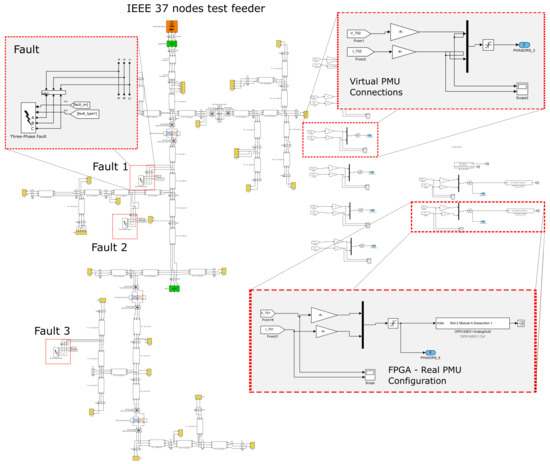
Figure 8.
IEEE 37-nodes test feeder Opal-RT Model. The model is split into five subparts with the Opal-RT SSN solver configuration. Connectors for the virtual PMUs and the FPGA analog outputs are on the right side.
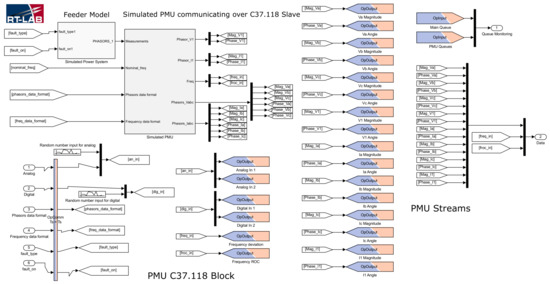
Figure 9.
RT-lab/simulink model for the PMU C37.118 slave.
Figure 8 shows the virtual and the real PMU configuration blocks used in RT-LAB environment. With this setup, the node measurements become outputs in the FPGA OP5142. Each PMU has its own configuration such as IP address and port designation utilizing a C37.118 protocol. Figure 9 shows a look inside the subsystem formed by all virtual PMUs used in the experiments. The PMUs are setup with a 100 samples per second reporting rate and the measurements are stored by PostgreSQL on a virtual machine in Cluster and also in a local CSV historian. This interface is used to obtain the data set with different fault scenarios and results for identifying faults based on the PMU measurements.
The PMU-RTS-HIL testbed uses the 37-Nodes test feeder model for simulating fault sequences of different types, locations and impedances to generate a dataset, which is used to analyze change frequency during the power disturbances. Additionally, the test feeder was used to create a data repository that may be used for machine learning algorithm validation. The RTS is capable of using an API in Python to perform automated sequences such as controlled switching, creating faults, changing loads, etc. As an example, a combination of different fault scenarios was created with the following parameters:
- Fault location: lines 702–703, 703–727 and 710–736.
- Fault types are line-to-ground, line-to-line and all three-lines-to-ground, A–G, A–B and ABC–G, respectively.
- Fault distance on the line: faults are placed the lines having an impact on the fault impedances.
- Fault impedance to ground: 0 Ω, 5 Ω, 10 Ω, 25 Ω and 50 Ω.
Figure 10 shows the time series of the fault sequences for different fault scenarios for the real and simulated measurements. In can be observed that a fault sequence has been introduced to the system from second 23:05:45 until second 23:05:47, where the system is running under normal operation conditions. Then, a single-line-to-ground takes place in phase A, showing the a voltage drop, which then follows by a line-to-line fault (phases B and C) and a three-phase-to-ground, consecutively. It is worth noting that all measurements are fully synchronized between different PMU vendors and the virtual PMU built in real-time environment.
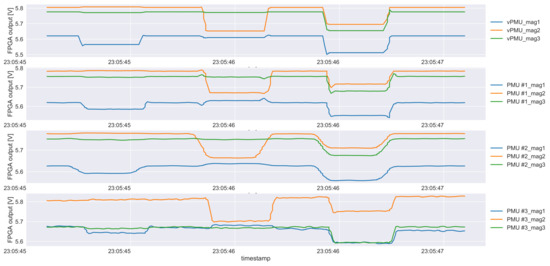
Figure 10.
Fault scenario sequence: vPMU measurements; PMU #1 measurements; PMU #2 measurements; PMU #3 measurements.
It is worth noting that the upper time-series in Figure 10 shows the virtual PMU measurements depicting a steeper and cleaner transition between fault events and states. The three other graphs below show the real PMU measurements taken in an HIL setup. The difference in the transitions is due to different signal processing algorithms of the devices and their communication module.
Figure 11 shows two different sets of fault sequences, where it can be seen that vPMUs and PMUs #1 and #3 present a similar behavior following the sequence consistently. However, some problems with the correct configuration of PMU #2 have been encountered. It is not possible to use the high sensitive analog inputs together with the PMU streaming functionality of the device. Therefore, the measurements were taken from a low voltage range ( V) provided by the FPGA I/O, which translated into oscillations of V. This is depicted in the bottom panel of Figure 11. This issue was confirmed by the PMU vendor and is currently working on a firmware that allows the PMU to stream data while using the analog inputs.
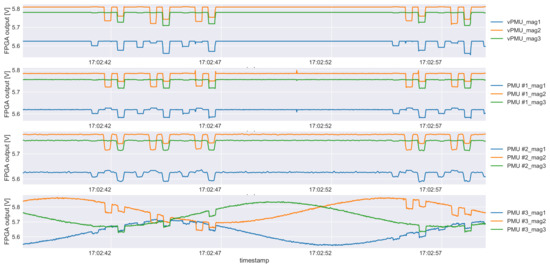
Figure 11.
Comparison of measurements of three real PMUs and vPMU under a 50 Ω impedance fault.
Simulated measurement quantities need to be scaled to match the analog output voltage range capabilities of the FPGAs. Phasors are defined as sinusodial waveform: and represented as Phasor:
where the magnitude is and and denote the complex values in rectangular form. Defining the magnitude of the simulated quantity as and the desired range at the analog output as V, we need a scaling factor of
For the measurement range transformation, for example, the scale for the network model used for the fault use case was calculated as s = 15 V/ kV has been used.
3.3. Communication Network Simulation Analysis
The PMU-RTS-HIL testbed includes an emulated communication layer that is capable of introducing behaviors such as the packet loss, latencies, and collisions in addition to validating different topologies and protocols with a modeled communication infrastructure. As stated in Section 1, different operation events require different response latencies, making this layer an important part when observing PMU-grid interaction dynamics.
The experiments were carried out by configuring the communication emulation with varying parameter value for e.g., bandwidth and latencies and/or emulating the scenario when background traffic is generated between the hosts. The measurements were performed while changing the state of the power grid through the change in the power Opal-RT/FPGA Output sequence triggered in the console as shown in Table 2. The effects of altering the communication parameters are perhaps more visible in terms of communication delay. To evaluate this hypothesis, the potential time delay and availability of measurements to upstream processing are measured and recorded by calculating the difference between the timestamps of the measurement and the timestamps of the respective database tuple (when the record is written in the database). These recorded results are then used for further analysis. A subset of these results can be seen in Figure 12.
Table 2.
Opal-RT/FPGA power output sequence for CNS.
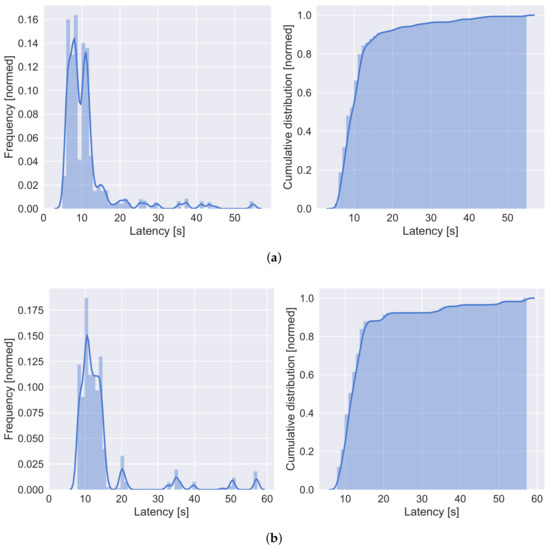
Figure 12.
Example of analysis of measurement delays: Histogram and fitted distribution probability of delay between measurement creation and database storage (left) and cumulative distribution of measurement delays (right) for (a) PMU #1 and (b) PMU #3.
For this experiment, the communication model was emulated with full IPv4 protocol stack. There were no additional or artificial delays in the model. All the communication links were set as per IEEE 802.3-2008 Gigibit Ethernet (full-duplex having a bandwidth of 1 Gigabit). The virtual host remains idle for most of the emulation time and there was no noticeable background traffic. The physical network that was used as the part of the emulated network consisted of two PMUs, a control terminal and a switch. The host machine had multiple USB Ethernet adapters through which respective nodes were connected to the emulated network.
The database was configured to tag a new record with a ‘created’ timestamp. The time difference to the phasor timestamp enables the analysis of queuing times and gives a first estimate of average processing times and data availability. Effects like the PDC output adapter batch processing parameter (e.g., 1000 data points per batch insert) have direct influence on the round-trip time and need to be configured.
As an example, Figure 12a,b show the histogram and fitted probability distribution as well as the cumulative distribution of the time delay when PMUs #1 and #3 are streamed via the CNS. It could be seen that both PMUs have similar characteristics of the round-trip time. The important insight here is the random occurrences of higher delays, which have direct impact on the processing distribution system application. To evaluate the impact of the communication network on the delay, the experiment has been repeated with different communication channel properties (e.g., packet collision and loss).
3.4. Rate of Change of Frequency (ROCOF)
In addition to the proposed experimental setups, the PMU-RTS-HIL testbed is capable of performing static and dynamic compliance testing of PMUs according to “IEEE C37.242-2013 IEEE Guide for Synchronization, Calibration, Testing, and Installation of Phasor Measurement Units (PMUs) for Power System Protection and Control”. The virtual PMU can act as a reference, since it provides exact values of the real-time simulated quantity.
One of the standardized tests is the “Rate of change of frequency” (ROCOF), which certifies that the PMU measurements comply with specific rates for reporting changes in the power grid’s frequency. The PMU-RTS-HIL testbed is capable of performing the ROCOF along with communication network simulation, which plays an important role if time delays and latencies are present. When it comes to real setup, additional communication delays are introduced according to the communication network properties, e.g., a frequency control system (e.g, primary control reserve), which takes in the frequency changes from the PMU network. The total delay and quality of service of the network communication influences the dynamic and stability of the control loop.
A typical setup to test signal reporting characteristics (e.g., latency) of the “Rate of Change of Frequency” (ROCOF) measurement propagation as part of a frequency control system is depicted in Figure 13. It consists of a frequency reference signal generator that is connected to a power amplifier stage (e.g., Spitzenberger and Spieß PAS 1000 in order to have real-field network voltage levels, PMUs and the communication network simulation that models the network for data streams to the analysis, storage and processing platform. Additionally, a trigger is created to tag the exact start time of the frequency change for evaluation of the latency. As shown in Figure 13, the frequency signal is propagated by the linear operating amplifier, with neglectable signal latency run-times, and then sensed by the PMU devices. A phasor data concentrator (e.g., OpenPMU) is configured to store the frequency responses in a database (e.g., PostgreSQL).
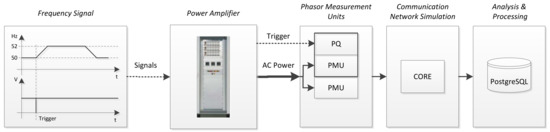
Figure 13.
Setup for testing with mains voltage levels by connecting PMUs to AC Power amplifier for e.g., ROCOF test.
For the test sequence, the frequency signal is programmed to start with 50 Hz to change frequency by 2 Hz increase for a one second wait for 10 s and reduce by 2 Hz within 1 s. Figure 14a shows the ramp stage of the frequency (in Hz) during the ROCOF test while Figure 14b shows the rate of change (, Hz/s). In both figures, various signal processing problems are shown (e.g., spikes, oscillation, magnitude), which has been discovered during the test as part of the development support and which have been reported back and fixed by the vendors accordingly.
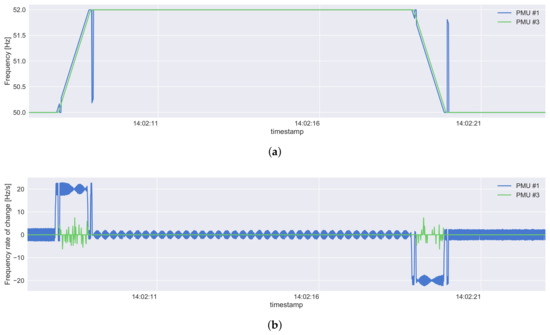
Figure 14.
ROCOF Test: (a) resulting frequency measurements of two PMUs following a frequency ramp; (b) resulting frequency delta/deviations of two PMUs following a frequency ramp. Note: This example shows signal processing errors that have been reported and fixed as part of the validation test.
3.5. Machine Learning Application: PMU-Based Fault Detection
In addition to the previously mentioned applications, the testbed can be utilized to generate large datasets to implement novel PMU-based machine learning algorithms.
In order to validate the testbed capabilities, we present an experiment for comparing the PMU-RTS-HIL testbed with the work developed by the authors in [11]. The authors developed a hierarchical clustering novel algorithm based on simulated PMU measurements. The algorithm is based on a shape-preserving algorithm that obtains similarity distances under the Fisher–Rao metric that are used to detect and identify electrical faults in a distribution system. The details of the algorithm go beyond the scope of this paper and the authors would like to refer the reader to [11]. Therefore, we would present the differences in technical and physical setups of the experiment to validate our testbed’s time-synchronized and HIL capabilities.
In [11], a non-Opal-RT state-of-the-art real-time simulator was used to model the IEEE 13-nodes test feeder. We have developed a setup that resembles the mentioned experiment for the IEEE 37-nodes test feeder case. For comparison purposes, Table 3 shows the different setup utilized for the fault detection experiment. Our proposed testbed (Case 2) includes 3 well-established industrial physical PMUs with GPS time synchronization. Additionally, it includes the communication layer simulated in CORE with IEEE C37.118 standard compliance. In contrast, case 1 does not have real PMUs connected and no communication layer. Furthermore, in case 1, fault detection was performed with voltage and current magnitudes only whereas the PMU-RTS-HIL provides the phasor measurement with both magnitude and angle values.
Table 3.
IEEE 37-nodes test feeder modeling for fault detection under different platforms.
PMU measurements in both setups were used to feed the machine learning algorithm and classify their fault type. Approximately 300 fault events were created with three different fault types: single-line-to-ground, line-to-line and three-line-to-ground. In case 1, only voltage and current magnitudes were used when using the fault classification algorithm. Measurements with the proposed PMU-RTS-HIL consisted of both magnitudes and angles of the voltage and current signals. Table 4 shows the total prediction error for both experiment setups. The total prediction error (TPE) is defined as follows:
where ME is the misdetection error and FAE is the false alarm error. It can be observed that the proposed PMU-RTS-HIL testbed gives a better overall classification of the fault type in the IEEE 37-nodes test feeder. Therefore, the PMU-RTS-HIL testbed can be utilized for machine learning applications while resembling real-field conditions that include communication and GPS synchronization.
Table 4.
Fault detection total prediction error.
4. Conclusions
In this paper, we presented a testbed that provides realistic scenarios of a distribution test feeder model with PMU data streams’ simulations. The primary objective was providing a testbed for the integration of multiple PMUs from industry established vendors. Moreover, the PMU-RTS-HIL has the time-synchronization capabilities of supporting virtual PMUs in an Opal-RT environment with actual physical PMUs under a unique clock reference. Utilizing different PMU devices from multiple manufacturers inherently introduces dealing with different sampling rates, configurations, calculation algorithms, and different time synchronization references. In the first experiments, different synchronization issues between the virtual and real PMUs were mitigated. For power systems applications, time synchronization is crucial and developing a testbed of real field resemblance should include precise time stamps.
Experimental results show that the PMU-RTS-HIL is capable of creating an experimental setup providing realistic scenarios in a distribution test feeder model with simulating PMU data streams using an HIL setup. As a result, different sequences of a large number of electrical fault events were created in a data repository for further pattern recognition analysis.
Evaluating response and propagation time of measurements have been intended to be evaluated with this experiment setup. An example application to be utilized with PMU data can be the frequency control (e.g., primary control) of (virtual) rotating masses (e.g., generators, batteries). The experiment shows that the testbed is capable of performing this setup in an accurate manner.
Introducing communication simulation/emulation using CORE has enabled various aspects and additional dimensions of evaluating PMU applications for distribution systems. In the realized setup, we could investigate directly the impact on delays and packet drops. More specifically, scenarios related to cyber security can be analyzed and evaluated in detail. A consequent step would be to evaluate directly the impact on communication on the application layer (e.g., state estimation, fault identification).
The PMU-RTS-HIL has been shown to be flexible in its capabilities and may be scalable to different power systems models and power quality events, while it can also support PMU devices from diverse manufacturers. The proposed testbed has been extensively used for providing development support for three PMU vendors. Functions as well as new protocol implementations can be tested under various simulated conditions. This includes protocol formats, streaming behavior and measurement validation. Moreover, the testbed provided useful insight for the RTS and PMU vendors, and helped to improve their application suite.
Acknowledgments
The authors would like to thank the AIT Austrian Institute of Technology, Vienna for hosting the Transnational Access and providing laboratory infrastructure. Additionally, the authors would like to thank the following companies for their technical assistance and support in equipment: Artemes, Opal-RT, Oregano, Power Standards Lab, and Siemens. This research has been performed using the ERIGrid Research Infrastructure and is part of a project that has received funding from the European Union’s Horizon 2020 Research and Innovation Programme under the Grant Agreement No. 654113. The support of the project ’European Research Infrastructure ERIGrid’ and its partner AIT is very much appreciated.
Author Contributions
Reza Arghandeh, Jose Cordova and Matthias Stifter conceived and designed the experiments; Matthias Stifter was responsible for testbed synchronization, data handling and processing, Jose Cordova for modeling and real-time simulation and Reza Arghandeh was coordinating and designing the experiment scenarios, together experiments have been performed; Matthias Stifter and Jose Cordova analyzed the data; Jawad Kazmi contributed communication network simulation tools and modeling; Jose Cordova and Matthias Stifter wrote the paper with substantial contributions from all authors.
Conflicts of Interest
The authors declare no conflict of interest.
Abbreviations
The following abbreviations are used in this manuscript:
| AIT | Austrian Institute of Technology |
| API | Application Programming Interfaces |
| CNS | Communication Network Simulation |
| CORE | Common Open Research Emulator |
| CSV | Comma Separated Values |
| CT | Current Transformer |
| DER | Distributed Energy Resource |
| D-PMU | Distribution Phasor Measurement Units |
| DRTS | Digital Real-Time Simulation |
| FE | Frequency Error |
| FPGA | Field Programmable Gate Array |
| FSU | Florida State University |
| GPS | Global Positioning System |
| HIL | Hardware-in-the-loop |
| HIL-SIL | Hardware-in-the-loop Software-in-the-loop |
| I/O | Input/Output |
| IAT | International Atomic Time |
| IED | Intelligent Electronic Devices |
| IRIG-B | Inter-Range Instrumentation Group - Time Code Format B |
| LXC/LXD | Linux Container |
| NIC | Network Interface Controller |
| NMEA | National Marine Electronics Association |
| NREL | National Renewable Energy Laboratory |
| NSTB | National SCADA Testbed |
| NTP | Network Time Protocol |
| Opal-RT | Opal-RT Technologies, Montreal, Canada |
| OPNET | OPNET Technologies, Inc, Maryland, USA |
| PCIe | Peripheral Component Interconnect Express |
| PDC | Phasor Data Concentrator |
| PHIL | Power Hardware-in-the-loop |
| PMU | Phasor Measurement Units |
| PMU-RTS-HIL | Phasor Measurement Unit Real-Time Simulation Hardware-in-the-loop |
| PMU-RTS-HIL | Phasor Measurement Units Real-Time-Simulation Hardware-in-the-loop |
| PPS | Pulse Per Second |
| PTP | Precision Time Protocol |
| RFE | Rate of Change of Frequency Error |
| ROCOF | Rate of Change of Frequency |
| RTDS | Real-time digital simulator |
| RTS | Real-Time Simulator |
| SCADA | Supervisory Control and Data Acquisition |
| SIL | Software-in-the-loop |
| SMA | Subminiature version A |
| SSN | State-Space Node |
| TAI | Temps Atomique International |
| TVE | Total Vector Error |
| micro-PMU | Micro Phasor Measurement Units |
| UTC | Coordinated Universal Time |
| vPMU | Virtual PMU |
| VT | Voltage Transformer |
| WAMS | Wide Area Monitori Ssystems |
References
- Meier, A.V.; Culler, D.; McEachern, A.; Arghandeh, R. Micro-synchrophasors for distribution systems. In Proceedings of the 2014 IEEE PES Innovative Smart Grid Technologies Conference (ISGT), Washington, DC, USA, 19–22 February 2014; pp. 1–5. [Google Scholar]
- Laverty, D.M.; Best, R.J.; Brogan, P.; Khatib, I.A.; Vanfretti, L.; Morrow, D.J. The OpenPMU Platform for Open-Source Phasor Measurements. IEEE Trans. Instrum. Meas. 2013, 62, 701–709. [Google Scholar] [CrossRef]
- Laverty, D.M.; Vanfretti, L.; Khatib, I.A.; Applegreen, V.K.; Best, R.J.; Morrow, D.J. The OpenPMU Project: Challenges and perspectives. In Proceedings of the 2013 IEEE Power Energy Society General Meeting, Vancouver, BC, Canada, 21–25 July 2013; pp. 1–5. [Google Scholar]
- Arghandeh, R.; Brady, K.; Brown, M.; Cotter, G.; Deka, D.; Hooshyar, H.; Jamei, M.; Kirkham, H.; McEachern, A.; Mehrmanesh, L.; et al. Synchrophasor Monitoring for Distribution Systems: Technical Foundations and Applications; North American SynchroPhasor Initiative: Albuquerque, NM, USA, 2018. [Google Scholar] [CrossRef]
- Cavraro, G.; Arghandeh, R. Power Distribution Network Topology Detection with Time-Series Signature Verification Method. IEEE Trans. Power Syst. 2017. [Google Scholar] [CrossRef]
- Cavraro, G.; Arghandeh, R.; Poolla, K.; von Meier, A. Data-driven approach for distribution network topology detection. In Proceedings of the 2015 IEEE Power Energy Society General Meeting, Denver, CO, USA, 26–30 July 2015; pp. 1–5. [Google Scholar]
- Arghandeh, R.; Gahr, M.; von Meier, A.; Cavraro, G.; Ruh, M.; Andersson, G. Topology detection in microgrids with micro-synchrophasors. In Proceedings of the 2015 IEEE Power Energy Society General Meeting, Denver, CO, USA, 26–30 July 2015; pp. 1–5. [Google Scholar]
- Cordova, J.; Faruque, M.O. Fault location identification in smart distribution networks with Distributed Generation. In Proceedings of the 2015 North American Power Symposium (NAPS), Charlotte, NC, USA, 4–6 October 2015; pp. 1–7. [Google Scholar]
- Li, W.; Vanfretti, L.; Chow, J.H. Pseudo-Dynamic Network Modeling for PMU-Based State Estimation of Hybrid AC/DC Grids. IEEE Access 2018, 6, 4006–4016. [Google Scholar] [CrossRef]
- Wen, M.H.F.; Arghandeh, R.; Meier, A.V.; Poolla, K.; Li, V.O.K. Phase identification in distribution networks with micro-synchrophasors. In Proceedings of the 2015 IEEE Power Energy Society General Meeting, Denver, CO, USA, 26–30 July 2015; pp. 1–5. [Google Scholar]
- Cordova, J.; Arghandeh, R.; Zhou, Y.; Wesolowski, S.; Wu, W.; Matthias, S. Shape-based data analysis for event classification in power systems. In Proceedings of the 2017 IEEE Manchester PowerTech, Manchester, UK, 18–22 June 2017; pp. 1–6. [Google Scholar]
- Zhou, Y.; Arghandeh, R.; Spanos, C.J. Online learning of Contextual Hidden Markov Models for temporal-spatial data analysis. In Proceedings of the 2016 IEEE 55th Conference on Decision and Control (CDC), Las Vegas, NV, USA, 12–14 December 2016; pp. 6335–6341. [Google Scholar]
- Mahmood, F.; Vanfretti, L.; Pignati, M.; Hooshyar, H.; Sossan, F.; Paolone, M. Experimental Validation of a Steady State Model Synthesis Method for a Three-Phase Unbalanced Active Distribution Network Feeder. IEEE Access 2018, 6, 4042–4053. [Google Scholar] [CrossRef]
- Faruque, M.D.O.; Strasser, T.; Lauss, G.; Jalili-Marandi, V.; Forsyth, P.; Dufour, C.; Dinavahi, V.; Monti, A.; Kotsampopoulos, P.; Martinez, J.A.; et al. Real-Time Simulation Technologies for Power Systems Design, Testing, and Analysis. IEEE Power Energy Technol. Syst. J. 2015, 2, 63–73. [Google Scholar] [CrossRef]
- Lauss, G.F.; Faruque, M.O.; Schoder, K.; Dufour, C.; Viehweider, A.; Langston, J. Characteristics and Design of Power Hardware-in-the-Loop Simulations for Electrical Power Systems. IEEE Trans. Ind. Electron. 2016, 63, 406–417. [Google Scholar] [CrossRef]
- Ibarra, L.; Rosales, A.; Ponce, P.; Molina, A.; Ayyanar, R. Overview of Real-Time Simulation as a Supporting Effort to Smart-Grid Attainment. Energies 2017, 10, 817. [Google Scholar] [CrossRef]
- Almas, M.S.; Kilter, J.; Vanfretti, L. Experiences with Steady-State PMU Compliance Testing Using Standard Relay Testing Equipment. In Proceedings of the 2014 Electric Power Quality and Supply Reliability Conference (PQ), Rakvere, Estonia, 11–13 June 2014; pp. 103–110. [Google Scholar]
- Kilter, J.; Palu, I.; Almas, M.S.; Vanfretti, L. Experiences with Dynamic PMU Compliance Testing Using Standard Relay Testing Equipment. In Proceedings of the 2015 IEEE Power Energy Society Innovative Smart Grid Technologies Conference (ISGT), Washington, DC, USA, 18–20 February 2015; pp. 1–5. [Google Scholar]
- Idaho National Laboratory (INL). INL Cyber Security Research—Idaho National Laboratory Research Fact Sheet; INL: Idaho Falls, ID, USA, 2005.
- National Renewable Energy Laboratory (NREL). Grid Modernization | Grid Simulation and Power Hardware-in-the-Loop. Available online: https://www.nrel.gov/grid/simulation-phil.html (accessed on 1 February 2018).
- Adhikari, U.; Morris, T.; Pan, S. WAMS Cyber-Physical Test Bed for Power System, Cybersecurity Study, and Data Mining. IEEE Trans. Smart Grid 2017, 8, 2744–2753. [Google Scholar] [CrossRef]
- Ashok, A.; Krishnaswamy, S.; Govindarasu, M. PowerCyber: A remotely accessible testbed for Cyber Physical security of the Smart Grid. In Proceedings of the 2016 IEEE Power Energy Society Innovative Smart Grid Technologies Conference (ISGT), Minneapolis, MN, USA, 6–9 September 2016; pp. 1–5. [Google Scholar]
- Sun, C.C.; Hong, J.; Liu, C.C. A co-simulation environment for integrated cyber and power systems. In Proceedings of the 2015 IEEE International Conference on Smart Grid Communications (SmartGridComm), Miami, FL, USA, 2–5 November 2015; pp. 133–138. [Google Scholar]
- Soudbakhsh, D.; Chakrabortty, A.; Annaswamy, A.M. A delay-aware cyber-physical architecture for wide-area control of power systems. Control Eng. Pract. 2017, 60, 171–182. [Google Scholar] [CrossRef]
- Aghamolki, H.G.; Miao, Z.; Fan, L. A hardware-in-the-loop SCADA testbed. In Proceedings of the 2015 North American Power Symposium (NAPS), Charlotte, NC, USA, 4–6 October 2015; pp. 1–6. [Google Scholar]
- Tang, Y.; Tai, W.; Liu, Z.; Li, M.; Wang, Q.; Liang, Y.; Huang, L. A Hardware-in-the-Loop Based Co-Simulation Platform of Cyber-Physical Power Systems for Wide Area Protection Applications. Appl. Sci. 2017, 7, 1279. [Google Scholar] [CrossRef]
- Mahmood, F.; Hooshyar, H.; Lavenius, J.; Bidadfar, A.; Lund, P.; Vanfretti, L. Real-Time Reduced Steady-State Model Synthesis of Active Distribution Networks Using PMU Measurements. IEEE Trans. Power Deliv. 2017, 32, 546–555. [Google Scholar] [CrossRef]
- Kansal, P.; Bose, A. Bandwidth and Latency Requirements for Smart Transmission Grid Applications. IEEE Trans. Smart Grid 2012, 3, 1344–1352. [Google Scholar] [CrossRef]
- Schneider, K.P.; Mather, B.; Pal, B.C.; Ten, C.W.; Shirek, G.; Zhu, H.; Fuller, J.; Pereira, J.L.R.; Ochoa, L.; Araujo, L.; et al. Analytic Considerations and Design Basis for the IEEE Distribution Test Feeders. IEEE Trans. Power Syst. 2017. [Google Scholar] [CrossRef]
- syn1588® PCIe NIC—Oregano Systems. Available online: http://www.oreganosystems.at/?page_id=71 (accessed on 1 February 2018).
- RSG2488—Industrial Communication Siemens. Available online: http://w3.siemens.com/mcms/industrial-communication/en/rugged-communication/pages/ruggedcom.aspx (accessed on 1 February 2018).
- Ahrenholz, J.; Danilov, C.; Henderson, T.R.; Kim, J.H. CORE: A real-time network emulator. In Proceedings of the MILCOM 2008 IEEE Military Communications Conference, San Diego, CA, USA, 16–19 November 2008; pp. 1–7. [Google Scholar]
- Bulletin C 52 Paris: IERS. Available online: https://hpiers.obspm.fr/eoppc/bul/bulc/bulletinc.52 (accessed on 31 December 2018).
- Kersting, W.H. Radial distribution test feeders. In Proceedings of the 2001 IEEE Power Engineering Society Winter Meeting Conference (Cat. No. 01CH37194), Columbus, OH, USA, 28 January–1 Feruary 2001; Volume 2, pp. 908–912. [Google Scholar]
© 2018 by the authors. Licensee MDPI, Basel, Switzerland. This article is an open access article distributed under the terms and conditions of the Creative Commons Attribution (CC BY) license (http://creativecommons.org/licenses/by/4.0/).