Abstract
Power Grids face significant variability in their operation, especially where there are high proportions of non-programmable renewable energy sources constituting the electricity mix. An accurate and up-to-date knowledge of operational data is essential to guaranteeing the optimal management of the network, and this aspect will be even more crucial for the full deployment of Smart Grids. This work presents a data analysis of the electricity production at the country level, by considering some performance indicators based on primary energy consumption, the share of renewable energy sources, and CO2 emissions. The results show a significant variability of the indicators, highlighting the need of an accurate knowledge of operational parameters as a support for future Smart Grid management algorithms based on multi-objective optimization of power generation. The renewable share of electricity production has a positive impact, both on the primary energy factor and on the CO2 emission factor. However, a strong increase of the renewable share requires that the supply/demand mismatching issues be dealt with through appropriate measures.
1. Introduction
The penetration of electricity in energy consumption has risen in recent years, and the increasing amount of electricity production from Renewable Energy Sources (RES) is changing the traditional approach used in monitoring and managing the Power Grids. High shares of intermittent RES in the network involve several challenges that need to be tackled before Smart Grids will be able to deploy their full potential. The basis for the design and operation of Smart Grids’ algorithms is the availability of live, accurate and detailed information of multiple parameters.
The role of data is currently gaining momentum in energy systems analyses and applications. An increasing number of studies are dealing with the advantages provided by Information and Communication Technology (ICT) infrastructure in terms of data measurement, storage, elaboration and analysis. Energy data are used in a wide range of applications. Among the most successful applications is the consumption profile forecast in buildings [1], which can have a number of advantages, including failure predictions and the optimization of energy management systems [2]. The energy characteristics of buildings are often included in energy certifications, and a proper data analysis on large datasets can provide useful insights for energy planning at an urban scale [3]. Heating and cooling in buildings is often provided by distributed generators, which are generally tested every few years to guarantee their combustion performance [4]. Data are also used for the analysis of energy production systems [5] and the prediction of energy consumption in power networks [6,7]. The importance of accounting for the variability in relation to the building–network interaction has also been analysed in some studies [8], and the use of data-driven approaches is required for the operation of Smart Grid algorithms [9,10].
Electricity networks are characterized by an intrinsic variability in their multiple operational parameters. The importance of data analysis is currently related to the possibility of optimizing business intelligence solutions for marketing purposes in wholesale electricity markets [11]. Some applications include correlation and clustering to analyse the structure of market data [12]. Most applications have been developed with the aim of providing a tool for price forecasting in electricity markets as a support to companies that operate in the day-ahead market. The development of models based and tested on real data has resulted in viable solutions for optimizing the operation of power plants [13].
While current data analyses are mostly related to power demand and production profiles and electricity prices, Smart Grid development could require additional information related to the Primary Energy Factors (PEFs) and CO2 emissions, as well as to the share of RES in the electricity mix. Decarbonization of electricity production will have a major impact on energy systems [14], by making achievable some sustainability targets through the application of multiple technologies [15,16]. The availability of low-carbon electricity from the Power Grid could foster the diffusion of heat pumps over the traditional technologies for space heating in buildings [17]. Moreover, low PEFs associated with electricity production could produce a major shift in the analysis of Combined Heat and Power (CHP) with respect to separate production. High-performance heat pumps running on electricity produced with low primary energy consumption could question the traditional assumption the CHP development is based on [18].
However, a high penetration of RES in the electricity network generates many technical challenges related to their variability and limited predictability, mainly for photovoltaics and wind [19], as well as the non-negligible further environmental impact associated with the construction of new infrastructures [20]. As a matter of fact, a main concern is the increase of the flexibility needs of the power network [21], achieved through the operation of backup and integration power plants and the development of electricity storage technologies [22]. Other technologies that support the increase of RES penetration by compensating for their variability are the power to heat [23] and the power to gas [24]. These technologies are still at an early stage, but their potential is considerable [25]. However, while wide adoption at system level could compensate for the high penetration of RES [26], proper design and planning is needed to avoid environmental impacts and sub-optimal operation [27]. The costs are decreasing and prompting a wider adoption of these solutions, but non-economic barriers should be taken into account as well [28], including the need of proper regulations at national and international level.
Due to the high variability of electricity characteristics over the time, a high resolution is required to provide accurate results. Spatial resolution is another key aspect to be considered, especially when aiming at optimizing the Transmission Network during potential congestion related to particular operating conditions (e.g., excess of RES production) [29]. The availability of real consumption and production profiles can also support the simulation of power reserve needs [30] for the purposes of choosing the best solutions for a given network.
The use of real operation data for the modelling of Power Systems can lead to more accurate results for the simulation of system behaviour [31]. Unfortunately, often the required data are not available with a high time resolution. Thus, most models are based on a lower time resolution (e.g., daily or monthly values) or on the use of standardized profiles. The availability of real patterns, reflecting all the possible variability that occurs, could lead to an accurate quantification of the performance of power generation, thus supporting energy modelling and optimal energy management in Smart Grids.
This paper presents an application of data analysis of the electricity production at the country level, to calculate relevant performance indicators (i.e., PEFs, CO2 emission factors and share of RES) of the electricity supplied by the National Power Grid. The primary energy consumption, the share of RES and the CO2 emissions are considered, in accordance with the main sustainability targets set worldwide. The availability of actual data on an hourly basis over multiple years is a valuable support for the design and development of Smart Grid logics.
The novelty of this approach is the comparison of multiple performance indicators for the electricity generation and supply to the power grid. The proposed application to a real test case, consisting of the Italian electricity generation and supply system, highlights the variability of the power generation performance with different time cycles. The availability of time-dependent indicators could lead to more focused analysis and modelling of any energy system that interacts with the Power Grid (e.g., heat pumps compared to other heating technologies, cooling chillers, etc.), and it can be a valuable resource for local energy planning and comparisons of different technologies. Moreover, the availability of electricity performance indicators for each hour can become a support for future smart grids where the optimization algorithms may aim at the primary energy consumption or other environmental impacts minimization of the entire network, thus requiring such information for each generation unit.
2. Methodology
The calculation of performance indicators related to the electricity supplied to the Power Grid requires a well-defined methodology, as a number of hypotheses are required. The steps to be performed for the analysis are described below. An aspect worth mentioning is the approximation of the results due to the current limitations in the quality of the input data. As will be further described in the following paragraphs, some hypotheses have been formulated to compensate for unavailable data and data gaps in the dataset. Higher accuracy in the analyses could be achieved with the availability of better data, which are in part already existing but not publicly available.
2.1. Energy Production Data Acquisition and Pre-Processing
The data used in this work is publicly available from the Italian Transmission System Operator (Terna Transparency Reports [32]). The data is provided through a single spreadsheet for each day, which includes the electricity production divided by source and bidding area with an hourly time resolution. Six bidding areas are included, based on the topology of the Italian network (North, Center-North, Center-South, South, Sardinia and Sicily) and related to the prices of the wholesale market. The sources include thermoelectric, hydro, photovoltaic (measured and estimated), geothermal and wind.
Every spreadsheet can be publicly accessed, but an organized collection of the entire dataset requires some effort, due to the change of format over the years, as well as the absence of a coherent naming pattern of the files and the folders. For these reasons, a dedicated scraping script has been developed to automate the data acquisition from the website, by using the R programming environment [33]. However, some daily files are missing, and in some cases, existing files showed some gaps or data errors. Table 1 reports a summary of the available records for each year of analysis and a calculation of the missing hours, which represent a percentage of 0.0–4.3% depending on the year. Based on the authors’ estimations, missing data appear to be limited, and they should not have a significant impact on the results of the calculations.

Table 1.
Power generation input data—available records from web scraping procedure.
The data used for this study is limited to domestic power production in Italy. No information is currently available on the characteristics of the electricity imported from abroad (France, Switzerland, Austria, Slovenia). A common framework for electricity data acquisition is being implemented at European level by ENTSO-E (European Network of Transmission System Operators for Electricity), but there are currently only limited historical data series available.
2.2. Renewable Share
The calculation of the renewable share in the electricity generation is based on a simple ratio of electricity production from RES (EERES) to total electricity production (EETOT):
RESshare = EERES/EETOT
RES in Italy include hydropower, photovoltaics, wind, geothermal and bio-energies (including wood biomass, biogas and the biodegradable share of municipal solid waste). The total electricity from RES reached 33.2% of the total electricity consumption in Italy in 2016 [34], with hydropower being the most used source, with 13.1%, followed by PV (6.8%), bio-energy (6.0%), wind (5.4%) and geothermal (1.9%).
The energy produced from RES is available with an hourly detail for each source, while thermoelectric generation is registered as an aggregate production (i.e., there is no information on the share of fuels, including bio-energies) [32]. The share of fuel is required for the calculation of the indicators presented in this study. The only available fuel share is given by the National TSO on an annual basis [34,35,36], and the authors applied it to each hour of operation of the system. The annual electricity production from thermoelectric plants, divided by fuel, is reported in Table 2.
Table 2.
Annual gross electricity generation from thermoelectric plants by fuel (authors’ calculation based on [34,35,36]).
While this approximation should not significantly impact the results for most of the operational hours, it reduces the variability of the calculated indicators. Consequently, the results presented in this study underestimate the variability of the electricity indicators. More accurate results require the availability of data with a better time resolution for thermoelectric energy production.
2.3. Primary Energy Factor
Primary energy consumption is one of the main aspects of interest for energy and climate goals at international level. For this reason, the Primary Energy Factor (PEF) represents a relevant indicator for the support of multiple applications, including energy planning, policy making and energy systems simulation. PEF is calculated as the ratio between of the primary energy consumption (EP) to the useful energy (EU), for any energy flow of interest:
PEF = EP/EU
In this research work, PEF is calculated considering as useful energy the electricity produced by Italian power plants and supplied to the National Power Grid. The primary energy is therefore the primary energy consumption of the power plants.
The calculation of the PEF indicator requires an accurate knowledge of the performance of each power plant involved in the analysis. However, seldom is such data available at a detailed time resolution, and therefore some approximations are due. In this research work, some hypotheses have been developed to compensate for the lack of accurate information. Average values on an annual basis have been used both for the fuel share in thermoelectric power plants and for conversion efficiencies, based on the operational data provided by the National Transmission System Operator [34,35,36]. The PEF values of thermoelectric plants vary in the range 2.047–2.176, depending on the year. The aggregated value has been used, as the calculation of the contribution of each fuel would have given a less accurate result. These are the major approximations of this research study, as different fuels in power plants can result in very different conversion. The future availability of more detailed and accurate data could lead to better results by applying the same methodology presented in this study.
Biomass and municipal solid waste are included in the energy produced by thermoelectric power plants, and therefore the relevant efficiency has been used for PEF calculation. For other RES sources, a 100% value has been considered for hydro, wind and solar, in accordance with the common practice in world energy statistics. Geothermal plants have been accounted for, assuming an efficiency of 10%, based on operational values for power plants in Italy and other Counties, mainly limited by the turbine inlet temperatures in these plants. These assumptions are consistent with the common methodologies used for electricity PEF calculation from RES at an international level (including Eurostat and IEA approaches).
2.4. CO2 Emissions Factor
The third indicator considered in this work is related to the specific emissions of CO2 for electricity generation. The study is limited to the emissions during the operation phase, i.e., the lifecycle emissions are not considered. This aspect is of primary concern, and some calculations are similar to those discussed for PEF in Section 2.3.
There is no common ground for the emission factors of fuels when burnt, as multiple parameters affect the CO2 emissions during the combustion phase (e.g., the fuel type, composition, unit layout and size, the combustion efficiency, etc.). Moreover, a number of hypotheses are required to estimate the actual conversion efficiency of power plants, as already discussed in the previous section.
In this study, the CO2 emissions have been calculated by considering only the emissions from thermoelectric plants, as non-thermal RES (i.e., hydro, wind, solar) and geothermal sources have no operation emissions. The thermoelectric emissions have been accounted for based on the values provided by a report by the Italian Institute for Environmental Protection and Research (ISPRA) [37] (in the range 489–528 g/kWh, depending on the year). These values are calculated on an annual basis, based on the actual operation of power plants in Italy. The CO2 emission factors given by [37] are already calculated on the real fuel mix of each year, and therefore these values have been used, instead of re-applying the fuel distribution of Table 2, which would have led to unnecessary approximations. The most recent data is from 2016, and these values have also been used for 2017.
Finally, a comparison with the economic value of the electricity in the Day-Ahead Electricity Market has been included. Hourly data of market prices for Italian Electricity Market (IPEX) [38] has been considered to highlight any potential relation with the other performance indicators. Other economic aspects may have an impact on electricity generation and dispatching (including incentives, capacity market, zonal prices, etc.). Since the focus of this work is not on the economic aspects, a simpler approach has been chosen.
3. Results and Discussion
The analysis of the electricity production data of the last six years makes it possible to describe a synthesis of the main aspects of Power generation in Italy. The data presented below does not represent the final user demand, for which electricity imports and Power Grid losses should be taken into account.
A first glance of the total electricity generation in Italy is presented in Figure 1, where all the hourly values of an entire year (in this case, 2015) have been plotted. The figure shows the significant variation in the request made to the power plants, with both daily and seasonal cycles. Electricity production reached its peak during the month of July, which was characterized by extreme weather conditions requiring an outstanding cooling demand for most of that month. Conversely, the lowest demand, in the central weeks of August, was related to the shutdown of industries and other commercial facilities during the summer holidays across the country. With regard to the other seasons, winter shows a consumption slightly higher than spring and autumn, due to the energy demand for space heating.
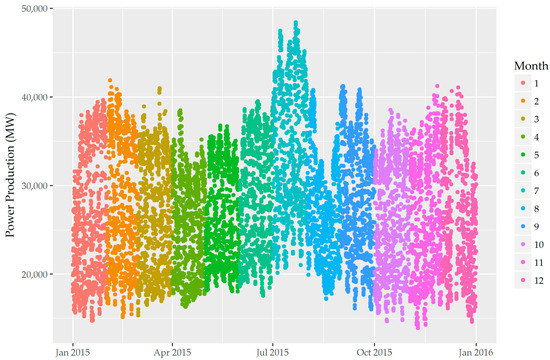
Figure 1.
Hourly power production of electricity in Italy in 2015.
The largest variability to be faced occurs on a daily basis. Some daily generation profiles over the entire year 2015 have been reported in Figure 2. The figure shows the profiles of each Wednesday, which is usually used in Italy to represent the average working day. The aim of the plot is to present the occurrence of similar patterns over the year, although some differences can be noticed from one month to another. The above-mentioned anomaly of July is clearly noticeable, with constant higher consumption both during the daylight and night hours.
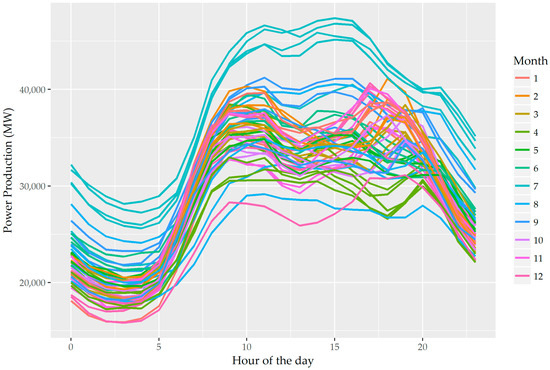
Figure 2.
Daily power profiles of electricity production in Italy in 2015, Wednesdays only.
Despite the seasonal differences, the patterns show the duality of daylight/night hours, together with a morning peak common to all of the seasons. Conversely, the afternoon peak seems to show a larger seasonality, appearing generally later in winter and earlier in summer, probably due to the effect of lighting demand during working hours and cooling appliance demand, respectively.
Figure 1 and Figure 2 give an overview of the generation patterns of the Italian power plants, for which the performance indicators are presented, below. Although the amount of import can reach significant percentages in Italy (an additional 13–16% of the gross production in the years from 2012 to 2016 [32]), it has no significant impact on the load profiles.
The primary energy consumption is the aspect that has been evaluated in the most detail, as the PEF calculation can give significant insights into the efficiency of the power plants used in Italy for electricity generation. As already mentioned, the findings of this analysis highlight the importance of including PEF variability in every energy analysis in order to account for the use of electricity from the Power Grid. The use of average annual values could lead to a strong bias in any result, as the PEF can range over a large interval.
Figure 3 reports the chronological variations of PEF over the entire range of analysis, from 1 January 2012 to 31 December 2017. The colours of the points represent the share of renewables in the electricity production, and a correlation can be qualitatively noticed from the figure: the higher the renewable share is, the lower the PEF. The reason for this is the higher conversion efficiency of hydro, wind and solar plants, being the main share of RES in Italy, while geothermal and bioenergy represent only a minor part.
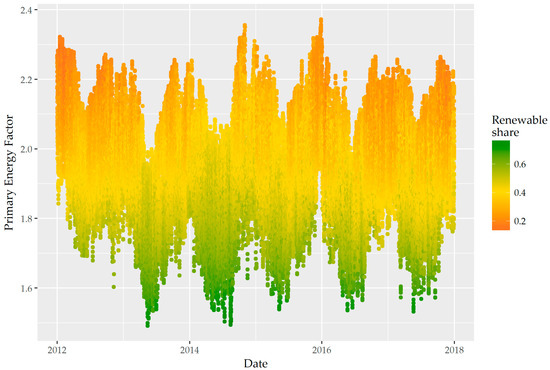
Figure 3.
Primary Energy Factor and Renewable share of electricity produced in Italy between 2012 and 2017.
The results presented in Figure 3 and in the following are the best approximation of hourly values that can be obtained, due to the unavailability of hourly values for the fuel share in thermoelectric power plant operation. Since the annual average has been used, this approximation results in stronger biases for the minimum and maximum values, but this has a lower effect on the median values. The reader should consider that the real operation has, therefore, an even larger variability. This latter cannot be more accurately calculated with the operation data available.
The variability noticeable in Figure 3 is the combination of the seasonal and daily cycles described for the power production in the previous sections. This combined effect can be analysed separately by means of two boxplots, as shown in Figure 4 and Figure 5.
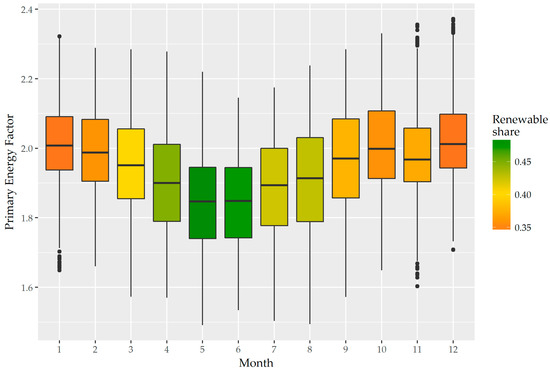
Figure 4.
Monthly variation of Primary Energy Factor and Renewable share (Italy, years 2012–2017).
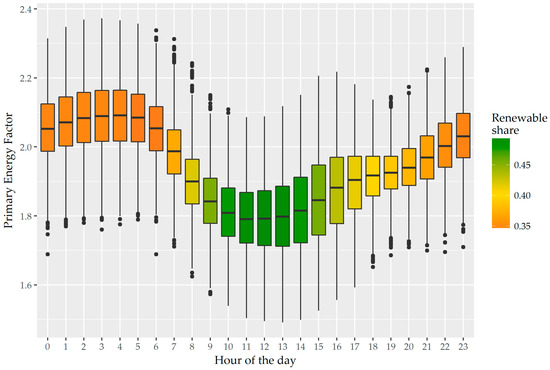
Figure 5.
Hourly variation of Primary Energy Factor and Renewable share (Italy, years 2012–2017).
Each boxplot shows the variation of the parameter under analysis with respect to the categories of the x-axis. The coloured box is made up of the first and third quartile, while the black line in the middle represents the median value. The outer lines include the values that are lower than 1.5*IQR (with IQR – Interquartile Range being the difference between the third and the first quartile). The remaining points are considered to be outliers.
In detail, Figure 4 represents the variability across the months, whereas Figure 5 represents the variability across the hours of the day. In summer hours and daylight hours, the higher share of RES results in a generally lower PEF, with medians as low as 1.8 (and average renewable share slightly lower than 0.5). Conversely, the PEF values in winter and in the night hours have medians higher than 2.0–2.1 and average renewable shares as low as 0.35.
The third indicator in this study is the specific CO2 emission factor for the electricity generated in Italy. Figure 6 shows the distribution of the hourly values for each year considered in this work. The distributions have some slight differences, mainly caused by the share of RES in the annual production, as well as the weight of each specific source. In 2014, the amount of electricity produced from hydro reached an historical maximum, mainly thanks to favourable weather conditions. The plot shows that the median of 2014 is lower than the other years, and the entire distribution is shifted towards lower values. In contrast, 2012 shows higher values, mainly because the RES penetration was still low.
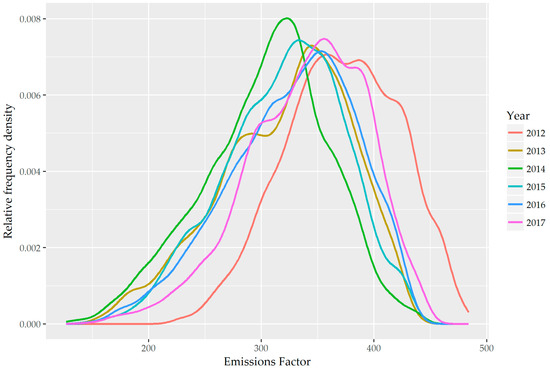
Figure 6.
Probability density distribution for CO2 Emissions factor (Italy, hourly values, years 2012–2017).
All three indicators considered in this study are highly related among themselves, due to the characteristics of the energy sources used for electricity production: RES has both low PEFs and CO2 emission factors. The relations among those indicators are shown in Figure 7, where the PEF is plotted against the renewable share, considering all the points of the dataset. The colour of the points is related to the CO2 emission factor, over its entire range of variability. The proportionality between the indicators is clearly emerging, although some variability is related mainly to the weight of each source in each hourly electricity mix.
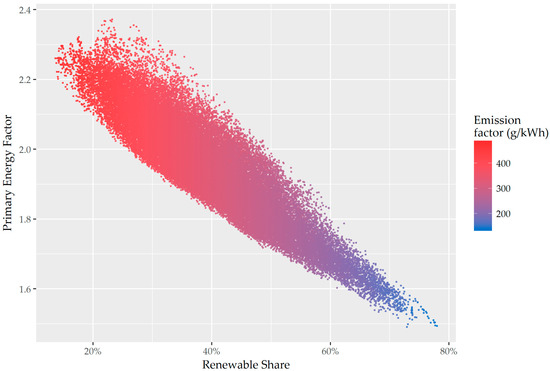
Figure 7.
Relation between Primary Energy Factor and Renewable share (Italy, hourly values, years 2012–2017).
Finally, minimum, median and maximum values of each indicator per year of analysis are summarized in Table 3. As already described in the previous comments, the hypotheses made to compensate the unavailability of some input data leads to an approximation of the values, especially for the minimum and maximum ones. For this reason, the values of Table 3 are not real values, but the best possible approximation based on the data currently available. The approximations have a lower impact on the median value, which is statistically more accurate.
Table 3.
Calculated values for Renewable share, Primary Energy Factor and CO2 Emissions Factor.
However, the values of Table 3 give qualitative information on the range of variability, with a conservative approach: the real variability is expected to be even higher. These results highlight the importance of performing such analyses, and of increasing the quality and accuracy of the available operational data in order to provide valuable support for local energy planning and energy systems modelling and simulation. The high variability emerging from Table 3 for the performance indicators highlights the importance of high time resolution analyses, instead of relying on average values on an annual or monthly basis. The variability of performance indicators with respect to the time domain is an aspect that cannot be neglected in energy analyses that aim at a holistic system optimization, and accurate data analyses will become a precious support for the development of future Smart Grid operational algorithms based on the optimization of power production and not limited to the economic optimum.
Finally, a further aspect that is worth mentioning is the electricity price, based on the energy price on the Day-Ahead Electricity Market in Italy. As a general trend, the high availability of electricity from RES is generally associated with lower prices, due to some mechanisms of Italian regulations, including incentives to electricity production from RES and dispatch priority over fossil-based power plants.
A preliminary analysis of Electricity Price compared to the indicators that have been calculated in this work is reported in Figure 8. The plot shows significant point scattering, highlighting a weak relation between the electricity price and the Renewable share, as well as the PEF. The scattering of the point cloud is due to many additional parameters that influence the Electricity Price, and a more complex analysis would be needed. While such research is beyond the scope of this paper, the trend of Figure 8 suggests that the share of RES is among the aspects that influence the price of electricity in the market.
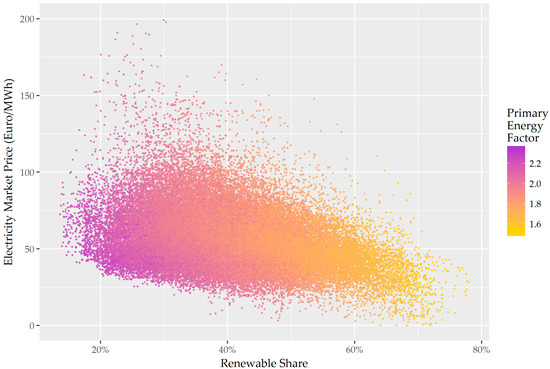
Figure 8.
Relation between Renewable share and electricity market price (Italy, hourly values, years 2012–2017).
4. Conclusions
This research work presents an analysis of performance indicators of the electricity production in Italy, by considering the share of renewable energy sources, the primary energy consumption and the CO2 emissions.
The results of the study provide interesting insights, and the main findings are:
- The accuracy and quality of the data needed for the analysis have a major impact on the precision of the results. A huge amount of data is required for the calculation of performance indicators, and its unavailability leads to approximations in the results. Improved detail in the monitored data is required to increase the reliability of the indicators, with further benefits on multiple applications.
- The variability of the electricity mix, both on a seasonal and daily basis, has a strong influence on all of the energy systems that use electricity from the Power Grid, affecting the sustainability of the final energy consumed by the users.
- The RES share in Italy is a major driver of the power production variability. It shows higher values in summer, and during daylight hours, up to a value of 80%, while in winter and night hours it decreases to 20%.
- The Primary Energy Factor shows annual median values in the range of 1.92–2.00, but with a variation reaching as low as 1.49 and as high as 2.37, respectively. The primary energy consumed for the electricity supply to the users is therefore highly dependent on the generation mix.
- The CO2 emissions are strictly related to both renewable share and PEF, due to the intrinsic features of the energy sources of Italian power plants. The results show emission factors in the range of 127–484 g/kWh, with annual median values from 310 to 372 g/kWh.
- The electricity price on the day-ahead electricity market shows a very weak relation to the renewable share of the Power Grid. A proper quantification of this relation would need a deeper economic analysis, including multiple aspects and market data.
Further improvements of this work, involving a larger availability and a better quality of the input data, could lead to an increase in the accuracy of the results presented. Moreover, the authors envisage the possibility of performing comparisons with other countries, which would require a careful evaluation of the peculiar conditions of the energy network and power plants, including the average efficiencies and emission factors used in the hypotheses. Moreover, each country has its own protocols related to data collection, such that a common and standardized organization of the datasets will be required.
Author Contributions
The authors contributed equally to the paper. Michel Noussan performed the data acquisition and analysis, Roberta Roberto and Benedetto Nastasi provided an analysis of the context and the results, all the authors wrote the paper together.
Conflicts of Interest
The authors declare no conflict of interest.
References
- Amasyali, K.; El-Gohary, N.M. A review of data-driven building energy consumption prediction studies. Renew. Sustain. Energy Rev. 2018, 81, 1192–1205. [Google Scholar] [CrossRef]
- Molina-Solana, M.; Ros, M.; Ruiz, M.D.; Gómez-Romero, J.; Martin-Bautista, M.J. Data science for building energy management: A review. Renew. Sustain. Energy Rev. 2017, 70, 598–609. [Google Scholar] [CrossRef]
- Dall’O’, G.; Sarto, L.; Sanna, N.; Tonetti, V.; Ventura, M. On the use of an energy certification database to create indicators for energy planning purposes: Application in northern Italy. Energy Policy 2015, 85, 207–217. [Google Scholar] [CrossRef]
- Noussan, M.; Nastasi, B. Data analysis of heating systems for buildings—A tool for energy planning, policies and systems simulation. Energies 2018, 11. [Google Scholar] [CrossRef]
- Noussan, M.; Jarre, M. Multicarrier energy systems: Optimization model based on real data and application to a case study. Int. J. Energy Res. 2017. [Google Scholar] [CrossRef]
- Ferlito, S.; Adinolfi, G.; Graditi, G. Comparative analysis of data-driven methods online and offline trained to the forecasting of grid-connected photovoltaic plant production. Appl. Energy 2017, 205, 116–129. [Google Scholar] [CrossRef]
- Chen, W.; Zhou, K.; Yang, S.; Wu, C. Data quality of electricity consumption data in a smart grid environment. Renew. Sustain. Energy Rev. 2017, 75, 98–105. [Google Scholar] [CrossRef]
- Cubi, E.; Akbilgic, O.; Bergerson, J. An assessment framework to quantify the interaction between the built environment and the electricity grid. Appl. Energy 2017, 206, 22–31. [Google Scholar] [CrossRef]
- Munshi, A.A.; Mohamed, Y.A.R.I. Big data framework for analytics in smart grids. Electr. Power Syst. Res. 2017, 151, 369–380. [Google Scholar] [CrossRef]
- Marah, R.; Hibaoui, A. El Algorithms for Smart Grid Management. Sustain. Cities Soc. 2018. [Google Scholar] [CrossRef]
- Radenković, M.; Lukić, J.; Despotović-Zrakić, M.; Labus, A.; Bogdanović, Z. Harnessing business intelligence in smart grids: A case of the electricity market. Comput. Ind. 2018, 96, 40–53. [Google Scholar] [CrossRef]
- Cui, T.; Caravelli, F.; Ududec, C. Correlations and clustering in wholesale electricity markets. Phys. A Stat. Mech. Its Appl. 2018, 492, 1507–1522. [Google Scholar] [CrossRef]
- Crisostomi, E.; Gallicchio, C.; Micheli, A.; Raugi, M.; Tucci, M. Prediction of the Italian electricity price for smart grid applications. Neurocomputing 2015, 170, 286–295. [Google Scholar] [CrossRef]
- Morvaj, B.; Evins, R.; Carmeliet, J. Decarbonizing the electricity grid: The impact on urban energy systems, distribution grids and district heating potential. Appl. Energy 2017, 191, 125–140. [Google Scholar] [CrossRef]
- Aste, N.; Manfren, M.; Marenzi, G. Building Automation and Control Systems and performance optimization: A framework for analysis. Renew. Sustain. Energy Rev. 2017, 75, 313–330. [Google Scholar] [CrossRef]
- Astiaso Garcia, D. Green areas management and bioengineering techniques for improving urban ecological sustainability. Sustain. Cities Soc. 2017, 30, 108–117. [Google Scholar] [CrossRef]
- Jarre, M.; Noussan, M.; Poggio, A.; Simonetti, M. Opportunities for heat pumps adoption in existing buildings: real-data analysis and numerical simulation. Energy Procedia 2017, 134, 499–507. [Google Scholar] [CrossRef][Green Version]
- Noussan, M.; Jarre, M.; Roberto, R.; Russolillo, D. Combined vs separate heat and power production—Primary energy comparison in high renewable share contexts. Appl. Energy 2018, 213, 1–10. [Google Scholar] [CrossRef]
- Eltigani, D.; Masri, S. Challenges of integrating renewable energy sources to smart grids: A review. Renew. Sustain. Energy Rev. 2015, 52, 770–780. [Google Scholar] [CrossRef]
- Astiaso Garcia, D.; Bruschi, D. A risk assessment tool for improving safety standards and emergency management in Italian onshore wind farms. Sustain. Energy Technol. Assess. 2016, 18, 48–58. [Google Scholar] [CrossRef]
- Koltsaklis, N.E.; Dagoumas, A.S.; Panapakidis, I.P. Impact of the penetration of renewables on flexibility needs. Energy Policy 2017, 109, 360–369. [Google Scholar] [CrossRef]
- McPherson, M.; Tahseen, S. Deploying storage assets to facilitate variable renewable energy integration: the impacts of grid flexibility, renewable penetration, and market structure. Energy 2018, 145, 856–870. [Google Scholar] [CrossRef]
- Bloess, A.; Schill, W.P.; Zerrahn, A. Power-to-heat for renewable energy integration: A review of technologies, modeling approaches, and flexibility potentials. Appl. Energy 2018, 212, 1611–1626. [Google Scholar] [CrossRef]
- Nastasi, B.; Lo Basso, G. Power-to-Gas integration in the Transition towards Future Urban Energy Systems. Int. J. Hydrogen Energy 2017, 42, 23933–23951. [Google Scholar] [CrossRef]
- Yilmaz, H.Ü.; Keles, D.; Chiodi, A.; Hartel, R.; Mikulić, M. Analysis of the power-to-heat potential in the European energy system. Energy Strateg. Rev. 2018, 20, 6–19. [Google Scholar] [CrossRef]
- Lyseng, B.; Niet, T.; English, J.; Keller, V.; Palmer-Wilson, K.; Robertson, B.; Rowe, A.; Wild, P. System-level power-to-gas energy storage for high penetrations of variable renewables. Int. J. Hydrogen Energy 2017, 43, 1966–1979. [Google Scholar] [CrossRef]
- Castellani, B.; Nastasi, B.; Rinaldi, S.; Morini, E.; Rossi, F. Carbon dioxide and energy footprint of flue gas treatment by Power-to-Gas integration for methane and ammonia synthesis. Energy Convers. Manag. 2018, in press. [Google Scholar]
- Astiaso Garcia, D. Analysis of non-economic barriers for the deployment of hydrogen technologies and infrastructures in European countries. Int. J. Hydrogen Energy 2017, 42, 6435–6447. [Google Scholar] [CrossRef]
- Singh, A.; Eser, P.; Chokani, N.; Abhari, R. High Resolution Modeling of the Impacts of Exogenous Factors on Power Systems—Case Study of Germany. Energies 2015, 8, 14168–14181. [Google Scholar] [CrossRef]
- Mitani, T.; Aziz, M.; Oda, T.; Uetsuji, A.; Watanabe, Y.; Kashiwagi, T. Annual Assessment of Large-Scale Introduction of Renewable Energy: Modeling of Unit Commitment Schedule for Thermal Power Generators and Pumped Storages. Energies 2017, 10, 738. [Google Scholar] [CrossRef]
- Li, H.; Li, G.; Wu, Y.; Wang, Z.; Wang, J. Operation Modeling of Power Systems Integrated with Large-Scale New Energy Power Sources. Energies 2016, 9, 810. [Google Scholar] [CrossRef]
- TERNA. Transparency Report. 2017. Available online: http://www.terna.it/it-it/sistemaelettrico/transparencyreport.aspx (accessed on 1 February 2018).
- R Core Team. R: A Language and Environment for Statistical Computing; R Foundation for Statistical Computing: Vienna, Austria, 2017. [Google Scholar]
- TERNA. Dati Statistici—Produzione (2016). 2017. Available online: http://www.terna.it/it-it/sistemaelettrico/statisticheeprevisioni/datistatistici.aspx (accessed on 1 February 2018).
- TERNA. Dati Statistici—Produzione (2012). 2013. Available online: http://www.terna.it/it-it/sistemaelettrico/statisticheeprevisioni/datistatistici.aspx (accessed on 1 February 2018).
- TERNA. Dati Statistici—Produzione (2014). 2015. Available online: http://www.terna.it/it-it/sistemaelettrico/statisticheeprevisioni/datistatistici.aspx (accessed on 1 February 2018).
- Caputo, A. Fattori di Emissione Atmosferica di CO2 e Altri Gas a Effetto Serra nel Settore Elettrico. 2017; ISBN 978-88-448-0812-9. Available online: http://www.isprambiente.gov.it/files2017/pubblicazioni/rapporto/R_257_17.pdf (accessed on 13 February 2018).
- Gestore Mercati Energetici GME—Dati Statistici. Available online: http://www.mercatoelettrico.org (accessed on 1 March 2018).
© 2018 by the authors. Licensee MDPI, Basel, Switzerland. This article is an open access article distributed under the terms and conditions of the Creative Commons Attribution (CC BY) license (http://creativecommons.org/licenses/by/4.0/).