Abstract
A large part of the stock of Italian educational buildings have undertaken energy retrofit interventions, thanks to European funds allocated by complex technical-administrative calls. In these projects, the suggested retrofit strategies are often selected based on the common best practices (considering average energy savings) but are not supported by proper energy investigations. In this paper, Italian school buildings’ stock was analyzed by cluster analysis with the aim of providing a methodology able to identify the best energy retrofit interventions from the perspective of cost-benefit, and to correlate them with the specific characteristics of the educational buildings. This research is based on the analysis of about 80 school buildings located in central Italy and characterized by different features and construction technologies. The refurbished buildings were classified in homogeneous clusters and, for each of them, the most representative building was identified. Furthermore, for each representative building a validating procedure based on dynamic simulations and a comparison with actual energy use was performed. The two buildings thus singled out provide a model that could be developed into a useful tool for Public Administrations to suggest priorities in the planning of new energy retrofits of existing school building stocks.
1. Introduction
The European Directive 2010/31/EU [1] introduces minimum energy requirements for buildings and in order to meet them, energy retrofits are usually necessary for existing buildings [2,3,4]. In addition, the European Directive 2012/27/EU [5] directs the member states to develop an intensive refurbishment of public buildings. Schools represent an important part of public building stock and, even if they are not a predominant percentage of the total public patrimony, their refurbishment represents an important issue, both for social and educational aspects. Therefore, in Italy, a high number of buildings (about 43,000, representing 58% of the stock of Italian educational buildings) were recently subjected to energy retrofits [6].
Several studies on the energy performance of schools estimated their medium normalized energy uses. This normalization procedure is necessary in order to compare the uses among different buildings. It can be achieved as a function of the volume of schools, the heated surface, the number of classes or number of students, and the external climate. Findings in literature show this normalization in terms of the heated surface but, since schools may have rooms with different heights, the normalization in terms of the heated volume can be considered more appropriate [7,8,9].
Comparing such a huge amount of data, that includes schools located in different countries, cannot be useful if standard indoor comfort conditions are not guaranteed and a normalization as a function of the external climate is not performed [8]. Children attend schools for a long period and good indoor comfort conditions must be guaranteed with reduced energy uses. The external climate has a strong influence on the building energy requirements and its influence can be considered by the Heating Degree Day (HDD) [8,9].
Energy use in schools can be characterized by different performance indicators, depending on several parameters, such as:
- the school’s typology (kindergarten, primary or high school), which also reflects the different occupational schedules and the different facility buildings connected to the supplementary activities given outside of teaching hours (laboratories, sport facilities, canteens, etc.) [8,10]. Generally, space heating is not provided all day long but only in the morning during the teaching period. However, some schools also have afternoon activities with a longer time schedule for the heating system;
- the ratio between external surface (S) and heated volume (V), which reflects how the geometric characteristics of the building influence energy use;
- the construction period: new schools show lower energy use in comparison with buildings made during the absence of any energy regulation [10].
The comparison of different use patterns for schools and the definition of benchmarks for energy use is crucial when an energy requalification of the building stock must be undertaken. The importance of the energy upgrade of existing public buildings is underscored by Ascione et al. [11], with a focus on educational buildings. The role of public administrations is fundamental to meeting the European directives on greenhouses gas emissions and energy efficiency. Their role is to provide stimulus for private interventions, to give demonstrative examples, and good practice guidelines. Moreover, the central administrations of various countries also provide the financial incentives for all of the interventions. Financial stimulus often aims at reducing the dependence on imported energy and at increasing energy self-sufficiency. The aim of getting both economically convenient and thermodynamically efficient energy retrofit interventions has already been demonstrated to be effective by García Kerdan et al. [12], who propose a novel optimization methodology that was tested on a primary school located in London. The definition of the most cost-effective energy retrofit intervention is still one of the major challenges when studying the energetic requalification of buildings. Ma et al. [2] attempted a methodology able to identify the best retrofit option between the technologies and analysis models currently available. The costs of the retrofit interventions are usually affected by a wide range of uncertainty and probabilistic life cycle cost analysis would be the most suitable and realistic solution to check the economic effectiveness of alternative measures [13].
In this framework, the development of a tool to correlate significant characteristics of educational buildings with the best energy retrofit interventions from the point of view of a cost-efficiency ratio is here presented. Such an instrument can be useful for Public Administrations, for example at a regional scale, to establish a priority in the planning of new energy retrofits of school assets. Moreover, this contribution carries out a cost efficiency evaluation of the interventions done in the schools already refurbished and analyzes the obtained post-retrofit uses compared to the ones assessed before the interventions.
The paper structure is as follows. In Section 2, we introduce the state of the art in this research field. In Section 3, we describe in detail materials and methods. In Section 4, we describe, compare, and discuss the outcomes of the cluster analysis and the simulations results. In Section 5, we draw the conclusions.
2. State of the Art
Several works about the energy performance of school buildings can be found in literature. Dias Pereira et al. [8] present a literature review about the energy uses of worldwide schools with the purpose of achieving energy benchmarks. Figure 1 shows an elaboration of the annual heating energy use values in European countries considering data from [8].
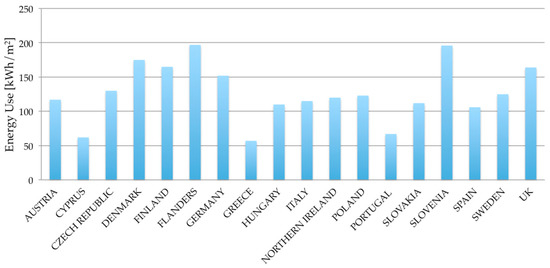
Figure 1.
Energy uses of school buildings in European countries (varying from about 52 to 197 kWh/m2 year) (elaboration of the authors from [8]).
According to other studies [14], Greek schools have an average heating use of 68 kWh/m2 year that represents the 72.4% of the total energy need. The overall calculated potential of energy conservation is about 20% and the intervention that has the strongest influence on heating energy savings is the envelope insulation with a reduction of space heating equal to 43%. In their research, Dascalaki and Sermpetzoglou [15] present similar values for the energy use of 500 Greek schools, reporting 57 kWh/m2 year for heating and 68 kWh/m2 year as the total specific energy requirement. In France, a retrofit program regarding Parisian schools revealed a global energy use of 224 kWh/m2 year of primary energy [16]. On the other hand, the annual primary energy use in Cyprus schools is 116.22 kWh/m2 year [17]. The addition of 5 cm of polystyrene on both walls and roof can reduce the energy use by 32%, while the most efficient solution for the air conditioning system in classrooms and labs is the removal of the split-unit and its substitution with fans. Schools in Slovenia have a global energy requirement of 192 kWh/m2 year and for 83% of them the insulation of the envelope is recommended [8]. They identified this intervention as the principal measure to adopt in order to reach the level of efficiency of neighboring countries. Luxemburg’s new schools have an average value of heating demand of 93 kWh/m2 year [10] with potential energy savings in passive buildings ranging from 17% to 35% respectively, when compared with the standard ones.
Taking into account Italian schools, Desideri and Proietti [18] estimated a thermal energy use from 15.7 kWh/m3 year to 21.7 kWh/m3 year after analyzing 29 schools located in the province of Perugia (central Italy), and estimated a potential reduction of the energy requirements of about 38%. The heating energy use represents 80% of the total energy requirements and generally the heating systems are characterized by natural gas, oil boilers, and by radiators as emission system. The generators can be obsolete and, in many cases, they are oversized in terms of installed power with a considerable drop of the efficiency as a consequence of their part load. The envelope of the buildings located in that region can be divided into old structures located in the historic centers, characterized by load bearing walls, and prefabricated buildings often located in the outskirts of the towns. The highest thermal specific energy uses are detected for the second type of structures dated from 1970 to 1980, with lower values for the same typologies built ten years later. Windows are the weakest part of the envelopes and, in some cases, remarkable infiltrations through the frames are detected during the energy audit [18].
In their study, Sarto and Dall’O’ [19] provided an energy audit campaign investigating 49 schools in the Lombardia region (north of Italy). They found an average value of 47.1 kWh/m3 for the heating energy demand. Some retrofit measures are proposed, based on three economic evaluations: a minimal investment scenario, a cost-effectiveness scenario, and a high-performance scenario, with the aim of reaching the standards of net zero energy buildings. The study demonstrates that it is not always convenient to pursue the high performance scenario [19]. Corgnati et al. [20], considering 100 schools located in the Piemonte region (north-west of Italy), showed an average heating value which ranges between 110 kWh/m2 and 115 kWh/m2, that corresponds to 37–38 kWh/m3. The paper shows how the definitions of specific indicators of space heating energy uses can be useful to predict the energy needs of a large building stock with a good approximation. Moreover, Walter and Sohn [21] have already demonstrated that it is possible to get energy saving estimations from the retrofitting of a large building’s stock, through statistical analysis. The application of a multivariate linear regression model, to foresee possible energy savings from different retrofits actions, results in a very interesting solution, particularly when the energy simulation is not cost or time feasible. Statistical methods are currently used for the prediction of the energy performance of buildings [22].
Recently cluster analysis has been employed to define homogenous classes and reference buildings within classes relying on data related to real energy uses [9,23,24]. In particular, Arambula Lara et al. [9] applied the cluster analysis to a sample of about 60 schools in the North-East of Italy, identifying reference buildings within the clusters in order to optimize the energy retrofit measures. The authors [9] correlated the real energy demands of the buildings’ stock to their geometrical and technical characteristics by means of proper statistical analyses. A fuzzy clustering technique has been used by Santamouris et al. [24] for the classification of energy data of 320 schools in Greece, clustered by similar characteristics. The clustering permitted the selection of representative schools for a more detailed analysis [23,24]. The definition of reference buildings has been promoted also by the European Commission [25] for cost-optimal analyses of energy retrofits in the existing building stock. Raatikainen et al. [26] use the k-means method for a data mining analysis on the average energy uses of six Finnish schools. The results show that the construction period has a strong influence on the energy requirements of the educational buildings: new schools are more efficient than older ones. Hong et al. [27] run a cluster analysis, using the decision tree method, of 6282 elementary schools located in South Korea. After the clustering, different combinations of methodologies were applied to evaluate the CO2 emissions from electric energy use, such as multiple linear regression, artificial neural networks, and case-based reasoning. The work shows that better accuracies and minor standard deviations can be reached when clustering is applied and all the available predictors are included in the analysis. Recently, Salvalai et al. [28] have proposed a methodology based on the cluster analysis, that defines the optimal cost-benefit retrofit action through an energy analysis of the reference buildings that represent every homogeneous group.
In this paper, we present data on the energy uses (before and after retrofit interventions when available) of 80 schools located in the Lazio region (central Italy). By means of the available database and through our own surveys, it was possible to find data about the buildings’ geometry, their construction age, energy retrofit interventions typology and their costs, energy uses before the refurbishment, and the primary energy saving after the retrofit. Specifically, data about savings for the whole dataset are declared by the designers and only for 20% of the buildings. The savings are obtained thanks to the monitoring of energy uses after the interventions for the year 2016. Aiming at identifying representative buildings of the whole stock, the cluster analysis was applied. The definition of reference buildings, which are representative of the homogenous classes of building stock, can be useful to develop specific energy retrofit plans, based on the cost-optimal method, which can then be extended to the entire cluster.
3. Materials and Methods
3.1. Buildings’ Sample Description
A large database composed by the refurbished buildings was provided by the Lazio region administrative offices. The sample includes 80 schools that are not uniformly distributed on the regional territory. The highest percentage (45%) is in the province of Rome, 22% are in the Latina province, and scattered cases are in the other provinces of Rieti, Viterbo, and Frosinone (see Figure 2). Incomplete and unreliable data were excluded from the cluster analysis. The schools composing the sample can be classified on the basis of the category of educational institution, as indicated by Italian law:
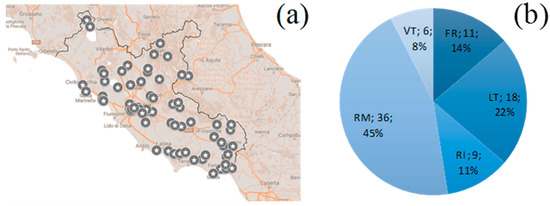
Figure 2.
Spatial distribution of the analyzed schools in the Lazio territory: (a) map and (b) number of schools per province (RM = Rome; VT = Viterbo; FR = Frosinone; LT = Latina; RI = Rieti).
- 9 kindergartens or daycare centers (1–2 years old);
- 1 kindergarten and nursery school;
- 22 nursery schools (3–5 years old);
- 11 nursery and primary schools;
- 4 comprehensive institutes, including nursery, primary and secondary schools;
- 18 primary schools (6–10 years old);
- 2 institutes, including primary schools and lower secondary schools;
- 13 lower secondary schools (11–13 years old).
Figure 3 shows that the analyzed buildings were mostly built before 1976 and only a few of them were built in recent years (6%). 1976 is the year of the first publication of an energy law in Italy [29] and from Figure 3 it is possible to notice that 52% of the buildings were built without any energy regulation.
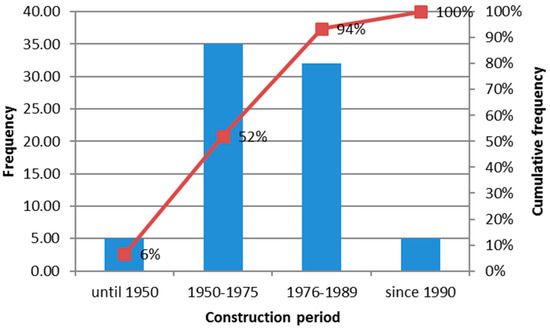
Figure 3.
Frequency distribution of schools in terms of construction period.
Considering the heating volume of the buildings (Figure 4), 57.1% of them have a volume lower than 5000 m3. Lower volumes occur when the school consists of a single building, or small kindergartens and nursery schools. In the case of more than one building and for comprehensive institutes including both primary and secondary schools, the volumes are bigger. The Italian legislation [30,31] fixed the minimal standards for the number of students per class and for the gross surfaces per student for every typology of school. The Italian Government has significantly tried to reduce the number of small schools, privileging the development of schools in urban areas and in cities with a high density of population. Sometimes the consequences of government action have been the union of two different schools in a comprehensive educational institution. Alternatively, the merge of two schools of the same typology occurred with a reduction of the number of buildings.
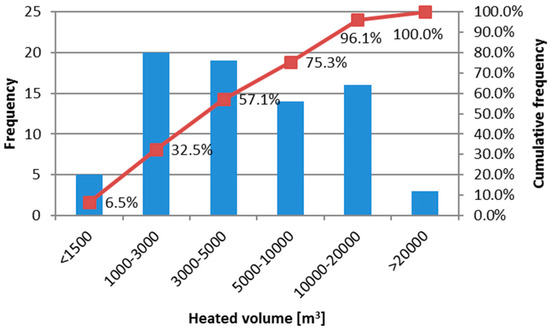
Figure 4.
Frequency distribution of schools in terms of gross heated volume.
Figure 5 shows the distribution of schools as a function of the ratio between the external surface and the gross heated volume (called S/V ratio). Only 6.5% of the sample is composed of very compact buildings with an S/V value lower than 0.3. A significant percentage of the studied buildings (44.2%) has a S/V ratio higher than 0.6 and this confirms the high presence of small single-floor buildings in the sample.
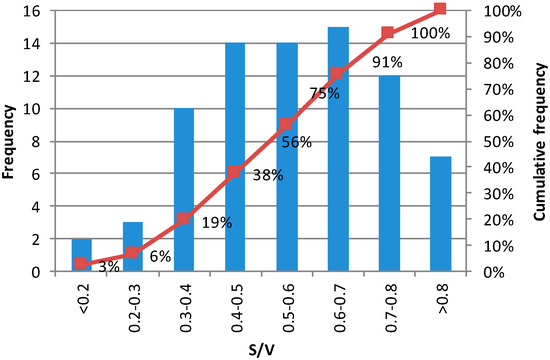
Figure 5.
Frequency distribution of schools in terms of S/V ratio.
3.2. Cost Framework
The cost of all the interventions on the school buildings, financed by European funds, sums to approximately 19.3 million euros. Around 13.2 million euros have been spent on the energy retrofit of the building envelope and just slightly more than 6 million euros for interventions on building systems and renewable energy sources. Over 50% of the interventions concern the building envelope, which accounts for approximately 70% of the costs.
The first observations of these data drive us to deepen an evaluation of effectiveness of the interventions. In building envelope renovation, the material choices and the realization of the works have an important impact on both the environmental and the technological quality of buildings.
The cost of renovation per floor area is in most of the cases below 500 €/m2 (Figure 6). This figure is significant for an ordinary cost that could represent the use of traditional technological standards, linked to common (not best) practices and, supposedly, to traditional materials.
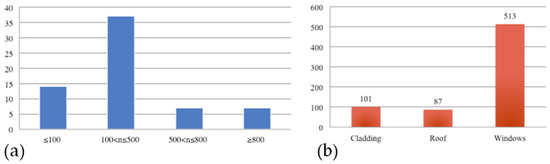
Figure 6.
Number of interventions as a function of cost per floor area (€/m2, (a)) and the cost per square meter of the interventions’ surface area (€/m2, (b)).
3.3. Retrofit Interventions
From the aforementioned database it was also possible to extract some information about the interventions carried out in the retrofits and the consequent improvement in energy class as defined by the Italian legislation [32]. The interventions can be divided in:
- envelope insulations (vertical walls insulation, roof insulation, windows replacement);
- energy service upgrades (heating, cooling);
- renewable energy sources implementation (solar, thermal, photovoltaic).
Figure 7 shows the frequency distribution of the kind of interventions proposed in the energy retrofit phase. It is noticeable that the vertical walls insulation interventions represent approximately half (50.6%) of the total ones and that 84.4% of the schools chose to replace windows. Also, the introduction of the photovoltaic system is very common and it has been implemented at a frequency of 81.8% of the sample. The integration of renewable energy sources can also be carried out thanks to the installation of solar thermal systems, but this happens in a lower percentage of the cases (29.9%). Finally, the interventions regarding the plants involve mainly the heating system with a few percentages implemented on the conditioning system. It is worth noticing that the interventions regarding the envelope, the energy systems, and the introduction of renewable energy systems were put in place by almost all the schools with percentages that are respectively 96%, 83%, and 86% of the overall schools considered in the study.
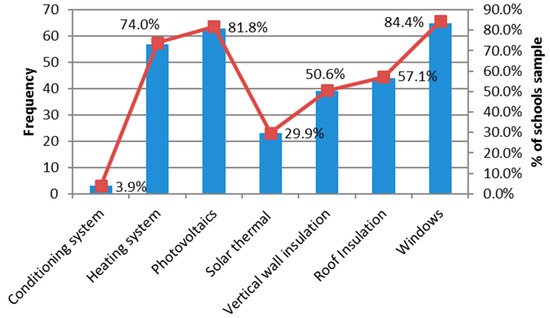
Figure 7.
Frequency distribution of retrofit interventions.
It is well-known that buildings energy efficiency can be determined by means of energy labeling procedures, in compliance with the Italian National Guidelines for Energy Labeling of Buildings [32].
Looking at the jumps in energy classes declared by the designers (Figure 8), 46.7% of the sample is characterized by an improvement of three or four energy classes, 26% by an improvement lower than three class jumps, and 27.3% by a jump of five or six classes.
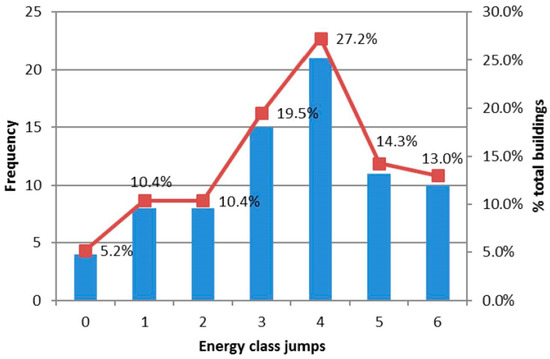
Figure 8.
Frequency distribution of jumps in energy classes according to the energy retrofit projects.
In 2013, the Lazio region published a call for proposals aiming at developing renewable energy systems, energy efficiency, and a reduction of the pollutant emissions through interventions able to increase the energy efficiency of the public buildings located within the regional area.
The funds were attributed by the regional administration following the criteria established in the call: conformity with the Italian legislation, coherence with the topic of the call, requirements of the proponent subjects. The validity of the proposal was evaluated considering the energy data available, the impact of the interventions, the presence of constraints, the complexity of the interventions, and the integration of the proposed retrofit action with initiatives about energy efficiency. Due to this, participants had to provide an energy consumption report in compliance with the Italian legislation, a description of the interventions to be actuated, and an estimation of the costs for each proposed intervention.
All schools proposed more than one intervention with the aim of achieving a deep improvement in their primary energy uses. The typology of proposed retrofits is quite uniform for all the schools because most of them put in place both interventions on envelope and on systems. The latter interventions consisted of both the improvement of the efficiency of the existing heating systems and the introduction of renewable energy sources. Because the public administration fully financed the retrofit interventions, the main goal of the schools’ administrators and designers was to maximize the savings and increase the number of possible interventions.
3.4. Preliminary Input Data Processing
When a comparison of the thermal energy uses has to be done, a normalization of the values of primary energy uses against the climatic conditions is necessary. The buildings included in the sample are located in the different cities and provinces of the Lazio region that are in three different Italian climatic zones, called C, D and E [32]. In particular, 30% of the schools are in climatic zone C, 48% in D, and 22% in E (see Figure 9). The climatic zones define areas with similar mean external temperatures during wintertime and consequently similar HDD. Certain areas in the Lazio region with lower HDD are in climatic zone C, and the areas with higher values are in climatic zone E. The values of the HDD can be easily found for each Italian city and town, as reported in the Italian legislation [33].
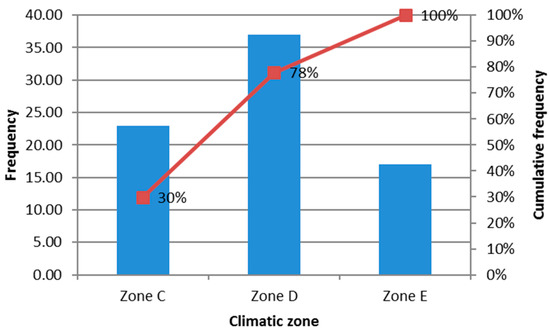
Figure 9.
Distribution of schools in the three climatic zones of Lazio Region.
In order to make the effects of the external weather conditions and gross heated volume negligible, it is possible to process the energy use data by employing the following equations:
where Ehn is the normalized value of the primary energy use for heating, Eh is the measured primary energy use for heating, HDD are the heating degree-days concerning the location of the school, HDDm is the mean value of the HDD of all the analyzed schools (equal to 1677 degree-days) and V is the gross heated volume.
Finally, it is worthy to notice that the schools’ energy uses depend on the occupancy schedule. In particular, the opening hours of care centers and nursery schools are established by the city council and, in Rome, they open generally from 8 am to 5 pm, from Monday to Friday with only few exceptions. The primary and secondary schools have a more variable opening time during the week because in some cases the afternoon education is not guaranteed. It was not possible to determine the afternoon opening hours for these schools during the entire 2012 year and so the value of primary energy uses was not normalized against the heating hours. However, this fact has a negligible influence on energy use because in many cases the building is characterized by central heating working also in the afternoon for the entire building because it is used for non-educational activities. For this reason, it can be stated that the working schedule of the heating system can be considered quite uniform for all the schools included in the sample.
Analyzing the energy use of the whole investigated building stock, it is possible to observe an average normalized value of the specific heating energy use of about 23 kWh/m3 (in 2012), with an average evaluated energy saving of about 30%, as reported in the executive projects. Table 1 lists the average consumptions and the energy savings as a function of the buildings’ construction years.

Table 1.
Average consumptions and the energy savings of the buildings’ stock.
3.5. Cluster Analysis
A cluster analysis can be a viable solution to provide the administrative institutions with a criterion for establishing which school building category the retrofit projects can prove most cost effective.
The first step of the work was to run the cluster analysis in order to divide the school samples in homogenous groups. The analysis was run with the k-means partitioning method [34]. The k-means method is one of the most popular in cluster analysis and it allows the creation of K non-overlapping clusters using Euclidean distance to assign every element to the closest centroid. Once the initial values are randomly individuated, the method is characterized by a cyclic procedure that stops the iterations after minimizing the sum of squared Euclidean distances or the sum of squared errors (SSE) of the elements from the respective centroids. The analysis was implemented in the Matlab code (MathWorks, version R2017a, Natick, MA, USA) [35].
One of the useful parameters to select the projects (from a cost-benefit point of view) is the cost for saved kWh or the cost-benefits ratio (CBr). The value of the CBr has been calculated from the data declared in the executive projects presented in order to obtain the financing. In particular, the projects indicate the cost for every intervention and the cumulative savings obtainable from the sum of all of them. From these data it was not possible to determine the cost-benefits ratio for each single retrofit intervention and the overall CBr was calculated for every school refurbishment. This ratio was related with the different parameters available, such as those describing the building’s geometry, heating primary energy use, and retrofit intervention typology. In a first phase, the construction year of the buildings was considered as an independent parameter able to describe the envelope insulation characteristics. However, the first analysis showed a low significance of that parameter because of the remarkable uniformity of the construction period of the schools included in the sample. 84% of the schools were built between 1950 and 1990, before the main Italian law on energy efficiency in buildings was implemented [29]. Since the clustering seemed not to be deeply influenced by the construction period of the buildings, it was excluded from the analysis.
The parameters considered for the cluster analysis are all the ones that were available and able to represent the energy and constructive features of the schools. Furthermore, these parameters are the most common and strongest indicators of energy use and cost-benefit in buildings. Different literature studies considered them in order to estimate energy consumption and to run a cluster analysis [9,36,37]. Such parameters, used to perform and validate the clustering, were obtained from the executive projects of the retrofits, and correlated with the cost-benefits ratio. They are:
- The shape factor of the school (S/V): it defines the ratio between the dispersing surfaces and the heated volume.
- The heating primary energy use in 2012, normalized through the HDD of the climatic zone and the gross heated volume (Evhn, defined in Equation (2)): these values were provided by the administration office that manages the heating services of the schools. The available data includes domestic hot water consumption. However, data shows that the domestic hot water demand can be considered negligible if compared with the space heating. This is due to the fact that in Italy, pupils generally do not use the gym showers after training [38].
- The declared jumps in energy classes given by the designers (J): before the retrofit, all of the schools were classified either G or F, which are the higher consumption energy classes for the Italian Legislation.
- The gross heated volume of the school building (V).
- The normalized primary saved energy for heating per year (ESn): both the primary energy saved and the heated volume were declared for the admission to public funding. This value also permits us to indirectly take into account the number of the retrofit interventions that were developed by the schools. The amount of heating primary energy reduction, in fact, can vary significantly when multiple measures are implemented.
Several tests were performed to check if the number of parameters could be reduced. Tests with 3, 4, and 5 parameters led to a poorer performance of cluster analysis because of the lower values of R2adj.
The cluster analysis was performed excluding the schools characterized by an incomplete dataset (missing a value of at least one of the above-mentioned parameters); the resulting number of schools was reduced from 80 to 60.
In order to understand if linear correlations between the cost-benefits ratio and the five parameters previously mentioned can be established, the multiple linear regression is applied. This regression is run for the elements belonging to each cluster, considering the cost-benefits ratio as a dependent output of the five independent parameters (called predictors). Once the clustering and the regression analyses are run, the adjusted index of determination (R2adj) and the probability value (the so-called p-value) are calculated to validate the clustering. The clustering is not accepted until no further improvement of the index R2adj is obtained after a prescribed number of trials and a p-value lower than 5% is calculated, since this limit is considered good for the rejection of a null hypothesis [39].
It is well known that the k-means clustering method is sensitive to the initial centroids. Consequently, if a poor value of the determination index is calculated, the clustering runs again, updating the initial centroids that were randomly created. Moreover, the k-means clustering method is sensitive to outliers since a small number of elements can substantially affect the mean value. The outliers are detected through the residuals interval of confidence. The outliers correspond to the observations of the interval that does not contain zero. The number of detected buildings is just three because these correspond to the outliers arising from multiple linear regression analyses. The corresponding schools are not considered in the analysis with the goal of obtaining a more robust clustering. The exclusion brings a tighter residuals interval of confidence and consequently the reduction of statistical error indexes.
Only two clusters were considered because a higher number would have led to groups characterized by a low number of schools, not statistically representative. Moreover, considering more than two clusters, the overall performance in term of R2adj was severely degraded for at least one cluster.
After the identification of the clusters and the centroids, two real schools (the nearest to the centroids) were modeled by means of a dynamic simulation code, in order to assess if the declared and the actually achieved energy savings are comparable.
This methodological approach can be summarized in the flow-chart shown in Figure 10.
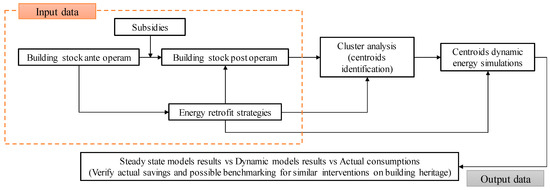
Figure 10.
Methodology flow chart.
4. Results and Discussion
Two clusters composed of 39 and 18 schools respectively, were obtained as a result of the cluster analysis described in Section 3.5. The index of determination and the p-value were calculated for both clusters and for the whole sample, prior to cluster subdivision. The obtained values demonstrate that the clustering is useful to reduce statistical errors, as seen in Table 2. Good values of the p-value parameter were found and they guarantee the possibility of excluding the H0 hypothesis since they are lower than 0.05 [9]. Moreover, better determination coefficient values were found compared to the R2 calculated before the clustering analysis for the entire sample.
Table 2.
R2adj and p-value calculated for each cluster and for the sample without clustering.
Once the centroids were identified, the mean characteristics of the elements belonging to each cluster can be described with the centroids’ coordinates (see Table 3).
Table 3.
The Centroids’ coordinates for every cluster.
Figure 11 represents a parallel coordinates plot of the normalized parameters describing the centroids. Each parameter was normalized compared to its maximum value. The plot highlights the centroids’ characteristics by a visual comparison of the parameters that correspond to the parallel axis.
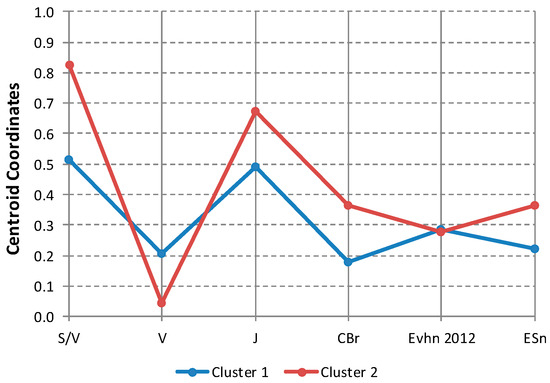
Figure 11.
Normalized coordinates of the centroids of the two clusters.
Cluster 1 represents the schools sample characterized by the lower S/V ratio and bigger volumes and the lower cost-benefits one. This cluster is composed by the largest schools. As the retrofits of schools in Cluster 1 are less performing (only 6.12 kWh year/m3 against the 10.10 kWh year/m3 of Cluster 2), also the energy class jumps declared in the design phase are lower. The declared savings achievable by the retrofit interventions represent a mean percentage of about 24% of the normalized energy uses recorded in 2012. The cluster is mainly composed by primary, secondary and nursery schools with a very low percentage of kindergartens (7%). The cluster 1 features are listed in Table 4.
Table 4.
Cluster 1 features (39 buildings).
Small volume schools with a higher shape ratio belong to Cluster 2. These schools are characterized by levels of heating energy use normalized per unit of heated volume that are comparable to the schools belonging to Cluster 1. The mean thermal energy savings that can be obtained, instead, are higher and correspond to 40% of the normalized heating energy use. Consequently, the mean declared jumps of energy classes are higher than in the previous cluster. The schools belonging to cluster 2 are mainly nursery schools (45%), kindergarten (20%), and primary schools (34%) and there is no presence of secondary schools. The cluster 2 features are listed in Table 5.
Table 5.
Cluster 2 features (18 buildings).
Figure 12 shows the energy savings for both clusters as a function of the buildings’ volume. Schools belonging to Cluster 2 are characterized by an average energy saving of 10.09 kWh/m3, while the educational buildings in Cluster 1 have an average energy saving of 6.12 kWh/m3. It is worthy to notice how the smallest schools belonging to Cluster 2 are characterized in almost half of the cases by energy savings higher than 15% and, on the other hand, the schools that are included in cluster 1 show in all cases an energy savings percentage lower than 15%.
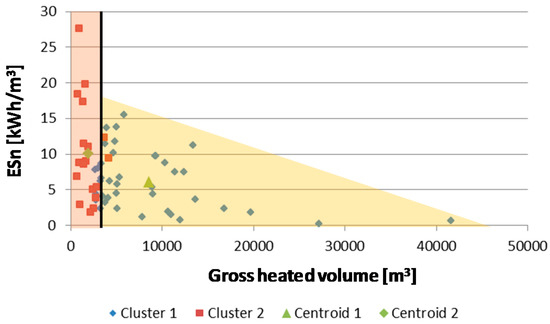
Figure 12.
Declared energy savings (kWh/m3) versus gross heated volume for the two clusters.
This trend means that small buildings generally have the possibility of realizing a higher number of energy retrofit interventions. Usually in large buildings the retrofit interventions are more complex to be realized because of the complexity of the building shape and of the building systems. For example, the roofs of large multiple floor buildings can be characterized by the presence of thermal machines and distribution canalizations. This fact causes many problems in the installation of photovoltaic panels or insulation panels. Similarly, the façade can be very articulated with the presence of balconies, pilasters, string courses and cornices, and these elements increase the difficulties in the solution of thermal bridges and in the application of insulation on the outside skin. For small single floor building, on the contrary, the retrofit interventions are in general simpler to realize and can bring higher energy savings. The higher potential of energy saving is caused by the higher envelope surface per unit of heated volume. The roof surface of a small building, for example, is proportionally higher in comparison with the roof surface in large buildings. The considerable potential of energy saving of small schools is also confirmed by the higher number of energy class jumps that is 4.72 for the centroid of Cluster 2, and 3.43 for the centroid of Cluster 1.
Looking at the cost-benefits ratio, the analysis shows that the higher reduction of energy uses in small schools is not followed by a proportional increase of costs. The cost-benefits ratio, in fact, is higher for schools belonging to Cluster 2 in comparison with Cluster 1. This fact discourages the retrofit of the stock of small schools and suggests a possible reduction of the retrofit interventions to implement in the future.
4.1. Clusters Reference Building Assessment
As mentioned in Section 2, several studies applied the cluster analysis to the buildings’ energy uses. This method has been employed to define homogenous classes and reference buildings within classes relying on the data connected to actual energy demands. In particular, in [9] the authors correlated the real energy demands of the buildings’ stock to their geometrical and technical characteristics by means of proper statistical analyses. Starting from this study, the novelty of this work deals with the cluster analysis application aiming at highlighting the relationship between the cost-benefits ratio and the five parameters mentioned in Section 3.5, which better describe the correlation between costs and benefits.
Once the clustering has been performed, the Euclidean distance of all the schools from the respective centroids allows to identify the ones that are the closest to the centroids. These schools can be considered the reference buildings for the cluster they belong to, since their characteristics best approximate the mean values represented by the centroids’ coordinates. For Cluster 1 the lowest distance was found for a school located in the province of Frosinone, climatic zone D, called Building 1 (Figure 13). This school building (primary and nursery education) was built in 1930 and is characterized by an E shaped plan and is two floors high. The volume of the school is 5990 m3 and the S/V ratio is equal to 0.41 1/m. The retrofit interventions involved the heating system and the envelope of the building included only vertical walls, leading to a declared specific energy saving equal to 4.53 kWh/m3 with an expected improvement in energy classes from class G to class D. In particular, the interventions on the heating system regard the replacement of the generator, which was a traditional boiler fueled with natural gas, equipped with a new hybrid system that is a 200 kW condensing boiler that integrates a 50 kW heating pump when the temperature is between 7 and 12 °C. Moreover, when the temperature goes below 7 °C only the boiler provides thermal energy. The interventions on the envelope are related to the windows replacement and is initially characterized by single glass and iron frames. They were replaced with double low-emittance 6-15-6 glass filled with argon and polyvinyl chloride (PVC) frames. The cost per saved kWh of the interventions is 6.86 €/kWh.
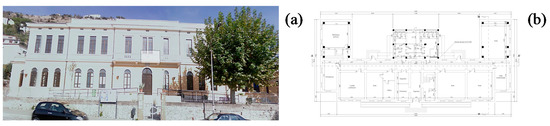
Figure 13.
The cluster 1 reference school building (Building 1): (a) actual view; (b) building ground floor map.
Considering that the Cluster 2 building closest to the centroid is a school located near Rome, in climatic zone C, called Building 2 (Figure 14). The building, dated back to 1978, has a different structure compared to the previous one (S/V ratio equal to 0.79) and it is characterized by a lower volume of 4156 m3 with a total floor area equal to 1100 m2 over two floors. The school includes a gym located on one side, but it was not considered for the retrofit interventions. The energy retrofit project regarded both the heating system and the envelope, with interventions on vertical and horizontal surfaces (including the single glass windows replacement). Regarding the envelope interventions, the traditional aluminum-framed windows were replaced with better performing double glazing 4-12-4 PVC framed ones, and extruded polystyrene (XPS) insulation panels were integrated in the vertical walls and the roof. On the other hand, the heating system retrofit was characterized by generator and radiator replacement. A new pressurized boiler with higher efficiency was installed to replace the old diesel fueled generator, which supplied thermal energy to the building before the retrofit. Moreover, a photovoltaic system was planned in the declared project. The declared specific energy saving is equal to 9.4 kWh/m3 modifying the energy class from G to B, with a funding application of 12.33 € per saved kWh.
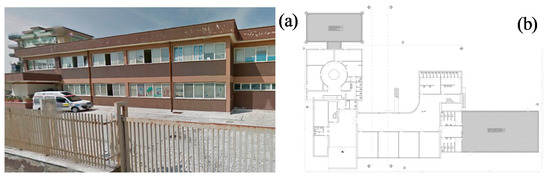
Figure 14.
The Cluster 2 reference school building (Building 2): (a) actual view; (b) building ground floor map.
4.2. Energy Performance Analysis of the Reference Schools
A dynamic energy simulation, employing the dynamic code TRNSYS (Transient System Simulation Tool) [40], was run for the two reference schools aiming at verifying the declared energy savings. It has been widely demonstrated that, employing this dynamic code, it is possible to correctly reproduce the building geometry and the external environmental conditions in order to accurately estimate energy uses. The TRNSYS Build allows us to generate the building model, and the external environmental conditions are applied by means of TRNSYS Studio (University of Wisconsin, Madison, WI, USA). The energy audits and the information included in the schools’ official documents provided the needed parameters for the simulations. The temperature set point for the heating period was set equal to 20 °C, according to the Italian Standard [41]. The data employed in the simulation models are summarized in Table 6.
Table 6.
Buildings model data set before retrofit.
The simulated heating energy needs of each building were compared with the actual data related to the heating energy uses. The simulation can be considered calibrated according to the acceptance criteria defined in the American Society of Heating and Air-Conditioning Engineers (ASHRAE) Standard [42], taking into account the Mean Bias Error (MBE), and the Coefficient of Variation of the Root Mean Squared Error (CV(rmse)).
Analyzing the measured and simulated energy uses, for the Building 1 dynamic model a MBE equal to −4.8%, and a CV(rmse) equal to 9.6% were obtained. On the other hand, the Building 2 model obtained a MBE value equal to 0.42%, and a CV(rmse) value equal to 5.1%.
These two reference buildings were retrofitted by improving the envelope performance, as mentioned before in Section 4.1. Table 7 lists the data set employed to simulate the reference buildings after the refurbishment phase.
Table 7.
Buildings’ model data set post retrofit.
Taking into account the reference building (Building 1) that is the closest to the Cluster 1 centroid, Table 8 lists the data about the declared energy savings stated in the technical documents provided by the designers before the retrofit phase, the achievable savings estimated by the means of the dynamic simulations after the refurbishment and, finally, the actual measured energy uses in 2016. Weather-data files in the building energy models were relative to 2012, the energy use reference year, which allows making the simulated energy uses comparable. Observing the percentage of energy savings in Table 8, it is possible to notice that the declared savings by the designer after the retrofit and the achievable energy savings obtained by means of the dynamic model are not far and the differences can be related to the different adopted simulation codes. The declared energy savings were obtained by means of steady-state simulation tools, less accurate than the dynamic one, yet able to fully reproduce hourly environmental boundary conditions and consider structural inertial effects [43]. These percentage differences can be also ascribed, to a lesser extent, to the modified weather conditions, which play an important role for calculating buildings energy demands. Indeed, temperatures in the winter period of 2016 were milder compared to the ones in 2012. Moving from the analysis of the 2012 energy use data to the 2016 ones, the actual energy needs after the retrofit confirm the reliability of the dynamic simulation model and the prediction obtained by the same model related to 2012, which indicates 24% energy savings in 2012 and 20% in 2016.
Table 8.
Comparison between declared, achievable and actual energy uses (Building 1).
The same information related to Building 2 is provided in Table 9. Also in this case, the declared savings and the achievable ones in 2012 are comparable, and the highlighted differences can be ascribed to the different simulation methods. Also in this case, moving from 2012 to 2016 data, the dynamic simulation model can be considered the most effective tool to properly reproduce the actual energy needs. In particular, comparing the actual energy need in 2012 and the achievable energy savings obtained by the dynamic code in 2012, it is possible to observe a percentage difference equal to 35% and this value is very close to the actual energy need after the retrofit phase in 2016 (33%).
Table 9.
Comparison between declared, achievable, and actual energy uses (Building 2).
Analyzing data about Building 1, it is possible to observe that the real energy saving is lower than the declared one of about 10% and, considering the comparison between the simulated and the actual energy demand, a difference of about 4% can be noticed.
The same findings can be noticed analyzing the values obtained through Building 2. In this case, the actual energy saving is lower than the declared one of about 7% and, comparing simulated and actual energy needs, they differ only by 2%.
It is worth noticing that the above-mentioned energy savings could be more accurately estimated employing some indicators on the measures persistence [44]. However, due to the lack of documentation (only one year of post-retrofitting energy use was available), it has not been possible to prove the persistence of energy efficiency measures.
5. Conclusions
Heating energy uses of school buildings are responsible for a significant part of the total energy demands and, due to this, proper cost-effective strategies for retrofitting are needed. In this framework, with the aim of improving the energy use of existing schools by means of proper retrofit interventions and of efficiently allocating public funds, an Italian school buildings’ stock was analyzed and classified through a cluster analysis. This approach was implemented to develop a methodology that can be useful to guide the selection of a building stock to be retrofitted from a cost efficiency point of view. A sample composed of 80 school buildings, located in the Lazio region (central Italy) and characterized by different features, construction age, and technologies was investigated. The refurbished buildings were classified in homogeneous clusters and, for each of them, an actual building, which best represents the cluster characteristics, was identified, simulated and verified.
In particular, starting from a domain composed of several parameters able to properly describe the whole analyzed buildings’ stock, five of them, which are considered independent predictors, were selected to apply multiple linear regression with the cost-benefits ratio as the dependent variable. The regression was performed for the data sets belonging to all possible clusters. The analysis led to the identification of two clusters. The clustering was significant since an improvement of the index R2adj was found, and the model’s statistical significance was verified through the p-value. The clusters are characterized by two centroids for which two real reference buildings were identified. The adjusted index of determination R2adj is about 0.6 for Cluster 1, and about 0.7 for Cluster 2.
The declared energy savings stated by the designers before the retrofit phase (as a predictive figure), the achievable energy savings calculated by means of dynamic simulations after the refurbishment, and the actual building energy demands were finally compared in order to validate the methodological approach. The implemented dynamic energy simulation, performed for the two reference schools, highlighted that the real energy saving is lower than the one declared by the designers after the refurbishment phase. Considering the comparison between the simulated and the actual energy demand, a very low percentage difference can be noticed in the Cluster 1 analysis, as well as the Cluster 2 one. These differences can be ascribed to the employment of different energy simulation codes. Steady-state and dynamic codes differ in their capability to describe physical phenomena over time (environmental climatic conditions and inertial effects) and, nowadays, it is well-known that transient system simulation tools can provide more effective and reliable simulation results. Beyond the differences between the two simulation approaches, we can say that the declared energy savings can be considered sufficiently reliable and representative of the actual performances of the retrofitted buildings. This constitutes an a-posteriori justification of the inclusion of declared energy savings in the group of predictors.
The proposed methodological approach can be useful to define reference buildings, considered as representative of a building stock characterized by similar structural, technological and energy features. The reference buildings could be used as models for further simulations able to quantify the energy savings related to specific retrofit interventions and the corresponding cost-benefit analysis. The results could be extrapolated to each corresponding cluster and this could help the Public Administration in decision-making and prioritizing the energy retrofit of the buildings’ stock with the lowest cost-efficiency ratio. Future developments will therefore analyze more in detail the two reference buildings in order to evaluate the persistence over time of the energy savings, the cost-effectiveness of further retrofit interventions, and the effect of management measures.
Acknowledgments
The research leading to these results was supported by the Lazio Region administration under the project POR FESR LAZIO 2007/2013.
Author Contributions
Paola Marrone and Francesco Asdrubali designed this research, analyzed the results and checked the manuscript throughout the whole revision process. Laura Calcagnini and Gianluca Grazieschi provided the statistical description of the schools’ sample. Paola Gori and Gianluca Grazieschi performed the cluster analysis. Luca Evangelisti and Paola Gori carried out the dynamic simulations. Laura Calcagnini, Gianluca Grazieschi and Luca Evangelisti wrote the paper and revised it.
Conflicts of Interest
The authors declare no conflict of interest.
Nomenclature
| CBr [€/kWh] | Cost-benefits ratio |
| COP | Coefficient of performance |
| CV(rmse) | Coefficient of variation of the root mean squared error |
| Eh [kWh/year] | Measured primary energy use |
| Ehn [kWh/year] | Normalized value of the primary energy use |
| Esn [%] | Normalized saved primary energy saving per year |
| Evhn [kWh/m3 year] | Normalized value of the primary energy use over volume |
| HDD [°C day] | Heating degree days |
| HDDm [°C day] | Average heating degree days |
| J | Declared jump in energy classes |
| MBE | Mean Bias Error |
| p-value | Probability value |
| R2adj | Adjusted index of determination |
| S [m2] | Dispersing building surfaces |
| U-value [W/m2K] | Thermal transmittance |
| V [m3] | Gross heated volume |
References
- The European Parliament. Directive 2010/31/EU of the European Parliament and of the Council of 19 May 2010 on the Energy Performance of Buildings; The European Parliament: Strasbourg, France, 2010. [Google Scholar]
- Ma, Z.; Cooper, P.; Daly, D.; Ledo, L. Existing building retrofits: Methodology and state-of-the-art. Energy Build. 2012, 55, 889–902. [Google Scholar] [CrossRef]
- Evangelisti, L.; Guattari, C.; Gori, P. Energy Retrofit Strategies for Residential Building Envelopes: An Italian Case Study of an Early-50s Building. Sustainability 2015, 7, 10445–10460. [Google Scholar] [CrossRef]
- Evangelisti, L.; Guattari, C.; Gori, P.; De Lieto Vollaro, R. In Situ Thermal Transmittance Measurements for Investigating Differences between Wall Models and Actual Building Performance. Sustainability 2015, 7, 10388–10398. [Google Scholar] [CrossRef]
- The European Parliament. Directive 2012/27/EU of the European Parliament and Council of 25 October 2012 on Energy Efficiency; The European Parliament: Strasbourg, France, 2012. [Google Scholar]
- MIUR Anagrafe Dell’edilizia Scolastica. Available online: http://www.istruzione.it/ediliziascolastica/anagrafe.shtml (accessed on 12 April 2017).
- Ma, Z.; Yan, R.; Nord, N. A variation focused cluster analysis strategy to identify typical daily heating load profiles of higher education buildings. Energy 2017, 134, 90–102. [Google Scholar] [CrossRef]
- Dias Pereira, L.; Raimondo, D.; Corgnati, S.P.; Gameiro Da Silva, M. Energy consumption in schools—A review paper. Renew. Sustain. Energy Rev. 2014, 40, 911–922. [Google Scholar] [CrossRef]
- Arambula Lara, R.; Pernigotto, G.; Cappelletti, F.; Romagnoni, P.; Gasparella, A. Energy audit of schools by means of cluster analysis. Energy Build. 2015, 95, 160–171. [Google Scholar] [CrossRef]
- Thewes, A.; Maas, S.; Scholzen, F.; Waldmann, D.; Zürbes, A. Field study on the energy consumption of school buildings in Luxembourg. Energy Build. 2014, 68, 460–470. [Google Scholar] [CrossRef]
- Ascione, F.; Bianco, N.; De Masi, R.F.; Mauro, G.M.; Vanoli, G.P. Energy retrofit of educational buildings: Transient energy simulations, model calibration and multi-objective optimization towards nearly zero-energy performance. Energy Build. 2017, 144, 303–319. [Google Scholar] [CrossRef]
- García, I.; Raslan, R.; Ruyssevelt, P.; Morillón, D. ExRET-Opt: An automated exergy/exergoeconomic simulation framework for building energy retrofit analysis and design optimisation. Appl. Energy 2017, 192, 33–58. [Google Scholar] [CrossRef]
- Di Giuseppe, E.; Iannaccone, M.; Telloni, M.; D’Orazio, M.; Di Perna, C. Probabilistic life cycle costing of existing buildings retrofit interventions towards nZE target: Methodology and application example. Energy Build. 2017, 144, 416–432. [Google Scholar] [CrossRef]
- Santamouris, M.; Balaras, C.A.; Dascalaki, E.; Argiriou, A.; Gaglia, A. Energy consumption and the potential for energy conservation in school buildings in Hellas. Energy 1994, 19, 653–660. [Google Scholar] [CrossRef]
- Dascalaki, E.G.; Sermpetzoglou, V.G. Energy performance and indoor environmental quality in Hellenic schools. Energy Build. 2011, 43, 718–727. [Google Scholar] [CrossRef]
- Technical Report Mairie de Paris Rénovation Énergétique des Écoles Parisiennes Grâce au Contrat de Partenariat et de Performance Energétique (CPPE). Available online: http://mycovenant.eumayors.eu/docs/benchmarks/docs/103999_1411746663.pdf (accessed on 13 March 2018).
- Katafygiotou, M.C.; Serghides, D.K. Analysis of structural elements and energy consumption of school building stock in Cyprus: Energy simulations and upgrade scenarios of a typical school. Energy Build. 2014, 72, 8–16. [Google Scholar] [CrossRef]
- Desideri, U.; Proietti, S. Analysis of energy consumption in the high schools of a province in central Italy. Energy Build. 2002, 34, 1003–1016. [Google Scholar] [CrossRef]
- Dall’O, G.; Sarto, L. Potential and limits to improve energy efficiency in space heating in existing school buildings in northern Italy. Energy Build. 2013, 67, 298–308. [Google Scholar] [CrossRef]
- Corgnati, S.P.; Corrado, V.; Filippi, M. A method for heating consumption assessment in existing buildings: A field survey concerning 120 Italian schools. Energy Build. 2008, 40, 801–809. [Google Scholar] [CrossRef]
- Walter, T.; Sohn, M.D. A regression-based approach to estimating retrofit savings using the Building Performance Database. Appl. Energy 2016, 179, 996–1005. [Google Scholar] [CrossRef]
- Zhao, H.; Magoulès, F. A review on the prediction of building energy consumption. Renew. Sustain. Energy Rev. 2012, 16, 3586–3592. [Google Scholar] [CrossRef]
- Gaitani, N.; Lehmann, C.; Santamouris, M.; Mihalakakou, G.; Patargias, P. Using principal component and cluster analysis in the heating evaluation of the school building sector. Appl. Energy 2010, 87, 2079–2086. [Google Scholar] [CrossRef]
- Santamouris, M.; Mihalakakou, G.; Patargias, P.; Gaitani, N.; Sfakianaki, K.; Papaglastra, M.; Pavlou, C.; Doukas, P.; Primikiri, E.; Geros, V.; et al. Using intelligent clustering techniques to classify the energy performance of school buildings. Energy Build. 2007, 39, 45–51. [Google Scholar] [CrossRef]
- European Commission. Commission Delegated Regulation (EU) No 244/2012 of 16 January 2012 Supplementing Directive 20102/31/EU; European Commission: Brussels, Belgium, 2012. [Google Scholar]
- Raatikainen, M.; Skön, J.; Leiviskä, K.; Kolehmainen, M. Intelligent analysis of energy consumption in school buildings. Appl. Energy 2016, 165, 416–429. [Google Scholar] [CrossRef]
- Hong, T.; Koo, C.; Jeong, K. A decision support model for reducing electric energy consumption in elementary school facilities. Appl. Energy 2012, 95, 253–266. [Google Scholar] [CrossRef]
- Salvalai, G.; Malighetti, L.E.; Luchini, L.; Girola, S. Analysis of different energy conservation strategies on existing school buildings in a Pre-Alpine Region. Energy Build. 2017, 145, 92–106. [Google Scholar] [CrossRef]
- Italian Parliament Law number 373, Norme per il Contenimento del Consumo Energetico per usi Termici Negli Edifici; Gazzetta Ufficiale: Rome, Italy, 1976. (In Italian)
- Ministry of Public Works. Italian Legislation: Norme Tecniche Aggiornate Relative All’edilizia Scolastica, ivi Compresi gli Indici di Funzionalità Didattica, Edilizia ed Urbanistica, da Osservarsi nella Esecuzione di Opere di Edilizia Scolastica; Gazzetta Ufficiale: Rome, Italy, 1976.
- Italian Parliament Law Number 23, Norme per L’edilizia Scolastica; Gazzetta Ufficiale: Rome, Italy, 1996.
- Italian Governament Minister Decree 26/06/2009: National Guidelines for Building Energy Labelling; Gazzetta Ufficiale: Rome, Italy, 2009.
- President of Italian Republic President of Republic Decree of 26 August 1993, Regolamento Recante Norme per la Progettazione, L’installazione, L’esercizio e la Manutenzione Degli Impianti Termici Degli Edifici ai fini del Contenimento dei Consumi di Energia; Gazzetta Ufficiale: Rome, Italy, 1993.
- Wu, J. Advances in K-means Clustering: A Data Mining Thinking; Springer Science & Business Media: Berlin, Germany, 2012; ISBN 9783642298073. [Google Scholar]
- Matlab. Available online: https://it.mathworks.com/products/matlab.html (accessed on 13 March 2018).
- Capozzoli, A.; Grassi, D.; Causone, F. Estimation models of heating energy consumption in schools for local authorities planning. Energy Build. 2015, 105, 302–313. [Google Scholar] [CrossRef]
- Beusker, E.; Stoy, C.; Pollalis, S.N. Estimation model and benchmarks for heating energy consumption of schools and sport facilities in Germany. Build. Environ. 2012, 49, 324–335. [Google Scholar] [CrossRef]
- Zinzi, M.; Agnoli, S.; Battistini, G.; Bernabini, G. Deep energy retrofit of the T. M. Plauto School in Italy—A five years experience. Energy Build. 2016, 126, 239–251. [Google Scholar] [CrossRef]
- Halkidi, M.; Batistakis, Y.; Vazirgiannis, M. On clustering validation techniques. J. Intell. Inf. Syst. 2001. [Google Scholar] [CrossRef]
- TRNSYS Transient System Simulation Tool. Available online: http://www.trnsys.com/ (accessed on 13 March 2018).
- Technical Regulation“UNI/TS 11300: 2008”. Energy Performance of Buildings. Available online: http://www.cti2000.eu/la-uni-ts-11300/ (accessed on 13 March 2018).
- Technical Regulation ANSI/ASHRAE ASHRAE Guideline 14-2002 Measurement of Energy and Demand Savings. Ashrae 2002. Available online: http://www.ashrae.org (accessed on 13 March 2018).
- De Lieto Vollaro, R.; Guattari, C.; Evangelisti, L.; Battista, G.; Carnielo, E.; Gori, P. Building energy performance analysis: A case study. Energy Build. 2015, 87, 87–94. [Google Scholar] [CrossRef]
- Nord, N.; Sjøthun, S.F. Success factors of energy efficiency measures in buildings in Norway. Energy Build. 2014, 76, 476–487. [Google Scholar] [CrossRef]
© 2018 by the authors. Licensee MDPI, Basel, Switzerland. This article is an open access article distributed under the terms and conditions of the Creative Commons Attribution (CC BY) license (http://creativecommons.org/licenses/by/4.0/).