Article

The Effects of NaCl Concentration and Confining Pressure on Mechanical and Acoustic Behaviors of Brine-Saturated Sandstone

1
State Key Laboratory for Geomechanics and Deep Underground Engineering, School of Mechanics and Civil Engineering, China University of Mining and Technology, Xuzhou 221116, China
2
GeoEnergy Research Centre, Faculty of Engineering, University of Nottingham, University Park, Nottingham NG7 2RD, UK
*
Author to whom correspondence should be addressed.
Energies 2018, 11(2), 385; https://doi.org/10.3390/en11020385
Submission received: 25 December 2017 / Revised: 16 January 2018 / Accepted: 23 January 2018 / Published: 7 February 2018
(This article belongs to the Special Issue Geothermal Energy: Utilization and Technology 2018)

Abstract

:
To better understand the mechanical behavior of rock with brine saturation, conventional triaxial experiments were carried out on sandstone for a range of confining pressures (0–60 MPa) and NaCl concentrations (0–30%). As the confining pressure and NaCl concentration increased, the triaxial compressive strength, crack damage threshold, Young’s modulus, cohesion, and internal friction angle all increased. Real-time ultrasonic wave and acoustic emission (AE) techniques were used to obtain the relationship between acoustic behavior and stress level during the whole triaxial compression process. During the whole deformation process, the evolution of P-wave velocity and accumulated AE count could be divided into four phases. The microstructural characteristics of brine-saturated sandstone, before and after loading, indicated that the strength enhancement mechanism may be attributed to an increase in inter-particle friction resulting from salt crystallisation around the points of contact. The angle of friction increased by more than 86% at maximum NaCl concentration compared to that for distilled water. The NaCl deposition in the pore space resulted in nonlinear strength increases for the brine-saturated sandstone specimens with increasing salinity. The present study is expected to improve the knowledge of the strength and failure mechanisms of sedimentary rock in deep saline aquifers.

1. Introduction

Underground water is anywhere in rock engineering, including geothermal reservoirs, hydropower dam and tunnelling and geological CO2 sequestration [1]. Rock–water interaction plays an important role in the stability and safety of rock engineering. In general, rock strength will be reduced by the presence of pore water [2,3]. The water weakening effect in rock strength is a result of mechanical and chemical effects [4,5]. Recently, the effect of brine water on the mechanical behavior of rock has been attracting attention, due to deep saline aquifer identified as one of the most promising sites of CO2 storage [6,7]. Therefore, the interaction between brine and rock is the emphasis of this study.
In previous studies, a series of laboratory tests were carried out to investigate the effect of brine on the strength properties and deformation behaviour of sedimentary rocks. Shukla et al. [8] conducted uniaxial compression tests for sandstone specimens with varying salinity including 0%, 2%, 5%, 10% and 15%. They analyzed the stress–strain responses, compressive strength, elastic modulus and peak strain, as well as the threshold stresses (such as crack closure stress, crack initiation stress and unstable crack propagation stress). Their experimental results also indicated that different types of sandstone material exhibited different responses to the salinity level. Rathnaweera et al. [9] performed uniaxial compression tests on brine-saturated sandstone specimens. Their experimental results suggested that the strength is enhanced with the increase of NaCl concentration values. The influence of NaCl concentration value and curing time on the mechanical behavior of sandstone under uniaxial compression were investigated by Nasvi [10]. Their experimental results showed that NaCl did not appear to have any obvious influence on the uniaxial compressive strength (UCS) of the tested sandstone.
However, to maintain the CO2 in a supercritical state (the critical temperature is 31.1 °C and the pressure is 7.39 MPa), the candidate saline aquifers for CO2 sequestration are located 800–2000 m below the earth’s surface [6,8]. At such depth, confining stress significantly influences the mechanical properties of reservoir rocks. Therefore, the study of the triaxial compressive behavior is very important for the understanding of brine and rock interactions. In the previous literature, only a few studies were conducted on the mechanical properties of brine-saturated sandstone under triaxial compression. For instance, conventional triaxial compression tests on sandstone specimens under dry and brine-saturated conditions were carried out by Zheng et al. [11]. Water softening and weakening effects on cementation resulted in strength reductions compared with the dry specimens. Rathnaweera et al. [12] tested sandstone samples with different confining pressures (e.g., 5–20 MPa) and brine salinity levels (0–30%) under triaxial compression tests. Based on the nonlinear relationship between the peak strength of brine-saturated sandstone and confining pressure, they proposed a modified strength criterion to simulate the experimental envelopes.
To date, the mechanism causing the differences in the triaxial mechanical behavior with various salinity level has not been fully investigated. Besides, in the previous studies on sandstone specimens under brine saturation, the real-time ultrasonic velocity monitoring technique was not used. Therefore, in this study, sandstone specimens saturated with varying NaCl concentrations were tested under triaxial compression with a range of confining pressures. Moreover, real-time ultrasonic wave and AE techniques were used to obtain the relationship between acoustic behavior and stress level under triaxial compression. The microstructural characteristics of brine-saturated sandstone (before and after loading) were qualitatively assessed using optical microscopy.

2. Experimental Methodology

2.1. Specimen Preparation

Most current CO2 sequestration in saline aquifers is surrounded by sedimentary sandstone material due to its adequate porosity and permeability. The maximum capacity of CO2 sequestration in deep saline aquifers is evaluated to be 200,000 Gt [6]. Quartz-rich sandstone with high permeability and porosity values, located in Zunyi City of Guizhou Province, China, were used for this study. The mercury intrusion porosimetry (MIP) result of the tested sandstone shows that the porosity is 16.20%. The surface digital photograph, X-ray micro computerized tomography (CT) slice and scanning electron microscopic (SEM) image are presented in Figure 1. From Figure 1, sandstone is a medium-grained, microscopically heterogeneous and macroscopically homogeneous material. The sandstone had an average bulk density of 2130 kg/m3. The average initial P-wave velocity of the sandstone was 2530 m/s.
All intact cylindrical specimens with 50 mm in diameter and 100 mm height were cored from the same block of sandstone, which resulted in a height: diameter ratio of 2:1 [13]. The mechanical properties of the tested sandstone are described below: the UCS was 50.61 ± 4.44 MPa, the elastic modulus was 12.06 ± 0.77 GPa, the Poisson ratio was 0.358 ± 0.008, the indirect tensile strength was 2.95 ± 0.11 MPa, the cohesion was 18.52 MPa and the internal friction angle was 38.82°.

2.2. Saturation Process

In this research, a NaCl solution was used to saturate the sandstone specimens. Although in real saline aquifers, the reservoir solution is a mixture of ions, NaCl (typically 70–90%) is dominant [14]. According to the geological condition of deep saline aquifers, the brine concentration is in the range of 2–25 wt % [15]. Furthermore, with the increase of reservoir depth, the brine concentration increases. In the range of 800–2000 m depth, the brine concentration is usually high. The selected four different NaCl concentrations (i.e., 0%, 10%, 20% and 30% by weight) in this experiment covered the salinity range.
The prepared sandstone specimens were immersed in desiccators under vacuum as shown in Figure 2a. The mass of the sandstone specimens was measured regularly to evaluate the saturation. Figure 2b shows the evolution of mass change for the two specimens over time. It is clear that the mass reaches its maximum value after a short immersion time and then remains constant, which means that the tested sandstone has been fully saturated.
An optical microscope (HIROX Co., Ltd., Tokyo, Japan, model KH-8700E) was used to qualitatively assess the apparent influence of brine on the microstructure of uncompressed sandstone specimens. Figure 3 shows the optical micrographs at different NaCl concentration levels. In the dry condition, many pre-existing initial micro cracks were observed. After two months of distilled water saturation, the surfaces of the grains appeared smoother, which suggests that cuttings and other loose material (e.g., clay and clasts) have been washed away. Compared with the results before immersion, the micro pores and cracks are more obvious after water saturation (see Figure 3b). It is observed from Figure 3c,d that the inter-particle pores appear to significantly reduce in size with increasing NaCl concentration. Crystallized NaCl appears to grow around the sand grains and coalesce at the inter-particle contact points (Figure 3e). Similar NaCl depositions were also observed in brine-saturated sandstone [9,12].

2.3. Testing System Description

All triaxial compression tests were performed in a GCTS high pressure and high temperature triaxial rock servo system (GCTS Testing Systems, Tempe, AZ, USA, model RTX-4000) at China University of Mining and Technology (CUMT). The testing system consisted of a triaxial cell, a hydraulic station, a microprocessor, a loading frame, and a confining pressure and pore pressure supercharger (see Figure 4a). The capacity of axial loading was 4000 kN, the capacity of confining pressure was 140 MPa, and the capacity of pore pressure was 140 MPa. In this experiment, both axial and circumferential deformations of specimen were measured by linear variable differential transducers (LVDTs) with a range of ±6 mm (see Figure 4b).
To detect the crack initiation, propagation and coalescence of micro-cracks, AE characteristics were monitored because they are related to the energy release during loading [16]. An AE measuring system (Physical Acoustic Corporation, Princeton, NJ, USA, model micro-II) was used to study the AE events in sandstone specimens. In each test, two AE sensors were used to achieve effective data acquisition during triaxial compression (see Figure 4b).
To further detect the internal damage of the sandstone under stress, compressional wave (P-wave) velocity measurements along the axial stress direction were conducted with an ultrasonic pulse transmission technique. In this work, the transmitter was positioned on the top end surface and the receiver was put on the bottom end surface of the specimen (see Figure 4b); an electric pulse was generated with a pulse generator, and the waveforms were recorded using a digital oscilloscope. The travel time was identified from the first cycle wave [17]. After the measurements, the P-wave velocity can be calculated using Equation (1):
Vp = h/t0
where Vp is the P-wave velocity; h is the length of specimen; and t0 is the travel time.

2.4. Experimental Procedure

All sandstone specimens were loaded under conventional triaxial compression (σ2 = σ3). First, the desired value of confining pressure was applied on the specimen and then kept constant during the whole experiment. To ensure uniform hydrostatic stress for the specimen, a low stress rate of 4.0 MPa/min was selected. At the beginning, the GCTS RTX–4000 and ultrasonic measuring system were operated simultaneously. Second, the axial deviatoric stress was imposed on the rock specimen surface until failure occurred. The axial fore was loaded under displacement-controlled condition with a rate of 0.04 mm/min. The AE events were measured in real-time during the entire testing process. All the tests were carried out under undrained conditions in which pore fluids were not allowed to drain freely during loading, and the pore water pressure was not measured [12,18,19].
Different confining pressures were used to parametrically assess the relative effect of different reservoir depths, i.e., 0, 10, 20, 40 and 60 MPa. The corresponding maximum reservoir depth is 2400 m (assuming a reservoir rock density of 2500 kg/m3). All tests were carried out at room temperature (20 °C) in order to study the effects of brine concentration in isolation, and therefore assuming a negligible geothermal gradient.

3. Results and Discussion

3.1. Mechanical Properties

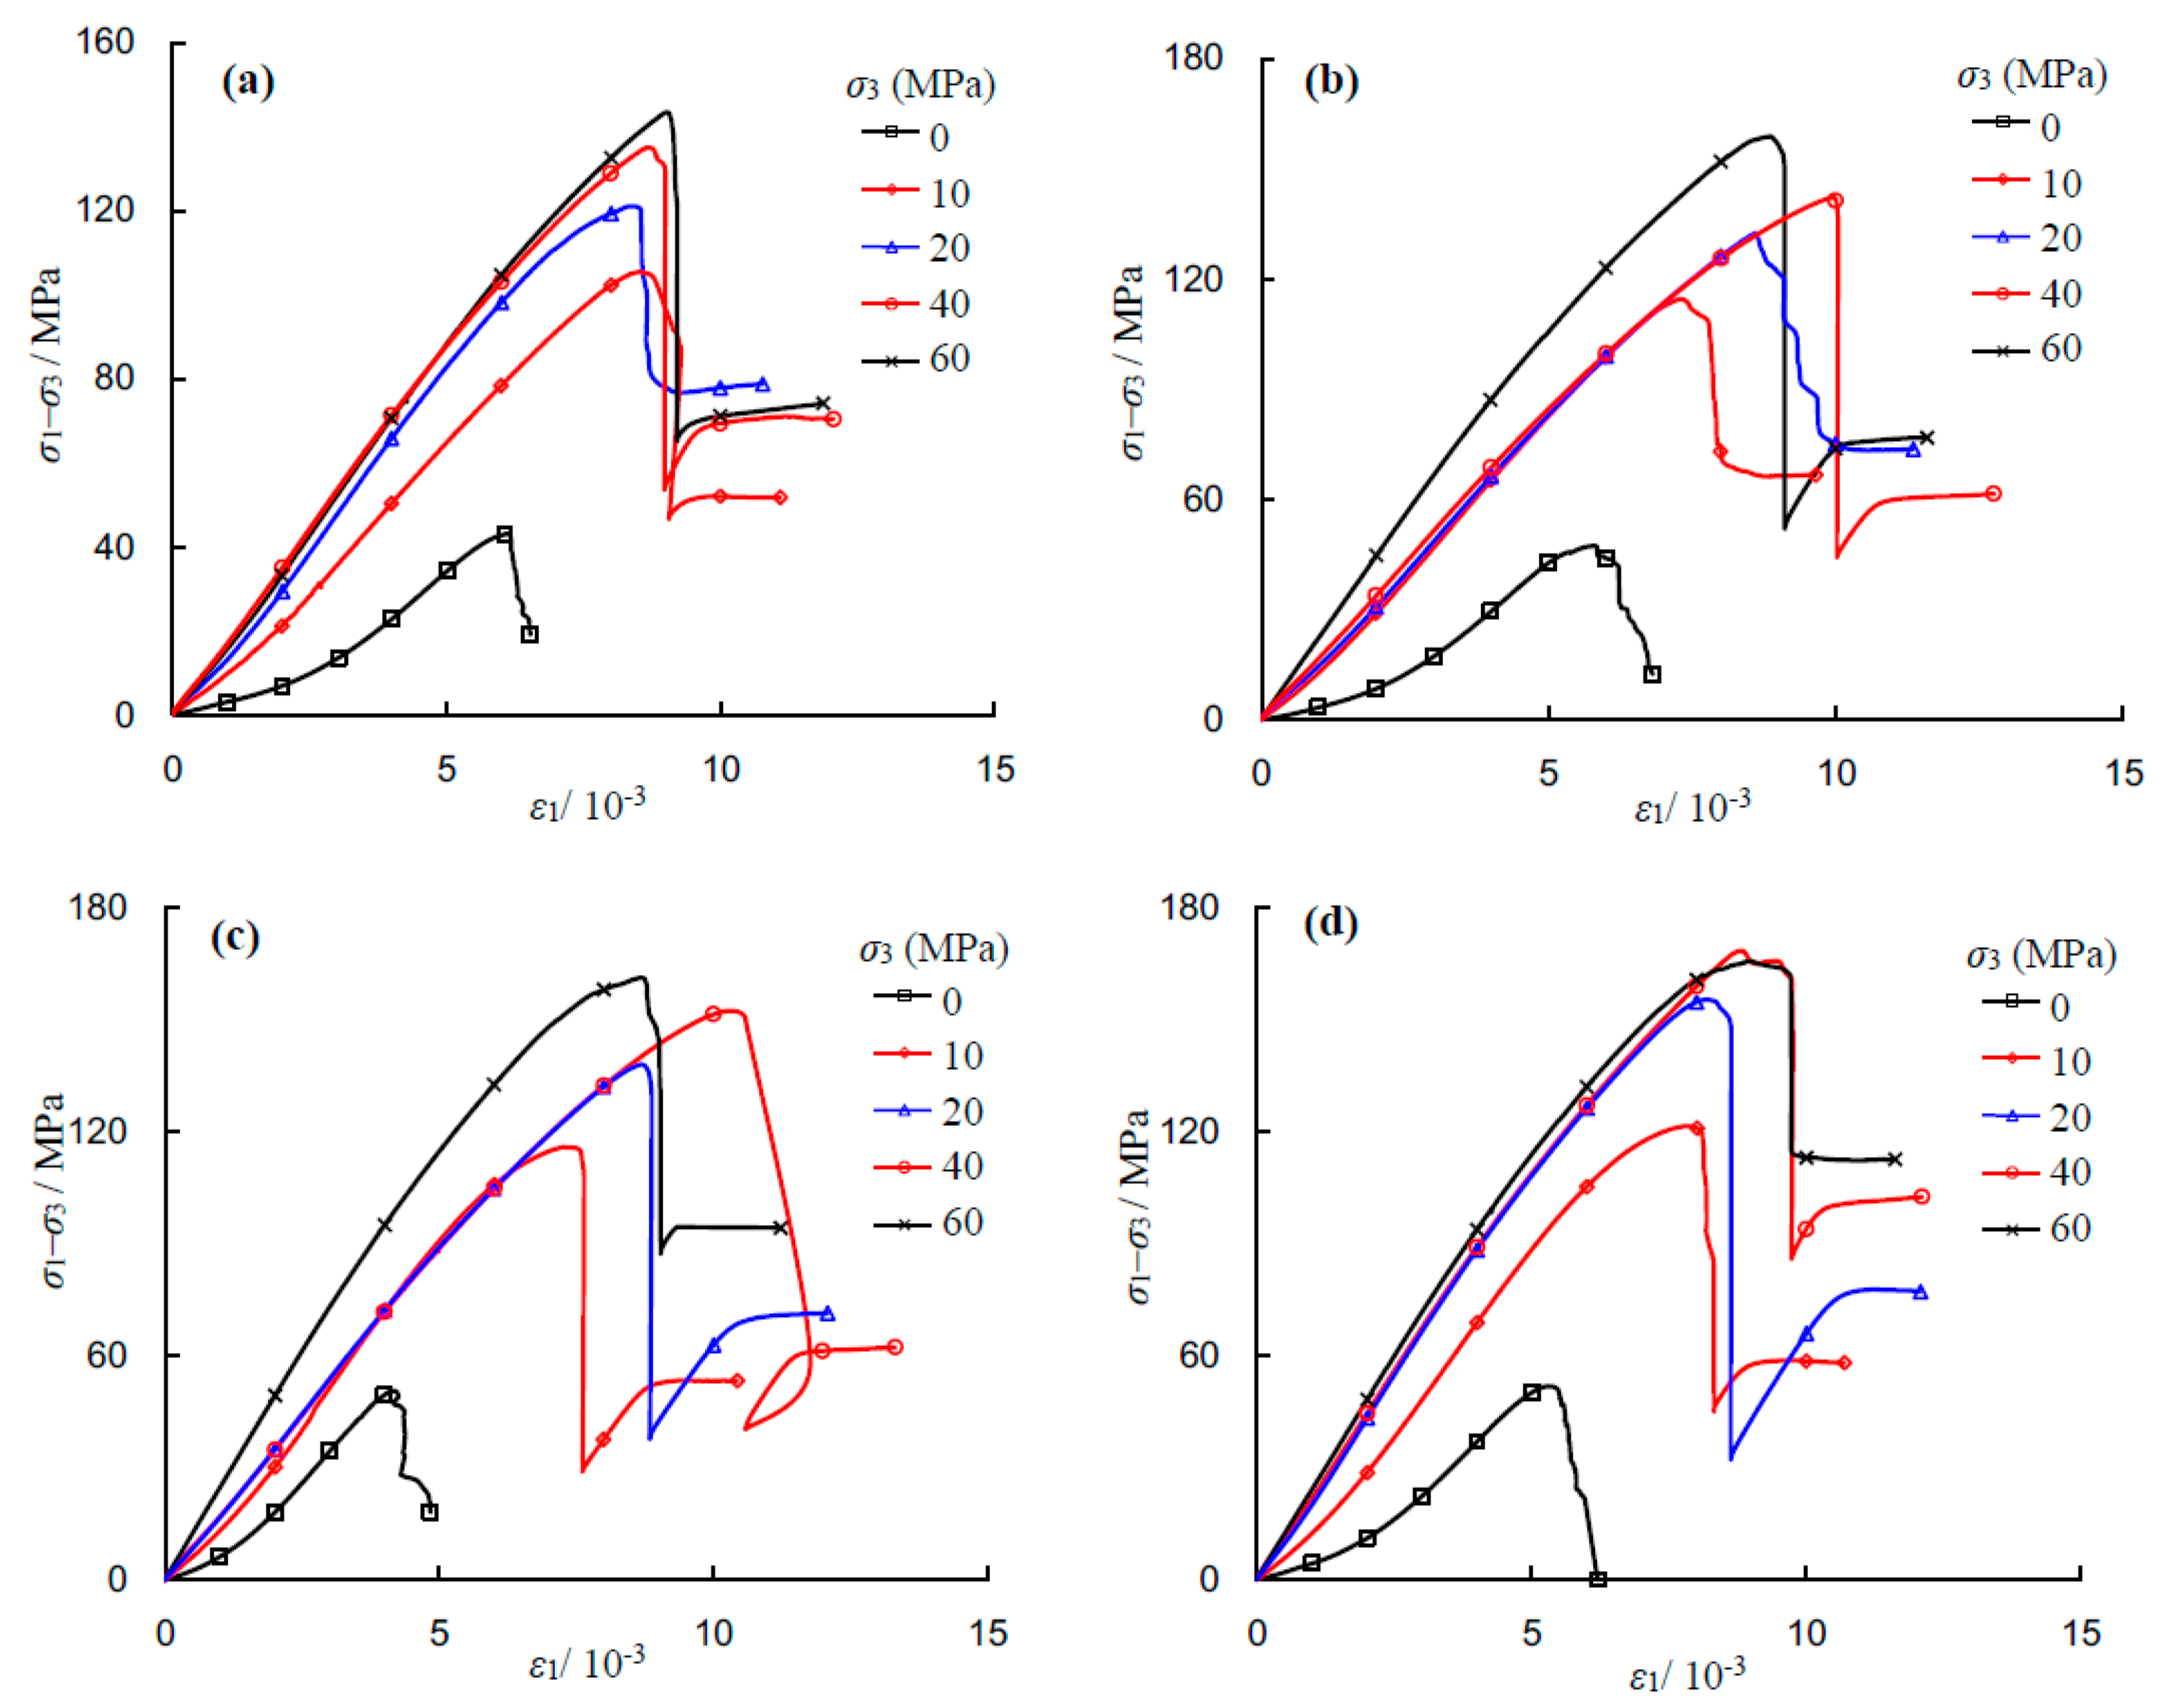
Figure 5 shows the axial deviatoric stress–strain curves of the saturated sandstone specimens under conventional triaxial compression. As seen from Figure 5, the NaCl concentration and confining pressure affect the stress–strain response and can be summarized as follows. (1) Under uniaxial compression (i.e., σ3 = 0 MPa), the sandstone specimen firstly undergoes initial compression, then elastic deformation, nonlinear deformation, and post-peak failure. However, under triaxial compression, besides those above stages, there is a residual strength stage. This finding is similar to those from previous studies [11,20]; (2) The characteristics of the post-peak curve depend upon the applied confining pressure. Under low confining pressures (e.g., 0, 10 and 20 MPa) multiple stress drops can be observed. However, under relatively high confining pressures (e.g., 40 and 60 MPa), the curve drops abruptly, which is typical of brittle failure. The brittleness of the sandstone increases with the increase of confining pressure regardless of NaCl concentration values; (3) The mechanical parameters, such as peak compressive strength and elastic modulus, are greatly influenced by NaCl concentration and confining pressure, which will be analyzed in the following section.
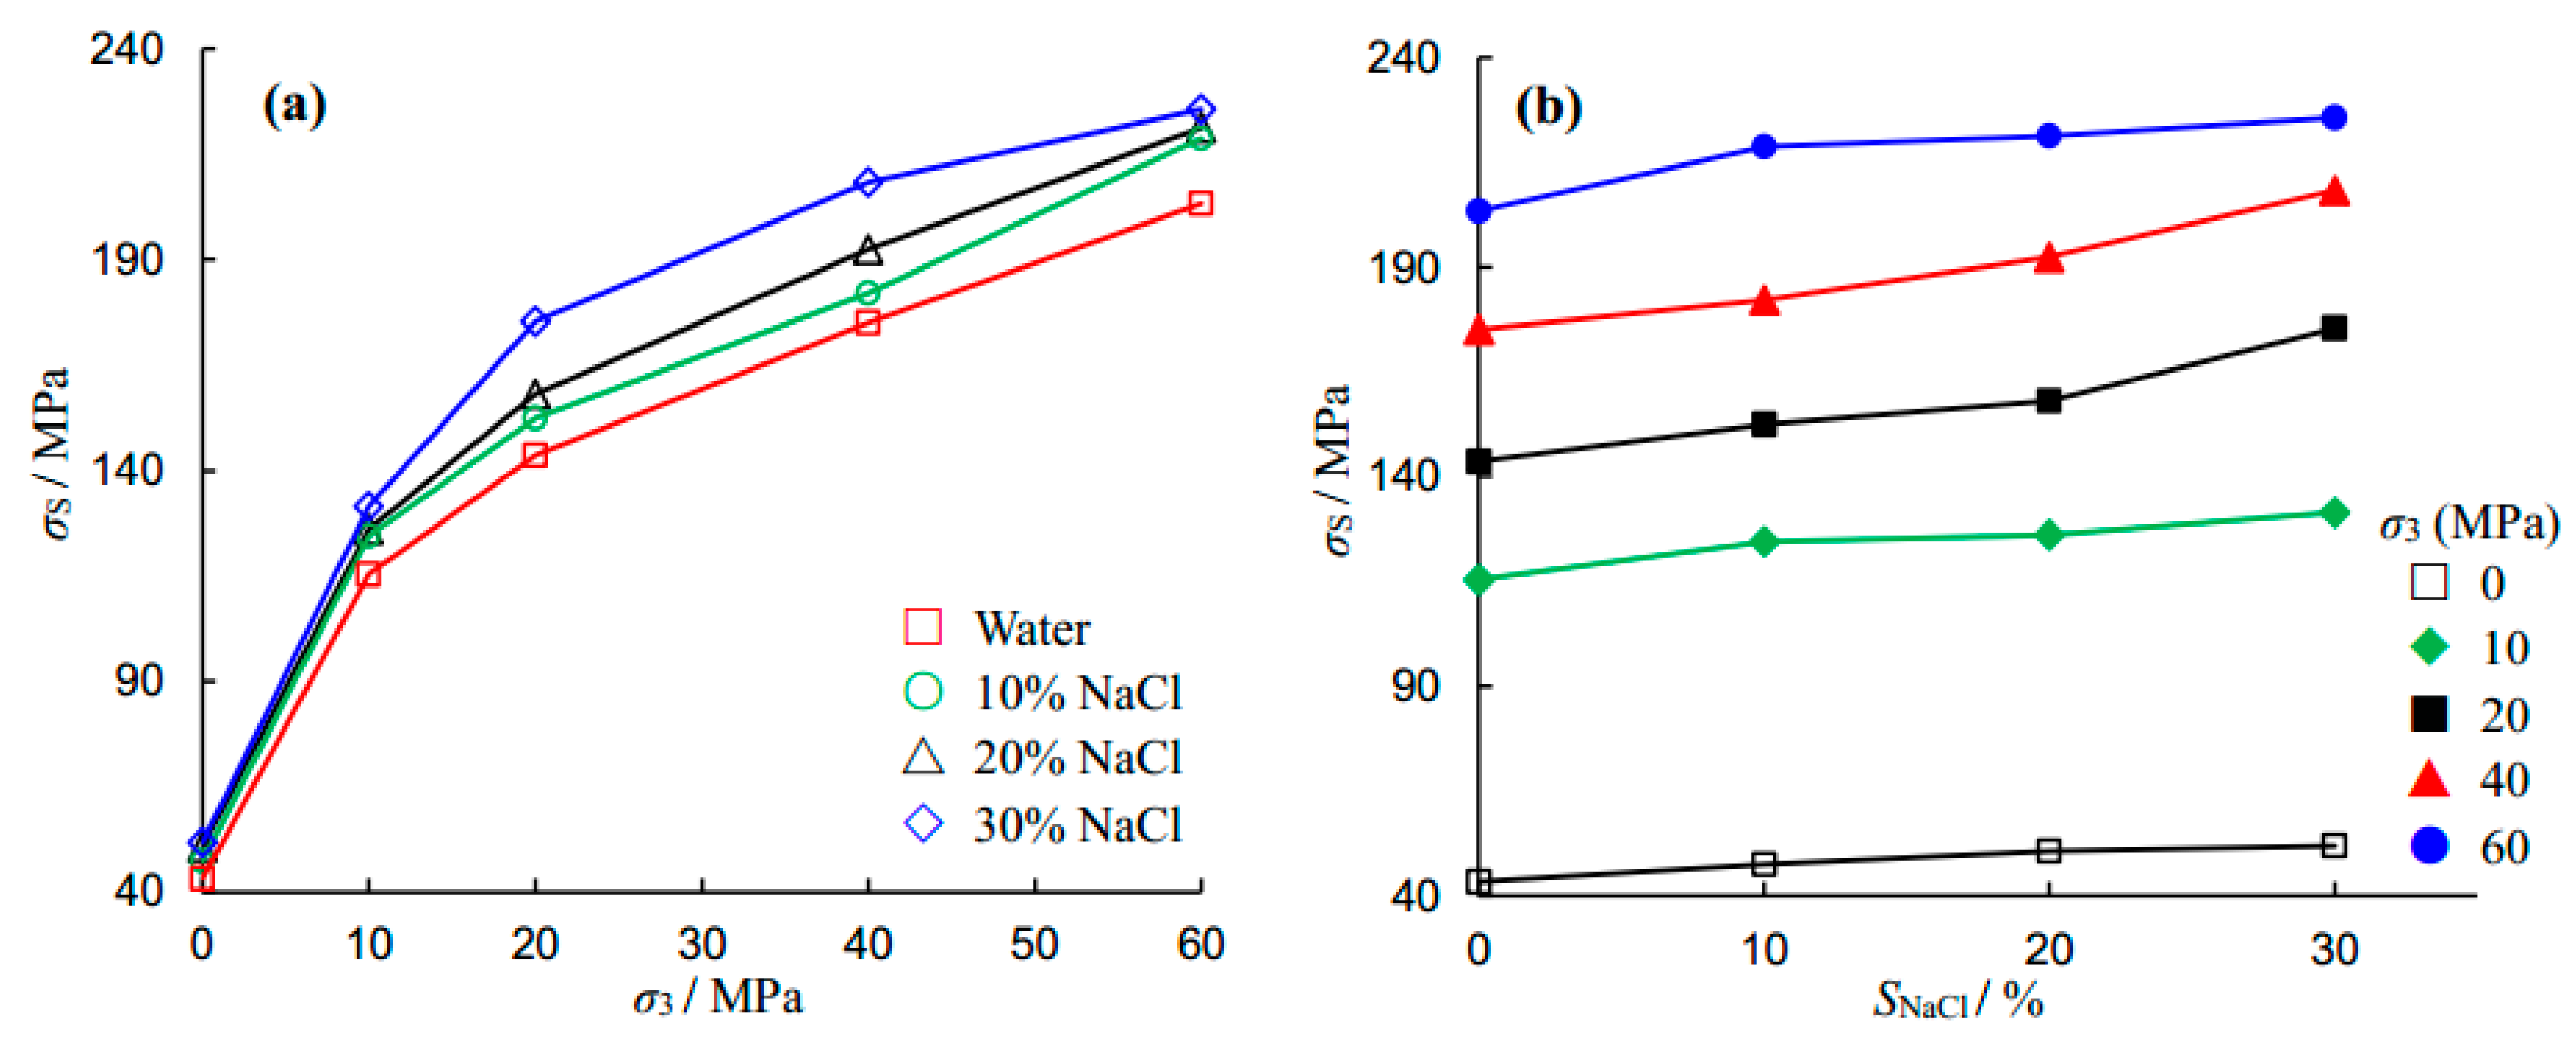
The effects of confining pressure and NaCl concentration on the triaxial compressive strength of a sandstone specimen are shown in Figure 6. It is clear from Figure 6a that as the confining pressure increases, the peak strength increases, regardless of saturation conditions. The relationship between peak strength and confining pressure shows nonlinear characteristics and is dependent upon both the confining pressure and NaCl concentration values. Under low confining pressures all four curves are nonlinear. This perhaps results from the low strength of sandstone under uniaxial compression. Similar experimental results have been reported in Rathnaweera et al. [12] in which a series of conventional triaxial compression tests were conducted at confining pressures of 0–20 MPa. The study reported that when the NaCl concentration was relatively high (i.e., 20 wt % and 30 wt %), the strength envelope was non-linear; without considering uniaxial compressive strength (UCS). However, in the present study much higher confining pressures than this were also taken into account. In the range of 20–60 MPa confining pressures, the curves of NaCl concentrations of 0%, 10% and 20% appear linear. However, NaCl-saturated sandstone specimens at 30% NaCl concentration exhibit non-linear responses, which is perhaps due to a significant increase in local NaCl crystallization, as indicated in Figure 3.
It can be seen from Figure 6b that the triaxial compressive strength of the sandstone specimen increases with NaCl concentration. For example, under unconfined compression, the UCS increases from 43.24 MPa to 47.33 MPa and 50.67 MPa to 51.83 MPa, when the NaCl concentration is increased from 0% to 10% and 20% to 30%, respectively. This implies that the maximum increase in peak strength is 19.86%, when the NaCl concentration increases from 0% to 30%. Under triaxial compression, the corresponding increments are 13.94%, 20.07%, 19.05% and 10.97% for σ3 = 10, 20, 40 and 60 MPa. The above analysis indicates that the NaCl solution strengthens the sandstone significantly.
The crack damage threshold (σcd) is axial deviatoric stress when the volumetric strain switches from compaction to dilation [13,21,22]. 
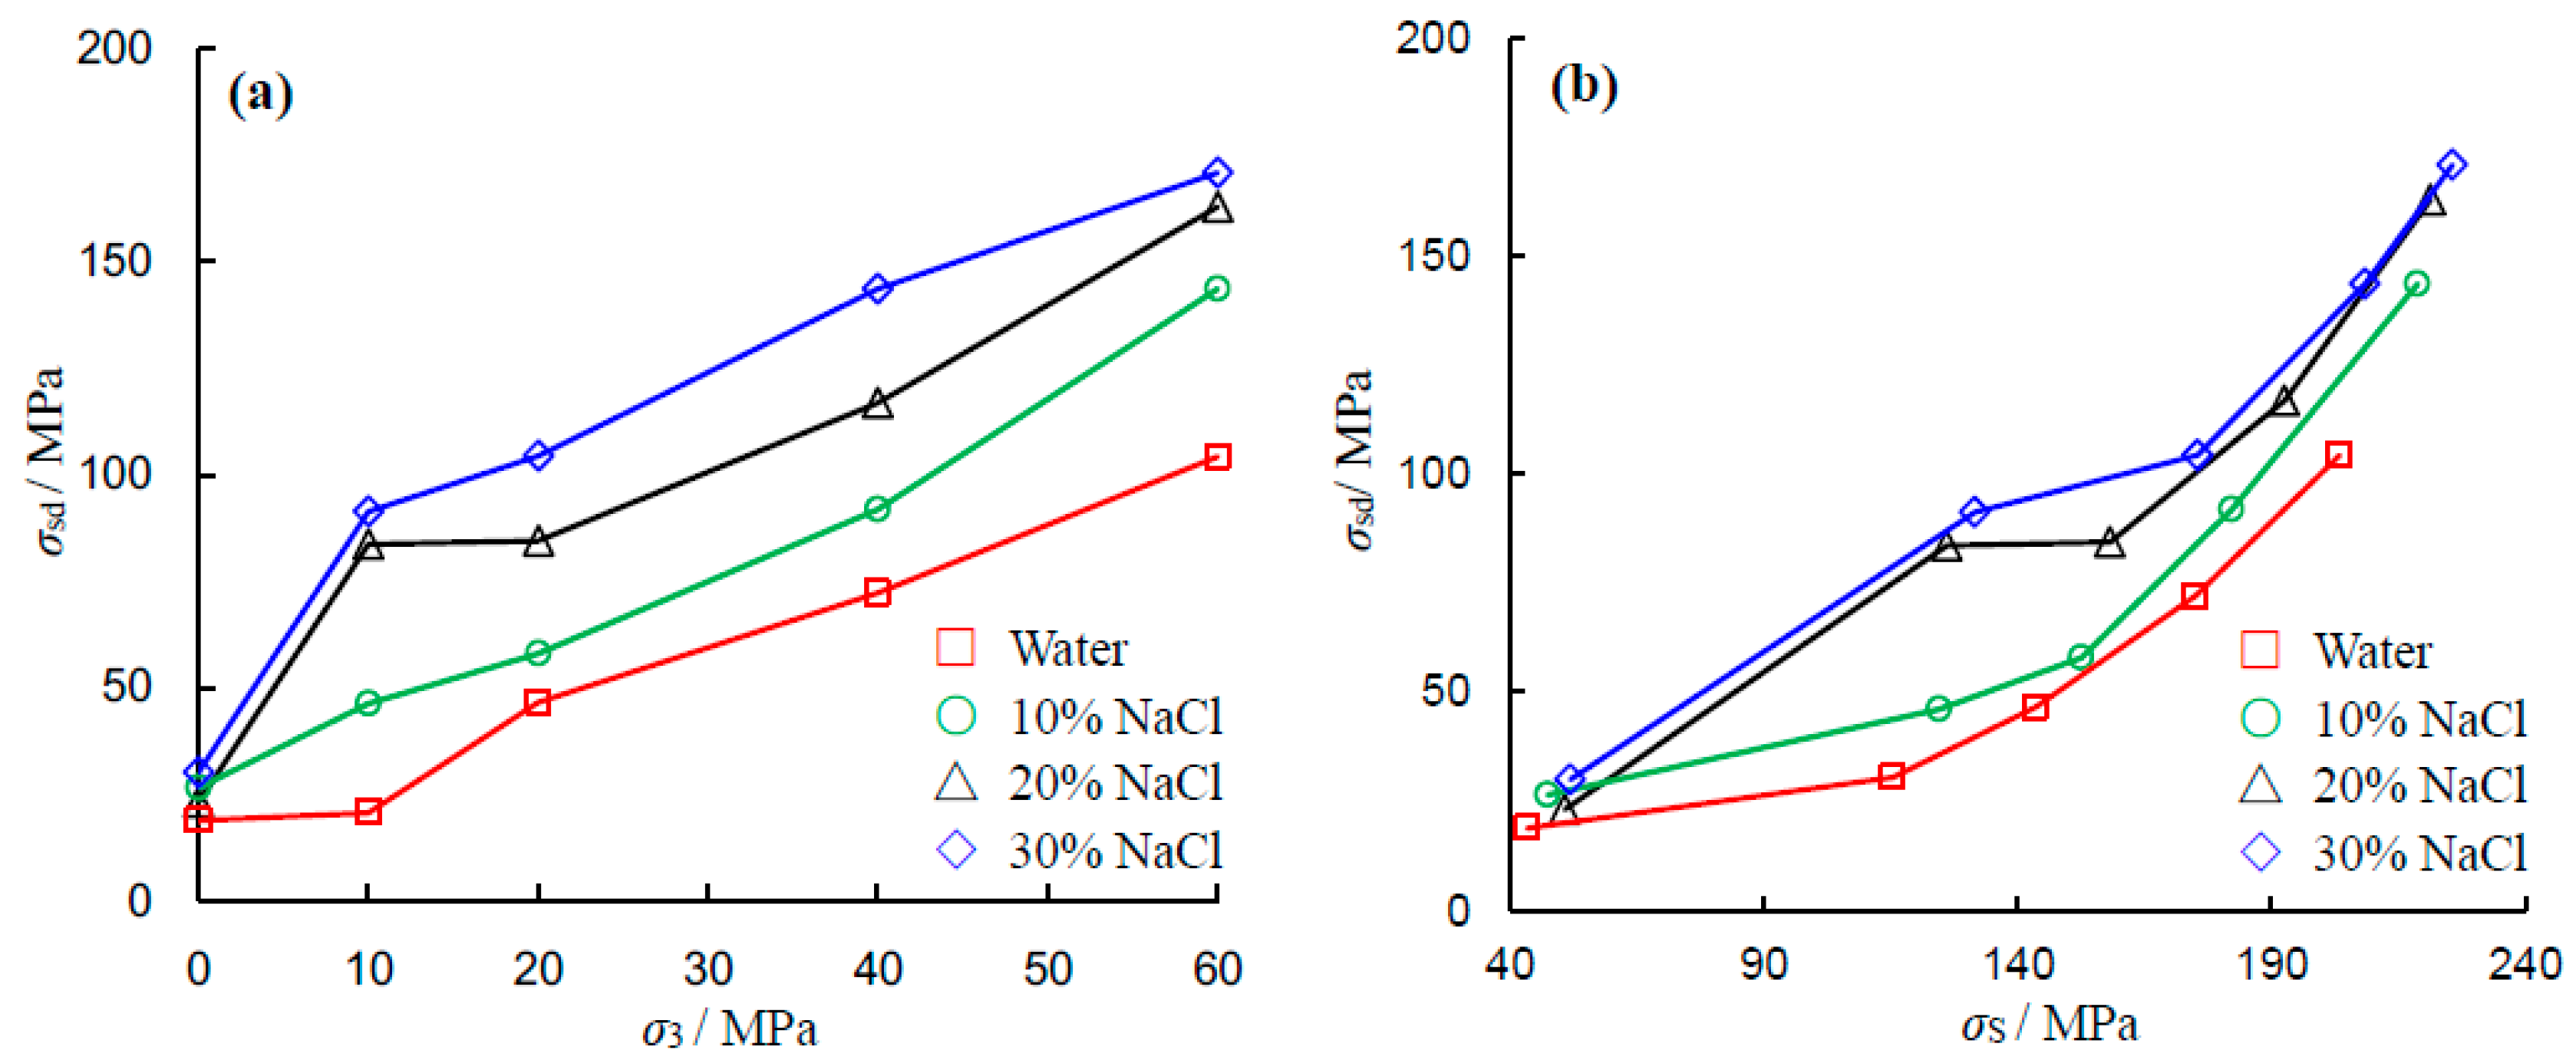
Figure 7a depicts the influence of confining pressure and NaCl concentration on the crack damage threshold of the sandstone specimen. As the confining pressure and the NaCl concentration increase, the crack damage threshold increases. The change trend of the crack damage threshold is similar to that of peak strength. Under low confining pressures, NaCl-saturated sandstone specimens exhibit non-linear responses. However, under high confining pressures, the crack damage threshold is linearly related to the confining pressure.
The crack damage threshold versus the corresponding triaxial compressive strength is displayed in Figure 7b. As the triaxial compressive strength increases, the crack damage threshold of sandstone also increases. In other words, the increase in crack damage strength is greater than the increase in triaxial compressive strength along with the confining pressure.
Although the strength of the sandstone specimen shows a nonlinear response to the confining pressure, the Mohr–Coulomb criterion was used to analyze the evolution of cohesion and internal friction angle. The Mohr–Coulomb criterion can be expressed as the following equation [23]:
σS = σ0 + qσ3 = [2Ccosϕ + σ3(1 + sinϕ)]/(1 − sinϕ)
where σ3 is the UCS, q is an influence coefficient of σ3 on σS, C is the cohesion, and ϕ is the internal friction angle.
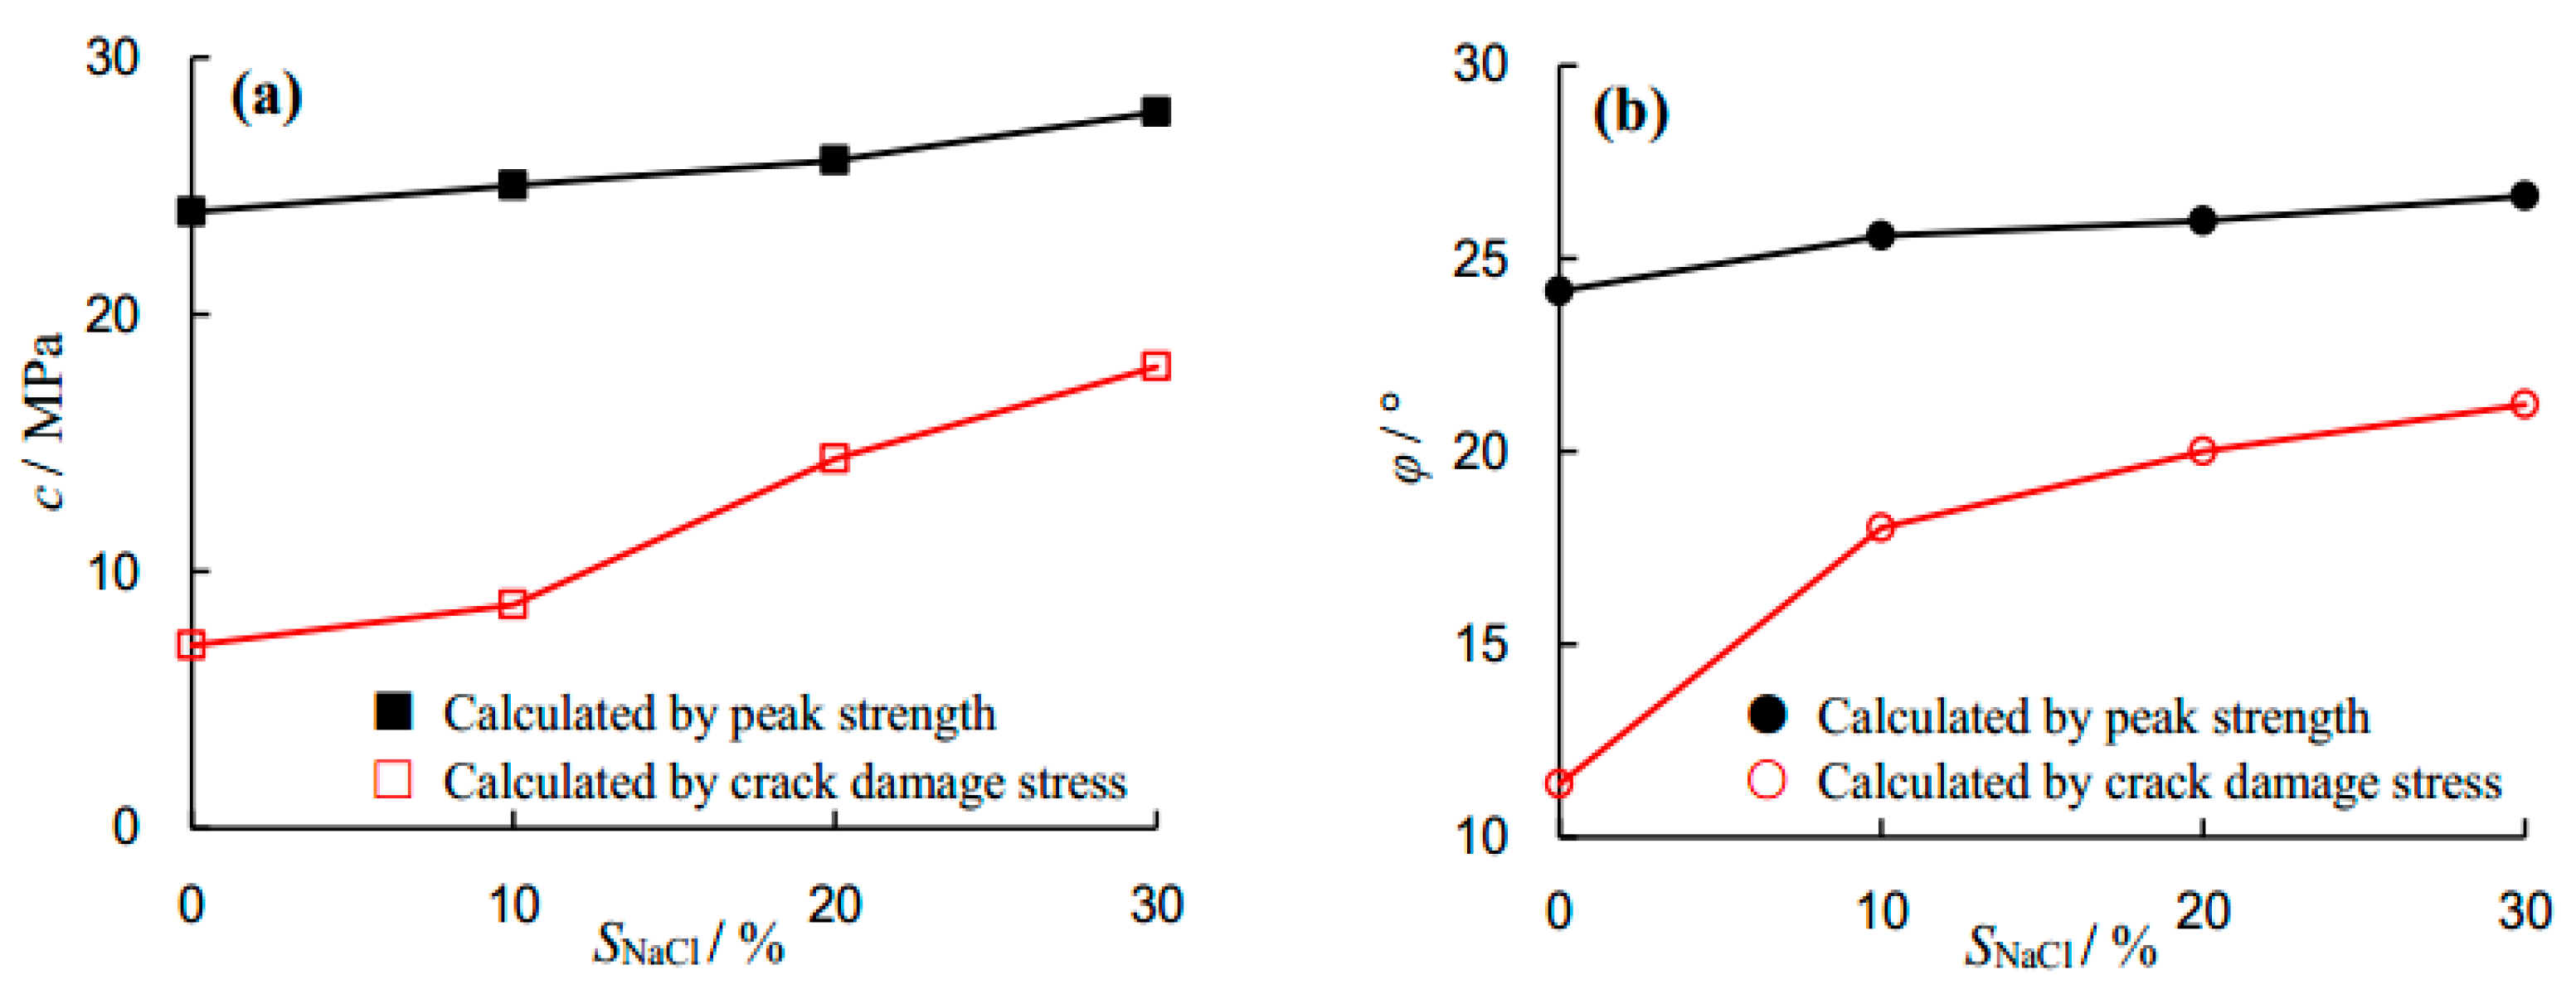
The calculated cohesion and internal friction angle results are presented in Figure 8. As can be seen from Figure 8a, the cohesions calculated by peak strength and crack damage threshold increase with increasing NaCl concentration. The cohesions calculated by peak strength were 23.99, 25.03, 25.99 and 27.88 MPa for the 0, 10%, 20% and 30% NaCl-saturated sandstone specimens, respectively. This indicates that the increment of cohesion calculated by peak strength is 16.22%, when the NaCl concentration increases from zero to 30%. However, the increment of cohesion calculated by crack damage threshold was 152.44%.
As can be seen from Figure 8b, as the NaCl concentration increases, the internal friction angles calculated by peak strength and crack damage threshold also increase. The evolution of the internal friction angle is similar to that of cohesion. The internal friction angles calculated by peak strength were 24.15°, 25.59°, 25.99° and 26.62° for the 0, 10%, 20% and 30% NaCl-saturated sandstone specimens, respectively. A total increment of 10.22% in internal friction angle calculated by peak strength was observed by increasing the NaCl concentration from zero to 30%. However, the increment of internal friction angle calculated by crack damage threshold was 86.55%. The observation of cohesion and internal friction angle can be explained as follows. In distilled-water-saturated specimens, the irregular boundaries among grains become smoother due to frictional abrasion. Moreover, during the loading process, the lubricating effect of water reduces the inter-particle friction. However, in brine-saturated specimens, NaCl depositions in the pore structure of rock appear to enhance the inter-particle friction and the enhancement effect increases with the increase of salinity level.
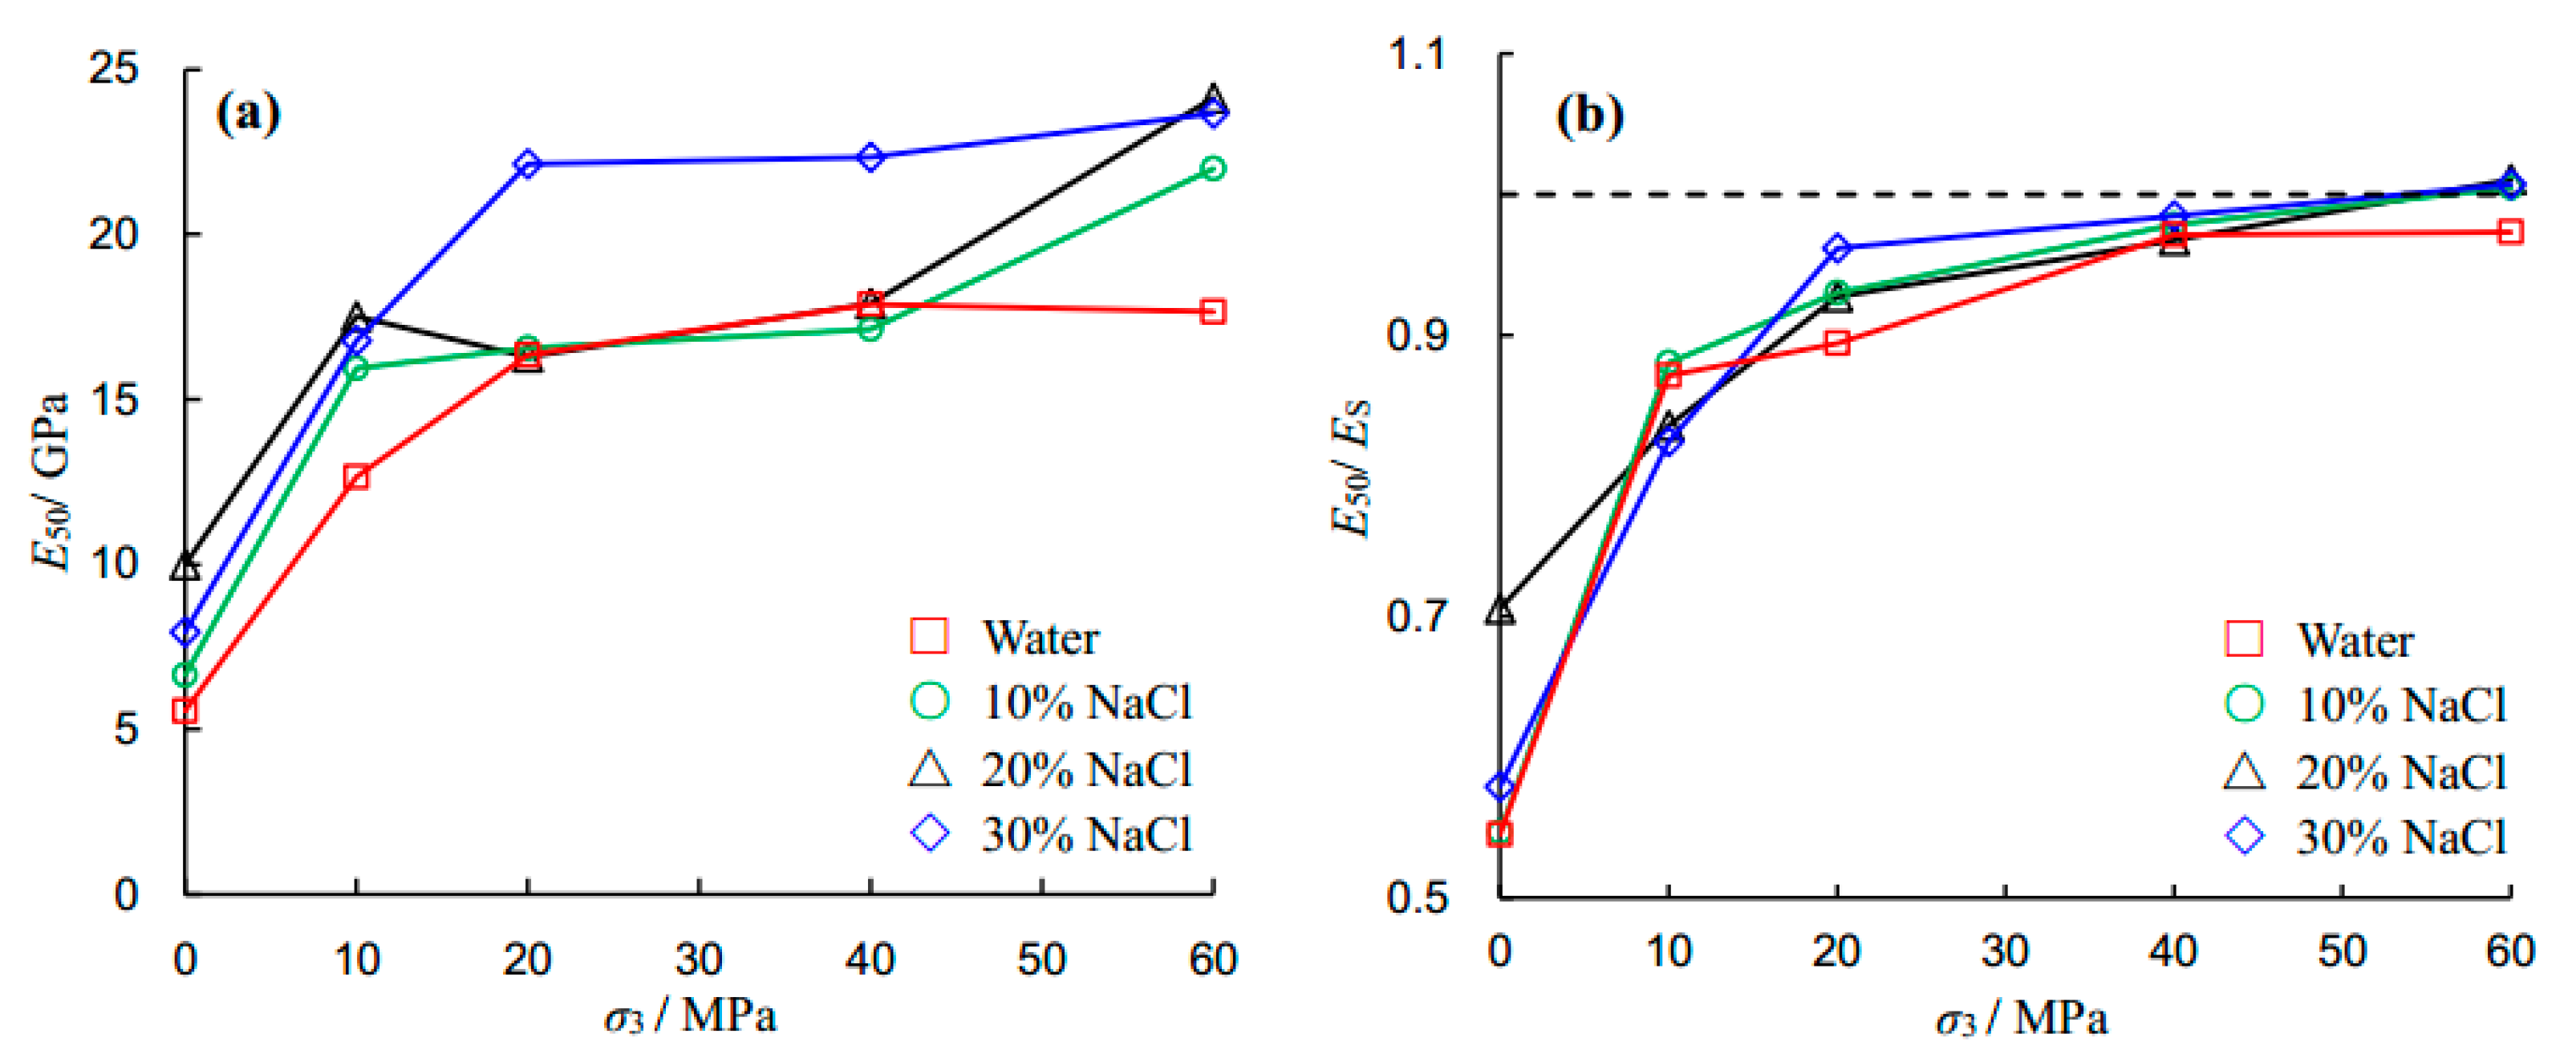
Figure 9 depicts the effects of salinity and confining pressure on the Young’s modulus of the sandstone specimen under triaxial compression. The elastic modulus (ES) was determined from the linear component of the stress–strain curves, and the deformation modulus (E50) was calculated from the slope between zero and 50% peak strength. It is clear that the deformation modulus increases with increasing confining pressure. For example, the deformation moduli for 30% NaCl-saturated sandstone specimens under confining pressures of 0, 10, 20, 40 and 60 MPa were 7.94, 16.78, 22.14, 22.33 and 23.66 GPa, respectively. The deformation modulus increased as σ3 increased from 0 to 20 MPa. However, they remained relatively constant as σ3 increased from 20 to 60 MPa. Overall, the deformation modulus of the sandstone specimen increased with increasing salinity.
Further, to compare the elastic modulus and deformation modulus, the E50 to ES ratio was plotted against the confining pressure, as shown in Figure 9b. As the confining pressure increases from zero to 60 MPa, the value of E50 to ES varies from 0.54 to 0.97 under water saturation, 0.55 to 1.00 under 10% salinity level, 0.71 to 1.01 at 20% salinity, and 0.58 to 1.01 at 30% salinity. The E50 to ES ratio demonstrates that it increases with confining pressure, which results in the tested sandstone specimens exhibiting nonlinear behavior at the initial stage under a relatively low confining pressure (see Figure 5).

3.2. Ultrasonic Velocity and AE Behavior

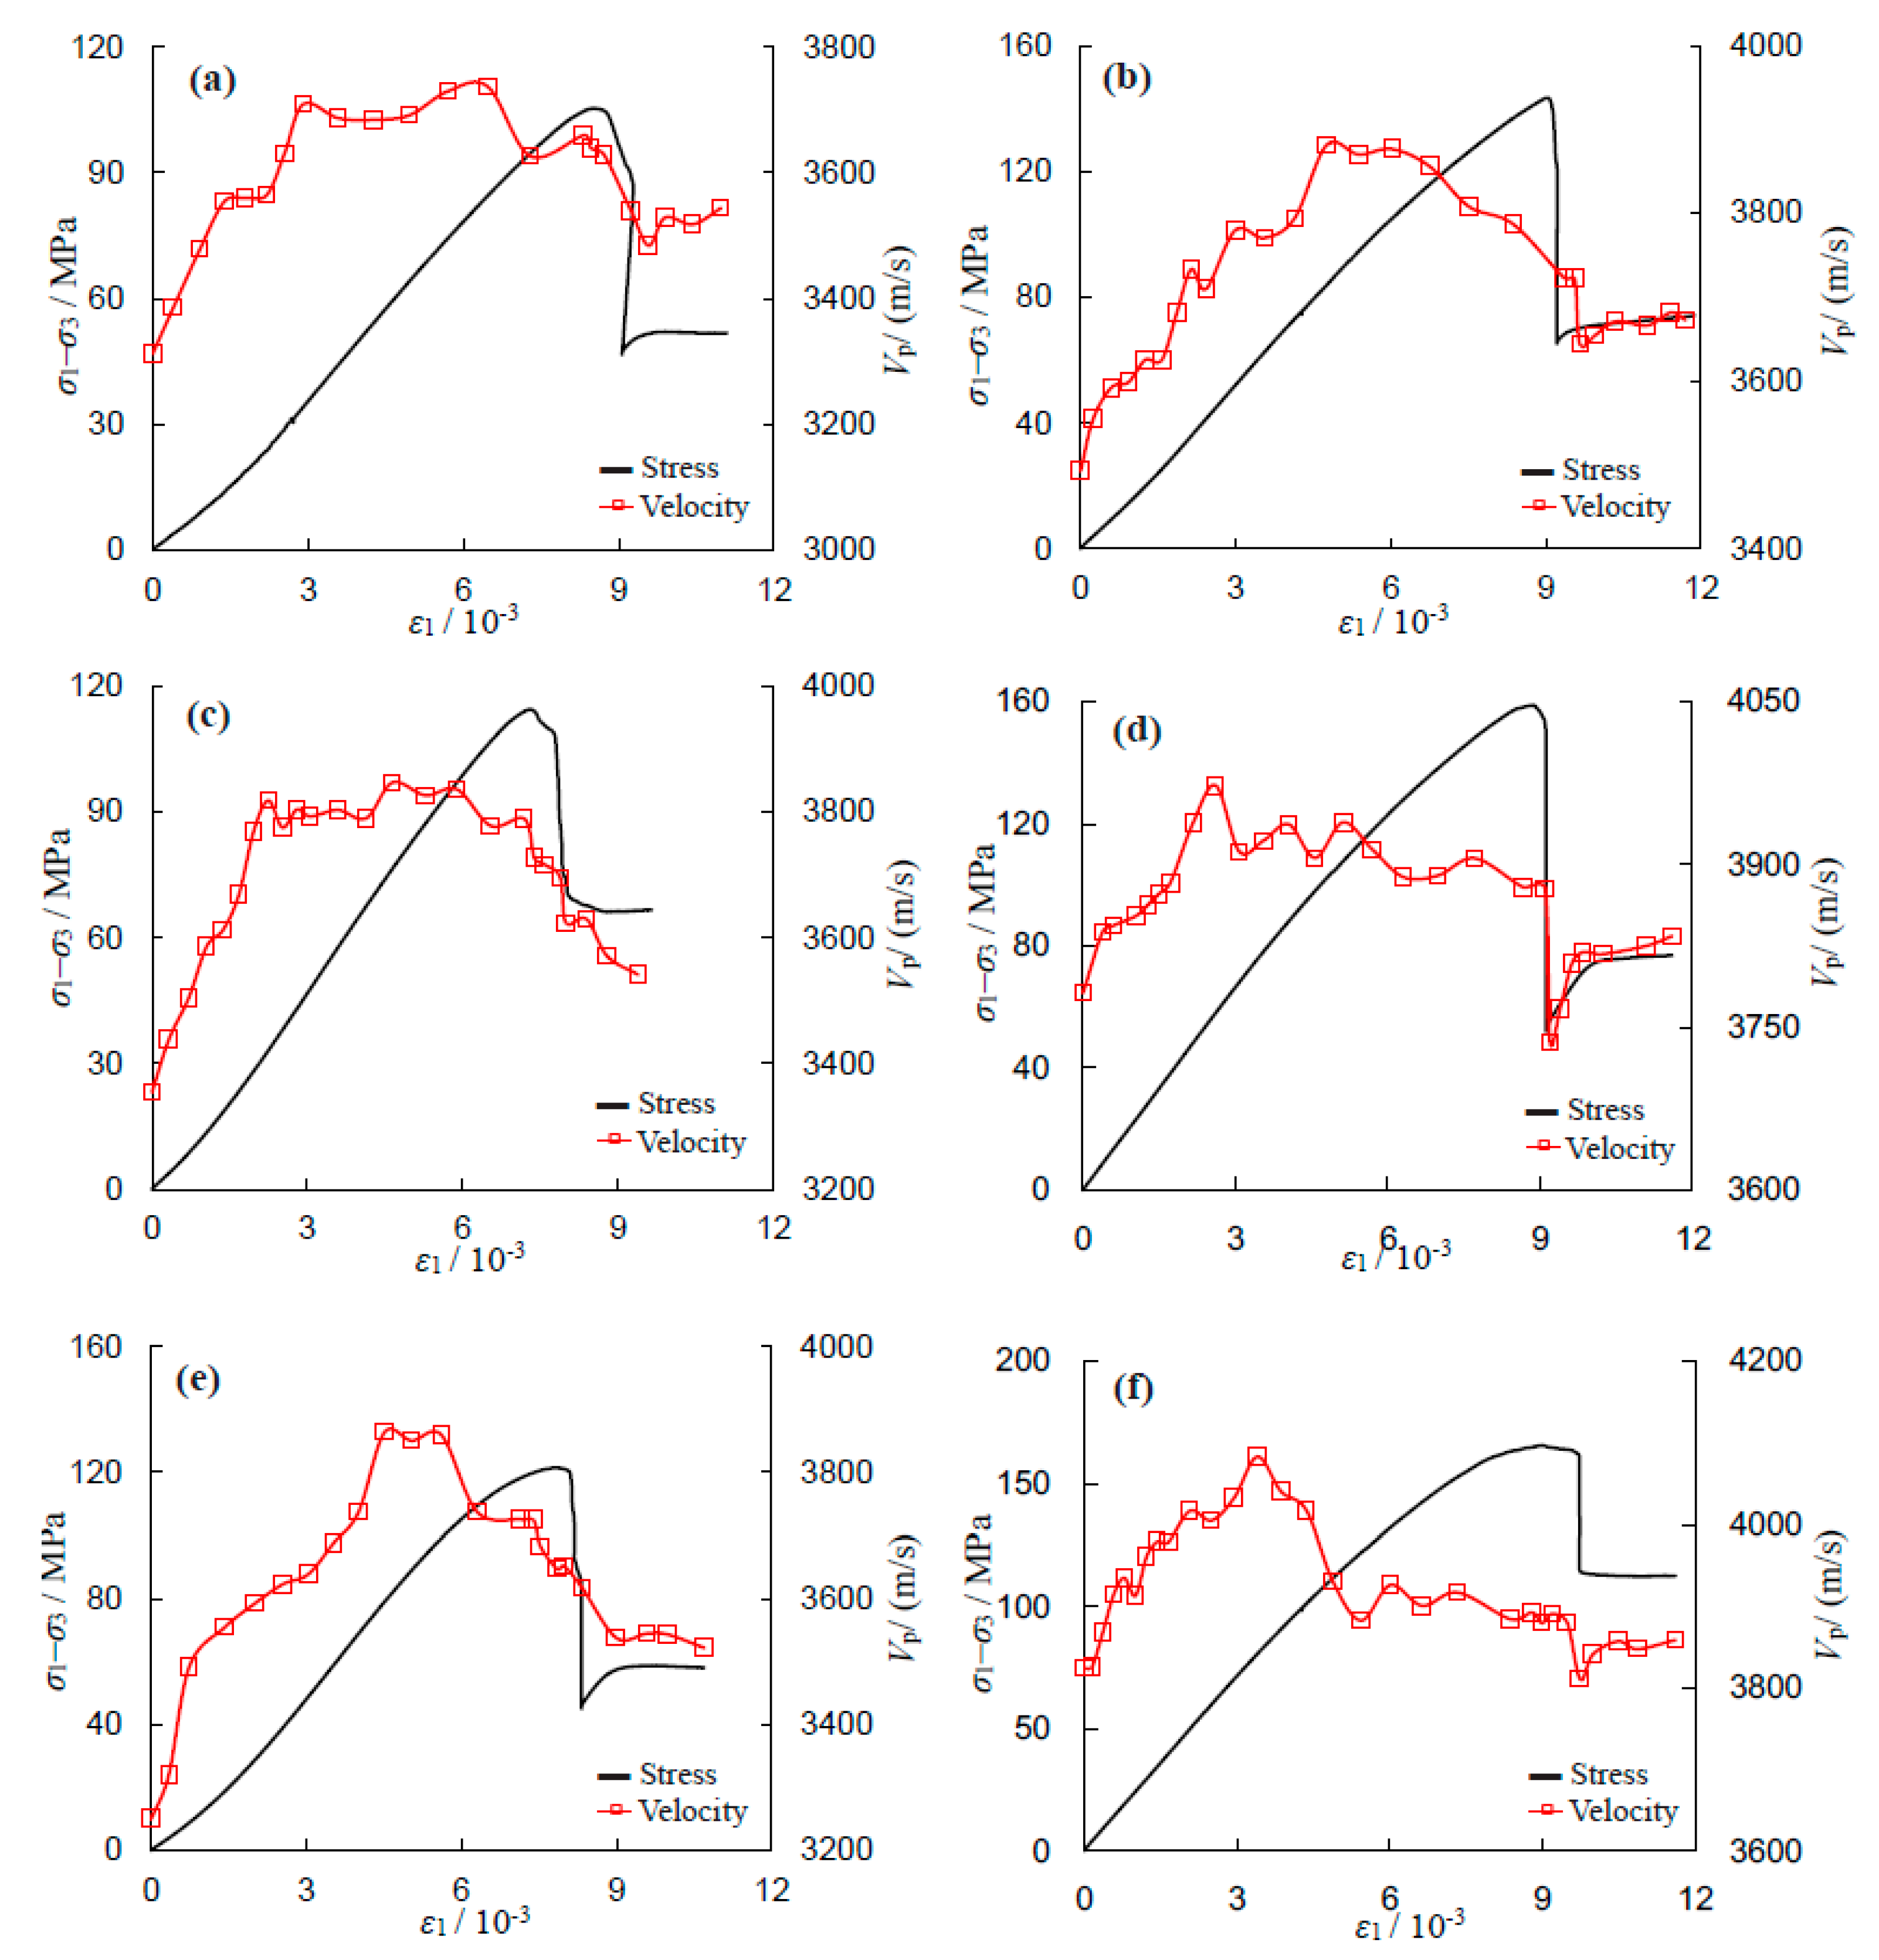
Figure 10 shows the evolution process of P-wave velocity for the sandstone specimens during the whole deformation. In general, similar variation trends were observed for various confining pressures and salinity levels.
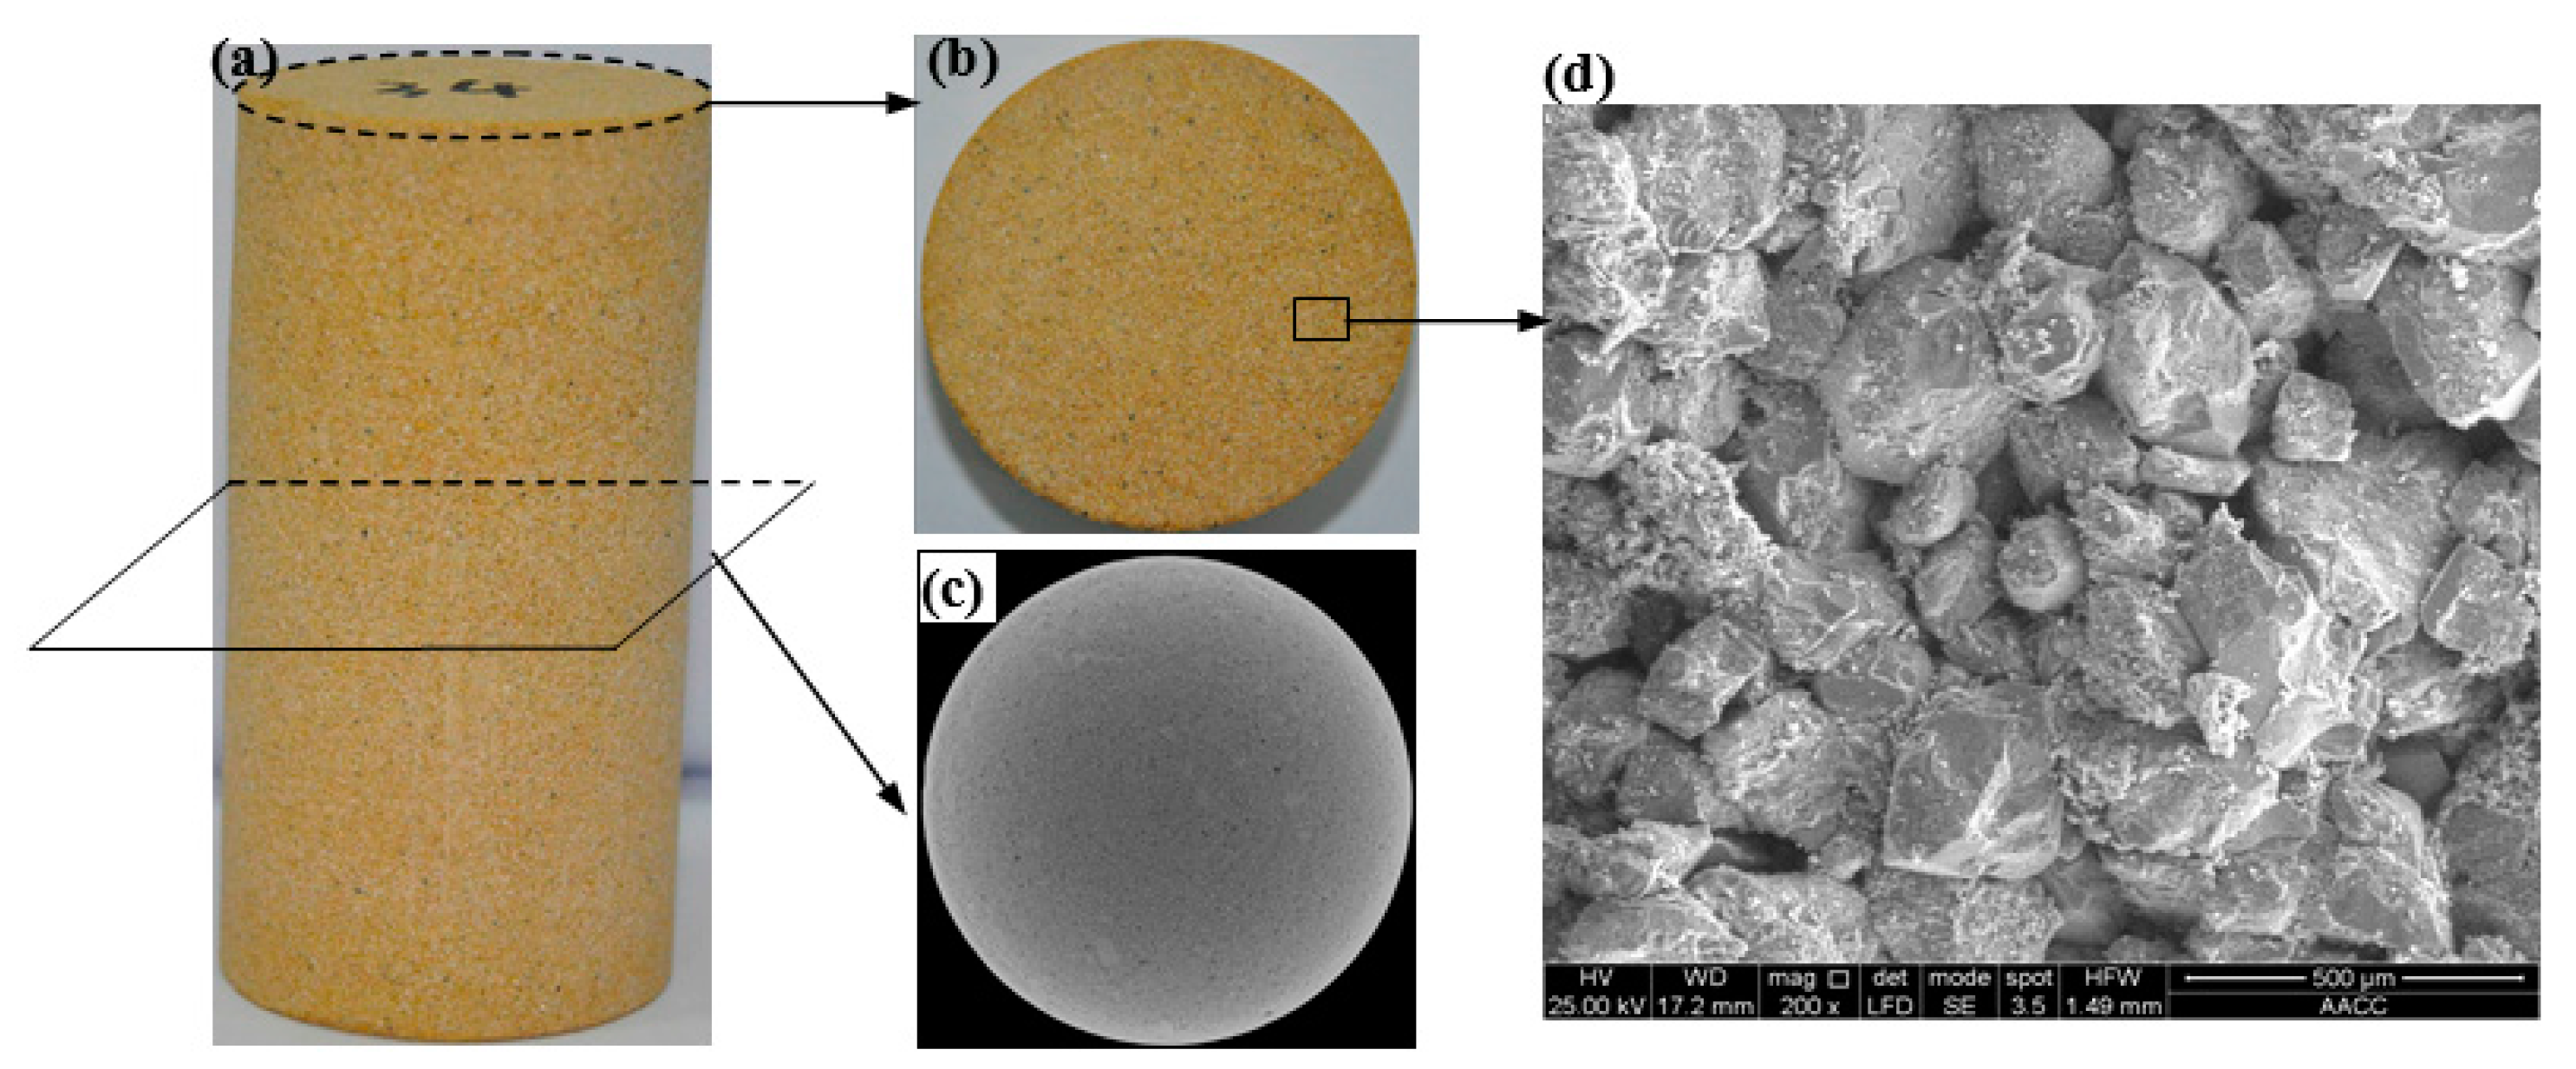
In the initial compaction stage, P-wave velocity increased. This mainly occurs as a result of the closure of the original micro-cracks in the sandstone material (see Figure 1 and Figure 3). After that, the linear elastic deformation starts to dominate the stress–strain curve, and the increase rate of P-wave velocity reduces. When the specimen reaches the nonlinear deformation stage, the P-wave velocity shows fluctuations due to the initiation and propagation of cracks. After the peak stress, macro fractures form in the specimen, leading the P-wave velocity to fall rapidly. During the stress drops, the P-wave velocity also suddenly drops. However, at the residual strength stage, the P-wave velocity remained constant, possibly due to the macro failure mode that had already formed.
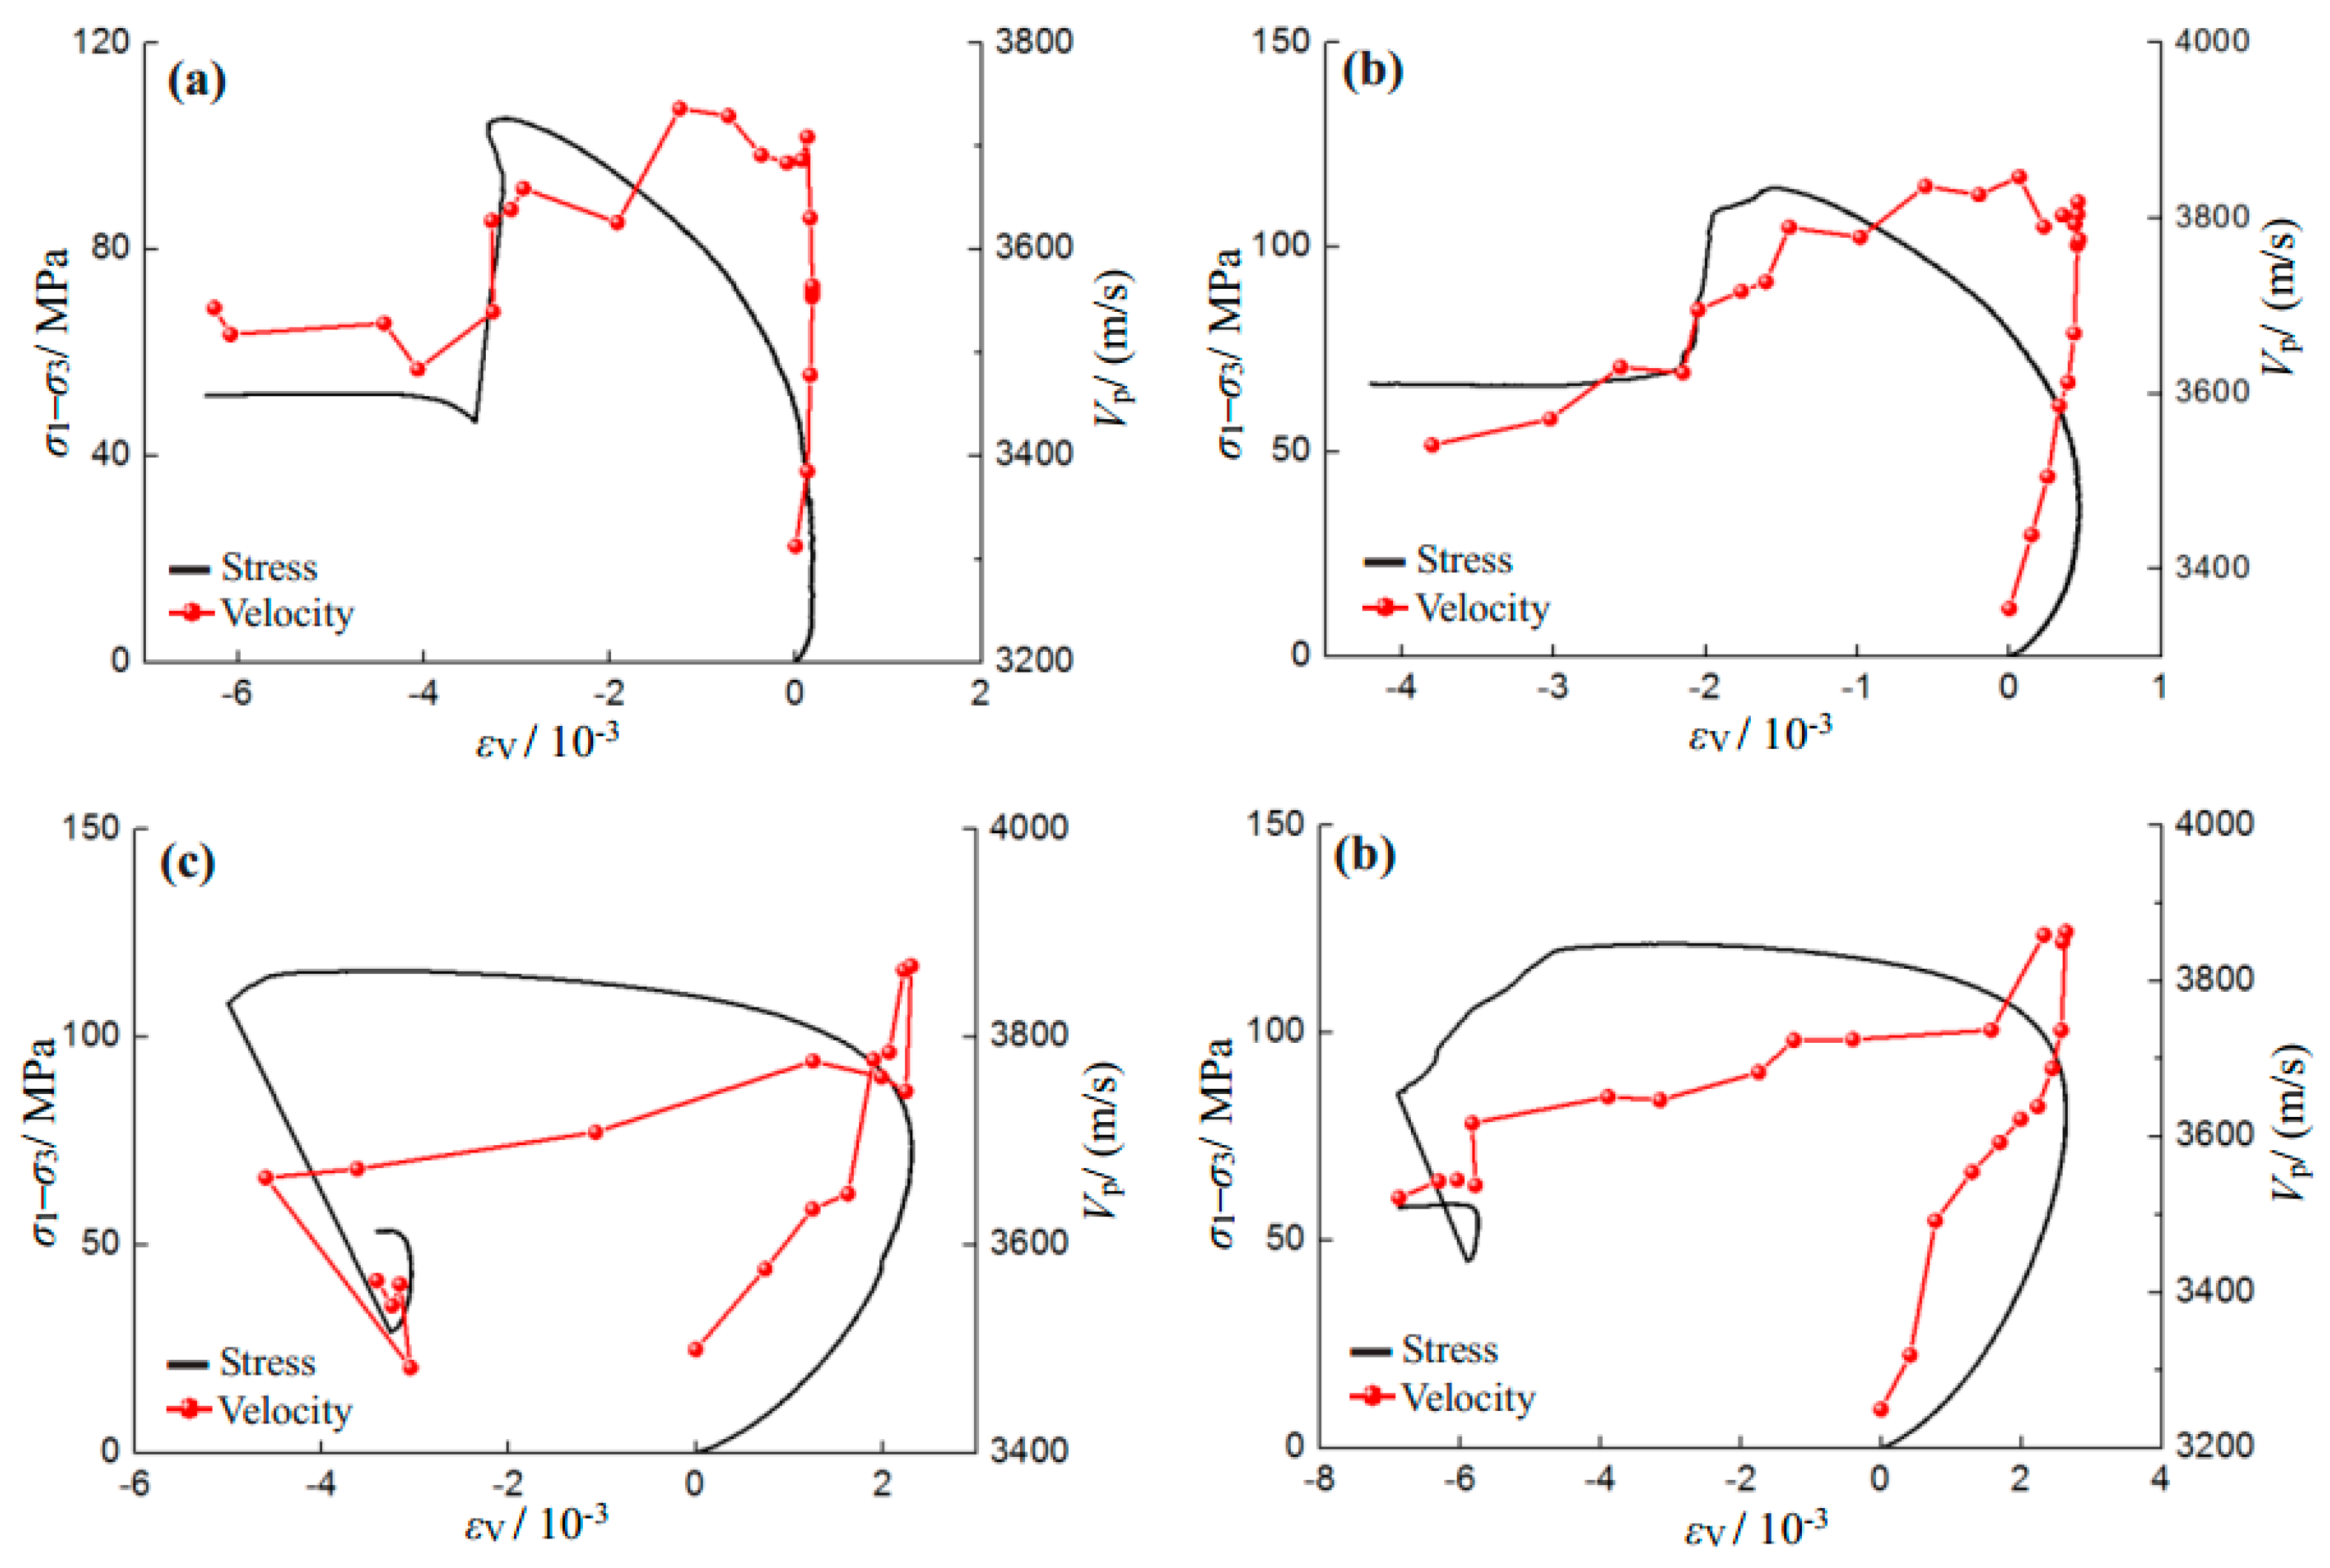
Figure 11 shows the evolution process of P-wave velocity with the volumetric strain of saturated sandstone specimens under various salinity conditions. It is clear from Figure 11 that the P-wave velocity is closely related to the volumetric strain. During the volumetric compaction (before the crack damage stress), P-wave velocity shows an increase trend due to the closure of pre-existing micro-defects. During the stage of volumetric dilation, the initiation and coalescence of micro-cracks and initiation of macro-cracks lead to decreasing P-wave velocity.
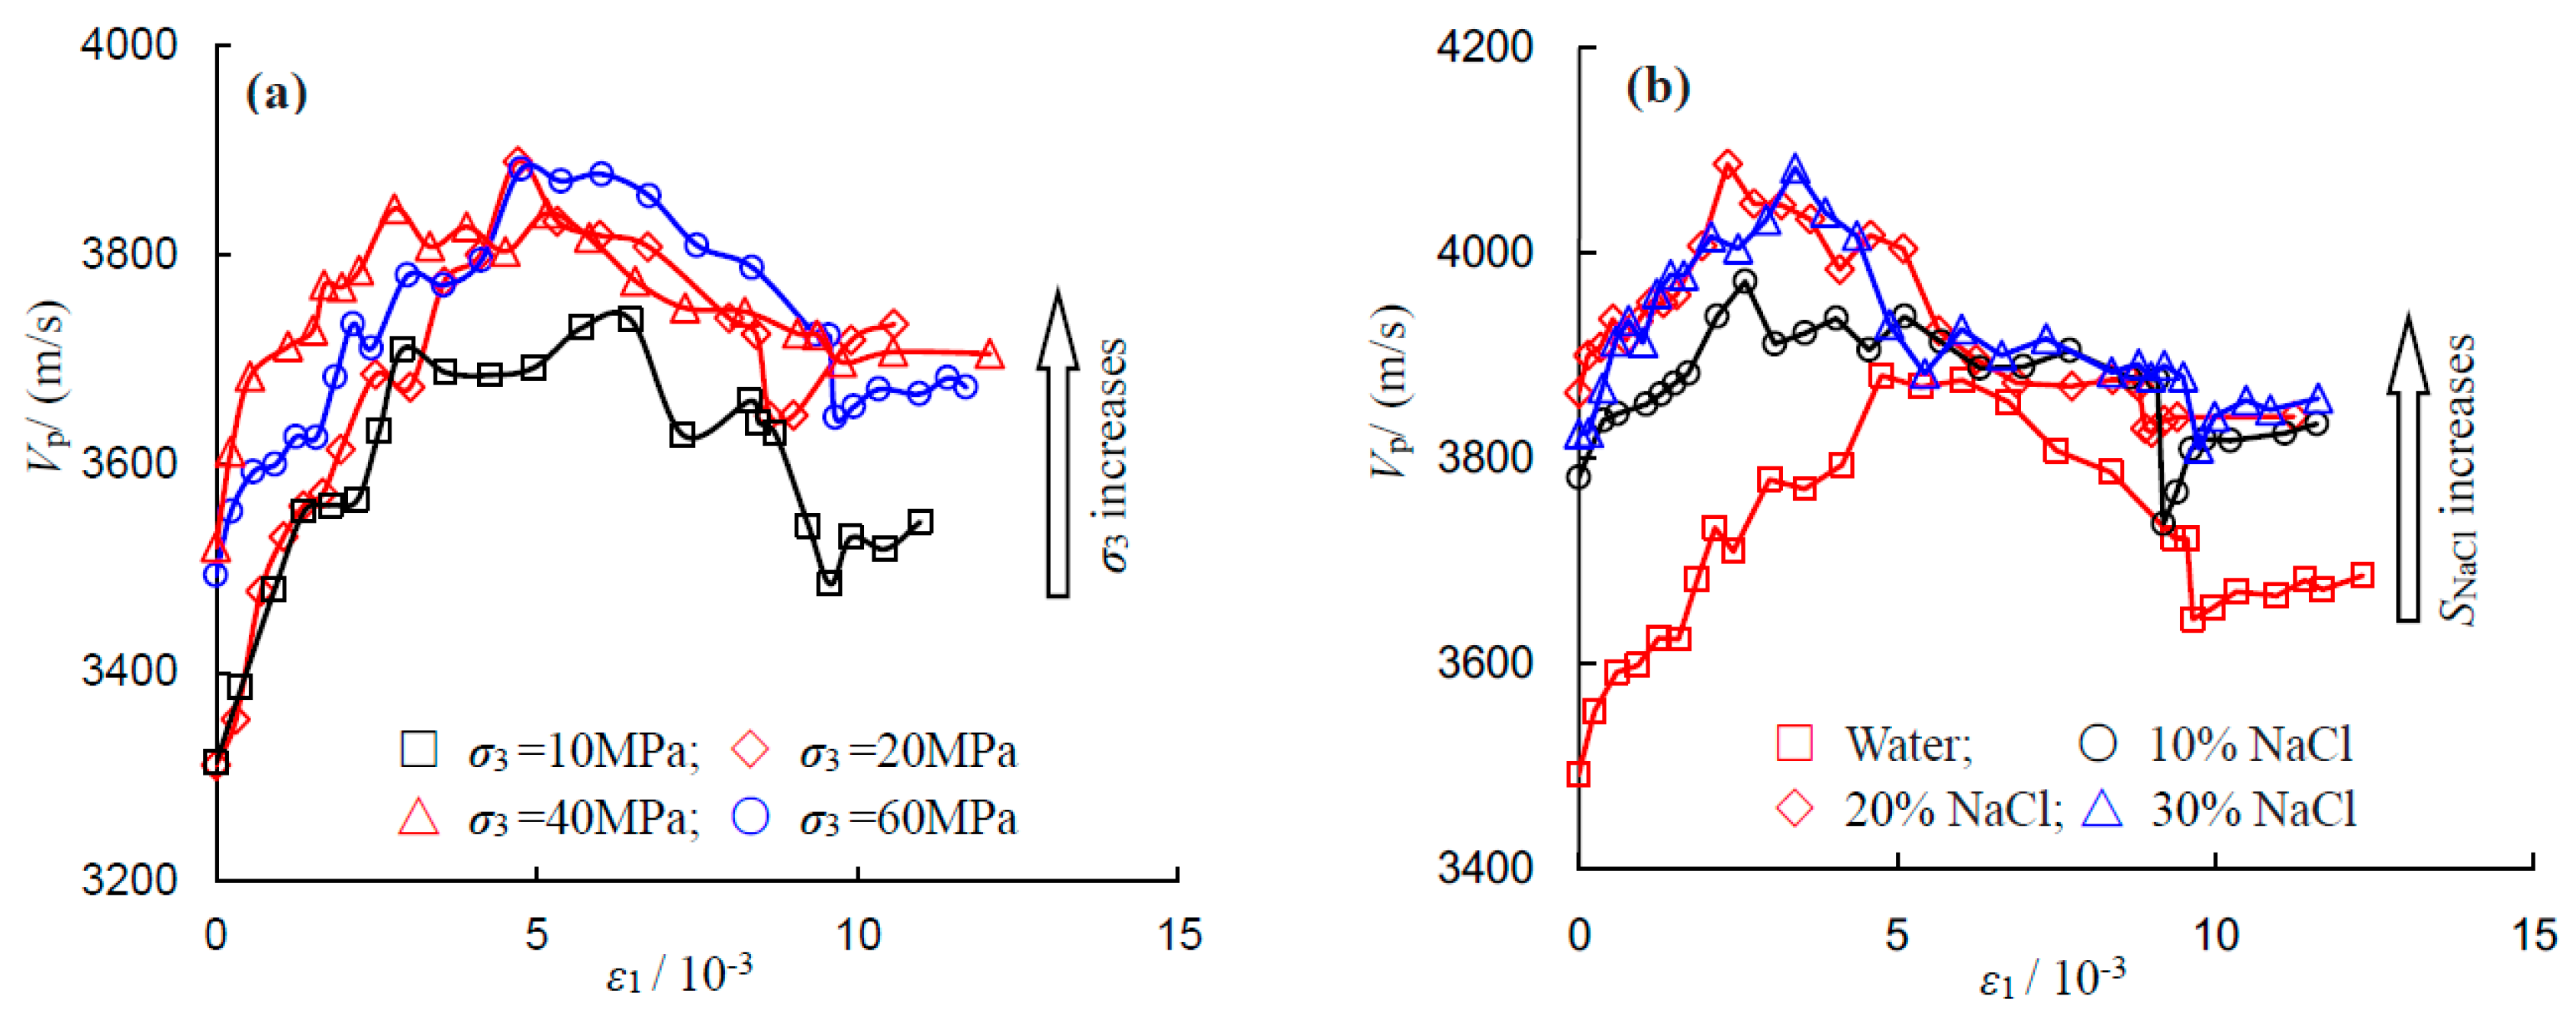
To investigate the influences of confining pressure and NaCl concentration on the ultrasonic wave velocity, the relationship between P-wave velocity and confining pressure and that between P-wave velocity and NaCl concentration are shown in Figure 12a,b, respectively. Under the same salinity level, e.g., 0% in Figure 12a, increments in P-wave velocity were clearly observed when the applied confining pressure increases from 10 to 60 MPa. The reason for the P-wave velocity increment can be explained by the densification of the particle assembly within the rock under increased confining pressure.
As can be seen from Figure 12b, the P-wave velocity increases with NaCl concentration. An apparent enhancement in P-wave velocity was observed when the saturation condition changes from distilled water to 10% brine concentration. However, the rates of increase were reduced when the salinity level moved from 10% to 30%, which indicated that the enhancement effect of brine in the pore space is limited.
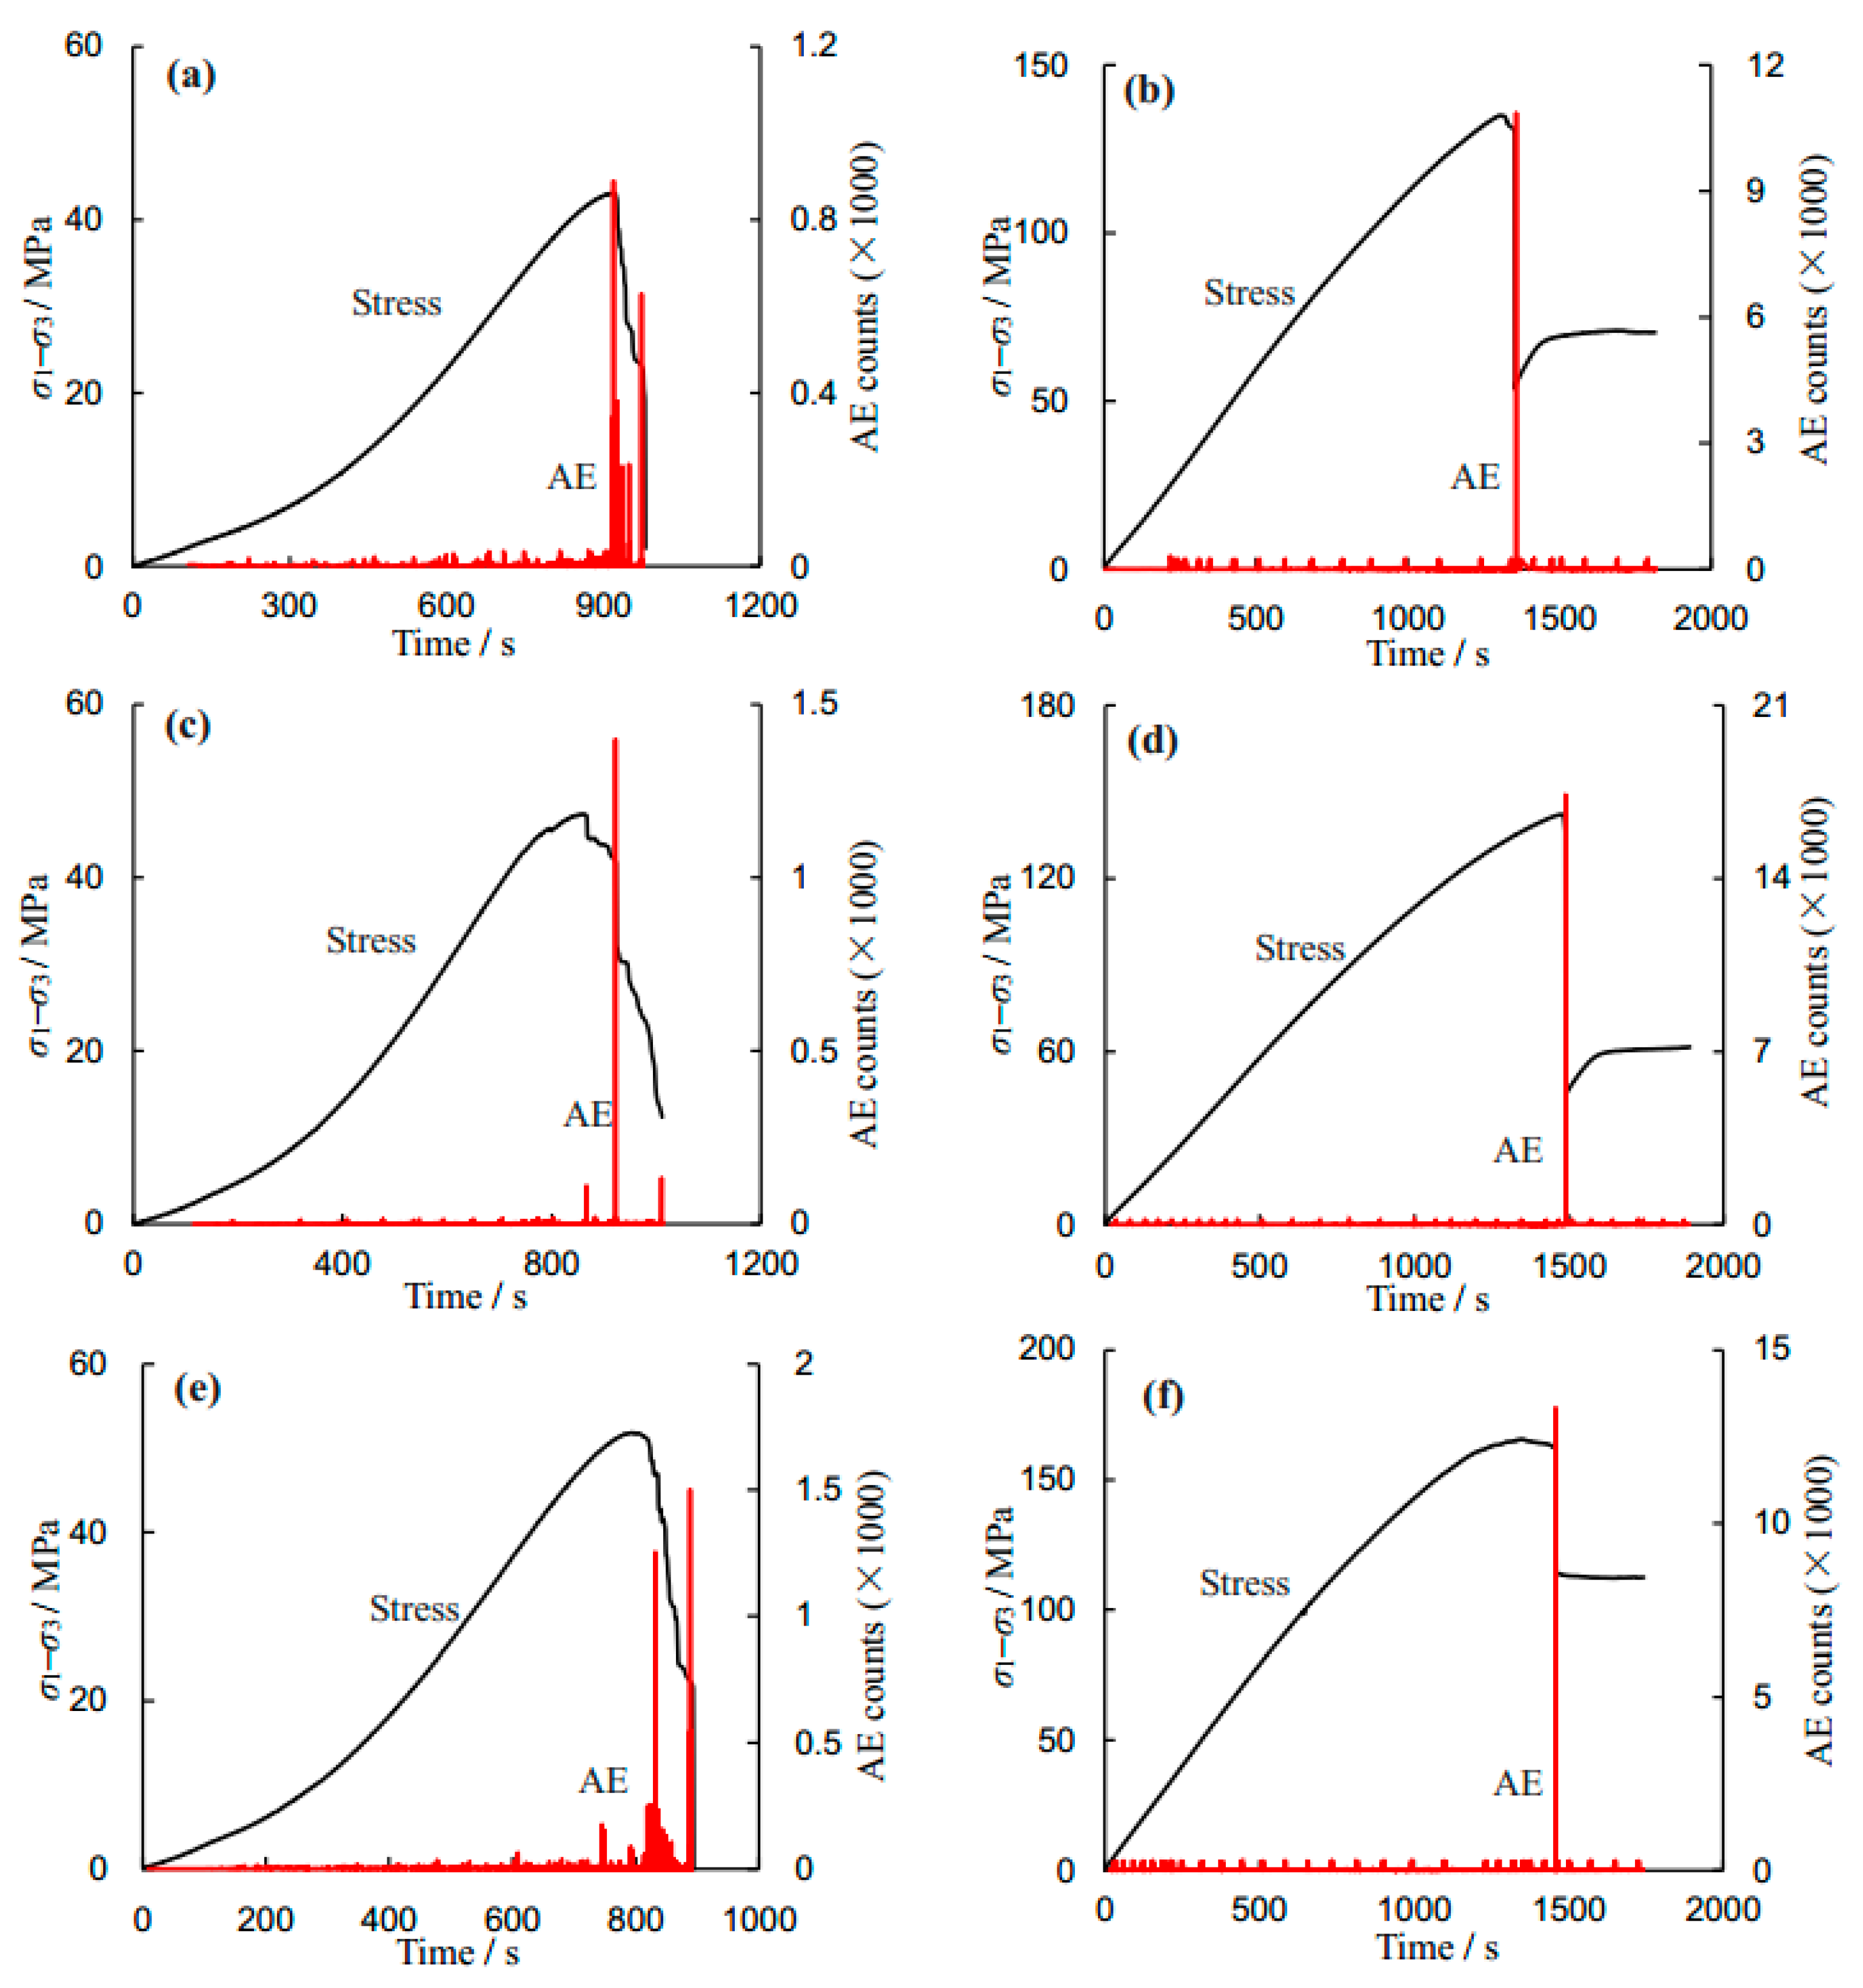
Figure 13 shows the evolution of AE events of sandstone specimens during the whole deformation process under conventional triaxial compression. From Figure 13, it is clear that the AE characteristic can be divided into two phases according to the active extent. Before peak strength, especially at the initial deformation stage, very few AE counts were recorded. At the nonlinear deformation stage (close to the peak strength), some AE events were observed. However, the magnitude of the AE events during this stage was relatively low compared to the post-peak stage. With the increase of deformation, the corresponding AE events became active, which indicates that the extent of fracturing within the specimen will most likely increase. When the specimen reached the post-peak stage, multiple abrupt AE counts were observed due to the initiation and coalescence of fractures. Moreover, the characteristics of the AE count under unconfined compression are quite different from those recorded under triaxial compression. In the 30% brine-saturated sandstone specimens shown in Figure 13e,f several AE counts can be seen at the post-peak strength stage during UCS, which correspond to the stress drops in the stress–strain curve. However, under a confining pressure of 40 MPa, only one huge AE count was observed during the whole deformation process. These AE phenomena confirm the observation that the sandstone fails progressively under low confining pressures, but fails abruptly under high confining pressures from the stress–strain curves shown in Figure 5.
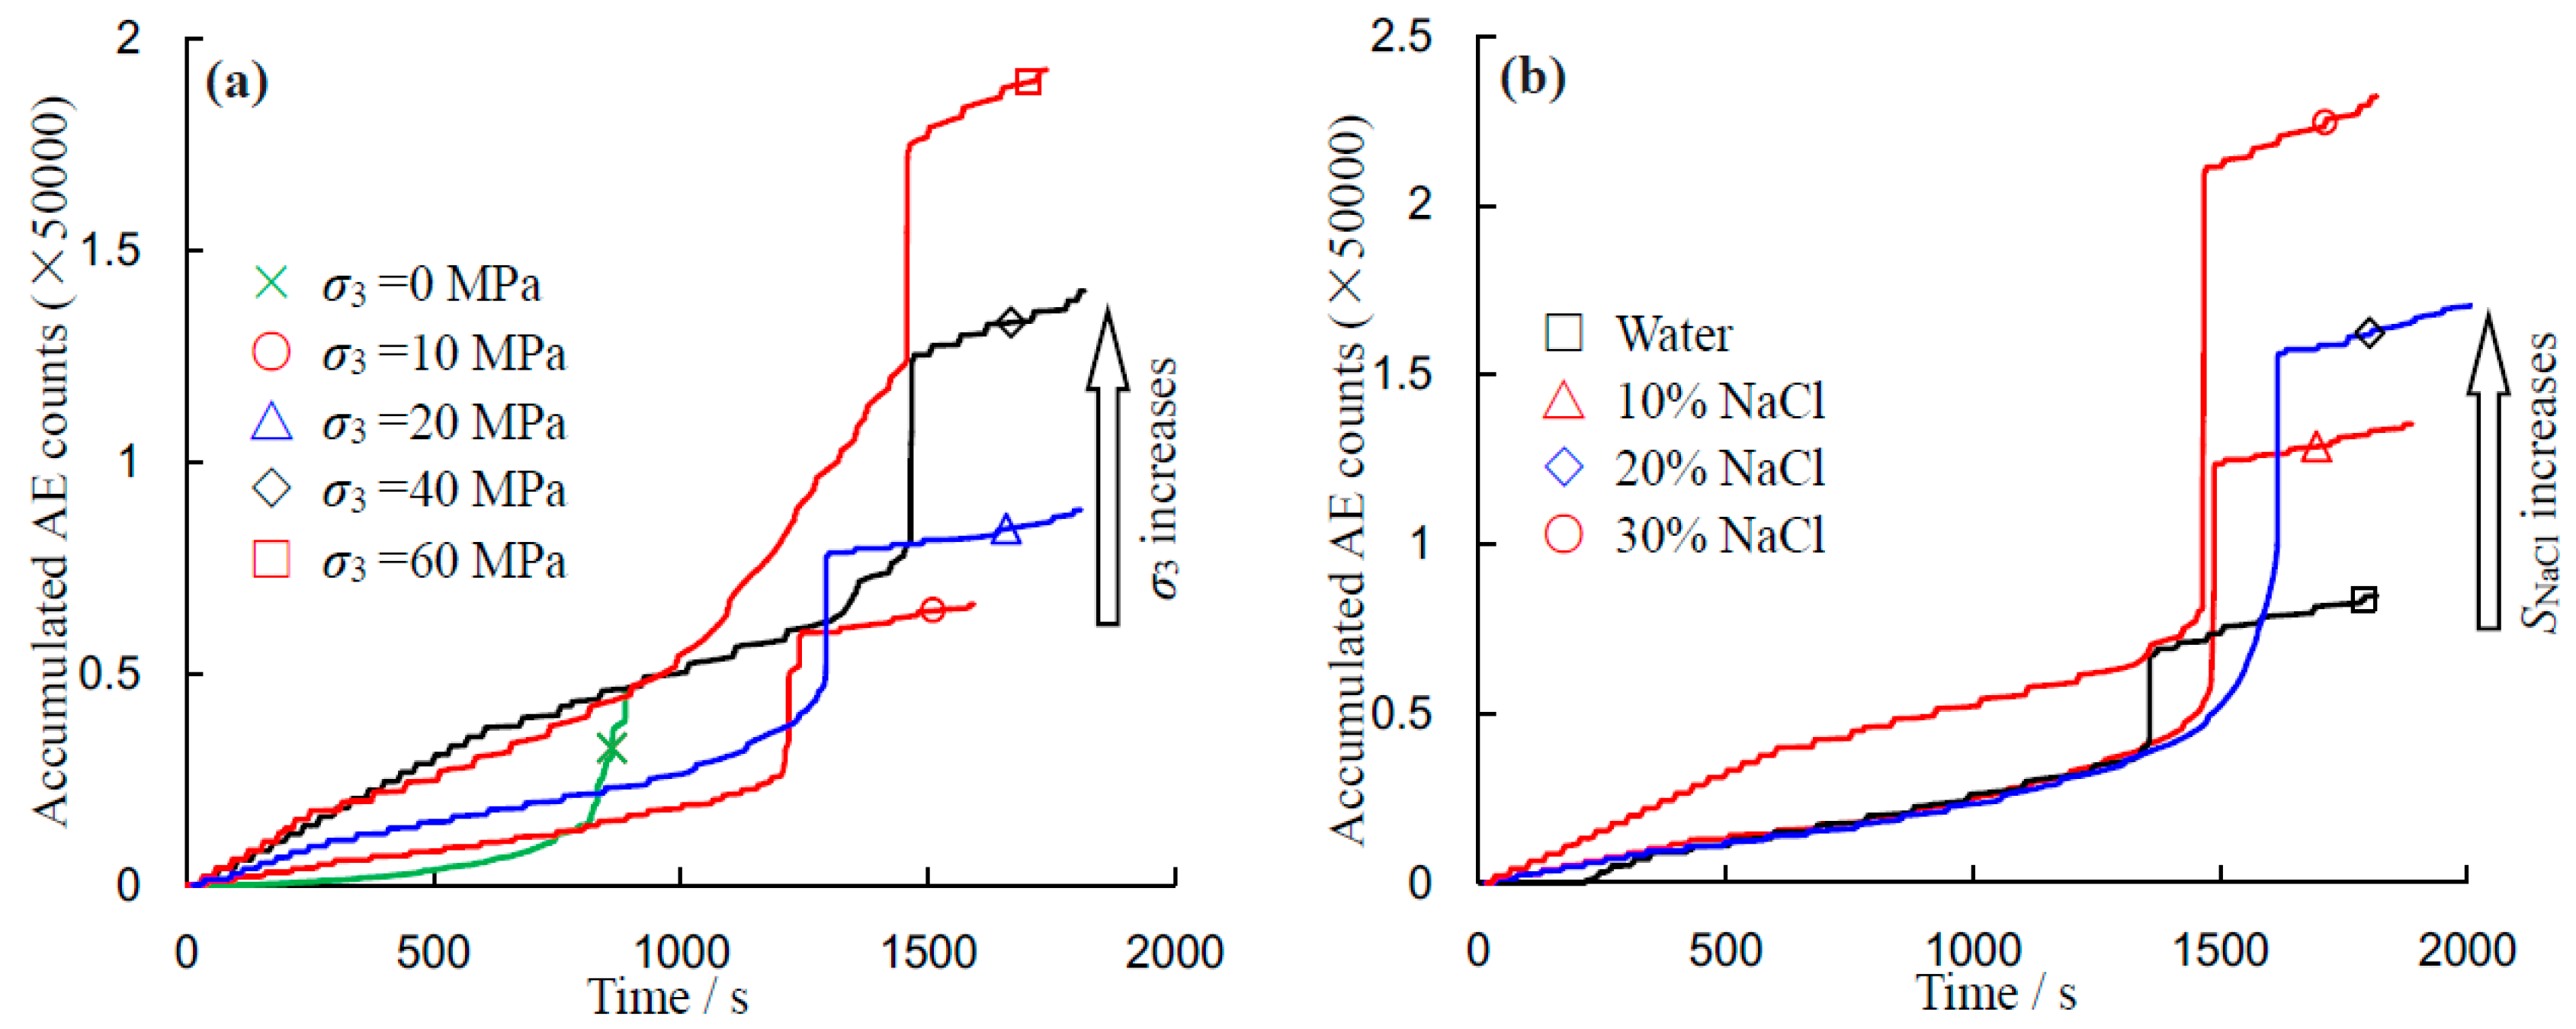
Figure 14 illustrates the evolution process of accumulated AE counts for sandstone specimens under triaxial compression. Generally, similar variation trends of AE can be observed for different applied confining pressures. With the increase of confining pressure, the rate of increase in the accumulated AE count before peak stress increased, along with the accumulated AE counts. However, the rate of increase in the accumulated AE counts before peak stress appeared to be independent of the salinity. The accumulated AE counts at the failure point increase with the NaCl concentration, as did the total accumulated AE counts. This again indicates that the increasing NaCl concentration strengthens the sandstone specimen. These phenomena correspond to the observed effect of the salinity level on the strength and Young’s modulus (see Figure 6 and Figure 9).
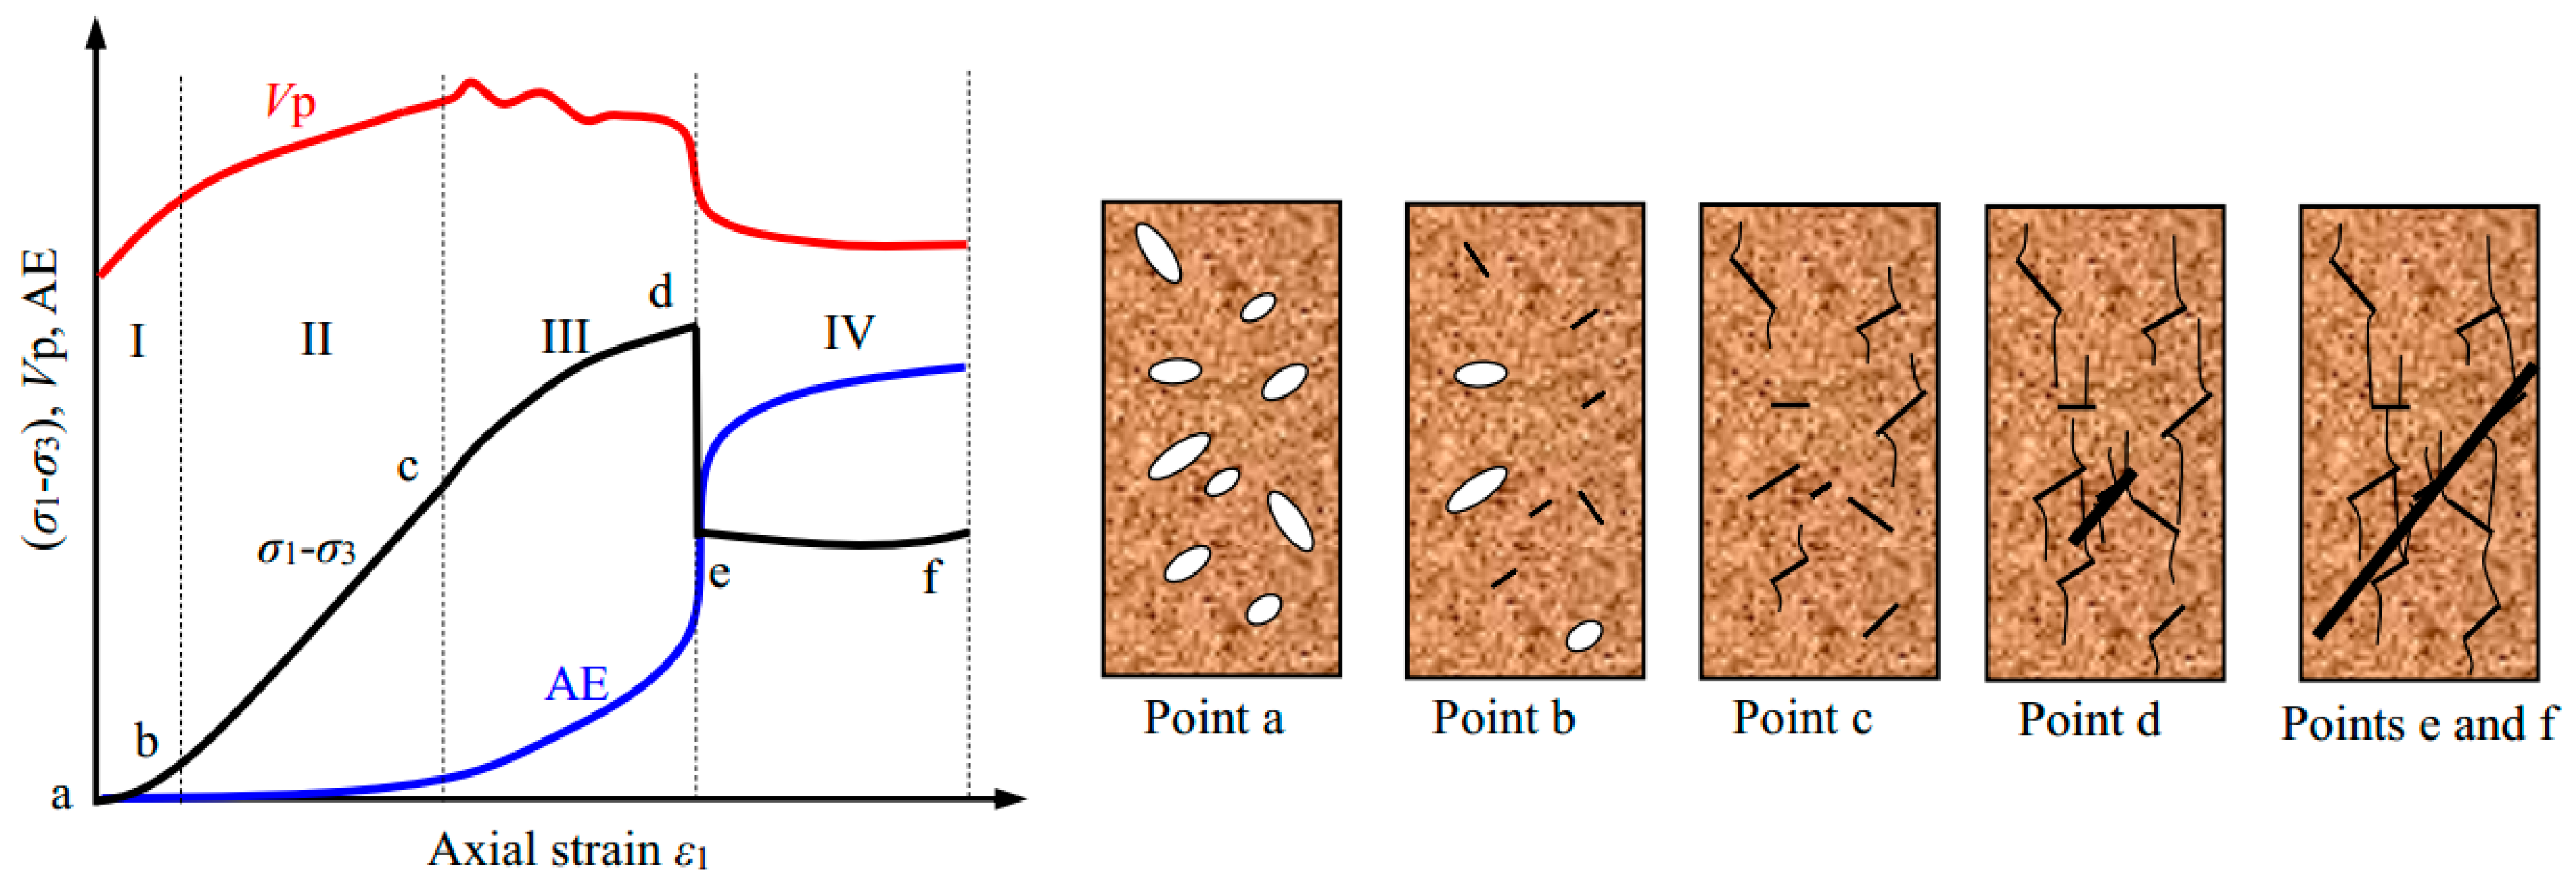
On the basis of the above observations, the evolution of P-wave velocity and AE event can be characterized as having four stages during the triaxial failure process (Figure 15). It is clear that the P-wave velocity and number of AE events evolve during the deformation process, and that both are dependent on the stress level. At the initial compressive deformation stage (from point a to point b), the P-wave velocity increased rapidly, while very few or no AE counts appeared. At the linear elastic deformation stage (from point b to point c), the P-wave velocity and the accumulated AE counts increased stably. At the nonlinear deformation stage (from point c to point d), the P-wave velocity decreased unstably, while the accumulated AE counts increased exponentially. At the residual strength stage (from point e to point f), the P-wave velocity remained constant, whilst the accumulated AE counts increased stably.

3.3. Fracture Behavior

The failure patterns of specimens can provide some important information on their mechanical behaviour [24,25]. To better understand the failure mechanisms of brine-saturated sandstone specimens under conventional triaxial compression, the images of failed specimens under each confining pressure and salinity level are shown in
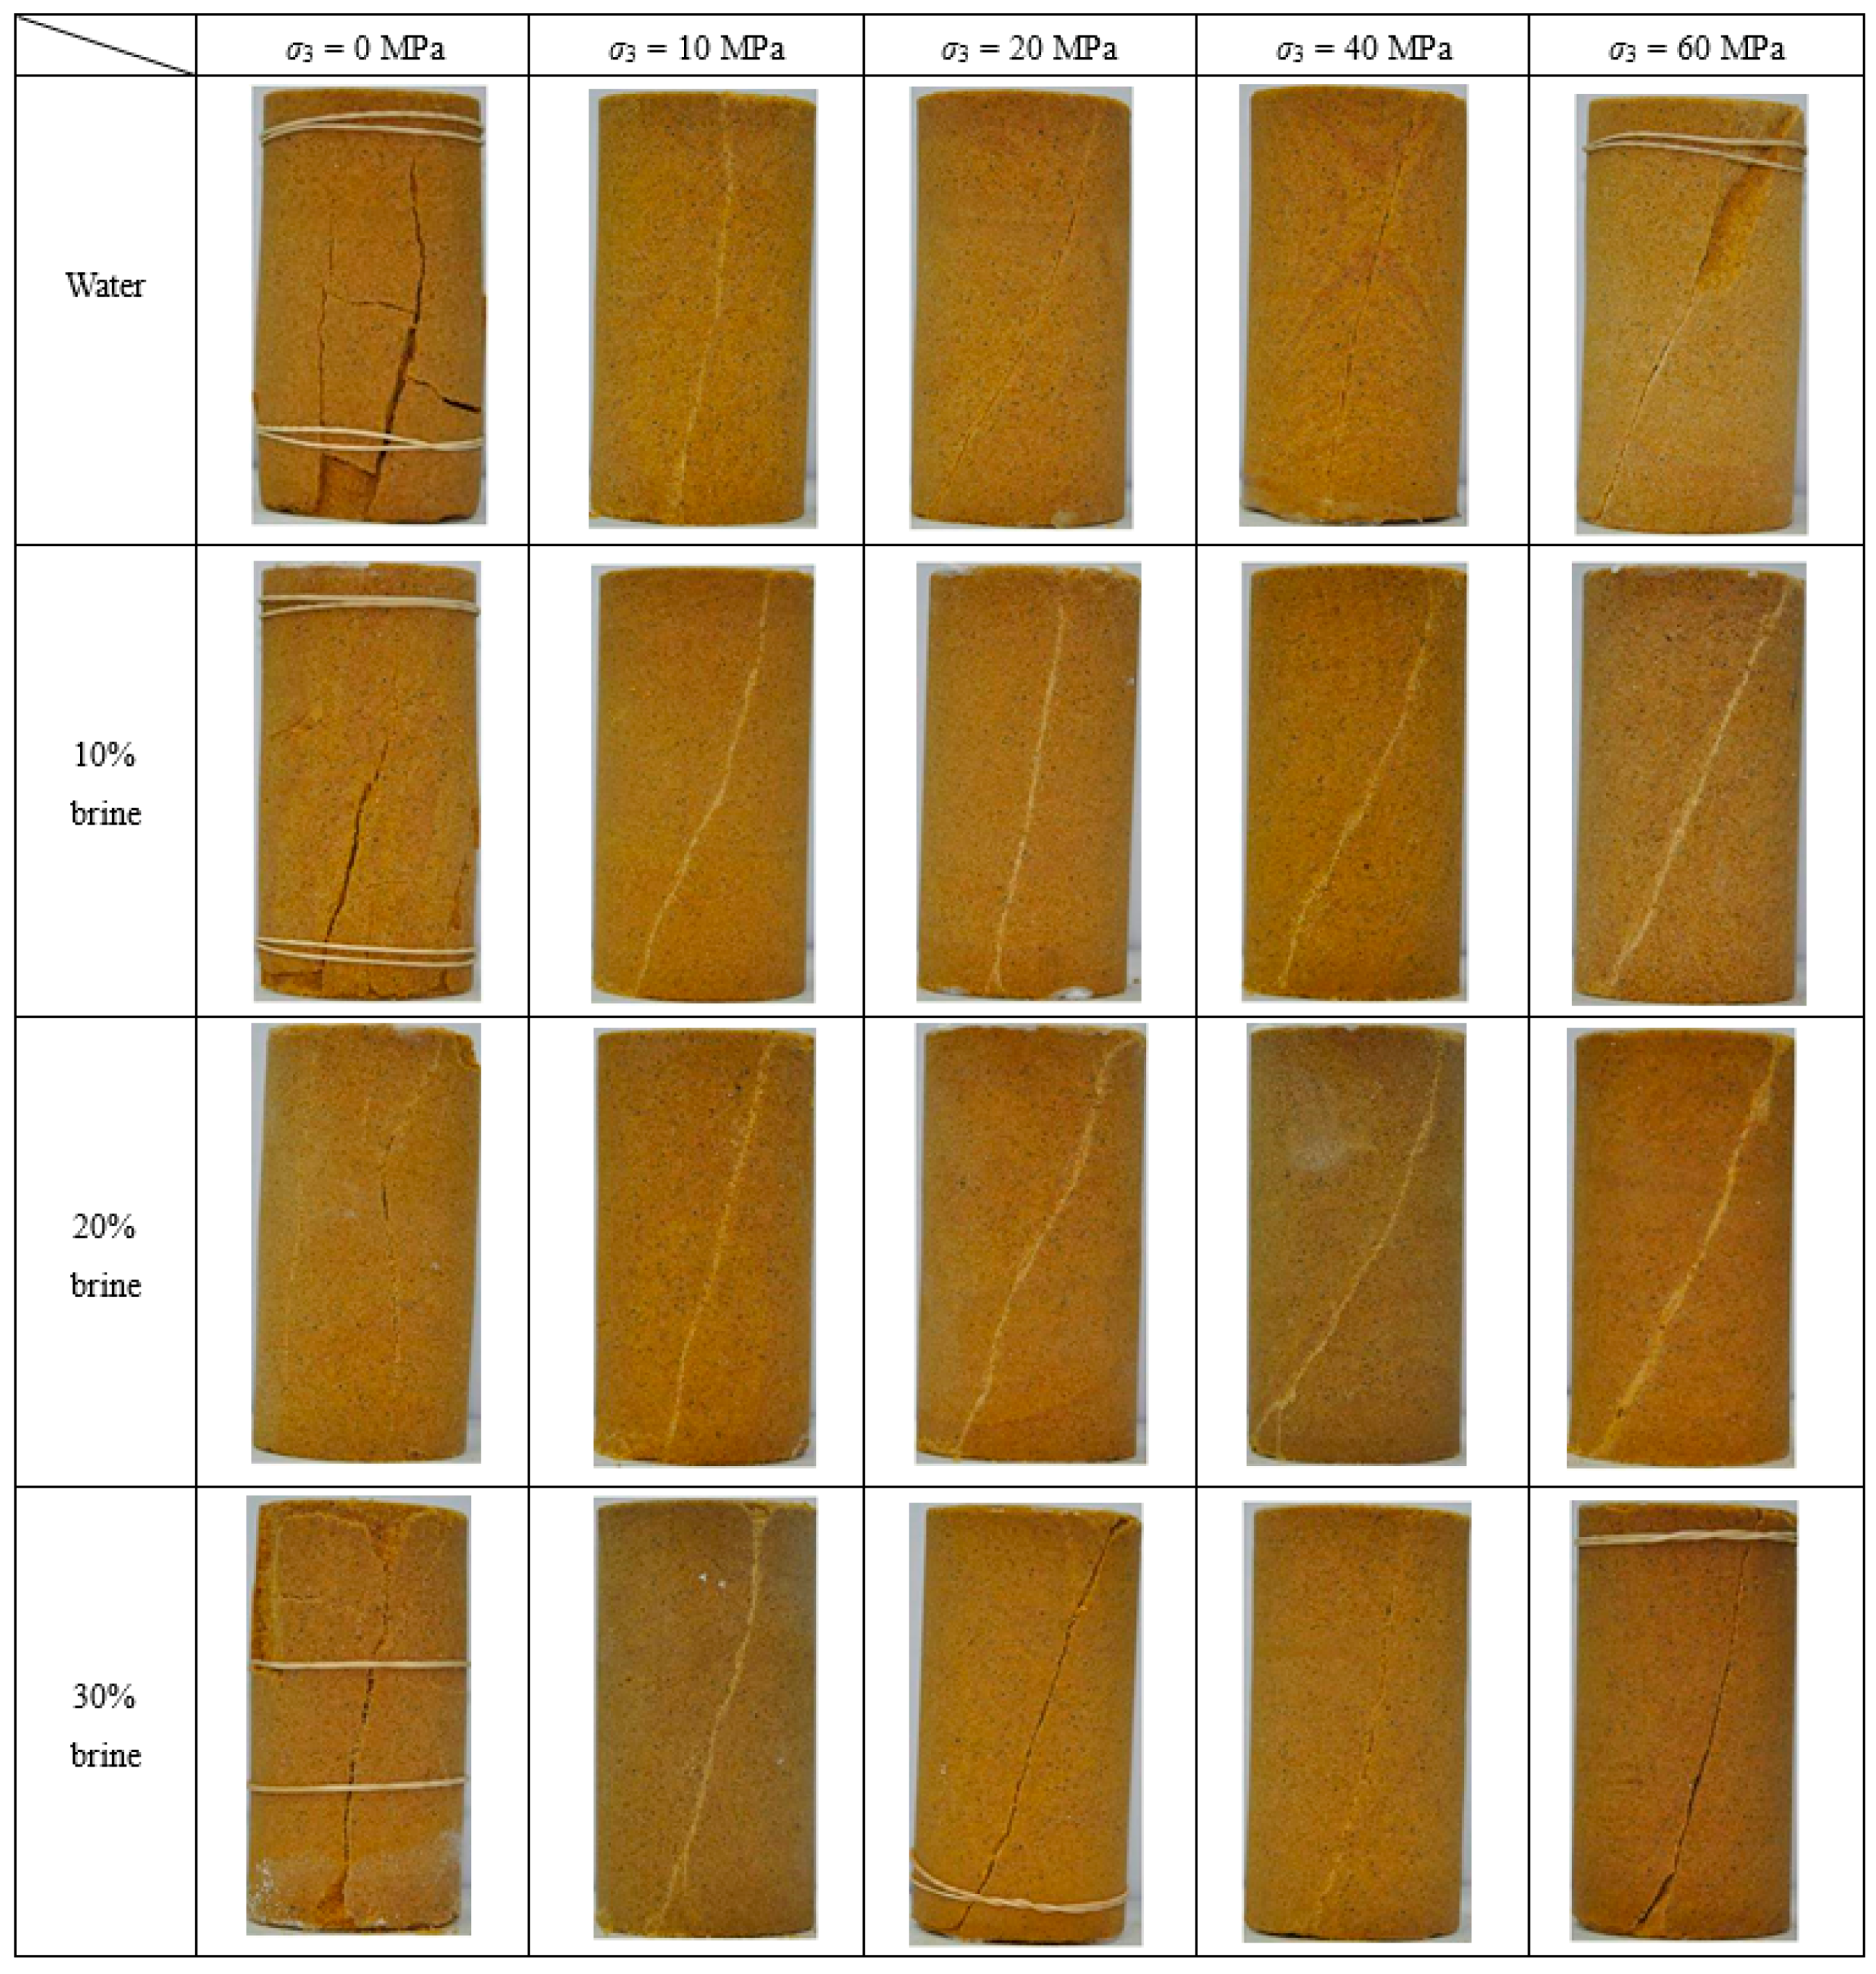
 Figure 16.
Overall, the failure modes of the sandstone specimens were closely related to the confining pressure, but appeared to be independent of NaCl concentration. There are two typical categories of failure patterns: splitting under uniaxial compression, and single shear failure under triaxial compression, which is consistent with the observation of previous studies [16,19,20,25]. In distilled-water-saturated specimens, the fracture angles between the fracture and the direction of minor principal stress (i.e., σ3) under confining pressures of 0, 10, 20, 40 and 60 MPa, were 90°, 81°, 78°, 79° and 71°, respectively. A similar trend of reduction in the fracture angle in water-saturated Hawkesbury sandstone specimens was reported by Wasantha and Ranjith [26]. This phenomenon indicates that the friction angle of the sandstone specimen decreases with increasing confining pressure, and possibly results from the more quasi-brittle behavior of sandstone specimens under higher confining pressures [26]. However, the trend of reduction in the fracture angle in brine-saturated sandstone specimens was less obvious than that using distilled water. The reduction of fracture angle implies an increase in the quasi-brittle behavior of the sandstone with increased confining pressure. This observation was supported by the observed characteristics of stress–strain response shown in Figure 5.
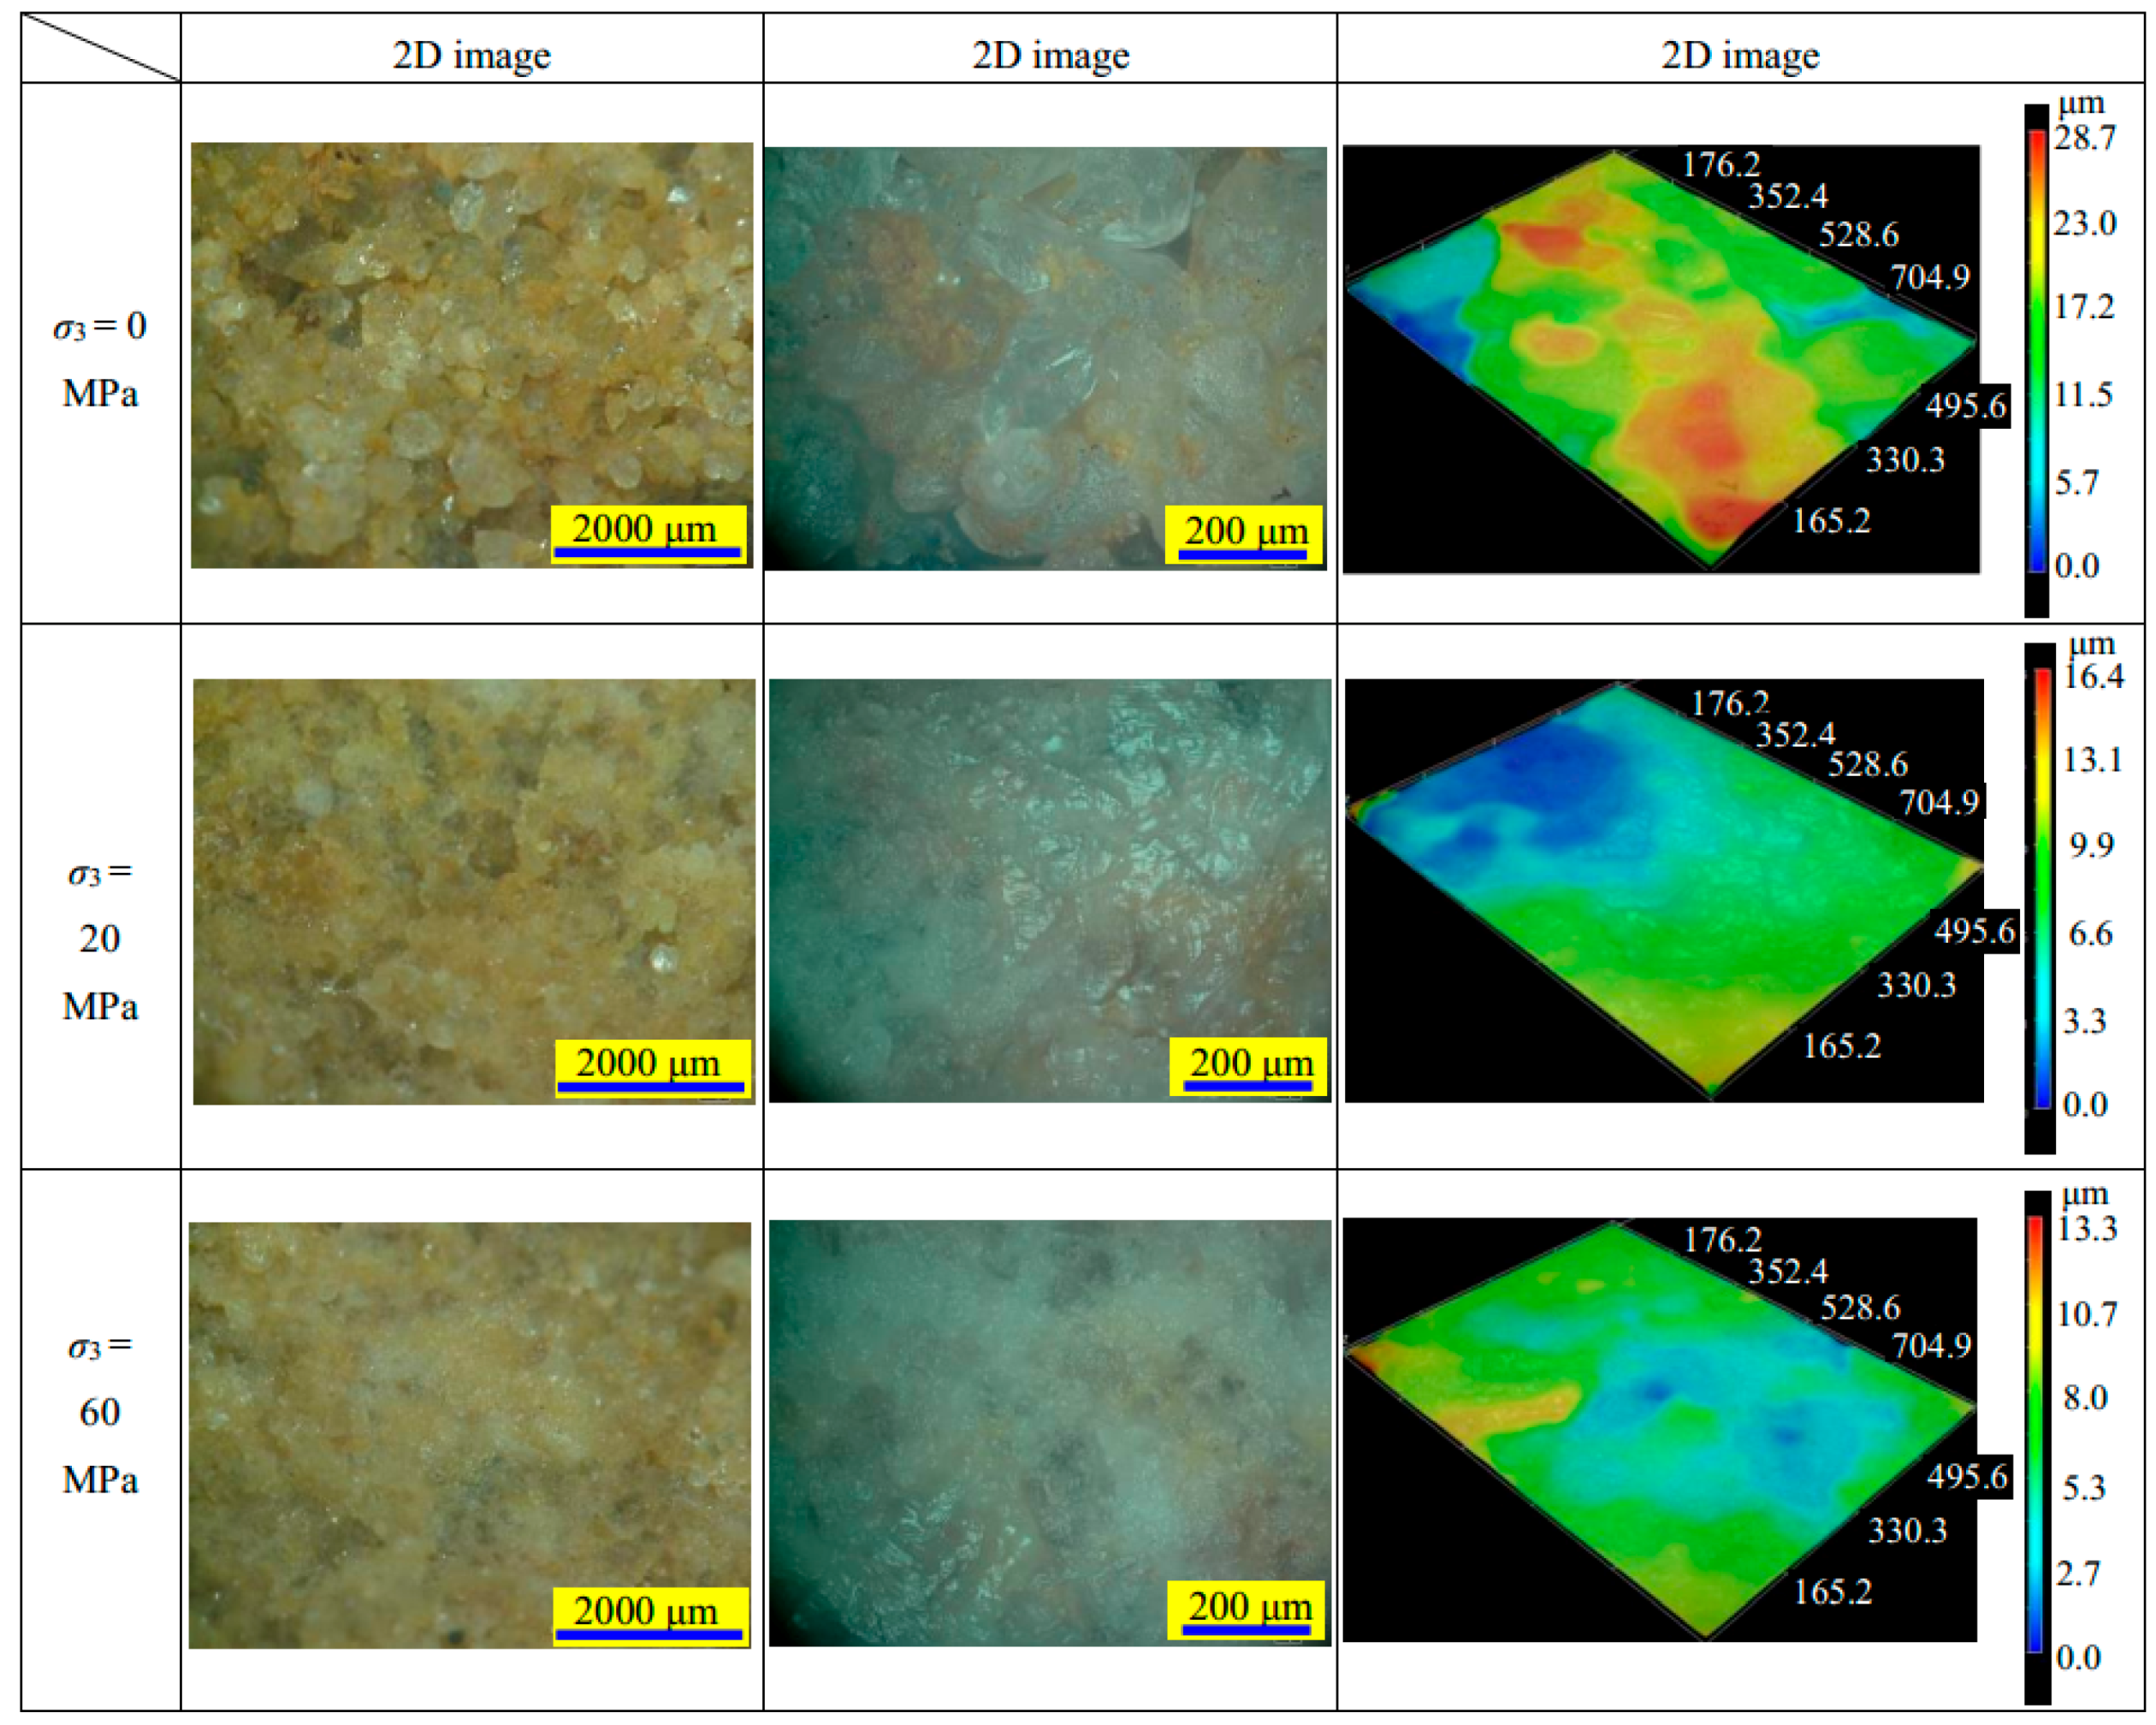
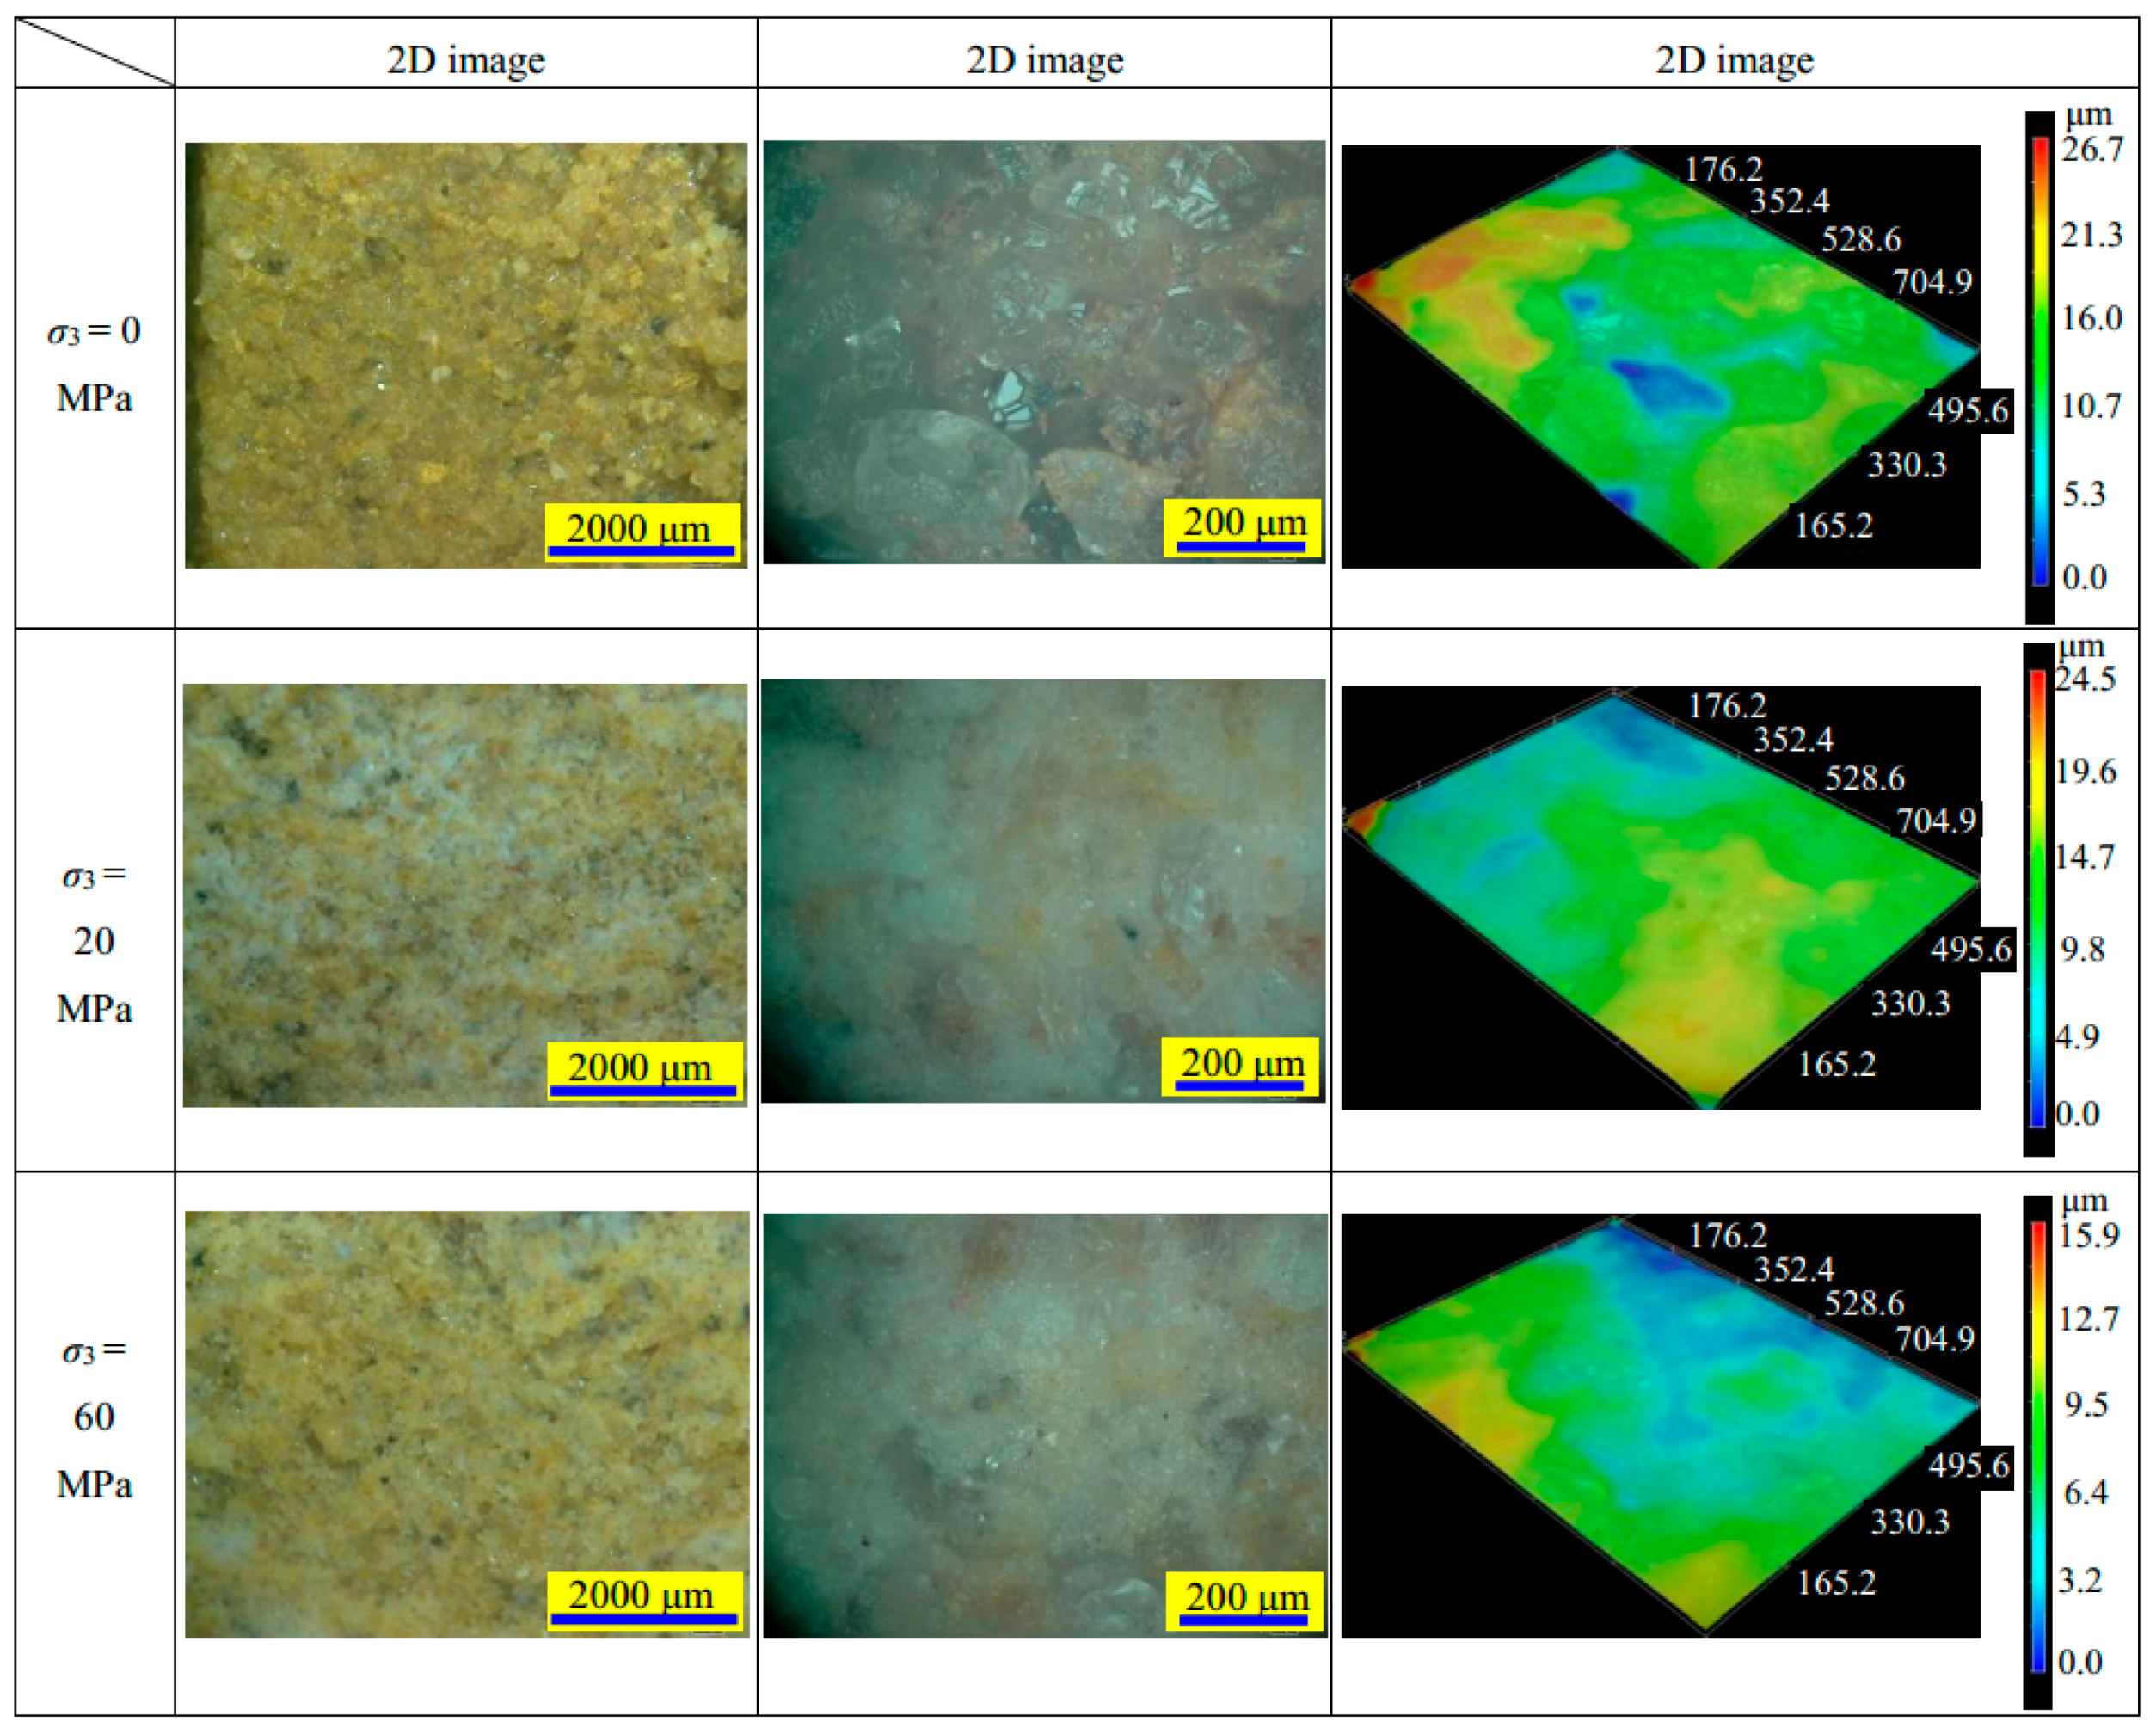
Microscopic observation tests were also carried out for the fracture surface of failed sandstone specimens. The fracture surfaces of distilled-water-saturated specimens and 30% NaCl-solution-saturated specimens under confining pressures of 0, 20 and 60 MPa were selected in the present study, as shown in Figure 17 and Figure 18.
From Figure 17, in the distilled-water-saturated sandstone specimens, the fracture surface is rough. Under higher resolution, the grains on the surface can be clearly observed. However, under a confining pressure of 20 MPa, frictional sliding was observed along the direction of the shear fracture plane. This was identified by the observation of rock flour at higher resolutions. Under a high confining pressure (e.g., 60 MPa), sliding is distinct, and a considerable amount of fault gouges were seen. The effect of confining pressure on the microstructure of the specimen under saline conditions (see Figure 18) is very similar to that of the specimen under water saturation.
Furthermore, in the distilled-water-saturated sandstone specimens, under confining pressures of 0, 20 and 60 MPa, the maximum height values were 26.7, 24.5 and 15.9 μm, respectively (see the third column in Figure 17). The height values were 28.7, 16.4 and 13.3 μm for the brine-saturated sandstone specimens (see the third column in Figure 18). The observed height reduction indicates that the friction increases with confining pressure. It needs to be noted that the micro-observations were conducted on a relatively small sub-sample of each sandstone specimen after conducting the triaxial compression tests. The height values are merely indicative and used as a qualitative comparison between the fracture plane surfaces. The indicative trend was that a reduction in height (surface roughness) was observed across the fracture surface as confining pressures were increased.

4. Conclusions

(1)
The strength and deformation parameters of the sandstone specimens were dependent on both the confining pressure and NaCl concentration. As the confining pressure and NaCl concentration increased, the triaxial compressive strength, crack damage threshold, Young’s modulus, cohesion, and internal friction angle all increased.
(2)
During the whole deformation process, the evolution of P-wave velocity and accumulated AE count could be divided into four phases. The P-wave velocity and AE were closely related to the confining pressure and NaCl concentration: the P-wave velocity and total AE count increased with increasing confining pressure and NaCl concentration.
(3)
The failure modes of the saturated sandstone specimens were closely related to the confining pressure, but were independent of the NaCl concentration. The tensile fracture surfaces formed during uniaxial compression were very rough in comparison to the shear fractures formed under triaxial compression. As the confining pressure increased, the friction on the fracture plane increased.

Acknowledgments

This research was supported by the National Natural Science Foundation of China (51734009) and Fundamental Research Funds for the Central Universities (2015XKZD05). The first author also wishes to acknowledge the support of the China Scholarship Council and the GeoEnergy Research Centre. The authors would like to express their sincere gratitude to the editor and the anonymous reviewers for their valuable comments, which have greatly improved this paper.

Author Contributions

Sheng-Qi Yang conceived and designed the experiments; Yan-Hua Huang and Yuan-Chao Zhang performed the experiments; Yan-Hua Huang and Sheng-Qi Yang analyzed the data; Yan-Hua Huang wrote the paper, which was revised by Sheng-Qi Yang and Matthew R. Hall.

Conflicts of Interest

The authors declare no conflict of interest.

References

  1. Feng, X.T.; Ding, W. Experimental study of limestone micro-fracturing under a coupled stress, fluid flow and changing chemical environment. Int. J. Rock Mech. Min. Sci. 2007, 44, 437–448. [Google Scholar] [CrossRef]
  2. Talesnick, M.; Shehadeh, S. The effect of water content on the mechanical response of a high-porosity chalk. Int. J. Rock Mech. Min. Sci. 2007, 44, 584–600. [Google Scholar] [CrossRef]
  3. Yilmaz, I. Influence of water content on the strength and deformability of gypsum. Int. J. Rock Mech. Min. Sci. 2010, 47, 342–347. [Google Scholar] [CrossRef]
  4. Yang, Y.C.; Zhou, J.W.; Xu, F.G.; Xing, H.G. An Experimental Study on the Water-Induced Strength Reduction in Zigong Argillaceous Siltstone with Different Degree of Weathering. Adv. Mater. Sci. Eng. 2016. [Google Scholar] [CrossRef]
  5. Chen, G.; Li, T.; Wang, W.; Zhu, Z.; Chen, Z.; Tang, O. Weakening effects of the presence of water on the brittleness of hard sandstone. Bull. Eng. Geol. Environ. 2017. [Google Scholar] [CrossRef]
  6. Bruant, R.; Guswa, A.; Celia, M.; Peters, C. Safe Storage of CO2 in Deep Saline Aquifers. Environ. Sci. Technol. 2002, 36, 240A–245A. [Google Scholar] [CrossRef] [PubMed]
  7. Soong, Y.; Goodman, A.L.; McCarthy-Jones, J.R.; Baltrus, J.P. Experimental and simulation studies on mineral trapping of CO2 with brine. Energy Convers. Manag. 2014, 45, 1845–1859. [Google Scholar] [CrossRef]
  8. Shukla, R.; Ranjith, P.G.; Choi, S.K.; Haque, A.; Yellishetty, M.; Hong, L. Mechanical behaviour of reservoir rock under brine saturation. Rock Mech. Rock Eng. 2013, 46, 83–93. [Google Scholar] [CrossRef]
  9. Rathnaweera, T.D.; Ranjith, P.G.; Perera, M.S.A. Salinity-dependent strength and stress–strain characteristics of reservoir rocks in deep saline aquifers: An experimental study. Fuel 2014, 122, 1–11. [Google Scholar] [CrossRef]
  10. Nasvi, M.C.M.; Ranjith, P.G.; Sanjayan, J.; Haque, A.; Li, X. Mechanical behaviour of wellbore materials saturated in brine water with different salinity levels. Energy 2014, 66, 239–249. [Google Scholar] [CrossRef]
  11. Zheng, H.; Feng, X.T.; Pan, P.Z. Experimental investigation of sandstone properties under CO2–NaCl solution-rock interactions. Int. J. Greenh. Gas Control 2015, 37, 451–470. [Google Scholar] [CrossRef]
  12. Rathnaweera, T.D.; Ranjith, P.G.; Perera, M.S.A.; Lashin, A.; Al Arifi, N. Non-linear stress–strain behaviour of reservoir rock under brine saturation: An experimental study. Measurement 2015, 71, 56–72. [Google Scholar] [CrossRef]
  13. Fairhurst, C.E.; Hudson, J.A. Draft ISRM suggested method for the complete stress-strain curve for intact rock in uniaxial compression. Int. J. Rock Mech. Min. Sci. 1999, 36, 279–289. [Google Scholar]
  14. Hem, J.D. Study and Interpretation of the Chemical Characteristics of Natural Water; U.S. Geology Survey Water-Supply Paper; U.S. Geology Survey: Reston, VA, USA, 1959.
  15. Bachu, S.; Bennion, B. Effects of in situ conditions on relative permeability characteristics of CO2-brine systems. Environ. Geol. 2008, 54, 1707–1722. [Google Scholar] [CrossRef]
  16. Yang, S.Q.; Ranjith, P.G.; Jing, H.W.; Tian, W.L.; Ju, Y. An experimental investigation on thermal damage and failure mechanical behavior of granite after exposure to different high temperature treatments. Geothermics 2017, 65, 180–197. [Google Scholar] [CrossRef]
  17. Wang, Y.; Li, X.; Zheng, B. Experimental study on mechanical properties of clay soil under compression by ultrasonic test. Eur. J. Environ. Civ. Eng. 2016. [Google Scholar] [CrossRef]
  18. Glover, P.W.; Gómez, J.B.; Meredith, P.G. Fracturing in saturated rocks undergoing triaxial deformation using complex electrical conductivity measurements: Experimental study. Earth Planet. Sci. Lett. 2000, 183, 201–213. [Google Scholar] [CrossRef]
  19. Li, D.; Wong, L.N.Y.; Liu, G.; Zhang, X. Influence of water content and anisotropy on the strength and deformability of low porosity meta-sedimentary rocks under triaxial compression. Eng. Geol. 2012, 126, 46–66. [Google Scholar] [CrossRef]
  20. Yang, S.Q.; Xu, P.; Li, Y.B.; Huang, Y.H. Experimental investigation on triaxial mechanical and permeability behavior of sandstone after exposure to different high temperature treatments. Geothermics 2017, 69, 93–109. [Google Scholar] [CrossRef]
  21. Wong, T.F.; David, C.; Zhu, W. The transition from brittle faulting to cataclastic flow in porous sandstones: Mechanical deformation. J. Geophys. Res. Solid Earth 1997, 102, 3009–3025. [Google Scholar] [CrossRef]
  22. Heap, M.J.; Baud, P.; Meredith, P.G.; Bell, A.F.; Main, I.G. Time-dependent brittle creep in Darley Dale sandstone. J. Geophys. Res. Solid Earth 2009, 114. [Google Scholar] [CrossRef]
  23. Yang, S.Q.; Tian, W.L.; Ranjith, P.G. Experimental investigation on deformation failure characteristics of crystalline marble under triaxial cyclic loading. Rock Mech. Rock Eng. 2017, 50, 2871–2889. [Google Scholar] [CrossRef]
  24. Yang, S.Q.; Tian, W.L.; Huang, Y.H. Failure mechanical behavior of pre-holed granite specimens after elevated temperature treatment by particle flow code. Geothermics 2018, 72, 124–137. [Google Scholar] [CrossRef]
  25. Wasantha, P.L.P.; Darlington, W.J.; Ranjith, P.G. Characterization of mechanical behaviour of saturated sandstone using a newly developed triaxial apparatus. Exp. Mech. 2013, 53, 871–882. [Google Scholar] [CrossRef]
  26. Wasantha, P.L.P.; Ranjith, P.G. Water-weakening behavior of Hawkesbury sandstone in brittle regime. Eng. Geol. 2014, 178, 91–101. [Google Scholar] [CrossRef]
Figure 1. Sandstone specimen used for the present study. (a) Cylindrical sandstone specimen; (b) Surface digital photograph; (c) Cross-section by computerized tomography (CT) scanning; and (d) scanning electron microscopic (SEM) image.
Energies 11 00385 g001
Figure 2. Saturation process under saline condition. (a) Desiccator and vacuum pump used for brine saturation; and (b) mass change of two sandstone specimens against time.
Energies 11 00385 g002
Figure 3. Microstructure of tested sandstone under different solution conditions. (a) Dry specimen; (b) Distilled water (0% brine); (c) 10% brine; (d) 20% brine; and (e) 30% brine.
Energies 11 00385 g003
Figure 4. GCTS RTX–4000 rock triaxial testing system. (a) Overview of the testing system; and (b) Detail displacement, ultrasonic wave and acoustic emission (AE) measurement.
Energies 11 00385 g004
Figure 5. Stress–strain of saturated sandstone specimens under conventional triaxial compression. (a) Distilled water saturation; (b) 10% brine saturation; (c) 20% brine saturation; and (d) 30% brine saturation.
Energies 11 00385 g005
Figure 6. Effect of confining pressure and salinity on the peak strength of sandstone specimens. (a) Triaxial compressive strength versus confining pressure; and (b) Triaxial compressive strength versus salinity level. Note: σS = σp + σ3.
Energies 11 00385 g006
Figure 7. The influence of confining pressure and salinity level on crack damage stress of sandstone specimens. (a) Crack damage stress versus confining pressure; and (b) Crack damage stress versus peak strength. Note: σsd = σcd + σ3.
Energies 11 00385 g007
Figure 8. The influence of salinity level on cohesion and the internal friction angle of sandstone specimens. (a) Cohesion; and (b) Internal friction angle.
Energies 11 00385 g008
Figure 9. The influence of confining pressure and salinity level on the Young’s modulus of sandstone specimens under triaxial compression. (a) Deformation modulus; and (b) Ratio of deformation modulus to elastic modulus.
Energies 11 00385 g009
Figure 10. P-wave velocity against axial strain during complete failure process under triaxial compression. (a) Water, σ3 = 10 MPa; (b) Water, σ3 = 60 MPa; (c) 10% NaCl, σ3 = 10 MPa; (d) 10% NaCl, σ3 = 60 MPa; (e) 30% NaCl, σ3 = 10 MPa; and (f) 30% NaCl, σ3 = 60 MPa.
Energies 11 00385 g010
Figure 11. P-wave velocity against volumetric strain during complete failure process with respect to various salinity levels. (a) Water, σ3 = 10 MPa; (b) 10% NaCl, σ3 = 10 MPa; (c) 20% NaCl, σ3 = 10 MPa; and (d) 30% NaCl, σ3 = 10 MPa.
Energies 11 00385 g011
Figure 12. Effects of confining pressure and of salinity level on the evolution of P-wave velocity of sandstone specimens under triaxial compression. (a) Influence of confining pressure (water saturation); and (b) Influence of salinity level (σ3 = 60 MPa).
Energies 11 00385 g012
Figure 13. AE counts and accumulated AE counts of saturated sandstone specimens during the whole deformation process. (a) Water, σ3 = 0 MPa; (b) Water, σ3 = 40 MPa; (c) 10% NaCl, σ3 = 0 MPa; (d) 10% NaCl, σ3 = 40 MPa; (e) 30% NaCl, σ3 = 0 MPa; and (f) 30% NaCl, σ3 = 40 MPa.
Energies 11 00385 g013
Figure 14. Effects of confining pressure and of salinity level on the accumulated AE counts of sandstone specimens under triaxial compression. (a) Influence of confining pressure (under 30% NaCl saturation); and (b) Influence of salinity level (σ3 = 40 MPa).
Energies 11 00385 g014
Figure 15. A sketch for the evolution of P-wave velocity and accumulated AE counts of rock specimens during conventional triaxial failure process.
Energies 11 00385 g015
Figure 16. Ultimate failure modes of saturated sandstone specimens under triaxial compression.
Energies 11 00385 g016
Figure 17. Micro-observation of the fracture plane of a sandstone specimen after failure under water saturation.
Energies 11 00385 g017
Figure 18. Micro-observation of the fracture plane of a sandstone specimen after failure under 30% NaCl saturation.
Energies 11 00385 g018

