Article

Electrical Trees and Their Growth in Silicone Rubber at Various Voltage Frequencies

1
State Key Lab of Electrical Power System, Department of Electrical Engineering, Tsinghua University, Beijing 100084, China
2
State Key Laboratory of Electrical Insulation and Power Equipment, Xi’an Jiaotong University, Xi’an 710049, Shaanxi, China
3
AC Project Construction Branch, State Grid Corporation of China, Beijing 100052, China
*
Author to whom correspondence should be addressed.
Energies 2018, 11(2), 327; https://doi.org/10.3390/en11020327
Submission received: 28 December 2017 / Revised: 25 January 2018 / Accepted: 26 January 2018 / Published: 2 February 2018
(This article belongs to the Section F: Electrical Engineering)

Abstract

:
The insulation property at high voltage frequencies has become a tough challenge with the rapid development of high-voltage and high-frequency power electronics. In this paper, the electrical treeing behavior of silicone rubber (SIR) is examined and determined at various voltage frequencies, ranging from 50 Hz to 130 kHz. The results show that the initiation voltage of electrical trees decreased by 27.9% monotonically, and they became denser when the voltage frequency increased. A bubble-shaped deterioration phenomenon was observed when the voltage frequency exceeded 100 kHz. We analyze the typical treeing growth pattern at 50 Hz (including pine-like treeing growth and bush-like treeing growth) and the bubble-growing pattern at 130 kHz. Bubbles grew exponentially within several seconds. Moreover, bubble cavities were detected in electrical tree channels at 50 Hz. Combined with the bubble-growing characteristics at 130 kHz, a potential growing model for electrical trees and bubbles in SIR is proposed to explain the growing patterns at various voltage frequencies.

1. Introduction

Electrical trees are pre-breakdown phenomena that accelerate the occurrence of insulation failure [1,2,3,4,5,6,7]. Owing to the harsh working conditions of power electrical equipment, there have been many investigations to determine the influence of temperature, voltage type, voltage frequency, thermal aging, and moisture on electrical treeing characteristics [8,9,10,11,12,13,14,15]. Partial discharge characteristics, treeing imaging technology, and channel characteristics have also been studied in order to better understanding the initiation and growth mechanisms of electrical treeing [2,7,16,17,18].
High-power, medium-voltage (several kV), and high-frequency (up to ~20 kHz) electronic equipment, i.e., insulated-gate bipolar transistors (IGBTs) and integrated gate-commutated thyristors (IGCTs), are critical to modern electrical power systems. With the widespread use of power electronics, insulation properties, i.e., the dielectric breakdown strength, surface charging, and electrical treeing characteristics, of polymeric materials have become critical issues, and have attracted increasing attention [12,19,20]. As mentioned above, electrical trees are among the main reasons of insulation failure. Trees will initiate and grow from dielectric defects. Once formed, they will develop within a short time and will lead to breakdown in dielectric materials in advance, especially under high-frequency voltages. Studies have shown that the electrical-treeing initiation voltage decreases with an increase in the voltage frequency. Meanwhile, electrical trees tend to be denser with increasing voltage frequency [12,13]. However, most experiments were carried out below 10 kHz, and there remain uncertainties to determine the mechanisms responsible for electrical treeing development under high voltage frequencies.
Silicone rubber (SIR) is an advanced insulating material that is widely used in high-voltage electrical equipment insulation, owing to its excellent electrical, thermal, and mechanical performance [14,21,22]. Because SIR is an elastic material, the mechanism responsible for electrical trees in SIR is different from that in polyethylene [2,7]. There are fewer studies that are aimed to determine electrical treeing behaviors in SIR compared to those that focus on polyethylene.
In this work, needle-plate samples are used to study the electrical treeing behavior in SIR materials. The processes of the initiation and development of electrical trees were automatically recorded via a digital microscopic imaging system at various voltage frequencies that range from 50 Hz to 130 kHz. Electrical treeing initiation and growing patterns of SIR samples were systematically analyzed. Bubble-shaped deterioration, which is a special breakdown phenomenon that has never been observed at lower voltage frequencies, occurred at 130 kHz. Then, the bubble-growing characteristics were evaluated. Moreover, a potential growing model for electrical trees in SIR was proposed to provide a reasonable explanation for the different tree-growing patterns at different voltage frequencies.

2. Experimental Details
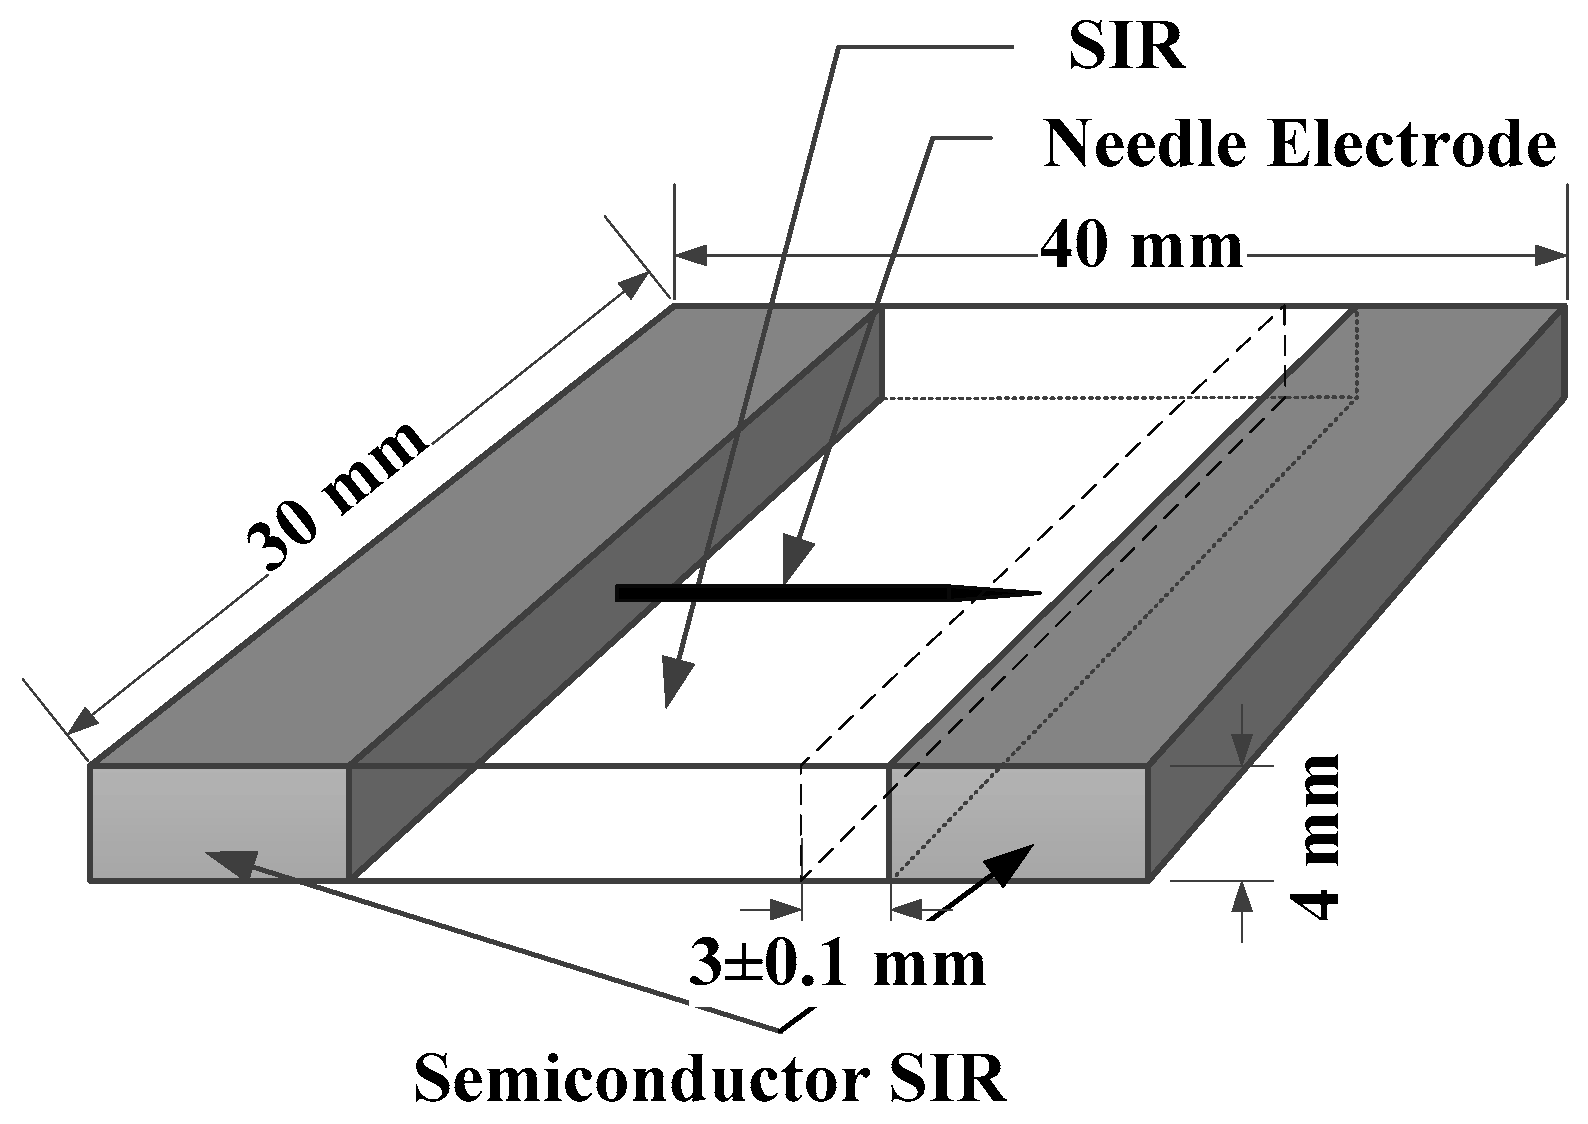
2.1. SIR Samples

In this study, we chose the needle-plate electrode model to study the electrical tree characteristics [14]. The two-component high-temperature vulcanization (HTV) liquid SIR (produced by Chinese Blue-star Chemical Company, Chengdu, China) was selected. Figure 1 shows the sample’s schematic with needle-plate electrode system. The details of the needle electrode are as follows: The cone angle was 30°, the diameter was around 250 μm, and the curvature radius was 3 μm. The needle electrode was connected to one semiconductor in a steel mold, and the vertical distance between the tip and the other semiconductor was adjusted to (3 ± 0.1) mm (shown in Figure 1). The well-mixed liquid SIR was poured into the mold. This process has been proven to avoid mechanical destruction near the needle tip as much as possible. Then, another flat steel was placed to cover it. Finally, the steel mode with the poured liquid SIR and needle tip was put under a hot-press machine at 165 °C and 6 MPa for 10 min to form the test SIR samples.

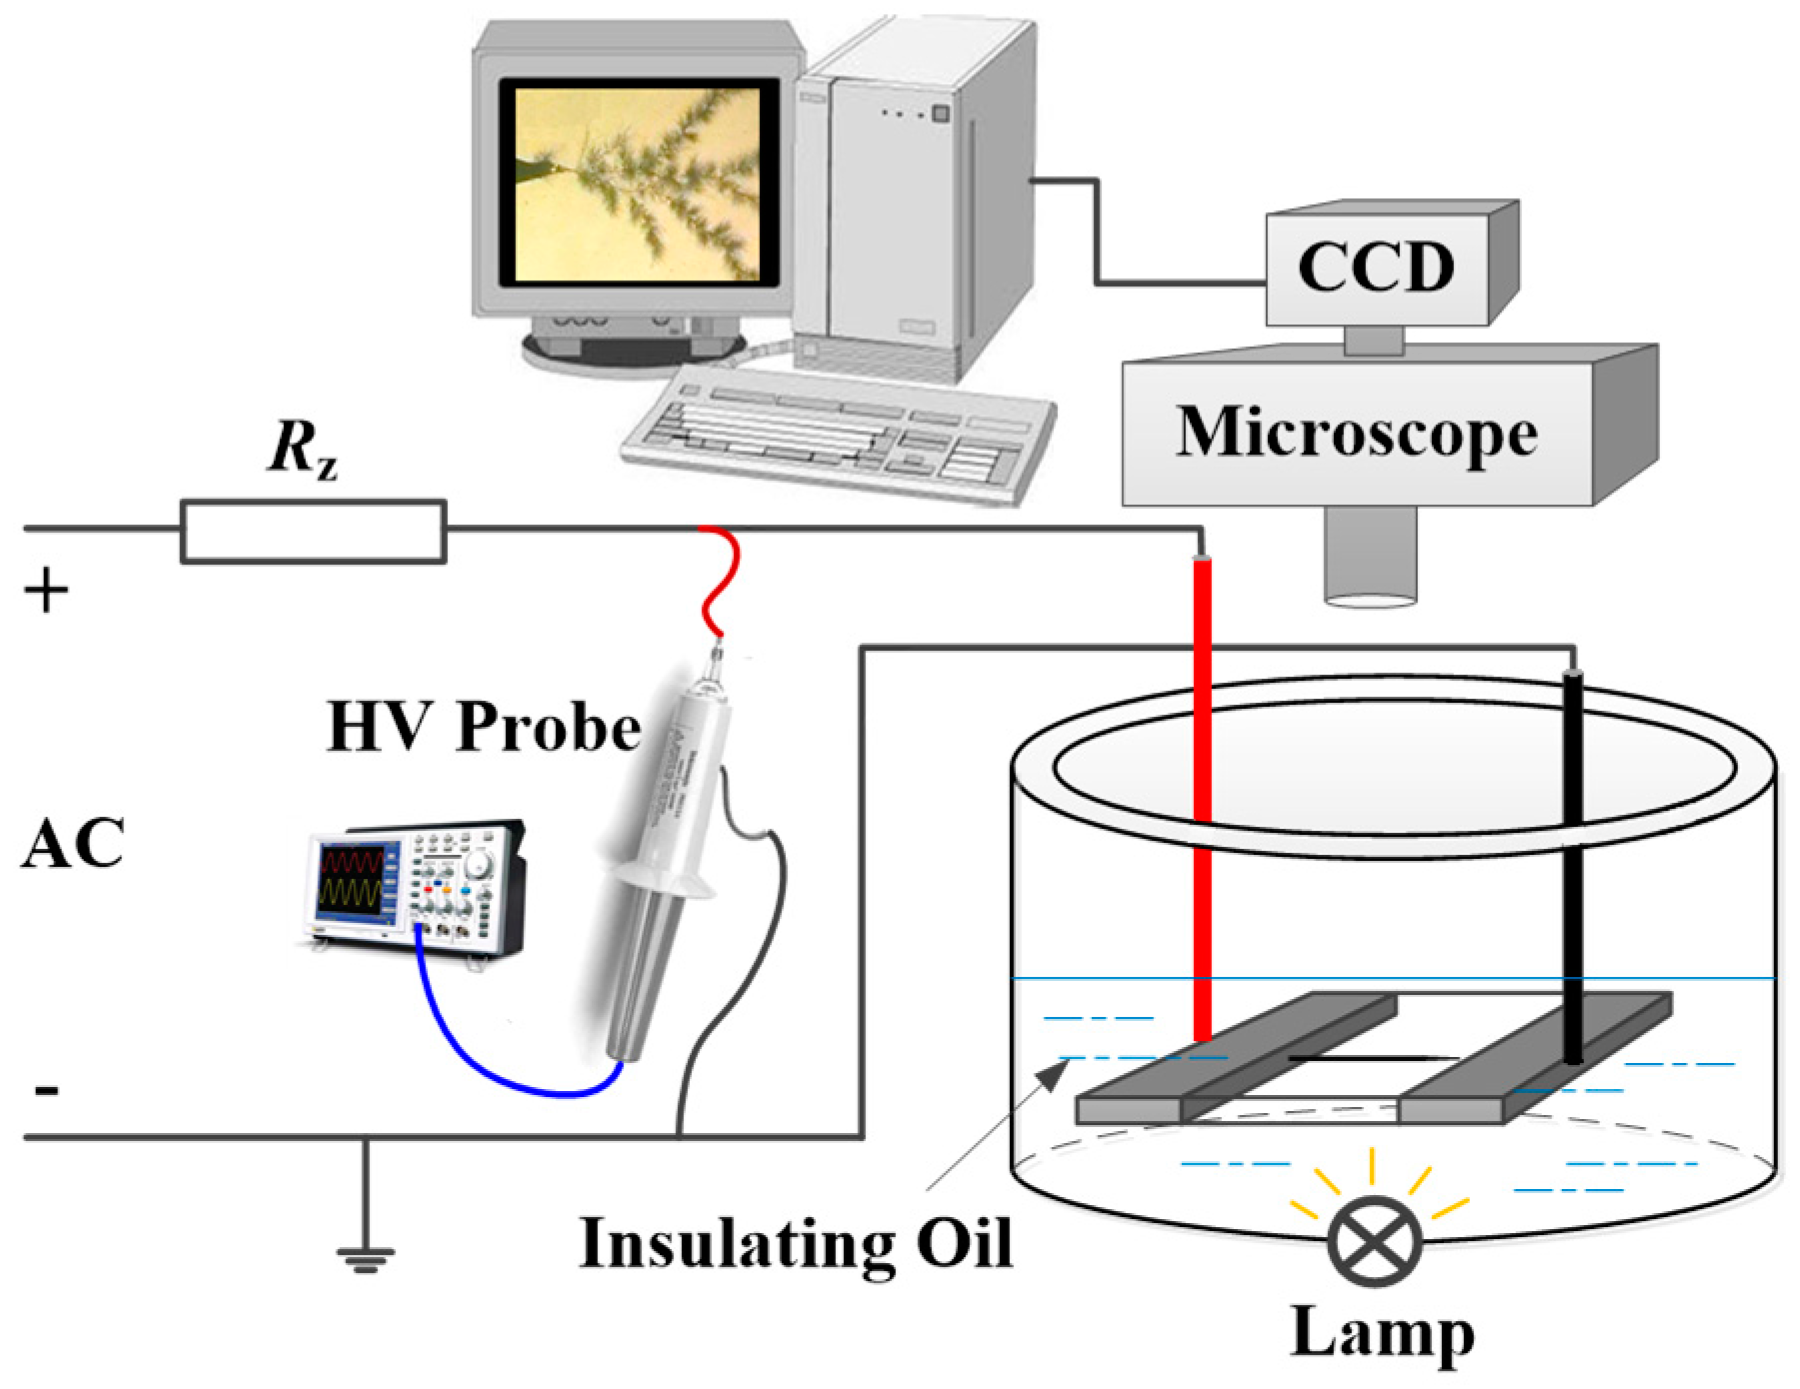
2.2. Electrical Treeing Initiation and Growing Tests

We employed conventional methods of testing the breakdown characteristics for solid materials to measure the treeing initiation voltage. The voltage was continuously increased to develop trees for samples. We used sine-wave power supplies with adjustable frequency (50 Hz–130 kHz) to meet the voltage-frequency requirements. The voltage was gradually increased with a rate of 500 V/s. The treeing initiation voltage was recorded when the tree length exceeded 10 μm. Then, the AC voltage amplitude was fixed and applied for a further 1 min at that value. Next, the image of the tree was recorded as the initiated tree shape. Each test was repeated more than 20 times under identical conditions.
To analyze the electrical treeing development and growth pattern, a constant voltage was used. We recorded videos of the growth process of electrical trees and measured the tree length simultaneously. The experimental system is shown in Figure 2. Rz is a protection resistance of 20 MΩ. The microscope, CCD camera and a computer were used to observe tree characteristics clearly. A high-voltage (HV) probe (P6015A, produced by Tektronix, Inc., Beaverton, OR, USA) was used to measure the voltage across the samples (the divider ratio is 1000:1).

2.3. Tree Initiation Probability

The two-parameter Weibull distribution could be used to detect the breakdown strength of insulating materials. Moreover, electrical treeing initiation can be seen as the result of a local breakdown in the solid. The function could be expressed as follows [14]:
F ( U , α , β ) = 1 exp { ( U α ) β }
where F(U) is the Weibull probability, U is the voltage applied to the sample, and α and β are the scale parameter and the shape parameter, respectively. α represents the voltage when the initiation probability reached to 63.2%, and β can characterize the data’s dispersion.

3. Experimental Results

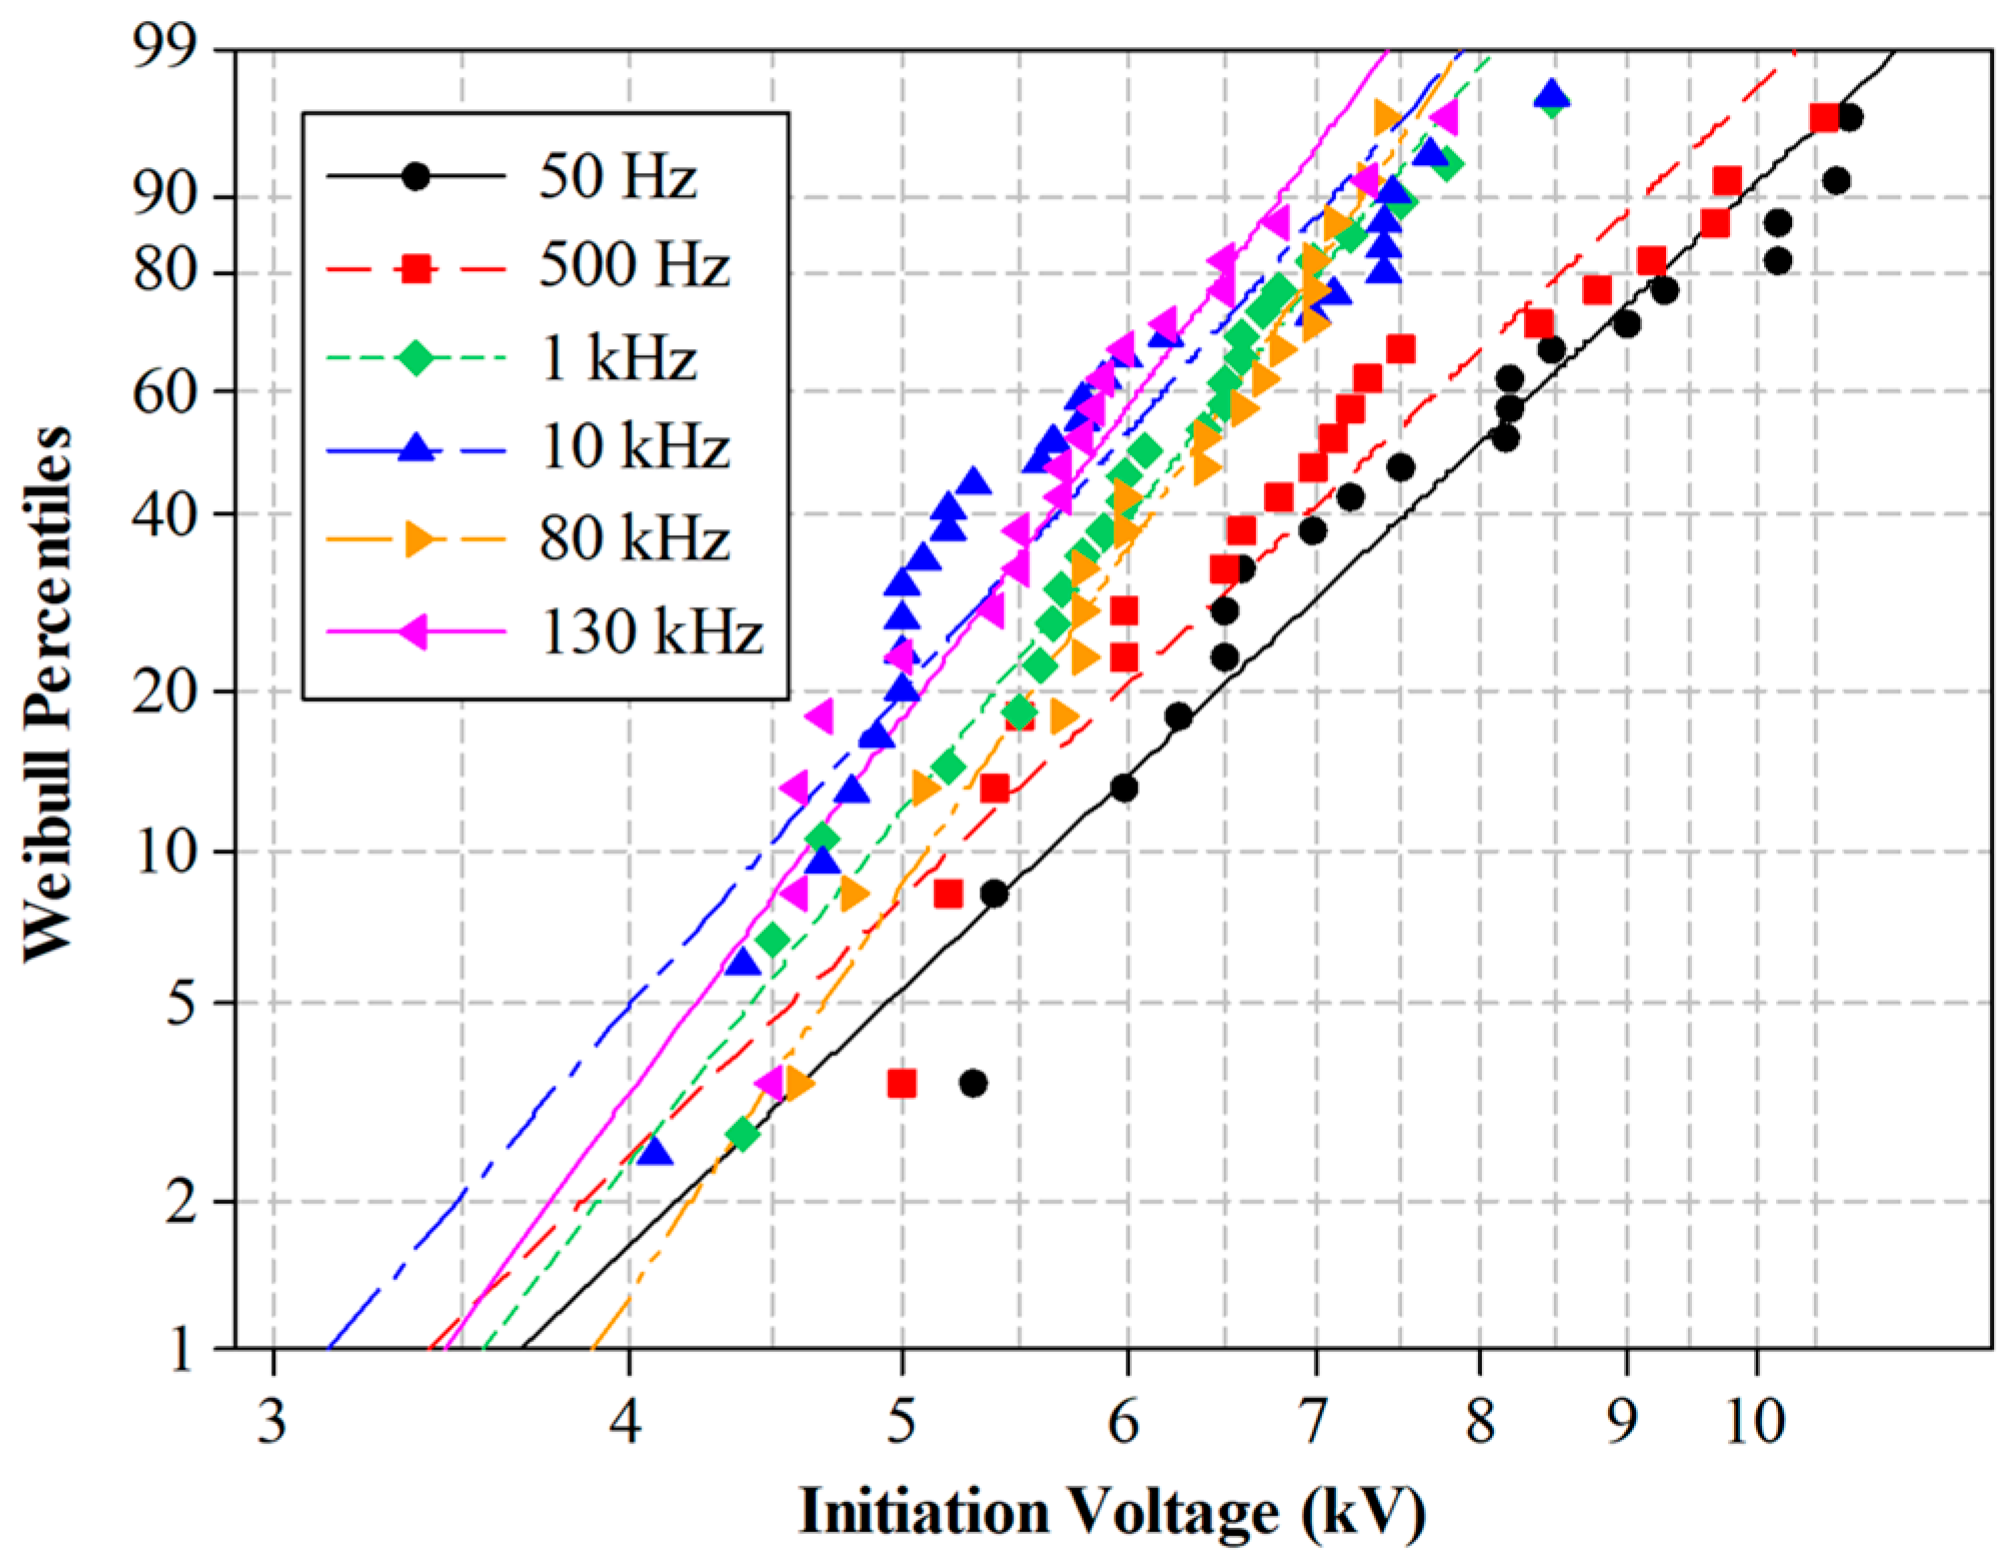
3.1. Electrical Tree Initiation Behaviors

Figure 3 shows the electrical tree initiation voltages at different voltage frequencies. It can be seen that they agree with the Weibull’s distributions well. The distribution of α and β are shown in Table 1. As mentioned above, α is the voltage with initiation probability of 63.2%, β is the parameter representing the data’s dispersion. As the voltage frequency increased from 50 Hz to 130 kHz, α decreased by 27.9% from 8.5 kV to 6.13 kV, while β had increasing trend as the voltage frequency increased. The bigger β means the smaller data deviation, thus, the deviation of electrical tree initiation voltage decreases with increasing voltage frequency. Moreover, as the voltage frequency increased from 50 Hz to 1 kHz, α decreased by 22.4% from 8.5 kV to 6.59 kV. However, there was no obvious reduction of α above 1 kHz.
Tree shapes differ from each other after they are initiated. In addition, they can be divided into four typical types in SIR, as shown in Figure 4. Figure 4a shows the branch-like trees. The tree channels were sparse and small. The pine-like trees are shown in Figure 4b, and they contained some thicker main channels. Some serried leaves were generated near the main channels, which looked like pine trees. For bush-like trees, as shown in Figure 4c, a large number of small channels gathered around the needle tip, and the trees were dense and looked like bush trees. Besides, when the applied frequency exceeded 100 kHz, a special type of bubble-shaped deterioration can be detected (shown in Figure 4d). A bubble grew within the tree channels after the tree was initiated for a few seconds.
The probabilities of different initiated tree shapes at different voltage frequencies (within 1 min) are displayed in Figure 5. As the voltage frequency increased, the tree became denser. This phenomenon could be divided into three stages. In the first stage, for voltage-frequency values ranging from 50 Hz to 500 Hz, branch-like and pine-like trees were generated, there being a greater probability of the latter. In the second stage, after a break point of 1 kHz, bush-like trees were generated, and within voltage frequencies from 1 kHz to 10 kHz, their probabilities remained constant. It should be noted that this break point (1 kHz) is consistent with the initiation voltage behaviors discussed above. In the third stage, when the voltage frequency is higher than 10 kHz, all of the initiated trees became bush-like trees. In particular, when the voltage frequency exceeded 100 kHz, bubble-shaped deterioration was observed.

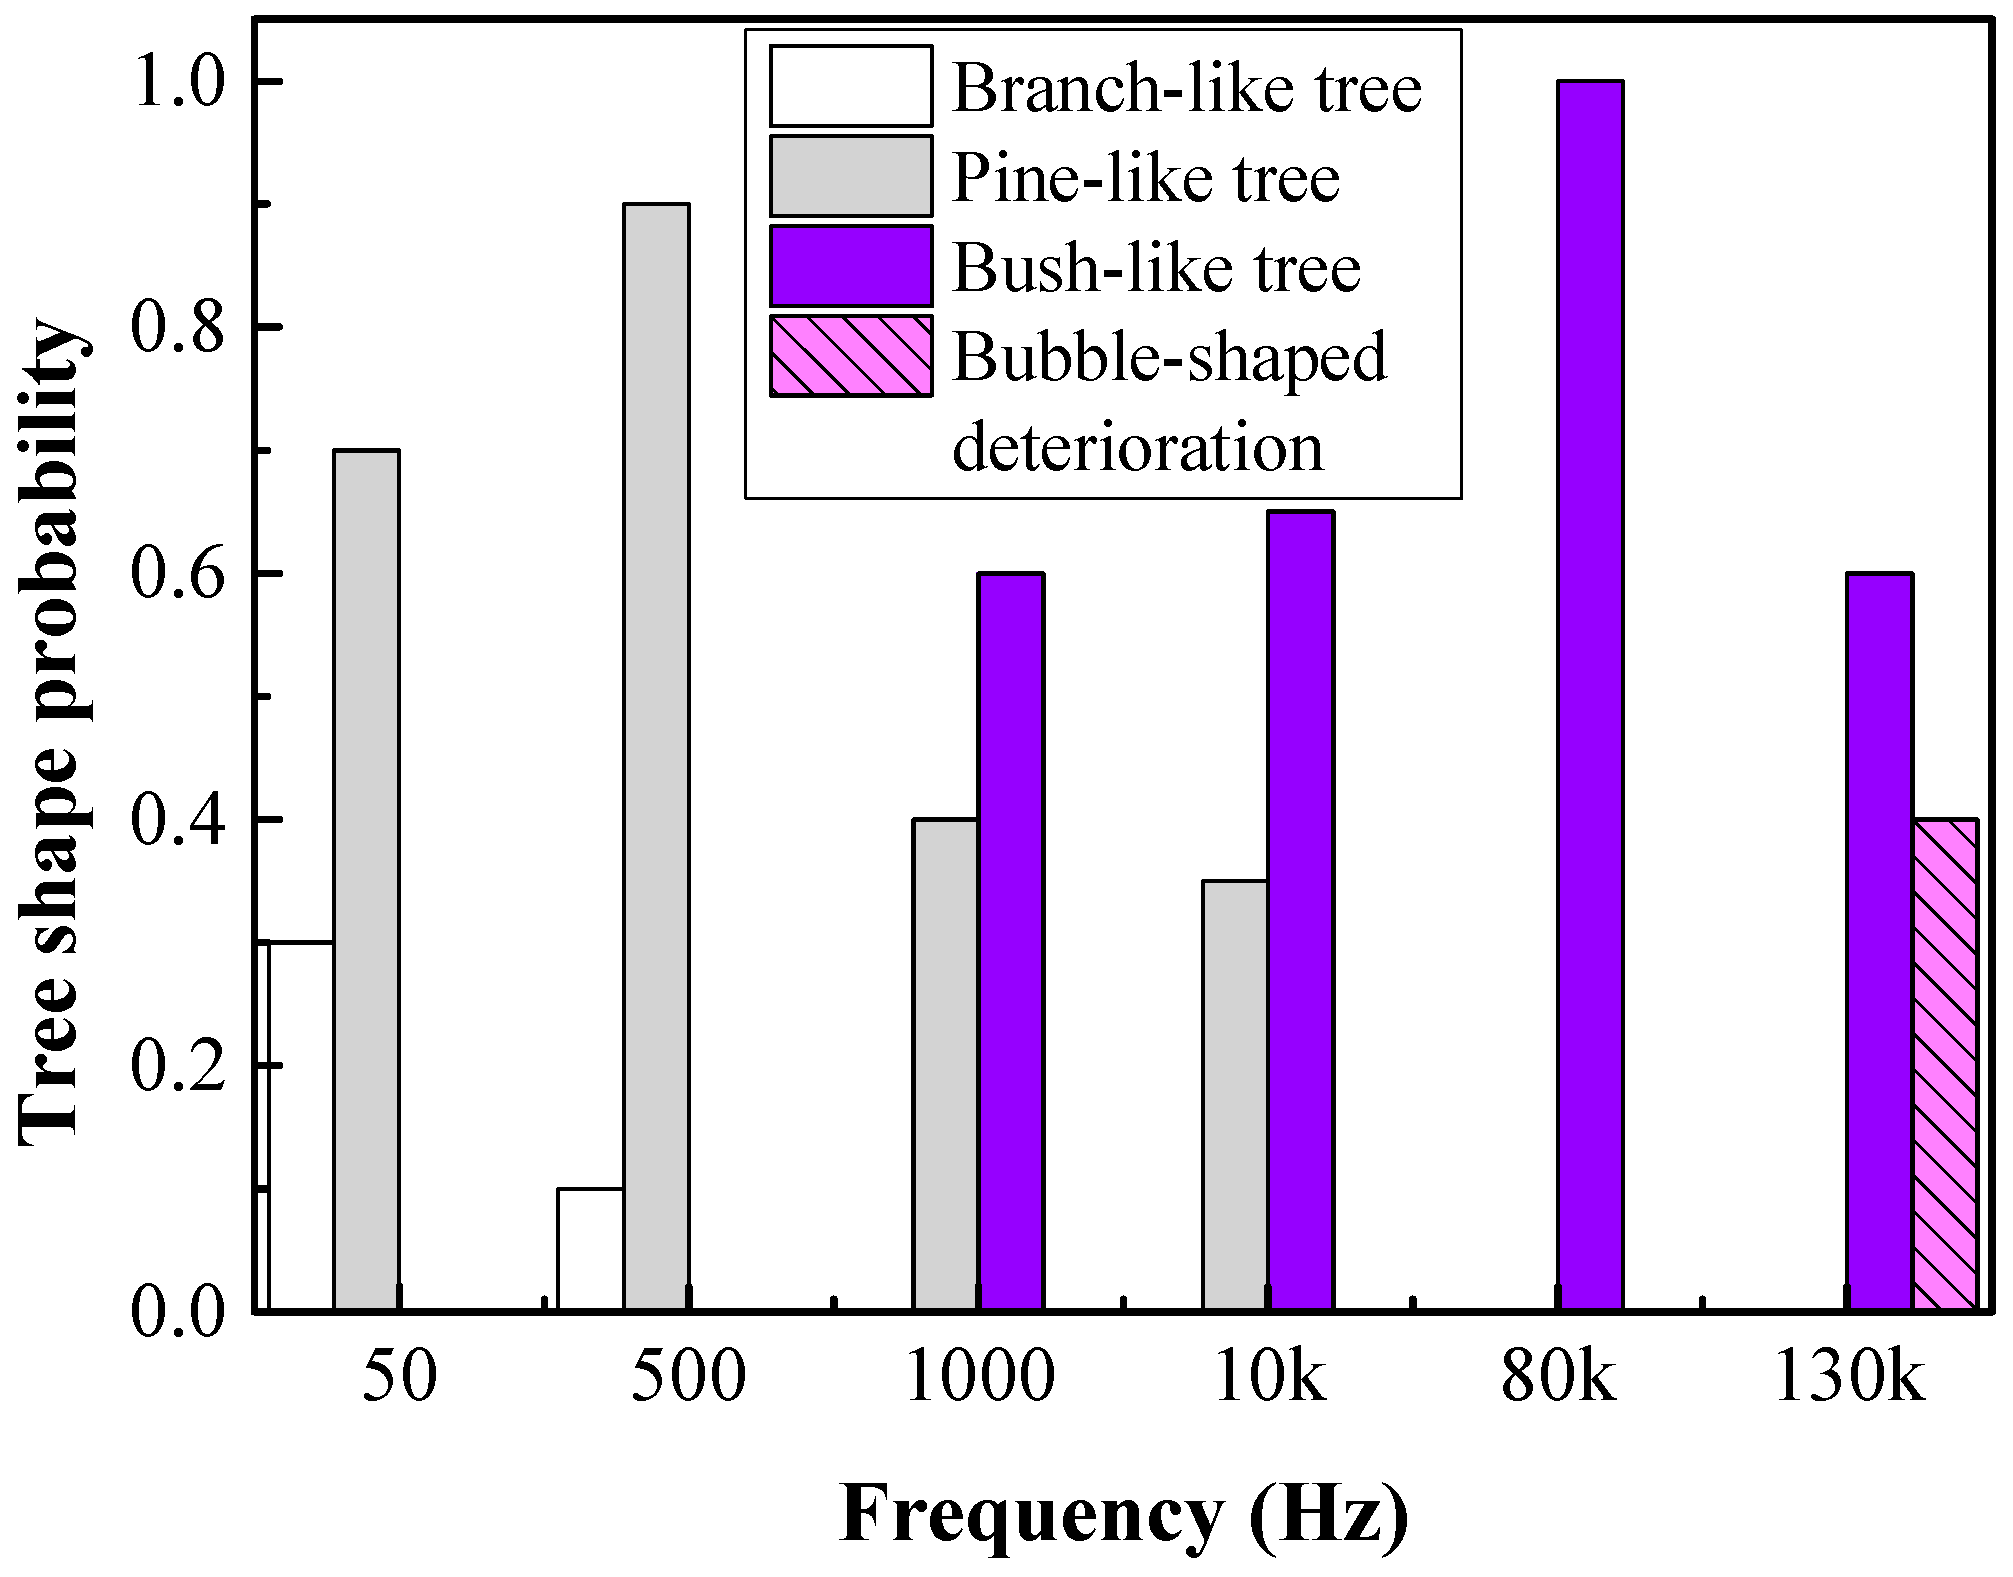
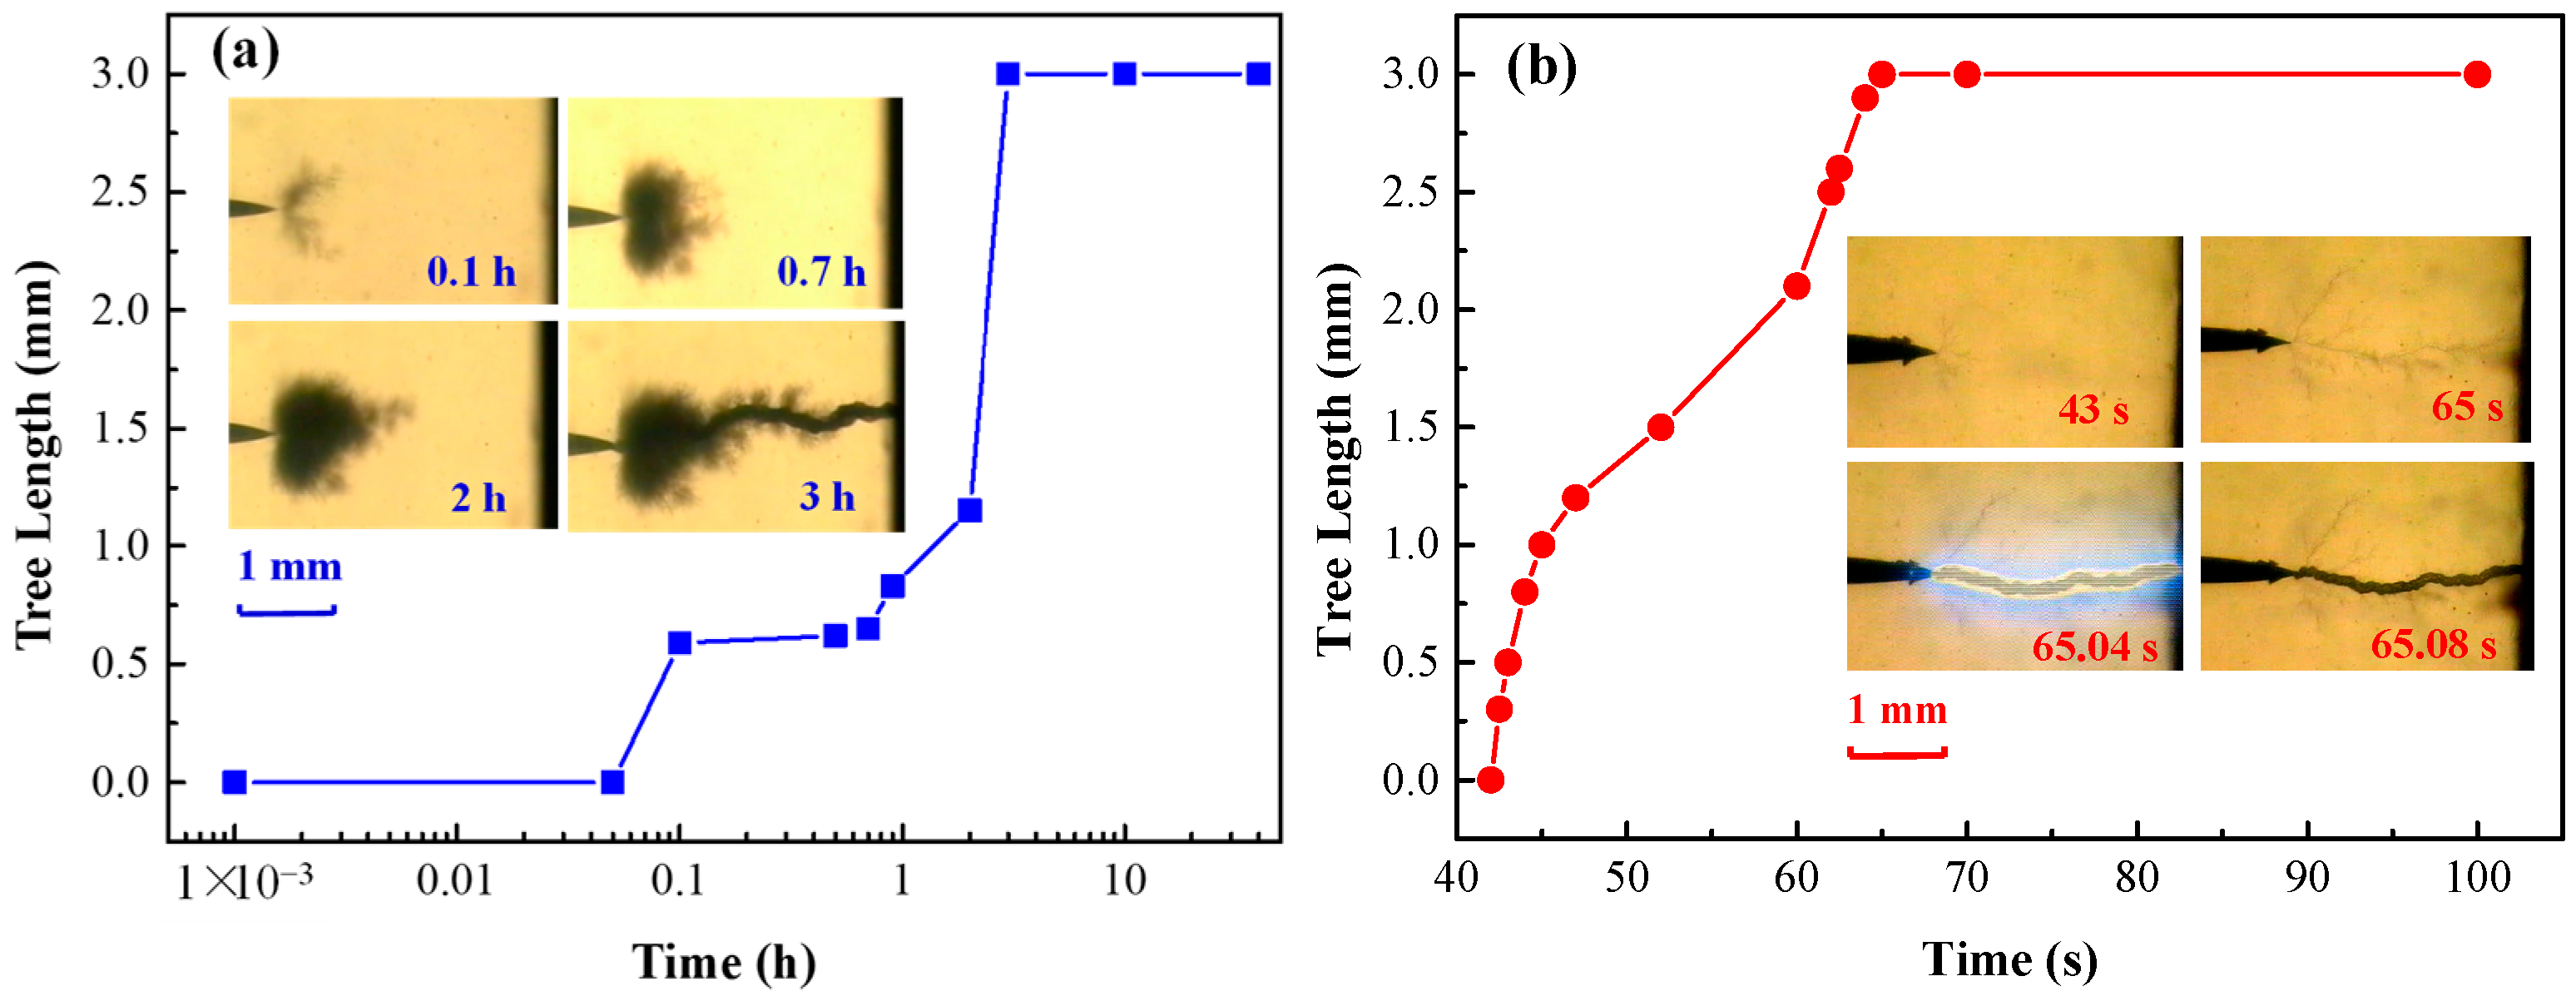
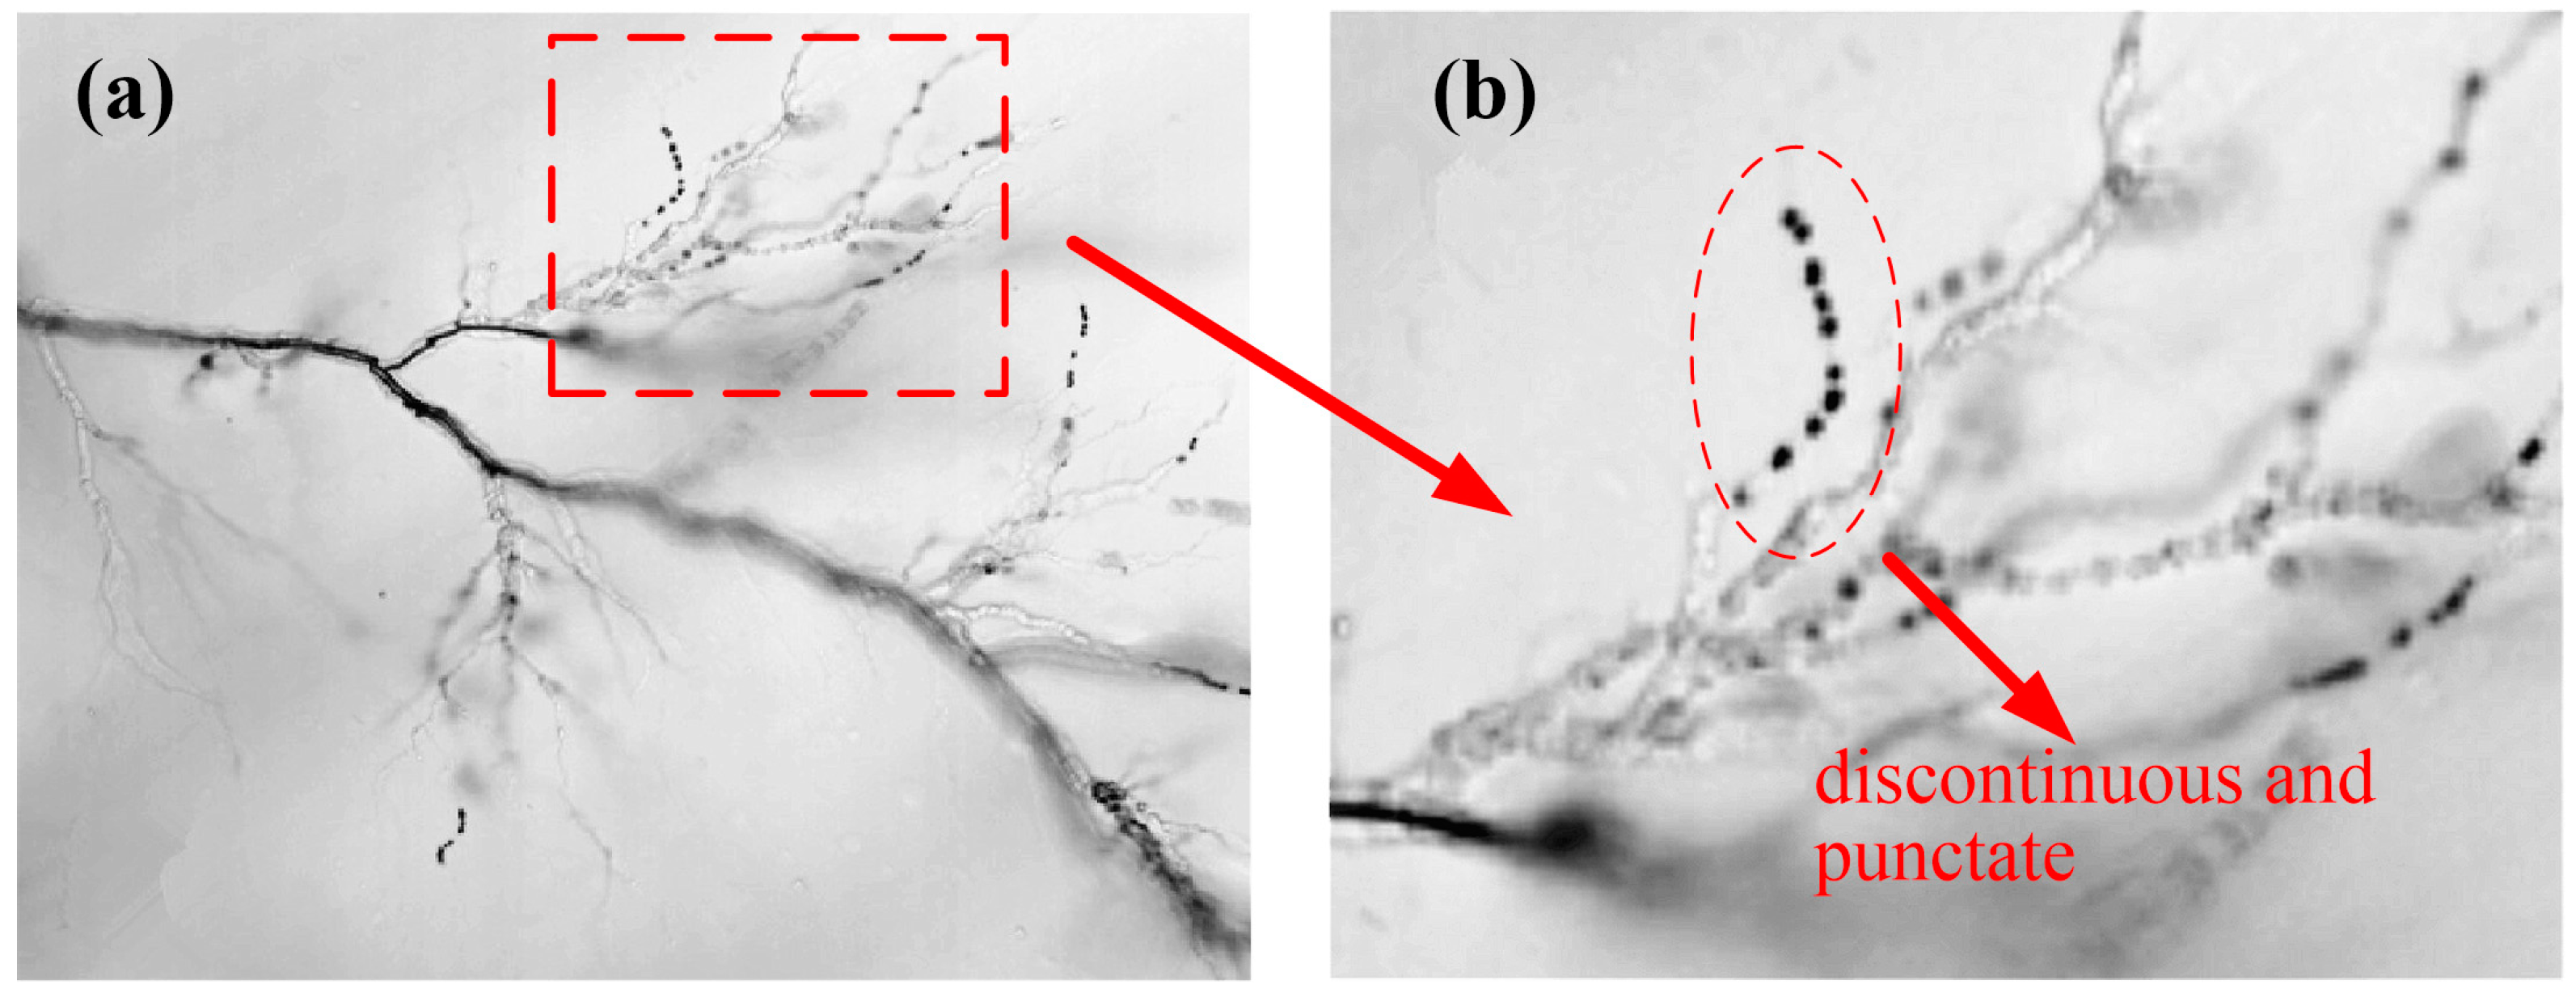
3.2. Electrical Treeing Pattern

Electrical trees grow larger over time, eventually causing breakdown. As mentioned above, below 100 kHz, there are three main types of tree shapes. In long-term aging tests, the tree shape changes with time under different conditions [23]. We roughly divided the treeing pattern below 100 kHz into the following two modes: bush-like treeing and pine-like treeing. When the voltage frequency exceeded 100 kHz, different breakdown phenomena were observed accompanied by bubble growth, which was similar to that in liquid [24]. For the analysis, we chose the typical growth pattern at 50 Hz and the bubble growth pattern at 130 kHz (as discussed in Section 3.3).
Figure 6a shows a typical bush-like treeing pattern at 50 Hz and the corresponding growing length. When a tree was initiated after the application of a voltage for 3 min, bush-like electrical trees were formed. When the total time was 0.1 h, trees stopped growing and the tree lengths remained stable between 0.1 h to 0.9 h. After that, large new channels formed in front of bush-like trees, and trees grew rapidly until they broke down. The total time from tree initiation to its breakdown was about 3 h. Figure 6b illustrates a typical pine-like treeing pattern at 50 Hz and the corresponding growing length. Pine-like trees were generated under a higher excited voltage, and the speed of growth was faster. The pine-like trees developed rapidly until they were punctured, and the whole process took less than 1 min.
Table 2 shows the probability of occurrence of different types of trees, as well as the corresponding average durations that were calculated when 10 kV AC voltage of 50 Hz was applied to the samples. Under this condition, the probability of pine-like treeing was higher than that of bush-like treeing. Pine-like trees developed rapidly, and the average breakdown duration was 4.98 min. However, the duration from the development of bush-like trees to breakdown was 90 min, which was much longer than that of pine-like treeing breakdown.

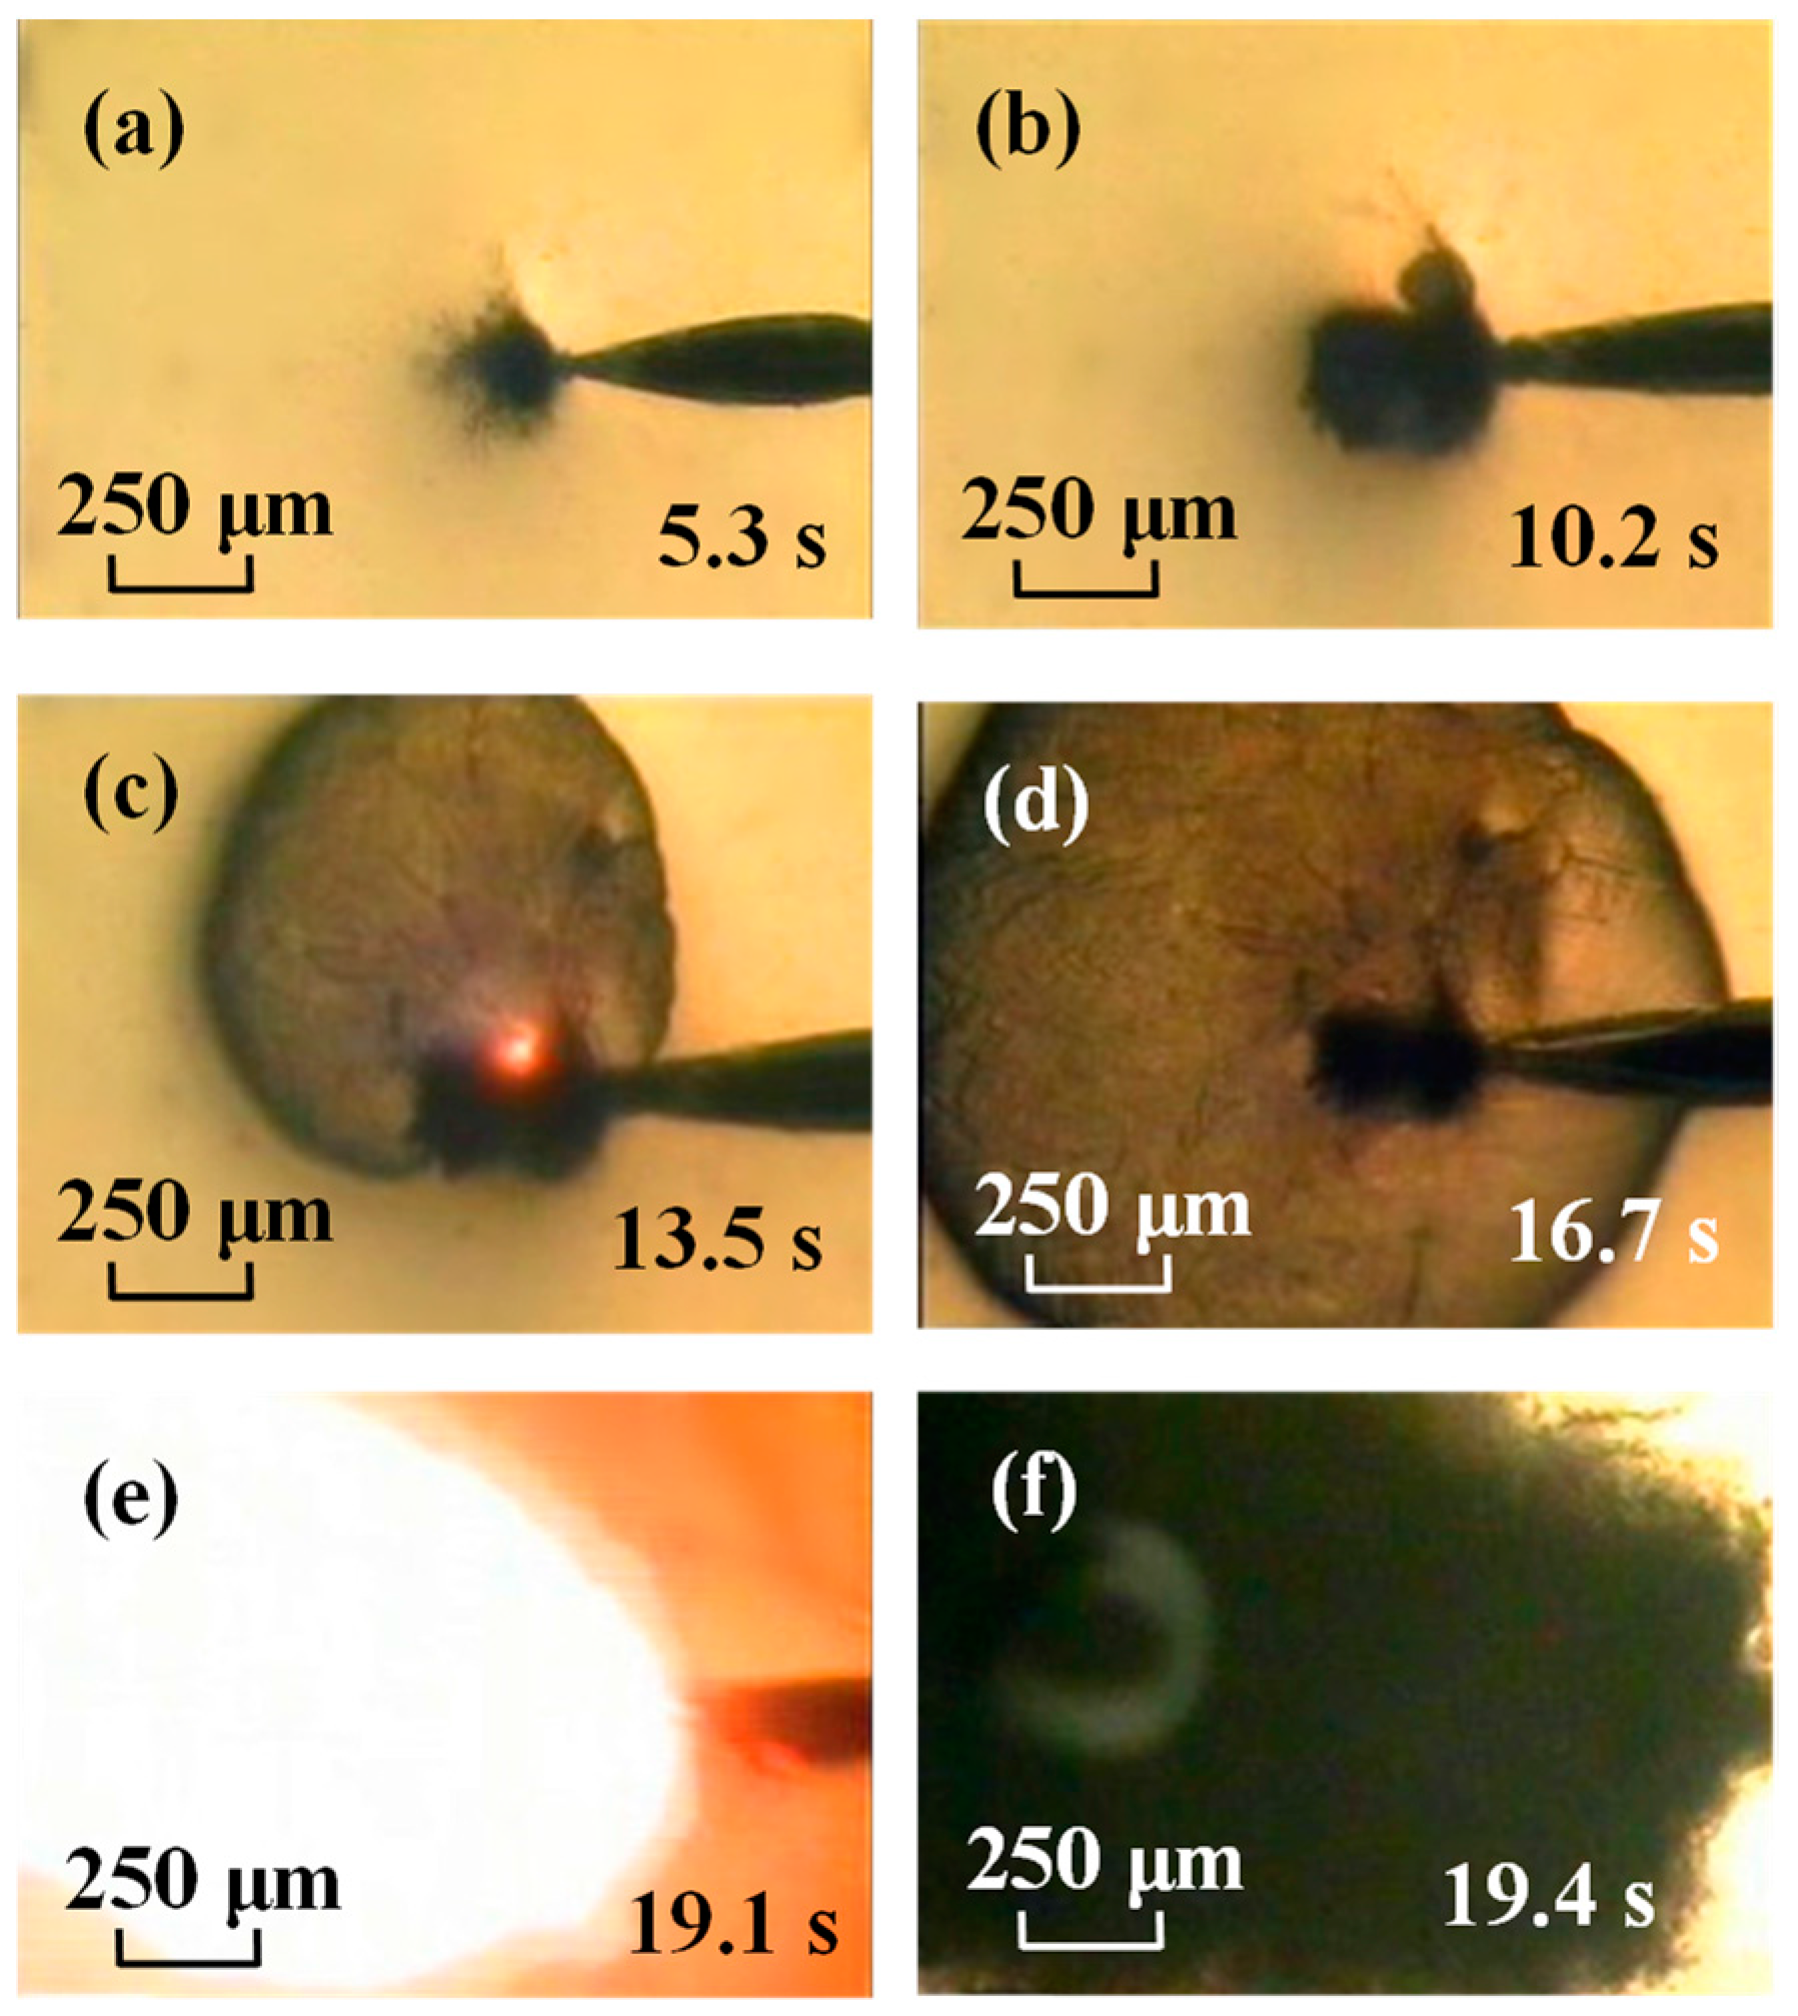
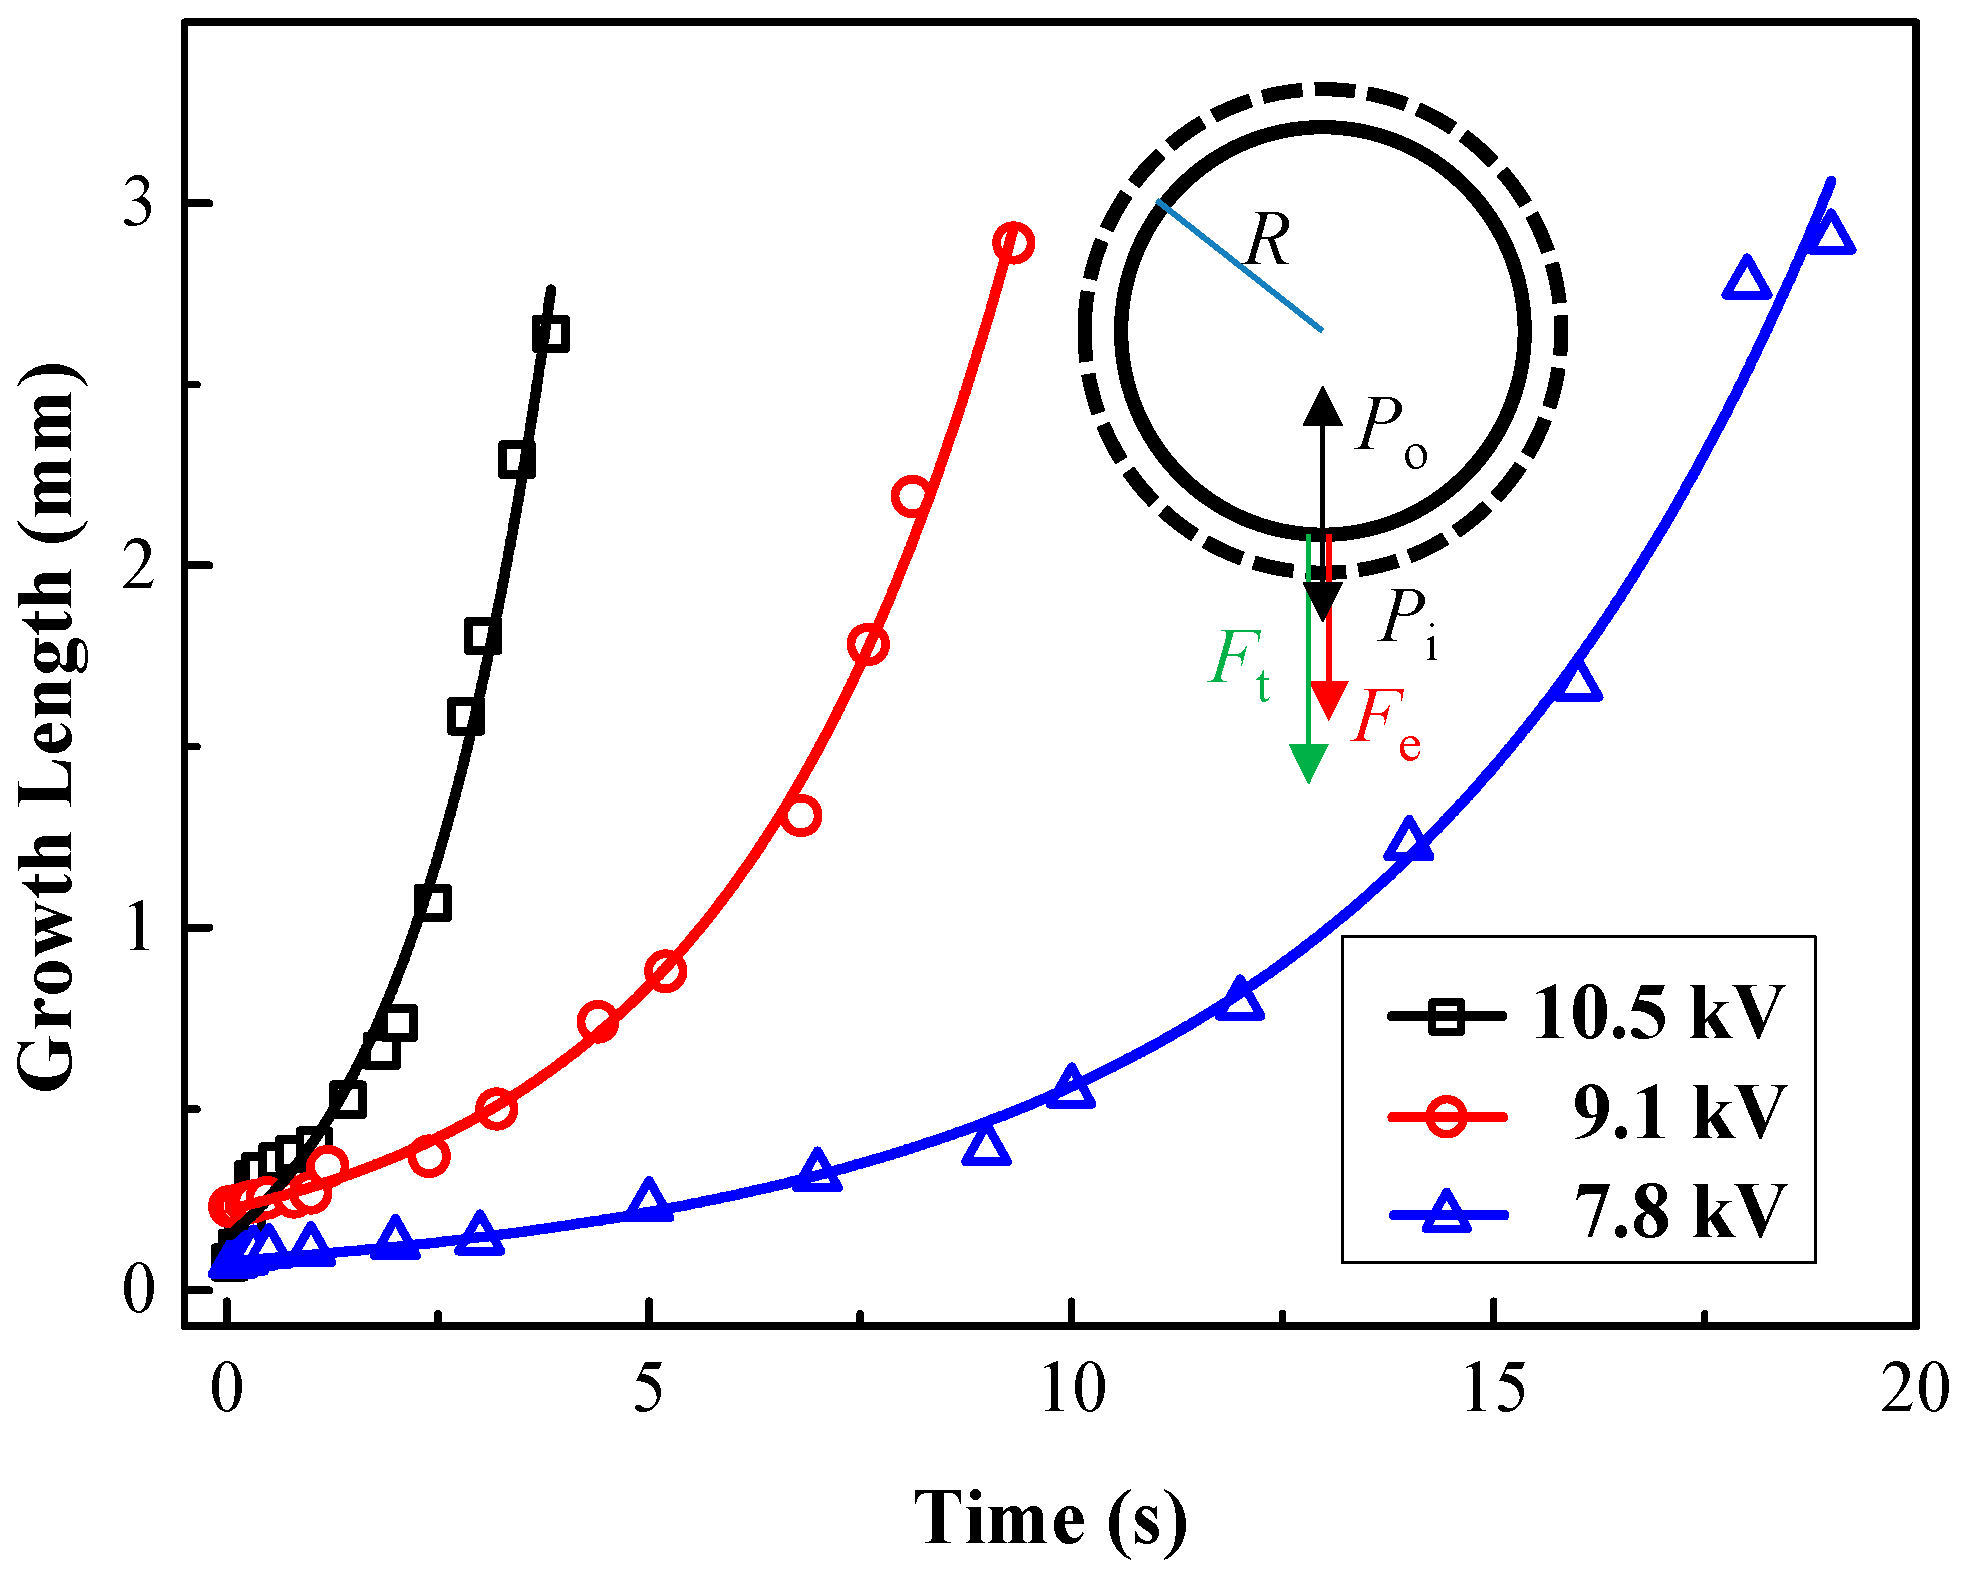
3.3. Bubble Growth at 130 kHz

Figure 7 describes the entire bubble-breakdown phenomenon at 130 kHz, which involved the following three stages: tree-growth stage, bubble-expansion stage, and breakdown stage. In the tree-growth stage, after the tree was initiated, there was a violent discharge inside the channel, which caused serious erosion in the SIR material, and led to the expansion and growth of the tree channel in SIR elastomers (Figure 7a). During the bubble-expansion stage, a bubble was created inside the tree channel (Figure 7b), and over time, the bubble began to swell rapidly with the high levels of visible partial discharge, remaining roughly spherical as it got larger (Figure 7c,d). When the bubble developed on the opposite grounding electrode, there was a strong primary discharge inside the bubble, and it eventually punctured the sample (Figure 7e). When the sample broke down, a large hole appeared in the breakdown part, and it was completely carbonized (Figure 7f).
Figure 8 shows the increases in the radii of the bubbles (R) upon the application of AC voltages with different magnitudes. As time increased, R increased exponentially. As the voltage increased, the growth rate also increased. The time from tree initiation to breakdown is within several seconds: about 3.84 s at 10.5 kV, 9.32 s at 9.1 kV, and 19.1 s at 7.8 kV (for all cases, the applied voltage frequency was 130 kHz).
Because the bubble expanded spherically after the trees were initiated, we could roughly establish the bubble-growth dynamics by analyzing the force. Assuming that the bubble remains spherical during the growth process, R can be determined by the following equation:
R ( θ , t ) = R 0 + Δ ( θ , t )
where R0 is the initial bubble radius, Δ is the function of the incremental radius, t is the growth time, and θ is the polar angle. According to Newton’s Second Law, the bubble’s equation of motion is given as follows (shown in Figure 8): [24]
m 2 R t 2 = F t + F e + P i P o
where m is the surface mass density, Ft is the surface tension [24], Fe is the electrical stress [25], Pi is the internal pressure of a bubble, and Po is the external pressure of a bubble [26].
According to the calculation methods cited in [24], the growing R along the direction from the needle tip to the plate follows the following equation:
R ( θ 0 , t ) = R 0 + K · e λ t
where K is a constant that corresponds to θ0. [24] If λ is positive, R will increase exponentially with time. We developed the exponential fitting for the growing length of bubbles in Figure 8 and found that they were well fitted. The results demonstrate that λ would be positive when a 130-kHz AC voltage is applied in our experimental conditions, and the bubbles grew exponentially in our samples.

4. Discussion

4.1. Effects of Voltage Frequency on Electrical Tree Initiation

It is believed that electrons play a vital role in the electrical treeing initiation mechanism for polymers under AC voltages [4,11,23]. When in the negative half cycle, electrons drift into the insulating materials. When the voltage is in the positive half cycle, most of electrons are extracted to the positive electrode, however, some of them have not been captured [27]. Those electrons are accelerated under the high electric field, and accumulate enough energy to penetrate the SIR material, causing the molecular chain to break. At the same time, under an AC voltage excitation, electrons and holes are injected from the electrodes in the opposite half cycles. The injected carriers fall into the trap immediately or recombine with the opposite charges, and energy released by the composite is partially converted into the energy for fracturing polymer chains. Polymer molecular chains are cut off, forming free radicals and leading to a chain reaction (following the reaction function shown in Figure 9). Then, low molecular chains and micro voids are produced, initiating the electrical trees.
To consider the treeing initiation characteristics, Tanaka and Greenwood proposed a mathematical model to relate the initiation time (tI) and the applied voltage (V) [28]. Considering the effect of the voltage frequency (f), the equation can be written as follows [29]:
f t I ( G n G th ) = C t
where Gn is the energy available from the displacement of the electrons under electric field, Gth is the threshold value to damage the insulation dielectric, and Ct is the energy that expects to be the intrinsic property of a material and is related to the tensile strength [29]. Gn and Gth can be expressed as follows:
G n = Aexp   ( B   Φ 3 / 2 V 1 ) G th = Aexp   ( B   Φ 3 / 2 V o 1 )
where A and B are constants and Φ is the effective work function. The critical value stated above is V0.
Based on the initiation method employed in our experiments, because the voltage on a tree-initiating ramp is proportional to the time, V and tI satisfy the following equation:
V = r t I
where r is the voltage-ramping rate (500 V/s in our experiments). Combined with Equations (6) and (7), the relationship between V and f satisfies the following equation:
V [ Aexp   ( B   Φ 3 / 2 V 1 ) G th ] = r C t f
Because the value of the left side in Equation (8) decreases monotonically as V decreases, and the value of the right side decreases with increasing f, it can be expected that the treeing initiation voltage would decrease with increasing voltage frequency, as observed for the SIR samples in our experiments. With respect to the tree shape after it was initiated, with increasing voltage frequency, the electrical-mechanical stresses applied around the tip becomes more frequent [12,13]. During a unit time, the number of loading flows injected into the SIR increases gradually; the number of discharged branches also increased [12]. Both of them cause the initiation of denser electrical trees with increasing voltage frequency. The mechanisms responsible for bubble-shaped deterioration are discussed in the next section.

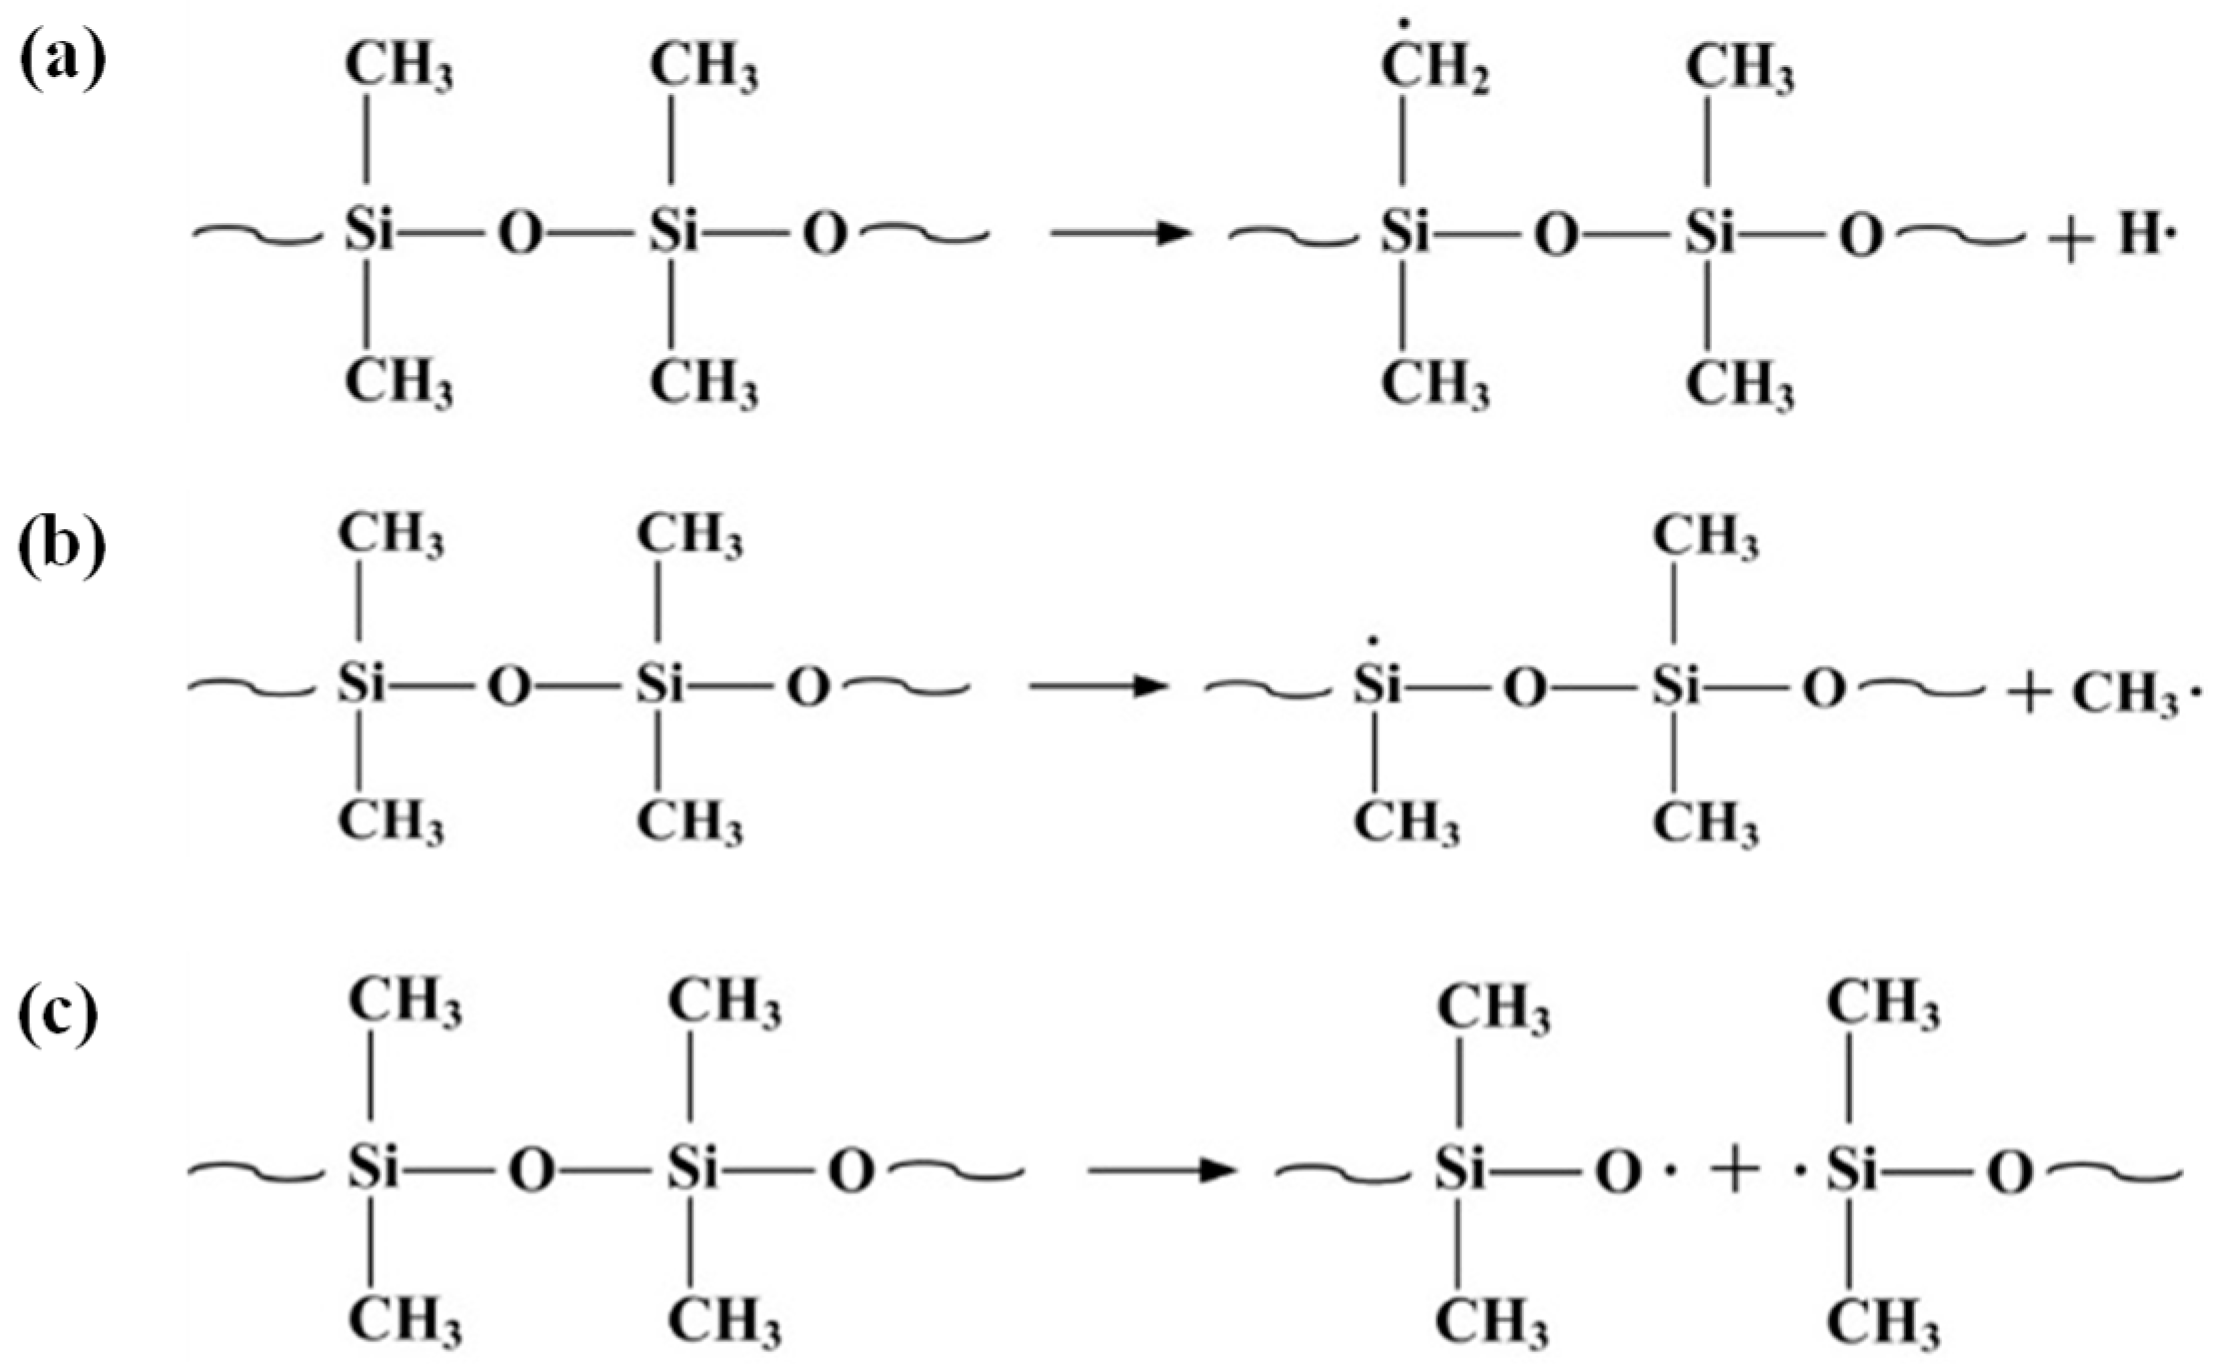
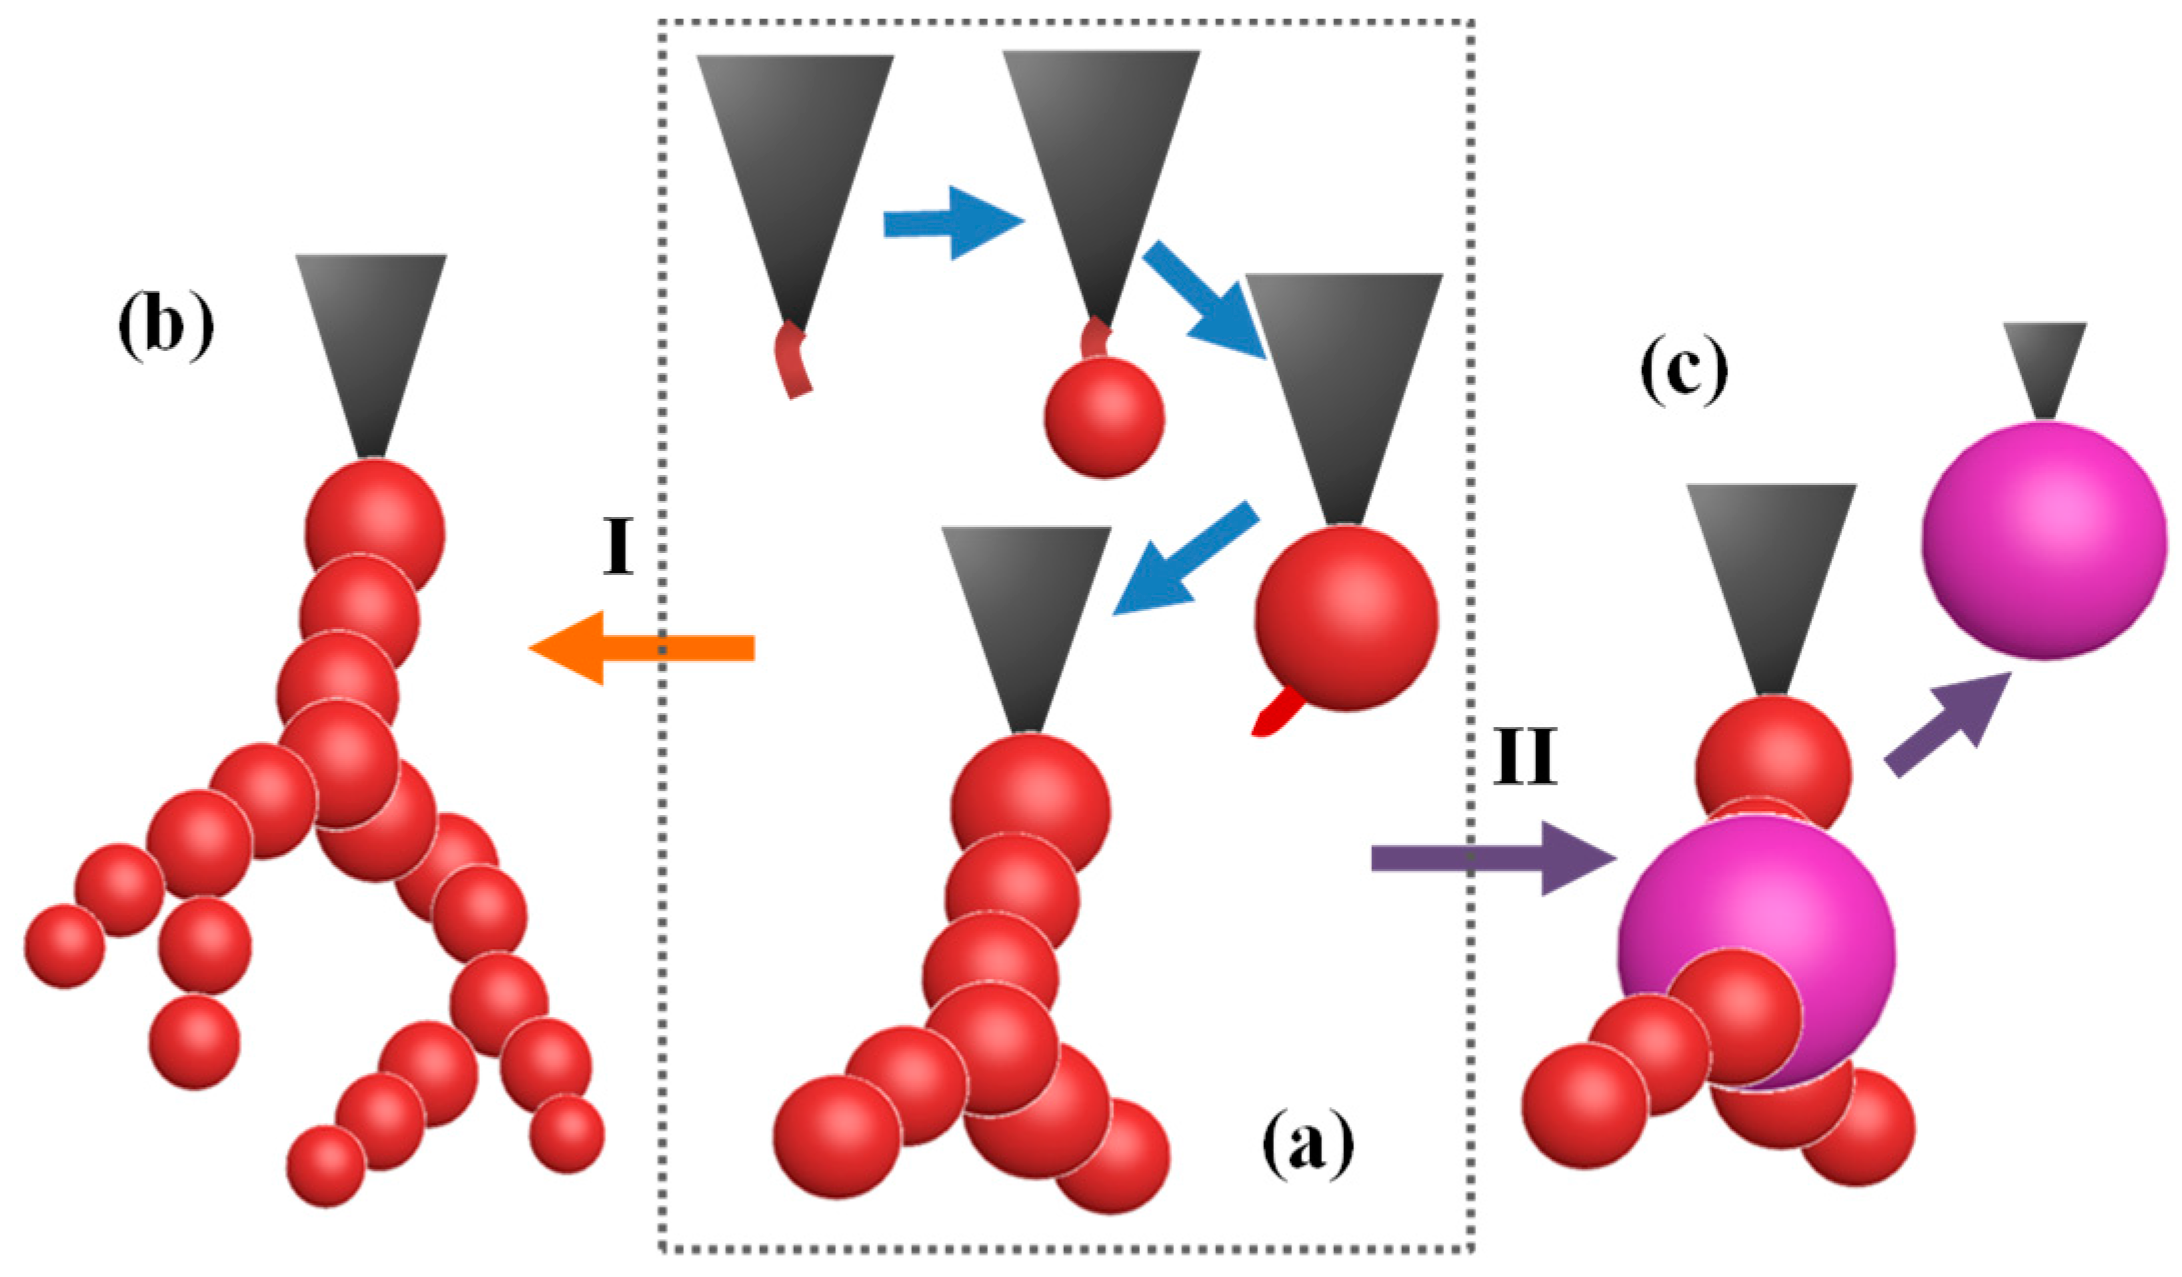
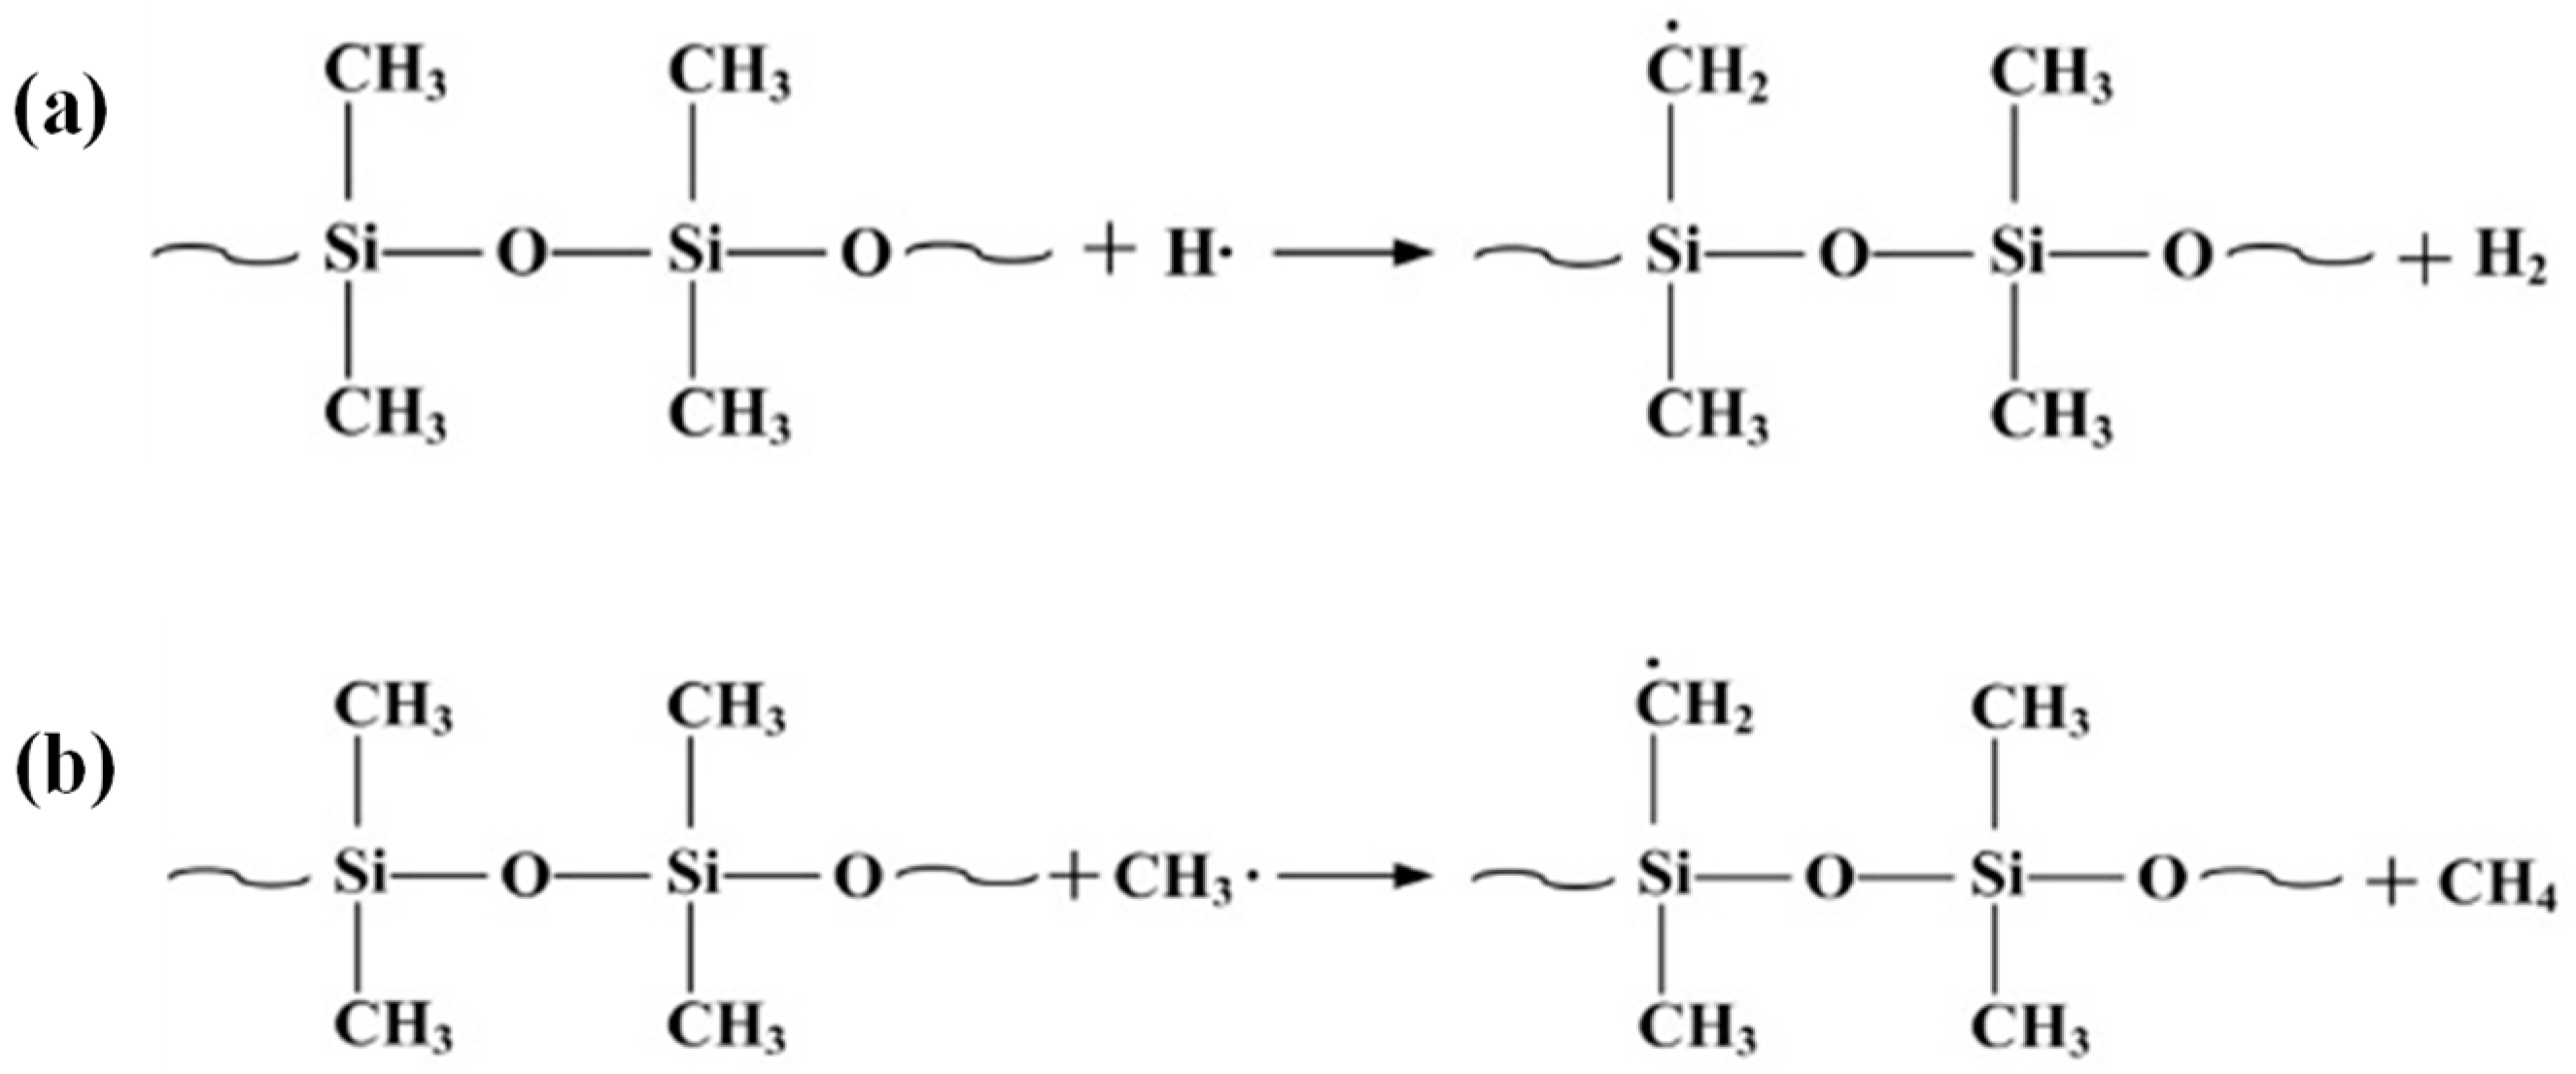
4.2. Potential Growth Model for Electrical Tree in SIR

In order to determine the growth mechanisms of electrical treeing in SIR, tree channels at 50 Hz were pictured under transmission light with high-resolution and high-magnification observing conditions (shown in Figure 10). We found that electrical tree channels in SIR were spherical and punctate. Combined with the spherical bubble growing at high frequencies, it is reasonable to deduce that the growth of electrical trees in SIR is closely related to the expansion of bubble cavities in the tree channel. This is consistent with our previous study [7], where we briefly discussed the growth patterns of trees at 50 Hz. Moreover, the bubble cavities were observed in silicone gels as well [30,31,32]. It is found that the form of electrical tree is strongly related to the mechanical strength of the silicone gels [30]. The bubble cavities would be less visible as the mechanical strength gets larger. As for the SIR we used in our tests, the elastic shear modulus is around 1~3 MPa which is larger than that in silicone gels (The maximum is 1.5 × 10⁵ Pa [30]). Although no bubble cavities were detected under the tree observing system in our tests (shown in Figure 2) when applied by 50-Hz AC voltage, the small punctate cavities could still be observed when the tree channels were exposed under higher-magnification conditions (shown in Figure 10).
In this section, thus, we propose a possible growth model in SIR for electrical trees considering different frequencies. Figure 11 shows the growth process of schematic trees in SIR. Partial discharge (PD) is a major contributing factor, which results in electrical tree growth after inception [33]. PD inside the channels generates high-energy charges that hit the SIR network. According to the calculation and analysis of energies needed to form free radicals in SIR materials [34], gases such as hydrogen and methane could be produced more easily in SIR materials using energetic particles (shown in Figure 12).
The tree growth mechanisms at a frequency of 50 Hz have been discussed in our previous studies [7], and the specific growth pattern is summarized as follows: pressure increases as the gases accumulate in the tree channels, causing the spherical hollow cavity to expand in SIR. In the case of samples to which an AC voltage is applied with lower frequencies, Ft, Fe, Pi, and Po (given in Equation (3)) will be in equilibrium when the cavity expands to a certain size. The bubble cavity stops growing until another small branch incepts from its weak place under the action of a space charge and electric field (shown in Figure 11a) [35]. Then, the previously mentioned procedures will be repeated, and the bubble cavity will be generated one-by-one, eventually forming the electrical trees (shown in Figure 11b).
Under the action of a high-frequency voltage, electron injection and extraction are more frequent, and the PD energy generated also increases. According to the bubble-shaped deterioration that occurred at 130 kHz, a possible mechanism responsible for bubble growth can be explained as follows: when samples are applied at a specific high voltage frequency (e.g., 130 kHz), after trees are initiated, the PD energy in the channel is so high that a large number of gases will be generated. The sum of the electric-field force and gas-pressure force is much larger than the elasticity force, causing the punctate cavity to expand continuously and form the bubble that we observed under a microscope. The bubble grows exponentially, finally leading to breakdown within a few seconds. The whole process is displayed in Figure 11c. It can be deduced that under a high-frequency voltage in SIR, once discharges are generated and bubbles are produced, test samples are soon punctured.

5. Conclusions

In this study, we investigated the electrical treeing initiation and breakdown characteristics in SIR at various frequencies. The electrical treeing initiation voltage of SIR decreased with increasing frequency. α decreased to 6.13 kV at 130 kHz, which is 27.9% lower than that at 50 Hz (8.50 kV). The density of the initiated electrical trees was greater with higher frequencies. When the frequency exceeded 10 kHz, all of the trees turned into bush-like ones. More specifically, when the frequency exceeded 100 kHz, there was bubble-shaped deterioration.
Both bush-like treeing and pine-like treeing patterns exist simultaneously at lower frequencies. Pine-like trees grew rapidly to breakdown, while bush-like treeing breakdown may have a longer latency. Moreover, bubble-growing characteristics at 130 kHz were analyzed. The bubbles grew exponentially, eventually leading to breakdown within a few seconds. It should be noted that electrical tree channels comprised spherical and hollow cavities. Combined with the bubble characteristics at high frequencies, a possible growth model was proposed for electrical trees in SIR considering different frequencies. This model may provide a reasonable explanation to the different growth phenomena at various frequencies.

Acknowledgments

The authors are grateful to the Special Fund of the National Priority Basic Research of China under Grant 2014CB239501, the National Natural Science Foundation of China (NSFC 51377089), and the fund given by State Key Laboratory of Electrical Insulation and Power Equipment (EIPE16208).

Author Contributions

Yunxiao Zhang and Yuanxiang Zhou conceived and designed the experiments; Qiong Nie performed the experiments; Ling Zhang and Zhongliu Zhou analyzed the data; Yunxiao Zhang wrote the paper.

Conflicts of Interest

The authors declare no conflict of interest.

References

  1. Jang, D.; Park, S. Evaluation of electrical tree degradation in cross-linked polyethylene cable using weibull process of propagation time. Energies 2017, 10, 1789. [Google Scholar] [CrossRef]
  2. Vaughan, A.S.; Hosier, I.L.; Dodd, S.J.; Sutton, S.J. On the structure and chemistry of electrical trees in polyethylene. J. Phys. D Appl. Phys. 2006, 39, 962–978. [Google Scholar] [CrossRef]
  3. Dissado, L.A. Understanding electrical trees in solids from experiment to theory. IEEE Trans. Dielectr. Electr. Insul. 2002, 9, 483–497. [Google Scholar] [CrossRef]
  4. Shimizu, N.; Laurent, C. Electrical tree initiation. IEEE Trans. Dielectr. Electr. Insul. 1998, 5, 651–659. [Google Scholar] [CrossRef]
  5. Du, B.X.; Xue, J.S.; Su, J.G.; Han, T. Effects of ambient temperature on electrical tree in epoxy resin under repetitive pulse voltage. IEEE Trans. Dielectr. Electr. Insul. 2017, 24, 1527–1536. [Google Scholar] [CrossRef]
  6. Dodd, S.J. A deterministic model for the growth of non-conducting electrical tree structures. J. Phys. D Appl. Phys. 2002, 36, 129–141. [Google Scholar] [CrossRef]
  7. Zhang, Y.X.; Zhou, Y.X.; Liu, R.; Zhang, X.; Wang, M.Y.; Zhang, L. Three-dimensional morphology and spherical growth mechanisms of electrical trees in silicone rubber. J. Electrost. 2015, 76, 83–88. [Google Scholar] [CrossRef]
  8. Iddrissu, I.; Zheng, H.L.; Rowland, S.M. DC electrical tree growth in epoxy resin and the influence of the size of inceptive AC trees. IEEE Trans. Dielectr. Electr. Insul. 2017, 24, 1965–1972. [Google Scholar] [CrossRef]
  9. Chalashkanov, N.M.; Dodd, S.J.; Dissado, L.A.; Fothergill, J.C. The role of bulk charge transport processes in electrical tree formation and breakdown mechanisms in epoxy resins. IEEE Trans. Dielectr. Electr. Insul. 2016, 23, 3256–3266. [Google Scholar] [CrossRef]
  10. Chen, X.R.; Xu, Y.; Cao, X.L.; Gubanski, S.M. Electrical treeing behavior at high temperature in XLPE cable insulation samples. IEEE Trans. Dielectr. Electr. Insul. 2015, 22, 2841–2851. [Google Scholar] [CrossRef]
  11. Tanaka, T. Space charge injected via interfaces and tree initiation in polymers. In Proceedings of the 2001 Annual Report Conference on Electrical Insulation and Dielectric Phenomena, Kitchener, ON, Canada, 14–17 October 2001; pp. 1–15. [Google Scholar]
  12. Nie, Q.; Zhou, Y.X.; Chen, Z.Z.; Chen, H.H. Effect of frequency on electrical tree characteristics in silicone rubber. In Proceedings of the IEEE 9th International Conference on the Properties and Applications of Dielectric Materials, Harbin, China, 19–23 July 2009; pp. 513–516. [Google Scholar]
  13. Du, B.X.; Han, T.; Su, J.G. Electrical tree characteristics in silicone rubber under repetitive pulse voltage. IEEE Trans. Dielectr. Electr. Insul. 2015, 22, 720–727. [Google Scholar] [CrossRef]
  14. Zhou, Y.X.; Zhang, Y.X.; Zhang, L.; Guo, D.W.; Zhang, X.; Wang, M.Y. Electrical tree initiation of silicone rubber after thermal aging. IEEE Trans. Dielectr. Electr. Insul. 2016, 23, 748–756. [Google Scholar] [CrossRef]
  15. Tiemblo, P.; Hoyos, M.; Gómez-Elvira, J.M.; Guzmán, J.; García1, N.; Dardano, A.; Guastavino, F. The development of electrical treeing in LDPE and its nanocomposites with spherical silica and fibrous and laminar silicates. J. Phys. D Appl. Phys. 2008, 41, 1854–1862. [Google Scholar] [CrossRef]
  16. Chen, X.R.; Xu, Y.; Cao, X.L.; Gubanski, S.M. On the conducting and non-conducting electrical trees in XLPE cable insulation specimens. IEEE Trans. Dielectr. Electr. Insul. 2016, 23, 95–103. [Google Scholar] [CrossRef]
  17. Schurch, R.; Rowland, S.M.; Bradley, R.S.; Withers, P.J. Imaging and analysis techniques for electrical trees using X-ray computed tomography. IEEE Trans. Dielectr. Electr. Insul. 2014, 21, 53–63. [Google Scholar] [CrossRef]
  18. Champion, J.V.; Dodd, S.J.; Alison, J.M. The correlation between the partial discharge behavior and the spatial and temporal development of electrical trees grown in an epoxy resin. J. Phys. D Appl. Phys. 1996, 29, 2689–2695. [Google Scholar] [CrossRef]
  19. Albertini, M.; Coletti, G.; Gemme, C.; Guastavino, F. Frequency acceleration of surface partial discharge tests on thin polymer films. In Proceedings of the 1994 IEEE International Symposium on Electrical Insulation, Pittsburgh, PA, USA, 5–8 June 1994; pp. 352–355. [Google Scholar]
  20. Li, G.; Hao, J.; Li, S.; Liao, R.J.; Zhao, X.T.; Yang, L.J. AC breakdown and frequency dielectric response characteristics of the mixed oil-paper insulation with different moisture content. In Proceedings of the 2017 IEEE Conference on Electrical Materials and Power Equipment, Xi’an, China, 14–17 May 2017; pp. 478–481. [Google Scholar]
  21. Akihiko, S.; Masaki, S.; Hisaaki, K.; Kiyotoshi, T.; Tadao, S. Degradation mechanisms of silicone rubber (SIR) by accelerated ageing for cables of nuclear power plant. IEEE Trans. Dielectr. Electr. Insul. 2014, 21, 16–23. [Google Scholar]
  22. Zhang, Y.X.; Zhou, Y.X.; Chen, M.; Zhang, L.; Zhang, X.; Sha, Y.C. Electrical tree initiation in silicone rubber under DC and polarity reversal voltages. J. Electrostat. 2017, 88, 207–213. [Google Scholar] [CrossRef]
  23. Zhou, Y.X.; Liu, R.; Hou, F.; Zhang, X.; Xue, W.B. Morphology of electrical trees in silicon rubber. J. Electrostat. 2013, 71, 440–448. [Google Scholar] [CrossRef]
  24. Aka-Ngnui, T.; Beroual, A. Bubble dynamics and transition into streamers in liquid dielectrics under a high divergent electric field. J. Phys. D Appl. Phys. 2001, 34, 1408–1412. [Google Scholar] [CrossRef]
  25. Watson, P.K. Electrostatic and hydrodynamic effects in the electrical breakdown of liquid dielectrics. IEEE Trans. Electr. Insul. 1985, 20, 395–399. [Google Scholar] [CrossRef]
  26. Garton, C.G.; Krasucki, Z. Bubbles in insulating liquids: Stability in an electric field. Proc. R. Soc. 1964, 280, 211–226. [Google Scholar] [CrossRef]
  27. Bao, M.H.; Tang, S.Y.; He, J.J.; Yin, X.G.; Wang, Q.; Wu, G.L.; Yang, Y. The initiation phenomena of electrical treeing in XLPE cable insulation. In Proceedings of the 2012 IEEE Conference on High Voltage Engineering and Application, Shanghai, China, 17–20 September 2012; pp. 431–434. [Google Scholar]
  28. Tanaka, T.; Greenwood, A. Effects of charge injection and extraction on tree initiation in polyethylene. IEEE Trans. Power Appar. Syst. 1978, 97, 1749–1759. [Google Scholar] [CrossRef]
  29. Dissado, L.A.; Fothergill, J.C. Electrical Degradation and Breakdown in Polymers, 1st ed.; Peter Peregrinus Ltd.: London, UK, 1992; pp. 125–131. [Google Scholar]
  30. Salvatierra, L.M.; Kovalevski, L.I.; Quina, P.L.D.; Irurzun, I.M.; Mola, E.E.; Dodd, S.J.; Dissado, L.A. Self-healing during electrical treeing: A feature of the two-phase liquid-solid nature of silicone gels. IEEE Trans. Dielectr. Electr. Insul. 2016, 23, 757–767. [Google Scholar] [CrossRef]
  31. Kovalevski, L.I.; Salvatierra, L.M.; Quina, P.L.D.; Irurzun, I.M.; Mola, E.E.; Chalashkanov, N.; Dodd, S.J.; Dissado, L.A. Effect of the field frequency during treeing tests in silicone polymers with different degree of crosslinking. In Proceedings of the 2015 IEEE Conference on Electrical Insulation and Dielectric Phenomena, Ann Arbor, MI, USA, 18–21 October 2015; pp. 613–616. [Google Scholar]
  32. Chalashkanov, N.; Dodd, S.J.; Dissado, L.A.; Salvatierra, L.M.; Kovalevski, L.; Mola, E. Strain produced by electrostatic forces in electrical trees and its relationship with the elastic modulus of the polymer matrix. In Proceedings of the 2015 IEEE Conference on Electrical Insulation and Dielectric Phenomena, Ann Arbor, MI, USA, 18–21 October 2015; pp. 601–604. [Google Scholar]
  33. Tanaka, T. Internal partial discharge and material degradation. IEEE Trans. Electr. Insul. 1986, 21, 899–905. [Google Scholar] [CrossRef]
  34. Zhang, L.X.; Xu, Z.; He, S.Y. A model for destruction of the methyl silicone rubber net-structure after the synergistic radiation of proton and electrons. Acta Chim. Sin. Chin. Ed. 2004, 62, 725–728. [Google Scholar]
  35. Roy, S.L.; Baudoin, F.; Griseri, V.; Laurent, C.; Teyssèdre, G. Space charge modeling in electron-beam irradiated polyethylene: Fitting model and experiments. J. Appl. Phys. 2012, 112, 351–357. [Google Scholar]
Figure 1. Silicone rubber (SIR) samples with needle tip.
Energies 11 00327 g001
Figure 2. Electrical treeing observation system.
Energies 11 00327 g002
Figure 3. Weibull distribution of electrical tree initiation voltage at different voltage frequencies.
Energies 11 00327 g003
Figure 4. Four typical electrical tree shapes in SIR: (ac) are branch-like trees, pine-like trees, and bush-like trees, respectively; (d) is bubble-shaped deterioration (applied by 7.8 kV with 130 kHz).
Energies 11 00327 g004
Figure 5. Probabilities of initiated tree-shape types at various voltage frequencies (within 1 min).
Energies 11 00327 g005
Figure 6. Typical treeing pattern and the corresponding tree length: (a) bush-like treeing pattern (after applying 7.5 kV at 50 Hz); (b) pine-like treeing pattern (after applying 11 kV at 50 Hz).
Energies 11 00327 g006
Figure 7. Bubble-treeing breakdown phenomenon under a 7.8 kV voltage at 130 kHz: (a) Bush-like tree generated after tree initiated; (b) Bubble generated within the tree; (c,d) Bubble expanded rapidly; (e) The increasing bubbles reached the grounding electrode with a strong discharge arc; and (f) The sample broke down.
Energies 11 00327 g007
Figure 8. Increasing radius of bubbles for voltages having different magnitudes (at 130 kHz).
Energies 11 00327 g008
Figure 9. Chain reaction function under high electric field in SIR
Energies 11 00327 g009
Figure 10. Enlarged pictures of electrical tree channels: (a) Transmission light image of electrical trees (upon application of 10-kV voltage at 50 Hz for 5 min); (b) Partial enlarged image of Figure 9a.
Energies 11 00327 g010
Figure 11. Growth model for electrical tree in SIR at different frequencies: (a) Electrical treeing initiation; (b) Trees growing under lower frequencies [7]; (c) Bubble growing under frequencies greater than 100 kHz.
Energies 11 00327 g011
Figure 12. Reaction function of producing gases (hydrogen and methane) in SIR materials using energetic particles.
Energies 11 00327 g012
Table 1. Distribution of α and β corresponding to Figure 3.
Frequency (Hz)α (kV)β
508.505.47
5007.845.50
1 k6.597.47
10 k6.276.66
80 k6.618.68
130 k6.127.99
Table 2. Probabilities of different breakdown types and the average breakdown duration under a 10 kV voltage at 50 Hz.
TypeProbabilityAverage Breakdown Duration (min)
Bush-like treeing37.5%90.0
Pine-like treeing62.5%4.98

