Article

Are Nano-Composite Coatings the Key for Photovoltaic Panel Self-Maintenance: An Experimental Evaluation

Department of Engineering “Enzo Ferrari”, University of Modena and Reggio Emilia, Via Vivarelli 10/1, 41125 Modena, Italy
*
Author to whom correspondence should be addressed.
These authors contributed equally to this work.
Energies 2018, 11(12), 3448; https://doi.org/10.3390/en11123448
Submission received: 17 November 2018 / Revised: 3 December 2018 / Accepted: 6 December 2018 / Published: 10 December 2018

Abstract

:
This article shows the influence of an anti-fouling nano-coating on the electrical energy produced by a string of photovoltaic modules. The coating effect was evaluated comparing the energy produced by two strings of the same PV power plant: one of them was cleaned and the other was cleaned and treated with the coating before the monitoring campaign. The PV plant is located in Modena, north of Italy. A first monitoring campaign of nine days after the treatment shows that the treatment increases the energy production on the PV arrays by about 1.82%. Results indicate that the increase is higher during sunny days with respect to cloudy days. A second monitoring campaign of the same length, but five months later, shows that the energy gain decreases from 1.82% to 0.69% due to the aging of the coating, which is guaranteed for one year by the manufacturer. A technical-economical analysis demonstrates that at the moment the yearly economic gain is 0.43 € per square meter of panel and the cost of the treatment is about 1 € per square meter. However, large scale diffusion can reduce the production cost and thus increase the affordability of the coating.

1. Introduction

Pollution and C O 2 emissions given by fossil fuels continuously push the interest for renewable sources. In fact, the renewable share of electricity world demand reached about 25% in 2015 and the forecast for 2021 is 28% [1]. In 2015, solar photovoltaic electrical energy was about 4% of the total renewable electricity produced, while the forecast for 2021 is 9% [1]. Moreover, photovoltaic energy cost has decreased thanks to market competition in the last five years. In 2011, this cost was up to 300 USD/MWh over a 20-year depreciation period, now it is about 120 USD/MWh and in 2021 it will be lower than 100 USD/MWh [1]. Moreover, photovoltaic power plants are affected by several inefficiencies that reduce the energy output [2]. First, mismatch losses can reduce by 3% the PV plant energy output as a result of differences in nominal power of photovoltaic modules [3,4,5,6,7,8,9]. Ohmic resistance in cables and diodes is a further source of losses [10]. Thermodynamics of the PV cells suggests that the part of irradiation that it is not converted into electrical energy becomes heat [11]. For this reason, heat dissipation of a panel is fundamental to reduce its temperature, which negatively affects the energy output [11], for example Kaushik et al. [12] calculated a PV module energy efficiency decreases from 16.73% to 14.39% with the increase in module temperature from 305 K to 360 K. To overcome this issue, nine PV panel cooling technologies are available [13]. Most of them use water evaporation or water cooling circuits to remove the excess of heat, but also some innovative technologies that use Phase Changing Materials (PCM) and Thermoelectric cooling have been developed [13]. Another important source of losses in the photovoltaics conversion is panel soiling [14,15,16,17,18,19,20,21,22,23]. Soiling includes dust, soot, foliage, bird dropping, salt and organic species that cause a reduction of radiation transmitted through the glass panels. It was proven that biological species such as alternaria can effectively colonize the panel surfaces over the years [24]. Soiling decreases the electrical energy production from 1% to 6.2% [15] as a function of the surrounding vegetation, panel slope, wind velocity, rainfall, and dust and soot content in the atmosphere [25,26]. Several soiling studies performed in different parts of the world were summarized by Sayyah et al. [25]. To reduce panel soiling, manual and/or automated cleaning processes are recommended. Manual cleaning with a solution of water and detergents is effective with brushing [25], however this process requires high amount of water, which is not available in arid zones. The automated cleaning processes use water sprays, sometimes coupled with robotic brushes. These systems are more efficient and consume less water than the manual ones, however capital and maintenance costs are high compared to the economical revenue of the output reduction due to soiling [25]. An effective method to reduce both soiling and cleaning maintenance frequency is the application of nano-coatings on the panel surface [27]. These coatings improve the cleaning effectiveness of natural cleaning agents because they make the panel surface hydrophilic. In addition, these coatings have anti-static and photo-catalytic effects [25,28,29]. All these properties reduce soiling with the major disadvantage of having a life span of a couple of years. Another disadvantage is that the re-application of coating might reduce the optical performance [25]. However, if the thickness of the coating is small (100–200 nm), the optical properties are not affected. This paper presents an experimental study regarding the influence of a nano-coating film applied on a domestic photovoltaic power plant with 4.83 kW of peak power. The modules array is composed of two independent sub-arrays: one with 10 modules connected in series and the other with 11 modules connected in series. The coating was applied to the 11-module sub-array and the plant production was monitored for the next nine days. A second nine-day monitoring campaign was done 150 days after the application of the coatings to asses the aging effect. A comparison between the normalized energy produced by the 10- and 11-module sub-arrays in the monitoring campaigns was done and discussed.

2. Material and Methods

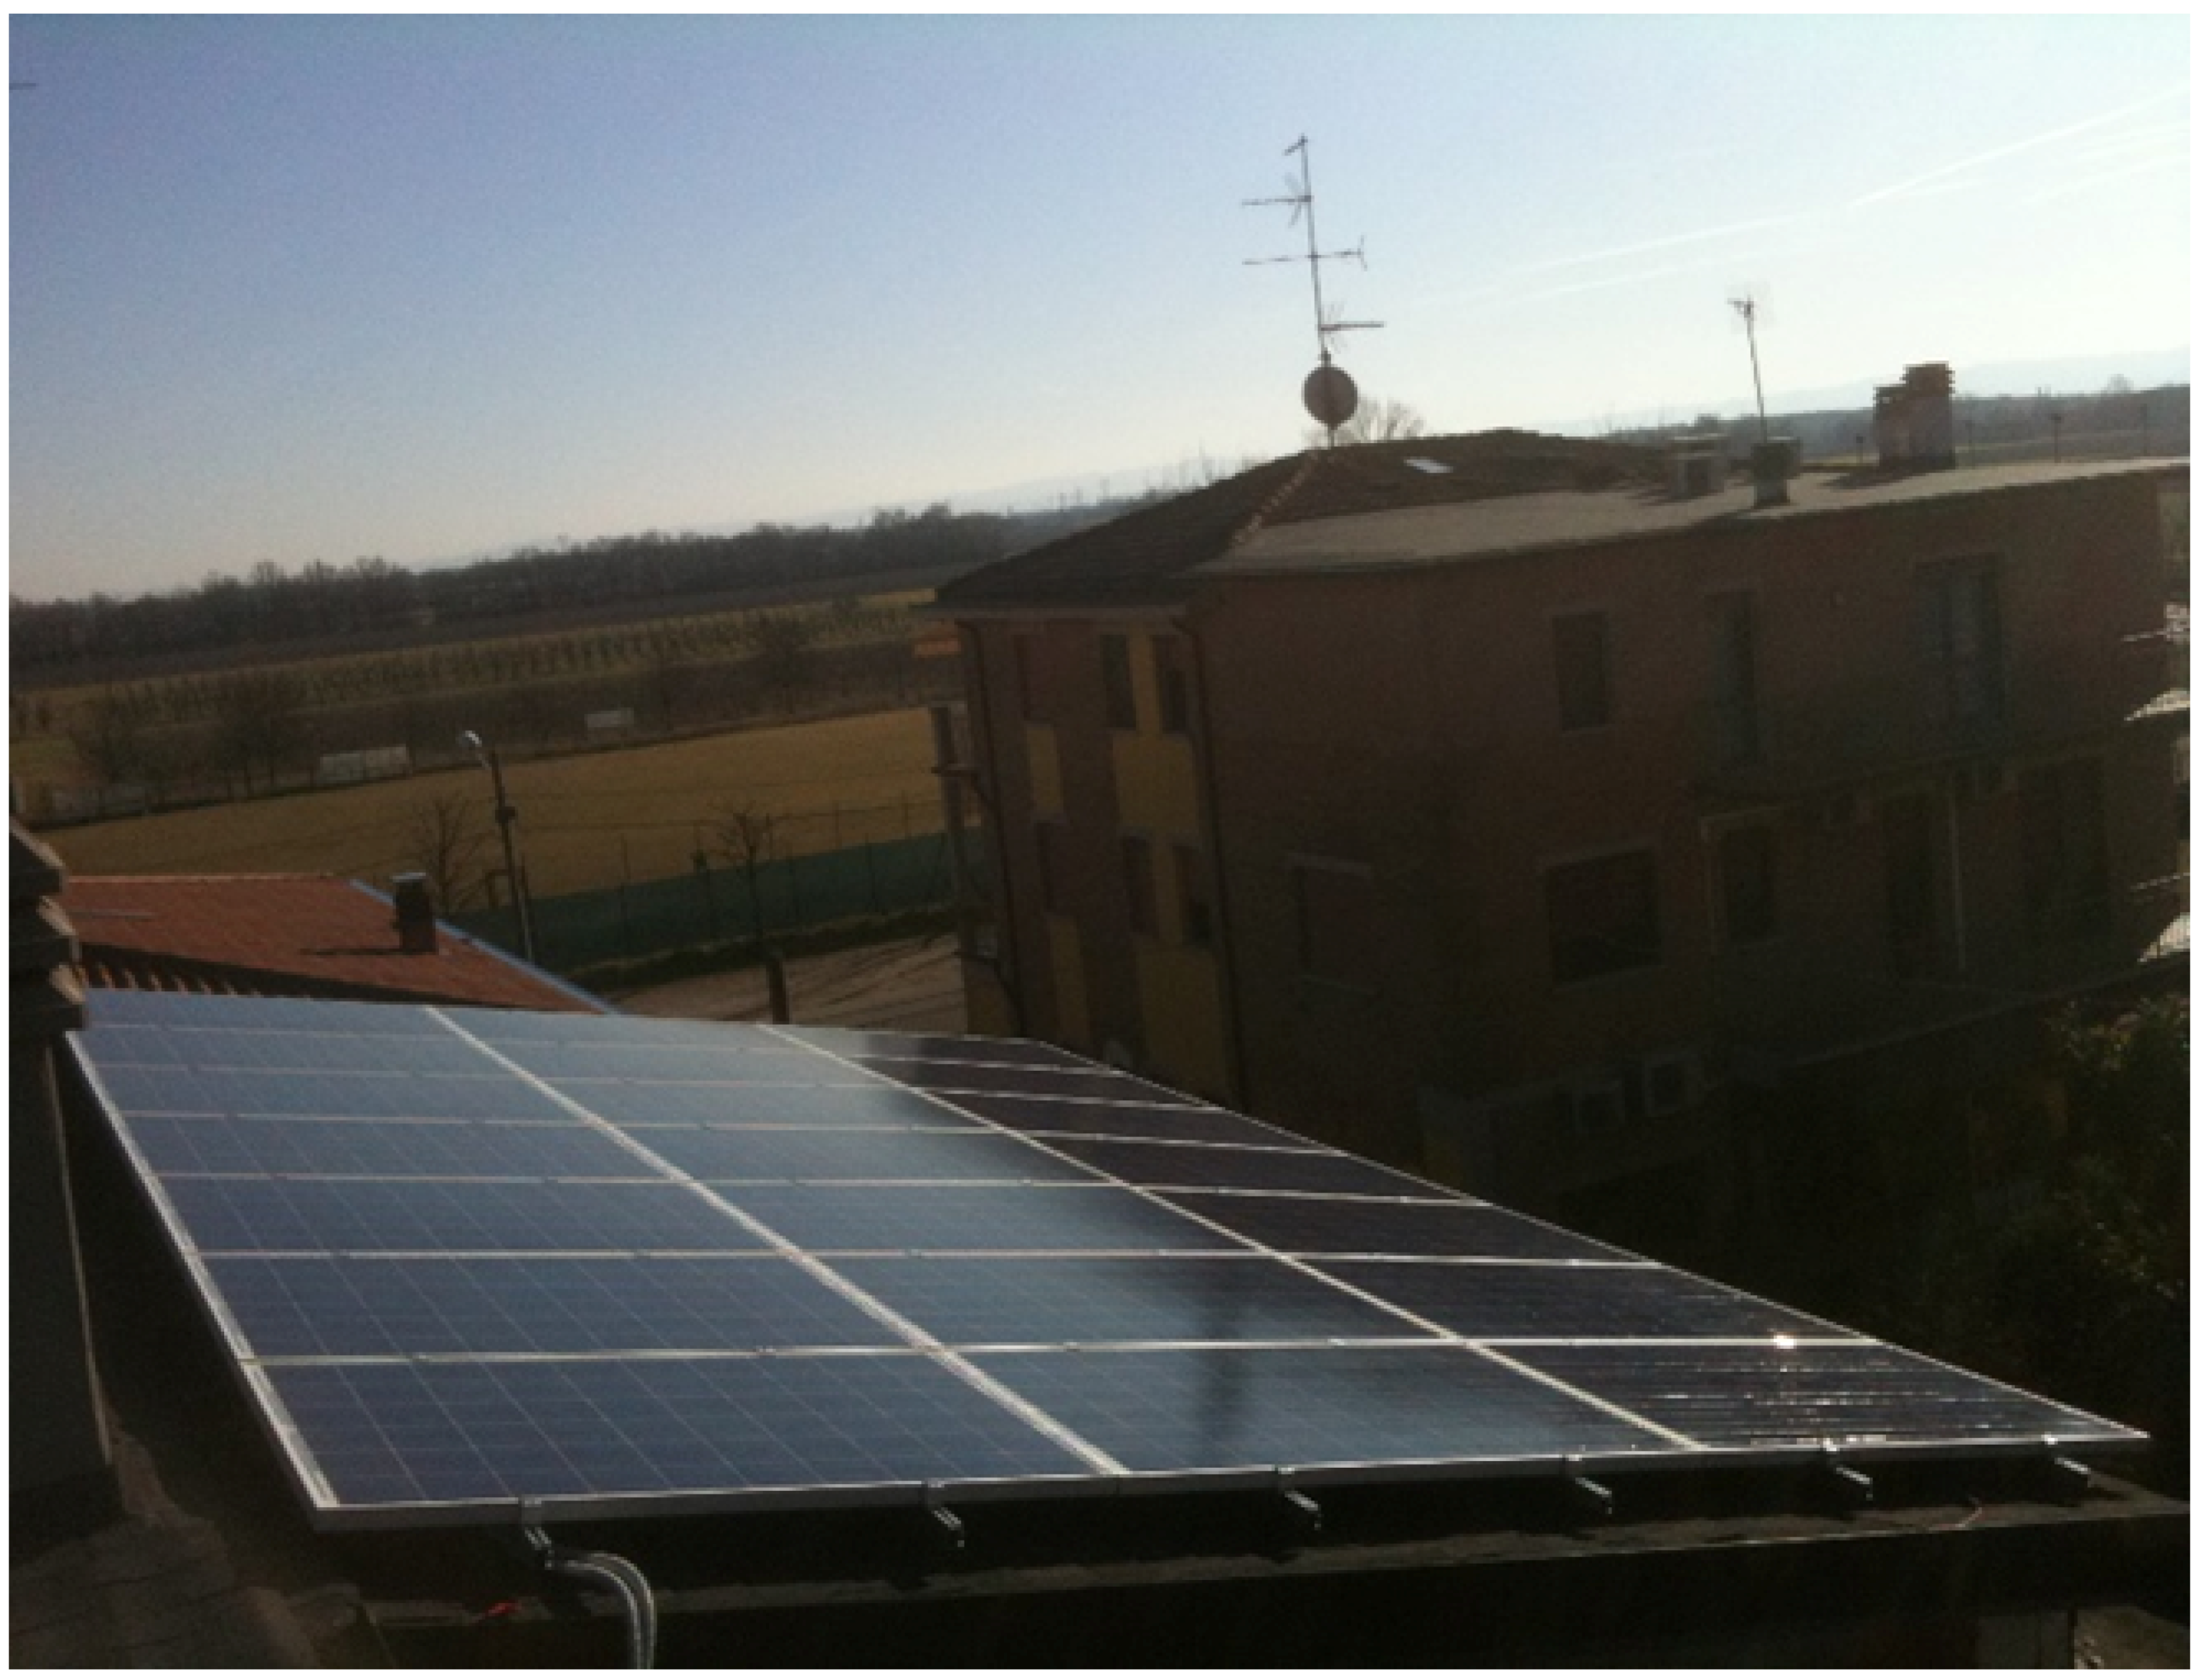
2.1. PV Plant Description

The power plant investigated in this work is located in Modena, north of Italy (44.6910838 N, 10.9685413 E). The site is characterized by a Central Europe continental climate. The choice of this site is strategical because it is representative of a large part of Central and Southern European areas and because in the whole Europe there are thousands of PV power plants, with total peak power about equal to 100 MW. The PV arrays object of this study is composed of 21 Linuo LN 230P polycrystalline modules with a peak power of 230 W and 1.64 square meter of gross surface each. Figure 1 shows the PV array. The slope of the array is 20 degree and the orientation is 35 degree from south. The power plant is split into two sub-arrays of 10 and 11 modules. Each sub-array is connected to an inverter PVI-6000-OUTD manufactured by Power-One Italy s.p.a. The inverter has two independent maximum power point trackers, each one connected to a single sub-array. In such a way, each sub-array is controlled autonomously by the inverter and can produce a different electrical power. The inverter converts the electrical energy from direct current and voltage to alternating current and voltage. This energy is then consumed by the power plant owner or is supplied to the national electric grid.

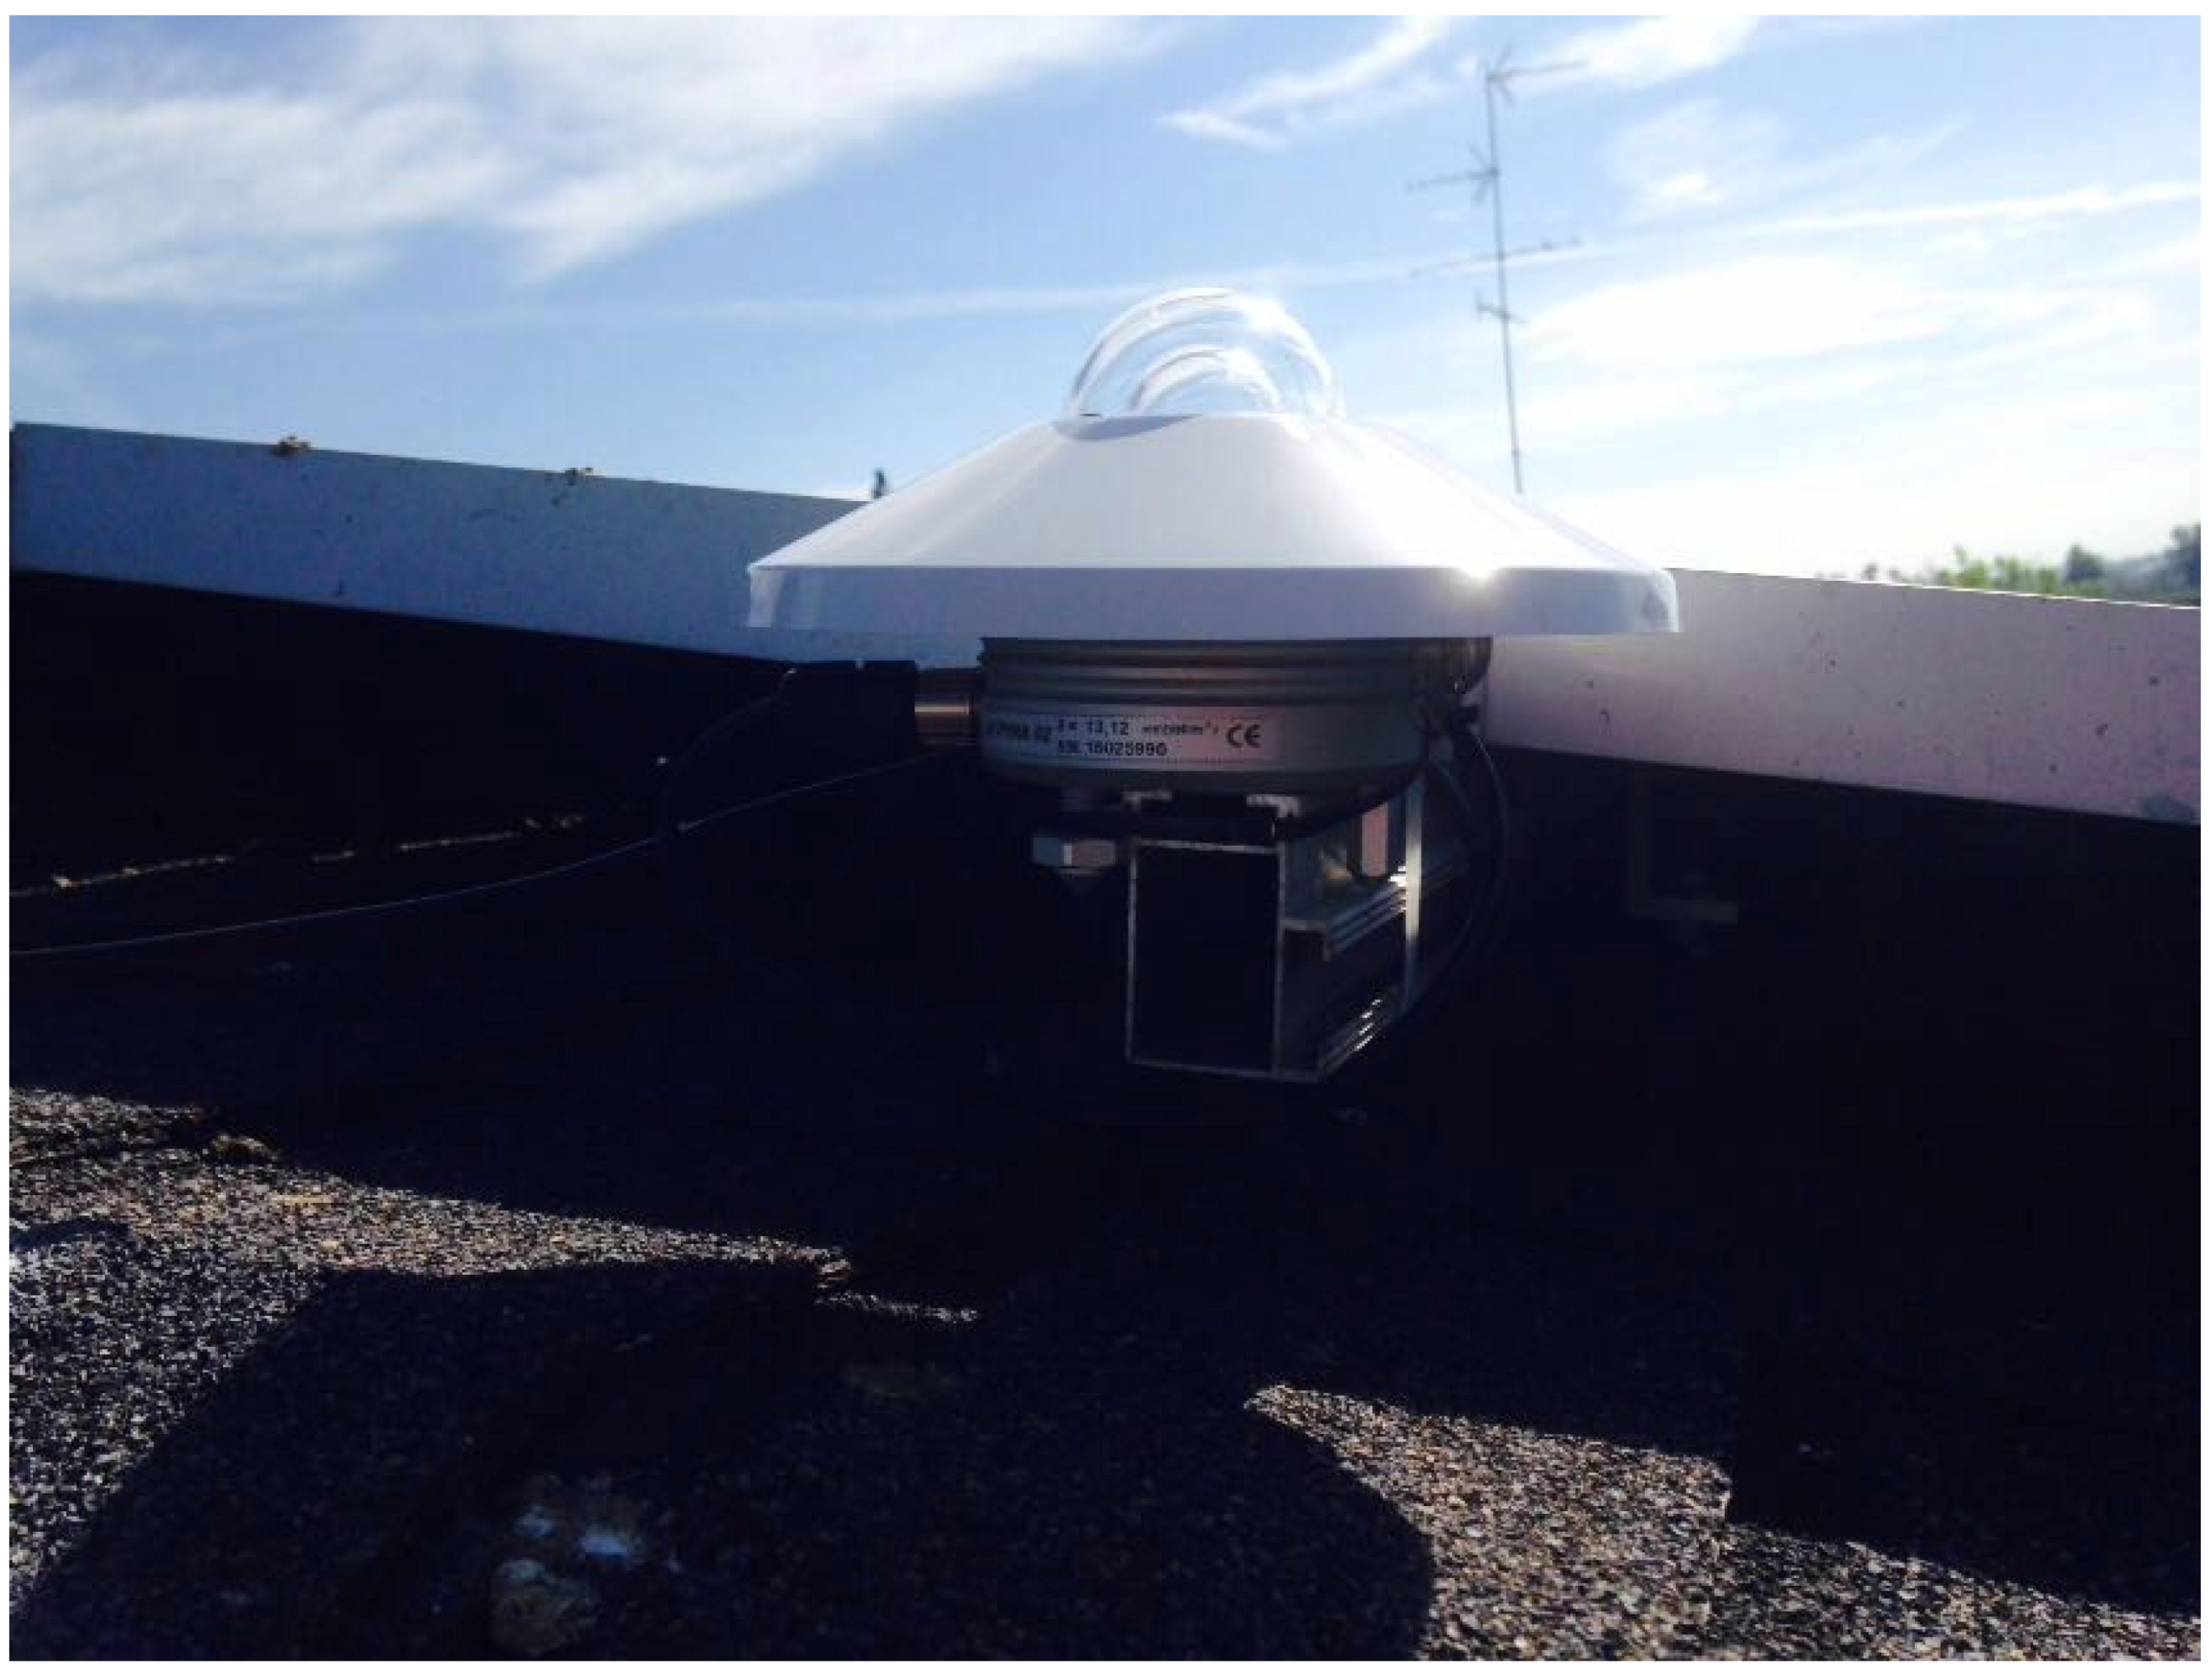
2.2. Measurement Devices Description

Several instruments were applied to measure the more interesting plant variables during the monitoring. First, the irradiation on the modules was detected through a pyranometer connected to a Delta Ohm HD2102.2 luxmeter installed in situ and depicted in Figure 2. This instrument has a resolution of 1 mW/m 2 . Direct current and voltage produced by each sub-array were detected with four Metrix MTX3293 multimeters, which have a precision of 0.02%. A record time step of two minutes was chosen for each instrument in order to have accurate results. The first monitoring campaign started at 12:20 on 4 April 2017 and finished at 12:20 on 15 May 2017 for a total of 216 h and 6481 data points. The second monitoring campaign started at 12:51 on 8 September 2017 and finished at 12:51 on 18 September 2017, the number of hours and data points being the same as the first campaign. The length of the monitoring campaign was limited by the maximum data points recordable by the multimeters, which is 7000. However, a good time resolution allowed evaluating the influence of the coating under high and low solar irradiation conditions. In addition, the second monitoring campaign permitted evaluating the aging effect of the nano-coating after five months on the performance of the PV power plant.

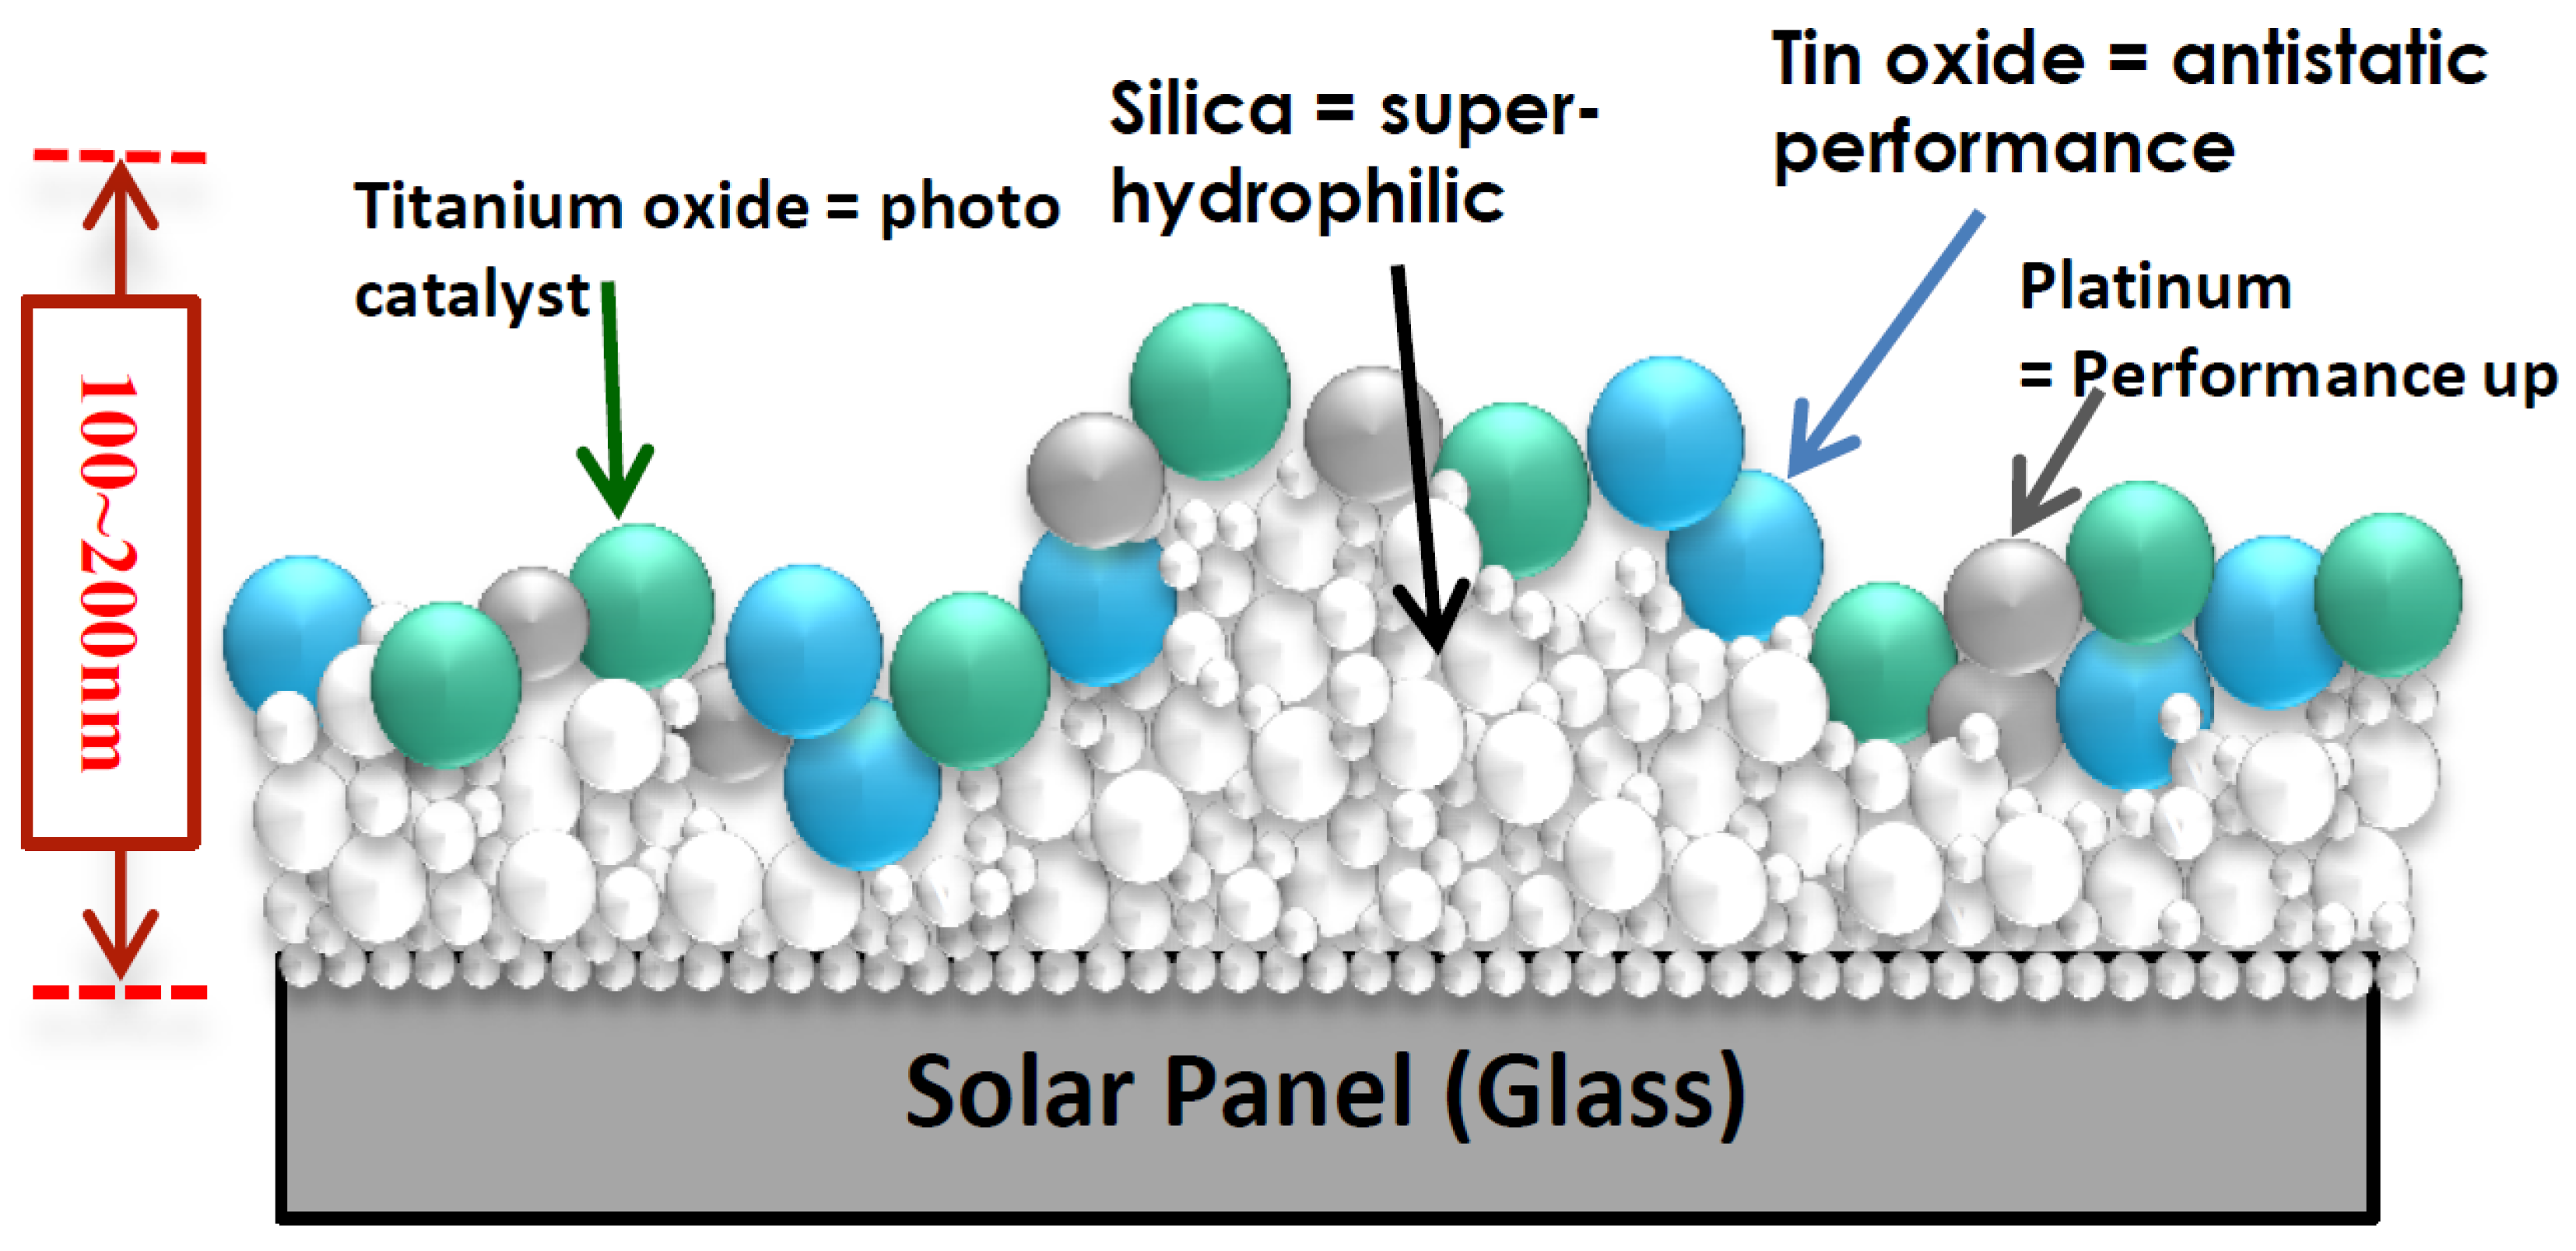
2.3. Coating Application

The coating was applied to the 11-module strings about two days before the first monitoring campaign. This coating was developed by the Japanese company Sketch Co., Ltd., Tokyo, Japan. Its characteristics are reported in the re-seller website. It is a photocatalyst, anti-fouling, and super-hydrophilic coating ideal for solar panels. The coating is made with silica, tin oxide, titanium oxide, platinum, methanol and water. Figure 3 shows how the coating behave on the panel surface. Silica is the component that produces the super hydrophilic effect. In fact, an even layer of 100–200 nano-sized silica crystals creates a constantly super-hydrophilic film. Contact angle will be 5 degrees or less, thus raindrops and water drops create an ultra-thin film (super-hydrophilic film) on the substrate while they help to wash the dirt away. The titanium oxide has a well-known photocatalyst effect [30]. The anti-fouling effect is made by tin oxide and platinum content. Tin oxide has many free electrons and this reduces the electrical resistance. A low electrical surface resistance prevents attraction and adhering of the fine dust and particles floating in the air. This is a different mechanism compared with hydrophobic oil coating. Rifai et al. described how these oil coatings exploit fluctuations in the weather (sun–rain) to effectively remove almost all of the dust particles [31]. The coating used in this paper also contains platinum. This super conductive metal enhances the tin oxide effect. This anti-fouling effect works also for inorganic dirt such as exhaust gases, coal ashes, yellow sand and iron powder that cannot be decomposed by photocatalyst. The application of the coating needs to be done on the entire tilted panel surface with a dedicated micro-fiber cloth. It is suggested to apply about 10 mL of coating per square meter of panel. In such a way, the coating thickness will be 100–200 nm, which preserves a high light transmittance. The manufacturer declares one-year weather resistance, a solar light transmittance coefficient of 92%, a contact angle of 3.3 and a surface electrical resistance that ranges from 10 7 to 10 9 Ω . To do a valid comparison, both PV arrays were washed with water and detergent, while only the array with 11 modules was coated before the monitoring.

2.4. Data Post-Processing

Data obtained from each campaign were post processed to facilitate the comparison and discussion. The energy produced by each array was normalized on the array peak power:
E i , j , n o r = E i , j β i P p k , i
where E i , j , n o r [MJ/kW p ] is the energy produced by the ith array during the jth experimental campaign, normalized; E i , j [MJ] is the energy produced by the ith array during the jth experimental campaign, not normalized; i = 1 for the coated 11-module array and i = 2 for the not coated 10-module array; j = 1 for the first campaign and j = 2 for the second campaign; P p k , i [kW p ] is the peak power of the ith array; and β i is a correction factor applied to the ith array. β i was calculated as the average value of the conversion efficiency of the first array divided by the conversion efficiency of the second array using data obtained from a previous monitoring campaign not discussed here. β i was set equal to 0.96 for the first array and is obviously equal to 1 for the second array. E i , j was calculated by integrating the instantaneous value of voltage and current given by the multimeters:
E i , j = 0 T j V i ( t ) I i ( t ) d t
where T j [s] is the total monitoring duration of the jth campaign; V i ( t ) is the instantaneous voltage of the ith array; and I i ( t ) is the instantaneous current produced by the ith array. The energy production gain between the coated and not coated array was calculated as follows:
Δ E j , n o r = E 1 , j , n o r E 2 , j , n o r E 2 , j , n o r × 100
where Δ E j , n o r [%] is the energy gain given by the coating in the jth monitoring campaign. Moreover, conversion efficiency was calculated by Equation (4):
η i , j = E i , j A i E r a d , j × 100
where η i , j [%] is the conversion efficiency of the ith array during the jth monitoring campaign; A i [m 2 ] is the gross surface of the ith array given by the Equation (5); and E r a d , j [MJ/m 2 ] is the total solar radiation on the panels surface calculated by Equation (6).
A i = A p a n N i
E r a d , j = 0 T j G j ( t ) d t
where A p a n [m 2 ] is the solar panel area; N i is the number of panels in the ith array; and G j ( t ) [W/m 2 ] is the instantaneous solar radiation on the panels surface measured by the photometer. The conversion efficiency gain between the coated and no coated arrays was calculated as follows:
Δ η j = η 1 , j η 2 , j η 2 , j × 100

3. Results and Discussion

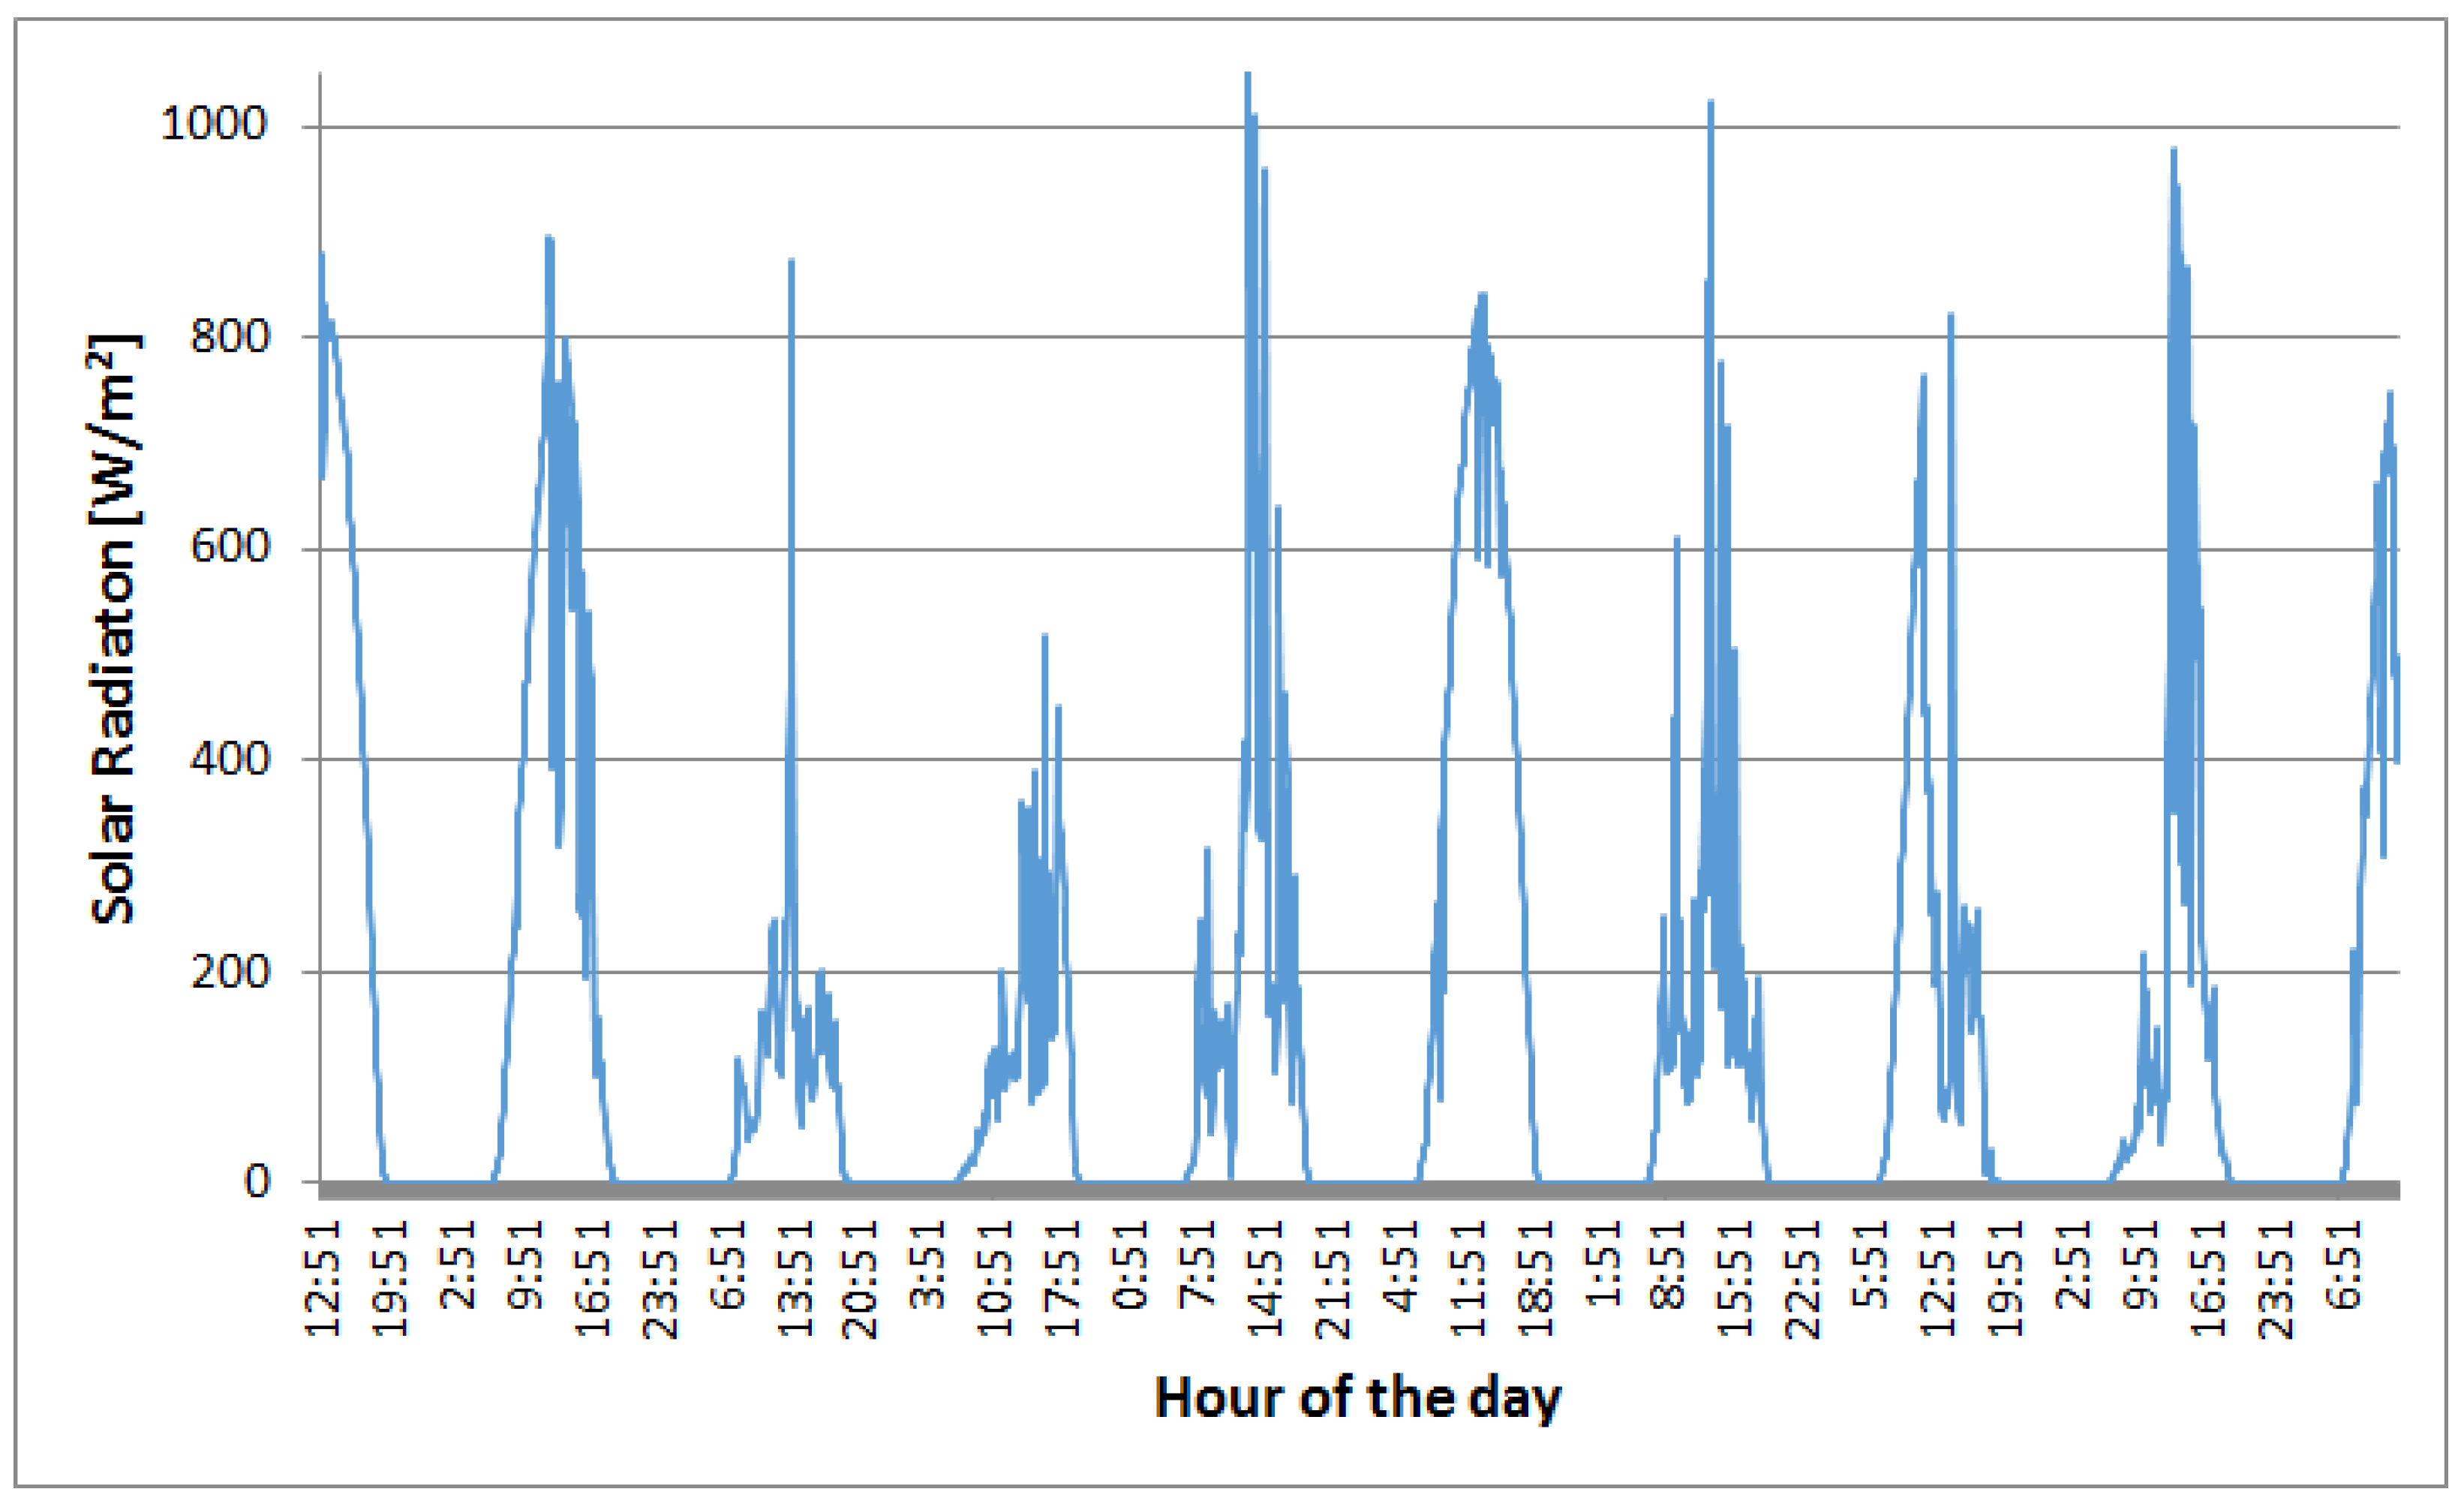
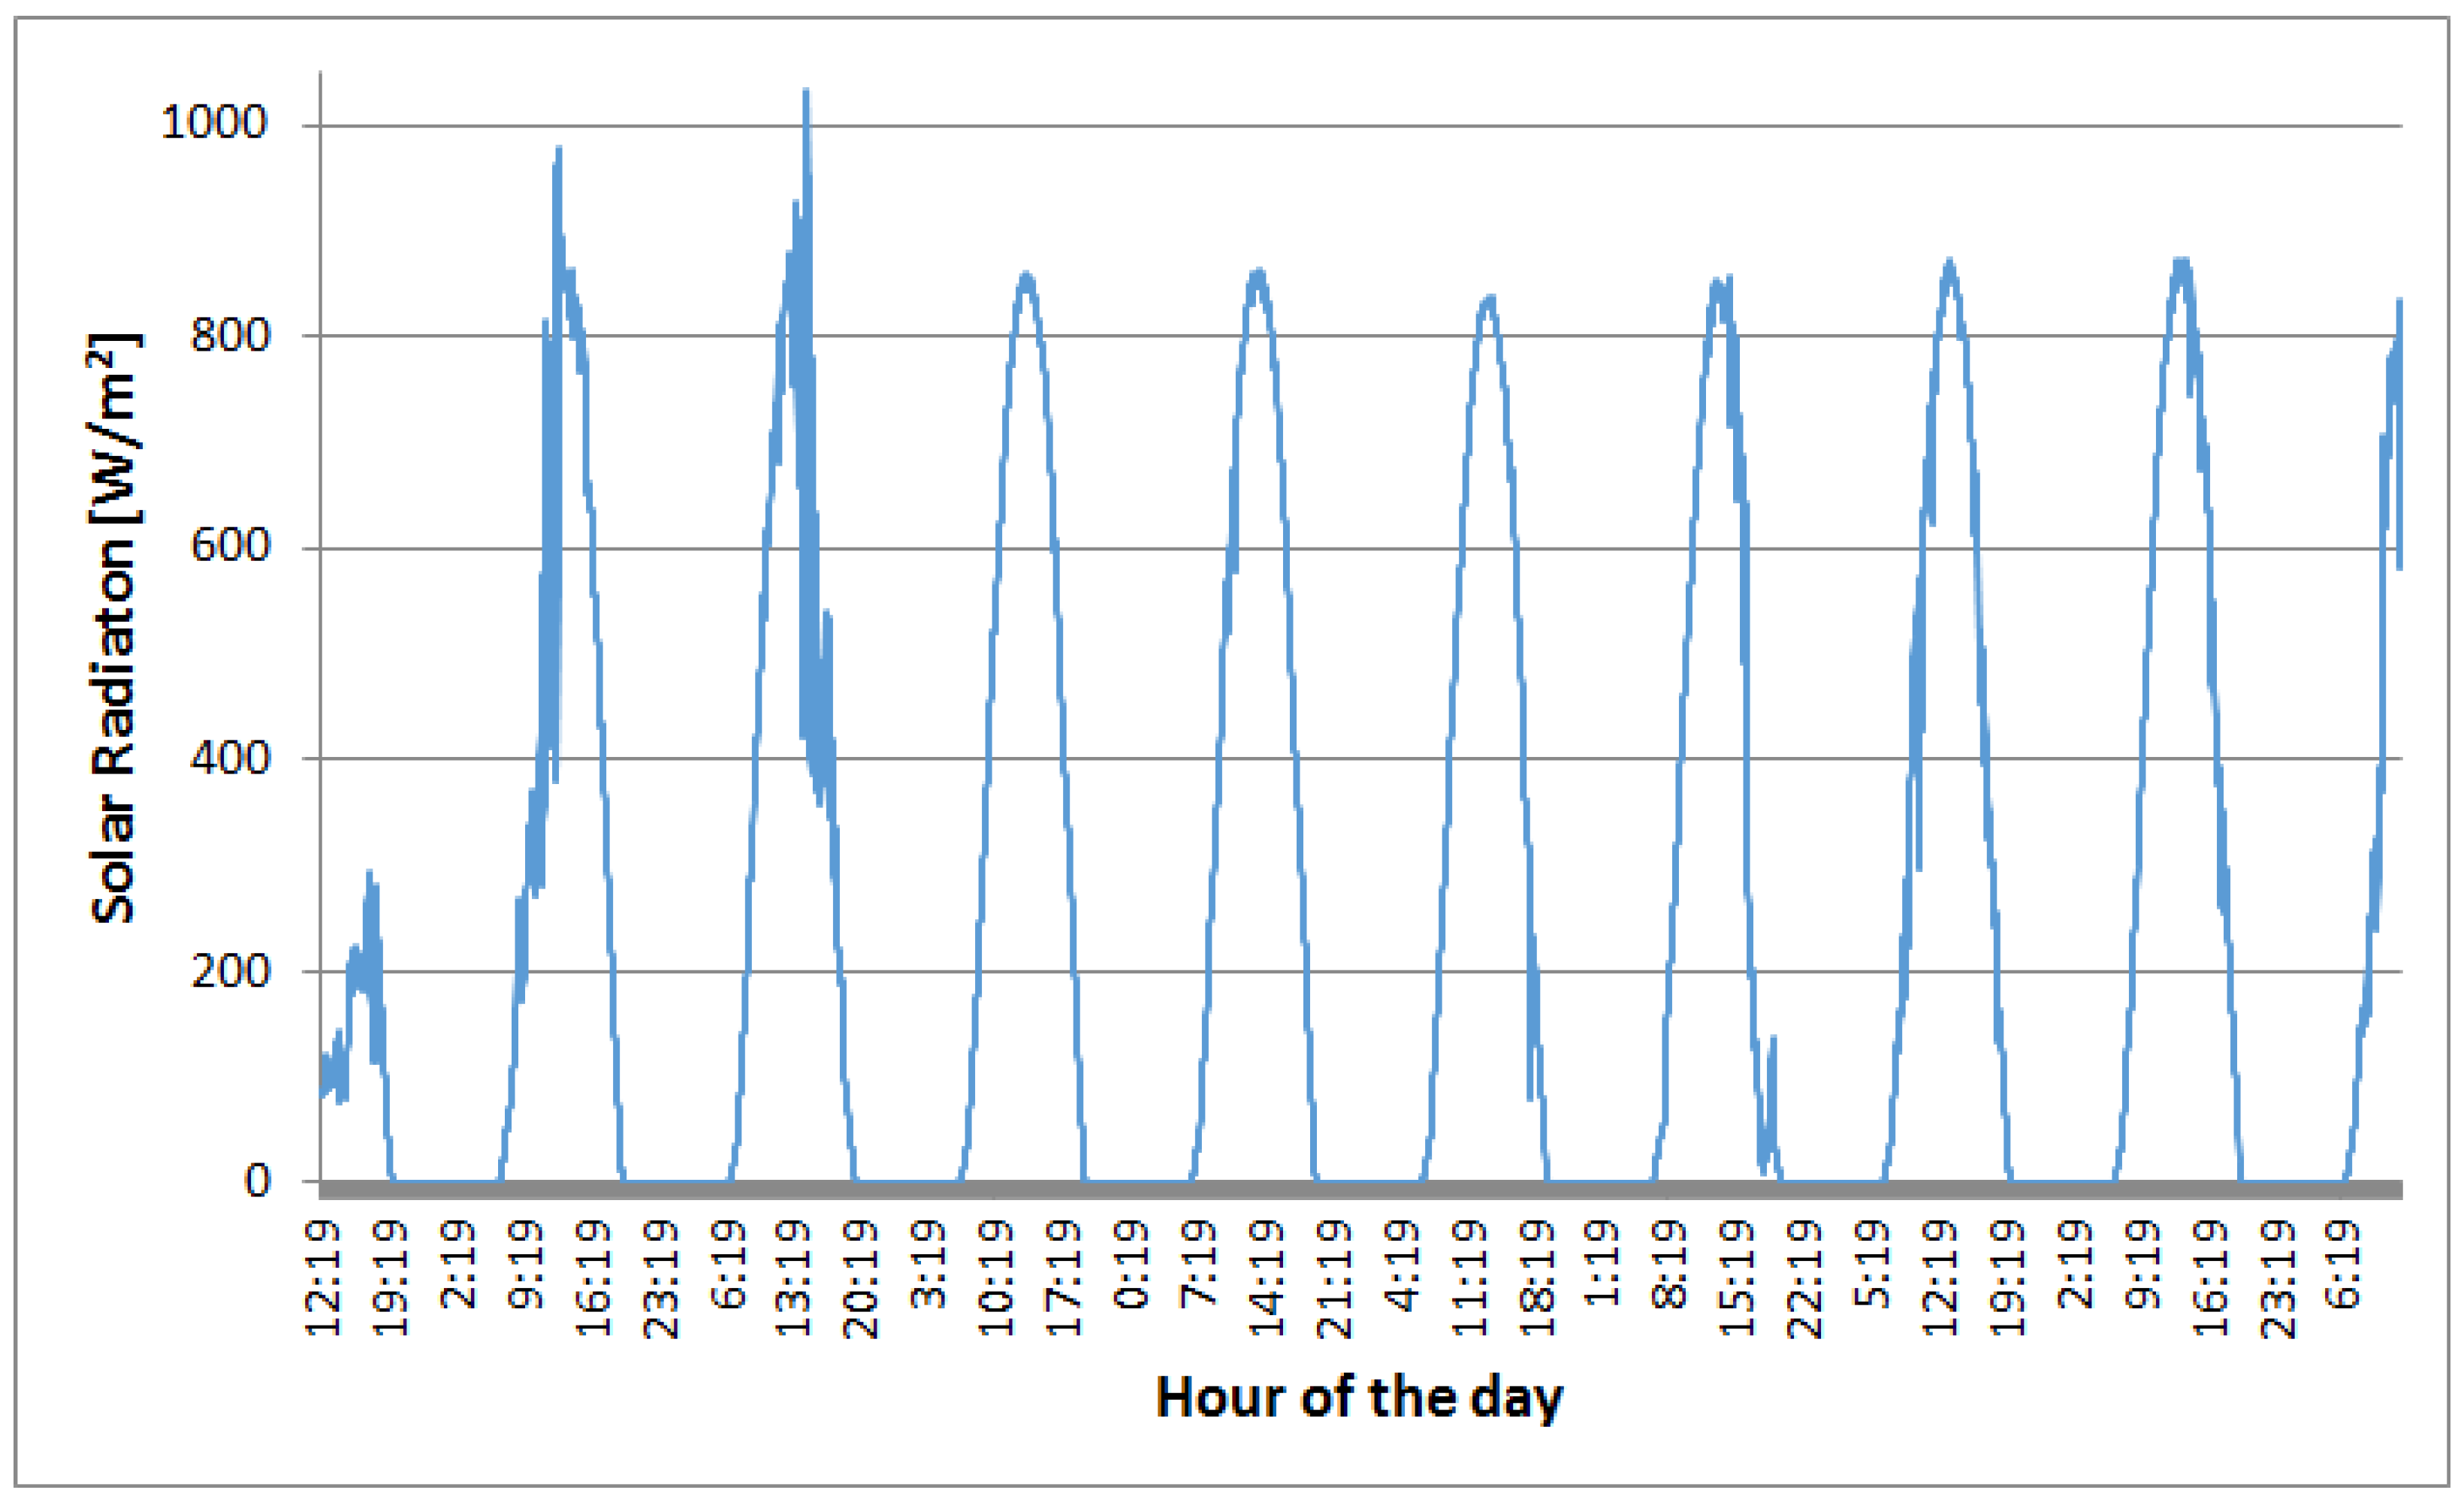
3.1. Solar Radiation

Solar radiation on the PV panels during the monitoring campaigns is reported in Figure 4 and Figure 5. Figure 4 depicts the solar radiation during the first campaign in April 2017. The sunrise was about at 07:00 and and the sunset was about at 19:30. Apart from the first cloudy day, the weather remained sunny with some clouds during the second and third days of monitoring. The maximum radiation reached was about 1020 W/m 2 the third day. Therefore, the radiation trend was regular from the fourth to the nineth day with a peak power of 850 W/m 2 . Completely different is the situation in the second monitoring campaign of September 2017 (Figure 5). Here, the weather was more variable with only two good sunny days (Days 1 and 6). The third and the fourth days of monitoring were cloudy and the average radiation was about 250–300 W/m 2 . The total solar energy incident on the panels surface was E r a d , 1 = 186.77 MJ/m 2 in the first monitoring campaign and E r a d , 2 = 110.95 MJ/m 2 in the second monitoring campaign. This difference of weather between the two monitoring campaigns allowed evaluating the performance of the coating under different conditions of solar radiation.

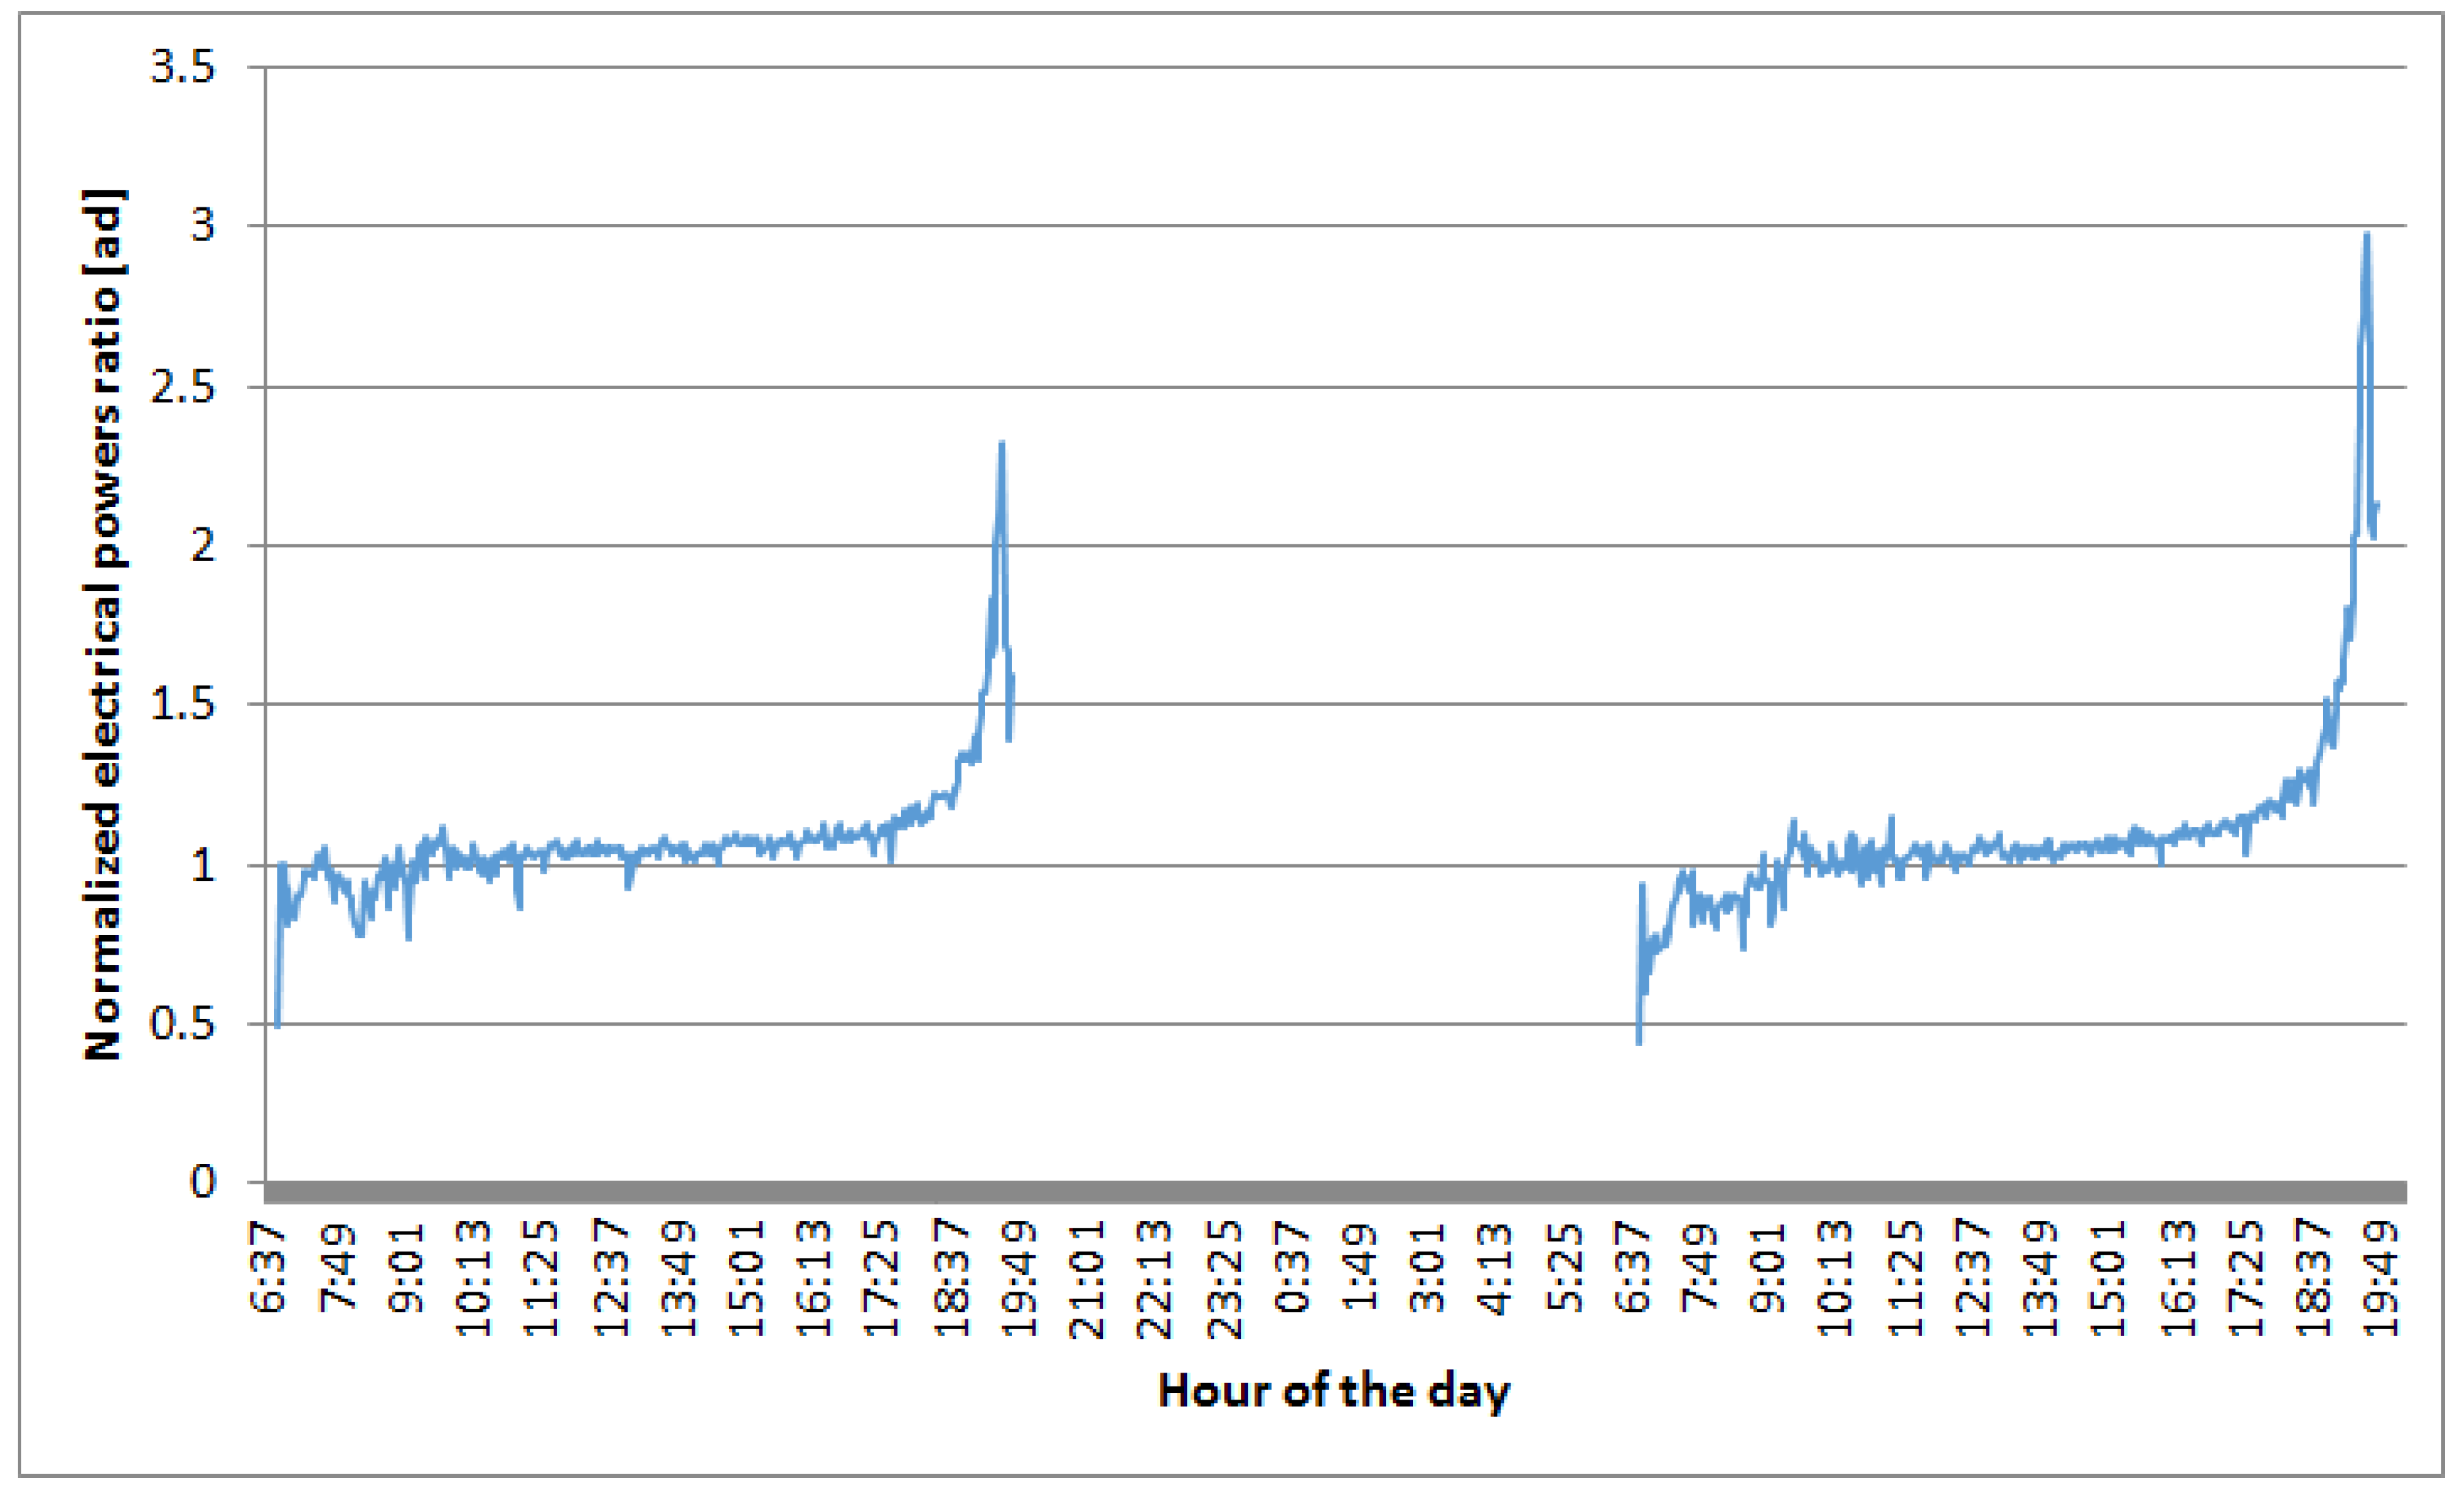
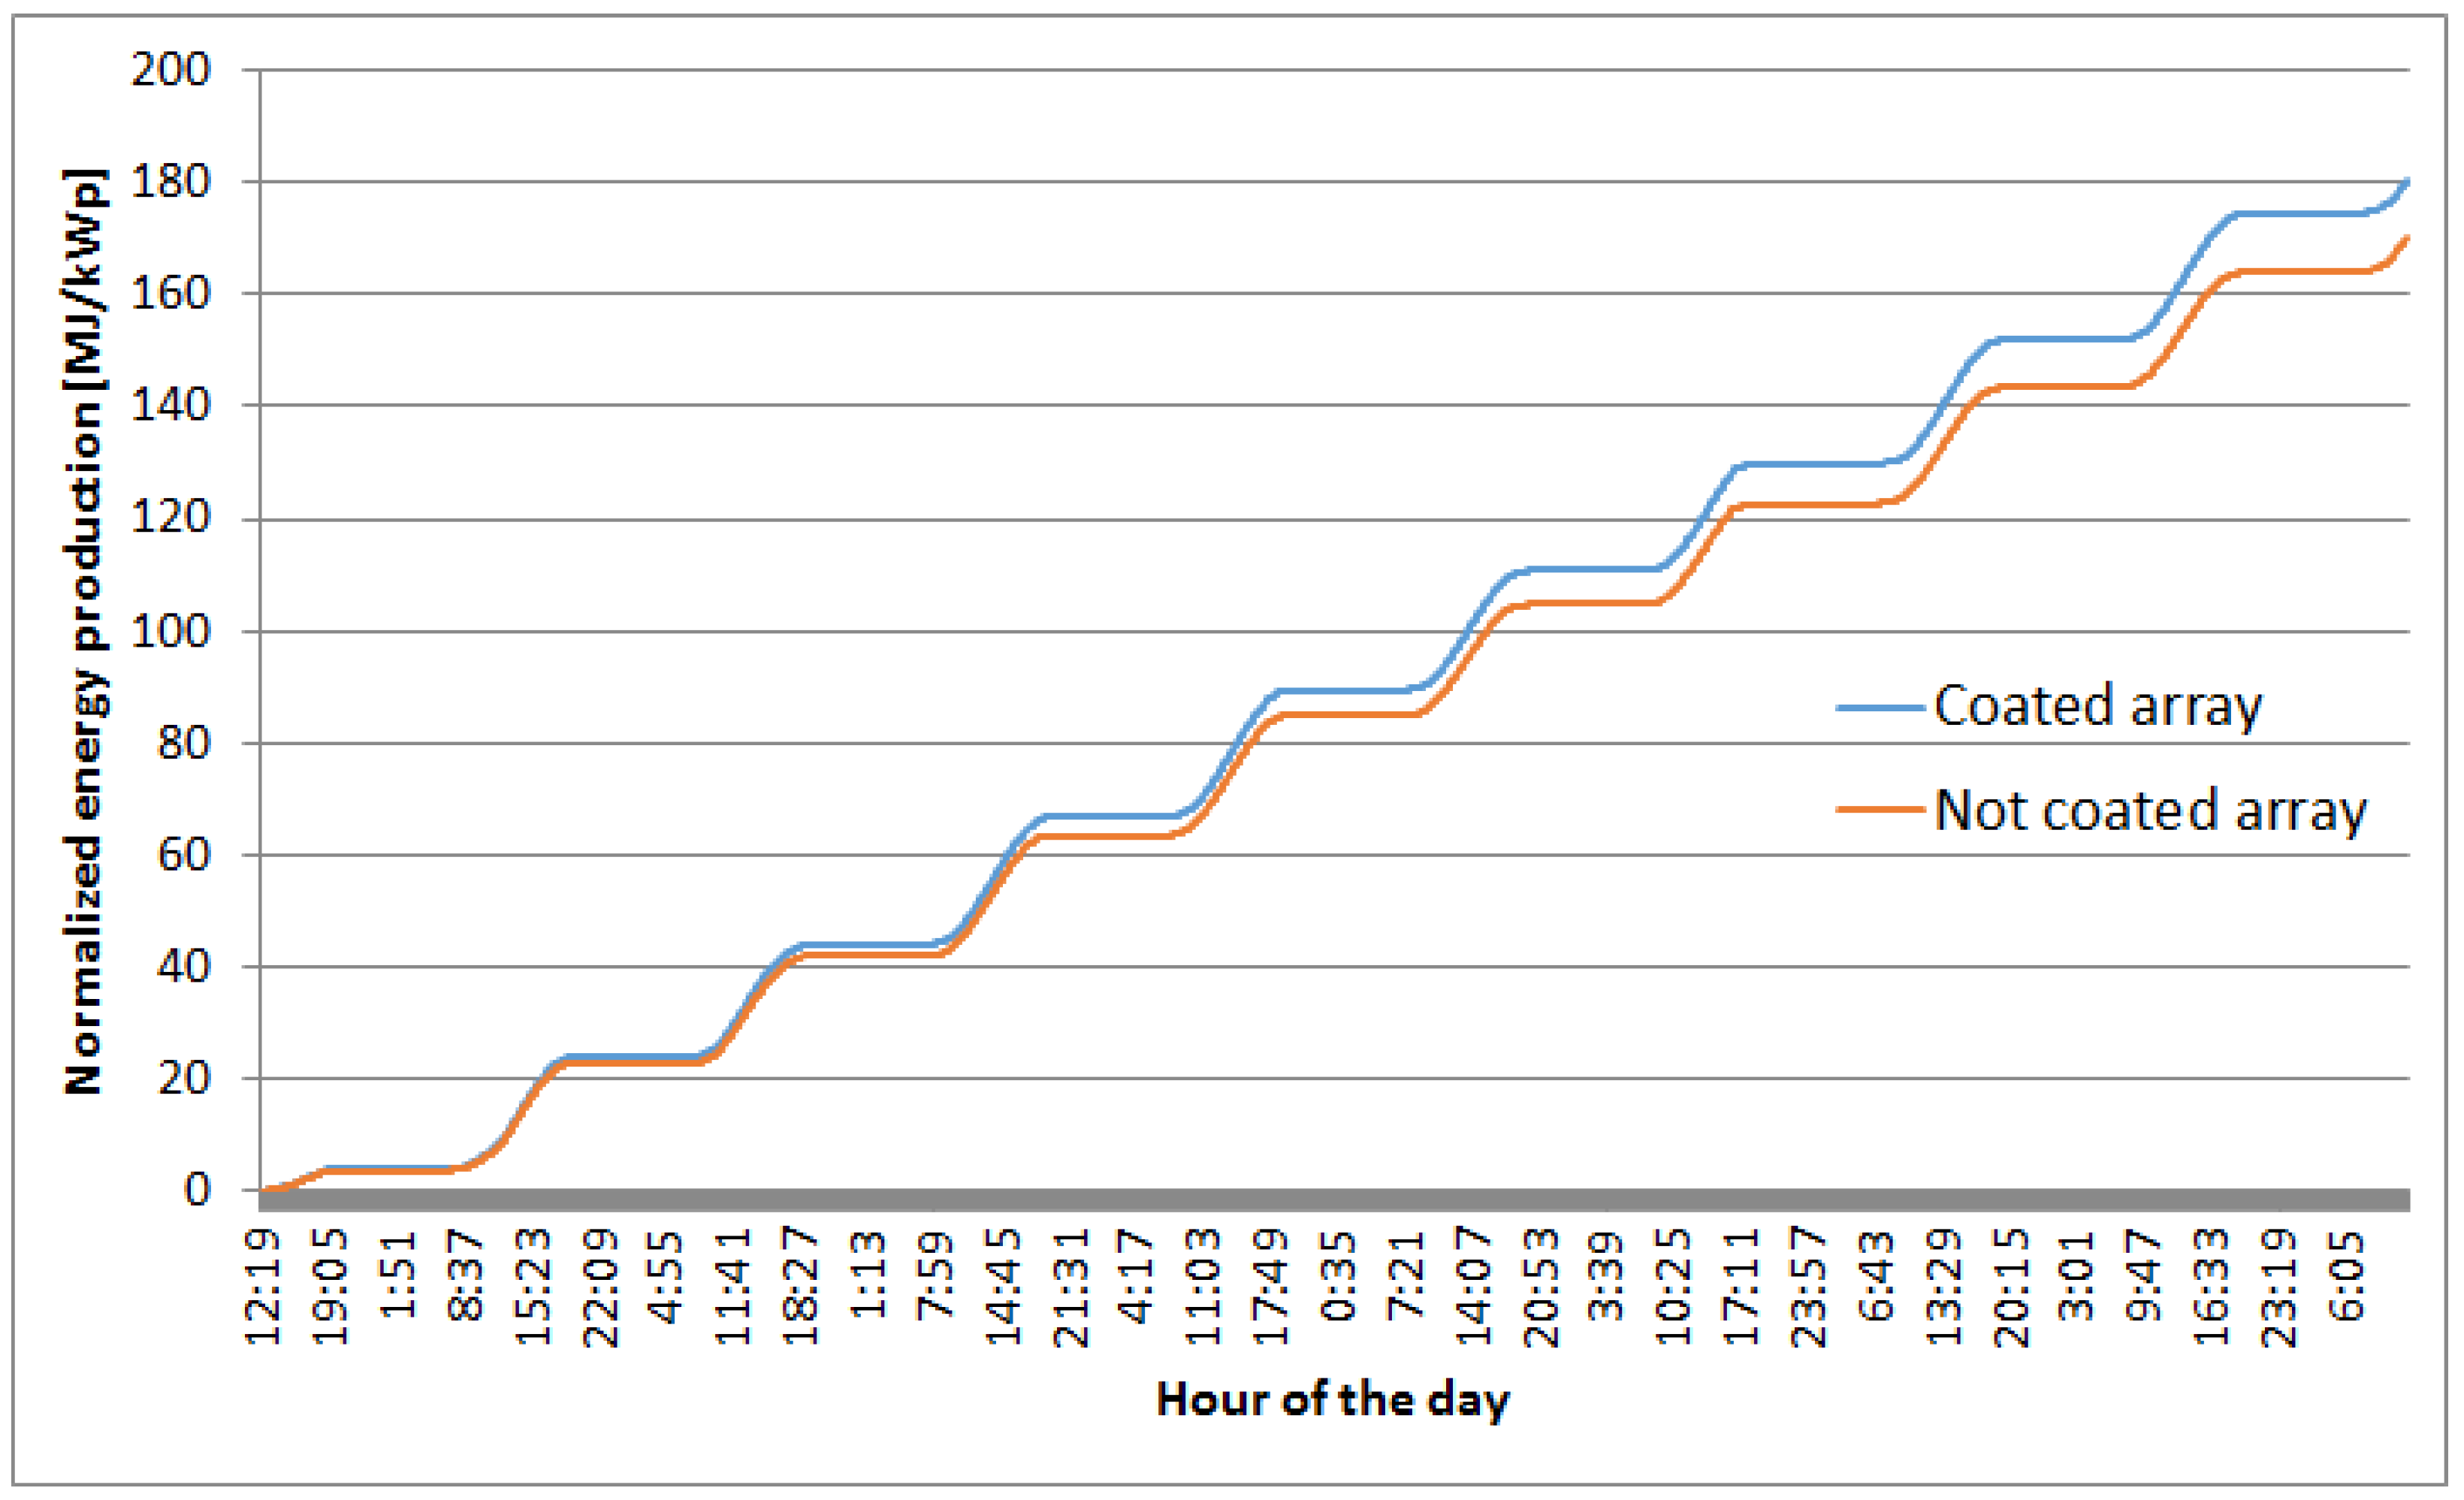
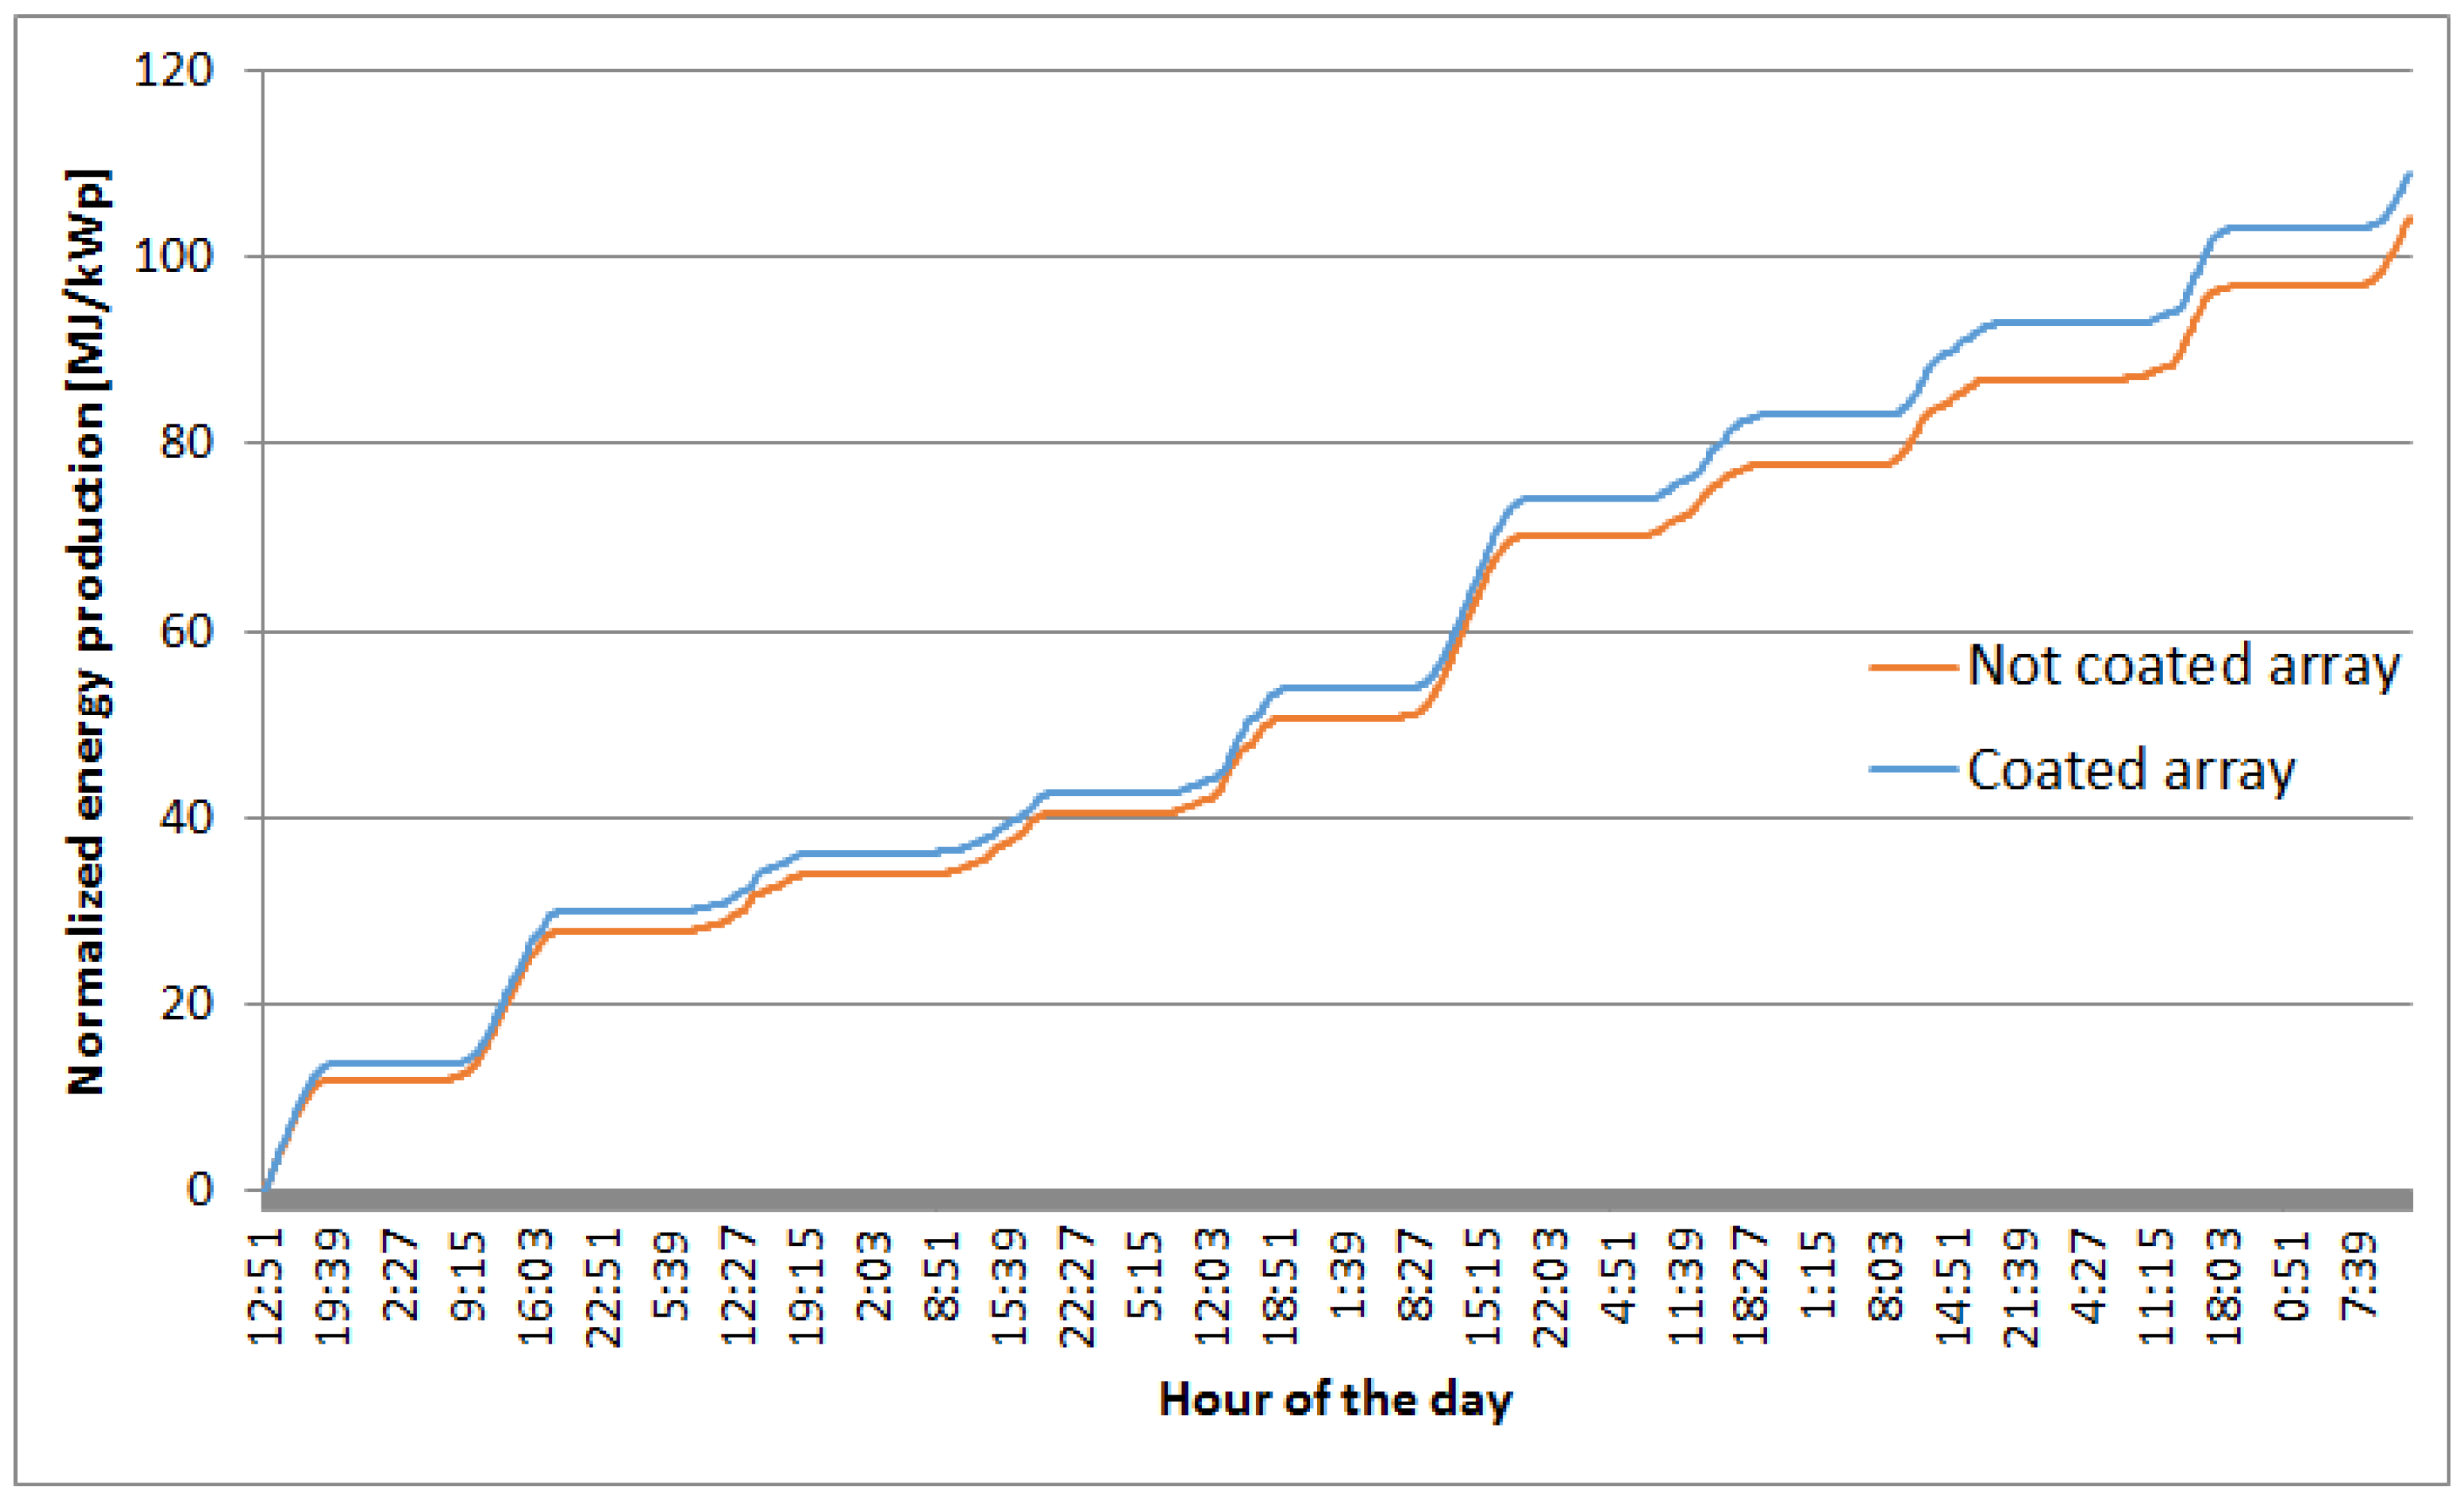
3.2. PV Arrays Energy Production and Efficiency

Figure 6 and Figure 7 show the normalized energy production of the two arrays during the monitoring campaigns. The orange line indicates the energy related to the not coated array and the blue line indicates the energy related to the coated one. Figure 6 shows the normalized energy production during the first monitoring campaign (April). Figure 7 shows the normalized energy production during the second monitoring campaign (September). In both cases, the normalized energy boost given by the coating is noticeable even if not so impressive.
Table 1 summaries the results concerning the electrical energy production and the conversion efficiency of the two arrays during the monitoring campaigns. The first array is the coated one and it has a greater performance in comparison with the second array. During the first campaign, characterized by high solar radiation, the coating increased the normalized electrical productivity by 5.97% and the conversion efficiency by 1.82%. This result is interesting because it is evaluated with normalized data so it can be assumed to be valid also for PV plants with higher peak power where even a productivity gain of almost 2% can significantly increase the economic yield. The results of the second monitoring campaign were less interesting because the normalized energy gain was 4.73% and the efficiency gain was 0.69%. This lower coating performance was due probably to several factors: aging of the coating, lower radiation during the monitoring campaign, or panel fouling.
The last phenomenon was not recognized by a visual inspection. Furthermore, it is neither representative nor economically sustainable to presume that the average user will schedule a cleaning maintenance every five months. The coating has one-year weather resistance; thus, the best way to proceed is the following: wash the PV plant once a year and apply the coating after washing. Thus, the advantages of the cleaning and the coating on the energy productivity are summarized under this assumption. To understand the solar radiation effects on the coating performance, an evaluation of the arrays energy production and efficiency in a cloudy day and a sunny day during the first campaign was done. Table 2 summarizes the results concerning the electrical energy production and the conversion efficiency of the two arrays during the first day of the monitoring campaign, when the weather was cloudy and the fourth day of the monitoring campaign when the weather was sunny. During sunny days, the coating effect is more evident; in fact, the efficiency gain on the sunny day was 1.53%, while during the cloudy day the efficiency gain was only 1%. This phenomenon is probably due to the modules’ higher conversion efficiency during the cloudy days with respect to the sunny days (contrary to what happens to the panels’ productivity). Table 2 reports a PV arrays conversion efficiency of about 14% on the cloudy day and 13% on the sunny day. This is probably given by the temperature of the modules that it is lower during cloudy days due to the low temperature of the air and the low radiation. In addition, the Linuo modules are composed of multi-crystalline solar cells that have a good conversion efficiency with a diffuse radiation, typical of cloudy days. All these considerations consolidate the utilization of the coating on big PV plants with high solar radiation during the year. In fact, even if the efficiency is higher on cloudy days, sunny days show greater energy gain differences between coated and uncoated panels.
Figure 8 depicts the ratio between normalized electrical power output of the first (coated) array and the normalized electrical power output of the second (not coated) array during two sunny days of the first monitoring campaign. The ratio was calculated as follows:
r j = P 1 , j β 1 P p k , 1 P 2 , j β 2 P p k , 2
where P 1 , j [W] is the instantaneous power produced by the first (coated) array during the jth experimental campaign; P p k , 1 [kW p ] is the peak power of the first (coated) array; β 1 is a correction factor applied to the first (coated) array; P 2 , j [W] is the instantaneous power produced by the second (uncoated) array during the jth experimental campaign; P p k , 2 [kW p ] is the peak power of the second (uncoated) array; and β 2 is a correction factor applied to the second (uncoated) array. The ratio value is slightly higher than 1 during the entire day; there is a peculiar increasing during last hours of sun from 17:00 to 20:00 characterized by a lower value of the solar radiation. This is probably due to the presence of a predominant diffuse radiation instead of direct radiation. With diffuse radiation, the coating effect on the solar panel is more effective because the modules have a greater conversion efficiency. The coating behavior during the early morning is not significant because the plant has an orientation of 35 degree south and the sun in the morning is not irradiating homogeneously the two arrays.
Concerning the aging effect, it can be noted that, comparing cloudy days in the first and second monitoring campaigns, the conversion efficiency gain was reduced from 1.82% to 0.69% in five months. This is an expected result; in fact, the coating producer declares a one-year weather resistance of their product.

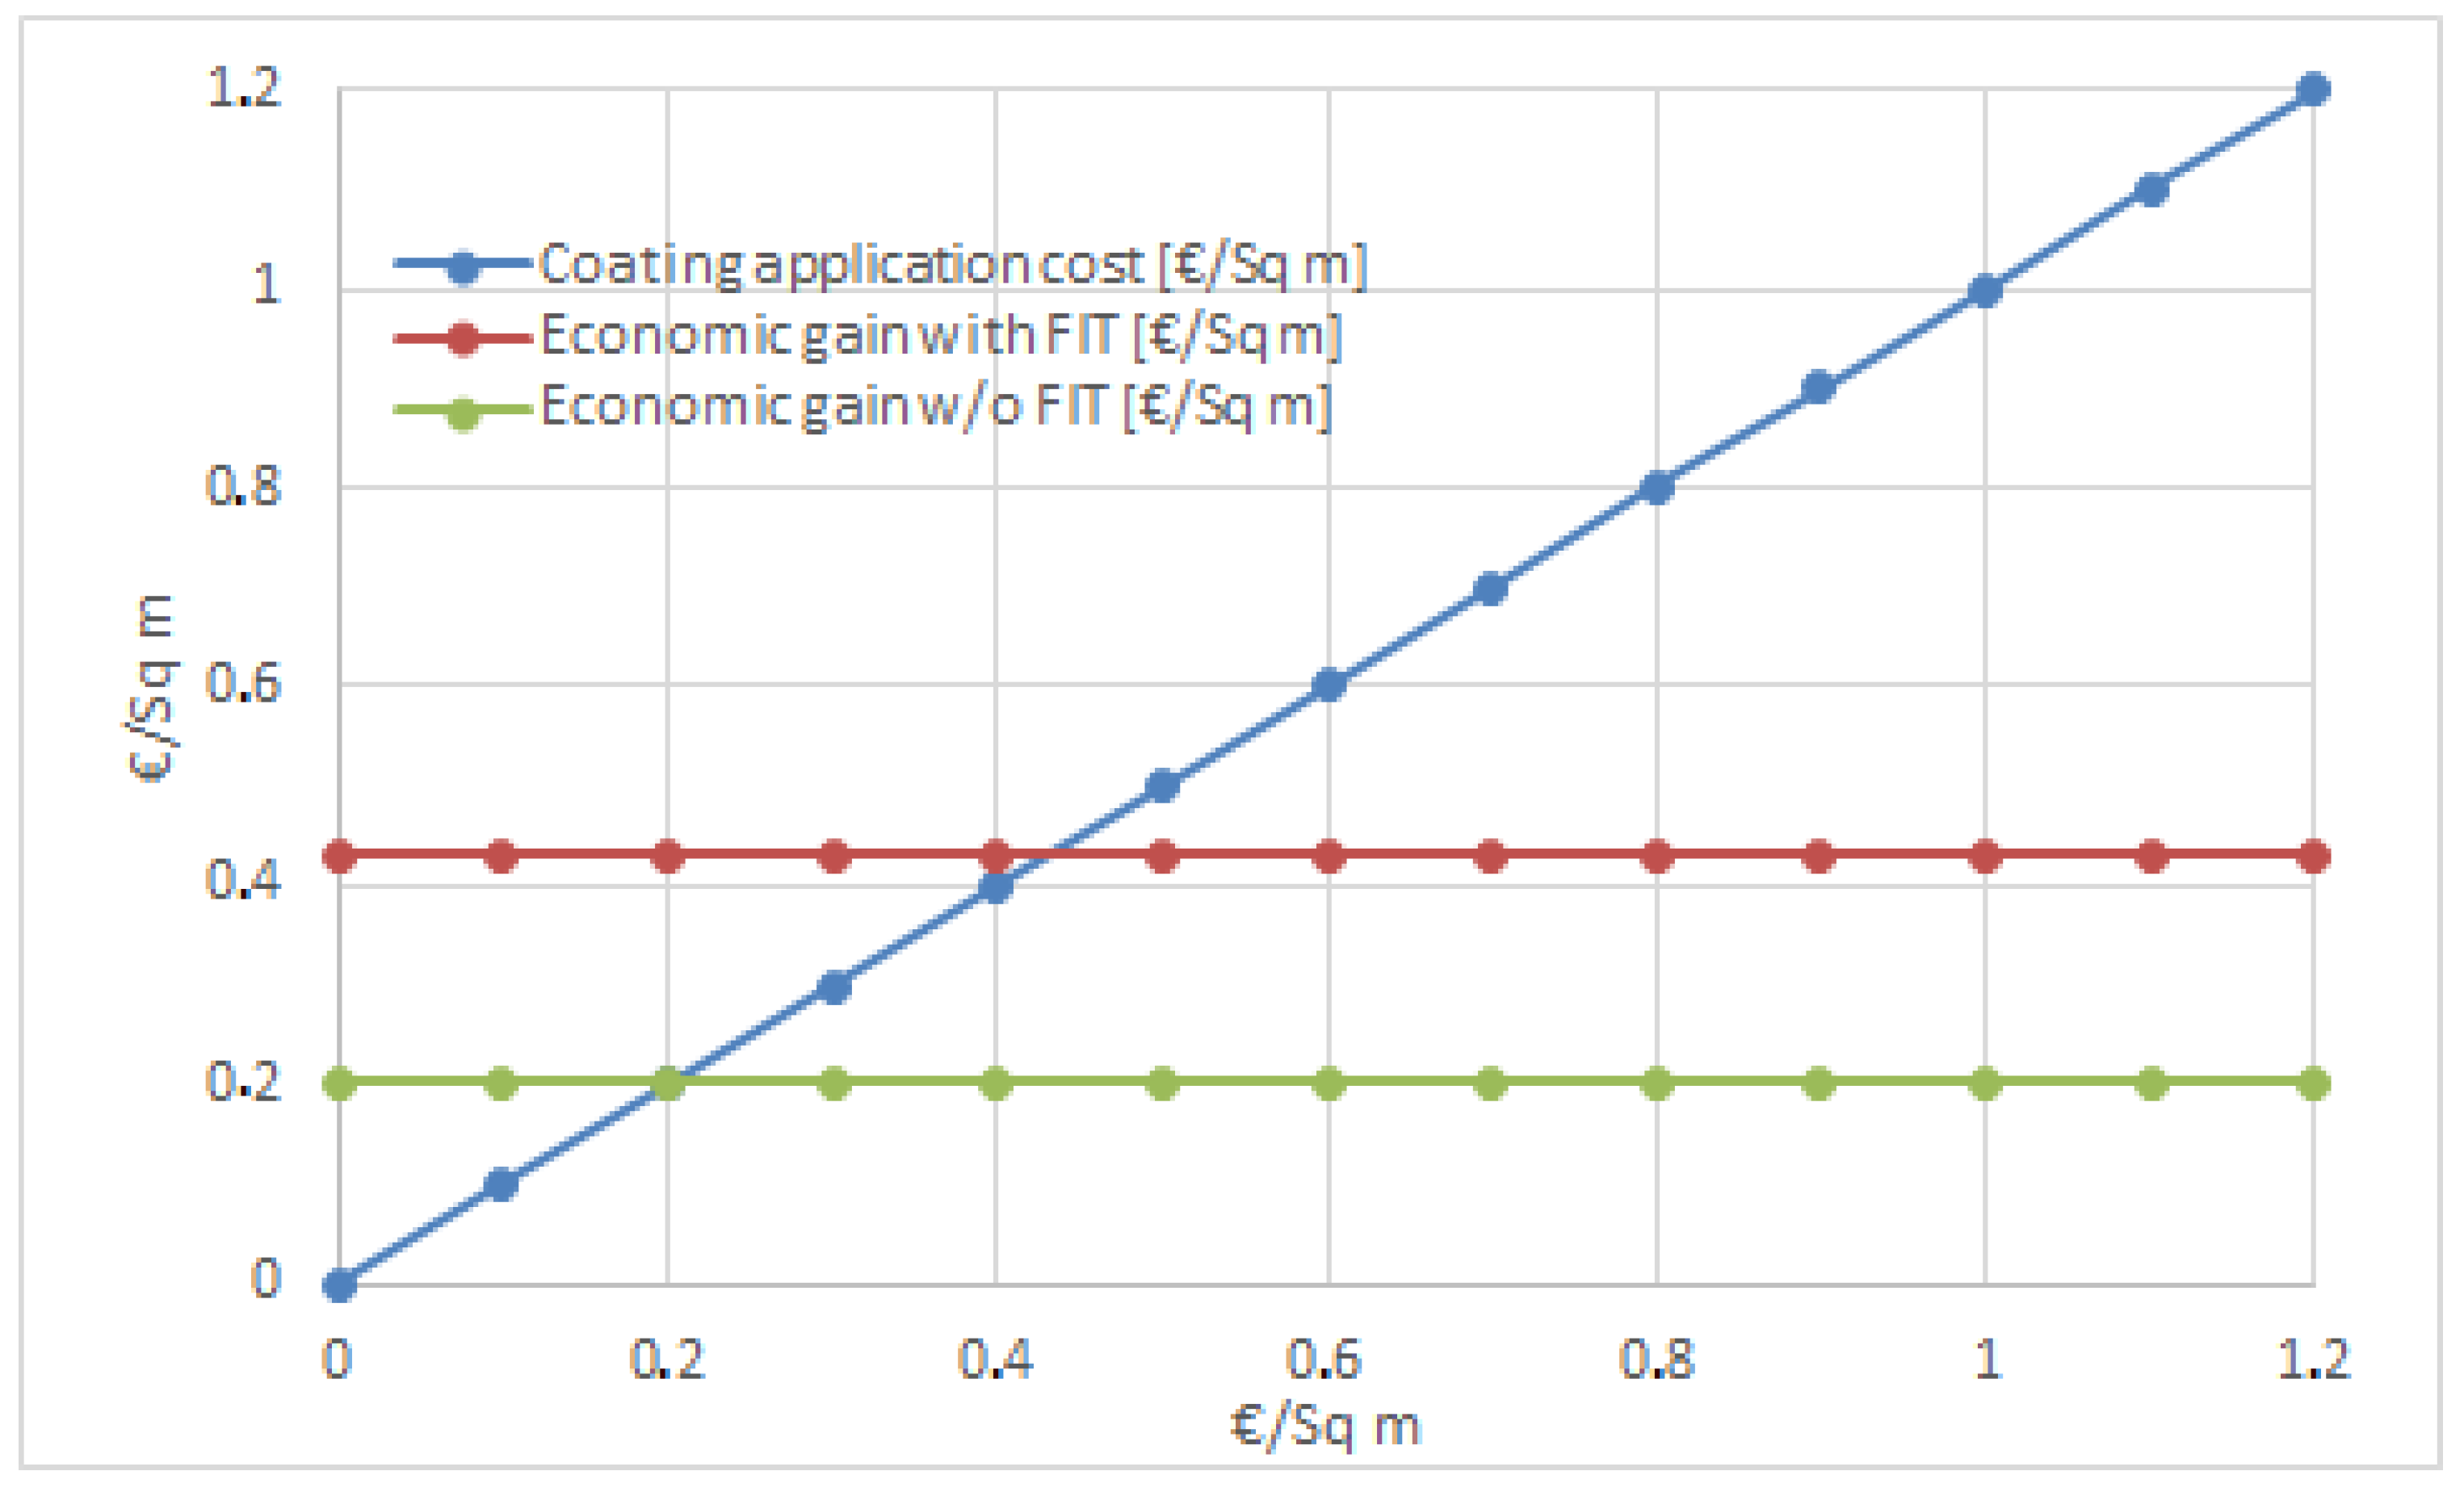
3.3. Technical-Economical Analysis

To evaluate the economic feasibility of the coating applied on solar panels, the economic incoming using the coating was calculated. The following rules were considered:
  • The coating is applied every year after panel washing.
  • The coating increases the annual power plant energy production by 0.6% on average.
  • The FV power plant benefits from a Feed In Tariff (FIT) incentive for the electrical energy produced. A value of 0.227 € per kWh was considered.
  • The energy produced by the PV plant is mainly self consumed by the electrical user. A economic value of 0.2 € per kWh of self consumed electrical energy from the PV plant was considered.
  • The PV plant considered has an annual PV energy production of 1200 kWh/kWp and it has an active surface area of 34.44 square meters.
The increase of the economic income given by the coating application was calculated by multiplying the increase of PV plant energy production by the sum of the FIT with the economic value of the self consumed energy. Figure 9 shows the increases of the economic income with and without FIT incentives normalized per PV plant area. The blue line represents the cost of the coating application and, where the blue line crosses the red and green lines, there is a balance between cost of the coating and increase of the economic earnings. The coating will increase the economic gain by 0.43 € per square meter in the case of FIT incentives and self consumed energy and by 0.20 € per square meter without FIT (only self consumed energy). Currently, the cost of the coating application does not balance the income because it is about 1 € per square meter. However, this cost can be lowered by an increase of the coating production volume. Moreover, the energy production gain will be greater in sub-Mediterranean zones where the irradiation is higher than central Europe zones. The application of the coating in sub-Mediterranean zones is probably already economically viable with the current cost of the coating.

4. Conclusions

The monitoring campaigns show that the nano-coating is effective for high solar radiation conditions and it decreases its performance during the declared year of life. The maximum energy gain achieved is 1.82% immediately after the application of the coating on the solar panels with high solar radiation.After five months, during the second monitoring campaign, the energy gain evaluated was 0.69%. Using a linear approximation, an average annual increase of the PV energy production of 0.6% was calculated. The cost–benefit analysis related to the coating application shows that the coating application is not convenient in the PV power plant object of this study as a result of the high coating cost with respect to the low increase of the electrical energy produced. In fact, the economic gain with the coating is 0.43 € versus the coating application cost of 1 € per square meter. However, large scale applications of the coating will decrease the coating application cost providing a wide market diffusion. Therefore, this nano-composite coating must not be intended for photovoltaic panels self-maintenance because it loses its effect progressively in a year. On the other hand, the coating can be an interesting method to increase the PV plant performance as it can be applied after a PV plant washing with yearly based schedule, especially in sandy and dusty zones. The coating can also be applied on new PV panels to increase their performance in terms of energy efficiency and anti-fouling behavior.

Author Contributions

Conceptualization, S.P., G.A. and A.M.; methodology, S.P. and G.A.; data curation, S.P.; writing–original draft preparation, S.P.; writing–review and editing, A.M. and G.A.; visualization, G.A.; supervision, A.M.

Funding

This research received no external funding.

Acknowledgments

The authors wish to thank Matteo Barozzi, of Barozzi Vernici Srl, and Umberto Bino, of SWISSnanotech SA, for having supported this study by providing the coating and its application.

Conflicts of Interest

The authors declare no conflict of interest.

References

  1. IEA. Renewable Energy Medium-Term Market Report 2016; IEA PUBLICATIONS: Paris, France, 2016. [Google Scholar]
  2. Rajesh, R.; Mabel, M.C. A comprehensive review of photovoltaic systems. Renew. Sustain. Energy Rev. 2015, 51, 231–248. [Google Scholar] [CrossRef]
  3. Bucciarelli, L.L. Power loss in photovoltaic arrays due to mismatch in cell characteristics. Sol. Energy 1979, 23, 277–288. [Google Scholar] [CrossRef]
  4. Charles, E.; Lehman, E.; Zoellick, J.; Pauletto, G. Effects of mismatch losses in photovoltaic arrays. Sol. Energy 1995, 54, 165–171. [Google Scholar]
  5. Iannone, F.; Noviello, G.; Sarno, A. Monte Carlo techniques to analyse the electrical mismatch losses. Sol. Energy 1997, 62, 85–92. [Google Scholar] [CrossRef]
  6. MacAlpine, S.; Deline, C.; Erickson, R.; Brandemuehl, M. Module Mismatch Loss and Recoverable Power in Unshaded PV Installations. In Proceedings of the 38th IEEE Photovoltaic Specialists Conference (PVSC), Austin, TX, USA, 3–8 June 2012. [Google Scholar]
  7. MacAlpine, S.; Brandemuehl, M.; Erickson, R. Beyond the Module Model and Into the Array: Mismatch in Series Strings. In Proceedings of the 38th IEEE Photovoltaic Specialists Conference (PVSC), Austin, TX, USA, 3–8 June 2012. [Google Scholar]
  8. Wurster, T.S.; Schubert, M.B. Mismatch loss in photovoltaic systems. Sol. Energy 2014, 105, 505–511. [Google Scholar] [CrossRef]
  9. Lorente, D.G.; Pedrazzi, S.; Zini, G.; Rosa, A.D.; Tartarini, P. Mismatch losses in PV power plants. Sol. Energy 2014, 100, 42–49. [Google Scholar] [CrossRef]
  10. Fouad, M.; Shihata, L.A.; Morgan, E.I. An integrated review of factors influencing the performance of photovoltaic panels. Renew. Sustain. Energy Rev. 2017, 80, 1499–1511. [Google Scholar] [CrossRef]
  11. De Vos, A. Thermodynamics of Photovoltaics. In Thermodynamics of Energy Conversion and Transport; Sieniutycz, S., De Vos, A., Eds.; Springer: New York, NY, USA, 2000; pp. 49–71. [Google Scholar] [CrossRef]
  12. Kaushik, S.; Rawat, R.; Manikandan, S. An innovative thermodynamic model for performance evaluation of photovoltaic systems: Effect of wind speed and cell temperature. Energy Convers. Manag. 2017, 136, 152–160. [Google Scholar] [CrossRef]
  13. Siecker, J.; Kusakana, K.; Numbi, B. A review of solar photovoltaic systems cooling technologies. Renew. Sustain. Energy Rev. 2017, 79, 192–203. [Google Scholar] [CrossRef]
  14. Said, S. Effects of dust accumulation on performances of thermal and photovoltaic flat-plate collectors. Appl. Energy 1990, 37, 73–84. [Google Scholar] [CrossRef]
  15. Maghami, M.R.; Hizam, H.; Gomes, C.; Radzi, M.A.; Rezadad, M.I.; Hajighorbani, S. Power loss due to soiling on solar panel: A review. Renew. Sustain. Energy Rev. 2016, 59, 1307–1316. [Google Scholar] [CrossRef]
  16. Appels, R.; Lefevre, B.; Herteleer, B.; Goverde, H.; Beerten, A.; Paesen, R.; Medts, K.D.; Driesen, J.; Poortmans, J. Effect of soiling on photovoltaic modules. Sol. Energy 2013, 96, 283–291. [Google Scholar] [CrossRef]
  17. Pedersen, H.; Strauss, J.; Selj, J. Effect of Soiling on Photovoltaic Modules in Norway. Energy Procedia 2016, 92, 585–589. [Google Scholar] [CrossRef]
  18. Mejia, F.A.; Kleissl, J. Soiling losses for solar photovoltaic systems in California. Sol. Energy 2013, 95, 357–363. [Google Scholar] [CrossRef]
  19. Sarver, T.; Al-Qaraghuli, A.; Kazmerski, L.L. A comprehensive review of the impact of dust on the use of solar energy: History, investigations, results, literature, and mitigation approaches. Renew. Sustain. Energy Rev. 2013, 22, 698–733. [Google Scholar] [CrossRef]
  20. You, S.; Lim, Y.J.; Dai, Y.; Wang, C.H. On the temporal modelling of solar photovoltaic soiling: Energy and economic impacts in seven cities. Appl. Energy 2018, 228, 1136–1146. [Google Scholar] [CrossRef]
  21. Piliougine, M.; Cañete, C.; Moreno, R.; Carretero, J.; Hirose, J.; Ogawa, S.; de Cardona, M.S. Comparative analysis of energy produced by photovoltaic modules with anti-soiling coated surface in arid climates. Appl. Energy 2013, 112, 626–634. [Google Scholar] [CrossRef]
  22. Lu, H.; Lu, L.; Wang, Y. Numerical investigation of dust pollution on a solar photovoltaic (PV) system mounted on an isolated building. Appl. Energy 2016, 180, 27–36. [Google Scholar] [CrossRef]
  23. Lu, H.; Zhao, W. Effects of particle sizes and tilt angles on dust deposition characteristics of a ground-mounted solar photovoltaic system. Appl. Energy 2018, 220, 514–526. [Google Scholar] [CrossRef]
  24. Toth, S.; Muller, M.; Miller, D.C.; Moutinho, H.; To, B.; Micheli, L.; Linger, J.; Engtrakul, C.; Einhorn, A.; Simpson, L. Soiling and cleaning: Initial observations from 5-year photovoltaic glass coating durability study. Sol. Energy Mater. Sol. Cells 2018, 185, 375–384. [Google Scholar] [CrossRef]
  25. Sayyah, A.; Horenstein, M.N.; Mazumder, M.K. Energy yield loss caused by dust deposition on photovoltaic panels. Sol. Energy 2014, 107, 576–604. [Google Scholar] [CrossRef]
  26. Chen, E.Y.T.; Ma, L.; Yue, Y.; Guo, B.; Liang, H. Measurement of dust sweeping force for cleaning solar panels. Sol. Energy Mater. Sol. Cells 2018, 179, 247–253. [Google Scholar] [CrossRef]
  27. Quan, Y.Y.; Zhang, L.Z. Experimental investigation of the anti-dust effect of transparent hydrophobic coatings applied for solar cell covering glass. Sol. Energy Mater. Sol. Cells 2017, 160, 382–389. [Google Scholar] [CrossRef]
  28. Son, J.; Kundu, S.; Verma, L.K.; Sakhuja, M.; Danner, A.J.; Bhatia, C.S.; Yang, H. A practical superhydrophilic self cleaning and antireflective surface for outdoor photovoltaic applications. Sol. Energy Mater. Sol. Cells 2012, 98, 46–51. [Google Scholar] [CrossRef]
  29. Sutha, S.; Suresh, S.; Raj, B.; Ravi, K. Transparent alumina based superhydrophobic self–cleaning coatings for solar cell cover glass applications. Sol. Energy Mater. Sol. Cells 2017, 165, 128–137. [Google Scholar] [CrossRef]
  30. Prabhu, S.; Cindrella, L.; Kwon, O.J.; Mohanraju, K. Superhydrophilic and self-cleaning rGO-TiO2 composite coatings for indoor and outdoor photovoltaic applications. Sol. Energy Mater. Sol. Cells 2017, 169, 304–312. [Google Scholar] [CrossRef]
  31. Rifai, A.; Abu-Dheir, N.; Khaled, M.; Al-Aqeeli, N.; Yilbas, B.S. Characteristics of oil impregnated hydrophobic glass surfaces in relation to self-cleaning of environmental dust particles. Sol. Energy Mater. Sol. Cells 2017, 171, 8–15. [Google Scholar] [CrossRef]
Figure 1. PV power plant.
Energies 11 03448 g001
Figure 2. Delta Ohm photometer model LP471-PYRA-02-10.
Energies 11 03448 g002
Figure 3. Coating effect on panel surface.
Energies 11 03448 g003
Figure 4. Solar irradiance during the first monitoring campaign.
Energies 11 03448 g004
Figure 5. Solar irradiance during the second monitoring campaign.
Energies 11 03448 g005
Figure 6. Normalized energy production during the first monitoring campaign.
Energies 11 03448 g006
Figure 7. Normalized energy production during the second monitoring campaign.
Energies 11 03448 g007
Figure 8. Ratio of the normalized electrical power of the first (coated) array to that of the second (uncoated) array during during two sunny days of the first monitoring campaign.
Energies 11 03448 g008
Figure 9. Coating application cost vs. coating economic gains with and without FIT.
Energies 11 03448 g009
Table 1. PV arrays’ energy production and conversion efficiency during the first ( j = 1 ) and second ( j = 2 ) campaign.
Variablei = 1, j = 1i = 2, j = 1i = 1, j = 2i = 2, j = 2
Electrical energy E i , j [MJ]438.05391.39265238.54
Correction factor β i [ad]0.961
Electrical energy normalized E i , j , n o r [MJ/kW p ]180.33170.17109.08104.15
Energy gain Δ E j , n o r [%]5.974.73
Conversion efficiency η i , j [%]1312.7713.2213.13
Efficiency gain Δ η j 1.820.69
Table 2. PV arrays’ energy production and conversion efficiency during a sunny and a cloudy day of the first campaign.
Variablei = 1, Cloudsi = 2, Cloudsi = 1, Suni = 2, Sun
Electrical energy E i , j [MJ]9.848.8654.9949.23
Correction factor β i [ad]0.961
Electrical energy normalized E i , j , n o r [MJ/kW p ]4.053.8522.6421.40
Energy gain Δ E j , n o r [%]5.195.79
Conversion efficiency η i , j [%]14.214.0613.1712.97
Efficiency gain Δ η j 11.53

