Article

Effect of Clay Mineral Composition on Low-Salinity Water Flooding

Research Institute of Petroleum Exploration and Development, PetroChina, Beijing 100083, China
*
Author to whom correspondence should be addressed.
Energies 2018, 11(12), 3317; https://doi.org/10.3390/en11123317
Submission received: 15 October 2018 / Revised: 22 November 2018 / Accepted: 23 November 2018 / Published: 28 November 2018
(This article belongs to the Special Issue Flow and Transport Properties of Unconventional Reservoirs 2018)

Abstract

:
Low-salinity water (LSW) flooding technology has obvious operational and economic advantages, so it is applied to practice in many oilfields. However, there are differences in the oil recovery efficiencies in different oilfields, the reasons for which need to be further studied and discussed. This paper studies the effect of different clay mineral compositions on low-salinity water flooding. For this purpose, three groups of core displacement experiments were designed with cores containing different clay mineral compositions for comparison. In the process of formation water and low-salinity water driving, the oil recovery and produced-water properties were measured. By comparing the two types of water flooding, it was found that the cores with the highest montmorillonite content had the best effect (5.7%) on low-salinity water flooding and the cores with the highest kaolinite content had the least effect (1.9%). This phenomenon is closely related to the difference in ion exchange capacity of the clay minerals. Moreover, after switching to low-salinity water flooding, the interfacial tension and wetting angle of the produced-water increased and the value of pH decreased, which are important mechanisms for enhancing oil recovery by low-salinity water flooding. This study reveals the influence of clay mineral composition on low-salinity water flooding and can provide more guidance for conventional and unconventional oilfield application of low-salinity water flooding technology.

1. Introduction

Compared with other enhanced oil recovery (EOR) technologies such as chemical flooding and thermal recovery, low-salinity water flooding is simple, economical and practical. Especially for unconventional reservoirs such as tight reservoirs, the general EOR methods such as polymer flooding cannot be applied because of the difficulty in injecting into such small pores, whose overpressure matrix permeability is less than 0.1 × 10⁻³ mD. On the other hand, low-salinity water flooding can enter the small pores at this scale, and the risk is low. Thus, low-salinity water flooding has great application potential in unconventional reservoirs. During the period of low oil prices, low-salinity water flooding has made great progress [1,2,3]. Martin [4] reported for the first time that decreasing the salinity of injected water improved the recovery of oil. However, this report did not get much attention until 1997 when Tang and Morrow [5] reported that the oil recovery was effectively improved by injecting low-salinity water and optimizing the composition of injected water. After that, numerous laboratory tests and field tests on low-salinity water flooding were carried out. Robertson, Lager and Seccombe [6,7,8] carried out oil field tests and achieved the desired results, confirming the feasibility of low-salinity water flooding. In 2006, Jerauld [3] found through numerical simulation that the injection of low-salinity water affected the relative permeability and formation pressure, thus changing the wettability of rock and finally improving the recovery. In 2008, Larger and others [9] proved through experiments that multicomponent ion exchange (MIE) occurs between low-salinity water injection, clay mineral surface and injected brine, thus enhancing the oil recovery. In 2010, Sorbie [10] proposed a mechanism for low-salinity water flooding, which is believed to be associated with rock porosity by low-salinity water flooding. At the same time, Rezaeidoust [11] also verified through application of low-salinity water flooding in Beihai sandstone reservoir that when the salinity of the injected water is low enough, the oil recovery can be improved. Many low-salinity water flooding experiments were carried out on limestone cores by Yousef and others [2,12,13] in 2011, and they found that continuous injection of low-salinity water can make rock more hydrophilic and improve recovery by improving pore throat connectivity. In 2015, Wu Jian [14] analyzed the oilfield experimental data and concluded that the main reason for the enhanced oil recovery effect of low-salinity water flooding is the microscopic transformation of reservoirs caused by migration of clay particles. Recently, Shehata [15] used zeta-potential measurements in low-salinity water flooding and found that chlorite and illite contributed to a smaller electrical-double-layer expansion compared to kaolinite, feldspars, montmorillonite, and muscovite. It has provoked people’s attention to the effect of clay minerals in low salinity water flooding.
Clay minerals are widely distributed in China and the types and contents of clay minerals in different reservoirs vary greatly [16,17,18], so they have an important impact on oilfield development. According to Li and Zou [19,
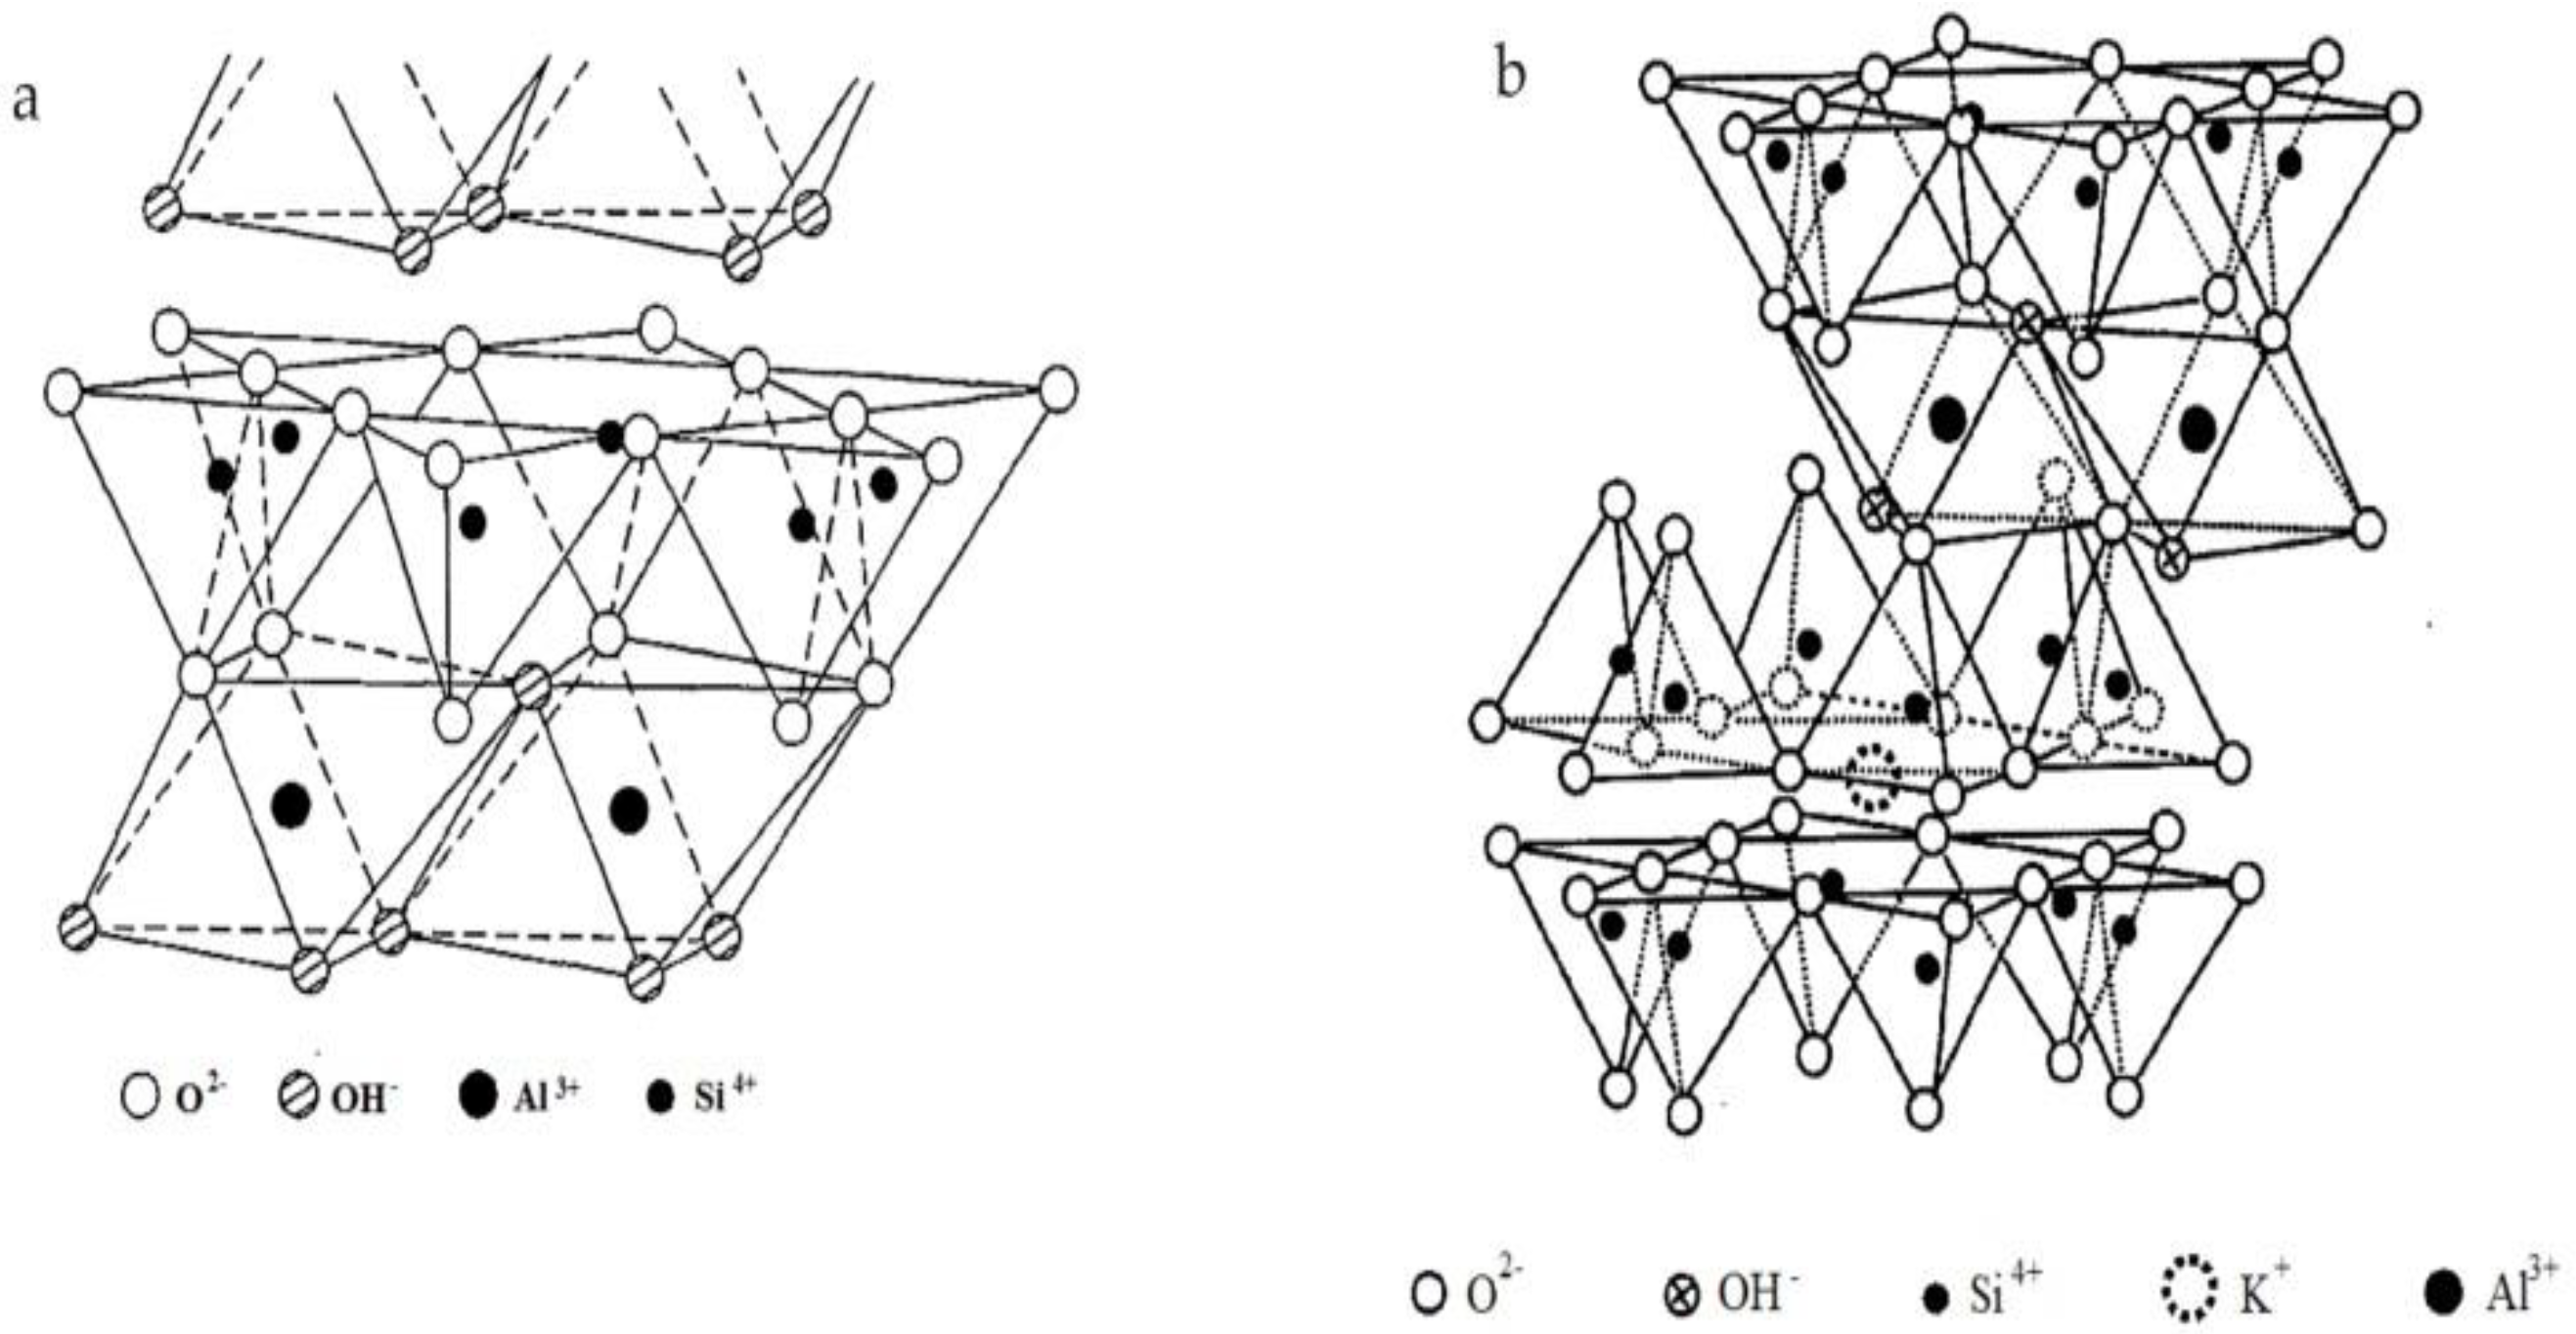
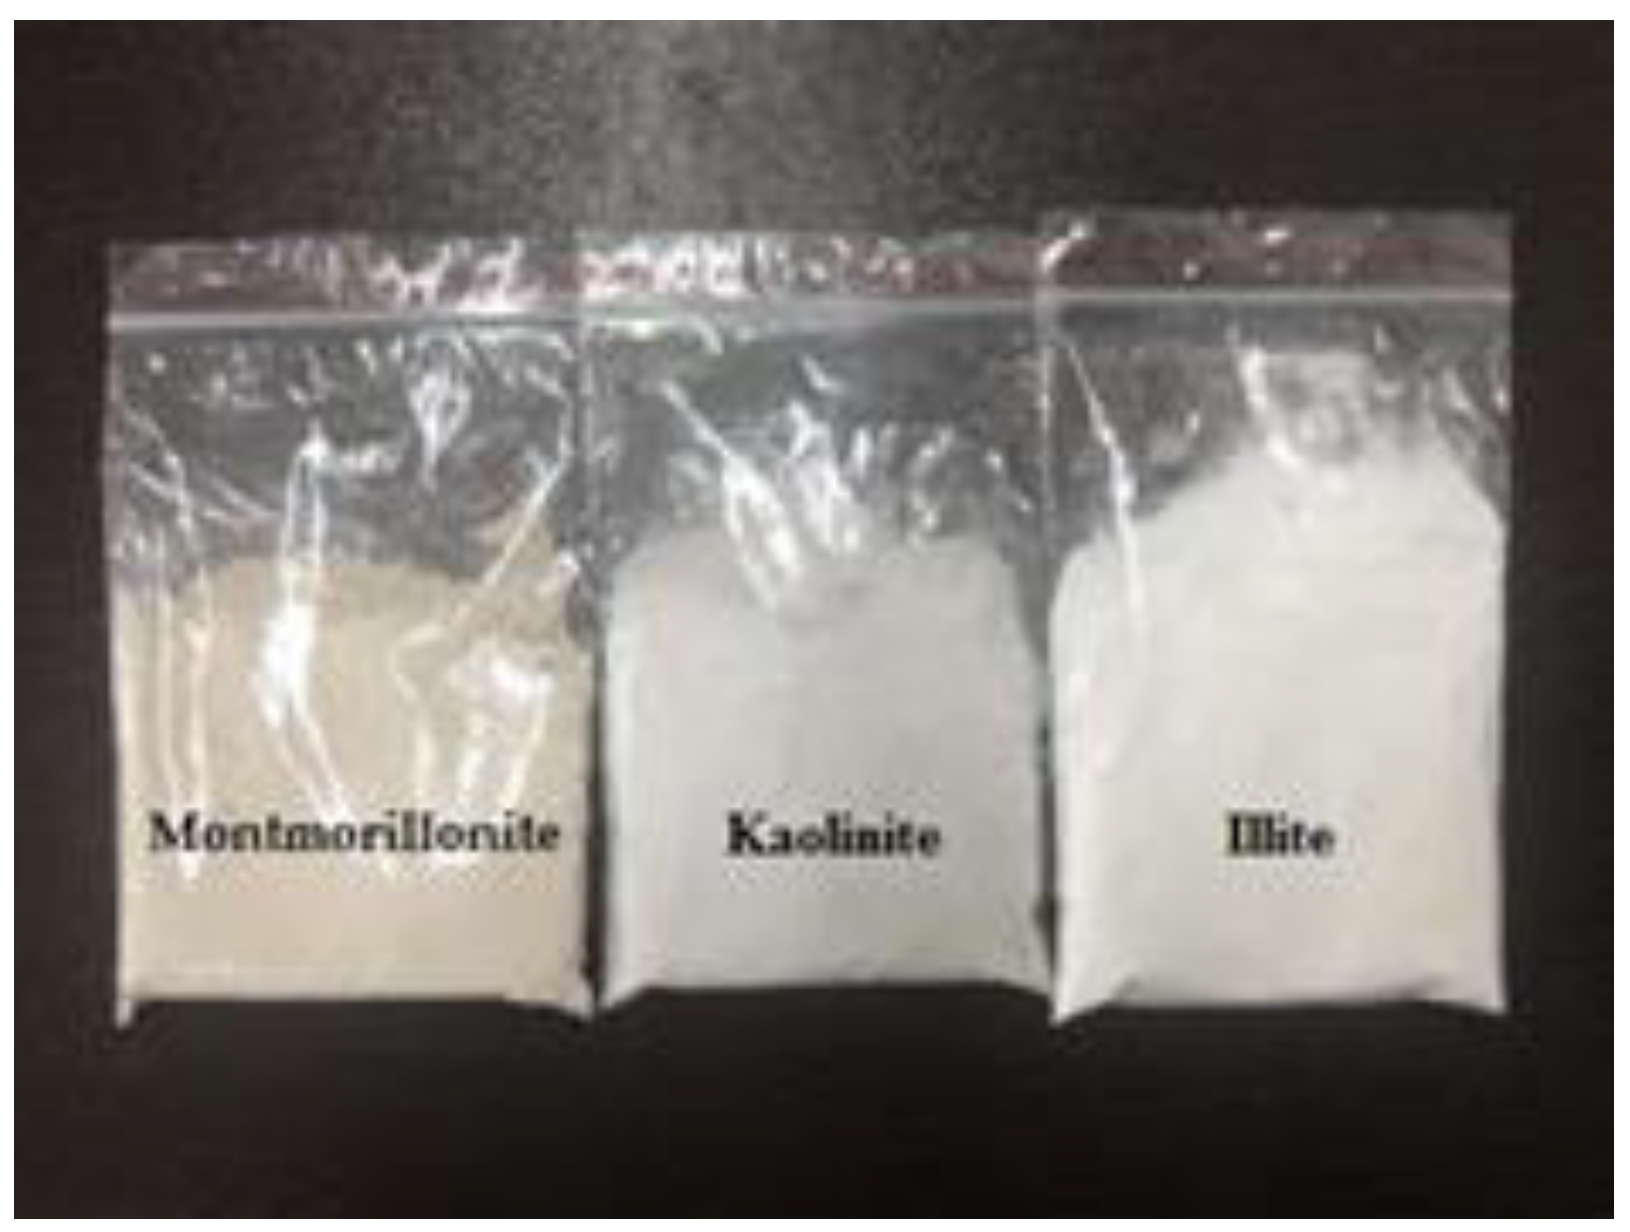
20], three main clay minerals (illite, kaolinite and montmorillonite) have very different crystal structures (Table 1), which may be the reason for their different effects on low-salinity water flooding.
Each unit of kaolinite crystal structure consists of Si-O tetrahedral sheet and A1-O/OH octahedral sheet. The head of Si-O tetrahedral sheet points to A1-O/OH octahedral sheet, and shares oxygen atoms with the A1-O/OH octahedral sheet. The layers are connected by hydrogen bonds, so that the interlayer spacing remains mainly unchanged and the expansion properties are small (Figure 1a). The interaction between atoms is strong, and desorption requires a greater chemical force.
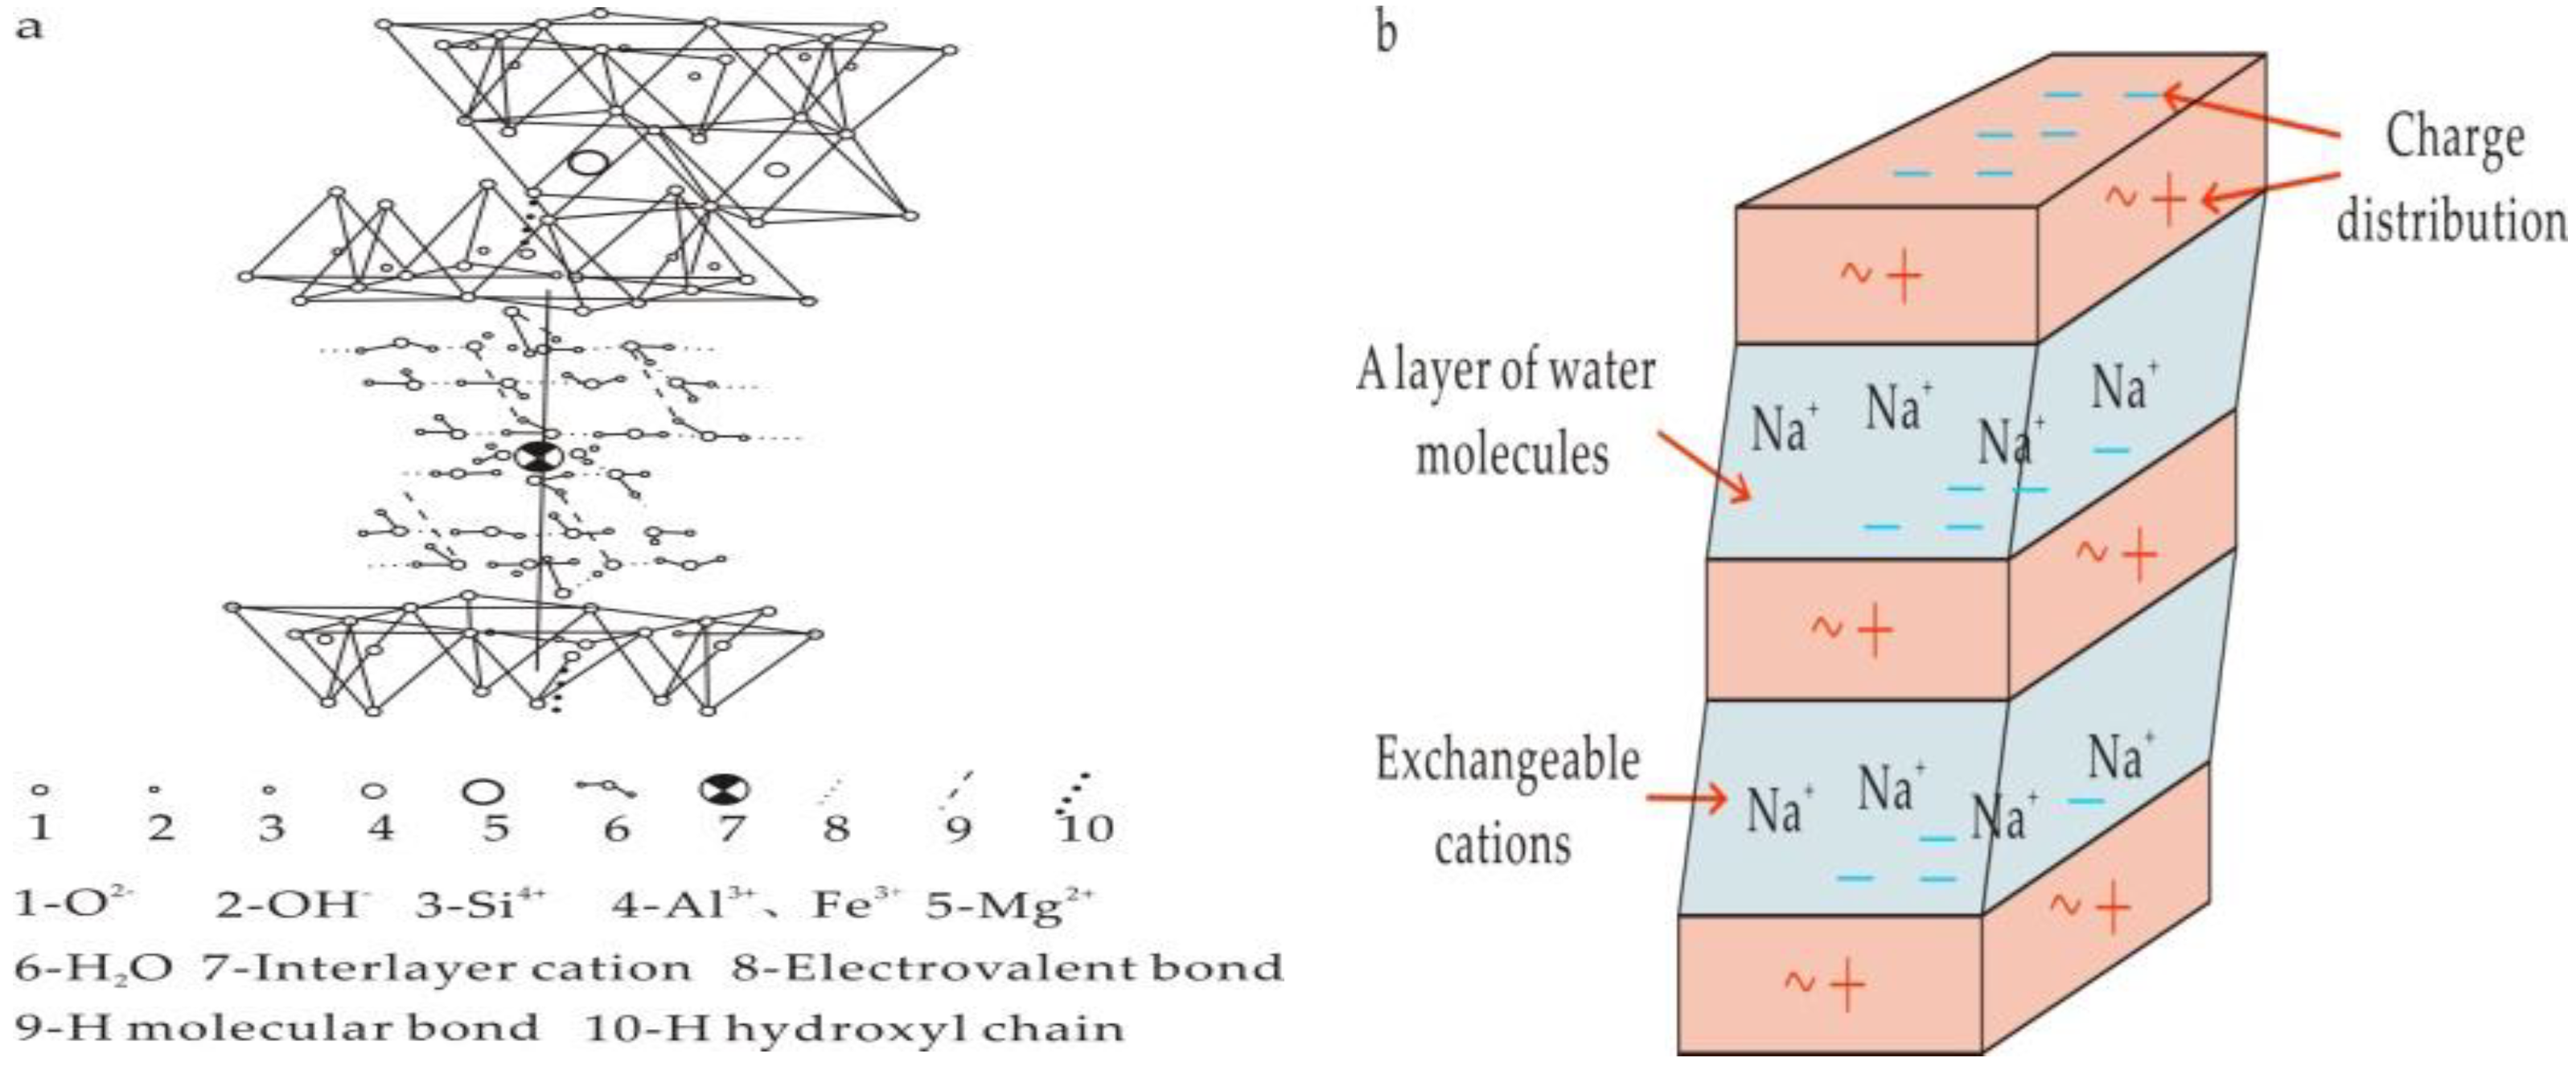
Illite is made up of two Si-O tetrahedral sheets and one A1-O/OH octahedral sheet. The octahedral sheet is between two Si-O tetrahedral sheets. The head of Si-O tetrahedral sheets points to A1-O/OH octahedral sheet, and shares Oxygen atom with A1-O/OH octahedral sheet. Approximately 1/4 of Si4+ atoms in the Si-O tetrahedron are replaced by A13+, causing a lack of positive charge. Consequently, a layer of K+ is formed between the two structural unit layers to balance the negative charge due to the displacement. During the evolution of mica into illite, K+ is easily exchanged with other cations. Therefore, Ca2+ and Mg2+ are often found in the layers of illite, and the interlayer structure of illite is not stable (Figure 1b). This property is beneficial for ion exchange on its surface.
Each unit of the montmorillonite crystal structure consists of two Si-O tetrahedral sheets and one A1-O/OH octahedral sheet. The layers are bonded by the weak van der Waals forces. Montmorillonite can absorb water and other liquids, and can adsorb cations to balance interlayer charge. The interlayer water and exchangeable cations adsorbed between two structural layers can cause the lattice to expand, and the adsorbed cations allow montmorillonite to have significant ion exchange capacity. Therefore, montmorillonite generally has less chemical force between layers and contains more Na+ or Ca2+ (Figure 2).
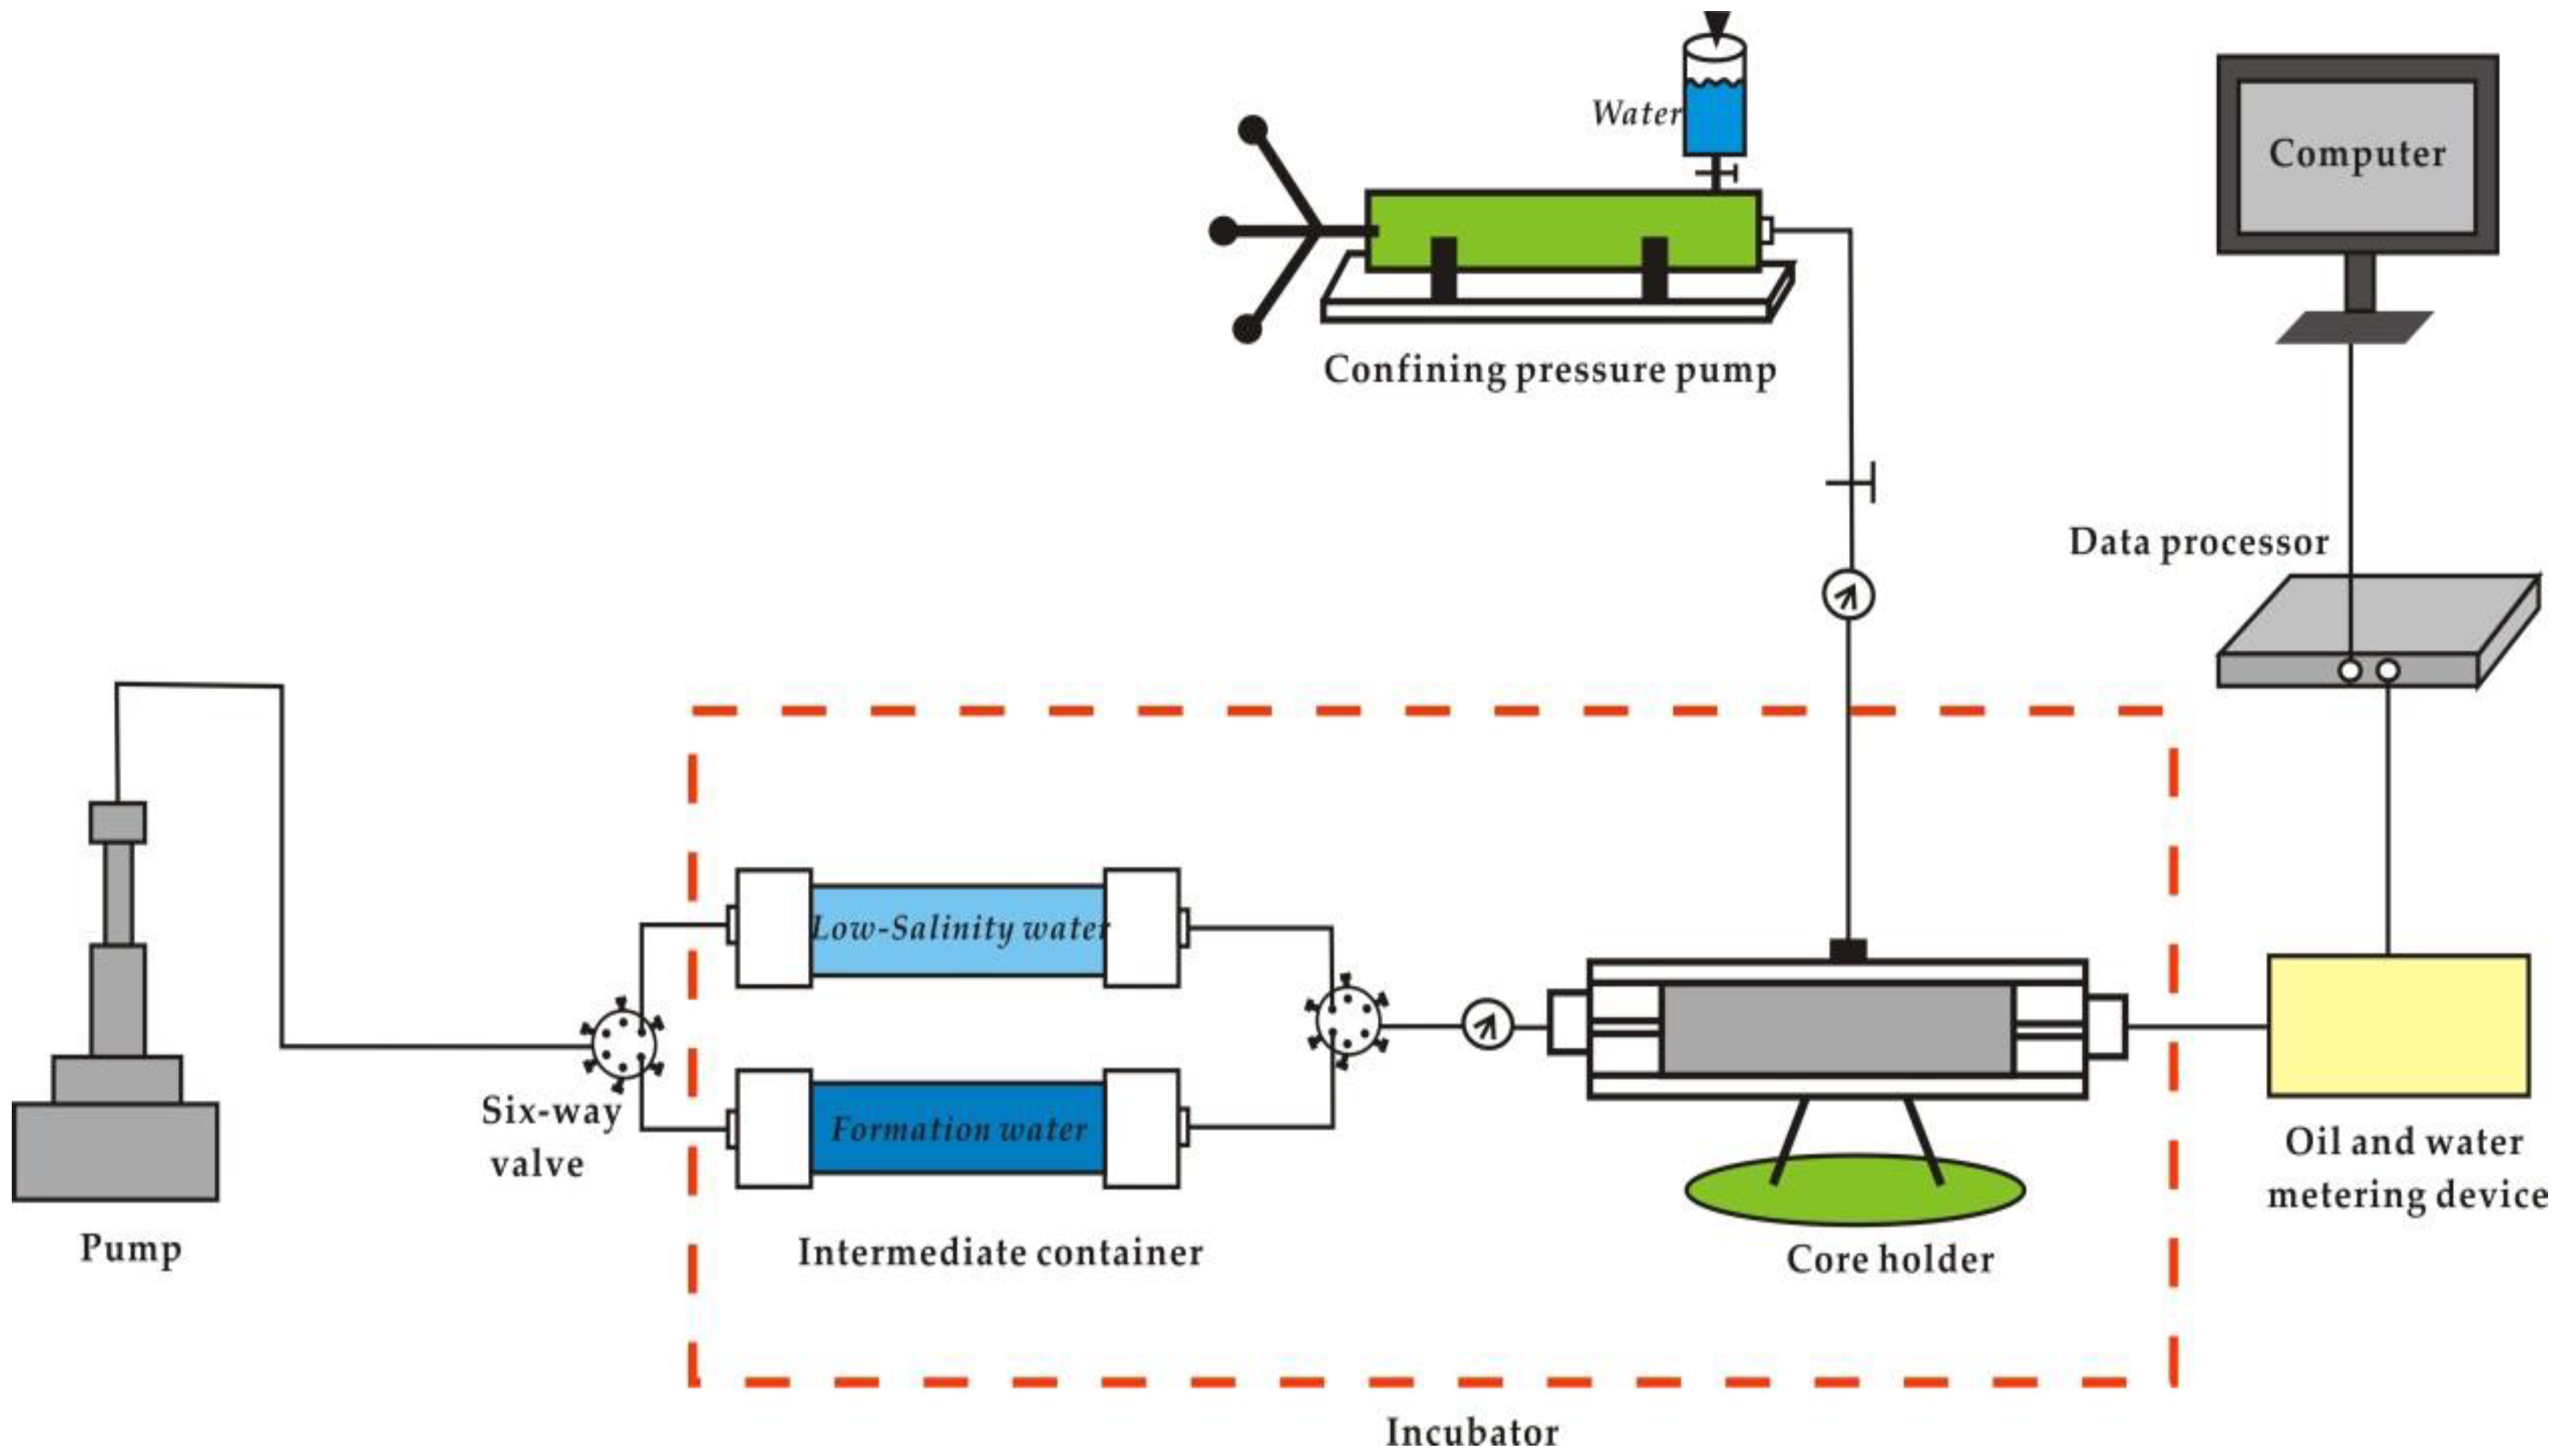
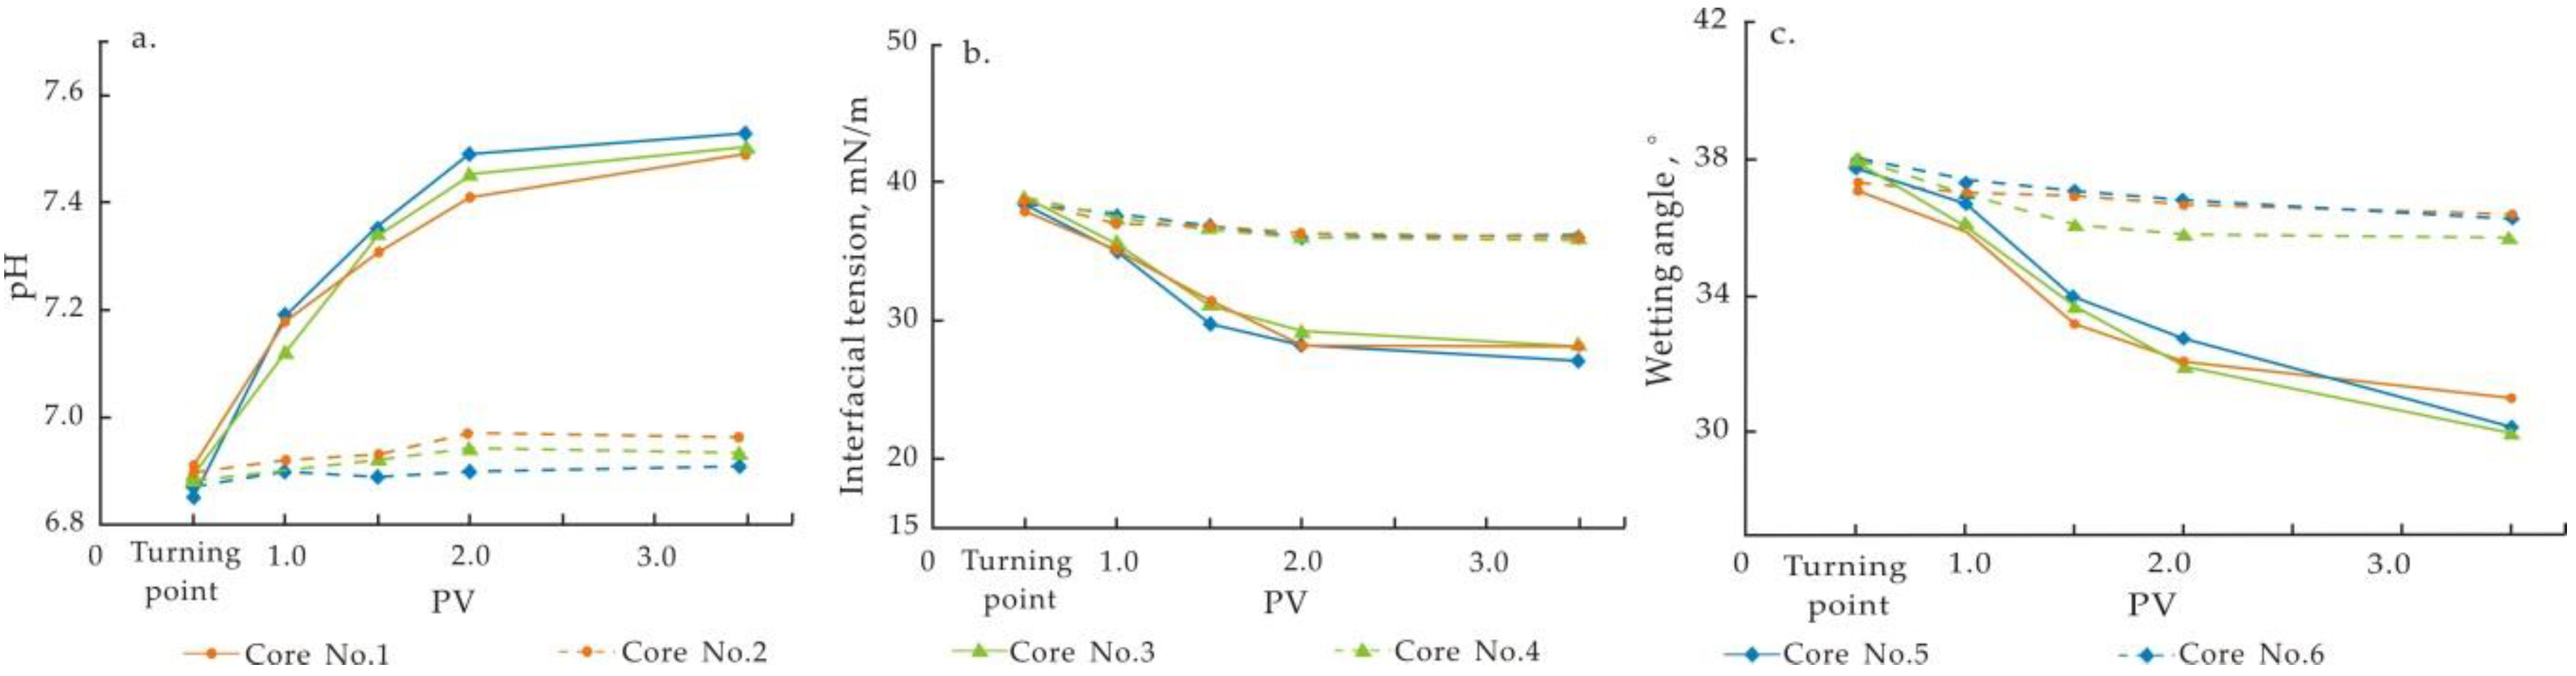
Great progress has been made in the study of the mechanism of low-salinity water flooding, but there is still a lot of controversy. Furthermore, the above studies did not quantitatively analyze the clay mineral composition of the cores used. The effect of low-salinity water flooding is probably related to clay mineral composition, but the influence of clay mineral composition on the EOR mechanism lacks the necessary basic experimental support. Therefore, three groups of experiments were designed in this study, and the influence of clay mineral composition on low-salinity water flooding was quantitatively studied based on the measurements of pH value, interfacial tension and wetting angle. The research results are of great significance for improving the recovery of clay-bearing mineral reservoirs.

2. Experiment

Three groups of high-temperature core displacement experiments were designed according to the experiment purposes. Each group of comparison experiments included the whole process of formation water flooding and low-salinity water flooding after the injection of 0.5 PV (1 PV = 1 pore volume) of formation water. The effects of clay mineral composition on low-salinity water flooding and the mechanism of low-salinity water flooding were comprehensively studied by statistical results of produced liquid and property tests of produced-water.

2.1. Core Preparation

The artificial cores were prepared in the laboratory as follows: First, the raw materials were prepared and mixed in a certain proportion. Then, they were placed in the mold for pressing and bonding. Finally, the cores were cut and stored for two weeks. Here, the clay mineral content of each core was designed as shown in Table 2.
According to the designed content, montmorillonite, kaolinite and illite (Figure 3) were added to the raw materials to make the six artificial cores (Figure 4). Their physical parameters are listed in Table 3.

2.2. Fluid Preparation

The samples of the formation water and low-salinity water were provided by A block in Shengli Oilfield, and their ionic composition were tested (Table 4). According to the ionic composition, formation water was prepared by dissolving sodium chloride, magnesium chloride, and calcium chloride reagents in deionized water, and low salinity water was prepared by dissolving sodium chloride, magnesium chloride, calcium chloride and sodium bicarbonate reagents in deionized water.
Field crude oil of the A block in Shengli Oilfield was selected for the experiments. The density of the crude oil is 0.857 kg/m3 at 25 °C, the viscosity is 100 mPa·s, and the pH is 6.79. The experimental crude oil was subjected to a four-component separation test, and the crude oil components are given in Table 5.

2.3. Experimental Procedure

The instrument used in the experiment is a thermostatic displacement device (Figure 5).
The specific experimental procedures are as follows, and each step is in strict accordance with the experimental standards [21]. (1) The cores were first weighed, then they were evacuated for 7 h, and then saturated with formation water for 24 h at pressure of 20 MPa. (2) The samples were weighed and nuclear magnetic resonance (NMR) spectroscopy was performed; (3) Oil flooding was performed for 15 PV to saturate cores with crude oil, then the cores were weighed and placed in the oil for 240 h. (4) The pipeline was connected and the displacing equipment was started. The equipment was preheated for 2 h before every experiment to reach 90 °C. (5) For core No.1, core No. 3 and core No. 5, low-salinity water was injected after injecting 0.5 PV formation water. (6) For core No. 2, core No. 4 and core No. 6, continuous injection of formation water was carried out until the water cut reached 98%. In steps (5) and (6), during the experiment, the water output and oil output were measured and the pH, interfacial tension and wettability of produced-water were tested. The specific parameters of the comparison experiment are designed as Table 6.

3. Results

3.1. Porous Structure of the Prepared Cores

The T2 NMR spectrum showed good correspondence with the pore structure of the cores [22,23,24,25]. The T2 spectrum curves of the six cores in saturated water state are shown in Figure 6. It can be observed that the pore structures of the six cores are relatively similar.

3.2. Relationship between Clay Mineral Composition and Oil Recovery

Measurements were taken at ten points during the experiments, and the oil recovery results were calculated and plotted, as shown in Figure 7.
As seen from the above graphs, injecting low-salinity water in cores containing clay minerals improved the oil recovery, but the degree of EOR was different. Cores with the highest content of montmorillonite had the most obvious effect of EOR, from 38% (Core No. 6) of the whole process of formation water flooding to 43.7% (Core No. 5), and the degree of recovery increased by 5.7%. On the other hand, cores with the highest content of kaolinite showed the poorest effect on low-salinity water flooding, from 38.6% (Core No. 2) of the whole process of formation water flooding to 40.5% (Core No. 1), and the degree of recovery increased by only 1.9%. Cores with the highest content of illite showed an intermediate effect of EOR (3.3%). The relative improvement of oil recovery for each group of cores was calculated, as shown in Table 7. It is obvious that cores with the highest content of montmorillonite are the most suitable for low-salinity water flooding.

3.3. Change in Properties during Displacement Process

During the displacement process, five samples were taken from each core and each sample was subjected to measurements of pH value, interfacial tension and wetting angle. A total of 90 attribute tests were performed and the results are presented in Figure 8.
During the entire process of formation water flooding test, the changes in the three properties were not significantly affected by clay mineral composition, and all the cores showed a consistent pattern.
In the test involving injecting low-salinity water after injecting formation water, the values of different properties changed significantly, mainly reflected in the increase in pH value (0.5–0.6), and the decrease in interfacial tension (8–9 mN/m) and wetting angle (5–6.5°) of the produced-water. These results indicate the alkaline enhancement of displacing liquid system and the decrease in resistance of oil displacement. This effect is favorable for improving oil displacement efficiency, ultimately resulting in the improvement of oil recovery.
Groups with different clay mineral compositions showed various degrees of difference in the three properties between two diverse displacement tests. Taking these results in combination with the oil recovery data, a clear trend can be observed: cores with better effect of EOR on low-salinity water flooding will have higher pH value and lower interfacial tension and wetting angle.

4. Discussion

Based on the analysis of the above experimental data, combined with literature research, the mechanism of influence of clay mineral composition on low-salinity water flooding is discussed in this section. According to the NMR results in Section 3.1, the pore structure of the six cores is similar. Therefore, the effect of pore structure on the low-salinity water flooding in the experiment is excluded.

4.1. Ionic Mechanism of Low-Salinity Water Flooding

After injecting formation water, the organic acids and salt base in the crude oil and some cations in the formation water (such as Ca2+) are adsorbed on the surface of the clay mineral due to the negative charge on the surface. At this point, the ion concentration, temperature, pressure, and pH are in a state of chemical equilibrium (Figure 9a).
After injecting low-salinity water, the original salt-rock interface equilibrium is destroyed. Then, the ion desorption reaction occurs on the rock surface, especially for Ca2+, because the ion concentration of low-salinity water is much lower than that of the original formation water. Thus, in order to compensate for the loss of Ca2+ on the rock surface and maintain charge balance, H+ in the water is adsorbed on the rock surface. In other words, the interaction between Ca2+ and H+ occurs on the surface of clay minerals (Figure 9b).
As the amount of H+ in the liquid system decreases and pH value of the system rises, the matrix and organic acids on the clay surface react with the OH, thereby forming a new interface of acid and salt and desorbing from the surface of the clay mineral (Figure 9c).
During this process, the amount of matrix and organic acids adhering to the clay surface is reduced by the reaction. On the one hand, this makes the rock surface more hydrophilic, and on the other hand, this reduces the resistance of oil displacement. Generally, this chemical reaction is similar to that of alkali flooding.

4.2. Analysis of Influence of Clay Mineral Composition on Low-Salinity Water Flooding

From the above analysis, it is evident that the surface ionic chemical reaction is closely related to the enhanced oil recovery mechanism of low-salinity water flooding. According to the statistics of the physical properties of the three clay minerals, it can be inferred that the fundamental reason for the different degrees of enhanced oil recovery is the differences in the degree of cation conversion occurring on the mineral surface for the three kinds of clay minerals.
Therefore, the different crystal structures of the three clay minerals determine the ion exchange capacity of their surface, which further influences the EOR effect of low-salinity water flooding. For kaolinite, the ion exchange capacity on its surface is weak, which is not conducive to the mechanism of low-salinity water flooding. As there are Ca2+ and Mg2+ ions inside the illite layer, and the interlayer structure of illite is unstable, its surface is favorable for ion exchange. At the same time, it is found that Ca2+ plays an extremely important role in EOR effect of low-salinity water flooding. Montmorillonite usually has less chemical force between layers and contains more Na+ or Ca2+, which not only increases the surface area available for the ionic reaction, but also transfers and catalyzes the ionic reaction. Therefore, montmorillonite is more suitable for the application of water flooding to enhance the oil recovery.

5. Conclusions

Core flooding tests were designed to investigate the effects of different clay mineral compositions on the EOR effect of low-salinity water flooding. At the same time, the properties of the effluent were determined in different flooding stages, and the mechanism of EOR effect of low-salinity water flooding was analyzed. The following conclusions were drawn from the results of this work:
Compared to the entire process of water flooding test, the pH value increased by 0.5–0.6, the interfacial tension decreased by 8–9 mN/m, and the wetting angle decreased by 5–6.5° during the low-salinity water flooding. That is, after the low-salinity water was injected into the core, a similar effect to the alkaline flooding occurred, which increased the overall cleaning efficiency and ultimately improved oil recovery.
The composition of clay minerals had a significant influence on the effect of low-salinity water flooding. In particular, cores with the highest content of montmorillonite showed the most obvious effect on low-salinity water flooding (EOR of 5.7%), while cores with the highest content of kaolinite showed the poorest effect on low-salinity water flooding (EOR of 1.9%). The cores with the highest content of illite showed an intermediate effect (EOR of 3.3%). These results can be explained by the differences in the crystal structure of the clay mineral. The interlayer of montmorillonite is connected by van der Waals forces, which makes its surface have the highest ion exchange capacity. On the other hand, kaolinite has the largest crystal chemical force and the closest ion connection. Thus, the ion exchange capacity on its surface is weak. The performance characteristics are consistent with the experimental data, indicating that ion exchange is one of the essential mechanisms of EOR effect of low-salinity water flooding. Therefore, in formations with similar conditions but different clay mineral composition, the content of montmorillonite is the most important factor affecting the performance of low-salinity water flooding. If the content of montmorillonite is relatively high in the formation, low-salinity water flooding can achieve better results.

Author Contributions

Conceptualization, S.J. and P.L.; Methodology, S.J., Y.H.; Investigation, P.L.; Resources, P.L., Y.H.; Data curation, S.J.; Writing—Original Draft Preparation, S.J.; Writing—Review and Editing, Y.H.

Funding

This research was funded by Major National Science & Technology Program of China, grant number 2017ZX05035001.

Acknowledgments

This research received much help from the staff of Research Institute of Petroleum Exploration and Development, PetroChina. In the process of writing articles, our teachers (Dazhong Dong, Yuman Wang) gave us a lot of advice, which we really appreciate.

Conflicts of Interest

The authors declare no conflict of interest.

References

  1. Wang, P.; Jiang, R.; Wang, G.C.; Liang, Y. Research Advance and Prospect of Low-Salinity Water Flooding. Lithol. Reserv. 2012, 24, 106–110. [Google Scholar]
  2. McGuire, P.L.; Chatham, J.R.; Paskvan, F. Low-Salinity Oil Recovery: An Exciting New EOR Opportunity for Alaska’s North Slope. In Proceedings of the SPE-93903-MS, SPE Western Regional Meeting, Irvine, CA, USA, 30 March–1 April 2005. [Google Scholar] [CrossRef]
  3. Jerauld, G.R.; Lin, C.Y. Modeling Low-Salinity Waterflooding. In Proceedings of the SPE 102239, Annual Technical Conference and Exhibition, San Antonio, TX, USA, 24–27 September 2006. [Google Scholar] [CrossRef]
  4. Martin, J.C. The Effects of Clay on the Displacement of Heavy Oil by Water. In Proceedings of the SPE1411, the 3rd Annual Venezuelan Region Meeting of AIME, Caracas, Venezuela, 14–16 October 1959. [Google Scholar]
  5. Emadi, A.; Sohrabi, M. Visual investigation of oil recovery by Low-Salinity water injection: Formation of water micro-dispersions and wettability alteration. In Proceedings of the SPE 166435, SPE Annual Technology Conference and Exhibition, New Orleans, LA, USA, 30 September–2 October 2013. [Google Scholar] [CrossRef]
  6. Robertson, E.P. Low-Salinity Waterflooding to Improve Oil Recovery-historical Field Evidence. In Proceedings of the SPE 109965, SPE Annual Technology Conference and Exhibition, Anaheim, CA, USA, 11–14 November 2007. [Google Scholar] [CrossRef]
  7. Lager, A.; Webb, K.J.; Collins, I.R.; Richmond, D.M. LoSal Enhanced Oil Recovery: Evidence of Enhanced Oil Recovery at the Reservoir Scale. In Proceedings of the SPE 113976, SPE Symposium on Improved Oil Recovery, Tulsa, OK, USA, 20–23 April 2008. [Google Scholar] [CrossRef]
  8. Seccombe, J.; Lager, A.; Jerauld, G.; Jhaveri, B.; Buikema, T.; Bassler, S.; Denis, J.; Webb, K.; Cockin, A.; Fueg, E. Demonstration of Low-salinity EOR at Interwell Scale, Endicott Field, Alaska. In Proceedings of the SPE 129692, SPE Improved Oil Recovery Symposium, Tulsa, OK, USA, 24–28 April 2010. [Google Scholar] [CrossRef]
  9. Qi, X.; Kuang, Y. Influence of Clay Minerals on Surface Properties of Coal Slime. Coal Sci. Technol. 2013, 7, 126–128. [Google Scholar] [CrossRef]
  10. Sorbie, K.S. A Proposed Pore-Scale Mechanism for How Low-salinity Waterflooding Works. In Proceedings of the SPE 129833, Improved Oil Recovery Symposium meeting, Tulsa, OK, USA, 24–28 April 2010. [Google Scholar] [CrossRef]
  11. Rezaeidoust, A.; Puntervold, T.; Austad, T. A Discussion of the Low-salinity EOR Potential for a North Sea Sandstone Field. In Proceedings of the SPE 134459, SPE Annual Technical Conference and Exhibition, Florence, Italy, 19–22 September 2010. [Google Scholar] [CrossRef]
  12. Zhang, Y.S.; Morrow, N.R. Comparison of Secondary and Tertiary Recovery with Change in Injection Brine Composition for Crude Oil/Sandstone Combinations. In Proceedings of the SPE/DOE Symposium on Improved Oil Recovery, Tulsa, OK, USA, 22–26 April 2006. [Google Scholar] [CrossRef]
  13. Yousef, A.; Al-Saleh, S.; Al-Jawfi, M. New Recovery Method for Carbonate Reservoirs through Tuning the Injection Water Salinity: Smart Water Fooding. In Proceedings of the SPE 143550, SPE/EAGE Annual Conference and Exhibition, Vienna, Austria, 23–26 May 2011. [Google Scholar] [CrossRef]
  14. Wu, J.; Chang, Y.W.; Li, J.; Liang, T.; Guo, X.F. Mechanisms of Low-salinity Waterflooding Enhanced Oil Recovery and Its Application. J. Southwest Pet. Univ. 2015, 37, 145–151. [Google Scholar] [CrossRef]
  15. Shehata, A.M.; Nasr-El-Din, H.A. The Role of Sandstone Mineralogy and Rock Quality in the Performance of Low-Salinity Waterflooding. SPE Reserv. Eval. Eng. 2017. [CrossRef]
  16. Zhang, X.F.; Liu, Z.B.; Liu, C.; Liu, H.; Zhang, R. Influences of the Clay Minerals on the Waterflooding Reservoir Physical Properties of Oilfield X in Liaodong Bay Depression. Pet. Geol. Oilfield Dev. Daqing 2017, 36, 62–67. [Google Scholar] [CrossRef]
  17. Huang, J.; Zhang, C.L.; Xie, G.W.; Liu, X.G.; Ding, Y.Q.; Zhang, R.Y.; Lei, Q. Effects of authigenic clay minerals on reservoir properties and oilfield development—Take X reservoir formation in Jiyuan and Huaqing areas in Ordos basin as an example. Petrochem. Ind. Appl. 2017, 36, 90–96. [Google Scholar] [CrossRef]
  18. Jiang, Y.Q.; Zhang, C.; Deng, H.B.; Wang, M.; Luo, M.S. Influences of Clay Minerals on Physical Properties of Low Permeability and Tight Sandstones. J. Southwest Pet. Univ. 2013, 35, 39–47. [Google Scholar] [CrossRef]
  19. Li, L. Feasibility study on enhanced oil recovery by Low-Salinity Water Flooding in XM oilfield. Ph.D. Thesis, Southwest Petroleum University, Chengdu, China, 2015. [Google Scholar]
  20. Zou, D.P.; Ke, S.Z.; Li, J.J.; He, Q.L.; Ma, X.R. Experimental Study on Resistivity Dispersion of Highly Clay Mineral Content Core. Well Logging Technol. 2018, 42, 261–266. [Google Scholar] [CrossRef]
  21. Technical Regulation for Oilfield EOR Methods Screening. Available online: http:// http://old.petrostd.com/read/view.aspx?id=3087 (accessed on 1 June 2016).
  22. He, Y.D.; Mao, Z.Q.; Xiao, L.Z.; Ren, X.J. An improved Method of Using NMR T2 Distribution to Evaluate Pore Size Distribution. Chin. J. Geophys. 2005, 48, 373–378. [Google Scholar] [CrossRef]
  23. Fleury, M.; Fabre, R.; Webber, J.B.W. Comparison of pore size distribution by NMR relaxation and NMR cryoporometry in shales. SCA 2015, 25, 25–36. [Google Scholar]
  24. Yun, H.Y.; Zhao, W.J.; Liu, B.K.; Zhou, C.C.; Zhou, F.M. Researching rock pore structure with T2 distribution. Well Logging Technol. 2002, 26, 18–21. [Google Scholar] [CrossRef]
  25. Zhang, C.M.; Chen, Z.B.; Zhang, Z.S. Fractal characteristics of reservoir rock pore structure based on NMR T2 distribution. J. JPI 2007, 29, 80–86. [Google Scholar]
Figure 1. Structural diagram of clay minerals; (a) Kaolinite; (b) Illite.
Energies 11 03317 g001
Figure 2. Structural diagram of montmorillonite. (a) Crystal structure of montmorillonite; (b) Crystal structure of montmorillonite after water swelling.
Energies 11 03317 g002
Figure 3. Clay minerals in the raw materials.
Energies 11 03317 g003
Figure 4. The 6 artificial cores for experiments.
Energies 11 03317 g004
Figure 5. Schematic diagram of the experimental instrument.
Energies 11 03317 g005
Figure 6. NMR curves of cores saturated with water.
Energies 11 03317 g006
Figure 7. Comparison of oil recovery of the cores. (a) Cores No. 1 and No. 2; (b) Cores No. 3 and No. 4; (c) Cores No. 5 and No. 6.
Energies 11 03317 g007
Figure 8. Results in attribute tests in Cores 1–6. (a) The change of pH; (b) The change of interfacial tension; (c) The change of wetting angle.
Energies 11 03317 g008
Figure 9. Ion exchange process during low-salinity flooding. (a) Initial state of clay surface; (b) Reaction occurring during low-salinity flooding; (c) Final state of clay surface.
Energies 11 03317 g009
Table 1. Crystallographic characteristics of kaolinite, illite and montmorillonite.
PropertyKaoliniteIlliteMontmorillonite
Layer1:12:12:1
Grain size, µm5–0.5<0.52–0.1
Ion exchange capacity, meq/100 g3–1510–4080–150
Surface area BET-N2, m2/g15–2550–11030–80
Table 2. Clay mineral content of each group of cores.
GroupClay Content, %Montmorillonite Content, %Kaolinite Content, %Illite Content, %Core Quantity
I76020202
II72060202
III72020602
Table 3. Physical parameters of the artificial cores.
Core NumberLength, mDiameter, mPorosity, %Permeability, D
10.0960.02518.20.4435
20.0960.02517.80.4307
30.0940.02516.80.4266
40.0970.02518.40.4104
50.0970.02519.00.4637
60.0960.02518.50.4523
Table 4. Ion content of formation water and low-salinity water.
Ion CompositionNa+Ca2+Mg2+ClHCO3−Total SalinitypH
Ion content of formation water, g/m3820053014014000550234206.9
Ion content of low-salinity water, g/m357580241100-1994-
Table 5. Contents of four components of crude oil.
Four-ComponentSaturated ComponentAromaticsColloidAsphaltene
Content, %43.4512.973.800.54
Table 6. Design of the comparison experiment.
GroupNumberMain Component of Clay MineralExperimental Procedures and Parameters
I1KaoliniteInjecting formation water at the beginning and injecting low-salinity water after 0.5 PV with flow rate of 0.05 cm3/min
2KaoliniteInjecting formation water with the flow rate of 0.05 cm3/min
II3IlliteInjecting formation water at the beginning and injecting low-salinity water after 0.5 PV with the flow rate of 0.05 cm3/min
4IlliteInjecting formation water with the flow rate of 0.05 cm3/min
III5MontmorilloniteInjecting formation water at the beginning and injecting low-salinity water after 0.5 PV with the flow rate of 0.05 cm3/min
6MontmorilloniteInjecting formation water with the flow rate of 0.05 cm3/min
Table 7. Difference in EOR.
Core1–23–45–6
Difference in EOR, %4.928.8515.00

