Stabilization of High-Organic-Content Water Treatment Sludge by Pyrolysis


Abstract
1. Introduction
2. Experimental
2.1. Raw Material
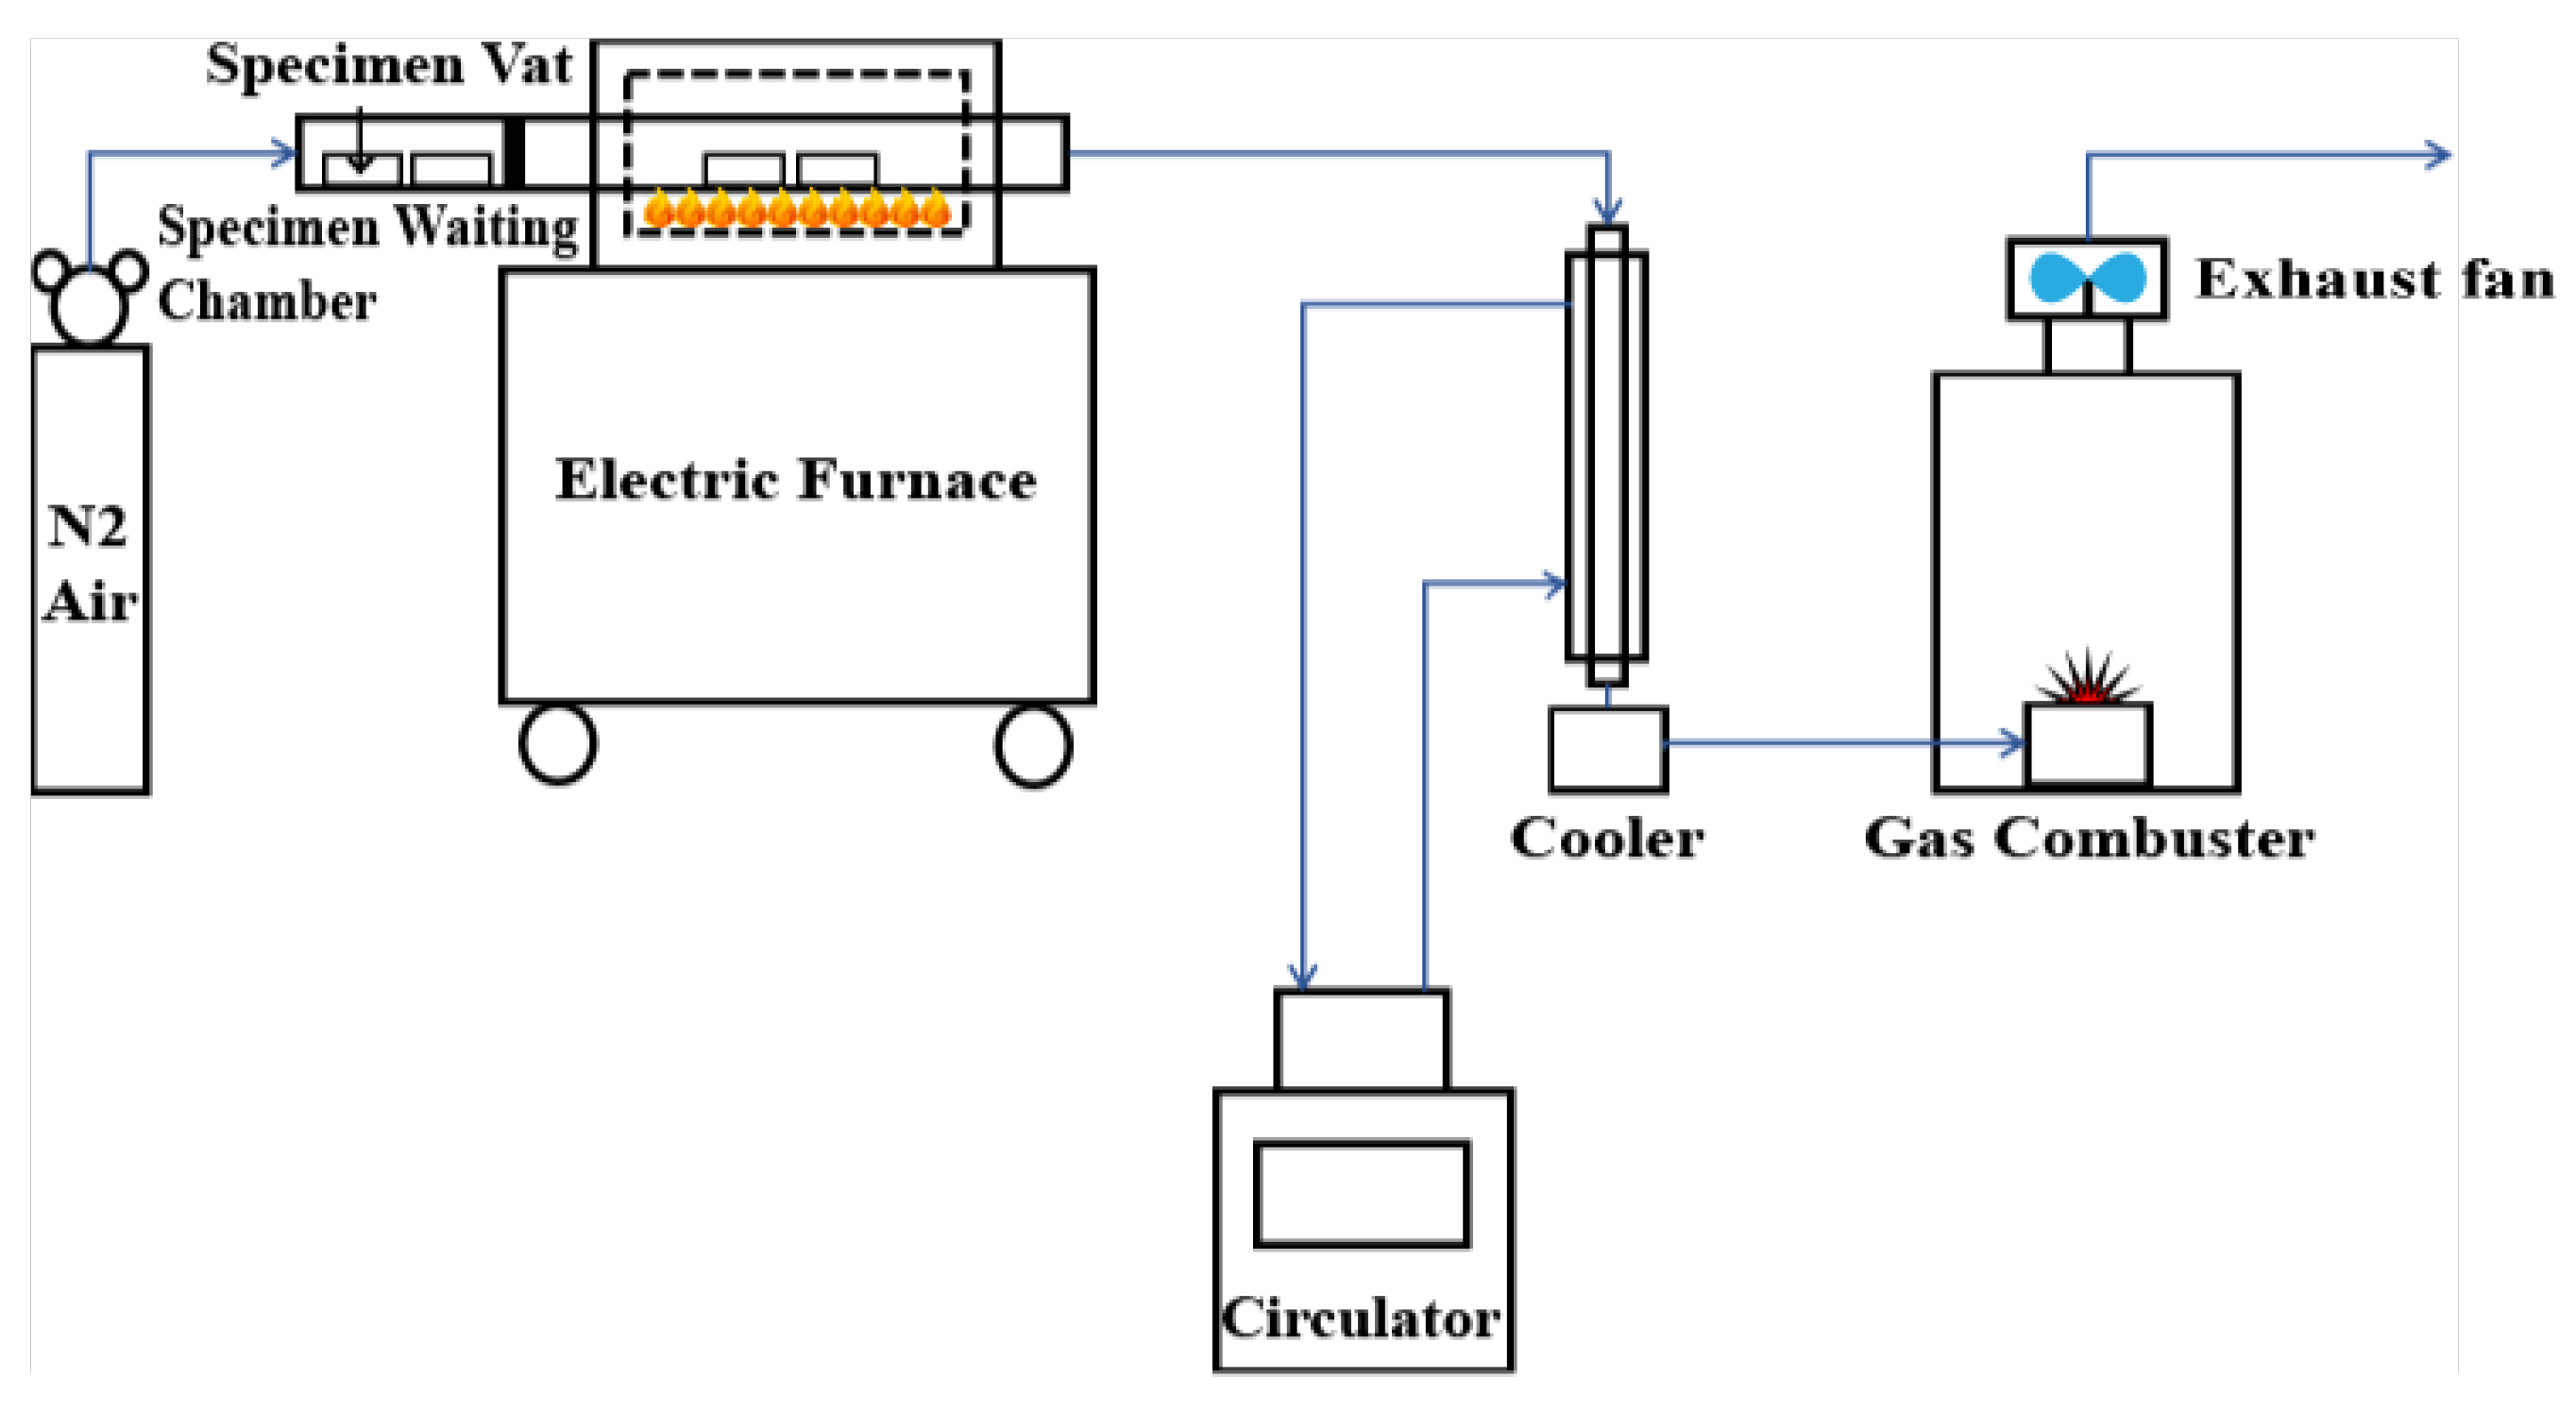
2.2. Experimental Methods
2.3. Analytical Methods
2.3.1. Characterization
2.3.2. Structural Analysis
2.3.3. Heavy Metal Leaching Analysis
3. Results and Discussion
3.1. Water Treatment Sludge and Water Treatment Sludge Char Composition Analysis
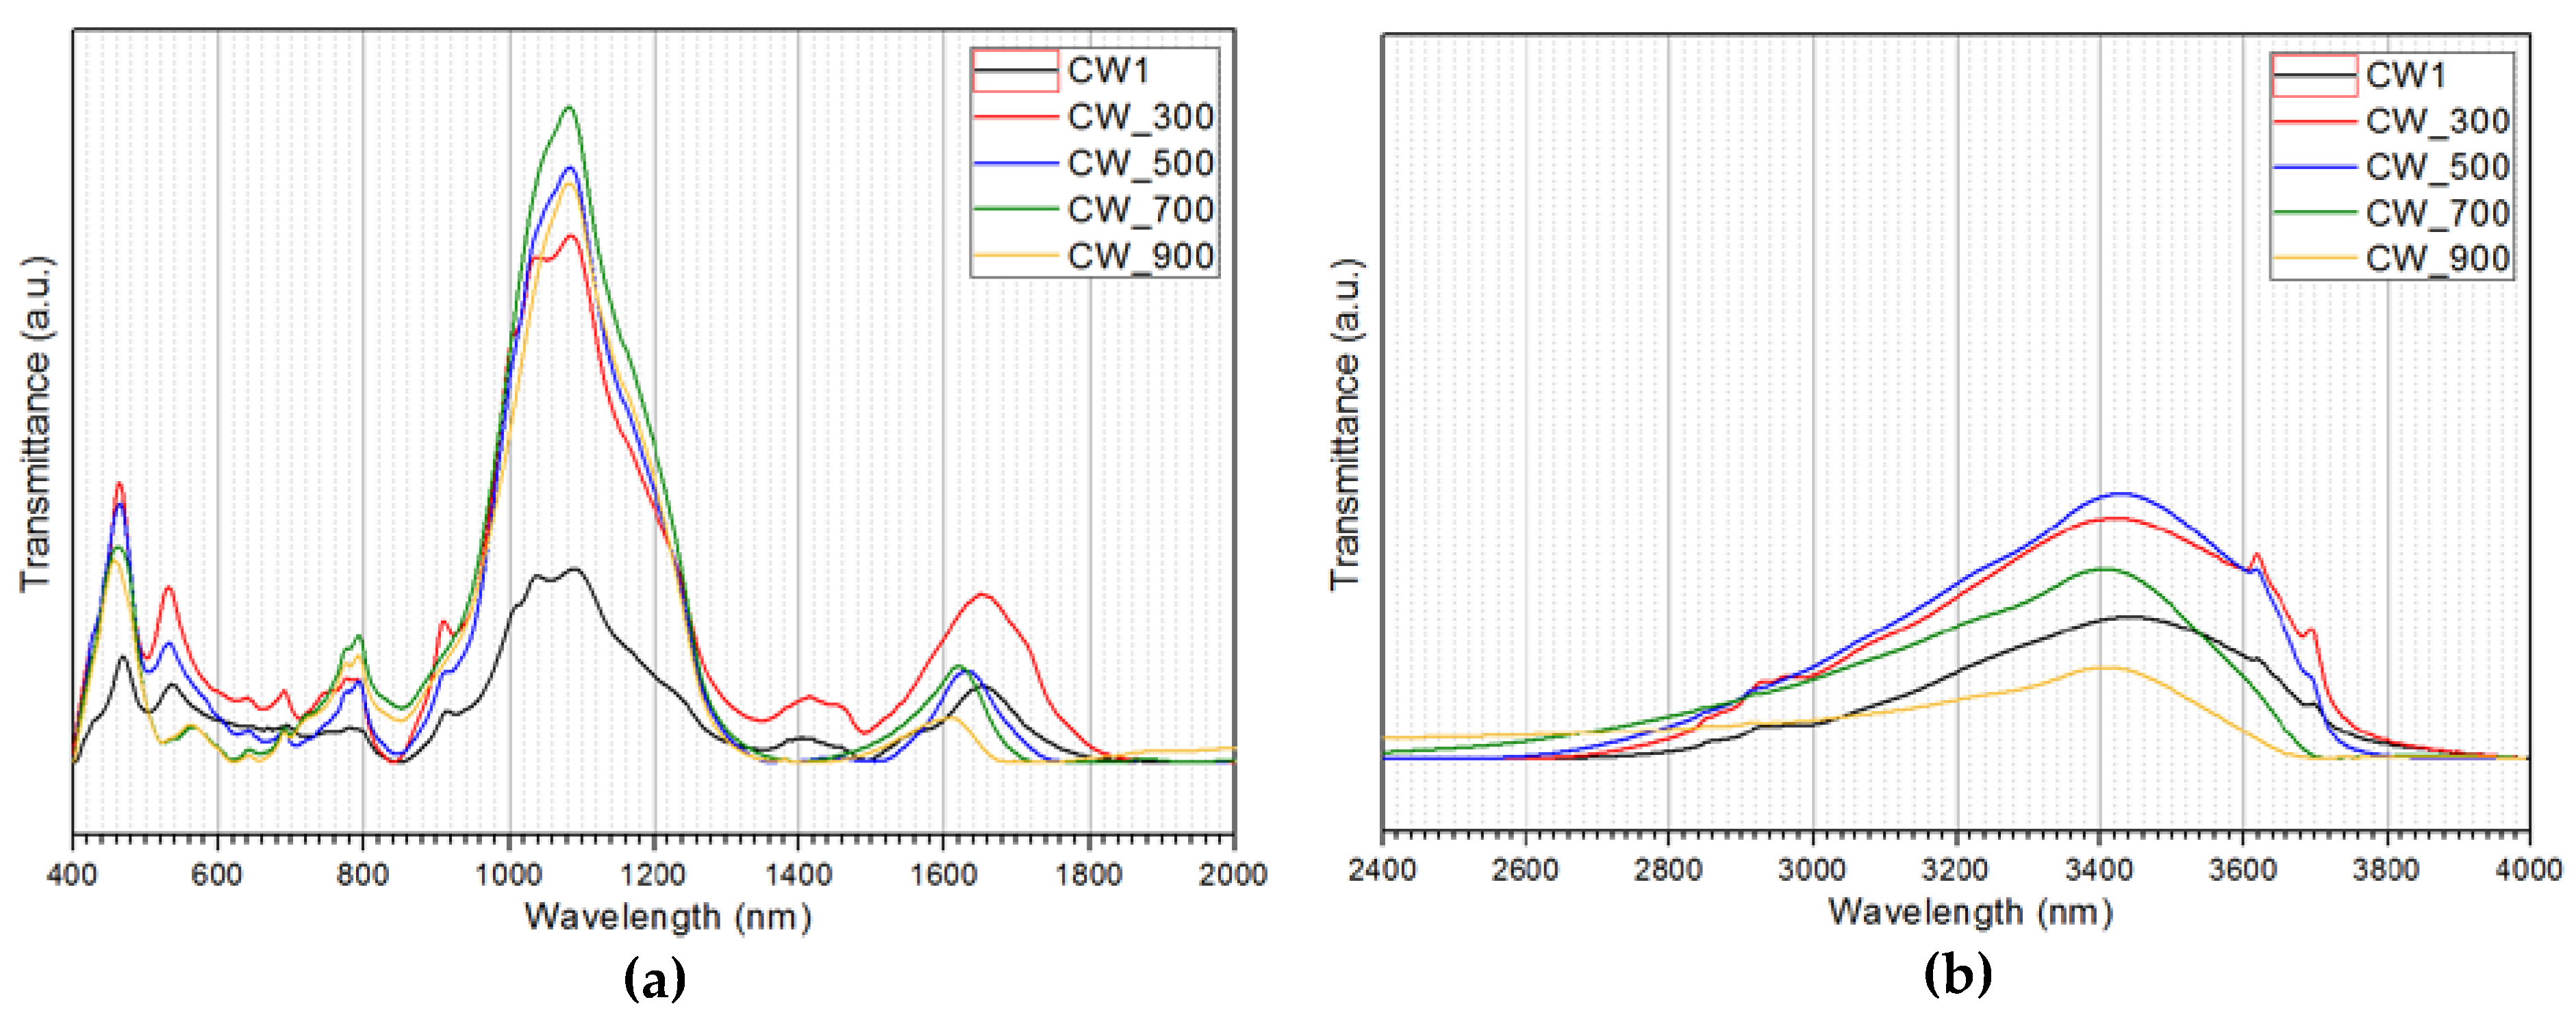
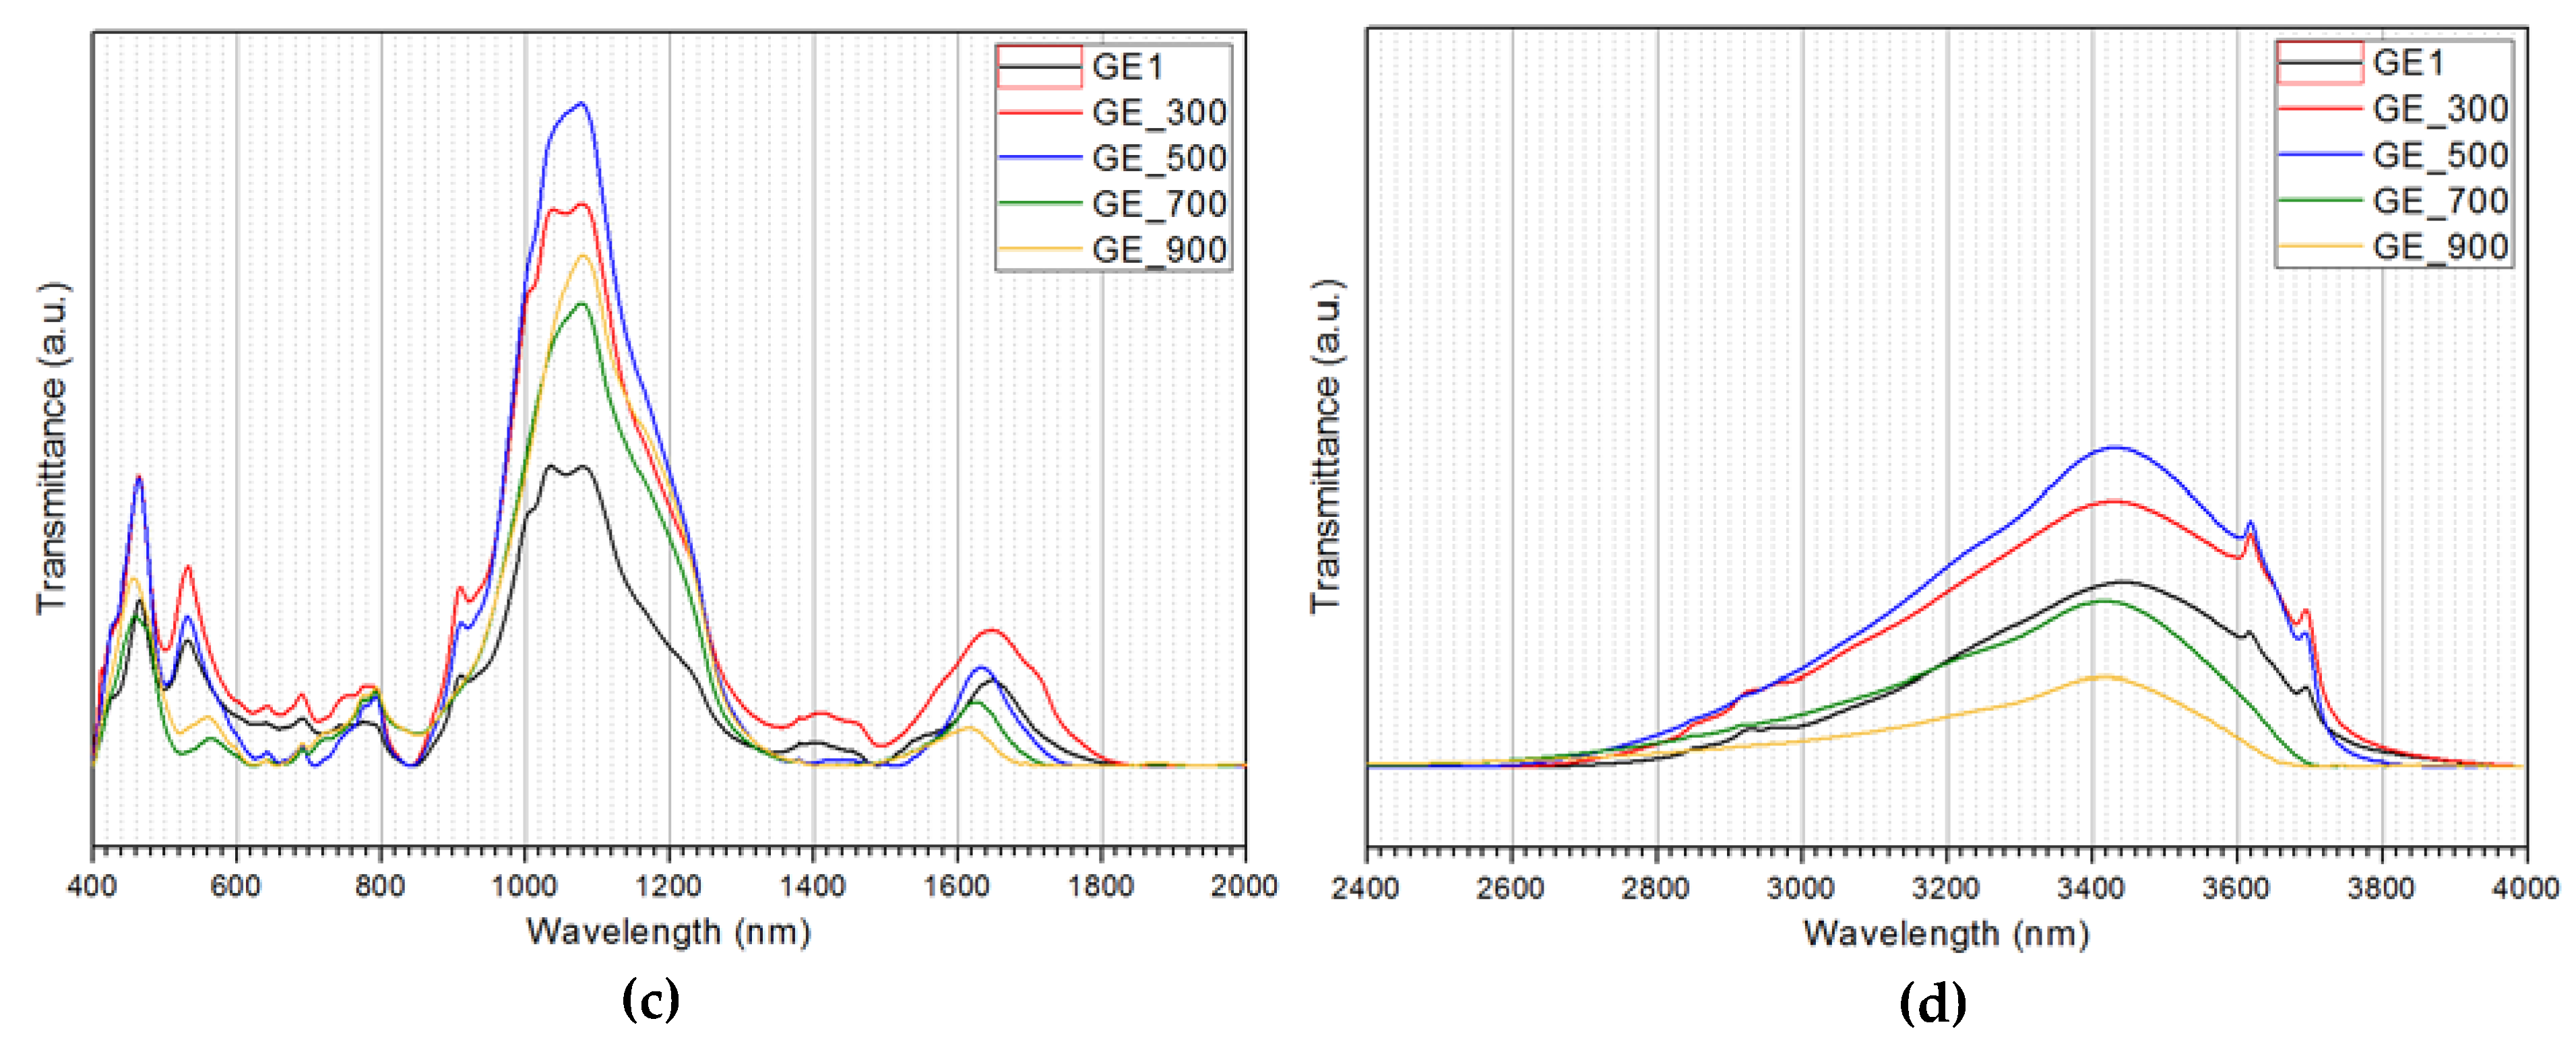
3.2. FT-IR Analysis
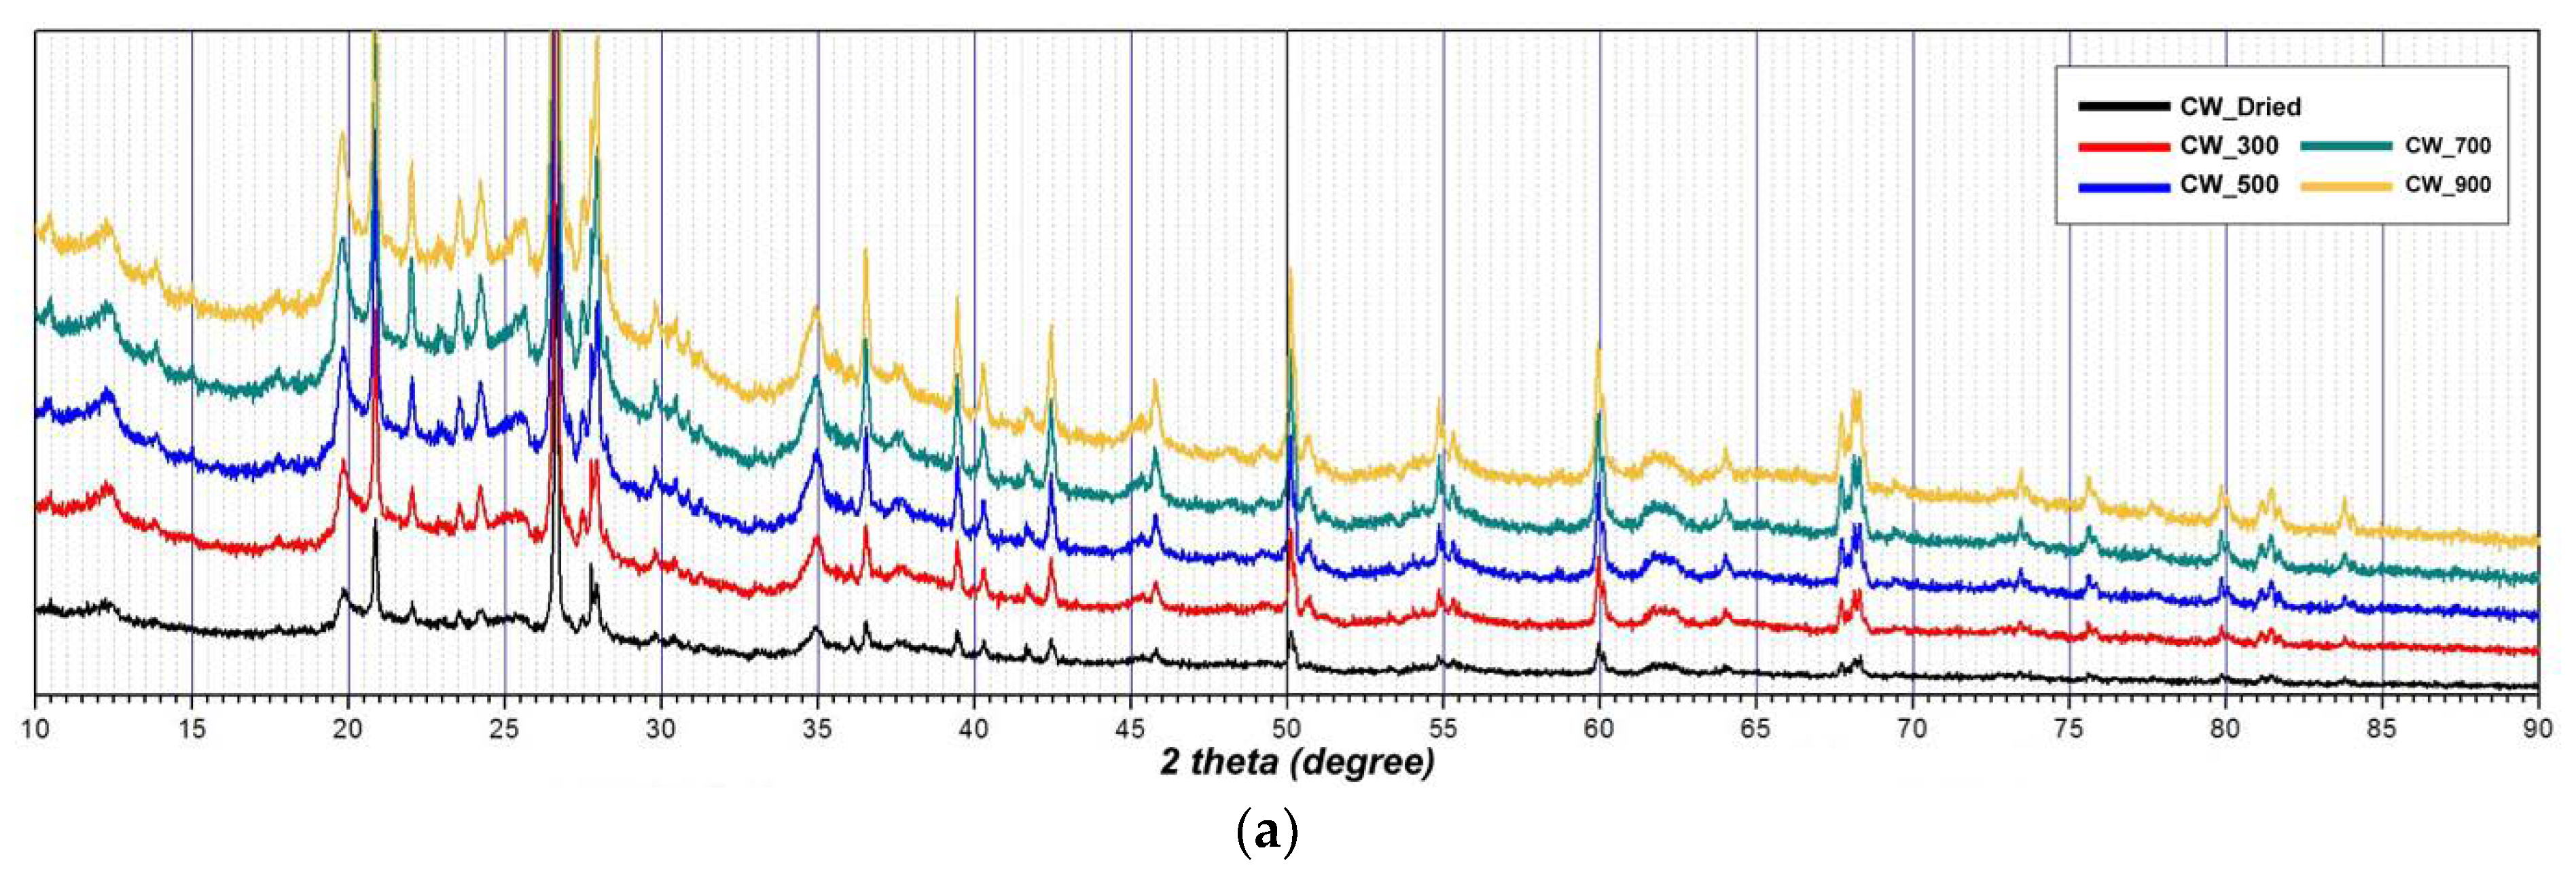
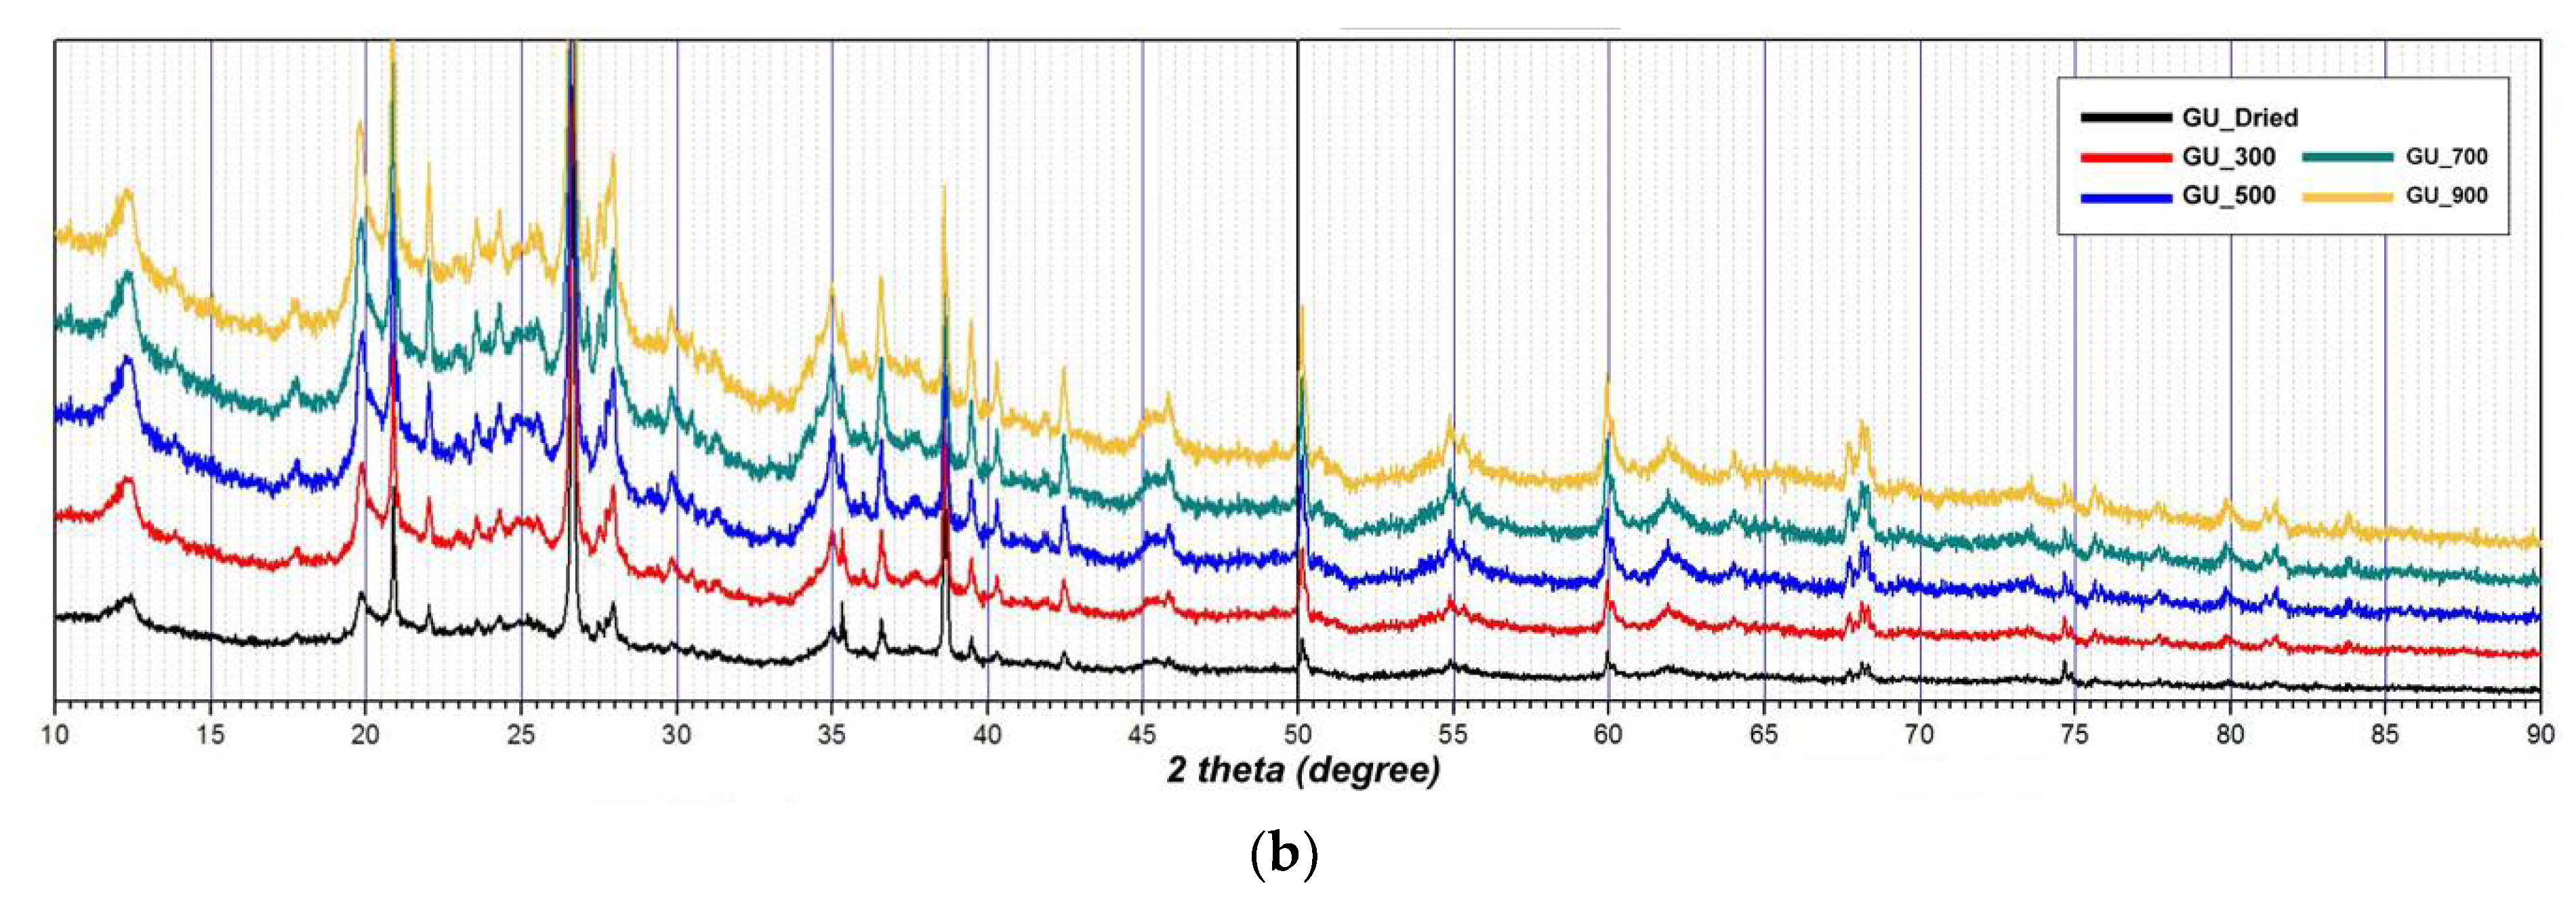
3.3. XRD Analysis
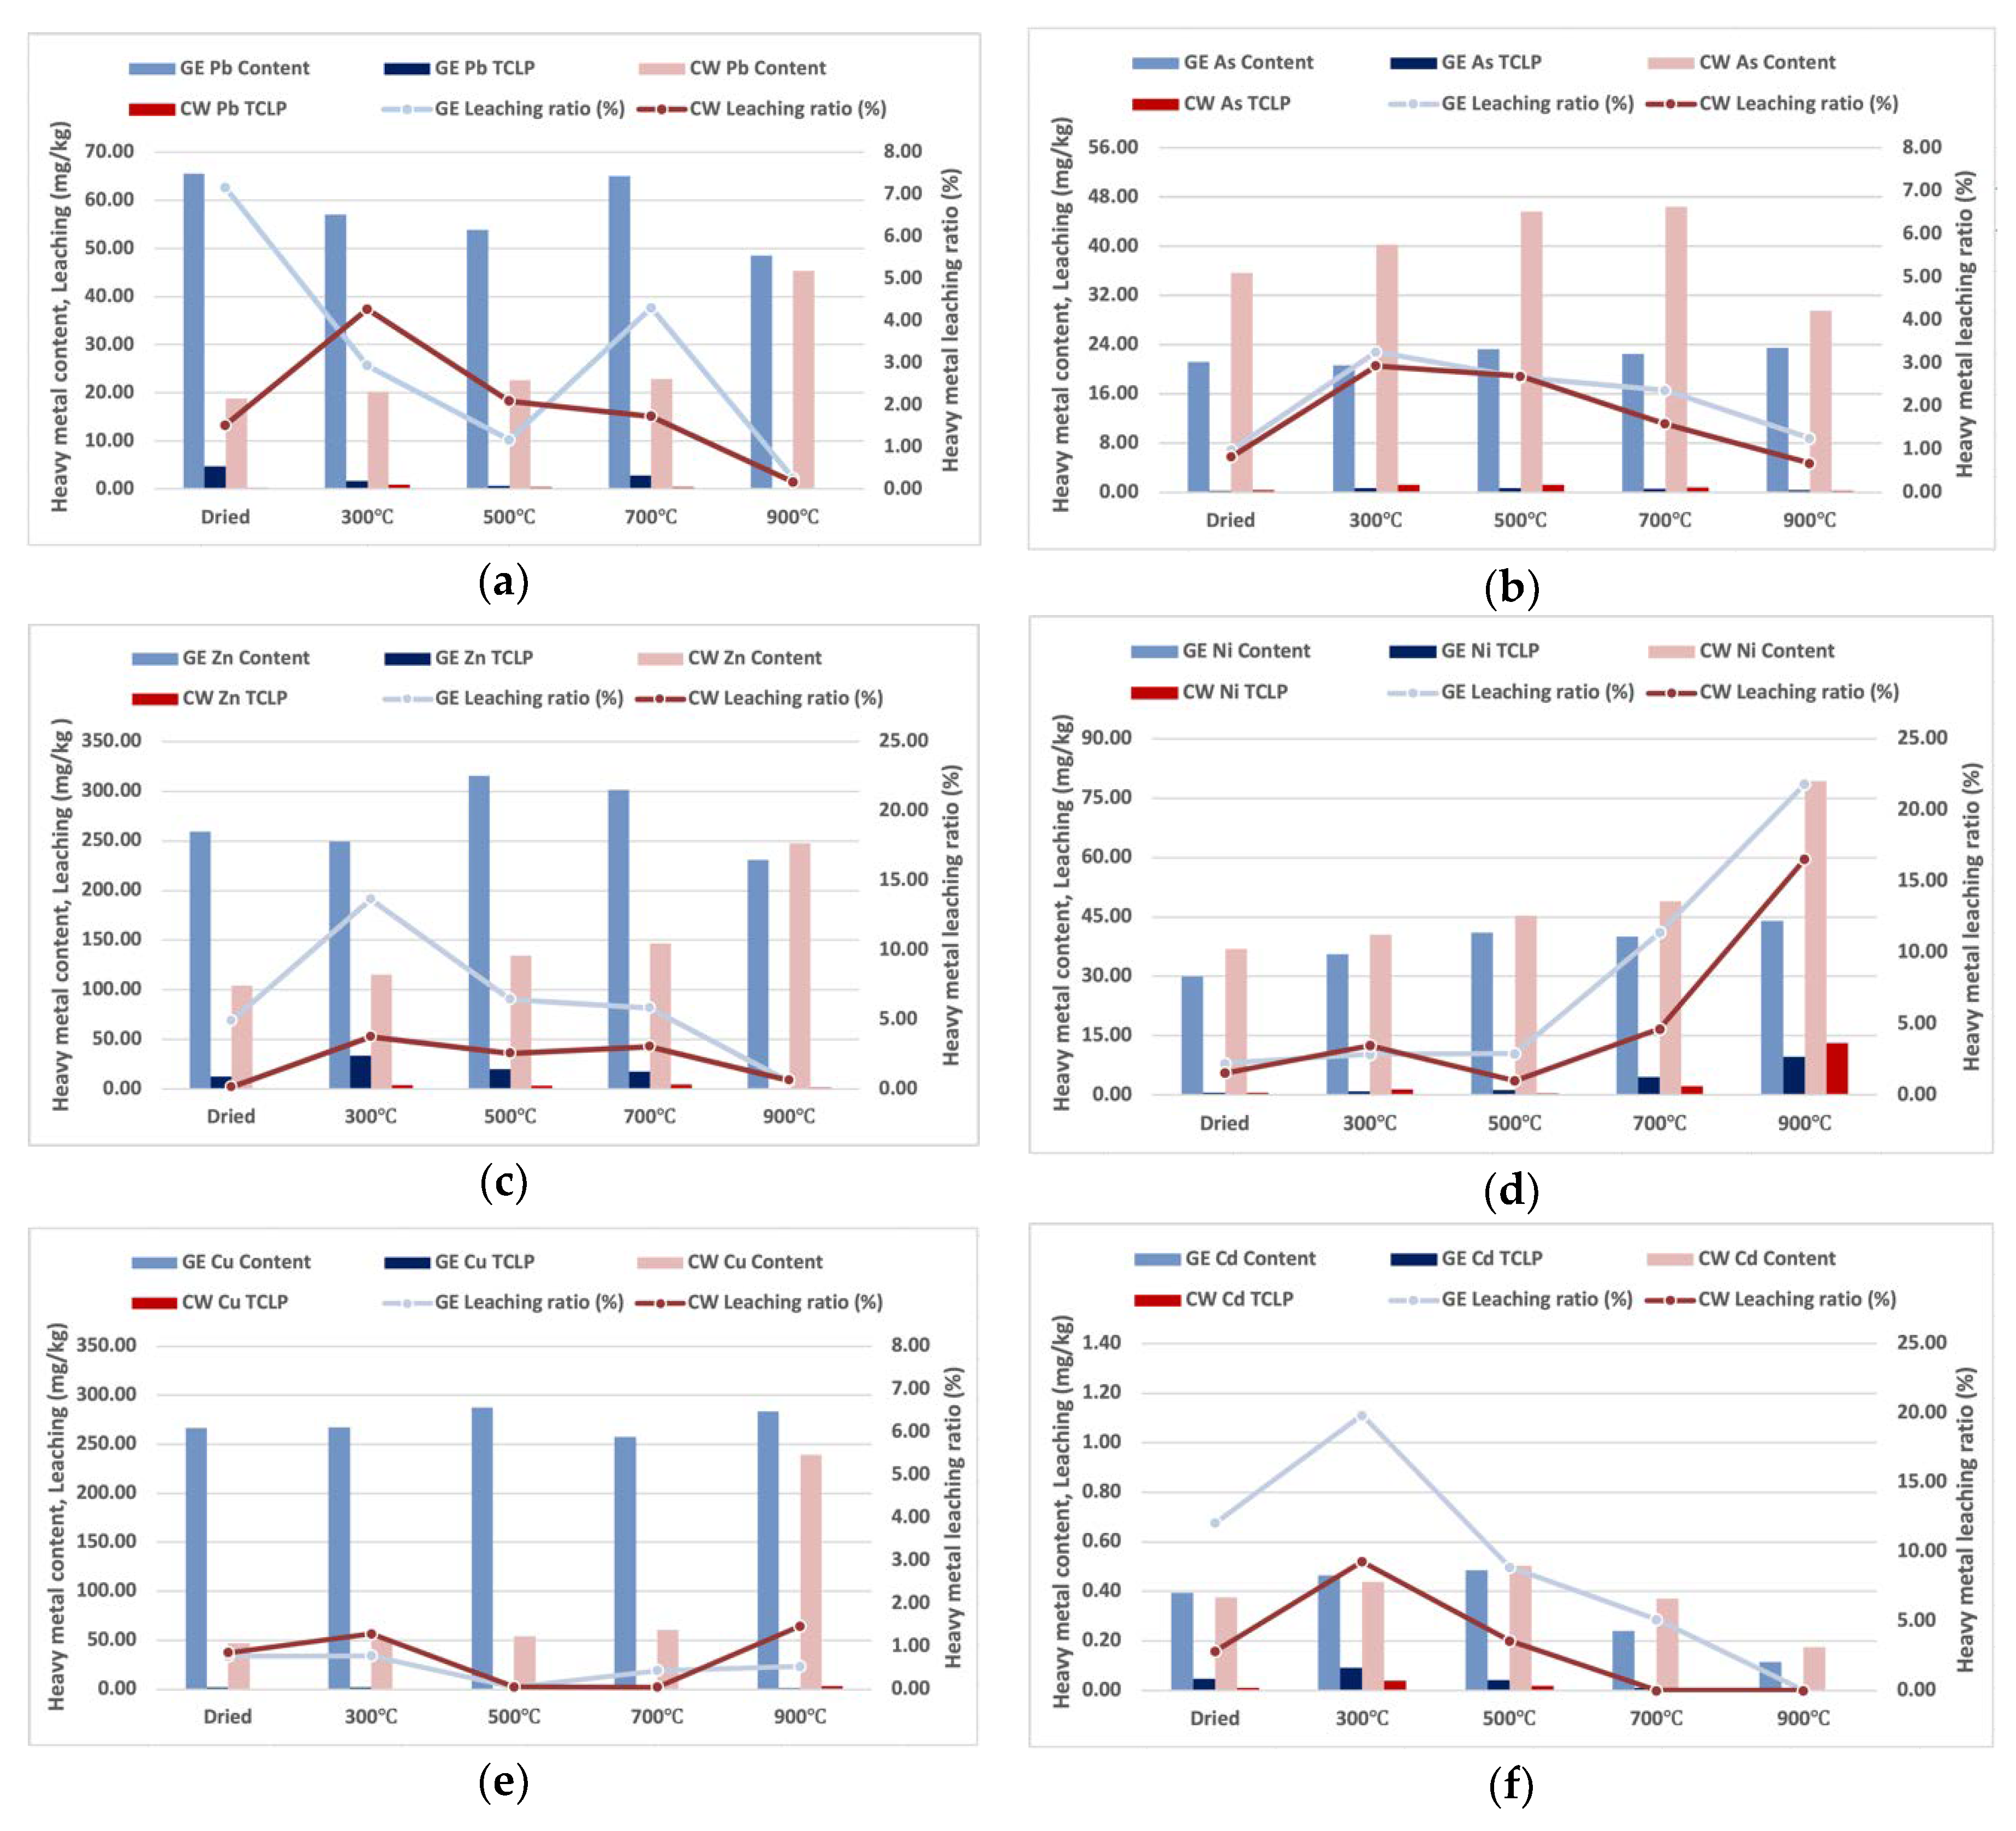
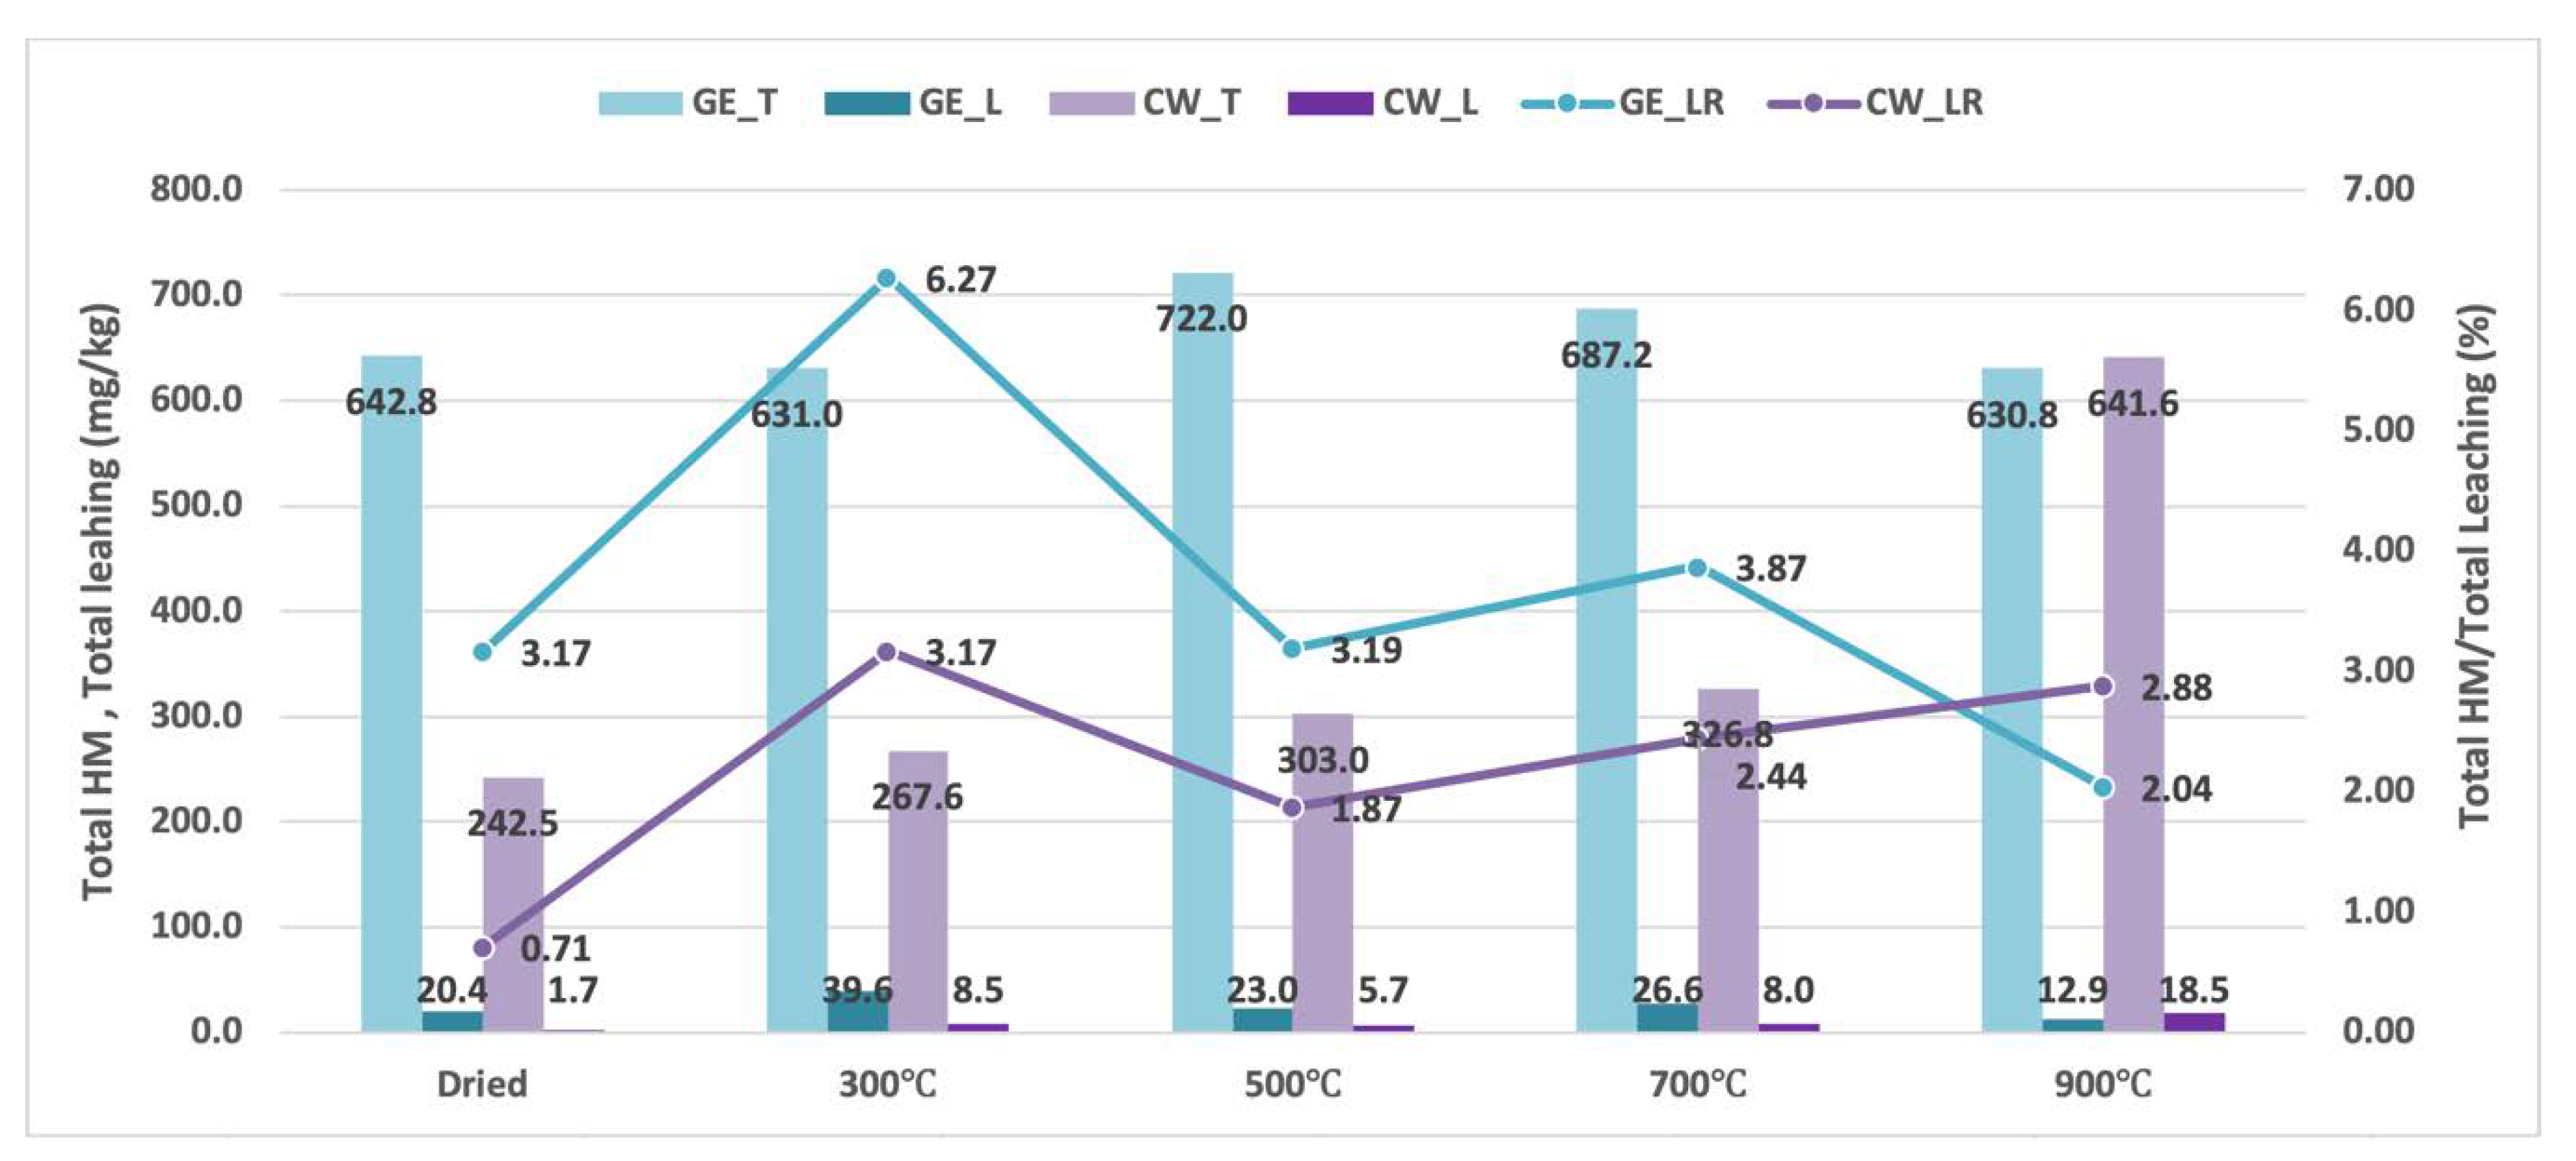
3.4. Heavy Metal Leaching Analysis
4. Conclusions
Author Contributions
Funding
Conflicts of Interest
References
- Ministry of Environment (MOE). National Waste Generation and Processing Statues; Ministry of Environment: Sejong City, Korea, 2016. [Google Scholar]
- Ministry of Environment (MOE). National Waste Generation and Processing Statues; Ministry of Environment: Sejong City, Korea, 2011. [Google Scholar]
- Yang, Y.; Tomlinson, D.; Kennedy, S.; Zhao, Y. Dewatered alum sludge: A potential adsorbent for phosphorus removal. Water Sci. Technol. 2006, 54, 207–213. [Google Scholar] [CrossRef] [PubMed]
- Ahmad, T.; Ahmad, K.; Alam, M. Characterization of water treatment plant’s sludge and its safe disposal options. Procedia Environ. Sci. 2016, 35, 950–955. [Google Scholar] [CrossRef]
- Sales, A.; Francis Rodrigues de Souza. Concretes and mortars recycled with water treatment sludge and construction and demolition rubble. Construct. Build. Mater. 2009, 23, 2362–2370. [Google Scholar] [CrossRef]
- Chen, H.; Ma, X.; Dai, H. Reuse of water purification sludge as raw material in cement production. Cem. Concr. Comp. 2010, 32, 436–439. [Google Scholar] [CrossRef]
- Babatunde, A.O.; Zhao, Y.Q. Constructive approaches toward water treatment works sludge management: An international review of beneficial reuses. Crit. Rev. Environ. Sci. Technol. 2007, 37, 129–164. [Google Scholar] [CrossRef]
- Magilligan, F.J.; Nislow, K.H. Changes in hydrologic regime by dams. Geomorphology 2005, 71, 61–78. [Google Scholar] [CrossRef]
- Kim, D.K.; Jeong, K.S.; Whigham, P.A.; Joo, G.J. Winter diatom blooms in a regulated river in South Korea: Explanations based on evolutionary computation. Freshw. Biol. 2007, 52, 2021–2041. [Google Scholar] [CrossRef]
- Lee, S.-H.; Kim, B.-R.; Lee, H.-W. A study on water quality after construction of the weirs in the middle area in Nakdong River. J. Korean Soc. Environ. Eng. 2014, 36, 258–264. [Google Scholar] [CrossRef]
- Jung, K.Y.; Lee, K.-L.; Im, T.H.; Lee, I.J.; Kim, S.; Han, K.-Y.; Jung, M.A. Evaluation of water quality for the Nakdong River watershed using multivariate analysis. Environ. Technol. Innov. 2016, 5, 67–82. [Google Scholar] [CrossRef]
- Andinet, T.; Kim, I.; Kim, J. Mini-review on river eutrophication and bottom improvement techniques, with special emphasis on the Nakdong River. J. Environ. Sci. 2015, 30, 113–121. [Google Scholar]
- Binzer, A.; Guill, C.; Rall, B.C.; Brose, U. Interactive effects of warming, eutrophication and size structure: Impacts on biodiversity and food-web structure. Glob. Chang. Biol. 2016, 22, 220–227. [Google Scholar] [CrossRef] [PubMed]
- Sillanpää, M.; Ncibi, M.C.; Matilainen, A.; Vepsäläinen, M. Removal of natural organic matter in drinking water treatment by coagulation: A comprehensive review. Chemosphere 2018, 190, 54–71. [Google Scholar] [CrossRef] [PubMed]
- Lehmann, J.; Joseph, S. (Eds.) Biochar for Environmental Management: Science, Technology and Implementation; Routledge: London, UK, 2015. [Google Scholar]
- Lehmann, J. A handful of carbon. Nature 2007, 447, 143–144. [Google Scholar] [CrossRef] [PubMed]
- Taghizadeh-Toosi, A.; Clough, T.J.; Condron, L.M.; Sherlock, R.R.; Anderson, C.R.; Craigie, R.A. Biochar incorporation into pasture soil suppresses in situ nitrous oxide emissions from ruminant urine patches. J. Environ. Qual. 2011, 40, 468–476. [Google Scholar] [CrossRef] [PubMed]
- Gascó, G.; Blanco, C.G.; Guerrero, F.; Lázaro, A.M. The influence of organic matter on sewage sludge pyrolysis. J. Anal. Pyrol. 2005, 74, 413–420. [Google Scholar]
- He, Y.D.; Zhai, Y.B.; Li, C.T.; Yang, F.; Chen, L.; Fan, X.P.; Fu, Z.M. The fate of Cu, Zn, Pb and Cd during the pyrolysis of sewage sludge at different temperatures. Environ. Technol. 2010, 31, 567–574. [Google Scholar] [CrossRef] [PubMed]
- Hwang, I.H.; Ouchi, Y.; Matsuto, T. Characteristics of leachate from pyrolysis residue of sewage sludge. Chemosphere 2007, 68, 1913–1919. [Google Scholar] [CrossRef] [PubMed]
- Taek–Keun, O.; Bongsu, C.; Yoshiyuki, S.; Jiro, C. Characterization of biochar derived from three types of biomass. J. Fac. Agric. Kyushu Univ. 2012, 57, 61–66. [Google Scholar]
- Agrafioti, E.; Bouras, G.; Kalderis, D.; Diamadopoulos, E. Biochar production by sewage sludge pyrolysis. J. Anal. Appl. Pyrol. 2013, 101, 72–78. [Google Scholar] [CrossRef]
- Thangarajan, R.; Bolan, N.; Mandal, S.; Kunhikrishnan, A.; Choppala, G.; Karunanithi, R.; Qi, F. Biochar for Inorganic Contaminant Management in Soil. Biochar Production, Characterization, and Applications; CRC Press, Taylor & Francis: Boca Raton, FL, USA, 2015; pp. 100–138. [Google Scholar]
- Ok, Y.S.; Uchimiya, S.M.; Chang, S.X.; Bolan, N. Biochar: Production, Characterization, and Applications; CRC Press: Boca Raton, FL, USA, 2015. [Google Scholar]
- Mukome, F.N.D.; Parikh, S.J. Chemical, Physical, and Surface Characterization of Biochar; CRC Press: Boca Raton, FL, USA, 2015; pp. 68–96. [Google Scholar]
- Rodríguez, N.H.; Ramírez, S.M.; Varela, M.B.; Guillem, M.; Puig, J.; Larrotcha, E.; Flores, J. Re-use of drinking water treatment plant (DWTP) sludge: Characterization and technological behaviour of cement mortars with atomized sludge additions. Cem. Concr. Res. 2010, 40, 778–786. [Google Scholar] [CrossRef]
- Oinuma, K.; Hayashi, H. Infrared study of mixed-layer clay minerals. Am. Mineral. 1965, 50, 1213–1227. [Google Scholar]
- Danková, Z.; Mockovčiaková, A.; Dolinská, S. Influence of ultrasound irradiation on cadmium cations adsorption by montmorillonite. Desalin. Water Treat. 2014, 52, 5462–5469. [Google Scholar] [CrossRef]
- Zhang, J.; Gong, J.L.; Zenga, G.M.; Ou, X.M.; Jiang, Y.; Chang, Y.N.; Liu, H.Y. Simultaneous removal of humic acid/fulvic acid and lead from landfill leachate using magnetic graphene oxide. Appl. Surf. Sci. 2016, 370, 335–350. [Google Scholar] [CrossRef]
- Wu, P.; Zhang, Q.; Dai, Y.; Zhu, N.; Dang, Z.; Li, P.; Wang, X. Adsorption of Cu (II), Cd (II) and Cr (III) ions from aqueous solutions on humic acid modified Ca-montmorillonite. Geoderma 2011, 164, 215–219. [Google Scholar] [CrossRef]
- Guizani, C.; Jeguirim, M.; Valin, S.; Limousy, L.; Salvador, S. Biomass chars: The effects of pyrolysis conditions on their morphology, structure, chemical properties and reactivity. Energies 2017, 10, 796. [Google Scholar] [CrossRef]
- Tantawy, M.A. Characterization and pozzolanic properties of calcined alum sludge. Mater. Res. Bull. 2015, 415–421. [Google Scholar] [CrossRef]
- Bera, T.; Purakayastha, T.J.; Patra, A.K.; Datta, S.C. Comparative analysis of physicochemical, nutrient, and spectral properties of agricultural residue biochars as influenced by pyrolysis temperatures. J. Mater. Cycles Waste Manag. 2017, 1–13. [Google Scholar] [CrossRef]
- Huang, C.-H.; Wang, S.-Y. Application of water treatment sludge in the manufacturing of lightweight aggregate. Construct. Build. Mater. 2013, 43, 174–183. [Google Scholar] [CrossRef]
- Wolff, E.; Schwabe, W.K.; Conceição, S.V. Utilization of water treatment plant sludge in structural ceramics. J. Clean. Prod. 2015, 96, 282–289. [Google Scholar] [CrossRef]
- Kizinievič, O.; Žurauskienė, R.; Kizinievič, V.; Žurauskas, R. Utilisation of sludge waste from water treatment for ceramic products. Construct. Build. Mater. 2013, 41, 464–473. [Google Scholar] [CrossRef]
- Chiang, K.Y.; Chou, P.H.; Hua, C.R.; Chien, K.L.; Cheeseman, C. Lightweight bricks manufactured from water treatment sludge and rice husks. J. Hazard. Mater. 2009, 171, 76–82. [Google Scholar] [CrossRef] [PubMed]
- Matilainen, A.; Gjessing, E.T.; Lahtinen, T.; Hed, L.; Bhatnagar, A.; Sillanpää, M. An overview of the methods used in the characterisation of natural organic matter (NOM) in relation to drinking water treatment. Chemosphere 2011, 83, 1431–1442. [Google Scholar] [CrossRef] [PubMed]
- Tang, W.W.; Zeng, G.M.; Gong, J.L.; Liang, J.; Xu, P.; Zhang, C.; Huang, B.B. Impact of humic/fulvic acid on the removal of heavy metals from aqueous solutions using nanomaterials: A review. Sci. Total Environ. 2014, 468, 1014–1027. [Google Scholar] [CrossRef] [PubMed]


| Sample | Moisture Content | Volatile Matter Content | Ash Content | Fixed Carbon Content |
|---|---|---|---|---|
| CW | 8.17 ± 0.47 | 30.90 ± 0.10 | 63.5 ± 0.47 | 5.63 ± 0.40 |
| GU | 4.76 ± 0.51 | 25.20 ± 0.55 | 71.1 ± 0.43 | 3.69 ± 0.13 |
| Sample | C | H | N | O | H/C | C/N |
|---|---|---|---|---|---|---|
| CW Dried | 11.96 ± 0.17 | 2.77 ± 0.06 | 1.58 ± 0.03 | 10.98 ± 0.49 | 0.23 | 7.59 |
| CW 300 | 11.89 ± 0.75 | 1.93 ± 0.35 | 1.66 ± 0.02 | 10.33 ± 3.38 | 0.16 | 7.16 |
| CW 500 | 8.46 ± 0.32 | 1.26 ± 0.02 | 0.97 ± 0.02 | 2.79 ± 0.50 | 0.15 | 8.76 |
| CW 700 | 8.32 ± 0.36 | 0.71 ± 0.00 | 0.65 ± 0.02 | 4.77 ± 0.94 | 0.09 | 12.79 |
| CW 900 | 5.82 ± 1.03 | 0.20 ± 0.07 | 0.24 ± 0.04 | 4.40 ± 2.04 | 0.03 | 24.52 |
| GU Dried | 8.75 ± 0.11 | 2.25 ± 0.20 | 1.17 ± 0.08 | 9.15 ± 0.26 | 0.26 | 7.50 |
| GU 300 | 8.82 ± 0.69 | 1.77 ± 0.01 | 1.28 ± 0.06 | 8.09 ± 0.01 | 0.20 | 6.89 |
| GU 500 | 6.07 ± 0.07 | 1.06 ± 0.03 | 0.65 ± 0.01 | 4.32 ± 0.47 | 0.18 | 9.29 |
| GU 700 | 5.31 ± 0.78 | 0.60 ± 0.02 | 0.44 ± 0.01 | 3.64 ± 0.12 | 0.11 | 12.21 |
| GU 900 | 6.77 ± 0.04 | 0.18 ± 0.08 | 0.22 ± 0.03 | 2.16 ± 0.15 | 0.03 | 30.77 |
| Sample | Yield (%) | Organic Matter Yield (%) | ||||||
|---|---|---|---|---|---|---|---|---|
| 300 °C | 500 °C | 700 °C | 900 °C | 300 °C | 500 °C | 700 °C | 900 °C | |
| CW | 82.41 ± 1.65 | 71.45 ± 0.96 | 66.08 ± 0.58 | 63.80 ± 0.25 | 51.76 | 21.75 | 7.05 | 0.83 |
| GU | 89.62 ± 1.64 | 79.89 ± 0.67 | 74.23 ± 0.61 | 71.74 ± 0.03 | 64.09 | 30.42 | 10.84 | 2.21 |
| (%) | CW Dried | 300 | 500 | 700 | 900 |
|---|---|---|---|---|---|
| Si | 25.13 | 25.04 | 25.19 | 25.24 | 25.32 |
| Al | 16.58 | 17.51 | 18.01 | 18.23 | 18.06 |
| Fe | 3.90 | 3.64 | 3.46 | 3.33 | 3.56 |
| K | 1.15 | 1.09 | 1.07 | 1.07 | 1.17 |
| S | 1.02 | 0.75 | 0.41 | 0.18 | 0.19 |
| Ca | 0.90 | 0.79 | 0.74 | 0.74 | 0.83 |
| P | 0.58 | 0.56 | 0.54 | 0.61 | 0.46 |
| Cl | 0.39 | 0.34 | 0.31 | 0.25 | 0.09 |
| Mg | 0.34 | 0.36 | 0.36 | 0.45 | 0.49 |
| Ti | 0.32 | 0.30 | 0.28 | 0.28 | 0.32 |
| Na | 0.19 | 0.22 | 0.22 | 0.28 | 0.31 |
| Si | 25.26 | 25.05 | 25.16 | 25.18 | 25.45 |
| Al | 17.05 | 17.73 | 17.93 | 18.30 | 18.07 |
| Fe | 4.25 | 3.76 | 3.77 | 3.70 | 3.63 |
| K | 1.36 | 1.28 | 1.27 | 1.25 | 1.17 |
| Ca | 0.95 | 0.84 | 0.87 | 0.86 | 0.80 |
| Mg | 0.46 | 0.53 | 0.53 | 0.51 | 0.45 |
| S | 0.50 | 0.46 | 0.27 | 0.11 | 0.14 |
| Cl | 0.42 | 0.43 | 0.41 | 0.26 | 0.09 |
| P | 0.36 | 0.39 | 0.36 | 0.34 | 0.42 |
| Ti | 0.40 | 0.36 | 0.36 | 0.36 | 0.33 |
| Na | 0.22 | 0.28 | 0.26 | 0.26 | 0.28 |
| Band Position (cm−1) | Component |
|---|---|
| 450–470 | Aromatic rings C-C stretching 470: Si-O-Si |
| 790, 875, 1190 | CO32− |
| 910 | OH bending bounded 2 Al3+ |
| 1010 | C-H deformation substituted aromatics |
| 1030–1040 | Si-O, C-N stretching, C-O stretching |
| 1080–1090 | C-O-C ether |
| 1160 | C-O-C ester groups in cellulose |
| 1380–1460 | 1416 (aromatic ring –), 1460-Stretching of C=O in cyclic amides 1375 phenolic O-H bendng, 1440 aromatic C=C stretching |
| 1600–1660 | 1645(C=O in cyclic amides) 1630 (Aromatic C-C ring stretching, 1643 (H-O-H bending)- 1550–1680 quinones 1600 aromatic C-C or quinones’s C=O |
| 2850, 2920, 2960 | 2850, 2920 (aliphatic CH2 stretching) 2960 (aliphatic ethers), alkyl/aliphatic C-H stretching |
| 3400–3440 | Alcoholic and phenolic OH stretching |
| (mg/kg) | Arsenic | Cadmium | Lead | Copper | Nickel | Zinc |
|---|---|---|---|---|---|---|
| CW | 35.63 ± 0.26 | 0.38 ± 0.02 | 18.84 ± 0.39 | 46.61 ± 0.17 | 36.96 ± 0.25 | 104.06 ± 0.88 |
| CW_300 °C | 40.33 ± 2.24 | 0.44 ± 0.00 | 20.28 ± 0.22 | 50.62 ± 0.29 | 40.64 ± 0.73 | 115.34 ± 4.14 |
| CW_500 °C | 45.67 ± 0.30 | 0.51 ± 0.02 | 22.61 ± 0.25 | 54.30 ± 0.84 | 45.38 ± 0.81 | 134.52 ± 0.88 |
| CW_700 °C | 46.46 ± 3.27 | 0.37 ± 0.04 | 22.95 ± 0.47 | 60.88 ± 1.57 | 49.03 ± 0.62 | 147.16 ± 0.50 |
| CW_900 °C | 29.58 ± 3.07 | 0.18 ± 0.05 | 45.41 ± 4.68 | 239.51 ± 35.47 | 79.32 ± 27.73 | 247.59 ± 41.89 |
| GE | 21.16 ± 2.07 | 0.40 ± 0.06 | 65.59 ± 14.37 | 266.58 ± 78.97 | 29.94 ± 0.07 | 259.19 ± 34.43 |
| GU_300 °C | 20.60 ± 0.88 | 0.47 ± 0.01 | 57.09 ± 2.89 | 267.53 ± 38.07 | 35.58 ± 1.48 | 249.74 ± 1.36 |
| GU_500 °C | 23.32 ± 0.31 | 0.49 ± 0.03 | 53.80 ± 2.31 | 287.54 ± 9.41 | 41.09 ± 3.38 | 315.76 ± 3.64 |
| GU_700 °C | 22.49 ± 0.50 | 0.24 ± 0.03 | 65.05 ± 1.47 | 257.81 ± 12.80 | 40.07 ± 2.97 | 301.53 ± 13.14 |
| GU_900 °C | 23.44 ± 2.46 | 0.12 ± 0.02 | 48.50 ± 10.75 | 283.80 ± 20.11 | 44.10 ± 1.33 | 230.85 ± 11.25 |
© 2018 by the authors. Licensee MDPI, Basel, Switzerland. This article is an open access article distributed under the terms and conditions of the Creative Commons Attribution (CC BY) license (http://creativecommons.org/licenses/by/4.0/).
Share and Cite
Lee, Y.-E.; Kim, I.-T.; Yoo, Y.-S. Stabilization of High-Organic-Content Water Treatment Sludge by Pyrolysis. Energies 2018, 11, 3292. https://doi.org/10.3390/en11123292
Lee Y-E, Kim I-T, Yoo Y-S. Stabilization of High-Organic-Content Water Treatment Sludge by Pyrolysis. Energies. 2018; 11(12):3292. https://doi.org/10.3390/en11123292
Chicago/Turabian StyleLee, Ye-Eun, I-Tae Kim, and Yeong-Seok Yoo. 2018. "Stabilization of High-Organic-Content Water Treatment Sludge by Pyrolysis" Energies 11, no. 12: 3292. https://doi.org/10.3390/en11123292
APA StyleLee, Y.-E., Kim, I.-T., & Yoo, Y.-S. (2018). Stabilization of High-Organic-Content Water Treatment Sludge by Pyrolysis. Energies, 11(12), 3292. https://doi.org/10.3390/en11123292