Article

Parametric Analysis of Buildings’ Heat Load Depending on Glazing—Hungarian Case Study

Department of Building Services and Building Engineering, Faculty of Engineering, University of Debrecen, 4028 Debrecen, Hungary
*
Author to whom correspondence should be addressed.
Energies 2018, 11(12), 3291; https://doi.org/10.3390/en11123291
Submission received: 29 October 2018 / Revised: 16 November 2018 / Accepted: 23 November 2018 / Published: 25 November 2018
(This article belongs to the Special Issue Energy Efficiency in Buildings: Both New and Rehabilitated)

Abstract

:
The share of cooling is rising in the energy balance of buildings. The reason is for increasing occupants’ comfort needs, which is accentuated by the fact that the number and the amplitude of heat waves are increasing. The comfortable and healthy indoor environment should to be realized with the minimum amount of energy and fossil fuels. In order to meet this goal, designers should know the effect of different parameters on the buildings’ energy consumption. The energy need for cooling is mainly influenced by the glazed ratio and orientation of the facades, the quality of glazing and shading. In this paper the heat load analysis was done by assuming different types of summer days and surface cooling, depending on the glazing ratio, shading factor and solar factor of glazing. It was proven that, for a certain parameter, the sensitivity of the heat load depends on the orientation and chosen summer day. If the glazing area is doubled, the heat load increases with about 30%. Decreasing the glazed area to 50%, the heat load decreases with about 10%. The heat load decreases with about 3% if the g factor is lowered with 25% or the shading factor is reduced with 60%.

1. Introduction

Mitigation of greenhouse gas emissions is a global goal and countries make important efforts to successfully meet this purpose [1,2,3]. Increasing the energy efficiency and reducing the energy demand have a priority in each sector. Significant results might be obtained through the energy conscious design of buildings. It was already shown that by proper thermal insulation of the buildings’ envelope and rational integration of renewable energy sources important energy savings can be obtained, see for example [4,5]. However, climate change does not help people in their pursuit of reducing the energy use in buildings. In countries with continental temperate climate 60–70% of the total energy consumption of a building was used for heating. In recent decades strict requirements related to the thermal properties of the buildings’ envelope and energy performance of buildings were introduced [6,7,8]. Besides the better thermal properties of the envelope, the warmer winters lead to the decrease of the heating energy demand. At the same time, because of the thermal comfort needs, the number of air conditioned buildings increased considerably. The share of energy use for cooling in the building’s energy balance increased in recent decades [9,10,11,12]. This is accentuated by the fact that, in recent decades, the number and the amplitude of heat waves during summer have been increasing [13]. By a proper design of thermal mass and heat storage capacity, the heat load of buildings might be reduced [14,15,16,17,18,19,20,21]. However, special attention has to be paid to the asymmetry of the solar radiation [22]. Cooling systems has to be chosen and designed in order to assure proper thermal comfort in closed spaces. In buildings, the required operative temperatures should be provided, minimizing the energy use and avoiding thermal discomfort. Integration of renewable energy sources can be efficiently done by low exergy cooling systems [23,24,25,26,27]. By choosing carefully the surface temperatures, air temperatures and air velocities in the occupation zone, then draught and asymmetric radiation can be avoided [28,29,30]. There are different methods and systems available to remove the heat load in a closed space [31,32,33,34]. However, to properly choose the cooling system, the heat load has to be determined as precisely as possible. Standard ISO 13790 and standard ISO 52016 give the calculation algorithm and methodology to determine the heat load of a building [35,36]. In the calculations, specific meteorological data have to be taken into account. Furthermore, the building configurations, the space shapes, the used building materials and energy performance requirements are specific for a region or country. In this paper the parametric analysis of building’s heat load was done taking into account solar radiation and temperature data from recent years registered in Debrecen, Hungary. It was decided to focus our study on the transparent area of the façade (glazing ratio, orientation, solar factor and shading ratio). Previously, it was demonstrated that the effect of windows U value on the buildings’ summer heat load is negligible in comparison to the effects of other physical properties of the glazing [37]. Furthermore, the heat gains through the opaque elements are negligible as well, if the envelope is properly insulated, even though there is an ageing process of the insulation material, which has to be taken into account [38].

2. Objectives and Hypothesis

Buildings’ heat load is influenced by a series of parameters. Some of these parameters are building dependent; others depend on the climate. The main goal of our research was to analyze the heat load variation in function of glazed ratio of the facades, orientation of glazing, solar factor of glazing and shading type. It was assumed that the sensitivity of the heat load in function of a certain building parameter is the highest for the South orientation of the facade.

3. Practical Implications

Proper design of buildings should result in low energy use and high comfort level. To reach the optimal solutions, complex analysis has to be done. The results of the present research may help practitioners, giving some insights on the buildings’ heat load sensitivity to different glazing parameters and on the influence of surface cooling type on the heat load of a conditioned space.

4. Methods

The heat load was determined using the calculation algorithm given by standard ISO 52016. According to this Standard the hourly values of the heat load are calculated in the following steps [28]:
  • At first the installed cooling capacity in the analyzed room (ΦHC,ld,un,ztc,t) is assumed to be zero (the room is not cooled);
  • The operative temperature (θint,op,0,ztc,t) is calculated in the room (the cooling system is not in operation);
  • If the calculated operative temperature exceeds the set point value (θint,op,set,ztc,t) required in the room, than the cooling load has to be calculated;
  • Firstly, the output of the cooling system is assumed to be ten times higher than the useful area of the room ΦHC,upper,ztc,t = 10 × Ause,ztc. With this theoretical cooling capacity the new operative temperature is calculated θint,op,upper,ztc,t.
  • The output of the cooling system will be:
    Φ H C , l d , u n , z t c , t = Φ H C , u p p e r , z t c , t · θ i n t , o p , s e t , z t c , t θ i n t , o p , 0 , z t c , t θ i n t , o p , u p p e r , z t c , t θ i n t , o p , 0 , z t c , t
The operative temperature is calculated as the average of the air temperature of the room and mean radiant temperature of the building elements (practically, the convective heat transfer coefficient and radiative heat transfer coefficient are considered to be equal).
The mean radiant temperature is calculated with Equation (2):
θ i n t , r , m n , z t c , t = e l i = 1 e l n ( A e l i · θ p l i = p l n , e l i , t ) e l i = 1 e l n A e l i
where:
θint,r,mn,ztc,t is the mean radiant temperature, in °C;
Aeli is the area of building element eli, in m2;
θpli= pln,eli,t is the temperature at node pli = pln of the building element eli, in °C
  • The indoor air temperature and the internal surface temperatures of the conditioned space are calculated based on the energy balance of the zone and energy balance of the building elements;
  • The energy balance equation of the zone is:
[ C i n t , z t c Δ t + e l i = 1 e l n ( A e l i · h c i , e l i ) + v e i v e n H v e , v e i , t + H t r , t b , z t c ] · θ i n t , a , z t c , t e l i = 1 e l n ( A e l i · h c i , e l i · θ p l n , e l i , t ) = C i n t , z t c Δ t · θ i n t , a , z t c , t 1 + v e i v e n ( H v e , v e i , t · θ s u p , v e i , t ) + H t r , t b , z t c · θ e , a , t + f i n t , c · Φ i n t , z t c , t + f s o l , c · Φ s o l , z t c , t + f H / C , c · Φ H C , z t c , t
where:
Cint,ztc,t is the internal thermal capacity of the zone, in J/K;
Δt is the length of the time interval, t in s;
θint,a,ztc,t is the internal air temperature, in °C
θint,a,ztc,t− 1 is the internal air temperature in the zone at previous time interval (t−Δt), in °C;
Aeli is the area of building element eli, in m2;
hci,eli is the internal convective surface heat transfer coefficient of the building element eli, in W/m2K;
Θpln,eli,t is the internal surface temperature of the building element eli, in °C;
Hve,k,t is the overall heat exchange coefficient by ventilation flow element k, in W/K;
Θsup,k,t is the supply temperature of ventilation flow element k, in °C;
Θe,a,t is the external air temperature, in °C;
Htr,tb,ztc is the overall heat transfer coefficient for thermal bridges, in W/K;
fint,c,ztc is the convective fraction of the internal gains;
fsol,c,ztc is the convective fraction of the solar radiation;
fH/C,c,ztc is the convective fraction of the cooling system;
Φint,ztc,t is the total internal heat gains, in W;
ΦHC,ztc,t is the cooling load (if negative), in calculation zone ztc, at time interval t, depending on type of application of the calculation, in W;
Φsol,ztc,t is the directly transmitted solar heat gain into the zone, summed over all window wi, in W;
  • Building elements are divided into three parts: inner side, inside and outer side and the energy balance equations are to be written for all three nodes;
  • The energy balance equation for internal side of a building element (“internal surface node”):
( h p l i 1 , e l i · θ p l i 1 , e l i , t ) + [ κ p l i , e l i Δ t + h c i , e l i + h r i , e l i · e l k = 1 e l n ( A e l k A t o t ) + h p l i 1 , e l i ] · θ p l i , e l i , t h c i , e l i · Θ i n t , a , z t , t e l k = 1 e l n ( h r i , e l i · A e l k A t o t · θ p l i , e l k , t ) = κ p l i , e l i Δ t · θ p l i , e l i , t 1 + 1 A t o t · [ ( 1 f i n t , c ) · Φ i n t , z t c , t + ( 1 f s o l , c ) · Φ s o l , z t c , t + ( 1 f H / C , c ) · Φ H C , z t c , t ]
where:
Aelk is the area of (this or other) building element elk, in zone ztc, in m2;
Atot is the sum areas Aelk of all building elements elk = 1,…,eln, in m2;
θpli,eli,t is the temperature at node pli, in °C;
θpli− 1,eli,t is the temperature at node pli − 1, in °C;
θint,a,ztc,t is the internal air temperature in the zone, in °C;
hpli− 1,eli,t is the conductance between node pli and node pli − 1, in W/m2K;
κpli,eli is the real heat capacity of node pli, in J/m2K;
hci,eli is the internal convective surface heat transfer coefficient, in W/m2K;
hri,eli is the internal radiative surface heat transfer coefficient, in W/m2K;
θpli,eli,t− 1 is the temperature at node pli, at previous time interval (t − Δt) in °C.
  • The energy balance equation inside the building element:
h p l i 1 , e l i · θ p l i 1 , e l i , t + [ κ p l i , e l i Δ t + h p l i , e l i + h p l i 1 , e l i ] · θ p l i , e l i , t h p l i , e l i · θ p l i + 1 , e l i , t = κ p l i , e l i Δ t · θ p l i , e l i , t 1
where:
θpli+ 1,eli,t is the temperature at node pli + 1, in °C;
hpli,eli,t is the conductance between node pli + 1 and node pli, in W/m2K;
  • The energy balance equation for the external side of a building element is:
( κ p l i , e l i Δ t + h c e , e l i + h r e , e l i + h p l i , e l i ) · θ p l i , e l i , t h p l i , e l i · θ p l i + 1 , e l i , t = κ p l i , e l i Δ t · θ p l i , e l i , t 1 + ( h c e , e l i + h r e , e l i ) · θ e , t + α s o l , p l i , e l i · ( I s o l , d i f , e l i , t + I s o l , d i r , e l i , t · F s h , o b s t , e l i , t ) θ s k y , e l i , t
where:
θe,a,t is the temperature of external environment, in °C;
hce,eli is the external convective surface heat transfer coefficient, in W/m2K;
hre,eli is the external radiative surface heat transfer coefficient, in W/m2K;
αsol,eli is the solar absorption coefficient at the external surface, in W/m2K;
Isol,dif,eli,t is the diffuse part (including circumsolar) of the solar irradiance on the element with tilt angle βeli and orientation angle γeli;
Isol,dir,eli,t∙is the direct part (excluding circumsolar) of the solar irradiance on the element with tilt angle βeli and orientation angle γeli;
Fsh,obst,eli,t is the shading reduction factor for external obstacles for the element;
θsky,eli,t is the (extra) thermal radiation to the sky, in W/m2;
βeli is the tilt angle of the element (from horizonal, measured upwards facing), in degrees;
γeli is the orientation angle of the element, in degrees.
  • For external opaque elements, five calculation nodes were taken into account (one on the internal side, one on the external and three inside the structure);
  • For external transparent elements two calculation nodes were taken into account (one inside and one on the outer side);
  • For internal building elements there are no prescriptions for the number of calculation nodes (we have calculated with nodes placed between the layers of the structures).
  • In the calculation, the heat storage capacity is taken into account depending on the heat storage class of the building structure:
Class I. (mass concentrated at internal side):
κ p l 5 , e l i = κ m , e l i
κ p l 1 , e l i = κ p l 2 , e l i = κ p l 3 , e l i = κ p l 4 , e l i = 0
Class E (mass concentrated at external side)
κ p l 1 , e l i = κ m , e l i
κ p l 2 , e l i = κ p l 3 , e l i = κ p l 4 , e l i = κ p l 5 , e l i = 0
Class IE (mass divided over internal and external side)
κ p l 1 , e l i = κ p l 5 , e l i = κ m , e l i 2
κ p l 2 , e l i = κ p l 3 , e l i = κ p l 4 , e l i = 0
Class D (equally distributed)
κ p l 1 , e l i = κ p l 5 , e l i = κ m , e l i 8
κ p l 2 , e l i = κ p l 3 , e l i = κ p l 4 , e l i = κ m , e l i 4
Class M (mass concentrated in side)
κ p l 3 , e l i = κ m , e l i
κ p l 1 , e l i = κ p l 2 , e l i = κ p l 4 , e l i = κ p l 5 , e l i = 0
where: κm,eli is the real heat capacity of opaque element eli, in J/m2K.
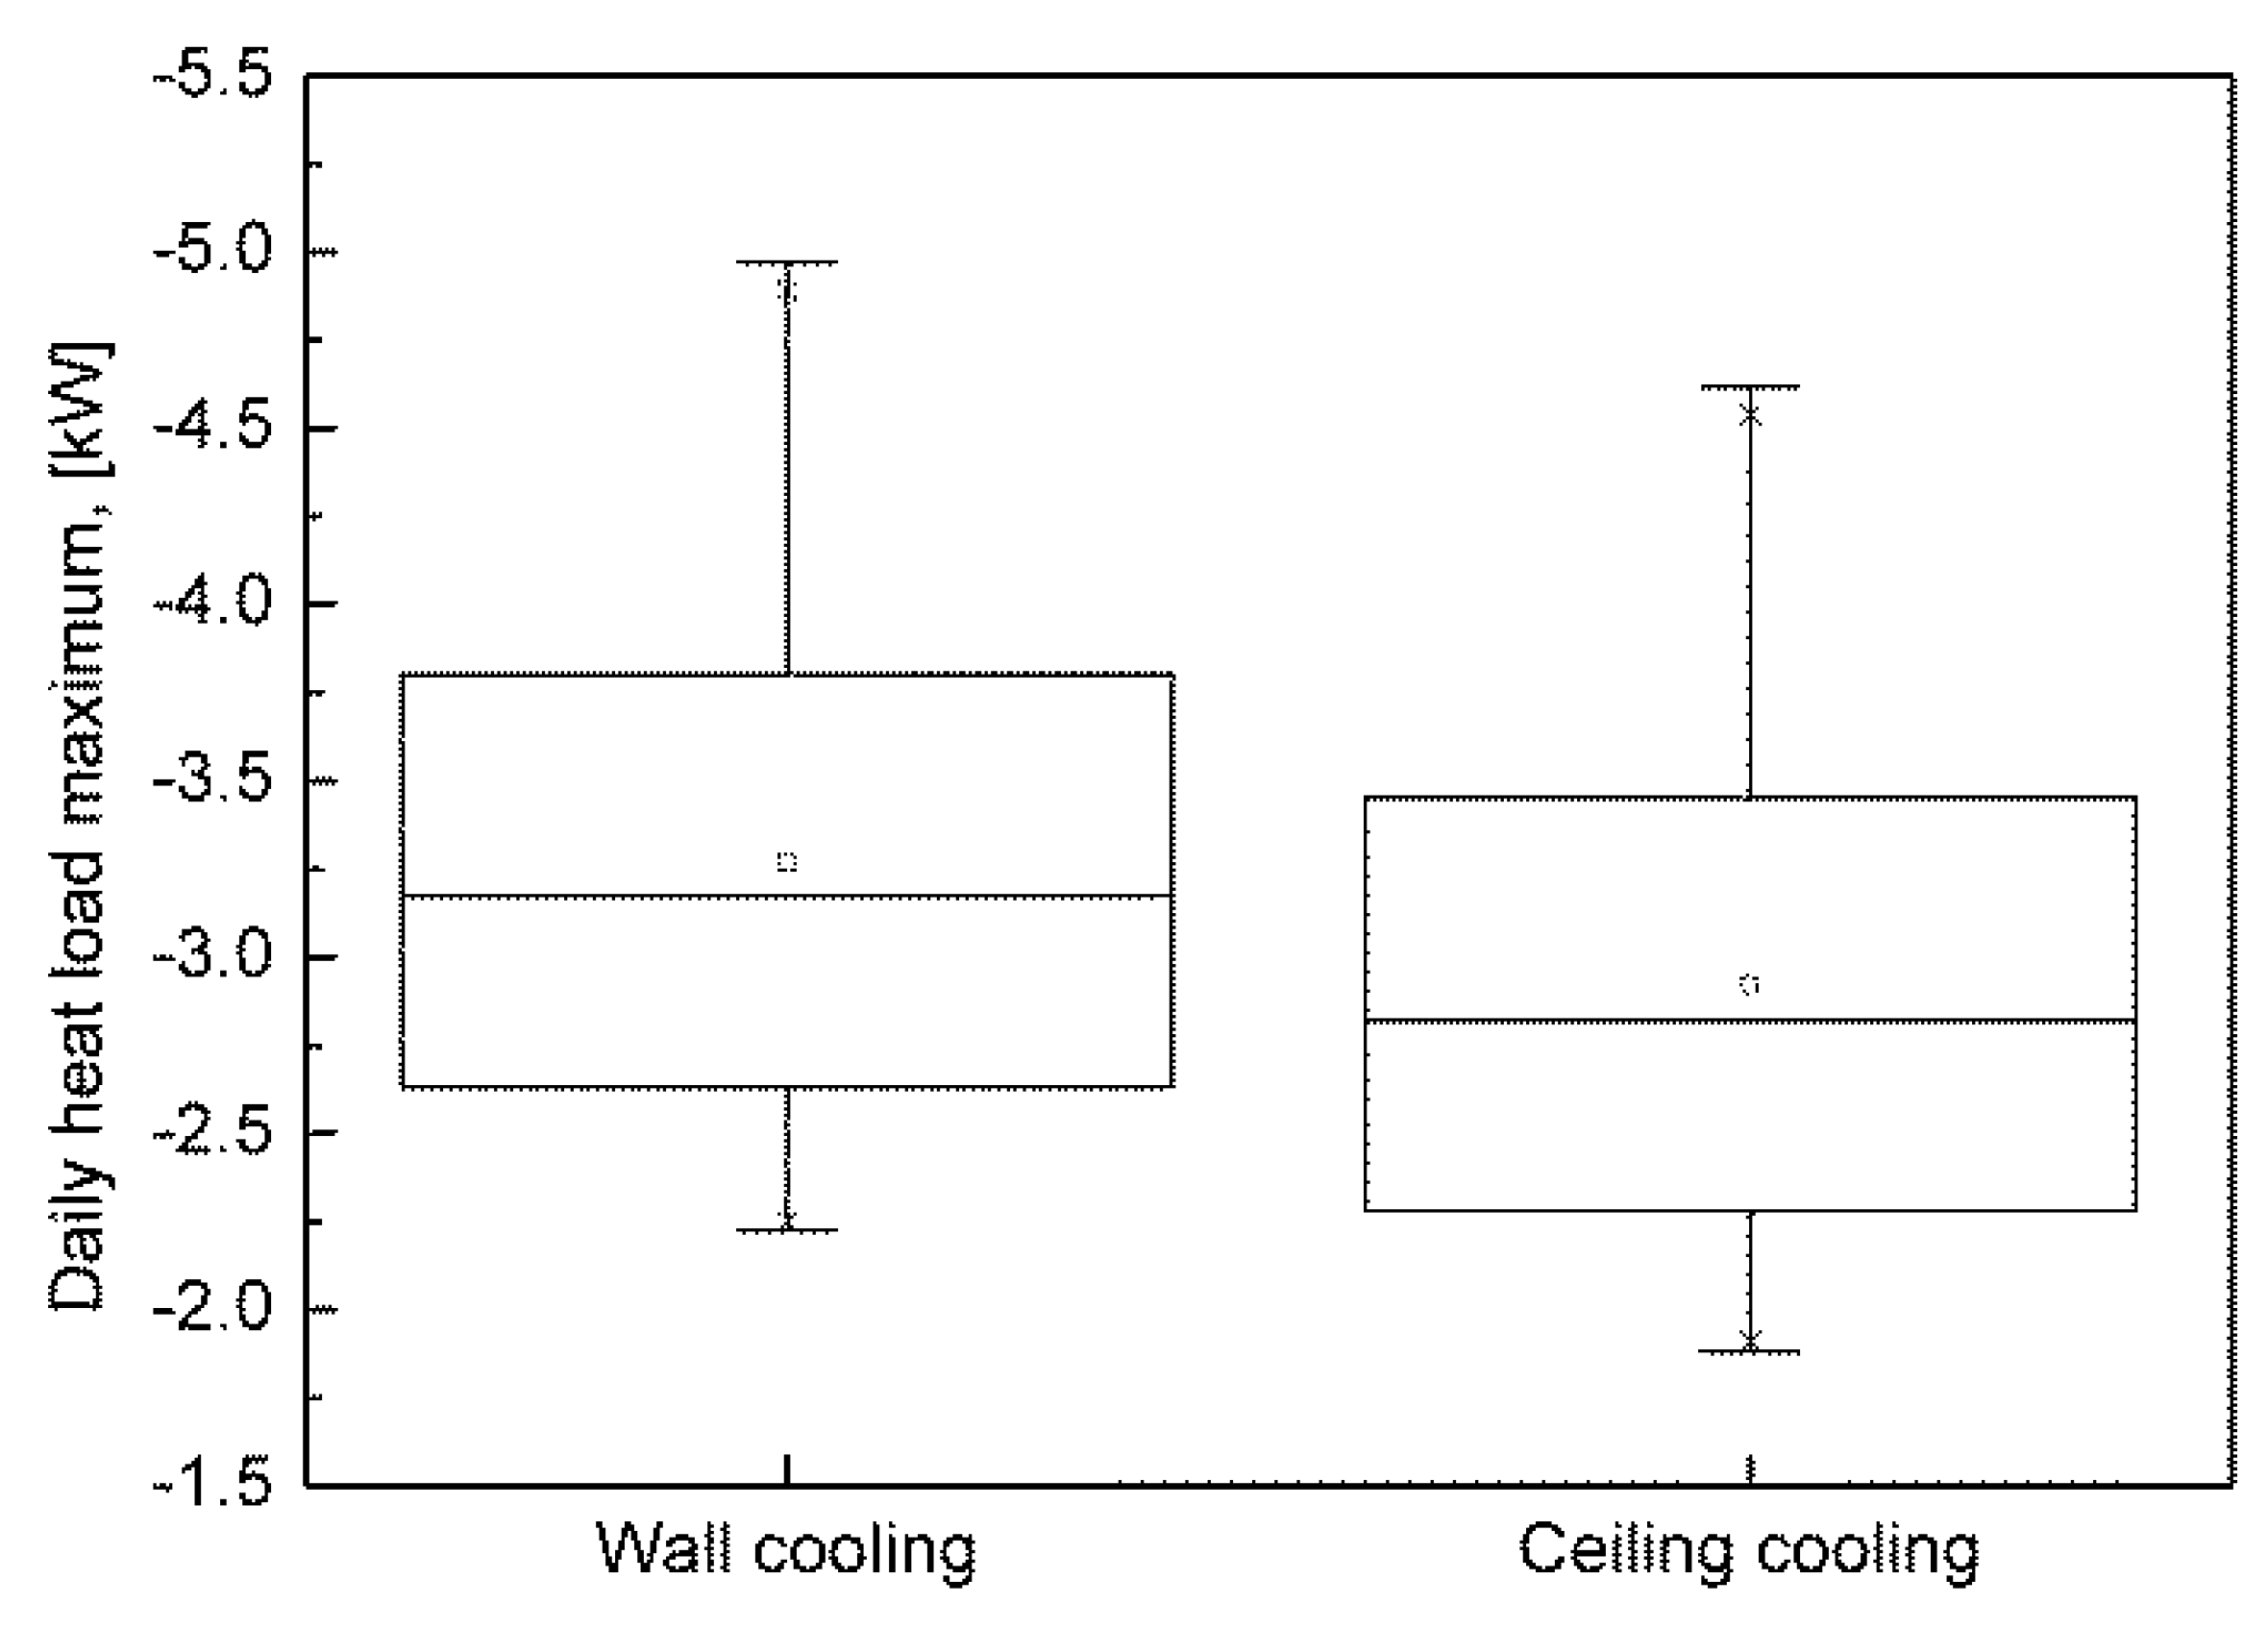
It was assumed that surface cooling systems are used in the conditioned room. The convective ratio (fC,c,ztc) was considered 40% in the case of wall, and 30% in the case of ceiling cooling.

4.1. The Analyzed Room

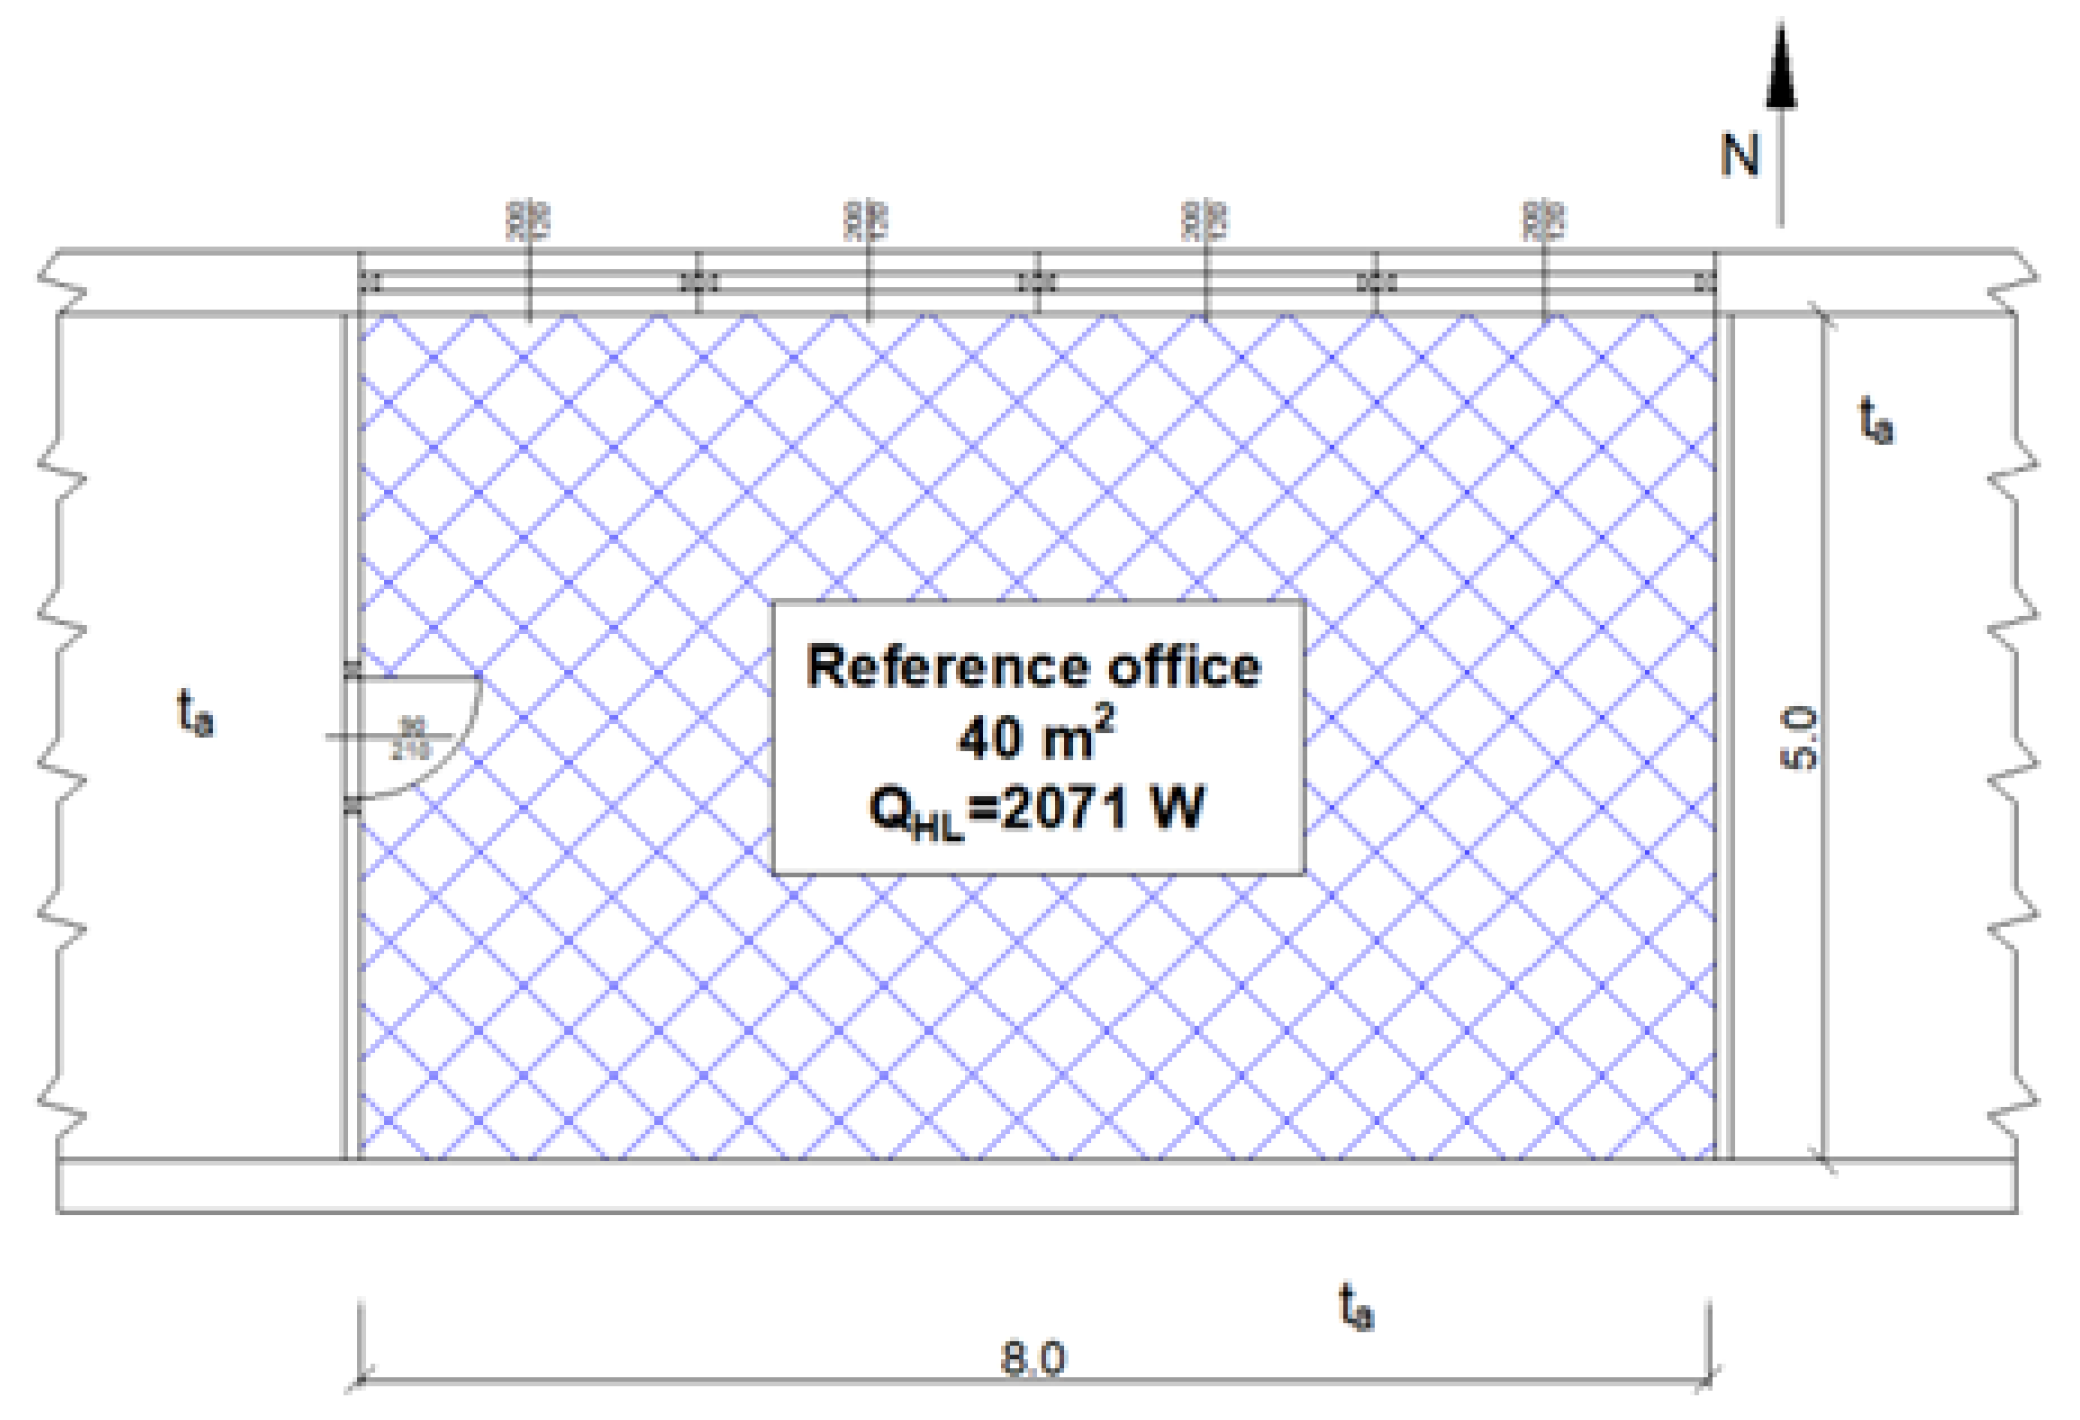
In order to perform the calculations, a reference room was taken into consideration, and placed on an intermediate floor an office building (Figure 1).
The room height is 3.5 m and has suspended ceiling (0.5 m). The slabs structure is: 2.0 cm lime plastering; 20 cm reinforced concrete, 6 cm concrete 0.6 cm tiles. The internal wall (opposite to the external wall) has the following structure: 2.0 cm lime plastering, 30 cm brick, 1.5 cm lime plastering. In the analyzed office, 10 persons are working between 8:00–17:00. Fresh air is 100% outdoor air and it is introduced in the room without changing its physical parameters. It is assumed that the fresh air flow is 30 m3/(h∙person). The overall heat transfer coefficient of the external wall is 0.24 W/(m2∙K), while the window has an overall heat transfer coefficient of 1.1 W/(m2∙K) (these values are currently required for a nearly zero energy building in Hungary). The heat storage capacity of the room is: 318110 J/m2K, (Class I). In the reference case, the glazed ratio of the external wall is 40% and the g value of glazing is 0.67.

4.2. Meteorological Parameters

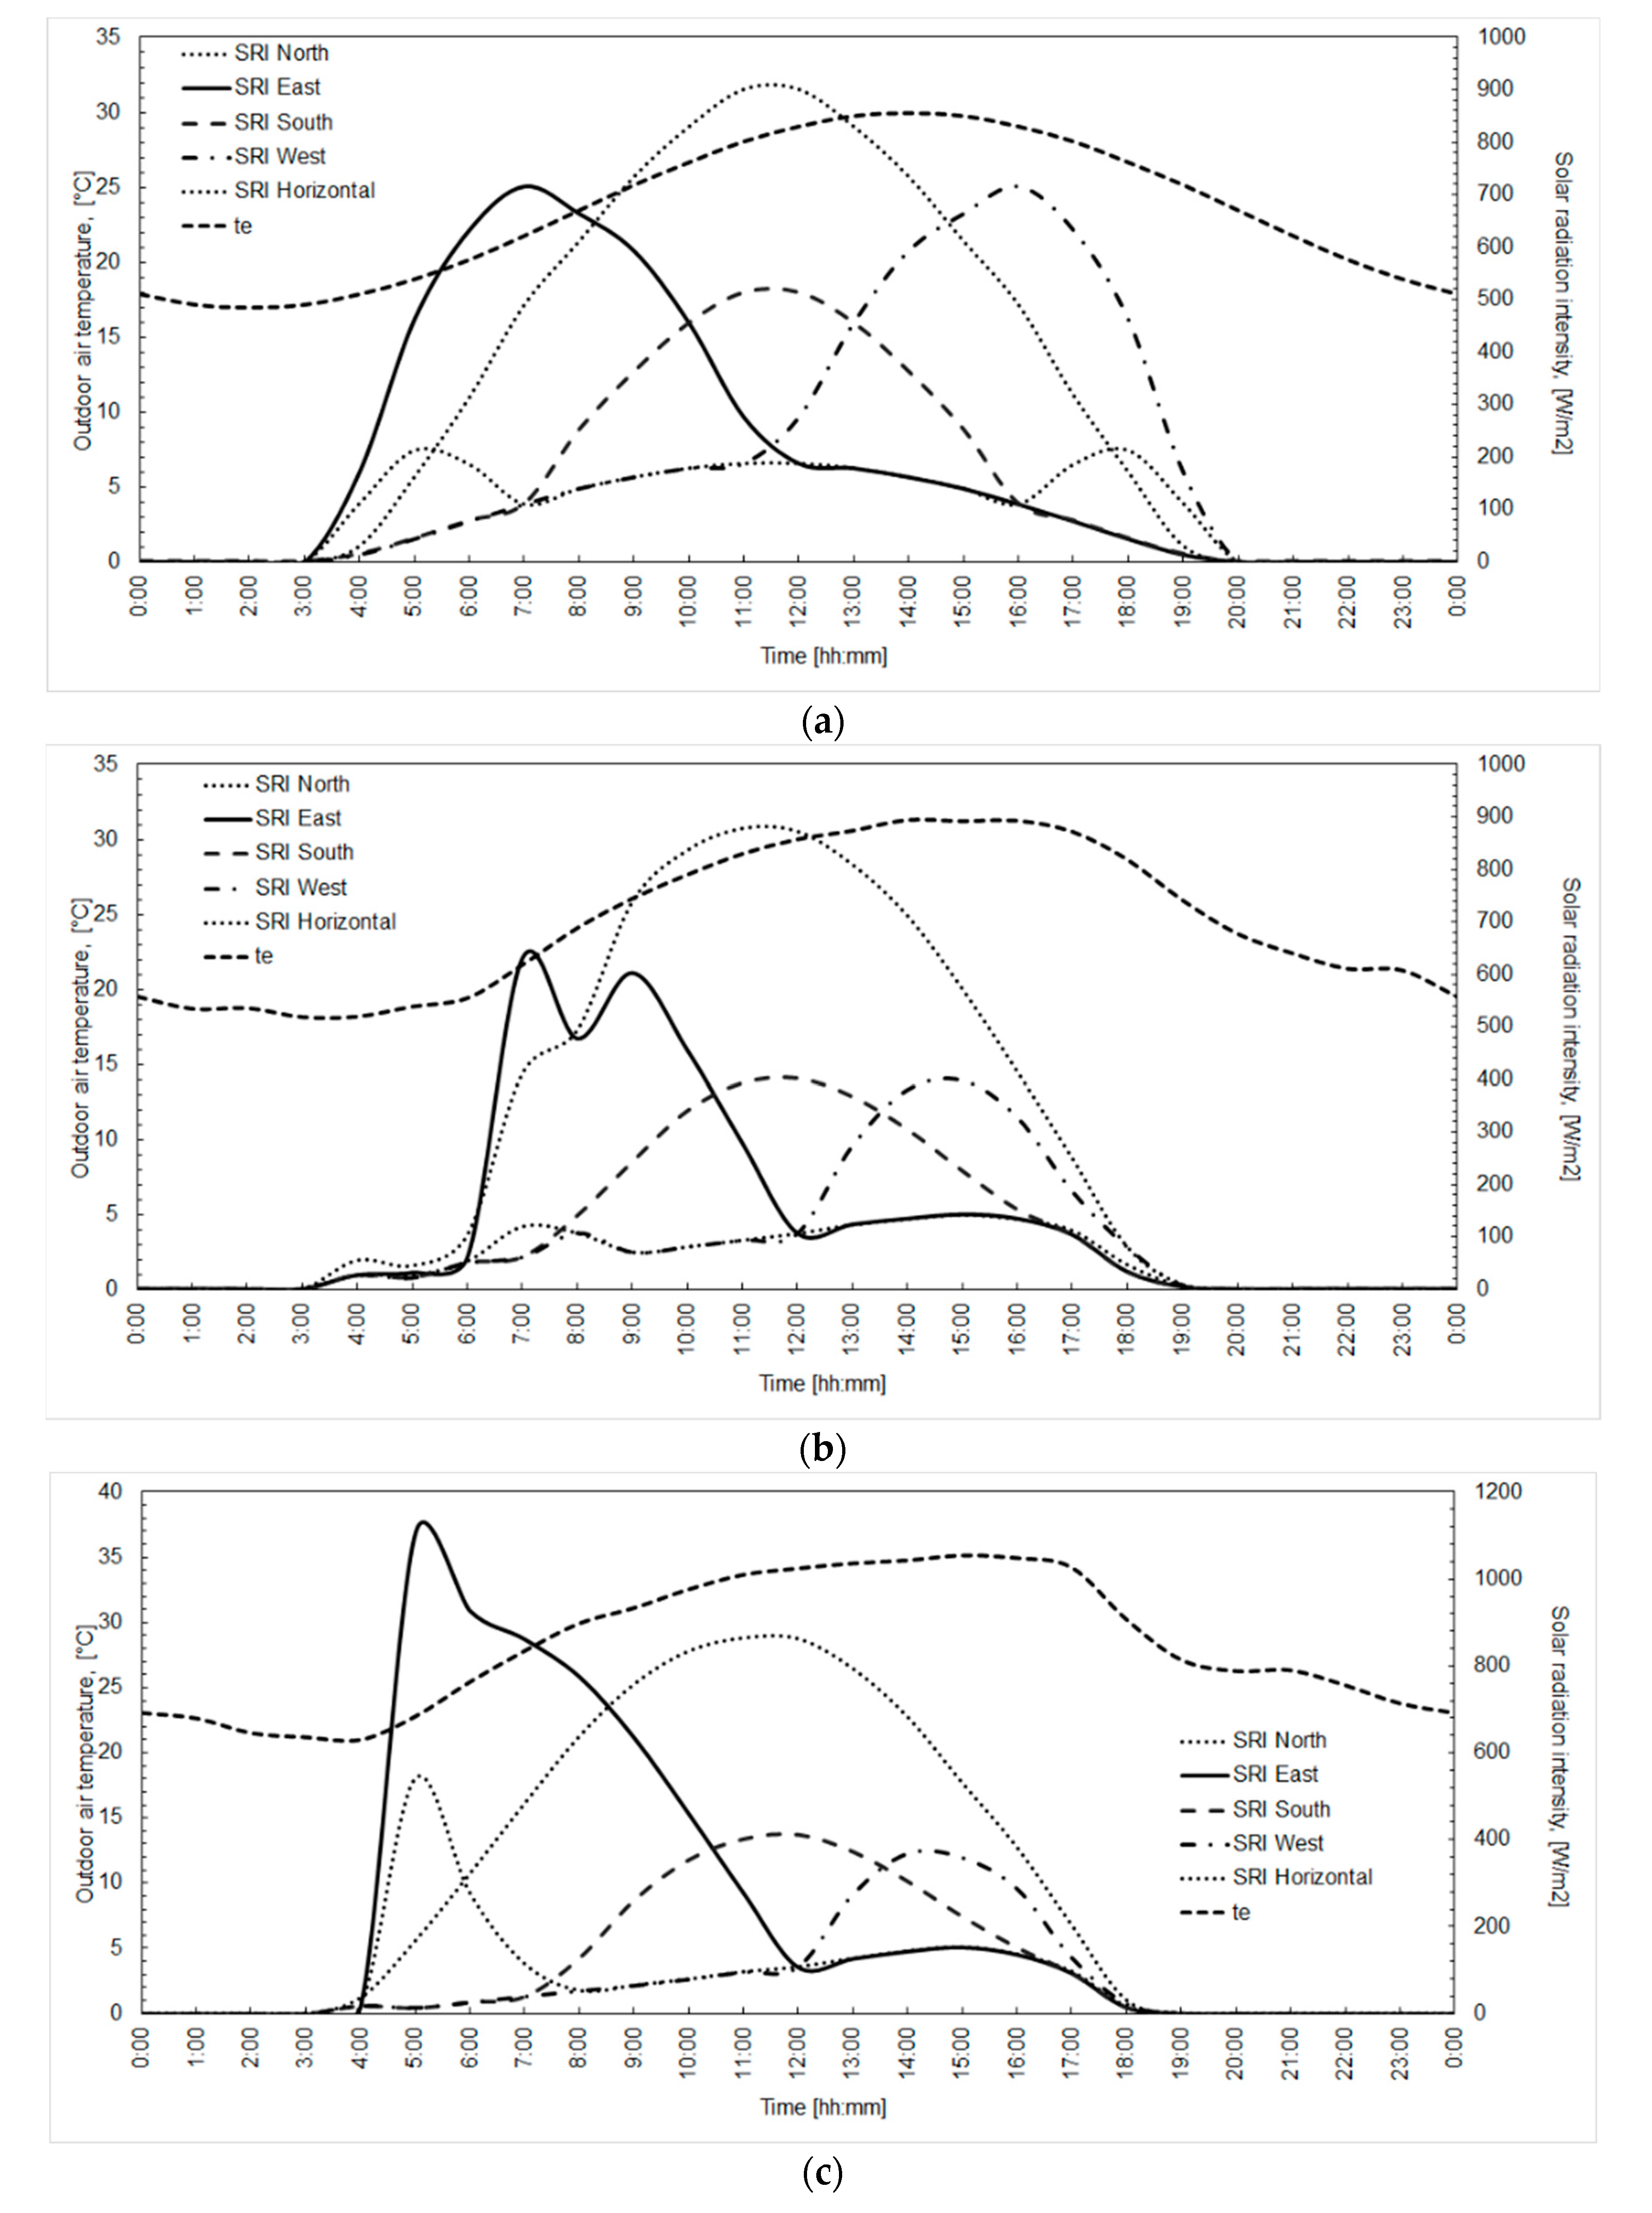
The incident solar radiation and the outdoor temperature in summer were analyzed for recent years. It was observed that in contrast with the previously used Hungarian 04140 Standard (which provides the solar radiation and temperature data for heat load calculation until 2012) the solar radiation does not show symmetry for East and West orientation. In most cases, the incident solar radiation intensity and the solar energy yield for East orientation exceeds the data registered for West orientation. These days were considered asymmetric days [14]. It was decided to analyze the heat load for one symmetric and two asymmetric days. Two extreme hot days were chosen (one symmetric and one asymmetric) and one extreme torrid asymmetric day. Those days are considered extreme hot days, which have an average outdoor temperature in the warmest hour higher than 30 °C. If the mean outdoor temperature in the warmest hour is higher than 35 °C, the day is called extreme torrid. The outdoor temperature variation and the incident solar radiation intensity for the chosen days can be seen in Figure 2. In Figure 2a the data for the extreme hot symmetric day is presented. Figure 2b shows the data for the extreme hot asymmetric day and in Figure 3c, the data for the extreme torrid asymmetric day can be found.
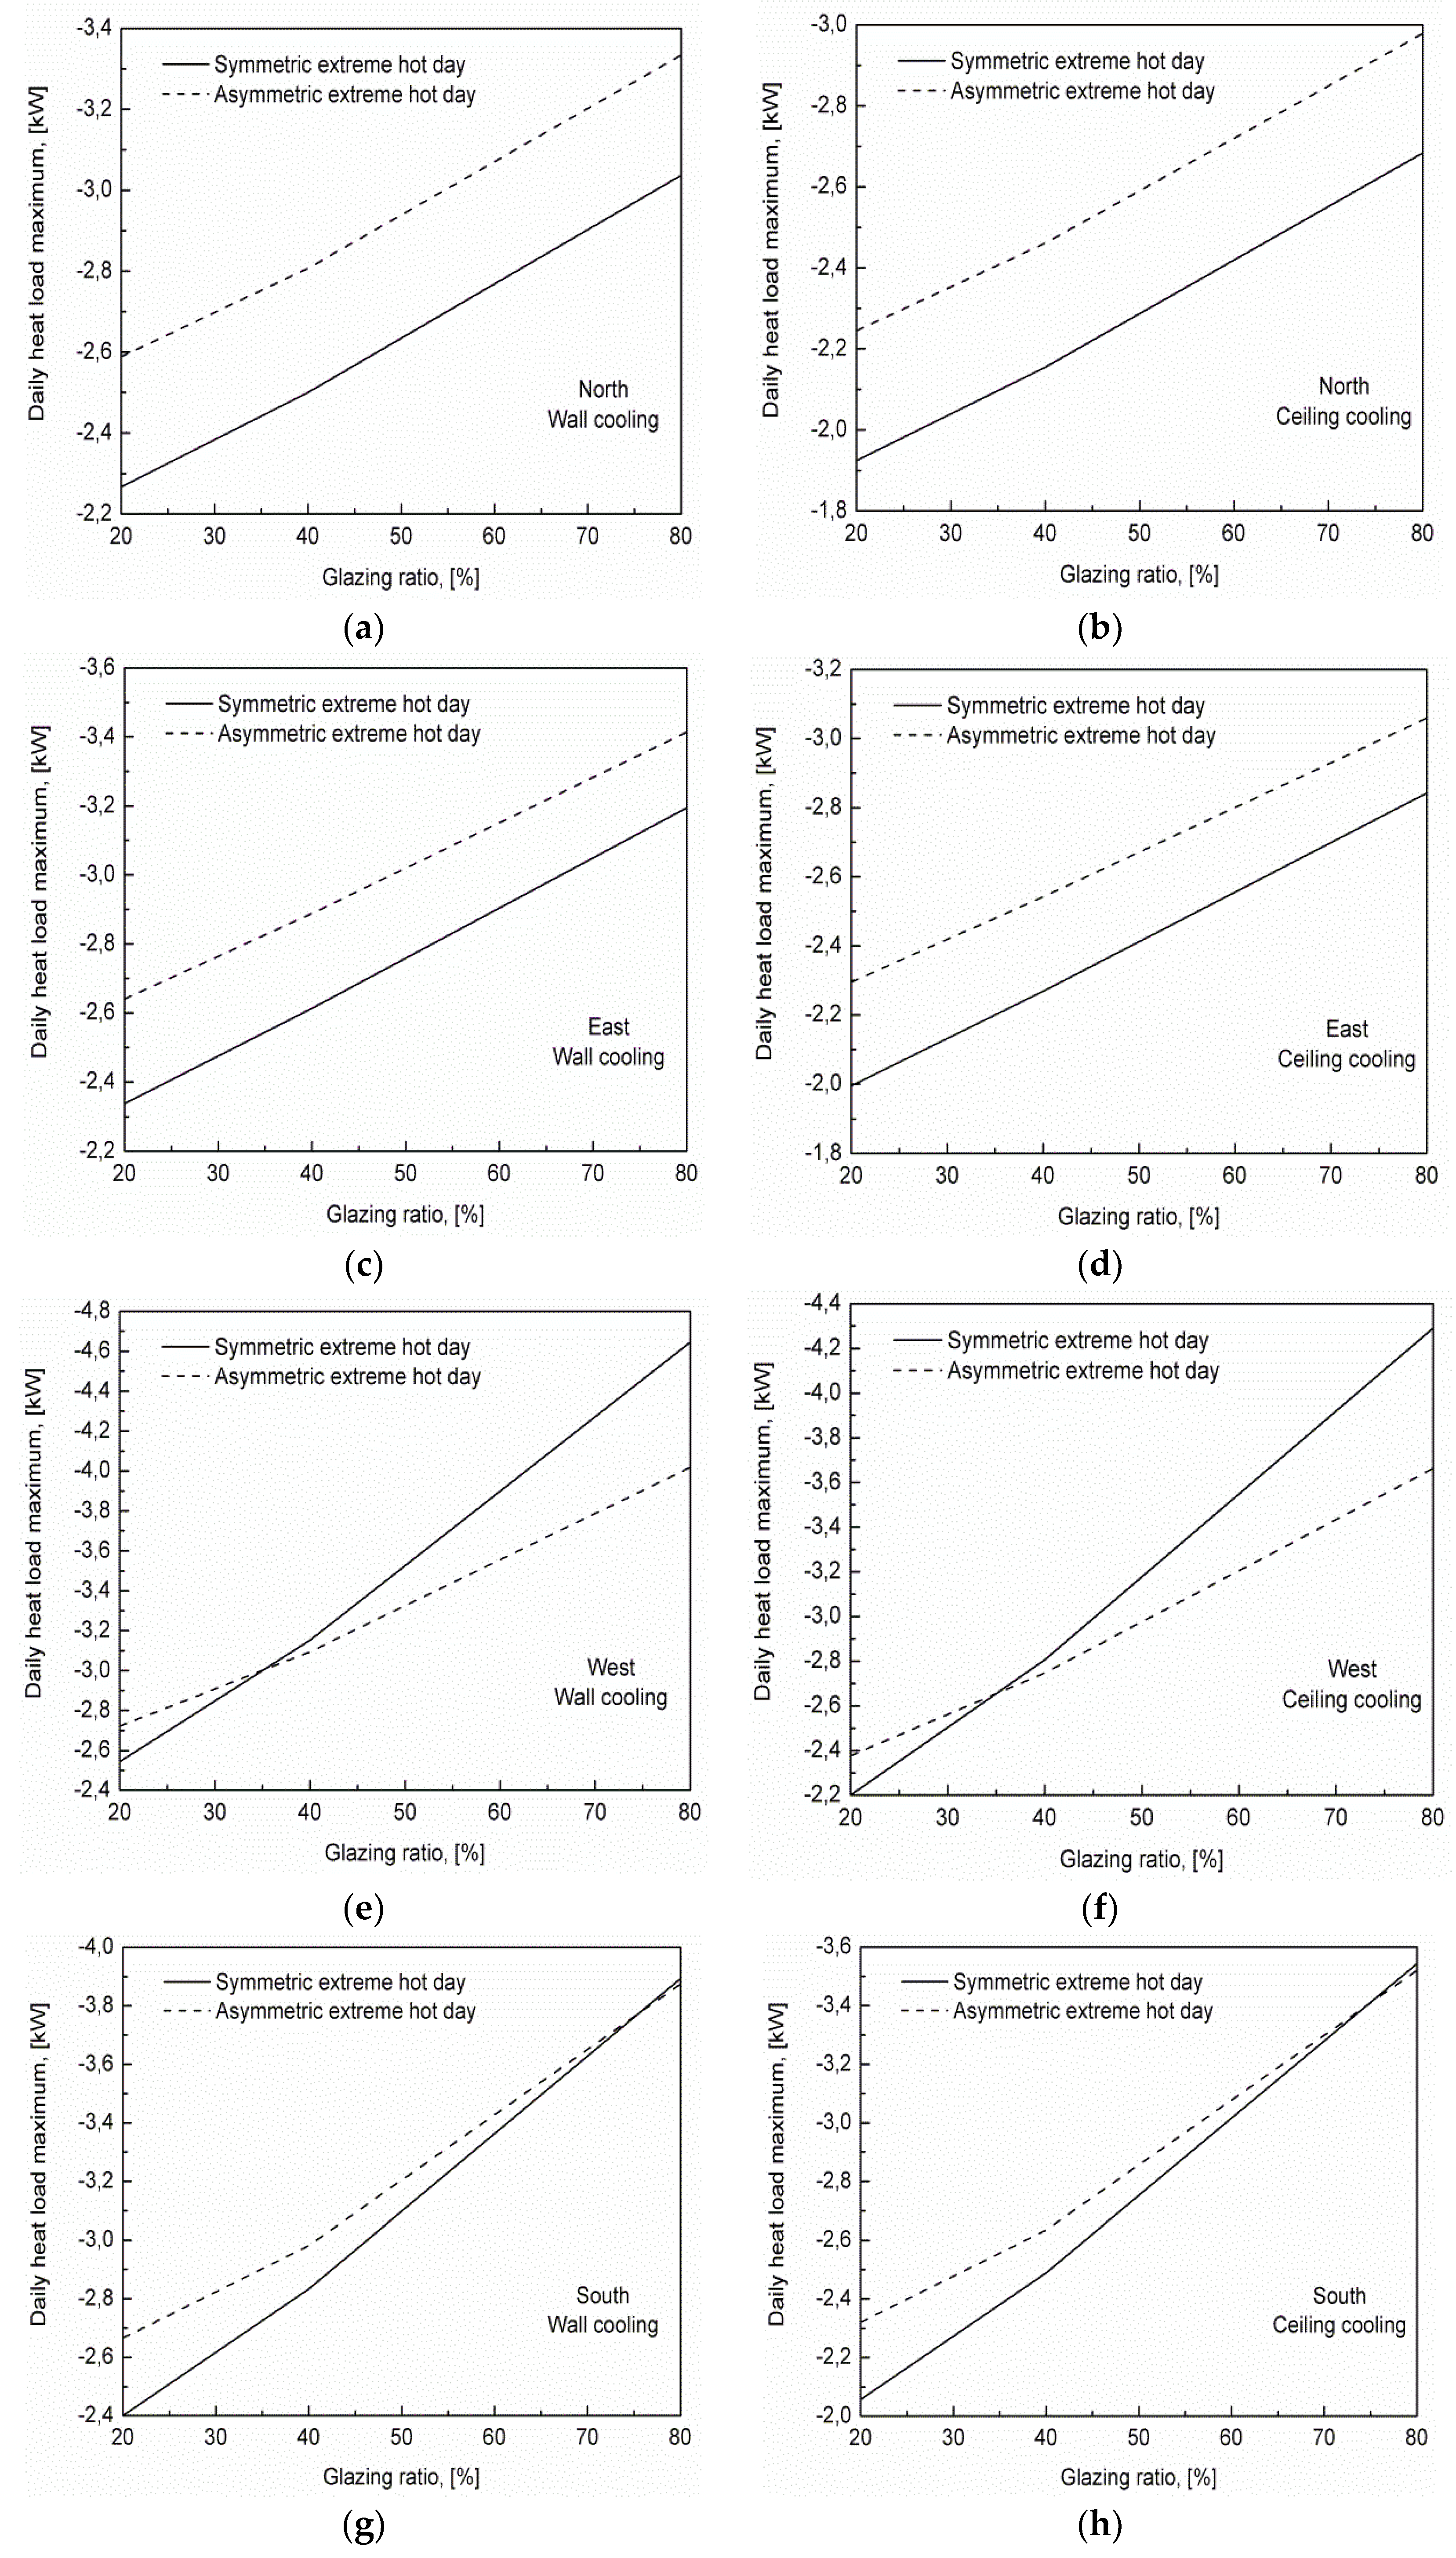
It was decided to analyze the heat load variation depending on the glazed ratio, total solar transmittance of the glazing and shading factor of glazing (Table 1).
As seen in the first column, the orientation, the meteorological parameters, the shading factor of the transparent surfaces, the glazing type (U and g values) and the glazed ratio of the facade were chosen as variables in the parametric study. We have four orientations of the facade, three days with different meteorological parameters, three types of shading, three types of glazing and three values for glazing ratio. The calculations were done for each combination of these parameters, so the heat load was computed for 648 cases (324—wall cooling; 324—ceiling cooling).

5. Results

In practice, the cooling equipments are chosen for the maximum value of the heat load. In our calculus the heat load variation for the whole day was determined, but from practical reasons in the following the maximum values will be presented and discussed. For the analyzed 648 cases, the computed maximum values of the daily heat load are presented in Figure 3.
The obtained daily maximum heat load values (324 for wall cooling and 324 for ceiling cooling) were classified into six classes (Table 2).
It can be observed that 55% of the obtained values are found in the 3rd and 6th classes, both for wall and ceiling cooling. The maximum values of the indoor operative temperatures can be seen in Table 3.
The effects of the glazed ration and orientation on the heat load can be seen in Figure 4.
The effects of the shading ratio, solar factor and glazing ratio on the heat load for West orientation of the facade are shown in Figure 5. On the abscissa, the variation of the analyzed parameter can be observed in [%]. The 0 value on the abscissa corresponds to the reference values of the solar factor, glazing ratio and shading ratio. It can be observed that the glazing ratio was increased and decreased, while the solar factor and the shading ratio were only decreased. The reason is that the reference value of the shading ratio was 1 (no shading), so this value cannot be increased further. Similarly, the reference value of the solar factor was 0.67 (this value is around the highest, which characterize the currently used windows).
It can be observed that the variation of glazing ratio, solar factor and shading ratio lead to a linear variation of the heat load maximum values if the calculation methodology given by Standard ISO 52016 is used. The variation of the heat load (in comparison to the reference case) for North, East and South orientation is given in Table 4, Table 5 and Table 6. In these tables, the heat load variation is shown both for wall and ceiling cooling. For each variable (Fobst, g-value and Gr) two values are presented. In the reference case the shading factor is 1. In the tables the heat load variation can be seen if the shading factor was decreased with 30% and 60% respectively. For solar factor, the reference value was decreased with 25.37% and increased with 4.48%. The glazing ratio of the facade was decreased with 50% and increased with 100%. It can be observed that the variation of the glazing ratio has the highest impact on the heat load. Furthermore, the highest variations of the heat load were obtained for symmetric hot day.

6. Discussion

The variation of the heat load depending on the glazing ratio, solar factor and shading is linear and can be characterized by the angle between the line of the heat load and horizontal axis. The higher angle means higher sensitivity. The angle values calculated for chosen days and each orientation are presented in Table 7.
It can be seen that in all cases, the heat load shows the highest angle (sensitivity) depending on the glazing ratio. Furthermore, it can be observed that for a certain orientation of the façade the sensitivity of the heat load is higher in case of ceiling cooling in comparison with the wall cooling. For all analyzed parameters, the highest sensitivity was obtained for symmetric hot day. The asymmetric hot day shows higher sensitivity than the asymmetric torrid day. For a certain parameter, day and surface cooling type the highest sensitivity is observed for West orientation. However, in the case of asymmetric days the sensitivity of the heat load for West and South orientation are almost similar.
The calculations were done assuming 70% heat exchange through radiation in the case of ceiling cooling and 60% in the case of wall cooling. In Figure 6. the sensitivity variation is presented for asymmetric extreme torrid day and West orientation of the faced for all analyzed parameters, taking into account other values for the radiation ratio (1296 simulations were done in total). For a certain parameter, (shading ratio, solar factor or glazing ratio) it can be seen that the highest sensitivity of the heat load is given by the ideal case (100% heat exchange by radiation). Decreasing the radiation ratio, the sensitivity shows lower values. If the glazing area is doubled, then the heat load increases with about 30%. Decreasing the glazed area to half, the heat load decreases with about 10%. The sensitivity of the heat load is almost similar in the case of solar factor and shading ratio. For real values of the radiation ratio the heat load decreases with about 3% if the g factor is lowered with 25% or the shading factor is reduced with 60%.
The limitations of our research are as follows:
  • We have taken into account windows which can be found on the market. The U and g values are specific for these products;
  • It was assumed an office with certain geometry and the number of occupants was set to 10. So, the internal heat loads were constant during the working hours;
  • The used global radiation and temperature values were measured in Debrecen, Hungary;
  • Surface cooling systems were taken into account. It was assumed that the fresh air (100% outdoor air) is provided in the conditioned room without changing its temperature and relative humidity.

7. Conclusions

In summer, the indoor thermal comfort in buildings is provided using air conditioning systems. The all-air cooling systems usually are using refrigerants and compressors and these systems are operating using electricity. By moving the cold air in the rooms, draught may lead to discomfort. Wall and ceiling cooling systems may avoid draught and the operation temperatures allow for the utilization of renewable energies. In order to obtain the highest performance of the cooling systems, the heat load ought to be determined as accurately as possible. The analysis performed clearly shows that the glazing ratio has the biggest influence on the heat load of a closed space. Considering windows widely used in practice (real values of the shading ratio and solar factor) the sensitivity of the heat load depending on these parameters is lower than 10% in the case of asymmetric days. The highest sensitivity values were obtained for symmetric days (rarely met in practice, but widely used for heat load calculations). The West and South orientations of the glazing leads to highest sensitivity values. The differences between the heat loads sensitivities obtained for different orientations were minimal in the case of asymmetric torrid days. The sensitivity of the maximum values of the heat load shows a linear variation depending on the analyzed parameters (glazing ratio, solar factor and shading ratio).

Author Contributions

Concetualization, F.K.; Methodology, F.K. and G.L.S.; Software, G.L.S.; Validation, F.K. and G.L.S.; Formal Analysis, F.K.; Investigation, G.L.S.; Resources, G.L.S.; Data Curation, G.L.S.; Writing-Original Draft Preparation, F.K. and G.L.S.; Writing-Review & Editing, F.K.; Visualization, G.L.S.

Funding

The research was financed by the Higher Education Institutional Excellence Programme of the Ministry of Human Capacities in Hungary, within the framework of the Energetics thematic program of the University of Debrecen.

Acknowledgments

Authors would like to express their gratitude to András Zöld for his kind comments and observations.

Conflicts of Interest

The authors declare no conflict of interest.

Nomenclature

  • SHD—symmetric extreme hot day;
  • AHD—asymmetric extreme hot day;
  • ATD—asymmetric extreme torrid day;
  • N—North;
  • E—East;
  • W—West;
  • S—South;
  • QHL—heat load of the room, [W];
  • te—outdoor temperature, [°C];
  • SRI—solar radiation intensity, [W/m2];
  • Gr—glazing ratio of the façade, [%];
  • Uw—overall heat transfer coefficient of windows, [W/m2⋅K];
  • g—solar factor of glazing, [-];
  • Fobst—shading factor, [-];
  • ΔGr—variation of the glazed ratio of the facade, [%];
  • Δg—variation of the solar factor of glazing, [%];
  • ΔFobst—variation of the shading factor, [%];
  • θint,r,mn,ztc,t is the mean radiant temperature, in °C;
  • Aeli is the area of building element eli, in m2;
  • θpli = pln,eli,t is the temperature at node pli = pln of the building element eli, in °C
  • Cint,ztc,t is the internal thermal capacity of the zone, in J/K;
  • Δt is the length of the time interval, t in s;
  • θint,a,ztc,t is the internal air temperature, in °C
  • θint,a,ztc,t− 1 is the internal air temperature in the zone at previous time interval (t−Δt), in °C;
  • Aeli is the area of building element eli, in m2;
  • hci,eli is the internal convective surface heat transfer coefficient of the building element eli, in W/m2K;
  • Θpln,eli,t is the internal surface temperature of the building element eli, in °C;
  • Hve,k,t is the overall heat exchange coefficient by ventilation flow element k, in W/K;
  • Θsup,k,t is the supply temperature of ventilation flow element k, in °C;
  • Θe,a,t is the external air temperature, in °C;
  • Htr,tb,ztc is the overall heat transfer coefficient for thermal bridges, in W/K;
  • fint,c,ztc is the convective fraction of the internal gains;
  • fsol,c,ztc is the convective fraction of the solar radiation;
  • fH/C,c,ztc is the convective fraction of the cooling system;
  • Φint,ztc,t is the total internal heat gains, in W;
  • ΦHC,ztc,t is the cooling load (if negative), in calculation zone ztc, at time interval t, depending on type of application of the calculation, in W;
  • Φsol,ztc,t is the directly transmitted solar heat gain into the zone, summed over all window wi, in W;
  • Aelk is the area of (this or other) building element elk, in zone ztc, in m2;
  • Atot is the sum areas Aelk of all building elements elk = 1,…,eln, in m2;
  • θpli,eli,t is the temperature at node pli, in °C;
  • θpli− 1,eli,t is the temperature at node pli − 1, in °C;
  • θint,a,ztc,t is the internal air temperature in the zone, in °C;
  • hpli− 1,eli,t is the conductance between node pli and node pli − 1, in W/m2K;
  • κpli,eli is the real heat capacity of node pli, in J/m2K;
  • hci,eli is the internal convective surface heat transfer coefficient, in W/m2K;
  • hri,eli is the internal radiative surface heat transfer coefficient, in W/m2K;
  • θpli,eli,t− 1 is the temperature at node pli, at previous time interval (t − Δt) in °C.
  • θpli +1,eli,t is the temperature at node pli + 1, in °C;
  • hpli,eli,t is the conductance between node pli + 1 and node pli, in W/m2K;
  • θe,a,t is the temperature of external environment, in °C;
  • hce,eli is the external convective surface heat transfer coefficient, in W/m2K;
  • hre,eli is the external radiative surface heat transfer coefficient, in W/m2K;
  • αsol,eli is the solar absorption coefficient at the external surface, in W/m2K;
  • Isol,dif,eli,t is the diffuse part (including circumsolar) of the solar irradiance on the element with tilt angle βeli and orientation angle γeli;
  • Isol,dir,eli,t∙is the direct part (excluding circumsolar) of the solar irradiance on the element with tilt angle βeli and orientation angle γeli;
  • Fsh,obst,eli,t is the shading reduction factor for external obstacles for the element;
  • θsky,eli,t is the (extra) thermal radiation to the sky, in W/m2;
  • βeli is the tilt angle of the element (from horizonal, measured upwards facing), in degrees;
  • γeli is the orientation angle of the element, in degrees.

References

  1. West, J.J.; Smith, S.J.; Silva, R.A.; Naik, V.; Zhang, Y.; Adelman, Z.; Fry, M.M.; Anenberg, S.; Horowitz, L.W.; Lamarque, J.-F. Co-benefits of mitigating global greenhouse gas emissions for future air quality and human health. Nature Climate Change 2013, 3, 885–889. [Google Scholar] [CrossRef] [PubMed] [Green Version]
  2. Dodman, D. Blaming cities for climate change? An analysis of urban greenhouse gas emissions inventories. Environ. Urban. 2009, 21, 185–201. [Google Scholar] [CrossRef] [Green Version]
  3. Schimschar, S.; Blok, K.; Boermans, T.; Hermelink, A. Germany’s path towards nearly zero-energy buildings—Enabling the greenhouse gas mitigation potential in the building stock. Energy Policy 2011, 39, 3346–3360. [Google Scholar] [CrossRef]
  4. Chwieduk, D.A. Towards modern options of energy conservation in buildings. Renew. Energy 2017, 101, 1194–1202. [Google Scholar] [CrossRef]
  5. Aditya, L.; Mahlia, T.M.I.; Rismanchi, B.; Ng, H.M.; Hasan, M.H.; Metselaar, H.S.C.; Muraza, O.; Aditiya, H.B. A review on insulation materials for energy conservation in buildings. Renew. Sustain. Energy Rev. 2017, 73, 1352–1365. [Google Scholar] [CrossRef]
  6. Paoletti, G.; Pascuas, R.P.; Pernetti, R.; Lollini, R. Nearly Zero Energy Buildings: An Overview of the Main Construction Features across Europe. Buildings 2017, 7, 43. [Google Scholar] [CrossRef]
  7. Loukaidou, K.; Michopoulos, A.; Zachariadis, T. Nearly-zero Energy Buildings: Cost-optimal Analysis of Building Envelope Characteristics. Procedia Environ. Sci. 2017, 38, 20–27. [Google Scholar] [CrossRef]
  8. Cao, X.; Dai, X.; Liu, J. Building energy-consumption status worldwide and the state-of-the-art technologies for zero-energy buildings during the past decade. Energy Build. 2016, 128, 198–213. [Google Scholar] [CrossRef]
  9. Ürge-Vorsatz, D.; Cabeza, L.F.; Serrano, S.; Barreneche, C.; Petrichenko, K. Heating and cooling energy trends and drivers in buildings. Renew. Sustain. Energy Rev. 2015, 41, 85–98. [Google Scholar] [CrossRef]
  10. Santamouris, M. Cooling the buildings – past, present and future. Energy Build. 2016, 128, 617–638. [Google Scholar] [CrossRef]
  11. Huang, K.-T.; Hwang, R.-L. Future trends of residential building cooling energy and passive adaptation measures to counteract climate change: The case of Taiwan. Appl. Energy 2016, 184, 1230–1240. [Google Scholar] [CrossRef]
  12. Ürge-Vorsatz, D.; Petrichenko, K.; Staniec, M.; Eom, J. Energy use in buildings in a long-term perspective. Curr. Opin. Environ. Sustain. 2013, 5, 141–151. [Google Scholar] [CrossRef]
  13. Luterbacher, J.; Dietrich, D.; Xoplaki, E.; Grosjean, M.; Wanner, H. European seasonal and annual temperature variability, trends, and extremes since 1500. Science 2014, 303, 1499–1503. [Google Scholar] [CrossRef] [PubMed]
  14. Long, L.; Ye, H. The roles of thermal insulation and heat storage in the energy performance of the wall materials: a simulation study. Sci. Rep. 2016, 6, 24181. [Google Scholar] [CrossRef] [PubMed] [Green Version]
  15. Csáky, I.; Kalmár, F. Investigation of the relationship between the allowable transparent area, thermal mass and air change rate in buildings. J. Build. Eng. 2017, 12, 1–7. [Google Scholar] [CrossRef]
  16. Csáky, I.; Kalmár, F. Effects of thermal mass, ventilation and glazing orientation on indoor air temperature in buildings. J. Build. Phys. 2015, 39, 189–204. [Google Scholar] [CrossRef]
  17. Balaras, C.A. The role of thermal mass on the cooling load of buildings. An overview of computational methods. Energy Build. 1996, 24, l–10. [Google Scholar] [CrossRef]
  18. Reilly, A.; Kinnane, O. The impact of thermal mass on building energy consumption. Appl. Energy 2017, 198, 108–121. [Google Scholar] [CrossRef]
  19. Verbeke, S.; Audenaert, A. Thermal inertia in buildings: A review of impacts across climate and building use. Renew. Sustain. Energy Rev. 2018, 82, 2300–2318. [Google Scholar] [CrossRef]
  20. Aste, N.; Leonforte, F.; Manfren, M.; Mazzon, M. Thermal inertia and energy efficiency – Parametric simulation assessment on a calibrated case study. Appl. Energy 2015, 145, 111–123. [Google Scholar] [CrossRef]
  21. Di Perna, C.; Stazi, F.; Ursini Casalena, A.; D’Orazio, M. Influence of the internal inertia of the building envelope on summertime comfort in buildings with high internal heat loads. Energy Build. 2011, 43, 200–206. [Google Scholar] [CrossRef]
  22. Csáky, I.; Kalmár, F. Effects of solar radiation asymmetry on buildings’ cooling energy needs. J. Build. Phys. 2016, 40, 35–54. [Google Scholar] [CrossRef]
  23. Schmidt, D. Low exergy systems for high-performance buildings and communities. Energy Build. 2009, 41, 331–336. [Google Scholar] [CrossRef]
  24. Zhai, X.Q.; Qu, M.; Li, Y.; Wang, R.Z. A review for research and new design options of solar absorption cooling systems. Renew. Sustain. Energy Rev. 2011, 15, 4416–4423. [Google Scholar] [CrossRef]
  25. Eicker, U.; Pietruschka, D. Design and performance of solar powered absorption cooling systems in office buildings. Energy Build. 2009, 41, 81–91. [Google Scholar] [CrossRef]
  26. Sangi, R.; Müller, D. Exergy-based approaches for performance evaluation of building energy systems. Sustain. Cities Soc. 2016, 25, 25–32. [Google Scholar] [CrossRef]
  27. Hepbasli, A. Low exergy (LowEx) heating and cooling systems for sustainable buildings and societies. Renew. Sustain. Energy Rev. 2012, 16, 73–104. [Google Scholar] [CrossRef]
  28. Toftum, J. Human response to combined indoor environment exposures. Energy and Buildings 2002, 34, 601–606. [Google Scholar] [CrossRef]
  29. Schellen, L.; Loomans, M.G.L.C.; de Wit, M.H.; Olesen, B.W.; van Marken Lichtenbelt, W.D. The influence of local effects on thermal sensation under non-uniform environmental conditions—Gender differences in thermophysiology, thermal comfort and productivity during convective and radiant cooling. Physiol. Behav. 2012, 107, 252–261. [Google Scholar] [CrossRef] [PubMed]
  30. Pallubinsky, H.; Schellen, L.; Rieswijk, T.A.; Breukel, C.M.G.A.M.; Kingma, B.R.M.; van Marken Lichtenbelt, W.D. Local cooling in a warm environment. Energy Build. 2016, 113, 15–22. [Google Scholar] [CrossRef]
  31. Imanari, T.; Omori, T.; Bogaki, K. Thermal comfort and energy consumption of the radiant ceiling panel system. Comparison with the conventional all-air system. Energy Build. 1999, 30, 167–175. [Google Scholar] [CrossRef]
  32. Kalmár, F. Interrelation between glazing and summer operative temperature in buildings. Inter. Rev. Appl. Sci. Eng. 2016, 7, 53–62. [Google Scholar] [CrossRef]
  33. Nardi, I.; de Rubeis, T.; Perilli, S. Ageing effects on the thermal performance of two different well-insulated buildings. Energy Procedia 2016, 101, 1050–1057. [Google Scholar] [CrossRef]
  34. Karmann, C.; Schiavon, S.; Bauman, F. Thermal comfort in buildings using radiant vs. all-air systems: A critical literature review. Build. Environ. 2017, 111, 123–131. [Google Scholar] [CrossRef] [Green Version]
  35. Lin, B.; Wang, Z.; Sun, H.; Zhu, Y.; Ouyang, Q. Evaluation and comparison of thermal comfort of convective and radiant heating terminals in office buildings. Build. Environ. 2016, 106, 91–102. [Google Scholar] [CrossRef]
  36. Li, R.; Yoshidomi, T.; Ooka, R.; Olesen, B.W. Field evaluation of performance of radiant heating/cooling ceiling panel system. Energy Build. 2015, 86, 58–65. [Google Scholar] [CrossRef]
  37. ISO 13790:2008. Energy performance of buildings—Calculation of energy use for space heating and cooling; ISO copyright office: Geneva, Switzerland, 2008. [Google Scholar]
  38. ISO 52016-1:2017, Energy performance of buildings—Energy needs for heating and cooling, internal temperatures and sensible and latent heat loads—Part 1: Calculation procedures. Available online: https://www.iso.org/standard/65696.html (accessed on 12 June 2018).
  39. Csáky, I. Energy analysis of buildings’ summer heat loads. Doctoral Thesis, University of Debrecen, Hungary, 2015. [Google Scholar]
Figure 1. Layout of the analyzed room.
Energies 11 03291 g001
Figure 2. Outdoor temperature and incident solar radiation intensity. (a) Extreme hot symmetric day (data from standard 04140); (b) Extreme hot asymmetric day (2012.06.30) [39]; (c) Extreme torrid asymmetric day (2011.07.10) [39].
Energies 11 03291 g002
Figure 3. Box chart of the maximum heat load values.
Energies 11 03291 g003
Figure 4. Interrelation between glazing ratio and the maximum of the daily heat load. (a) North orientation and wall cooling; (b) North orientation and ceiling cooling; (c) East orientation and wall cooling; (d) East orientation and ceiling cooling; (e) West orientation and wall cooling; (f) West orientation and ceiling cooling; (g) South orientation and wall cooling; (h) South orientation and ceiling cooling.
Energies 11 03291 g004
Figure 5. Sensitivity of the heat load depending on the glazing ratio, solar factor and shading ratio (West orientation of the facade). (a) Symmetric extreme hot day; (b) Asymmetric extreme hot day; (c) Asymmetric extreme torrid day.
Energies 11 03291 g005
Figure 6. Heat load sensitivity in function of the radiation ratio. (a) g = 0.67, Fobst = 1.0; (b) Fobst = 1.0, Gr = 40%; (c) g = 0.67; Gr = 40%.
Energies 11 03291 g006
Table 1. Input parameters (“*” denotes reference case data).
Changed ParameterAnalyzed Cases
OrientationNorthEastWestSouth
Meteorological parametersExtremely warm symmetric day (standard 04140)Extremely warm asymmetric day (2012.06.30)Extremely hot asymmetric day (2011.07.10)
ShadingNo shading (Fobst = 1.0) *Partial shading (Fobst = 0.7)Strong shading (Fobst = 0.4)
GlazingTriple glazing, Low-e on both sides (g = 0.5; Uw = 0.82 W/(m2∙K))Double glazing, Low-e on the outer side (g = 0.67; Uw = 1.1 W/(m2∙K)) *Triple glazing (g = 0.7; Uw = 1.0 W/(m2∙K))
Glazed ratioGr = 20%Gr = 40% *Gr = 80%
Table 2. Heat load classes.
Heat Load ClassWall CoolingCeiling Cooling
IntervalNo. of valuesIntervalNo. of values
1st class−4971−451318−4617−416118
2nd class−4512−405624−4160−370524
3rd class−4055−359885−3704−325087
4th class−3597−314038−3249−279436
5th class−3139−268365−2793−233865
6th class−2682−222594−2337−188294
Table 3. Maximum indoor operative temperatures [°C].
Operative TemperatureWallCeiling
Minimum25.8225.80
Maximum26.2626.21
Median26.1726.14
Mean26.1326.10
Standard Deviation0.1020.100
Table 4. Variation of the heat load for North orientation of the facade [%].
Day TypeWall CoolingCeiling Cooling
Fobst [%]g [%]Gr [%]Fobst [%]g [%]Gr [%]
−30−60−25.374.48−50100−30−60−25.374.48−50100
SHD−0.1−0.3−2.90.4−9.221.1−0.1−0.3−3.30.5−10.524.1
AHD0.00.0−2.20.2−7.718.60.00.0−2.50.2−8.720.8
ATD−0.2−0.4−2.10.1−5.913.6−0.2−0.4−2.30.1−6.414.7
Table 5. Variation of the heat load for East orientation of the facade [%].
Day TypeWall CoolingCeiling Cooling
Fobst [%]g [%]Gr [%]Fobst [%]g [%]Gr [%]
−30−60−25.374.48−50100−30−60−25.374.48−50100
SHD−1.2−2.5−3.80.5−10.421.8−1.5−2.9−4.30.6−11.824.8
AHD−0.8−1.6−2.80.3−8.518.0−0.9−1.8−3.20.4−9.620.1
ATD−1.2−2.3−2.80.2−7.018.3−1.3−2.6−3.10.2−7.620.8
Table 6. Variation of the heat load for South orientation of the facade [%].
Day TypeWall CoolingCeiling Cooling
Fobst [%]g [%]Gr [%]Fobst [%]g [%]Gr [%]
−30−60−25.374.48−50100−30−60−25.374.48−50100
SHD−3.6−7.3−5.80.9−14.936.3−4.1−8.3−6.61.1−16.941.0
AHD−2.1−3.5−3.90.5−10.329.2−2.4−4.1−4.40.6−11.632.7
ATD−1.6−3.2−3.20.3−8.221.4−1.8−3.5−3.50.3−9.023.1
Table 7. Angle of the heat load variation [°].
Analyzed DayCooling TypeOrientationGrgFobst
SHDCeiling coolingN13.07.20.3
E13.79.42.8
W25.918.612.8
S21.114.37.9
Wall coolingN11.46.20.3
E12.18.22.4
W23.516.711.4
S18.812.76.9
AHDCeiling coolingN11.15.30.0
E11.26.81.7
W17.010.35.8
S16.49.63.9
Wall coolingN9.94.60.0
E10.06.01.5
W15.39.25.1
S14.78.53.4
ATDCeiling coolingN8.04.50.4
E10.76.42.4
W12.17.33.4
S12.17.33.3
Wall coolingN7.44.10.4
E9.65.82.2
W11.26.73.2
S11.26.73.0

