Article

Structural Optimization Method for the Transition Section in Composite Bucket Foundations of Offshore Wind Turbines

1
State Key Laboratory of Hydraulic Engineering Simulation and Safety, Tianjin University, Tianjin 300072, China
2
School of Civil Engineering, Tianjin University, Tianjin 300072, China
*
Author to whom correspondence should be addressed.
Energies 2018, 11(11), 3230; https://doi.org/10.3390/en11113230
Submission received: 25 October 2018 / Revised: 15 November 2018 / Accepted: 16 November 2018 / Published: 21 November 2018

Abstract

:
A two-step structural optimization method was proposed to select the transition section of a composite bucket foundation (CBF). In the first step, based on the variable density method, a solid isotropic microstructures with penalization (SIMP) interpolation model was established under specific load conditions and boundary conditions. The solution of force transmission path and the topology of the transition section in six forms (e.g., linear, arc-shaped, linear thin-walled, and arc-shaped thin-walled) were optimized. Afterwards, finite element software ABAQUS was used to verify this model. Results show that the utilization rate of the arc-shaped thin-walled structure was the largest, and its basic transmission force was more straightforward together with smaller cross-section size at the same height and smaller influence on spoiler flow. In the second step, the detailed optimization of CBF was carried out using mathematical programming. Under the premise of minimum total construction cost, the body shape parameters of each part were set as design variables satisfying the corresponding strength, stiffness, and stability conditions; meanwhile, the minimum total structure weight was set as the objective function. MATLAB was used to solve the sequence quadratic programming (SQP) algorithm and hybrid genetic algorithm, and the optimal body parameters were obtained.

1. Introduction

Offshore wind power has a huge development potential. However, along with its applications, a series of technical problems have also been encountered, among which the optimization design of the lower part of a wind turbine tower is still not well solved. As the core part of the overall wind turbine construction, the wind turbine foundation faces a complex working environment, including wind, wave, and current, which places higher demands on its safety, reliability, and corrosion resistance of various components [1]. In general, the cost of design, construction, installation, operation, and maintenance of a wind turbine infrastructure accounts for more than 40% of the total cost. To make the infrastructure more economical and reasonable, each part of the foundation should play a better role in reducing the construction cost.
A series of studies on the response to force conditions of the bucket foundation were conducted in China and other countries. In 1999, Bransby and Randolph [2] studied the failure envelope of bearing capacity of a bucket foundation under different combinations of load components in different directions. In the same year, Shi et al [3] carried out a horizontal bearing capacity model test of bucket foundation in soft soils, analyzed the displacement of bucket body under horizontal load and its interaction with soils, and put forward a formula for calculating the horizontal bearing capacity of a single-bucket foundation. In 2000, Liu et al. [4] obtained the distribution of earth pressure in the active and passive zones of the bucket foundation through field model experiments and numerical simulations; using the limit equilibrium method, a formula for calculating the horizontal ultimate bearing capacity of a single-bucket foundation was also proposed. In 2002, Gourvenec and Randolph [5] determined the failure modes of bucket foundations in heterogeneous soils through two- and three-dimensional finite element analysis and model tests as well.
The optimization of the force of offshore wind turbines were also studied. In 2010, Zhai et al. [6] introduced a multi-factor and multi-level fuzzy optimization theory into the design and selection of wind turbine foundations, and made a multi-level fuzzy comprehensive optimization decision-making on 13 factors affecting the basic design and 4 forms of pile foundation, thus providing a novel idea for the design and selection of the wind turbine foundation. In 2012, Ding et al. [7] used the finite element software ABAQUS to simulate the structural optimization degree of effective prestressed large-scale bucket foundations subjected to ultimate loads, and applied effective prestress of different sizes to the steel strands of arc-shaped transitional structures. In the same year, Lian et al. [8] numerically analyzed the design of a 3 MW offshore wind turbine with a prestressed drum-type foundation structure, and analyzed the influence of arc-shaped transition tower segment on the structural stress. In 2017, Ding et al. [9] took the bucket foundation of an off-shore wind power project as the research object, established a variety of trial calculation models for the initial bucket foundation structure, and optimized the tension transition stress, as well as the numbers of prestressed holes and steel strands using ABAQUS.
The optimization of the shape of offshore wind turbines was also extensively studied. To make the foundation cost more economical, Tove et al. combined actual offshore wind engineering projects in Europe to optimize the single-pile foundation [10]. Kang and Zhang [11] used ANSYS to optimize the deterministic size, shape, and fuzzy dimensions for a three-fan foundation. Wu [12] proposed a limit reaction method to estimate the bearing capacity of bucket foundations and optimized the structural parameters. With an offshore wind power project as an example, Liu et al. [13] adopted a numerical analysis method to study the influence of different characteristic parameters of size on the transmission of the bucket foundation and its resistance to bending moment loads. In recent years, more and more algorithms have been applied to fan-based optimization. By combining the pile foundation and tower monitoring data of a wind turbine loacated in Xiangshui Wind Farm, Jiangsu Province, China, Yang [14] analyzed the response of a foundation-tower structure under dynamic loads (e.g., wind, waves, and earthquakes), and obtained the dynamic optimization design based on genetic algorithm. Liu [15] applied the sequence quadratic programming (SQP) and the improved genetic algorithm to the overall structural optimization design of the bucket foundation for the first time. By combining the optimization method with the finite element method, Liu [16] optimized the design of a 6 MW composite bucket foundation (CBF) with diagonal support. Based on the SQP optimization theory, Sun [17] carried out deterministic size optimization of a composite pile foundation.
At present, the research on bucket foundations mainly focuses on optimization using finite element software; however, the member of optimization algorithms is limited. The traditional algorithms can only optimize the overall structure, but they cannot find the optimal force transmission path. The main methods for solving the optimal force transmission path include the analytical method based on Michell theory [16,18], the method of quantifying the force transmission path based on the bearing factor, and the numerical method based on topology optimization. Based on the quantification method of load-bearing path [16,18,19], differential method is used to derive the differential equation of the shortest transmission path in the structure. However, for complex heteromorphic structures, differential equations are too complex to solve. Fortunately, topology optimization can solve the problem of shortest force path; its design variables are not specific dimensions or node coordinates as usual, but indicate the existence of sub-regions with independent levels. According to Kirsch [20,21,22,23,24,25,26], topology optimization is the most difficult task in structural optimization. In recent years, with the development of computer technology, optimization design for structural topology has been improved substantially.
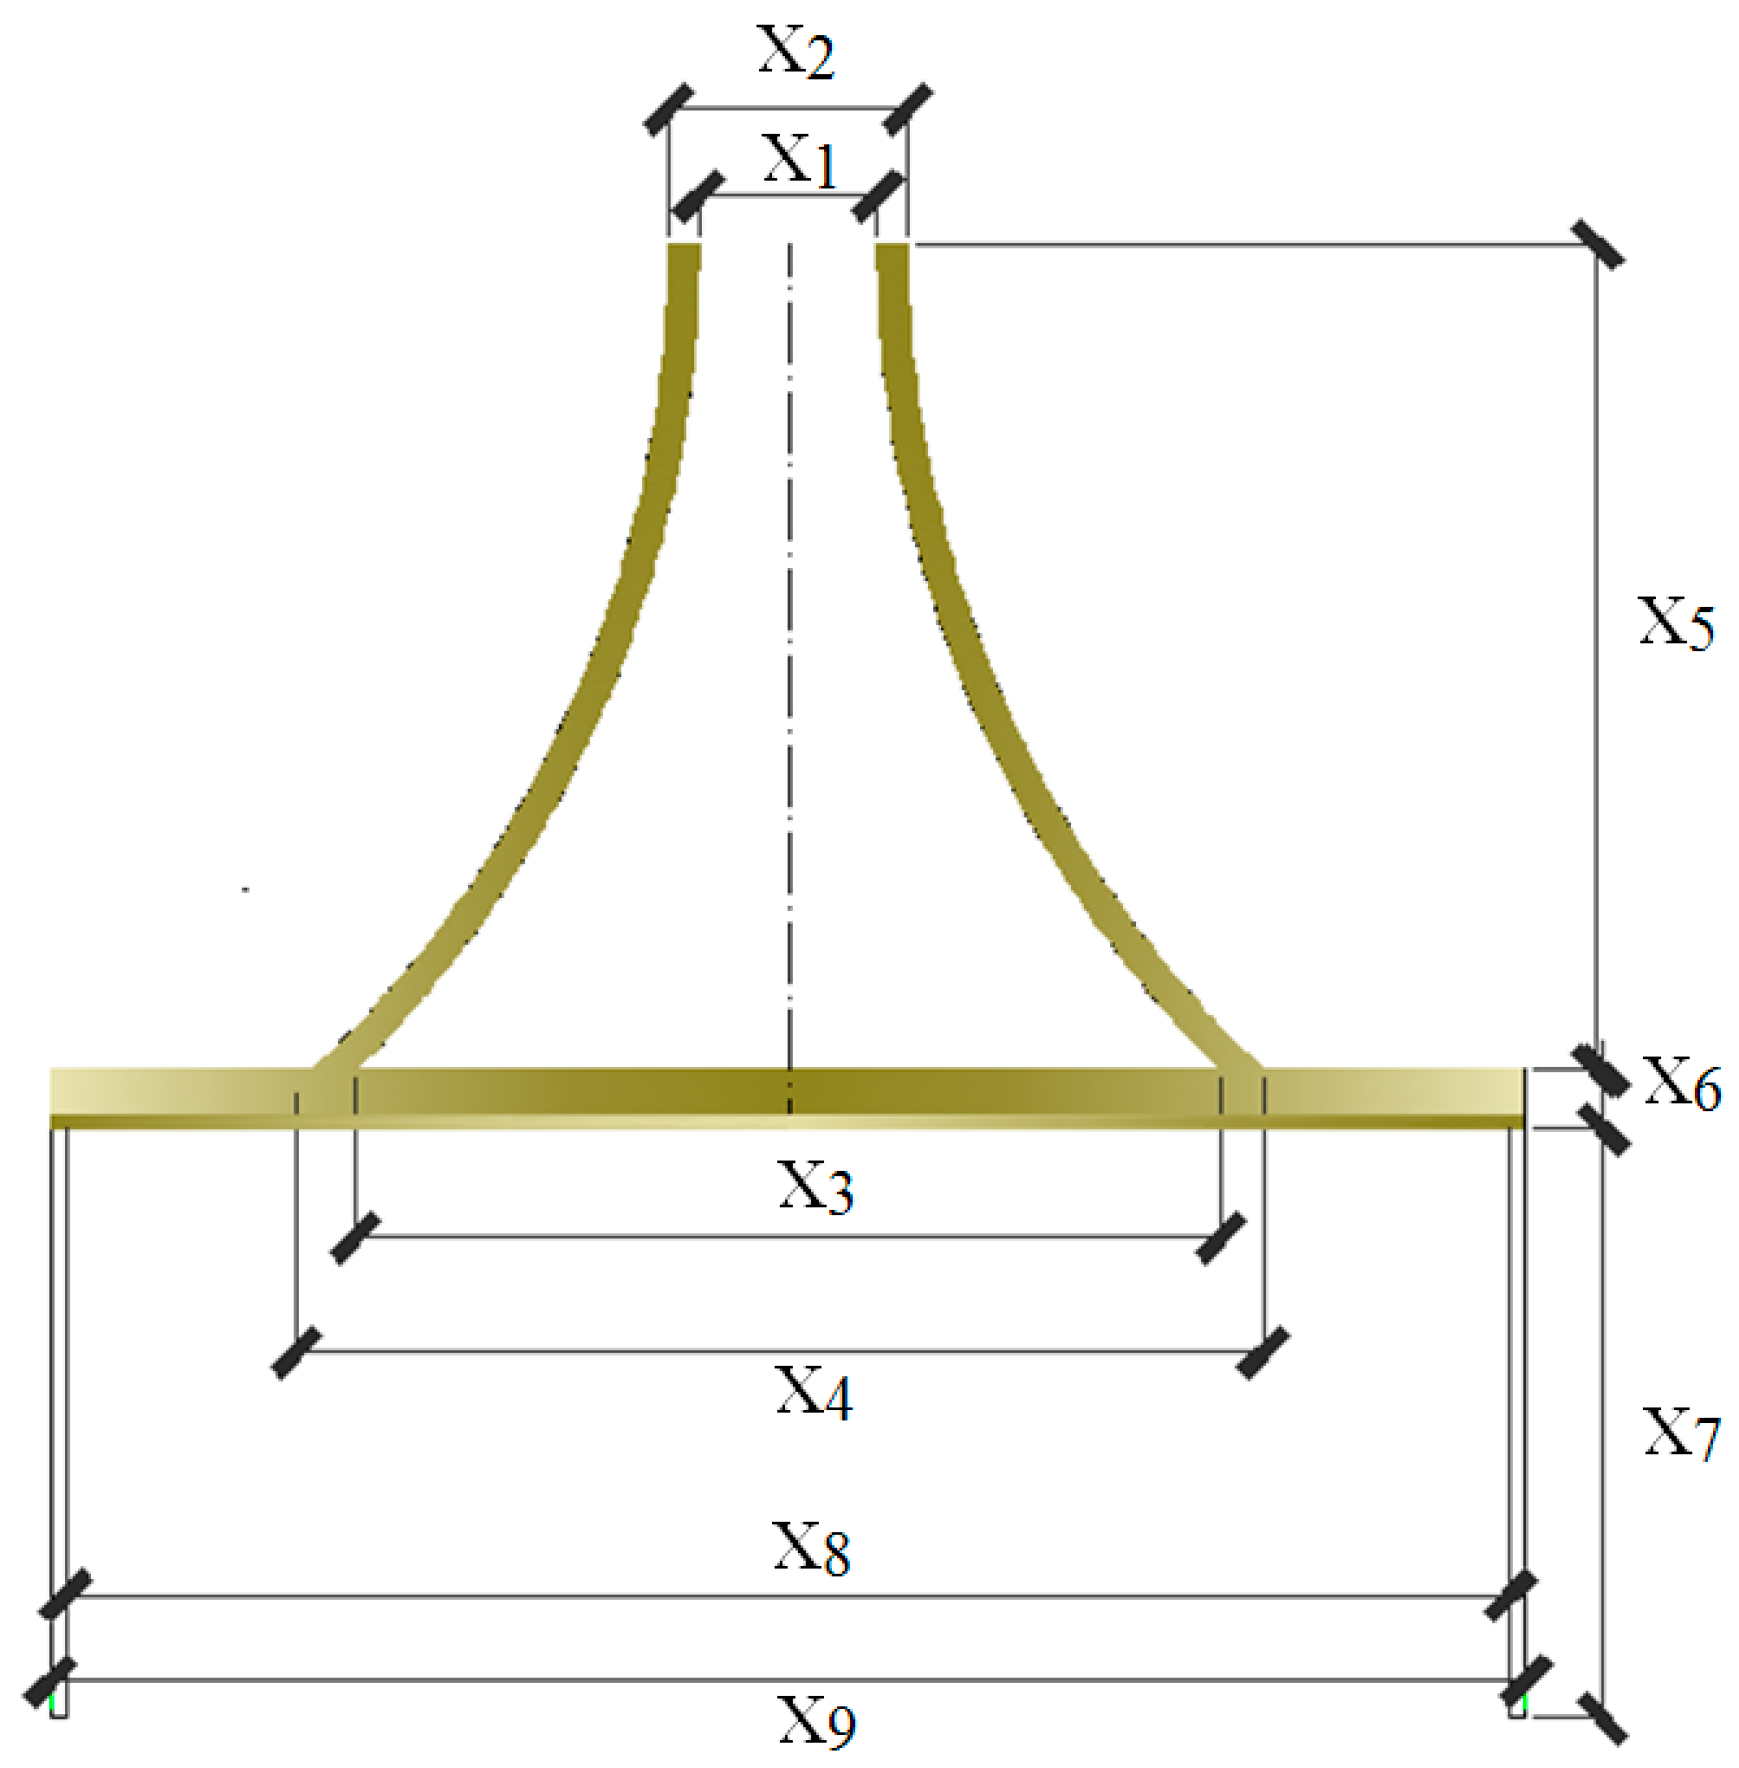
In this paper, the design of an offshore bucket foundation is optimized through topology optimization and mathematical programming. First, the optimal force transfer path in the structure and the economical and practical optimal structural scheme are determined according to constraints, load conditions, and optimization objectives. The topology of the transition section in six forms is optimized to search for the best transfer path. At the same time, finite element software ABAQUS is used to verify the six models. Then, the bucket type is selected, and mathematical programming method is used to analyze the optimization of CBF. With the minimum total weight of the structure as the objective and the shape parameters of each part as design variables, the SQP quadratic programming algorithm and hybrid genetic algorithm are used. Finally, the optimization objective function based on the offshore wind turbine type prototype is established, and the optimal parameters are obtained; the feasibility of mathematical programming in the optimization design of a complex structure is thus verified.

2. Mechanical Characteristics of CBF

Bucket foundation is a new type of offshore structure appearing first in the 1980s. Nowadays, it is mainly applied to the construction of offshore oil platforms, seawalls, and other man-made islands in the form of suction anchor offshore [
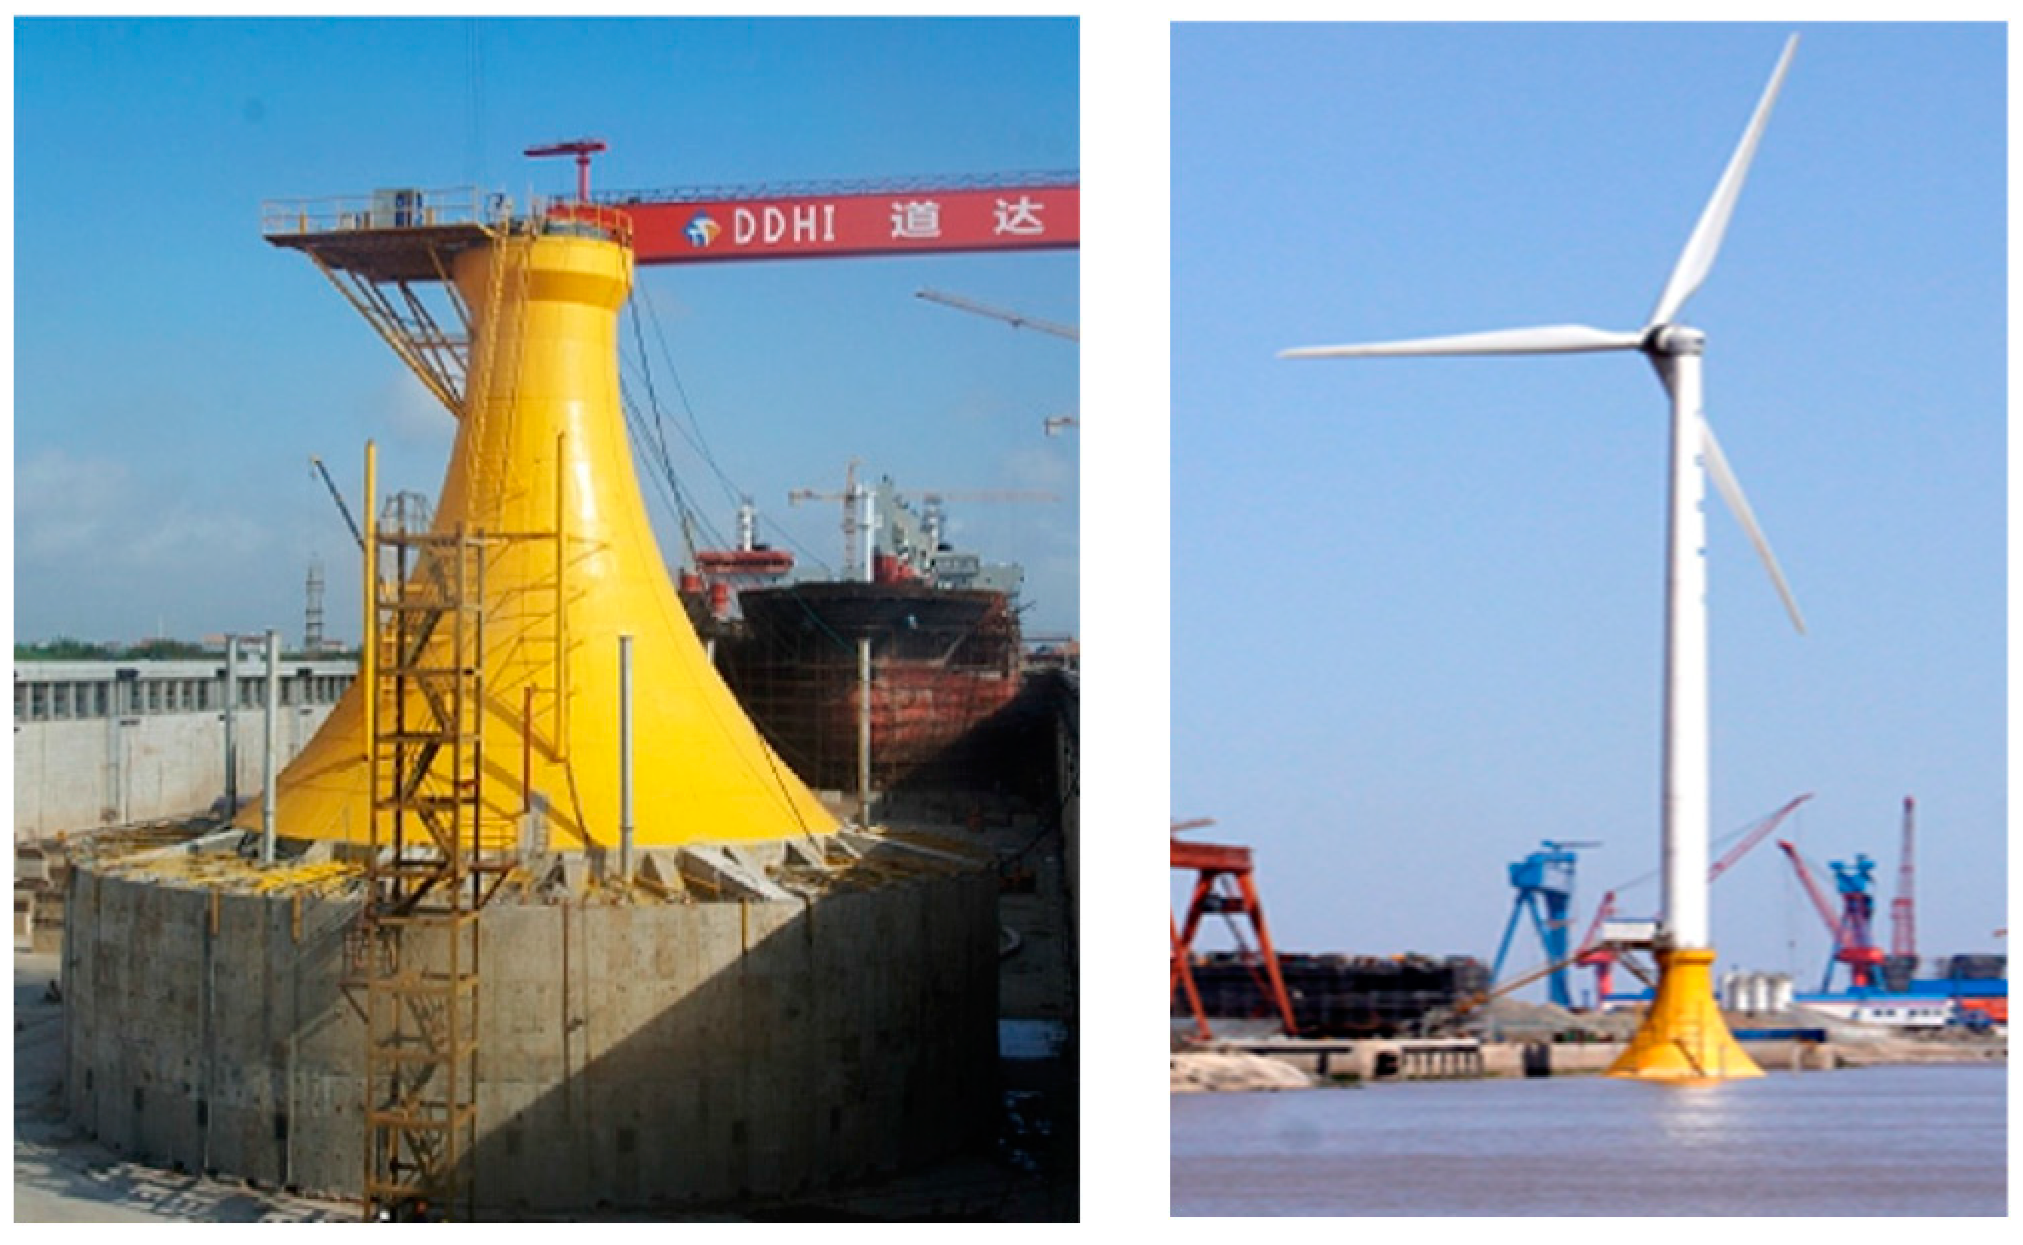
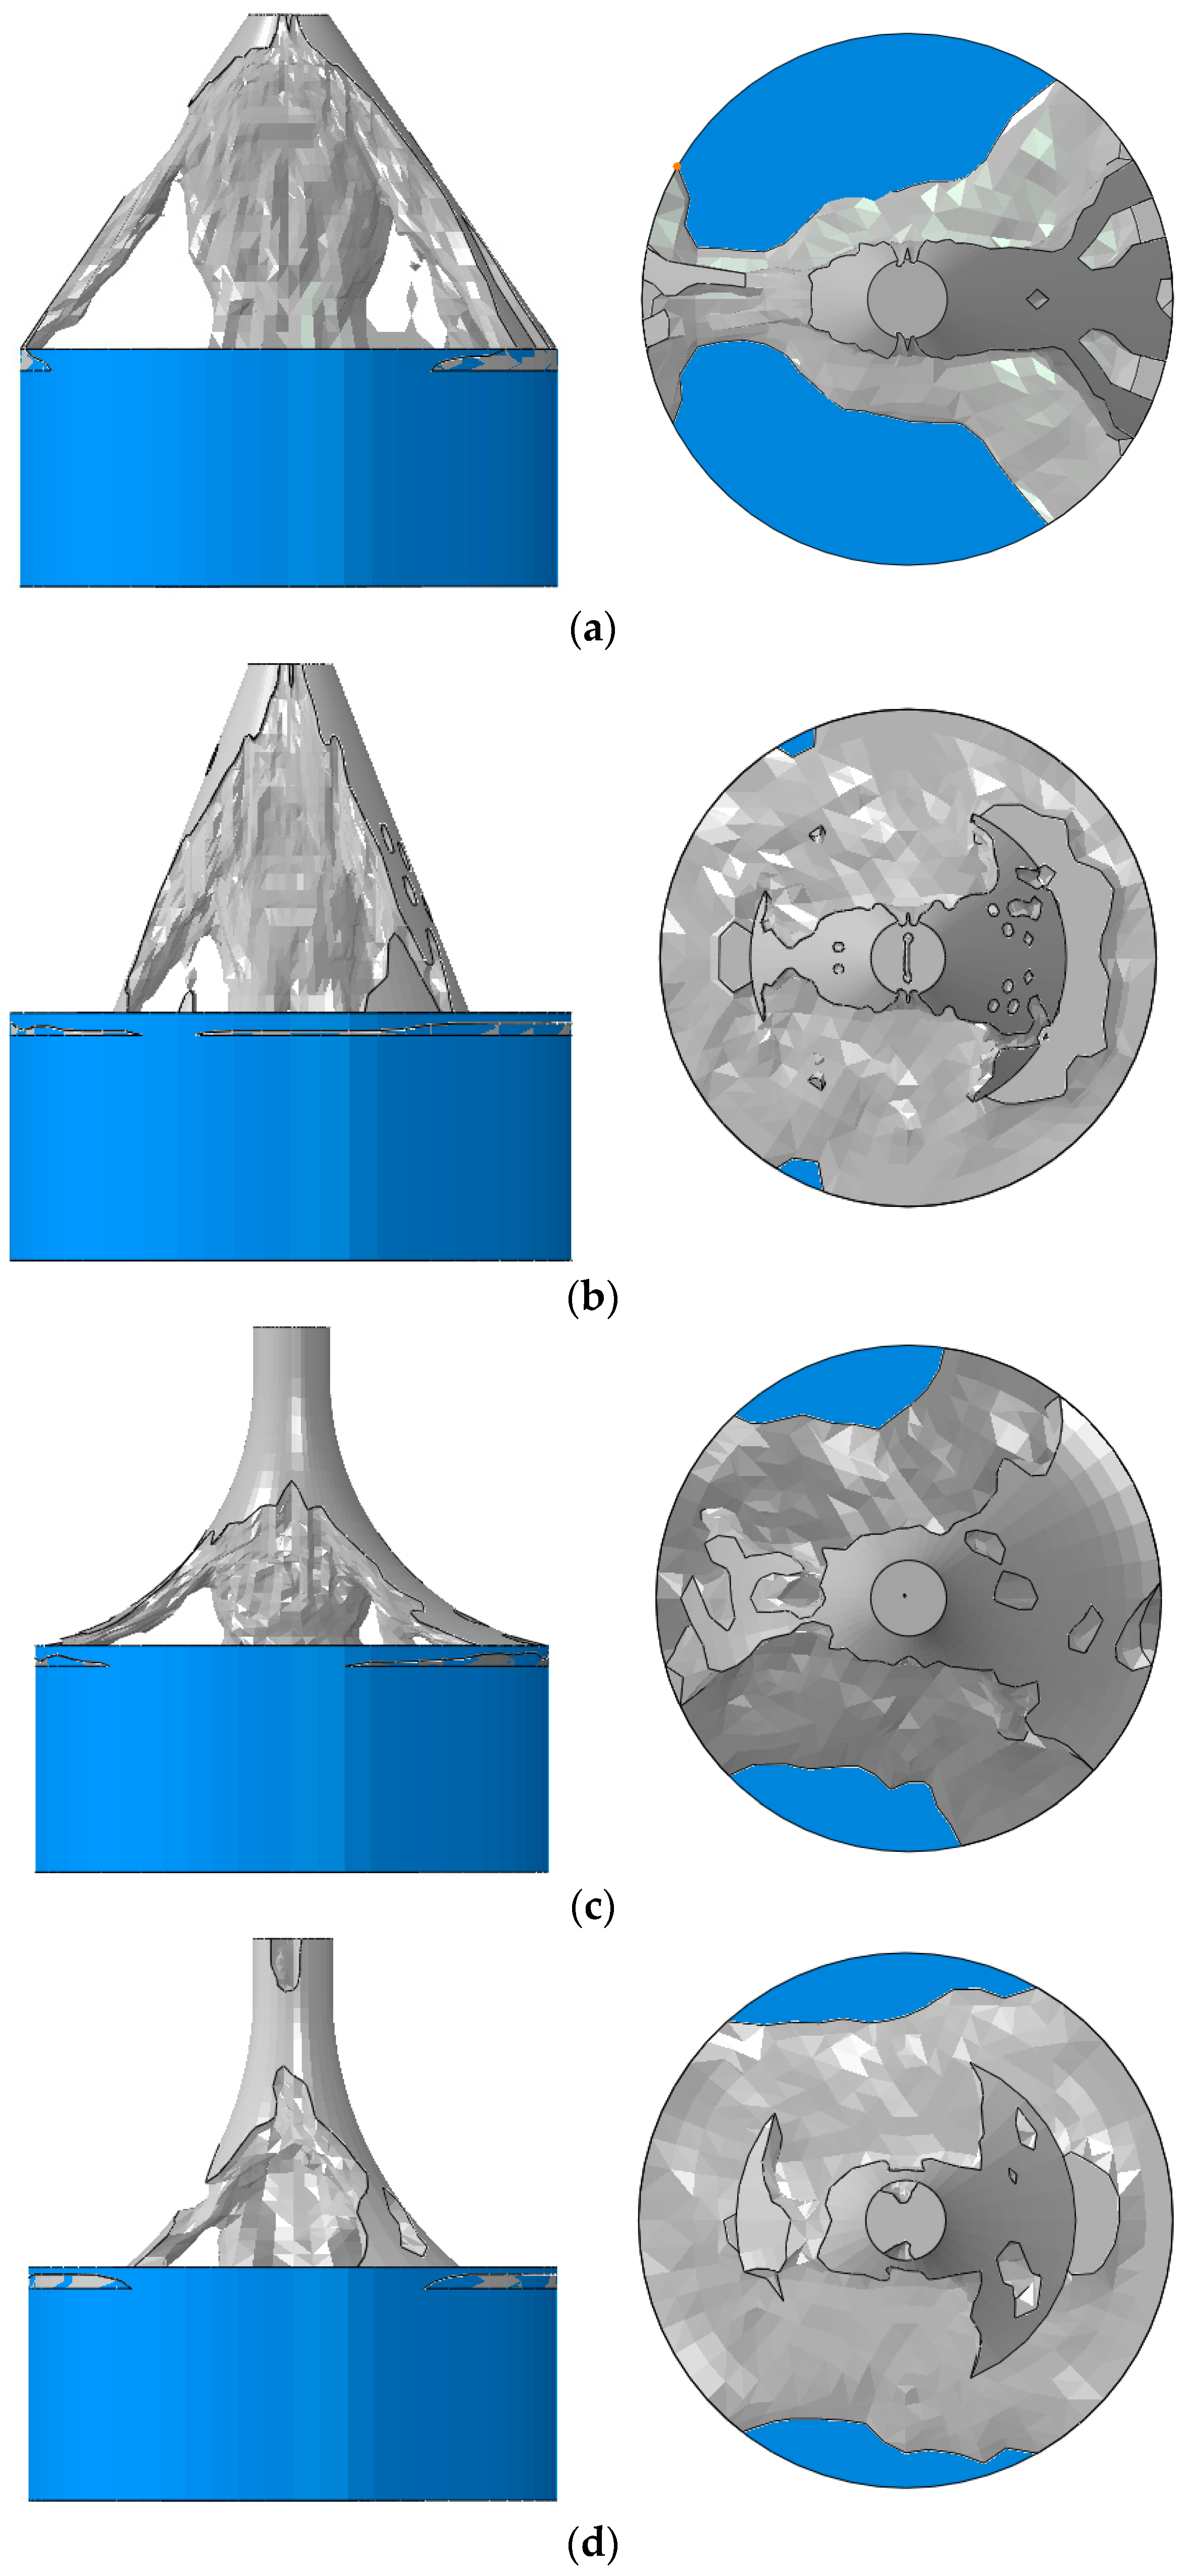
27]. In 2010, China’s first 2.5 MW large-scale CBF was installed in Qidong City (Jiangsu Province), marking a substantial progress in the development of bucket foundations, as shown in 
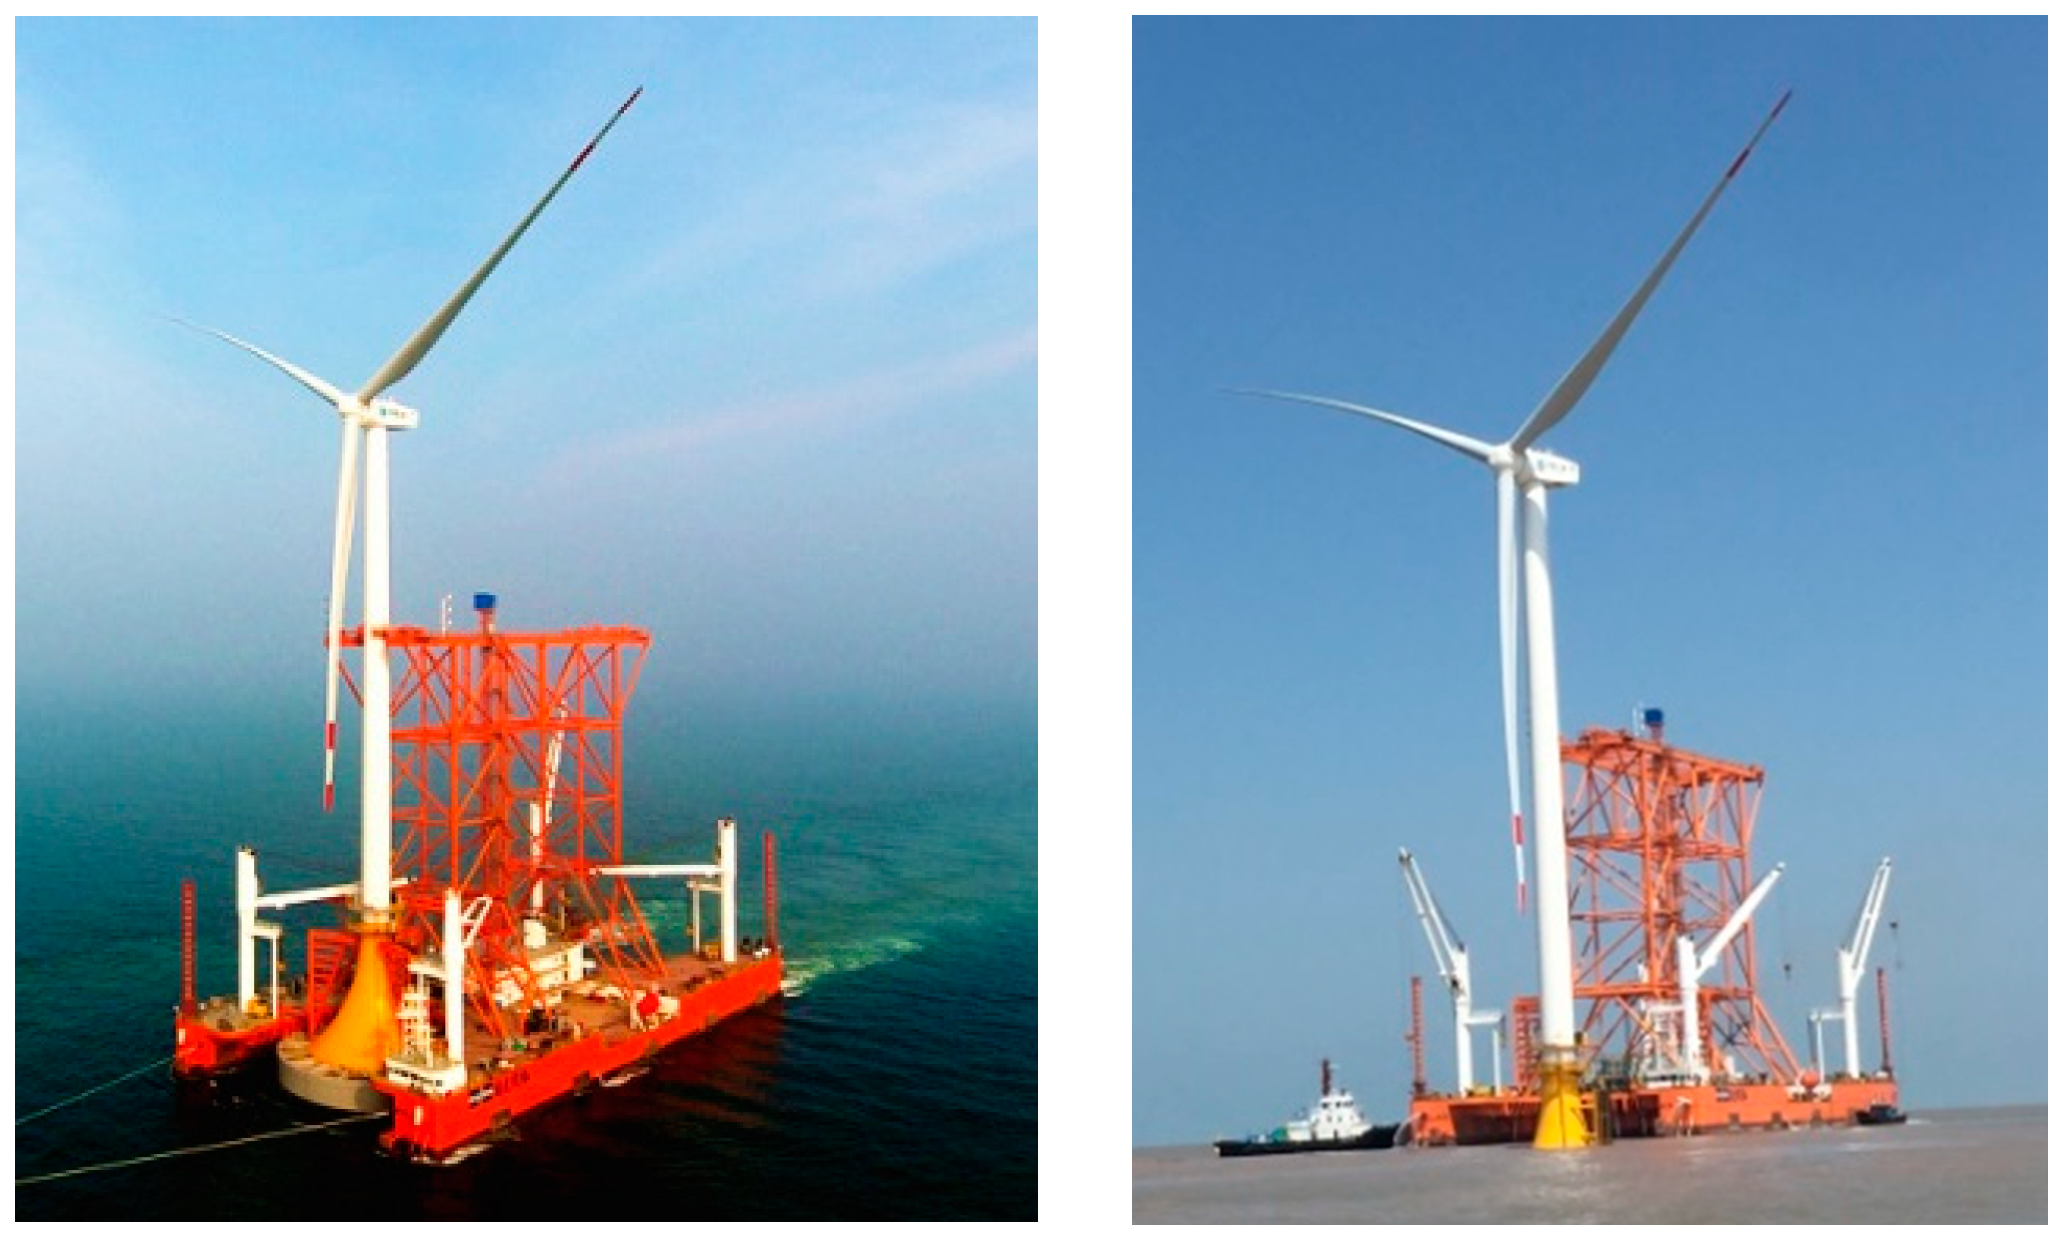
Figure 1. In 2017, the one-step installation of a 3 MW prototype was carried out at the Xiangshui Wind Farm in Jiangsu Province, which was the beginning of a batch test of CBF, as shown in Figure 2. At present, there are 13 composite bucket foundations under construction in Jiangsu Dafeng Wind Farm, of which 11 are of capacity 3.3 MW and two are of 6.45 MW.
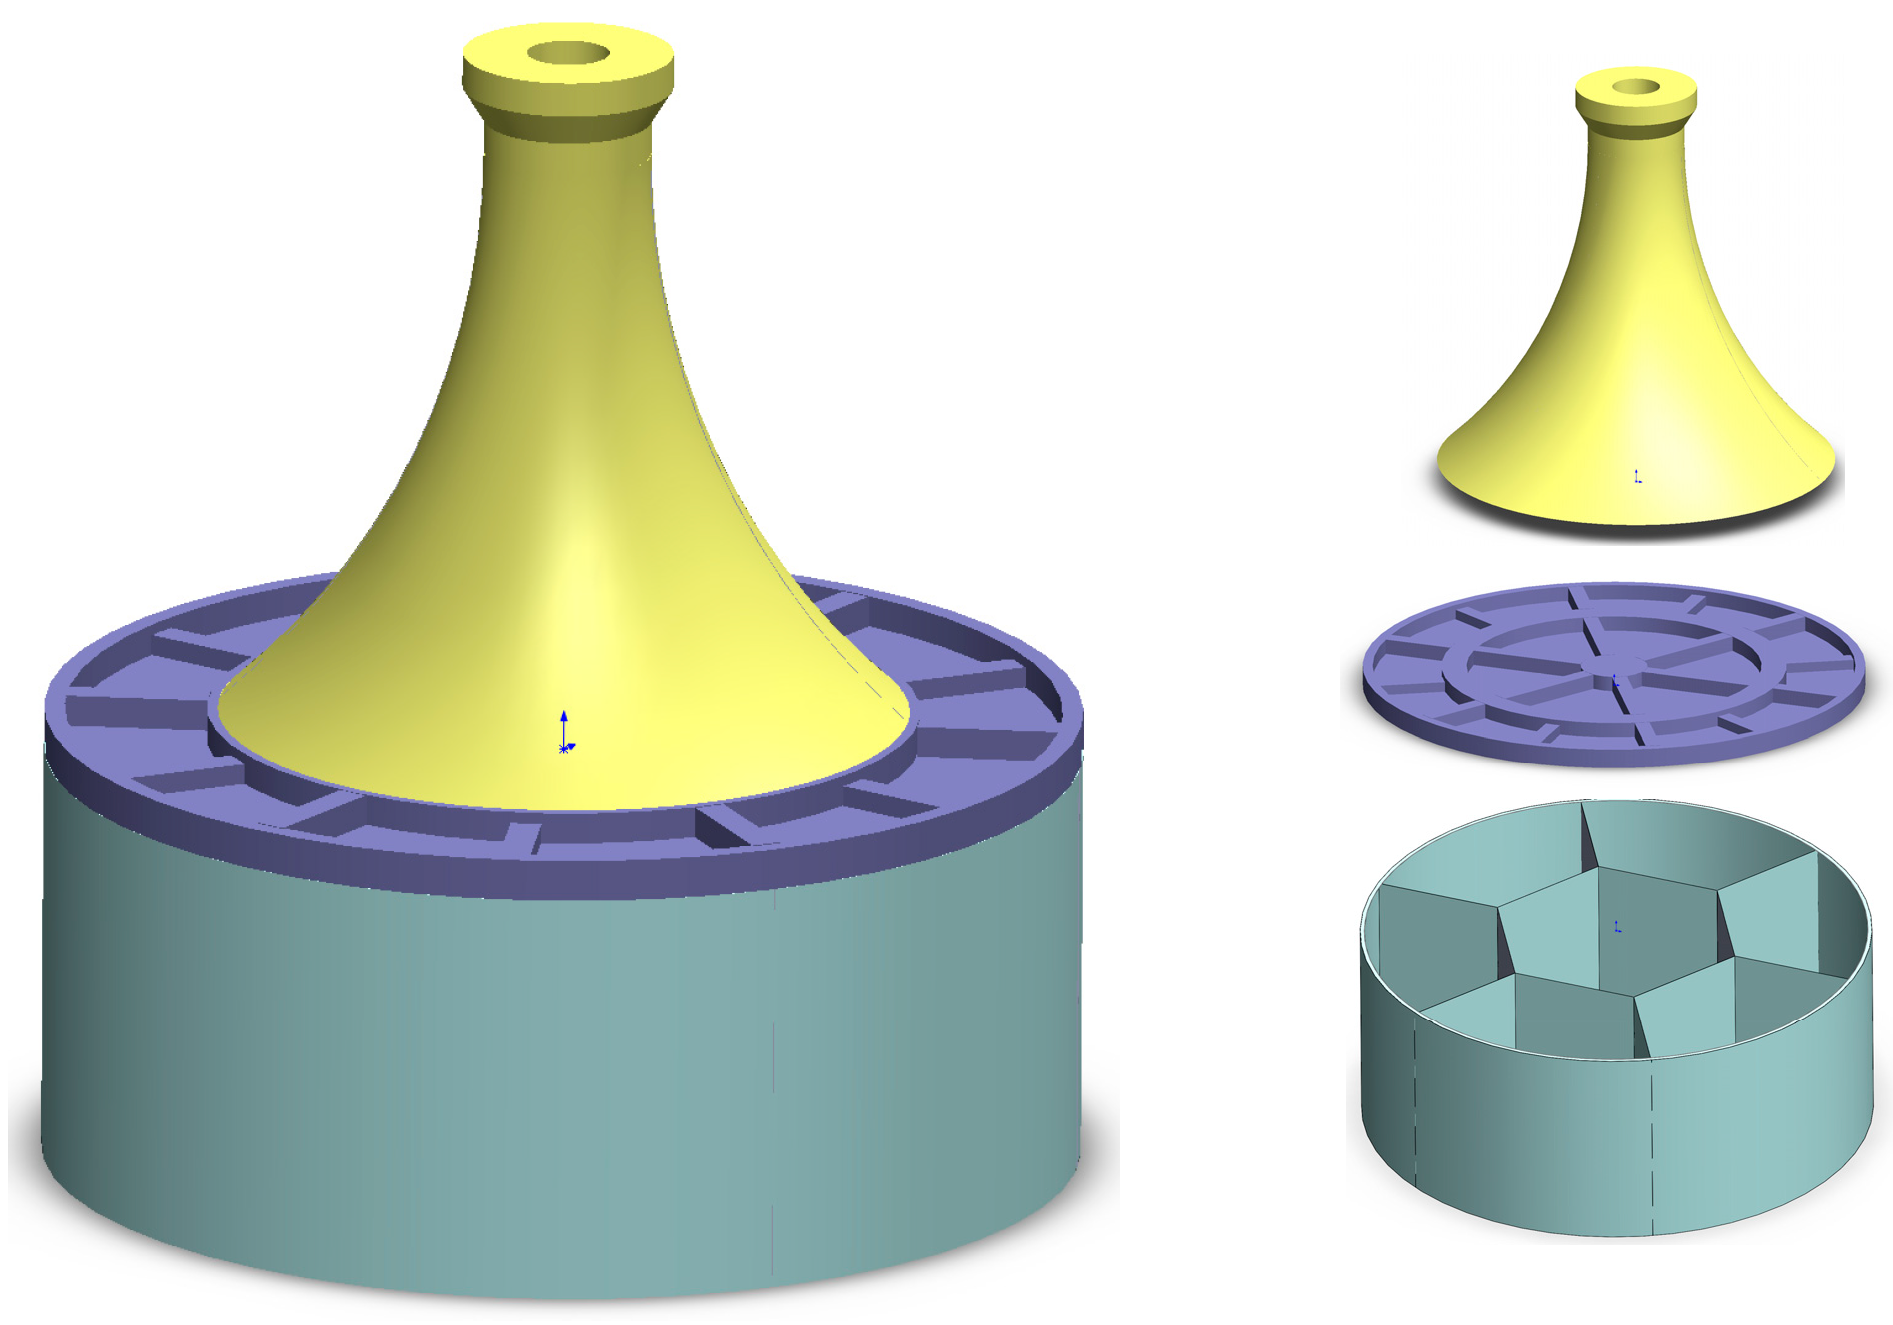
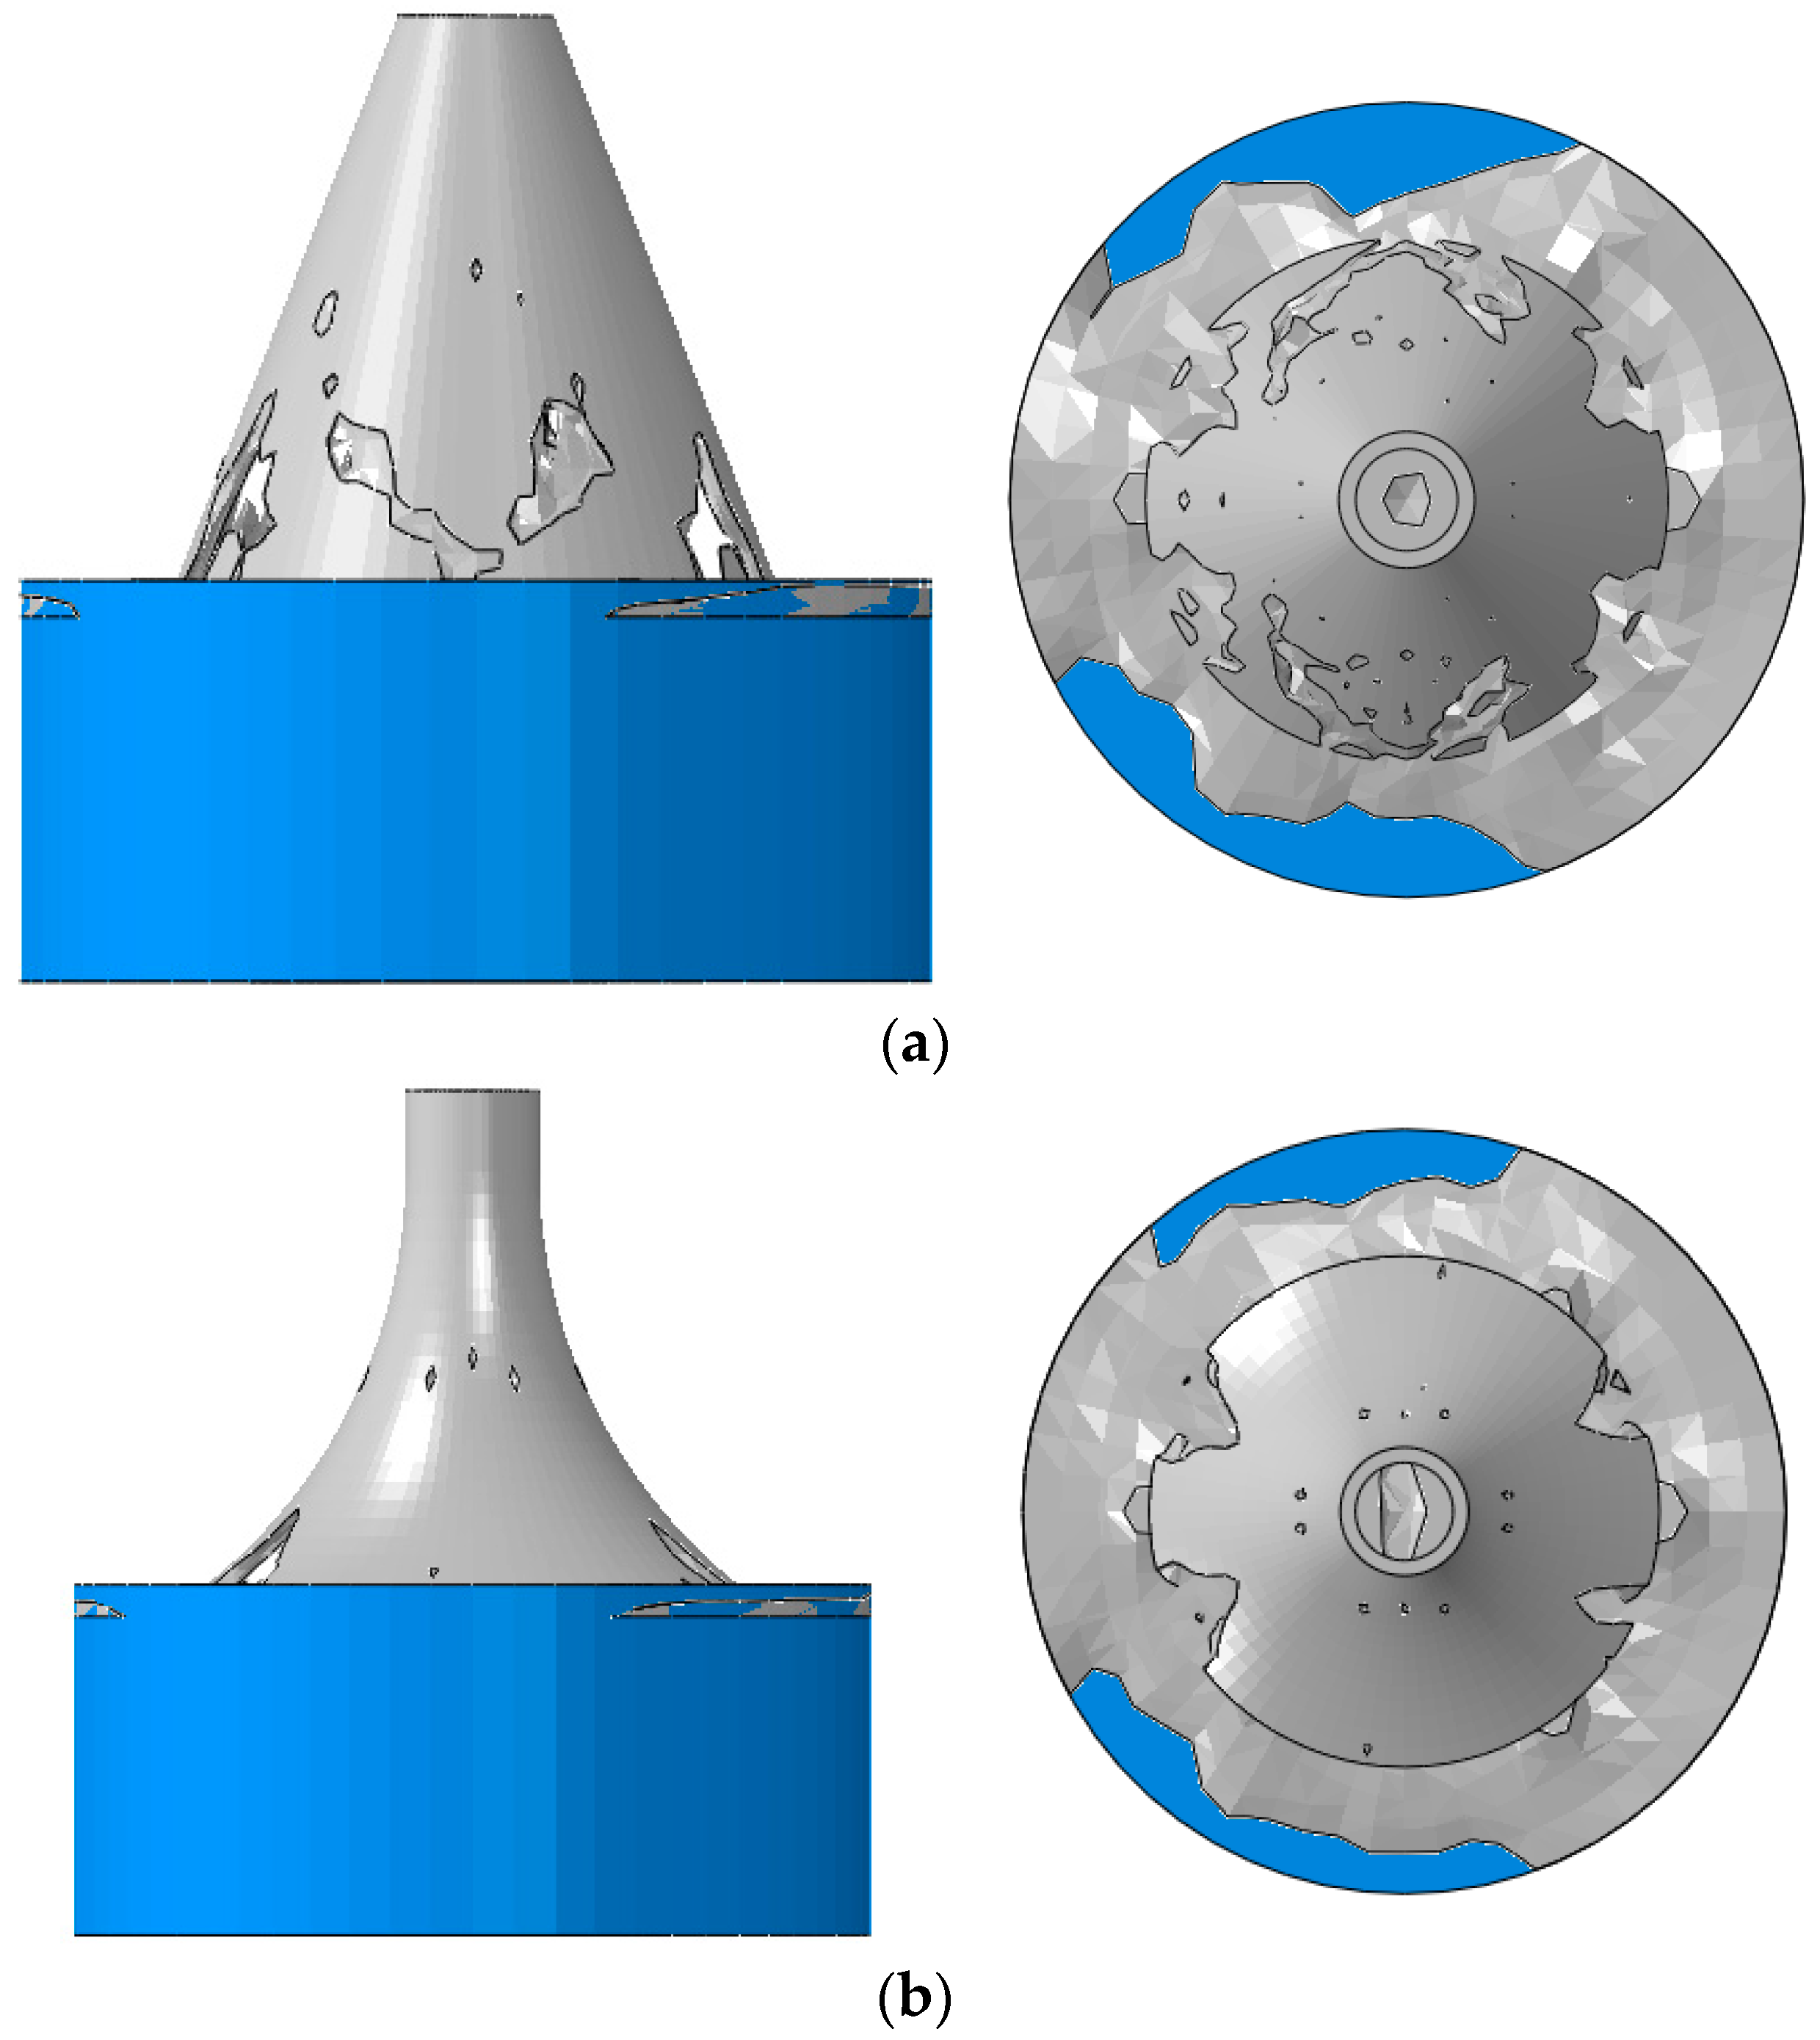
As a kind of foundation with closed upper end and open bottom, it is similar to an inverted cup, mainly consisting of a steel cylinder body, a concrete ceiling, and a bucket cap beam structure [9]. To meet the requirements of float-sink-leveling and provide strength reserves for the bucket foundation, a honeycomb-shaped partition plate structure is arranged in the cylinder body, thus dividing the foundation into separate compartments (see Figure 3).
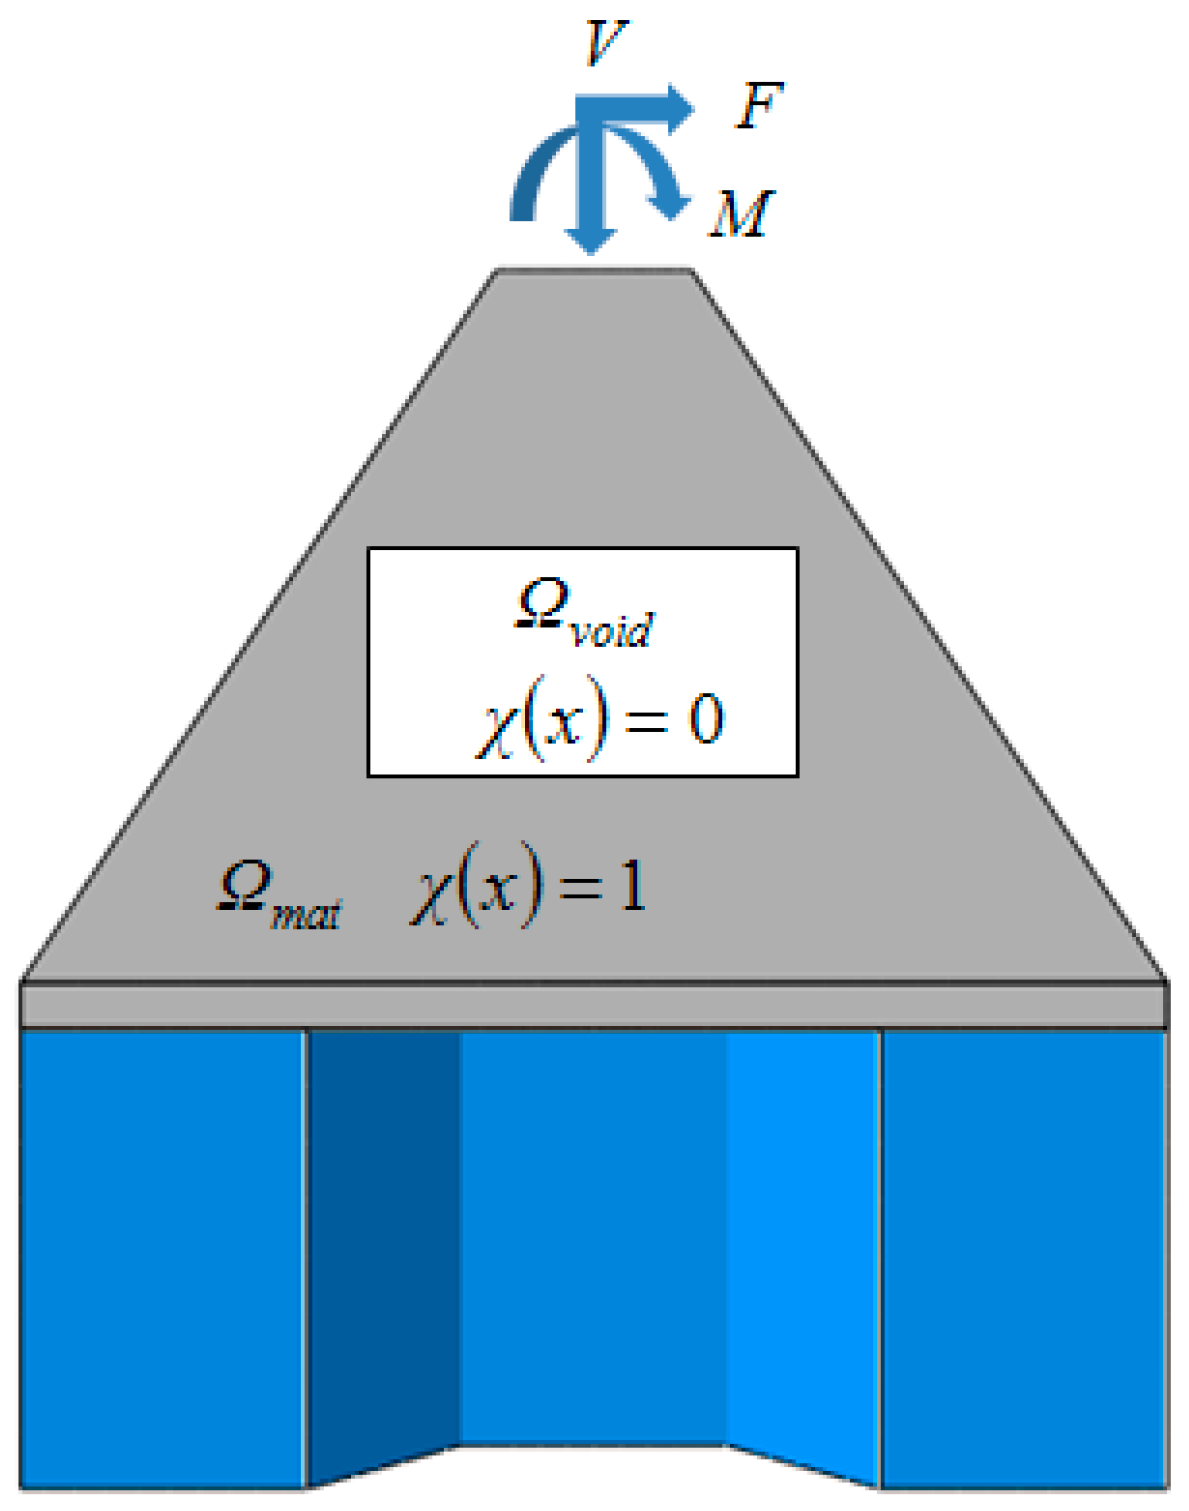
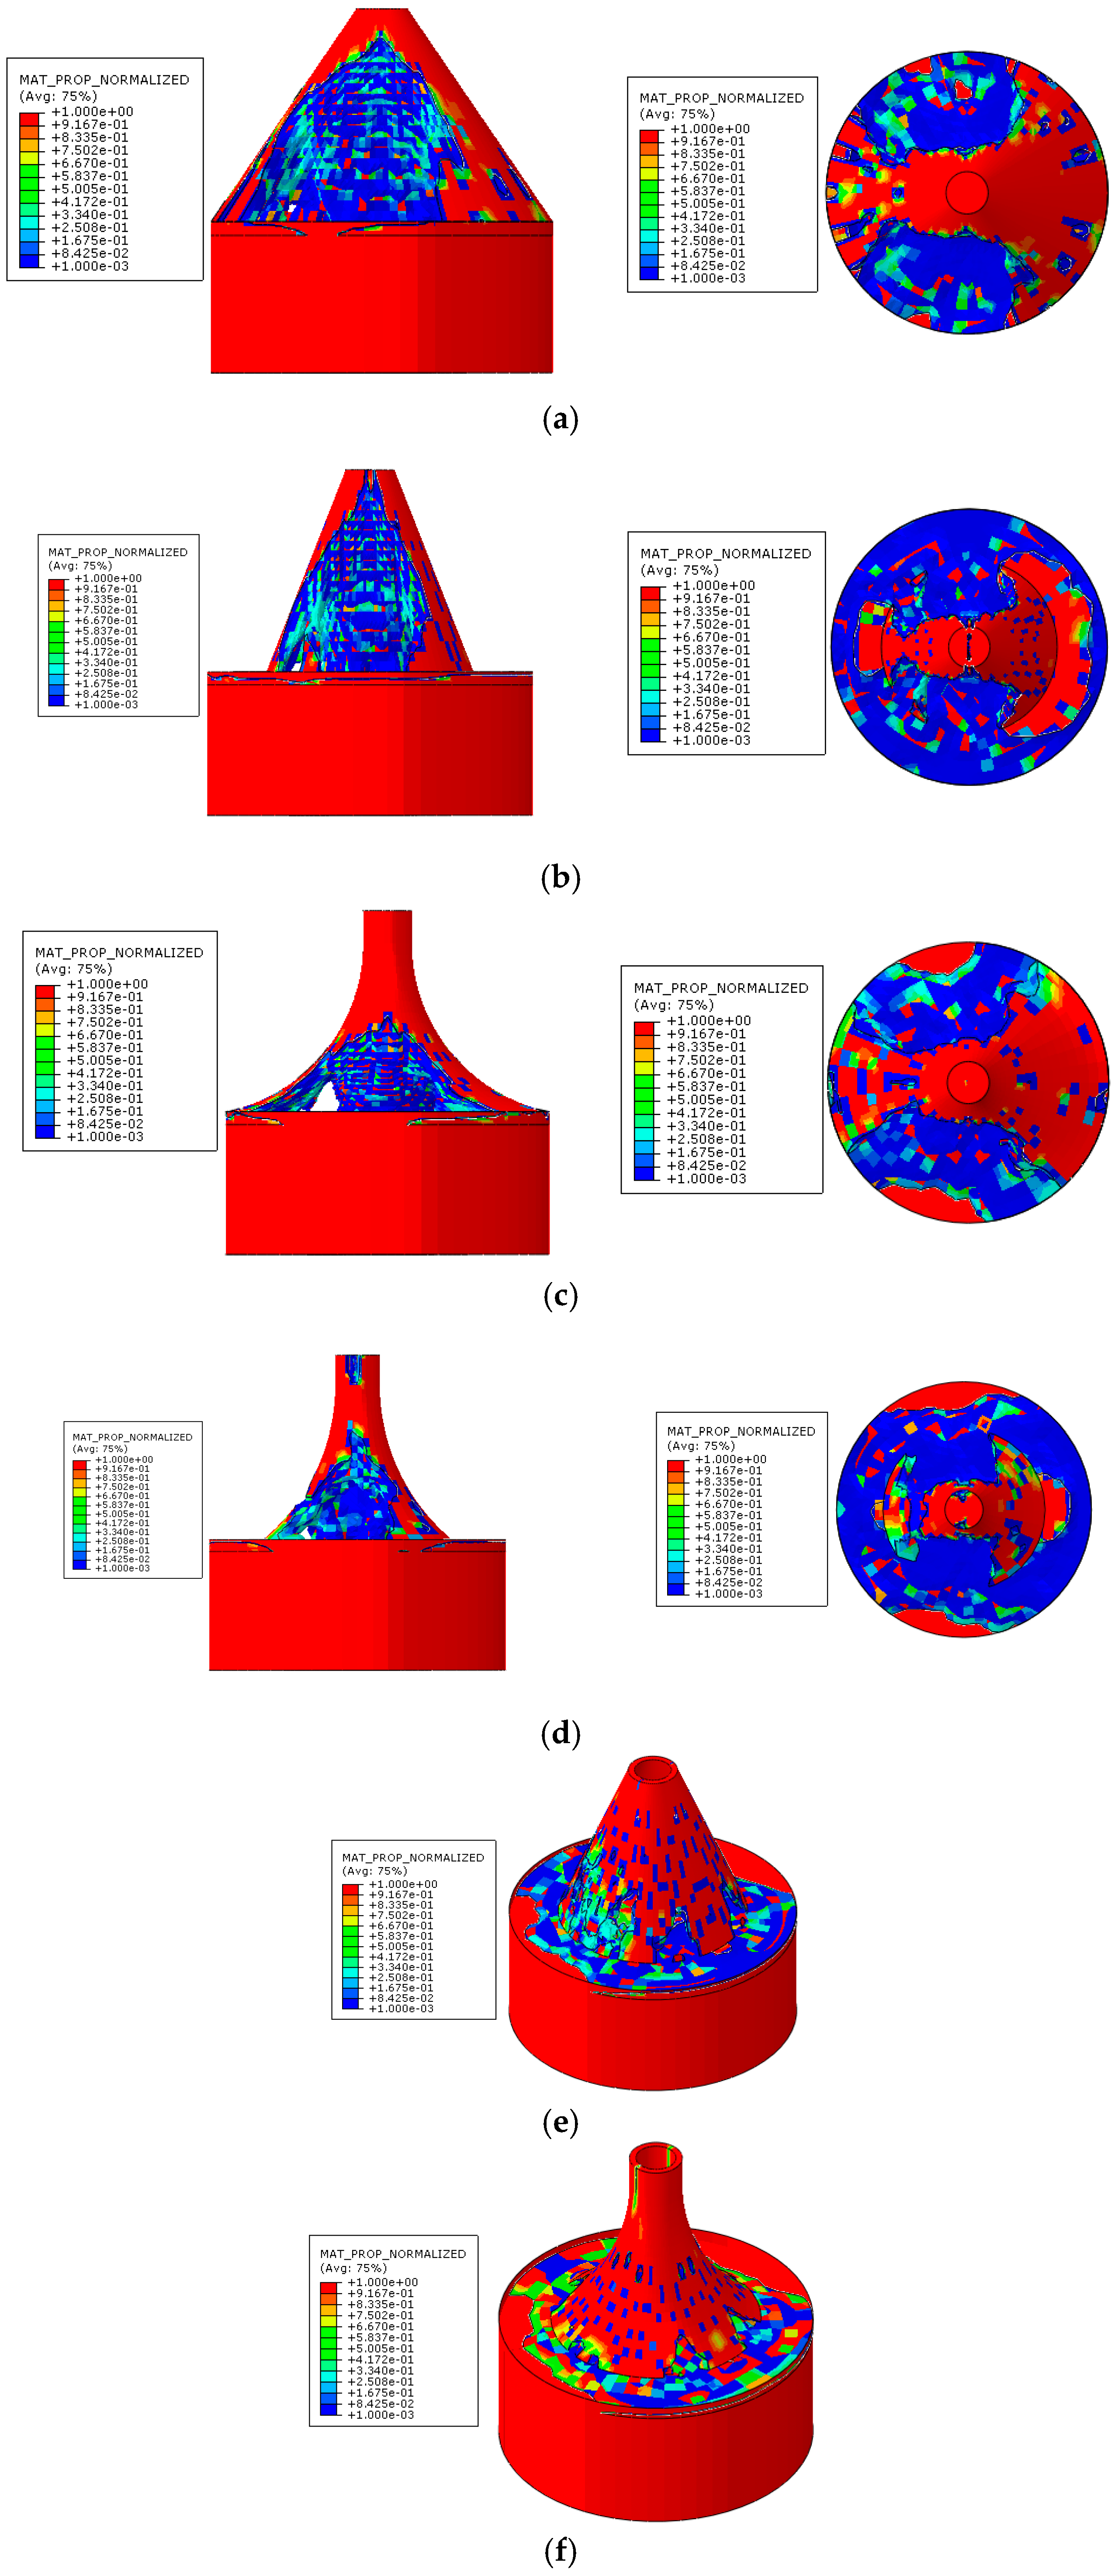
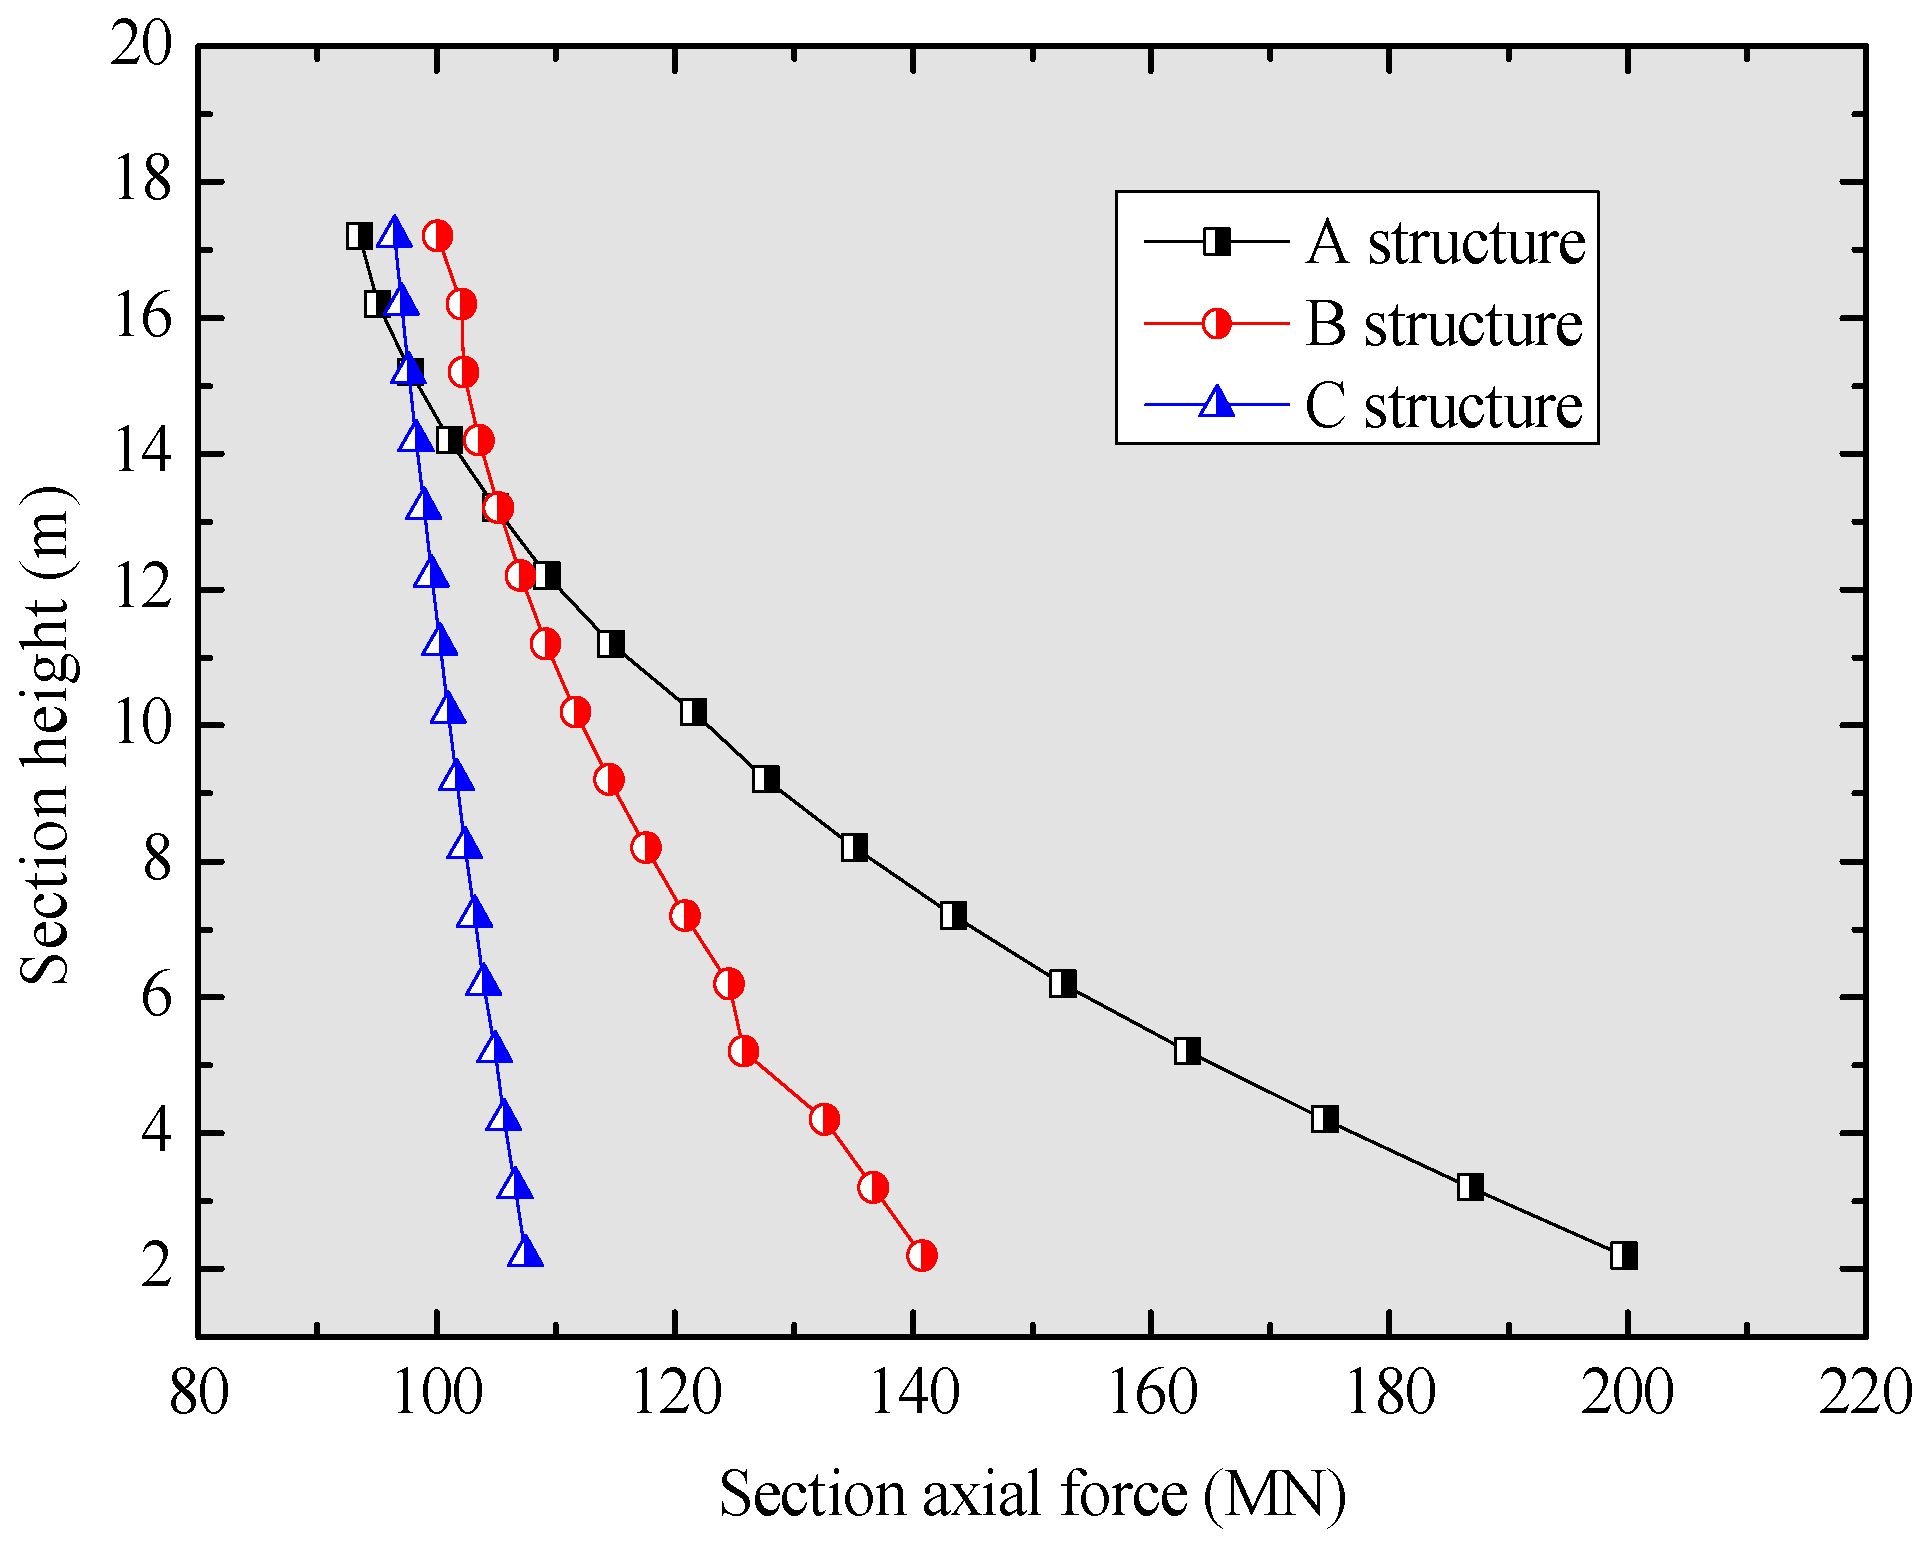
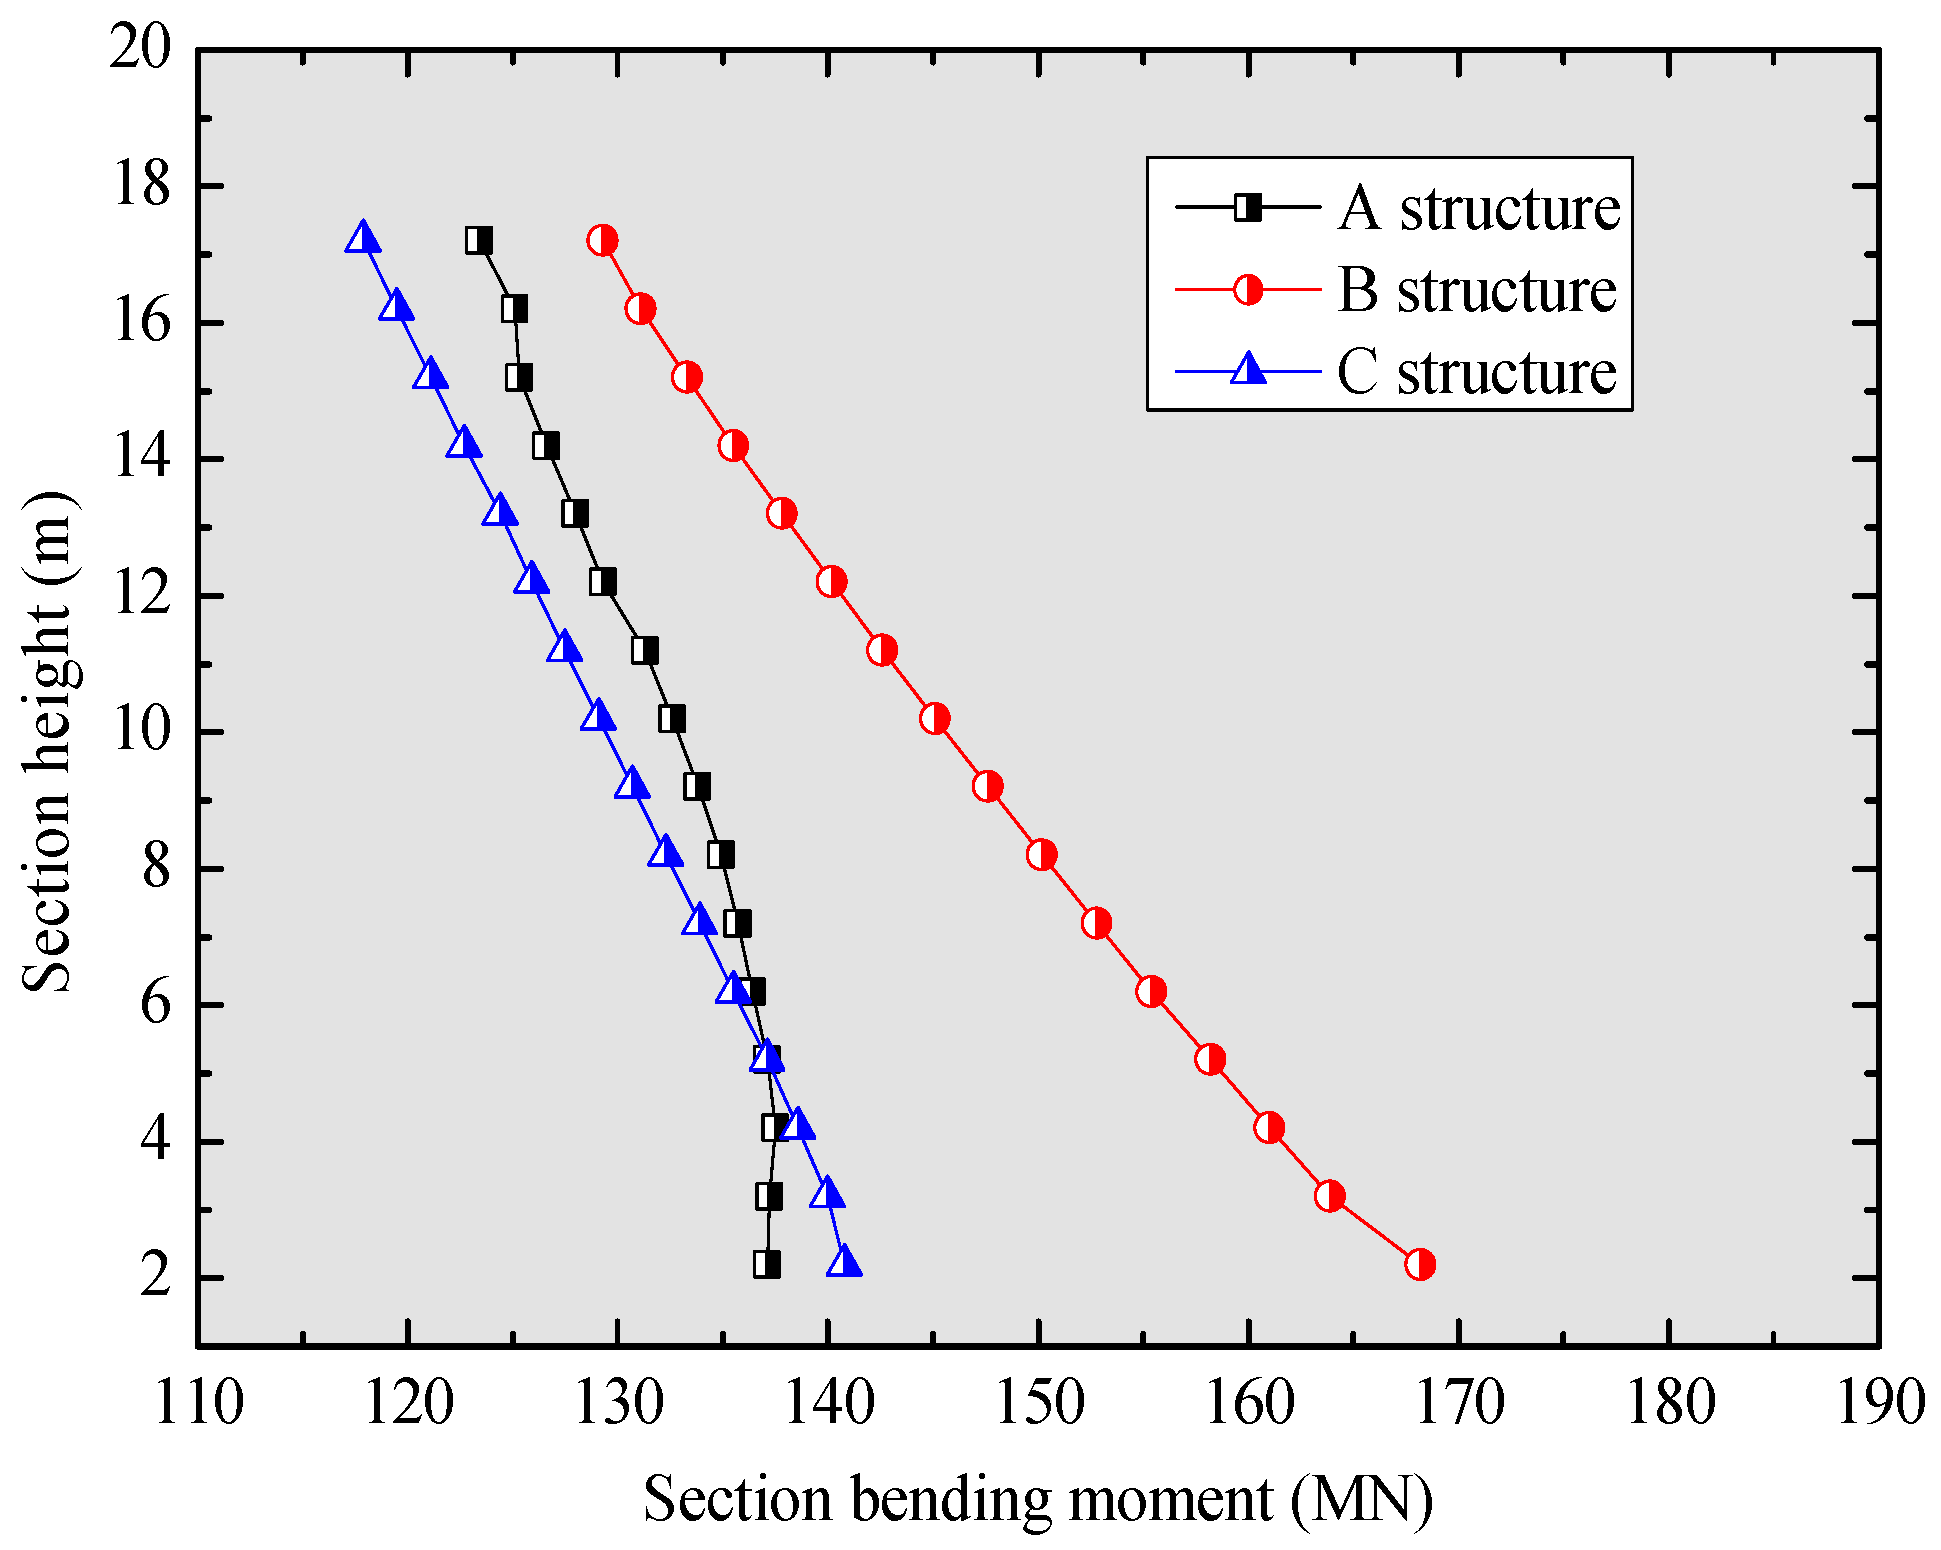
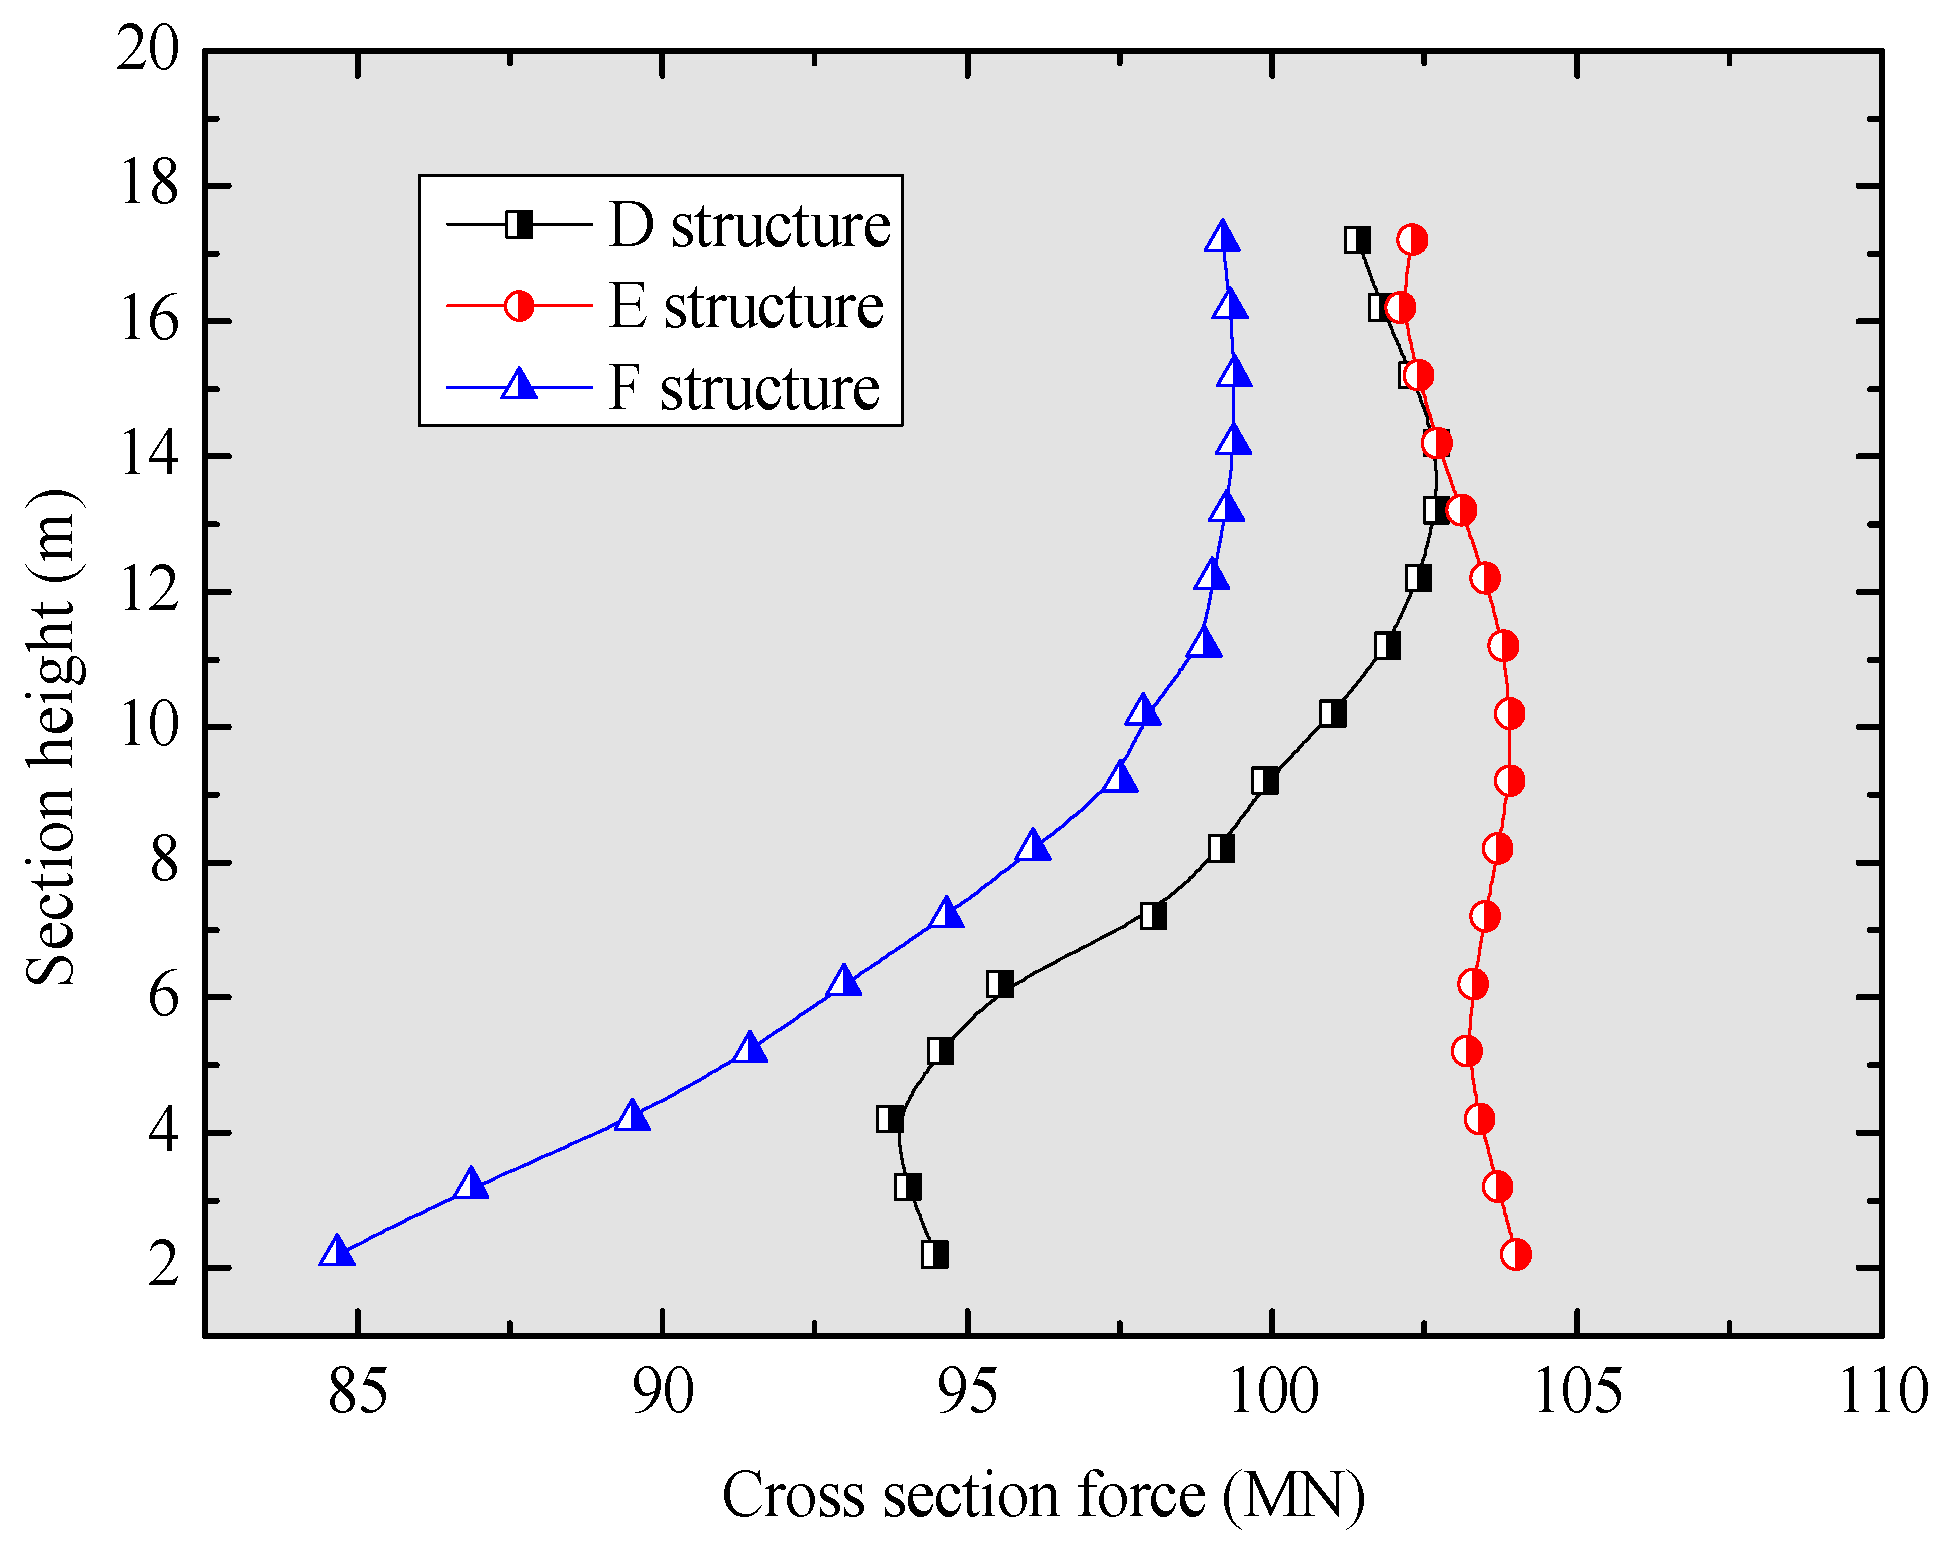
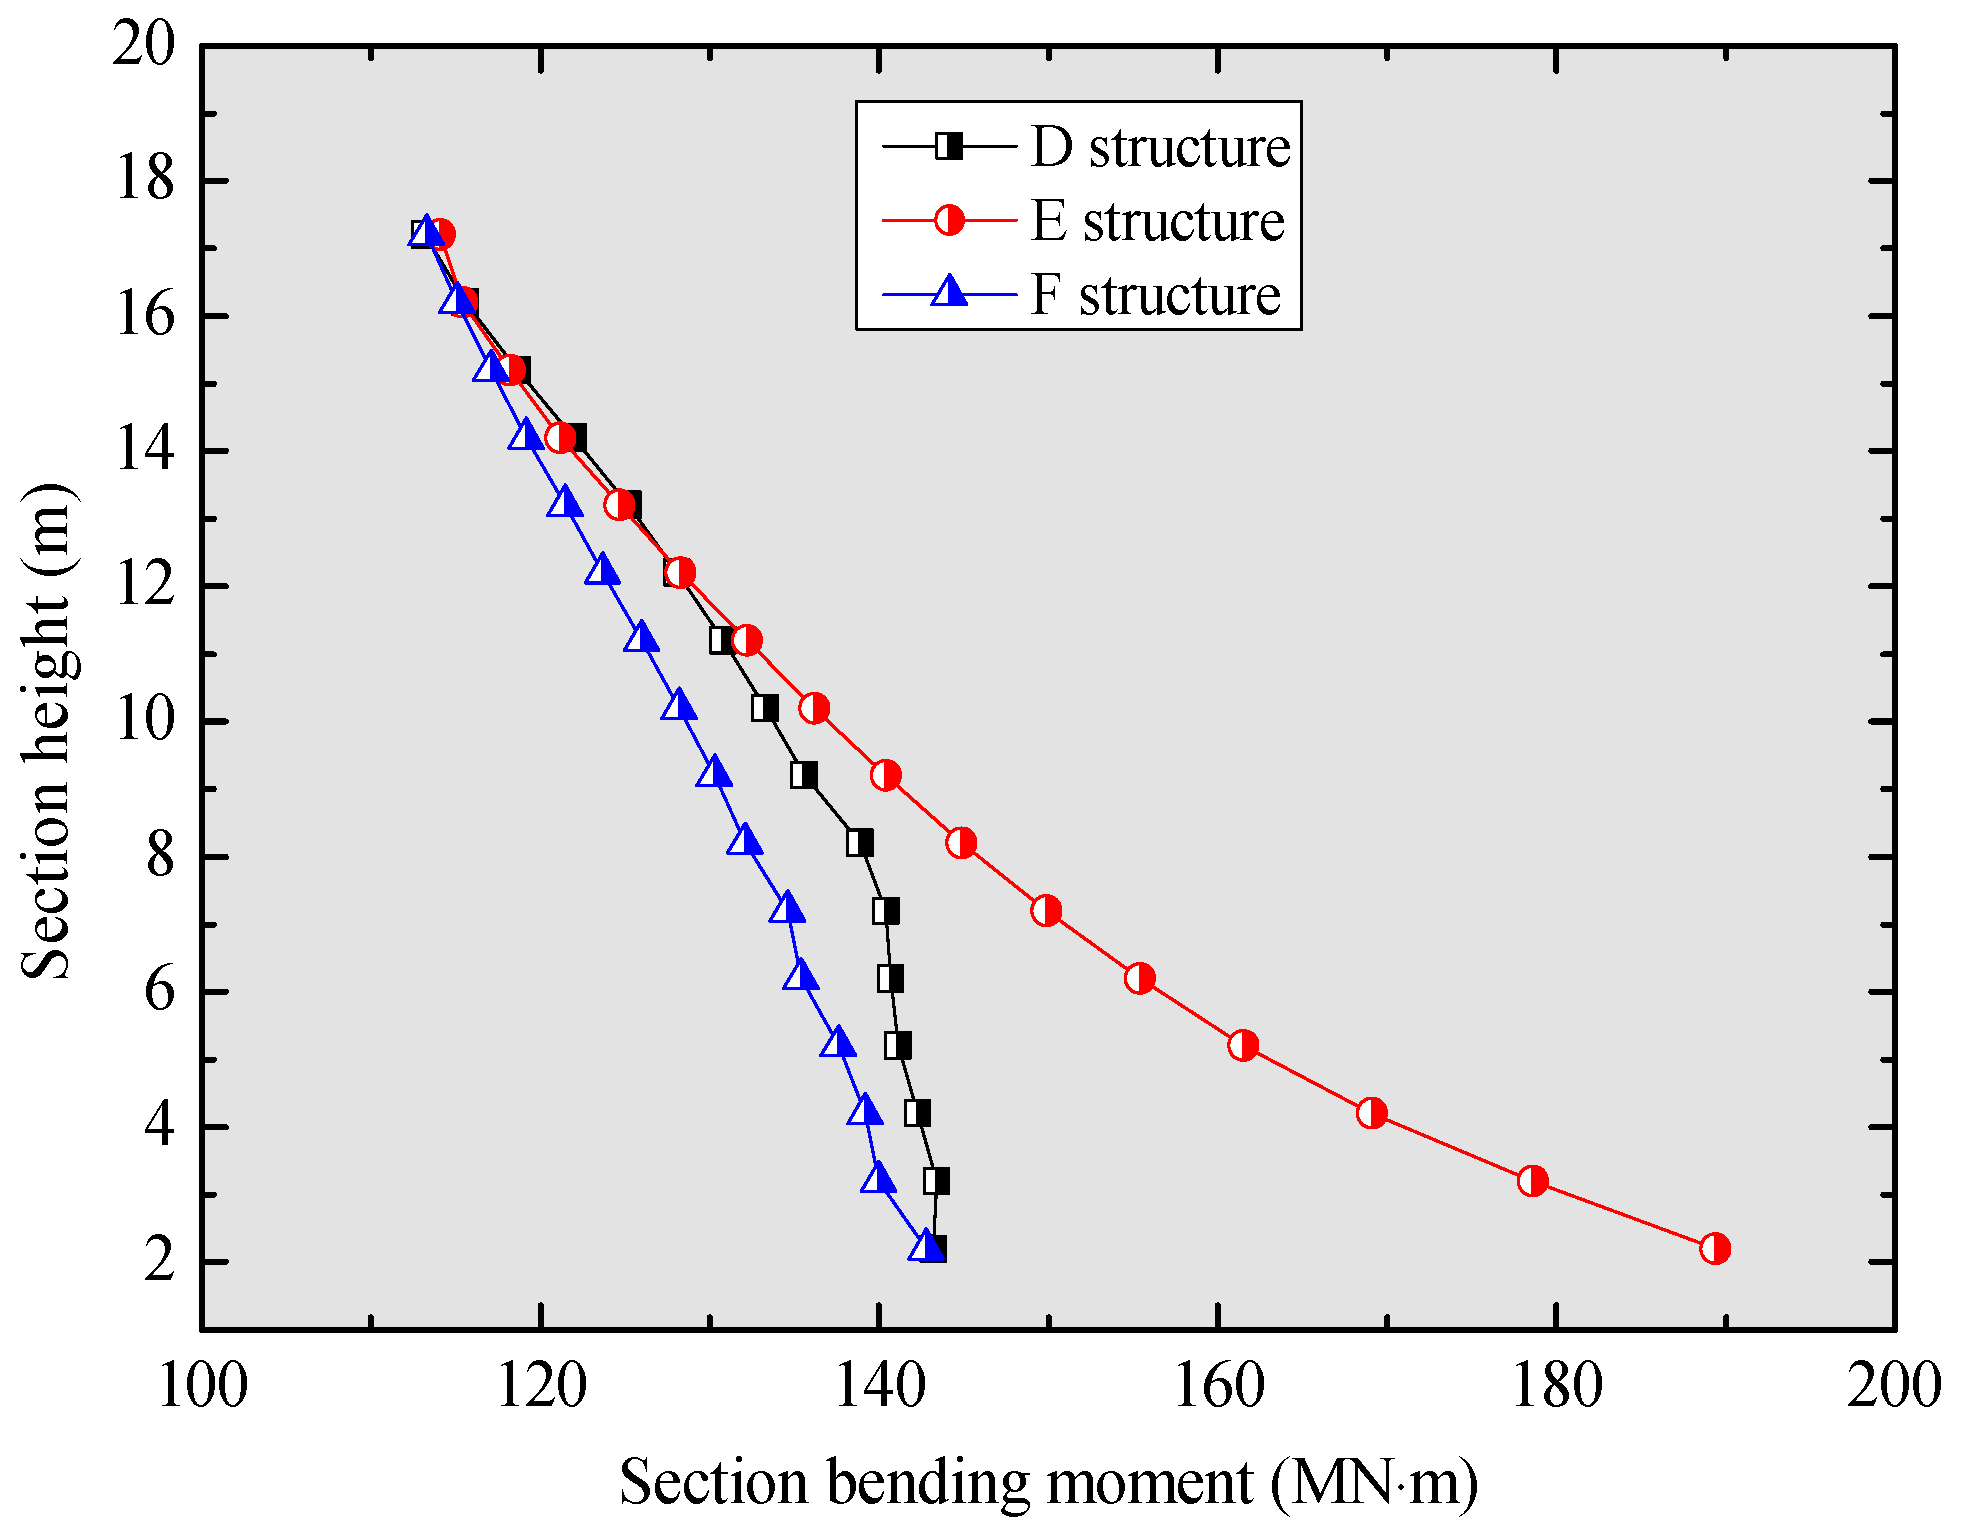
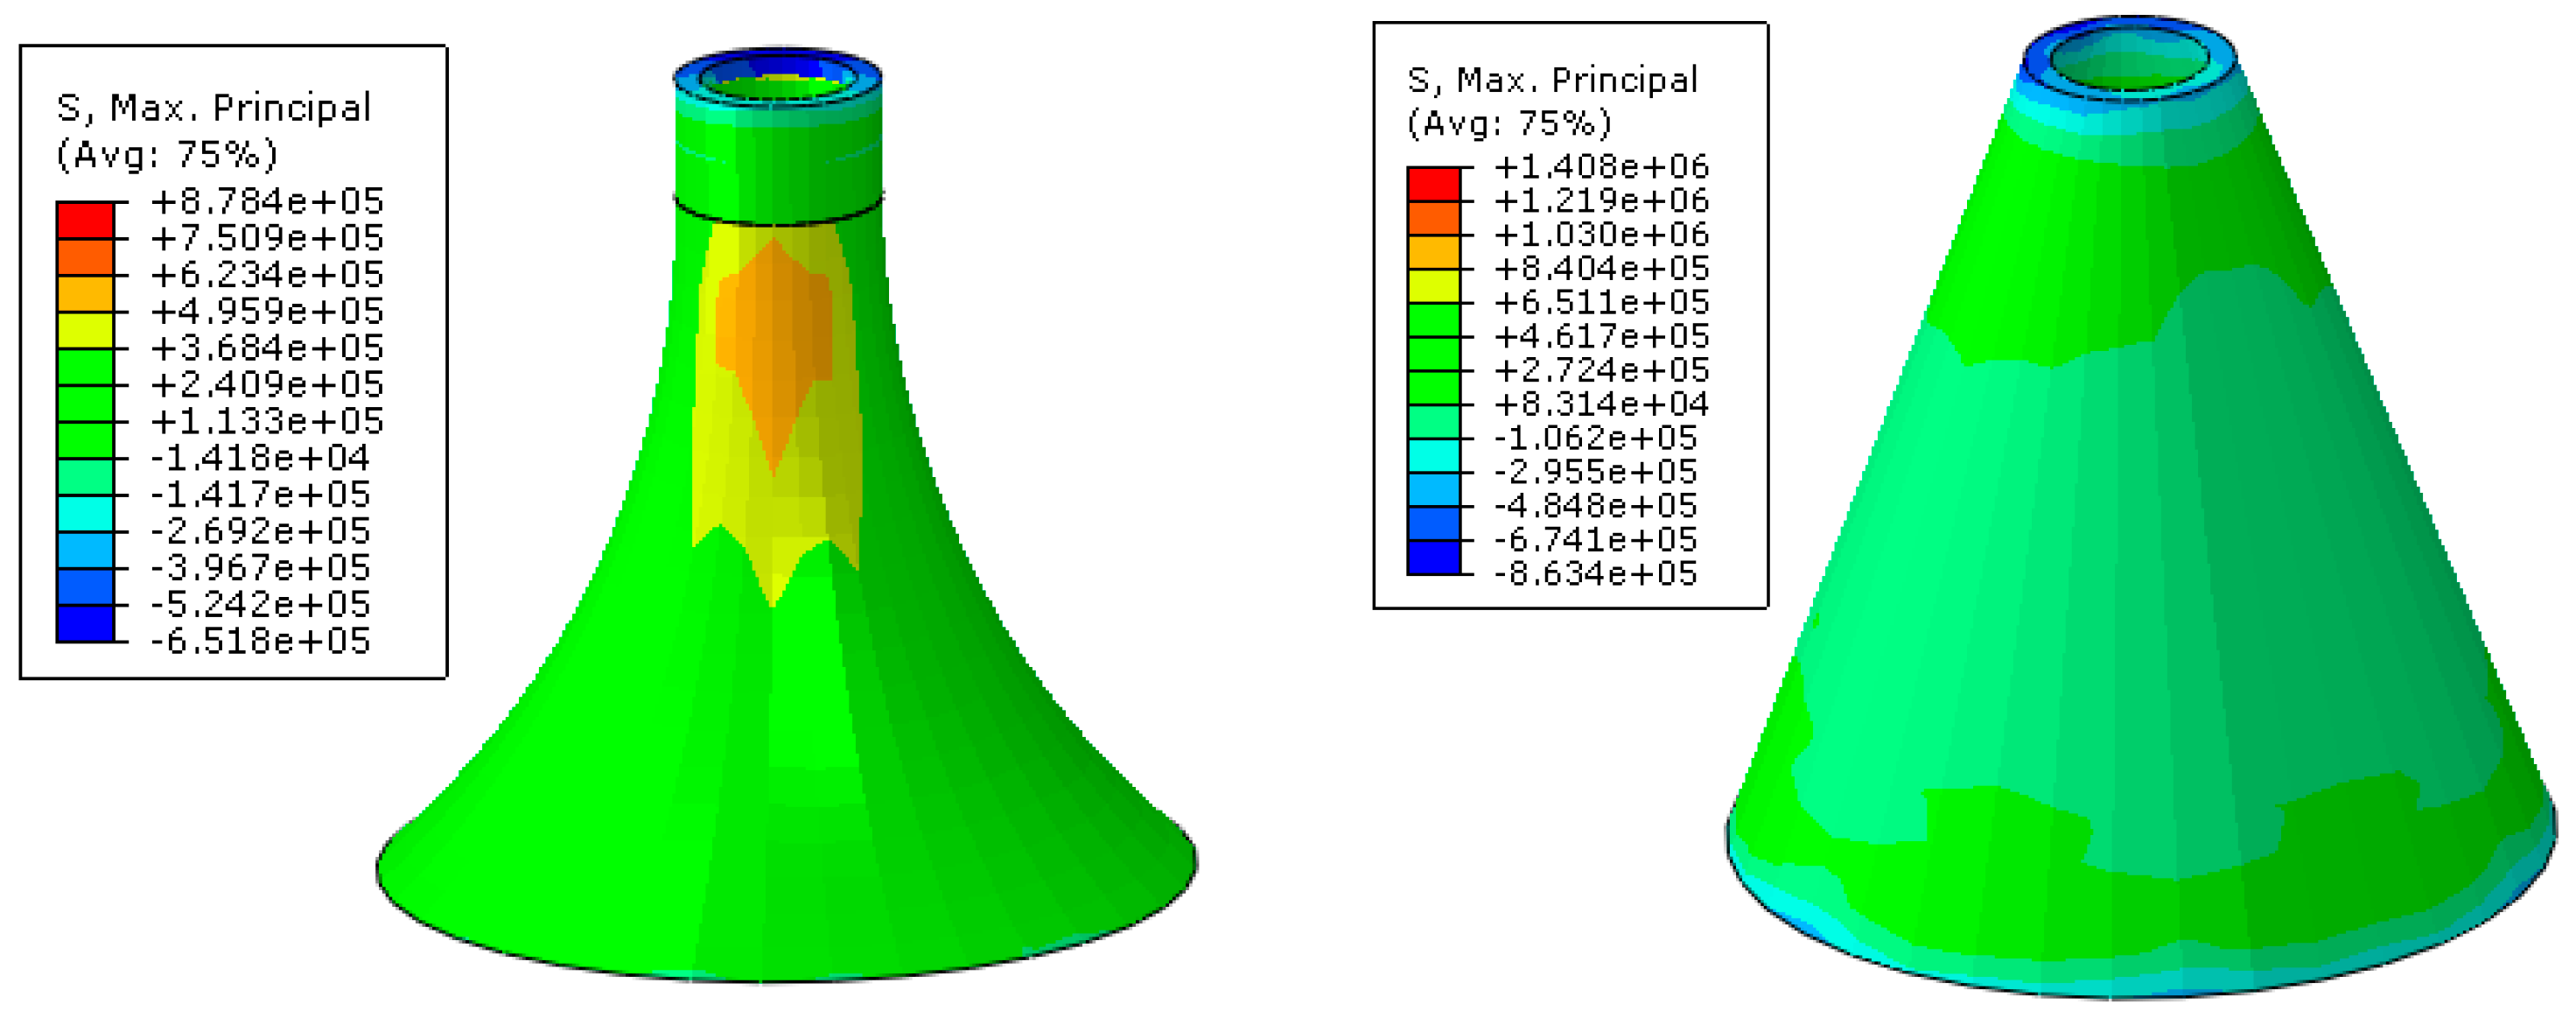
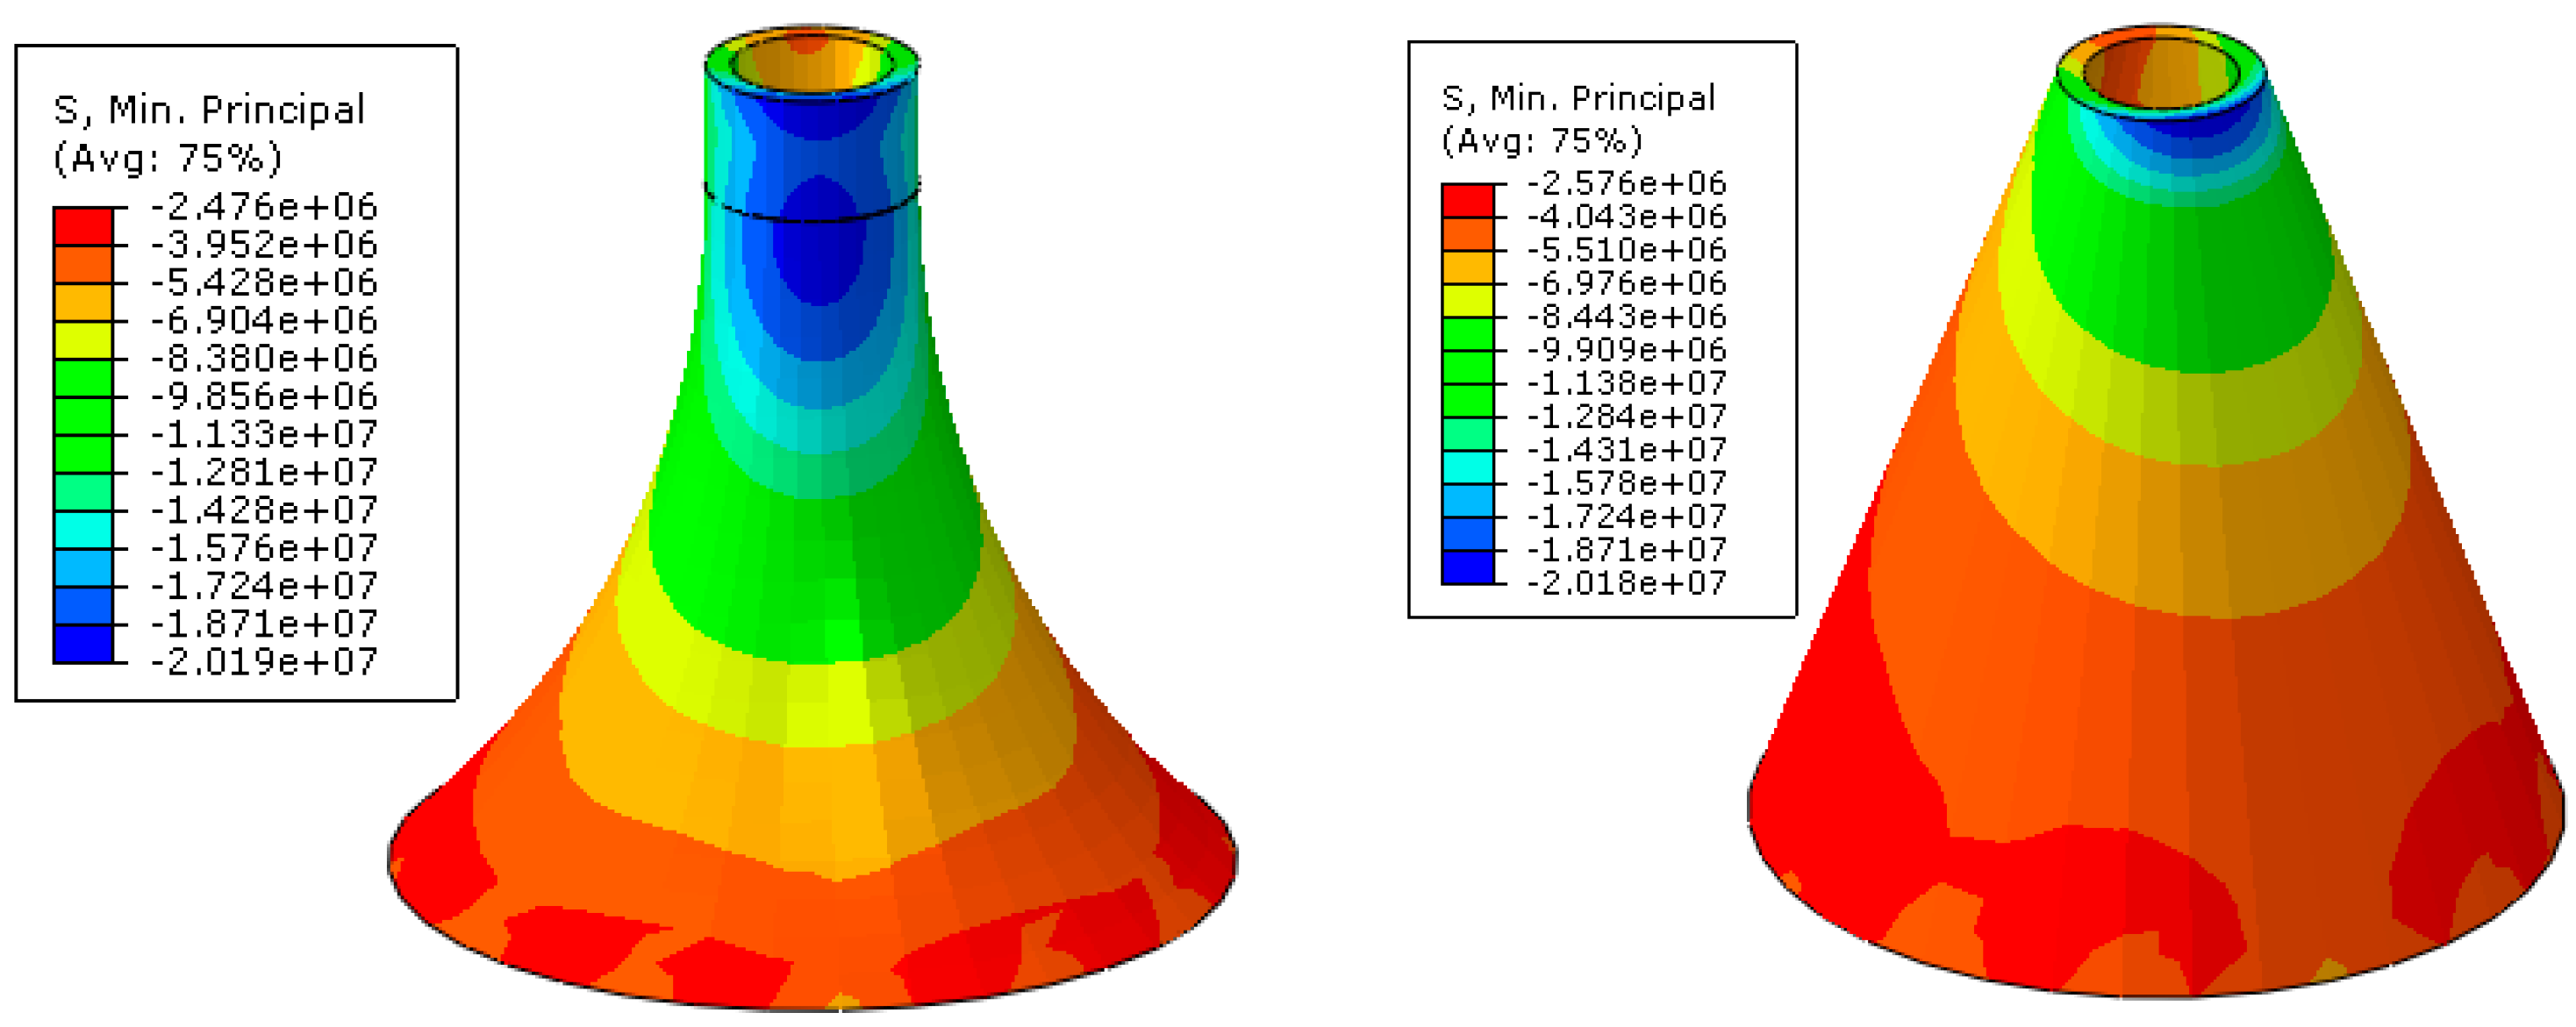
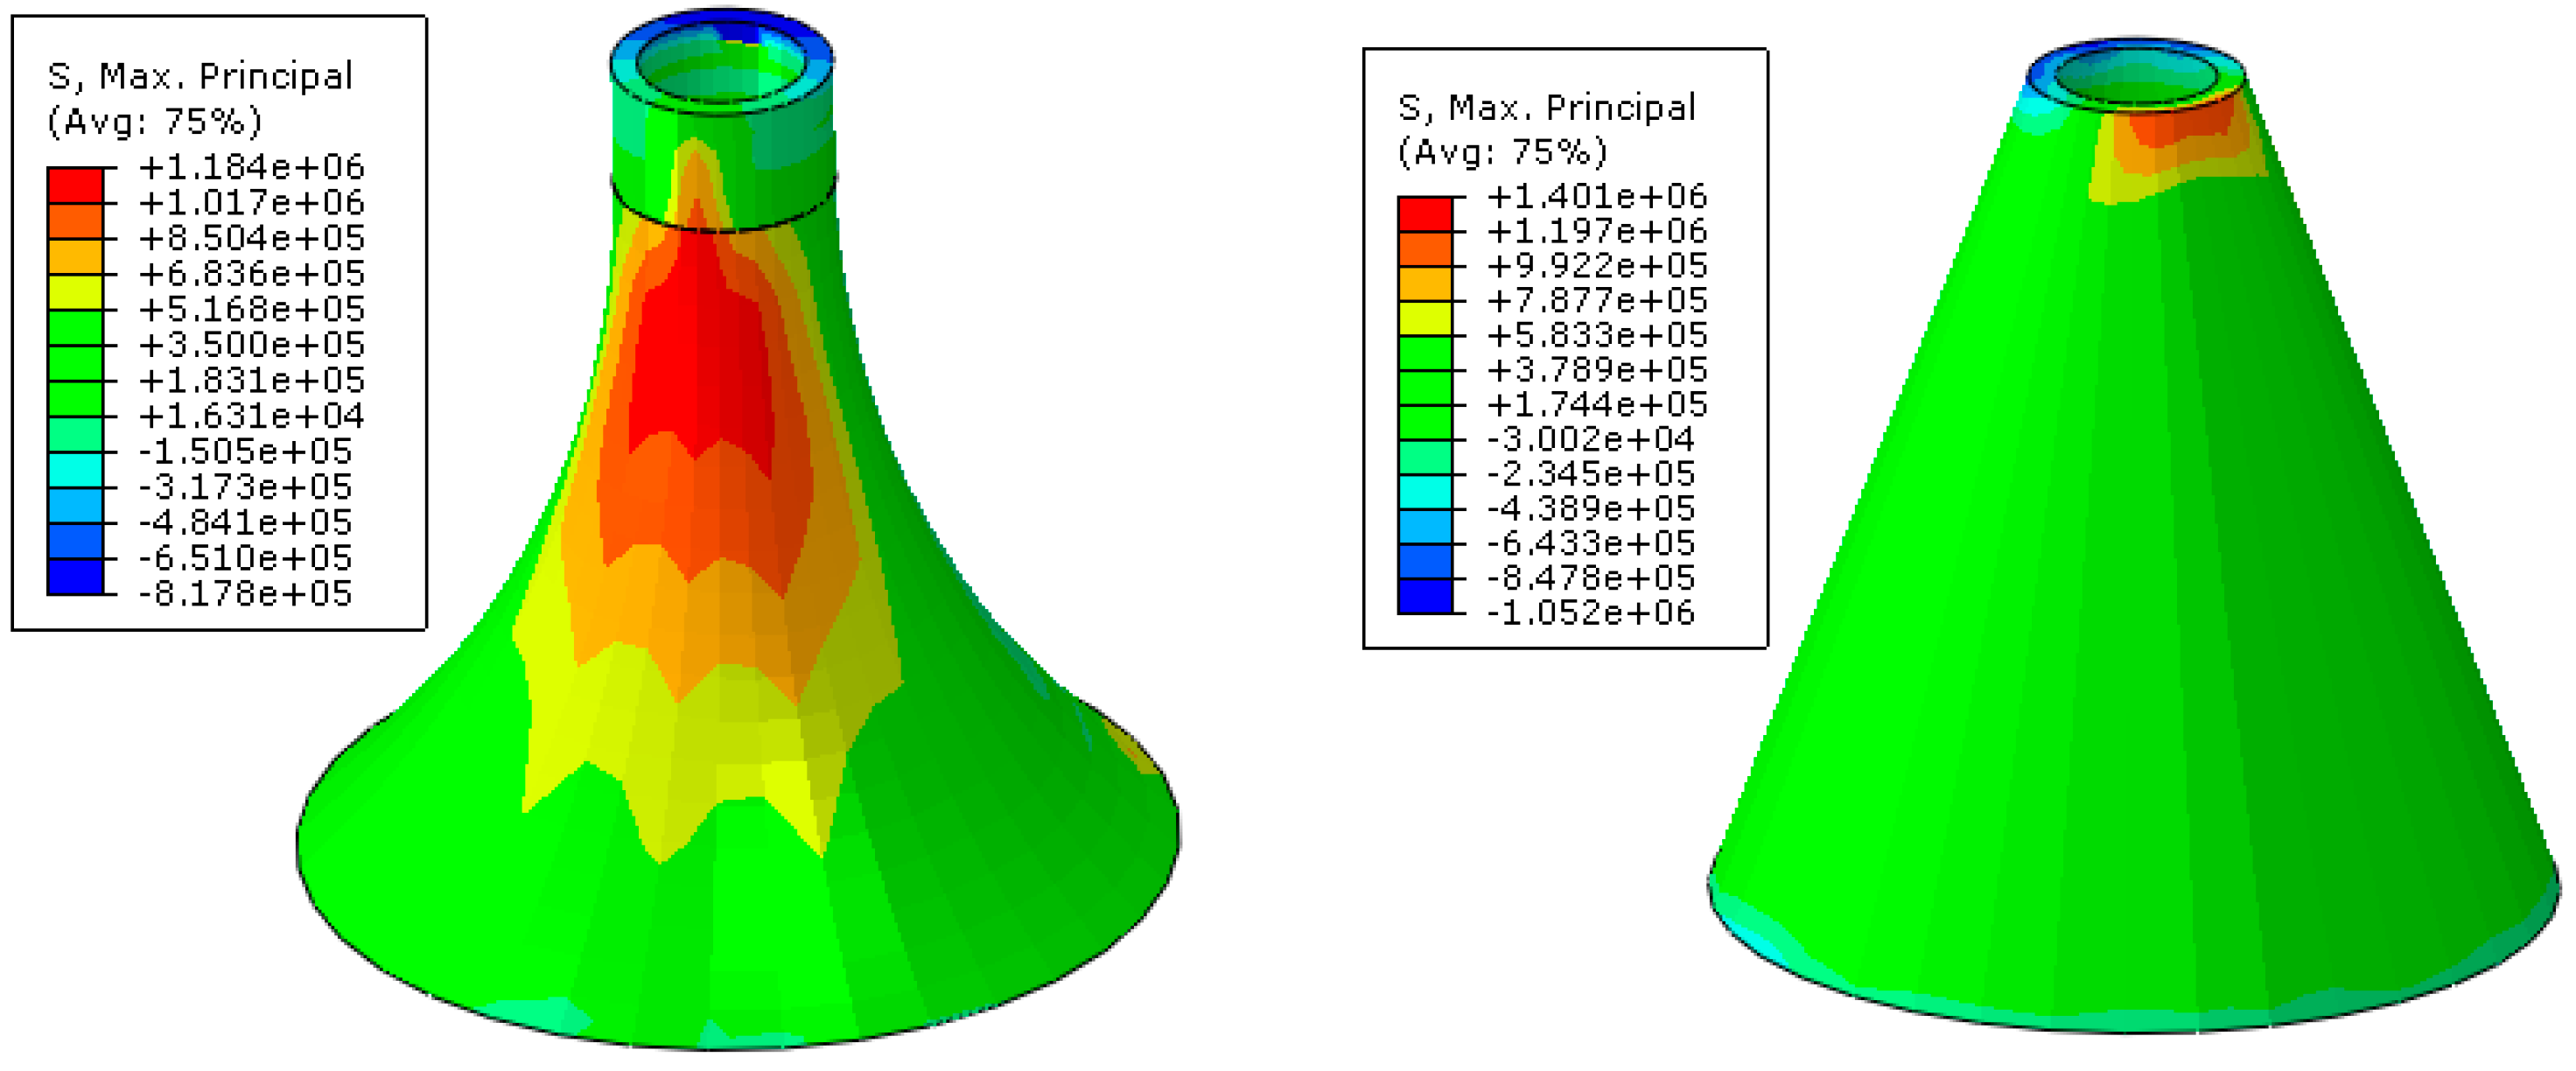
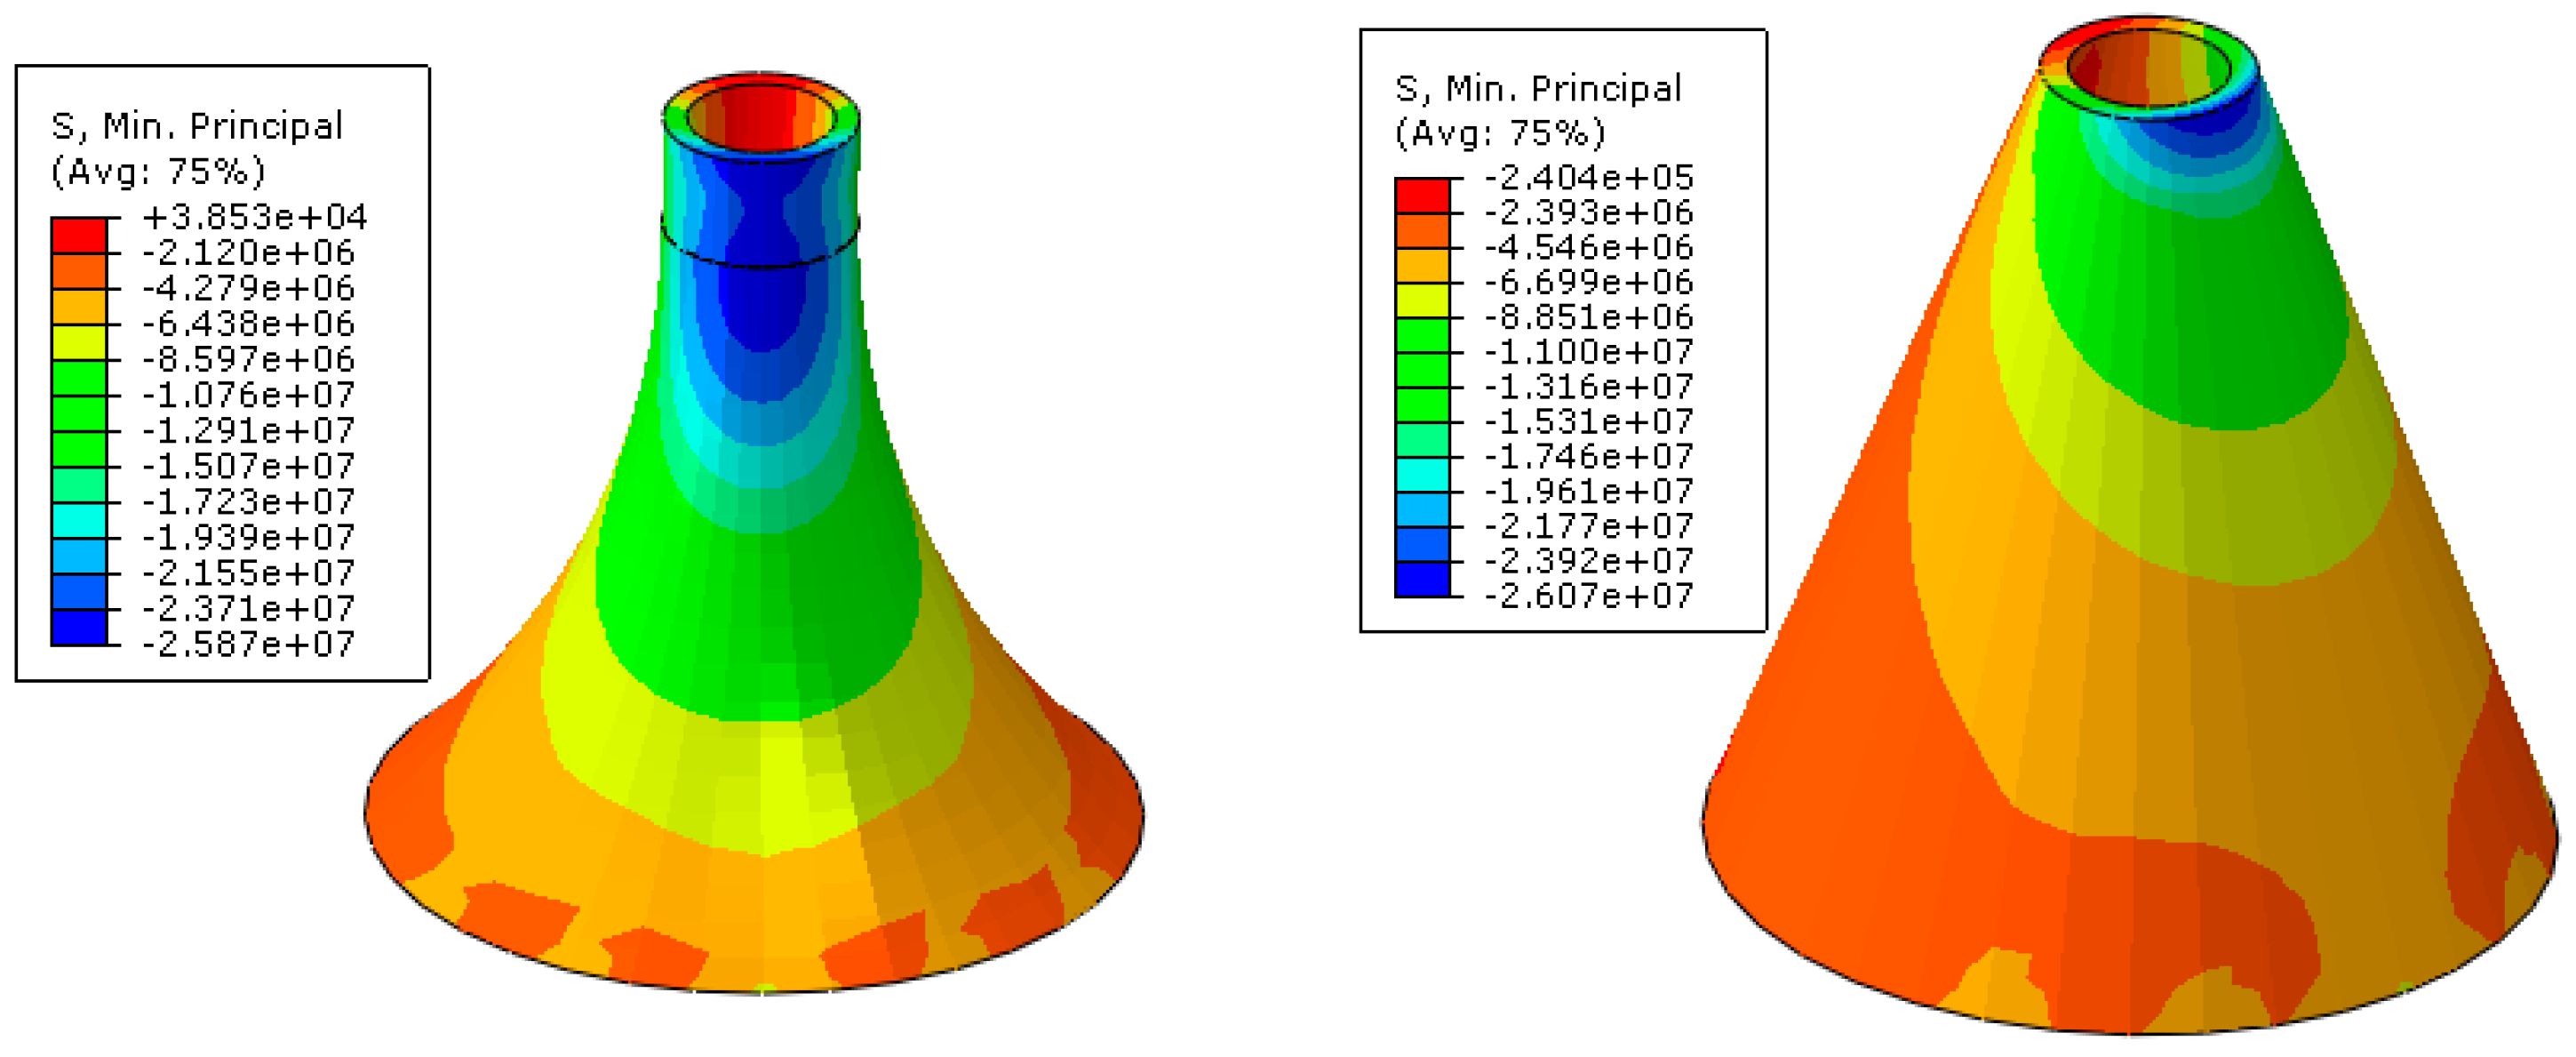
In the design of bucket foundation, the key is to solve the transfer of bending moments and horizontal forces. By designing a reasonable transition section, including its wall thickness, variation range of upper and lower opening diameters, prestressing force, and reinforcement, the coordination of the transition section (through which the bending moments and horizontal forces are transmitted from the tower to the top of the transition section), connecting ring beam, radial bucket top cap beam system, composite drum, and inner deck, is realized. Finally, the bending moments and horizontal forces can be effectively transferred and dispersed into the seabed soil. At the same time, through the optimized design of the transition section, the load can be transformed into the structure’s own limited tensile and compressive stress, thus the corrosion caused by the cracking in concrete can be avoided. In this way, the economic efficiency, durability, and reliability of the combined structural system (i.e., prestressed steel strand-steel plate-concrete) is guaranteed. The difficulty in the design of pre-stressed reinforced concrete composite structures comes from two aspects: (1) the force transfer mode of the entire structure is not clear; (2) and there is no relevant norm or experience for the design and calculation of the basic structure.

3. Topology Optimization of CBF

From the perspective of engineering design, the optimization of structural selection can be divided into three steps: the first is topology optimization, which determines the optimal topology of the structure under specific load and boundary conditions through calculations; the second is shape optimization, which determines a reasonable boundary shape to avoid stress concentration; and the third is size optimization, in which the specific dimensions of each part are determined based on the results of the previous two steps. In general, topology optimization consists of two steps, i.e., the construction of an optimization model, and the selection of a solving method.

3.1. Construction of Optimization Model

The eigenfunction of a structure can be used to parameterize various parts in the topology optimization process, as shown in Equation (1). Figure 4 illustrates the expressions of the eigenfunction for the bucket foundation and transition section, as well as their domain [28]:
χ ( x ) = 1 , x Ω mat χ ( x ) = 0 , x Ω void
where Ω is the design domain Ω mat ; Ω mat is the optimal material subset; and Ω void is the cavity set after softening.
From the parameterized structure shown in Figure 4, it can be seen that the structure density in the optimized area is 1 when x = 1, indicating that the structure is a solid structure; when x = 0 (i.e., the structure in the optimized domain has a material density of 0), the element is softened and removed, thus becoming a hole. Therefore, the eigenfunction of a structure is also referred to the eigenfunction of a structural material, through which the material properties at each point in the design domain can be mathematically expressed to define any structural shape therein [28]. Through the above analysis, the topology optimization model of the structure can be obtained, as shown in Equations (2) and (3):
min χ ( x ) f ( χ ( x ) )
s . t . : V χ ( x ) ( χ ( x ) ) V
where f ( χ ( x ) ) is objective function; χ ( x ) is structural volume; and V is the overall volume of the structure before optimization. According to different optimization objectives, can be arbitrarily set as structural properties, such as structural rigidity and frequency.
To find all the possible topological forms of the structure, Dorn et al. [29] proposed the concept of base structure to describe the topology of a continuum structure. The base structure method is used to determine the design area and design variables at first. The design area is also called a base structure under load and boundary conditions [28].
The expression of the internal force virtual work for an elastic body is:
a ( u , v ) = Ω E ijkl ( x ) ε u ( u ) ε v ( v )   d Ω
where Ω is structural design domain; E ijkl   is design variable; u is actual displacement; and v is virtual displacement. Then, the line strain can be expressed as:
ε ij ( u ) = 1 2 ( u i x i + u j x j )
The linear form of load (i.e., potential of external force) is calculated as:
l ( u ) = Ω f u d Ω + t t u d s
where f is physical strength; and t is boundary traction.
From the principle of virtual work, the following equation can be applied to an elastomer:
a ( u , v ) = l ( v )
The key to the topology optimization of a continuum structure [30] is to find the best topology represented by the optimization objectives under external load. According to the previous research results, the structure with the minimum structural deformation energy is considered as topologically optimal. In this paper, the minimum deformation energy of the transition section (i.e., the minimum compliance) is selected as the objective function. The model of structural design problem is expressed as:
min u U , E l ( u )
s . t . : a E ( u , v ) = l ( v ) ,   v U

3.2. Optimization Method for Structural Topology

According to the difference in the structural material parameter E, there are usually two different topological optimization design methods, i.e., homogenization method and variable density method. Since the second one is most widely used, it will be used in this paper [31,32,33]. There are two common density stiffness interpolation models: one is solid isotropic microstructures with penalization (SIMP), and the other is rational approximation of material properties (RAMP) [24].
(1) SIMP interpolation model
The SIMP interpolation model [18,28] mainly establishes a nonlinear correspondence between the elastic modulus of the material and the relative density of the element by introducing a penalty factor P, whose effect is to punish the intermediate density value when the value of the design variable is between (0,1), so that the intermediate density value gradually converges to 0/1, which can make the topological optimization model of continuous variables well approximate the original 0-1 discrete variable optimization model. Here, the intermediate density element is corresponding to a very small elastic modulus, and its influence on the structural stiffness matrix will become very small and even negligible [31,32].
The functional expression of the elastic modulus penalized by the penalty factor P is:
E P ( ρ ) = E min + ρ P ( E 0 E min )
where E 0 and E min are the elastic models of the entity and void, respectively. The influence of different values of P on the relationship between material design variables and elastic modulus is shown in Figure 5. According to the principle of material mechanics, the flexibility of the structure must be minimized (or the stiffness maximized and the strain capacity minimized) to ensure that the structure is optimized under the given boundary conditions and load conditions. Therefore, under the constraint condition (i.e., the model volume), the topology optimization model is:
Min   C ( X ) = { U } T [ K ] { U }
s . t . :   ( i = 1 n ( V i X i ) V ) 0 ,   0.001 X i 1
where [K] is structural stiffness matrix; {U} is structural displacement matrix; and C(X) is structural flexibility matrix. The stiffness matrix, flexibility matrix, and sensitivity matrix functions are as follows:
[ K ] = i = 1 n ( E min + X i p Δ E )   [ K i ]
C ( X ) = i = 1 n ( E min + X i p Δ E ) { U i } T [ K i ] { U i }
C ( X ) = i = 1 n pX i p 1 Δ E { U i } T [ K i ] { U i }
where Ki is the unit stiffness matrix of the ith element; Δ E = E 0 E min is the sensitivity matrix of structural flexibility; and Xi is the design variable of the element. To ensure that the stiffness matrix will not produce any singular moment, the minimum value of Xi is set as 0.001.
(2) RAMP interpolation model
In Reference [18], the continuation algorithm is studied to solve the topology optimization problem of local extremum, and it is found that with the increase of P, the discontinuity of the trace of the global optimal solution may occur, which leads to the fact that the final result will not converge under any values of P. Accordingly, a model that approximates the interpolated relationship of materials is proposed in the form of a rational function:
1 E ( ρ ) = 1 E min + ρ ( 1 E 0 1 E min )
The above equation can be expressed in a way similar to that used for the SIMP material interpolation model:
E q ( ρ ) = E min + ρ 1 + q ( 1 ρ ) ( E 0 E min )
The control parameters of the elastic modulus of the structural element [30] are the relative density ρ and weight coefficient q. When different values of q are taken, different densities of the middle element material ρ will cause the unit modulus and other performance parameters to approach 0 or E0, as shown in Figure 6.
The stiffness matrix, flexibility matrix, and sensitivity matrix functions are as follows:
[ K ] = i = 1 n ( E min + X i 1 + q ( 1 X i ) Δ E ) [ K i ]
C ( X ) = i = 1 n ( E min + X i 1 + q ( 1 X i ) Δ E ) { U i } T [ K i ] { U i }
C ( X ) = i = 1 n 1 1 + q ( 1 X i ) X i Δ E { U i } T [ K i ] { U i }
From Figure 5 and Figure 6, it can be seen that both SIMP and RAMP models can effectively suppress the occurrence of intermediate density elements. When a proper penalty factor P is used, the attribute coefficients of the middle element’s density can be as close to 0 or 1 as possible. In this paper, the SIMP interpolation model is used.

3.3. Topology Optimization Model for CBF

3.3.1. Model Overview

The transition section and cap of CBF are made of C50 concrete, and the lower part is a steel composite bucket made of Q345 with diameter of 30 m and height of 12 m. The material parameters of concrete are shown in Table 1. The upper part of the steel cylinder is a concrete top plate and a transitional section. The top of the transition section is connected to the tower of the wind turbine, thus the upper load can be transmitted to the top surface of the transition section. The hydrological conditions of a 3 MW unit are used as simulation conditions: the water depth is 13.34 m in the extreme condition, and the wave elements are the design elements for a 50-year event: the effective wave height H = 4.87 m, the average period T = 8.62 s, and the wave length L = 85.7 m. The maximum flow rate (downward current speed) is 2.31 m/s, the maximum wind speed is 15 m/s, and the average mean wind speed is 3 m/s.

3.3.2. Load Calculation

The offshore wind turbine mainly bears wind, wave, and current loads. The specific calculation methods for each load are as follows:
(1) Wind load
The wind load acting on the wind turbine is calculated according to the API specification, i.e.:
F = 0.5 C d ρ DHU 2
where C d is shape factor; ρ is air density; D and H are diameter and height of the tower, respectively; and U is wind speed.
(2) Wave load
The wave load acting on the transition section of the bucket foundation can be calculated according to the JTS 145-2015 “Code of Hydrology for Harbour and Waterway” [34,35]. For small piles with D/L ≤ 0.2, when H/d ≤ 0.2 and d/L ≥ 0.2 or H/d > 0.2 and d/L ≥ 0.35, the positive force acting on the horizontal directions of the pile at height Z above water surface is composed of velocity component and inertia component, i.e.:
p = p D + p I = 0.5 ρ C D Du | u | + ρ C M π D 2 4 u t
u = π H T ch 2 π ( d + z ) L sh 2 π d L cos ω t
u t = 2 π 2 H T 2 ch 2 π ( d + z ) L sh 2 π d L sin ω t
where PD is the velocity component of wave force (kN/m); PI is the force component of wave force (kN/m); D is the diameter of cylinder (m), and it will become b in the case of a rectangular section; CD is the coefficient of velocity force, which is taken as 1.2 for a circular section; CM is the coefficient of inertia force, which is taken as 2.0 for a circular section; u and ∂u/∂t are the horizontal speed (m/s) and horizontal acceleration (m/s2) of the water quality point orbit, respectively.ch is hyperbolic cosine function and sh is hyperbolic sine function; z is the depth below still water and it is measured negatively downward (m); d is still water depth (m); T is wave period (s) and L is wavelength (m); ω is circular frequency (s−1), ω = 2π/T; t is time (s), and when t = 0, the peak passes through the centerline of the cylinder.
The maximum values of PDmax and PImax for PD and PI occur when ωt equals 0° and 270°, respectively. When H/d ≤ 0.2 and d/L < 0.2 or H/d > 0.2 and d/L < 0.35, PDmax and MDmax should be multiplied by coefficients α and β, respectively. The value of α and β is 1.40, 1.50. When 0.04 ≤ d/L ≤ 0.2, PImax and MImax should be multiplied by coefficients γP and γM, respectively. The value of γP and γM, is 1.01, 1.05 [34,35].
(3) Current load
Current load is mainly calculated according to the specification of JTS 145-2015 “Code of Hydrology for Harbour and Waterway” [35], i.e.:
F w = C w ρ 2 V 2 A  
where Fw is standard value of water flow force (kN); V is the design value of flow rate (m/s); Cw is flow resistance coefficient; ρ is the density of water (t/m3), which is set as 1.0 and 1.025 for freshwater and seawater, respectively; and A is the projected area of the component in the flow to the vertical plane (m2).
(4) Weight of upper structure
The weight of each component is listed in Table 2.
The load transmitted from the tower and upper structure to the top surface of the transition section is listed in Table 3. The horizontal load and moment load adopt a structural safety factor of 1.35 and a structural importance factor of 1.1.
Therefore, the load combination of the 3 MW wind turbine is calculated, as listed in Table 4.

3.3.3. Construction of Model and Its Parameterization

The foundation structure of an offshore wind turbine bucket is mainly divided into an upper transition section and a lower steel cylinder. Two types of bucket foundation, i.e., linear and arc type, are designed, and two topological optimization models are established, respectively. The diameters of the upper and lower parts of the transitional section, and the barrel base are D1, D2, and D, respectively; and the height is H. The boundary constraints, loads and contact conditions of the two types are the same in the calculation process. The optimization area is the top cover and the transition section. The optimization objective is the minimum strain energy of the structure, and the constraint condition is the material volume. The quality after optimization should be maintained. The basic types and dimensions of each type are listed in Table 5.
Variable weight method is used to optimize the bucket foundation. Since the optimization region is continuous, the continuous variable X and the penalty factor P are introduced, thus the 0-1 discrete variable problem can be transformed into a continuous body optimization problem. Here, X takes the value in [0, 1], and a natural number satisfying 5 ≤ P ≤ 20 is used for trial calculation according to the literature. By taking strain energy and volume as response, the minimum strain energy is set as the optimal objective and the volume as the constraint condition, and the initial optimized volumes are 50% and 24%, respectively. Different values of P are set, and the transition section is optimized based on the RAMP interpolation model. Figure 7 shows the convergence curve of the iterative process. The optimization objective tends to be stable after 10 iterations, indicating that the algorithm has good convergence.

3.4. Analysis of Calculation Result

3.4.1. Transmission Path in Infrastructure

Figure 8 shows the topology diagrams for four bucket foundations after optimization. The gray part is the concrete transition section and top plate, while the blue part is the composite bucket. The void is the removed element after softening. It can be seen that the bottom diameter of the transitional section has a greater influence on the transmission force. Whether the transition section is of arc- or linear-type, the force transfer effect of the concrete top cover gradually weakens when the bottom edge of the transition section extends to the edge of the barrel wall.
The load is transmitted to the top of the transition section, then to the edge of the composite bucket wall, and finally to the foundation soil. The role of linear-type foundation top cap in transmitting forces is smaller than that of arc-type one.
When the bottom edge of the transition section does not extend to the cylinder wall, the upper load will be first transferred to the concrete top cap through the transition section, and then to the edge of the cylinder wall through the top cap. The utilization ratio of the top cap of the linear-type foundation is larger than that of the arc-type one, indicating that the top cap is more involved in load bearing; the arc-type foundation takes the advantages of its arc structure, and transmits more loads to the wall; the section size of the linear-type transition section is larger at the same height, which increases the influence of spoilage. The straight transition section requires a thicker top cap to transmit the force, and this shape is more in line with the design concept of a top-support bucket foundation; since the composite bucket’s height to diameter ratio is relatively smaller, CBF has a broad and shallow base, thus the cap can transfer more load.
From the above analysis, it can be seen that the upper transition section of the bucket foundation has a large number of softened regions (i.e., the structural elements do not contribute to force transmission or load-carrying) in both linear- and arc-type structures, therefore, thin-wall hollows can be adopted in the design. Figure 9 shows the topological structure of two types of designs with a wall thickness of 600 mm.
From Figure 9, it can be seen that the two optimized foundations have only a few scattered softening elements in the transition section, indicating that the thin-walled structures are more reasonable in the force transmission path; the upper load is transferred to the concrete in the circumferential range, thus more structural elements are involved in loading; the utilization rate of arc-type structure is larger than that of the linear-type, showing that the transmission force in the arc-type section is more straightforward by taking the advantage of the arc-type structure to transmit force, and the arc-type foundation has a smaller cross-sectional size at the same height, thus the corresponding influence on the spoilage is also smaller; the linear-type transition section requires a thicker top cover to transmit the force, which conforms to the design concept of a top-support barrel-type foundation.
Figure 10a–d show the relative density of structures after normalization under load. The four types of foundations have a large number of elements in the transitional section with a density close to 0 (marked by blue color). Combined with the topological analysis shown in Figure 7, the internal elements of the upper transition section contribute less to the load-bearing capacity of the structure, thus the structure type can be further optimized. Therefore, a hollow thin-wall transition section structure is used. Figure 10e,f show the relative density of the arc- and linear-type thin-walled transitional structures; the density of most elements in the structure is close to 1, showing a better load-bearing performance.

3.4.2. Finite Element Calculation

To prove the rationality of the topology optimization model of CBF, finite element method is used. This ABAQUS model adopts an explicit linear integral element form (C3D8R), the steel yield strength is 345MPa, the elastic modulus is 200 GPa, and the Poisson’s ratio is 0.3. The concrete adopts C50 grade, the elastic modulus is 34.5 GPa, and Poisson’s ratio is 0.167. The soil is defined as an elasto-plastic material using the Mohr-Coulomb yield criterion. The concrete and steel are defined as elastic materials, the contact between the cylindrical wall and the cap is of friction type, the friction coefficient is 0.25, and the prestress is 1320 MPa.
Figure 11, Figure 12, Figure 13 and Figure 14 show the distribution curves of internal forces at the cross-section of different types of transitional section within the structural height range under extreme load conditions. As shown in Figure 11 and Figure 12, the section forces and section bearing moments of three kinds of linear transition section decrease with the increasing section height, and the changing trends are basically linearly. It can be seen that the optimized A-type structure is superior to others.
Figure 15 and Figure 16 show the distributions of the maximum and minimum principal stress fields of the optimized model under working load conditions, respectively. The tensile stress of the optimized linear- and arc-type structures under the working load do not exceed the ultimate strength of the concrete. The structural high-stress regions expand along the section height and in the circumferential direction, indicating that more concrete participates in bearing. This is consistent with the basic topological model.
Figure 17 and Figure 18 show the maximum and minimum principal stress field distributions for the optimized model under extreme load conditions. The optimized linear- and arc-type structures do not exceed the ultimate strength of the concrete. The structural high-stress regions expand along the section height and in the circumferential direction, indicating that more concrete participates in bearing. This is consistent with the basic topological model. Under ultimate load, the stress of both foundations exceeds the limit value; the stress concentration area is at the top cap of the transition section, which is related to the arc curvature and inclination of the straight line.
From the optimization results shown in Figure 17 and Figure 18, it can be found that under the condition of equal quality, the structural flexibility after optimization, showing that this method is still effective for the topology optimization of the bucket foundation as well as the transition section.

4. Shape Optimization for CBF

4.1. Construction of Optimization Model of Transition Section

The essence of the optimization of the transition section is to seek the optimal solution of each design variable at the minimum total construction cost. Thus, the shape parameters of each part are selected as design variables, all of which should meet the constraints of strength, rigidity, and stability; and the minimum total weight of the structure is taken as the objective function. Accordingly, the optimal model of a bucket foundation structure is:
{ F ( X ) = min f ( X ) g i ( X ) 0 h i ( X ) = 0
where F(X) is the objective function related to the basic body shape parameters, which can represent the total cost; variable X represent the body shape design parameters of different parts; and hi(X) and gi(X) are constraint functions, representing the requirements under geometric construction conditions, overall and local strengths, stiffness, and stability of the bucket foundation structure.

4.1.1. Design variables

The relevant design variables are factors affecting the strength and load-carrying capacity of the bucket foundation, including nine variables, i.e., height of transition section (X5), thickness of top cover (X6), diameters of upper opening (X1 and X2), diameters of lower opening (X3 and X4), diameters of steel cylinder (X8 and X9), and height of cylinder (X7), as shown in Figure 19.
X i = ( X i 1 , X i 2 , X i 3 , , X i 9 ) T
where i denotes the ith scheme. The values of X1 and X2 are determined by the upper tower size, and X5 is determined based on hydrological conditions. The value of X7 is determined in accordance with the required depth of soil penetration into the wall of the drum. Considering that the cylindrical wall of bucket foundation all sink below the soil surface, the concrete transition section is a hollow thin-walled structure, and the thickness of the transition section is held constant from top to bottom, we have X2X1 = X4X3. With reference to all of the above design conditions, the number of all variables can be reduced to five.

4.1.2. Objective function

The purpose of the optimization of the offshore wind turbine is to find the most reasonable type and structural parameters for each part, while satisfying the requirements of various operating conditions and engineering safety design requirements. Meanwhile, simple construction, relatively low cost, and overall economic benefits should also be taken into account. Therefore, the objective function of optimization design is to select the overall weight of the concrete transition section. Let M1(X), M2(X), and M3(X) represent the weights of concrete transition section, concrete top cover, and steel cylinder, respectively, then the expression of F(X) is as follows:
F ( X ) = M 1 ( X ) + M 2 ( X ) + M 3 ( X )
The formulas for the total weight are as follows:
M 2 ( X ) = ρ c π X 9 2 X 6 4
M 3 ( X ) = ρ s π X 7 4 ( X 9 2 X 8 2 )
It should be pointed out that the curvature of the arc-type transition section is related to the height of the transition section (X5), the inner and outer diameters (X1 and X2) of the upper section, and the inner and outer diameters (X3 and X4) of the lower section. After the above variables are determined, the size of the arc-type transition section will also be determined. Therefore, the volume of the arc-type transition section can be approximately calculated according to the volumetric formula of a circular table of the same size. Accordingly, the formula for M1(X) is:
M 1 ( X ) = ρ c π X 5 12 ( X 4 2 + X 2 X 4 + X 2 2 X 3 2 X 1 X 3 X 1 2 )

4.1.3. Constraint conditions

For the bucket foundation, its constraint conditions mainly include the strength constraint and the deformation constraint, i.e., each part of the concrete and the steel should meet the strength limits given in specifications, and the base slope should satisfy the specification of FD 003-2007. In addition, the size of the steel cylinder wall should meet the requirements of the structure to resist buckling deformation. For the transition section structure with prestressed reinforcement, the influence of prestressing tendons must also be considered.
(1) Strength constraints
The stress on each section of the transition section structure should meet:
σ = N A ± M W [ σ ]
The section stress on the top of the transition section should meet:
σ =   M π 32 X 2 ( X 2 4 X 1 4 ) ± F V π 4 ( X 2 2 X 1 2 ) [ σ ]
The stress on the bottom of the transition section should satisfy:
σ 1 = M 1 W 1 = M 1 π 32 D 1 3 ( 1 α 4 ) = [ σ ]
where:
M 1 = M + F H X 5 M q
D 1 = X 5 ( X 4 X 2 ) + X 5 X 2 X 5
α = X 5 ( X 4 X 2 ) + X 2 X 5 ( X 2 X 1 ) X 5 X 5 ( X 4 X 2 ) + X 5 X 2
The stress at the joint between the transition tower section and top cover should satisfy:
σ = M 3 y I = [ M 3 + F V 3 X 4 2 X 7 2 X 4 X 7 ] X 4 X 4 3 X 7 3 ( X 1 + X 2 ) [ σ ]
(2) Stability constraints
The inclination of the concrete top cap is:
Δ s / x 9 tan θ
where Δs is the displacement difference of the bucket foundation cover along the force direction; and tan θ is the allowable value of the inclination rate. Here, Δs = s1s2, and s1 and s2 are the final settlement of the two edges in the actual pressure-carrying area in the tilt direction.
According to soil mechanics, the basic foundation deformation can be obtained using the method of additional stress. Although the cylindrical foundation is circular, it can be approximated as a rectangle in the calculation process, as shown in Figure 20 [16]:
A eff = 2 [ R 2 arccos ( e R ) e R 2 e 2 ]
b e = 2 ( R e )
l e = 2 R 1 ( 1 b e 2 R ) 2
l eff = A eff l e b e ,   b eff = l eff l e b e
In addition, the bucket foundation also needs to meet requirements of vertical bearing capacity, anti-slide, and anti-dump, i.e.:
Q U / Q V 2 ,   F R / F S 1.3 ,   M R / M S 1.6
(3) Buckling constraints
To meet the structural strength and flexion requirements, the wall thickness of the composite bucket should be reduced as much as possible to facilitate the settlement of construction.
The wall buckling constraint is as follows:
σ σ xe = 0.061 E t R
(4) Calculation of prestressed reinforcement:
In consideration of the cost and durability, the transition section of the bucket foundation is designed as a concrete structure. Due to the large moment and horizontal force transmitted from the upper part to the top surface of the transition section, the stress of the concrete transition section usually cannot meet the strength limit. Therefore, to reduce its size and total weight, it is configured with arc prestressing tendons in the height direction to control cracking in the structure and adjust the force balance. The number of prestressed bars and the corresponding arrangement are mainly estimated according to load on the top of the structure. The number of unbonded prestressed bars is determined by:
A p = N pe σ con σ l , tot
where Npe is the total effective pre-force; σl,tot is the estimated total loss; σcon is the tension control stress; and Ap is the cross-section area:
N pe = β M q W [ σ ctq , lim ] 1 A + e p W
where W is the elastic resistance moment on the tensile edge of the member cross-section; A is the member’s cross-section; Mq is the design value of bending moment under quasi-permanent load combination, which is calculated according to formula (48); σctq,lim is the tensile stress limit of concrete under the quasi-permanent load combination, and it takes the value of 0 for the offshore structure; ep is the eccentricity distance from the center of gravity on the member’s cross-section to the center of gravity of unbonded prestressed tendons; B is coefficient, and it takes 1.2 for the positive moment section of a continuous member and 0.9 for the negative moment section:
M q = M [ σ ] π 32 X 2 ( X 2 4 X 1 4 )

4.2. Optimization example of CBF

SQP algorithm and hybrid genetic algorithm are used to perform the optimization calculation, respectively. The parameters of each part of the bucket foundation obtained using these two algorithms are listed in Table 6 and Table 7, respectively.
From Table 6 and Table 7, it can be seen that the results obtained using the two algorithms are similar, indicating that this method can be used for the preliminary calculation of the selection and design of CBF. The mass of the transition section and the bucket foundation satisfying the load and constraint conditions is about 2400 t. The optimization results obtained using SQP are slightly larger than those using hybrid genetic algorithm. Considering that the advantages of the hybrid genetic algorithm are closely related to the size of population and the rule of iteration, the initial solution regenerated in each iterative process is probably a local optima.

5. Conclusions

In this paper, based on topology optimization, the optimal topology of the transition section of CBF is studied under several working conditions. The optimization models of the bucket foundation and its transition section are established. SQP and hybrid genetic optimization algorithms are further used to optimize the shape of the prestressed steel-mixed composite bucket foundation. The following conclusions are obtained:
(1)
Topology optimization method can better solve the selection problem of irregular and complex structures. After the optimization of transition structure, there are only fewer and dispersive softening elements. In the thin-walled structures of two types of foundation, the transfer path are more reasonable; when the transition section transfers the upper load to the concrete ring, more structural elements are involved in bearing.
(2)
The type of CBF transition has a larger impact on the force transmission path. When the bottom edge of the transition section extends to the edge of the barrel wall, the load can be transferred directly to the barrel wall.
(3)
Compared with the linear-type transition section, the structural transition of the arc-type transition can transfer force in a more straightforward way; at the same height, the section area is smaller, and the influence on spoilage is also smaller.
In summary, mathematical programming provides an effective tool for the selection and optimization of offshore wind turbines.

Author Contributions

Conceptualization, H.D. and P.Z.; Methodology, P.Z. and C.L.; Software, Y.X. and Y.G.; Formal Analysis, C.L. and Y.X.; Writing-Original Draft Preparation, Y.X. and Y.G.; Writing-Review & Editing, P.Z. and C.L.

Funding

This research was funded by the National Natural Science Foundation of China (Grant Nos. 51779171 &51679163), Innovation Method Fund of China (Grant No. 2016IM030100) and the Tianjin Municipal Natural Science Foundation (Grant No. 17JCYBJC22000).

Conflicts of Interest

The authors declare no conflict of interest.

References

  1. Zhao, Q.; Chai, F.L. A review on recent advancements of substructures for offshore wind turbines. Energ. Convers. Manage. 2018, 15, 103–119. [Google Scholar]
  2. BRANSBY, F.; RANDOLPH, M. The effect of embedment depth on the undrained response of skirted foundations to combined loading. Soils Found. 1999, 39, 19–33. [Google Scholar] [CrossRef]
  3. Shi, X.C.; Xu, R.Q.; Gong, X.N.; Chen, G.X.; Yuan, Z.L. Experimental Study on Horizontal Bearing Capacity of Single Bucket with Barrel Foundation. Chin. J. Geotech. Eng. 1999, 6, 723–726. [Google Scholar]
  4. Liu, Z.W.; Wang, J.H.; Qin, C.R.; Yuan, Z.L.; Chen, G.X. Study on Horizontal Bearing Capacity of Bucket Foundation with Negative Pressure. Chin. J. Geotech. Eng. 2000, 6, 691–695. [Google Scholar]
  5. Gourvenec, S.; Randolph, M. Effect of Strength Non-Homogeneity on the Bearing Capacity of Circular Skirted Foundations Subjected to Combined Loading. In Proceedings of the Twelfth (2002) International Offshore and Polar Engineering Conference, Kitakyushu, Japan, 26–31 May 2002. [Google Scholar]
  6. Zhai, G.J.; Li, Y.G.; Kang, H.G. Comprehensive fuzzy optimization of offshore foundation pile foundation structure. Engin. Sci. 2010, 12, 40–46. [Google Scholar]
  7. Ding, H.Y.; Yu, R.; Zhang, P.Y.; Le, C.H. Prestressing Optimization Design of Large Scale Prestressed Bucket Foundation Structures for Offshore Wind Power. Trans. Tianjin Univ. 2012, 45, 473–480. [Google Scholar]
  8. Lian, J.J.; Ding, H.Y.; Zhang, P.Y.; Yu, R. Design of Large-Scale Prestressing Bucket Foundation for Offshore Wind Turbines. Trans. Tianjin Univ. 2012, 18, 79–84. [Google Scholar] [CrossRef]
  9. Ding, H.Y.; He, S.H.; Zhang, P.Y.; Zhai, S.H. Structural optimization design of pre-stressed transition section of compound bucket foundation. J. Tianjin Univ. (Nat. Sci. Eng. Technol. Ed.) 2017, 50, 174–180. [Google Scholar]
  10. Feld, T.; Rasmussen, J.L.; Sørensen, P.H. Structural and economic optimization of offshore wind turbine support structure and foundation. In Proceedings of the 18th International Conference on Offshore Mechanics and Artic Engineering, St. John’s, Nfld, Canada, 11–16 July 1999. [Google Scholar]
  11. Kang, H.G.; Zhang, X. Study on optimization method of offshore pile fan. Sci. Technol. Innov. Her. 2010, 16, 2–9. [Google Scholar]
  12. Wu, M.X.; Shi, Z.M. The ultimate reaction method for calculating the bearing capacity of bucket foundation. Chin. Ocean Platform. 2004, 4, 24–27. [Google Scholar]
  13. Liu, R.; Chen, G.S.; Liu, Y.C.; Xu, Y. Analysis of flexural characteristics of large diameter and shallow bucket foundations for offshore wind power. J. Tianjin Univ. (Nat. Sci. Eng. Technol. Ed.) 2013, 46, 393–400. [Google Scholar]
  14. Yang, F. Offshore Pile Fan Foundation—Tower Dynamic Load Characteristics and Responses and Pile Foundation Optimization. Ph.D. Thesis, China Institute of Water Resources and Hydropower Research, Beijing, China, 2013. [Google Scholar]
  15. Liu, X.Z. Research on Design and Safety of Large Diameter Wide Shallow Cylindrical Foundation Structures for Offshore Wind Power. Ph.D. Thesis, Tianjin University, Tianjin, China, 2010. [Google Scholar]
  16. Liu, M.M. Study on Bearing Capacity and Optimization Design of Compound Bucket Foundation for Offshore Fan. Ph.D. Thesis, Tianjin University, Tianjin, China, 2014. [Google Scholar]
  17. Sun, L.K. Study on the optimization of body shape and bearing capacity of offshore wind-power composite pile. MEng. Thesis, Tianjin University, Tianjin, China, 2014. [Google Scholar]
  18. Chen, L. Research on Structural Layout Optimization Method Based on Force Transfer Path. MEng. Thesis, Nanjing University of Aeronautics and Astronautics, Nanjing, China, 2010. [Google Scholar]
  19. Lan, Q.; Du, Y.F.; Li, H. Topology Optimization Based Simulation of Force Transfer of Raft Foundation. Comput. Simul. 2007, 11, 104–106. [Google Scholar]
  20. Kirsch, U. Integration of reduction and expansion processes in layout optimization. Struct. Optim. 1996, 11, 13–18. [Google Scholar] [CrossRef]
  21. Kirsch, U.; Taye, S. On optimal topology of grillage structures. Eng. Comput. 1986, 1, 229–243. [Google Scholar] [CrossRef]
  22. Kirsch, U. Optimal topologies of flexural systems. Eng. Optim. 1987, 11, 141–1149. [Google Scholar] [CrossRef]
  23. Kirsch, U. Optimal topologies of truss structures. Comput. Methods Appl. Mech. Eng. 1989, 72, 15–28. [Google Scholar] [CrossRef]
  24. Kirsch, U. On singular topologies in optimum structural design. Struct. Optim. 1990, 2, 133–142. [Google Scholar] [CrossRef]
  25. Kirsch, U.; Topping, B.H.V. Minimum weight design of structural topologies. J. Struct. Eng. 1992, 118, 1770–1785. [Google Scholar] [CrossRef]
  26. Kirsch, U. Optimal topologies of structures. Appl. Mech. Rev. 1989, 42, 223–239. [Google Scholar] [CrossRef]
  27. Liu, R.; Li, B.R.; Lian, J.J. Research on Co-bearing Mechanism of Single-piles Composite Tube Foundation Piles in Offshore Wind Power. J. Tianjin Univ. (Nat. Sci. Eng. Technol. Ed.) 2015, 48, 429–437. [Google Scholar]
  28. Li, B.H. Topology Optimization Design and Post-processing Method of Flexible Mechanism Based on Variable Density Method. MEng. Thesis, Huazhong University of Science and Technology, Wuhan, China, 2015. [Google Scholar]
  29. Dorn, W.; Gomory, R.; Greenberg, H. Automatic design of optimal structures. J. Mec. 1964, 3, 25–52. [Google Scholar]
  30. Wang, C.H. Continuum structure topology optimization design. MEng. Thesis, Northwestern Polytechnical University, Xi’an, Shanxi, China, 2005. [Google Scholar]
  31. Wu, D.F. Research on Topology Optimization of Continuum Structure Based on Variable Density Method. MEng. Thesis, Xidian University, Xi’an, Shanxi, China, 2010. [Google Scholar]
  32. Man, H.L. Theoretical Research and Application of Topology Optimization of Engineering Structure. MEng. Thesis, Jilin University, Jilin, China, 2007. [Google Scholar]
  33. Yang, Z.Y. Research on Topology Optimization of Continuum Structure Based on Variable Density Method. MEng. Thesis, Xidian University, Xi’an, Shanxi, 2009. [Google Scholar]
  34. Morison, J.R.; Johnson, J.W.; Schaaf, S.A. The force exerted by surface waves on piles. J. Pet. Technol. 1950, 2, 149–154. [Google Scholar] [CrossRef]
  35. CCCC First Harbor Consultants Co., Ltd. Code of Hydrology for Harbour and Waterway; JTS 145-2015; China Communications Press Co., Ltd.: Beijing, China, 2015. [Google Scholar]
Figure 1. Composite bucket foundation (CBF) with concrete skirt of 2.5 MW in Qidong, Jiangsu Province, China.
Energies 11 03230 g001
Figure 2. CBF with steel skirt of 3 MW in Xiangshui Wind Farm, Jiangsu Province, China.
Energies 11 03230 g002
Figure 3. Structure of CBF.
Energies 11 03230 g003
Figure 4. Initial design domain and eigenfunction.
Energies 11 03230 g004
Figure 5. Relationship between design variables and elastic moduli in solid isotropic microstructures with penalization (SIMP) model.
Energies 11 03230 g005
Figure 6. Relationship between design variables and elastic modulus of rational approximation of material properties (RAMP) model.
Energies 11 03230 g006
Figure 7. Optimal iterative convergence curve.
Energies 11 03230 g007
Figure 8. Optimal topologies of bucket foundation: (a) Foundation A; (b) Foundation B; (c) Foundation C; (d) Foundation D.
Energies 11 03230 g008
Figure 9. Optimal topologies of bucket foundation: (a) Foundation E; (b) Foundation F.
Energies 11 03230 g009
Figure 10. Nephogram of relative density of different foundations (non-dimensional): (a) Foundation A; (b) Foundation B; (c) Foundation C; (d) Foundation D; (e) Foundation E; (f) Foundation F.
Energies 11 03230 g010
Figure 11. Curve of section axial force before and after optimization.
Energies 11 03230 g011
Figure 12. Curve of section bending moment before and after optimization
Energies 11 03230 g012
Figure 13. Curve of cross section force before and after optimization.
Energies 11 03230 g013
Figure 14. Curve of section bending moment before and after optimization.
Energies 11 03230 g014
Figure 15. Nephogram of tensile stress under working load conditions (Pa).
Energies 11 03230 g015
Figure 16. Nephogram of compressive stress under working load conditions (Pa).
Energies 11 03230 g016
Figure 17. Nephogram of tensile stress under extreme load conditions (Pa).
Energies 11 03230 g017
Figure 18. Nephogram of compressive stress under extreme load conditions (Pa).
Energies 11 03230 g018
Figure 19. Design variables for bucket foundation.
Energies 11 03230 g019
Figure 20. Effective area of circular foundation base.
Energies 11 03230 g020
Table 1. Concrete parameters of bucket foundation.
Modulus of Elasticity/MPaPoisson’s RatioDensity/(kg·m−3)Design Value of Compressive Strength/MPaDesign Value of Tensile Strength/MPa
34,5000.167250023.11.89
Table 2. Weight of each part of the wind turbine Unit: t.
TowerCabin AssemblyGeneratorImpeller System
22432.86868.3
Table 3. Cases of load.
ConditionActing PositionVertical load /kNHorizontal Load /kNMoment Load /(kN·m)
Normal operationTop of transition section 7144.2868.761,663.4
Ultimate loadTop of transition section 70111523109,368
Table 4. Cases of load combination.
ConditionLoad typeVertical load/kNHorizontal /kNMoment load /(kN·m)
Operating loadUpper transfer load7144.2868.761,663.4
Wave force-450.56-
Current-47.45-
Combination7144.21366.7177,079.25
Ultimate loadUpper transfer Load70111523109,368
Wave force-608.17-
Current-64.06-
Combination70112195.23136,710
Table 5. Dimensions of different bucket foundations.
ClassificationDimensions
Foundation ALinear, D1 = 4.5 m, D2 = 30 m, D = 30 m, H = 12 m
Foundation BLinear, D1 = 4.5 m, D2 = 30 m, D = 30 m, H = 12 m
Foundation CArc-shaped, D1 = 4.5 m, D2 = 18 m, D = 30 m, H = 12 m
Foundation DArc-shaped, D1 = 4.5 m, D2 = 18 m, D = 30 m, H = 12 m
Foundation ELinear thin-walled, D1 = 4.5 m, D2 = 18 m, D = 30 m, H = 12 m
Foundation FArc-shaped thin-walled, D1 = 4.5 m, D2 = 18 m, D = 30 m, H = 12 m
Table 6. Calculation result obtained using hybrid genetic algorithm.
X1 (m)X2 (m)X3 (m)X4 (m)X5 (m)X6 (m)X7 (m)X8 (m)X9 (m)Total mass (t)
3.1994.02619.30520.13214.9891.76311.46322.10822.7862397.322
Table 7. Calculation results obtained using sequence quadratic programming (SQP).
X1 (m)X2 (m)X3 (m)X4 (m)X5 (m)X6 (m)X7 (m)X8 (m)X9 (m)Total mass (t)
3.2514.00820.88321.71115.0291.84112.18622.71923.3962406.64

