Article

Hydrothermal Carbonization Brewer’s Spent Grains with the Focus on Improving the Degradation of the Feedstock

Department of Conversion Technologies of Biobased Resources, Institute of Agricultural Engineering, University of Hohenheim, Garbenstrasse 9, 70599 Stuttgart, Germany
*
Author to whom correspondence should be addressed.
Energies 2018, 11(11), 3226; https://doi.org/10.3390/en11113226
Submission received: 22 October 2018 / Revised: 11 November 2018 / Accepted: 15 November 2018 / Published: 21 November 2018
(This article belongs to the Special Issue Hydrothermal Technology in Biomass Utilization & Conversion)

Abstract

:
Hydrochar is a very interesting product from agricultural and food production residues. Unfortunately, severe conditions for complete conversion of lignocellulosic biomass is necessary, especially compared to the conversion of sugar compounds. The goal of this work is to improve the conversion of internal carbohydrates by application of a two-steps process, by acid addition and slightly higher water content. A set of experiments at different temperatures (180, 200, and 220 °C), reaction times (2 and 4 h), and moisture contents (80% and 90%) was performed to characterize the solid (high heating value (HHV), elemental) and liquid product phase. Afterwards, acid addition for a catalyzed hydrolysis reaction during hydrothermal carbonization (HTC) and a two-steps reaction (180 and 220 °C) were tested. As expected, a higher temperature leads to higher C content of the hydrochar and a higher fixed carbon (FC) content. The same effect was found with the addition of acids at lower temperatures. In the two-steps reaction, a primary hydrolysis step increases the conversion of internal carbohydrates. Higher water content has no significant effect, except for increasing the solubility of ash components.

1. Introduction

The two major conversion pathways to produce energy from lignocellulosic biomass are based on biological and thermochemical processes [1]. Among the several advantages of thermochemical processes versus biological ones are that the former have shorter conversion times and higher robustness, while biological processes require an accurate control using microorganisms. Due to its versatility and flexibility, thermochemical conversion technologies receive special attention by process developers. Thermochemical conversions can be divided depending on the feedstock’s characteristics in dry processes where the feedstock’s moisture content is between 5 wt.% and 10 wt.%, such as torrefaction, pyrolysis, and gasification; and in wet processes, which focus on feedstock with moisture content between 60 wt.% and 90 wt.% [2]. These wet processes are hydrothermal carbonization (HTC), hydrothermal liquefaction (HTL), and hydrothermal gasification (HTG).
This study focuses on the HTC process. HTC is a promising technology for processing wastes and residues with high moisture content, aiming to produce carbonaceous material [3], called hydrochar to distinguish it from other carbonaceous materials, such as biochar or coal [4,5,6]. The operating temperature range of HTC is from 180 °C to 250 °C, in order to maximize solid production (66 wt.% dry basis) [4,7,8] and minimize gas and liquid/solved organic compounds yield [9]. At temperatures from 250 °C to 373 °C the process is called HTL, so liquid phase is the main product [10]. If gas phase is the desired product phase, usually the temperature has to be increased near to or above the critical point of water; in this case the process is called HTG or supercritical water gasification (SCWG) [11].
The chemical mechanisms involved during the HTC process involve a sequence of different reactions. These are essentially hydrolysis, dehydration, decarboxylation, aromatization and re-condensation reactions [12,13,14,15]. As most of them also occur simultaneously, the study of the process is quite complex. According to Kruse et al. [16], the reactions are divided on two major pathways. Firstly, the solid-to-solid conversion of original biomass takes place (here, the structure of the hydrochar has the morphology and structural elements of the initial feedstock). Secondly, the solvation of the intermediates from converted biomass in the aqueous phase, which is followed by polymerization [7,17]. This is a simplification, because in the case of biomass both processes occur. The dominant pathway depends on the structure and composition of biomass (Karayıldırım et al. [17]).
A study carried out by Kambo and Dutta [18] focused on the applications of hydrochars, depending on their chemical composition, morphological features, and surficial functionalities. Applications can be energy production by combustion, carbon sequestration and gas adsorbent, soil amelioration and activated carbon, for example, for air and water cleaning.
In this study, the feedstock processed was brewer’s spent grains (BSG) (dry mass 20–25 wt.%), which is a by-product of breweries; it is lignocellulose with glucamine-rich proteins [19]. The high protein content of BSG makes it suitable for animal nutrition (e.g., cattle), although the proteins cannot be completely assimilated into rumens [20]. Furthermore, the production of BSG is not constant throughout the year; harvesting cycles can result in overproduction. The presence of proteins reduces storability by enzymatic hydrolysis, which is a serious environmental problem. Therefore, there is a real necessity to develop flexible processes that can buffer the BSG quantity. In this context, the implementation of thermochemical processes such as HTC are considered a promising alternative [21].
Regarding this objective, this study tries to contribute to the knowledge of the HTC process under different operating conditions, in order to control the product distribution, maximize the energy yield and evaluate the effect on the main chemical compounds in liquid phase. The final aspect is important in view of the water treatment technologies needed.
The process was carried out in a batch reactor, where the influence of temperature, residence time, and moisture content was evaluated. A two-steps HTC process and the addition of an organic acid (CH3COOH) is also investigated. The two first parameters, temperature and reaction time, have been considered by several authors [7,22,23,24], which concluded that product distribution was mainly affected by operating temperature and that the reaction time does not play a significant role. Usually the moisture content was not evaluated. Thus, in this paper we studied two different known moisture contents, three different temperatures, and two reaction times. The different water contents may influence the hydrolysis or polymerization, in the case of limited solubility.
In order to improve the properties of the hydrochars obtained, the strategy of carrying out the process in two-steps was studied, which was considered a significant factor according to Fakkaew et al. [7]. This strategy consists of a first step to enhance the hydrolysis reaction between 170 °C and 180 °C, and a second step, in which the carbonization reactions take place at a range of 200–220 °C. This implies the maximization of both reaction rates, which have different optimums, leading to an increase of fixed carbon (FC) content. On the other hand, Ghanim et al. [25] studied the effect of addition of H2SO4 and CH3COOH. Both had an effect on the removal of ash content; however, H2SO4 also produced an increase of FC content. Obtaining a lower ash content because of the removal of alkaline and alkaline earth metals (AAEMs) [26] improves the high heating value (HHV) (MJ/kg) of the hydrochars obtained.
From these prior results the hypothesis was created that two-steps carbonization with a hydrolysis step and the addition of acids improves hydrochar properties as a fuel. This could avoid the increase of temperature to get a similar improvement. If hydrolysis is important, the water content may also have an influence. The aim of this paper is to verify or refute the hypothesis and investigate the influence of water on the two-steps process.

2. Materials and Methods

2.1. Feedstock

The biomass feedstock used in this study is BSG, with a moisture content of 78 wt.%, from Hoepfner Brewery Factory (Karlsruhe, Germany). It was stored at −15°C until processed. In Table 1 (see method section), the main analytical data to characterize the feedstock are summarized.

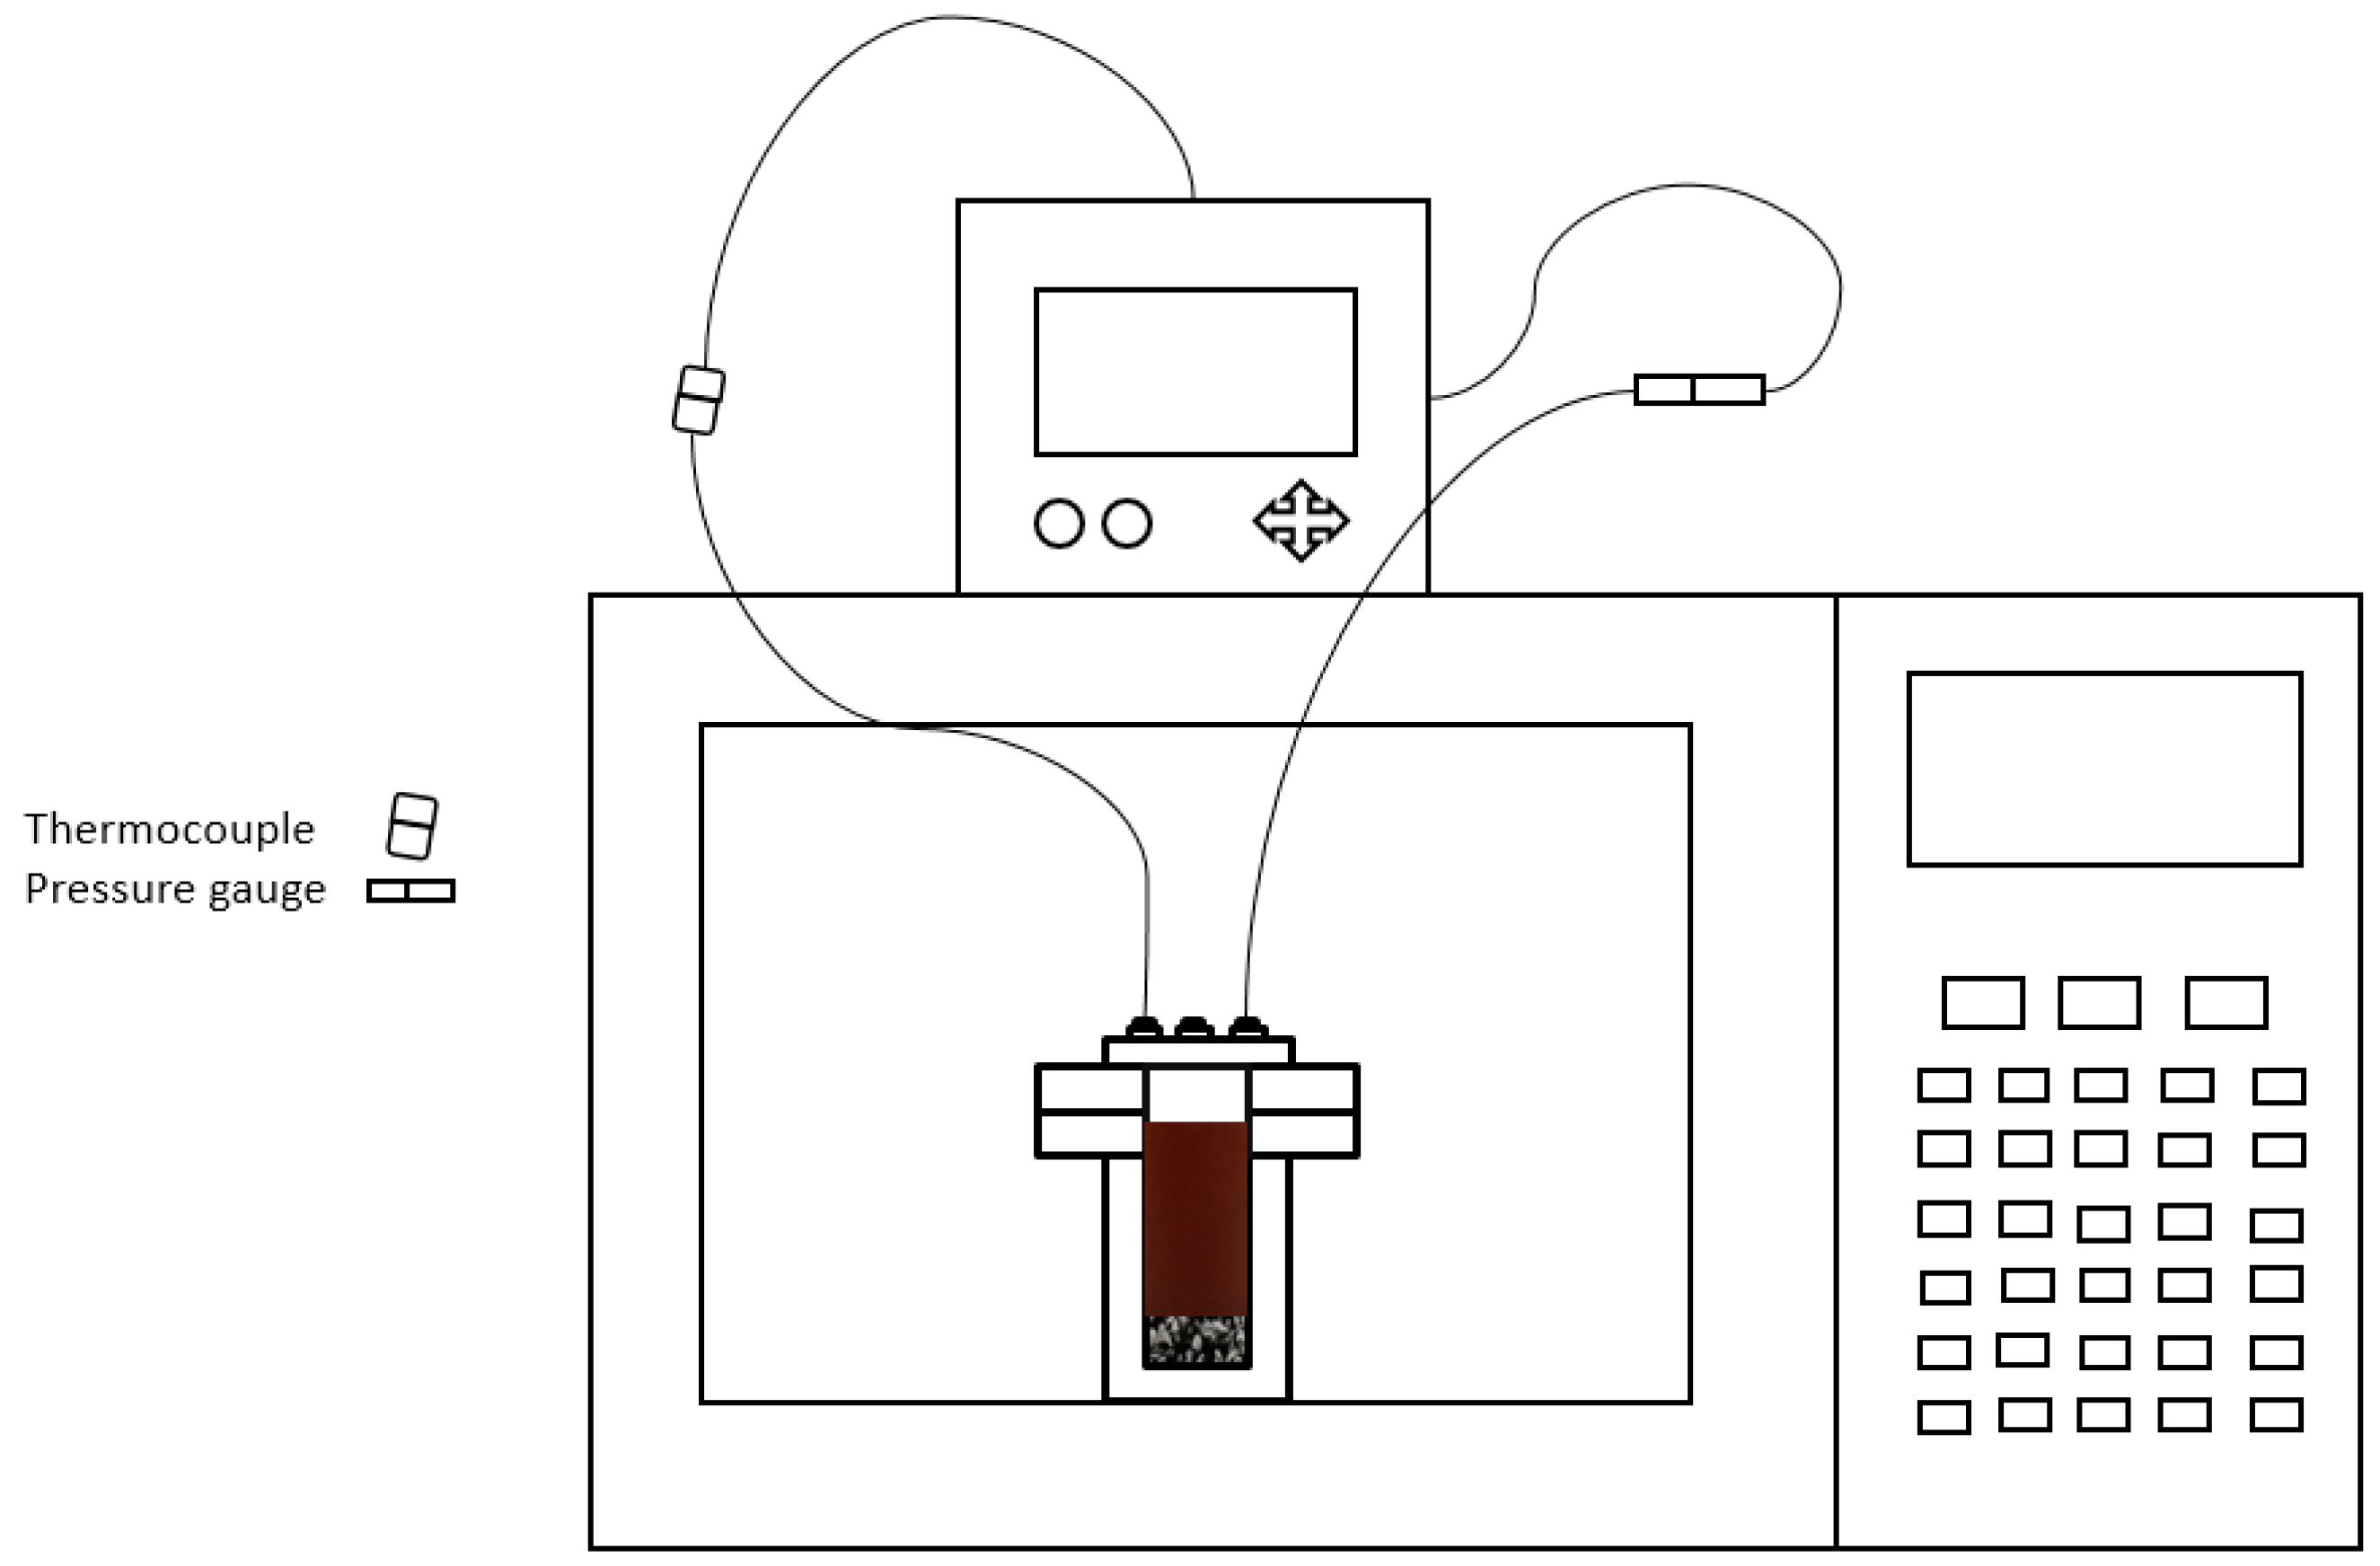
2.2. Experimental Procedure

HTC experiments were conducted in an autoclave reactor (VA2 stainless steel) with a volume of 250 mL. To check reproducibility, experiments were performed twice. The feedstock moisture content selected varied between 80 wt.% and 90 wt.% and the initial moisture was adjusted with deionized water. The blend of distilled water and feedstock was stirred manually in order to obtain a homogenous slurry. Then, the reactor was closed and heated inside a gas-chromatography (GC) oven (Hewlett Packard, GC 5890, Koblenz, Germany) (Figure A1). Three different temperatures (180, 200, and 220 °C) were selected and two reaction times (time applied after preheating time) were established: 2 and 4 h. It is necessary to point out that 1 h is required to reach the desired temperature inside the reactor. During the experiments, pressure was measured with a digital pressure gauge and the temperature with a thermocouple. Both were recorded during all processes with a portable data logger (Endress + Hauser, RSG 30, Nesselwang, Germany). Once the experiment had taken placed, the reactor was cooled down to room temperature in 30 min with a cold water bucket.
Afterwards, the total gas volume was determined with the water displacement by gas from a probe full of water. The slurry product from HTC was filtered with a quantitative filter grade 413 VWR® filter paper (VWR European Cat, Leuven, Germany) placed onto a Buchner settle in a flask bottle and connected to a vacuum pump. Liquid and solid phases were weighed to calculate yields of different phases. To remove moisture, the solid phase was dried inside an oven over 24 h at 105 °C up to stable weight. The liquid phase pH was measured by a HACH HQ40d multi equipment and kept in the fridge at 4 °C for further analysis. The solid samples (raw material or hydrochars) were ground into a range of sizes between 150 µm and 250 µm to facilitate its characterization.
In order to obtain hydrochars with the highest HHV (MJ/kg), which are related with low O/C and H/C ratios, a two-steps procedure was applied. Two-steps temperature selection was based on the fact that hydrolysis reactions in the HTC process occur below 180 °C and carbonization reactions are favored at 220 °C [7,12]. The first step is a reaction at 180 °C for 1 h. Secondly, a 3 h reaction time, including the time necessary to achieve 220 °C, was applied.
As acids catalyzed the hydrolysis reaction and remove the ash [11], the catalytic effect of acetic acid in the HTC process was also evaluated. For this objective, experiments with 5 wt.% of acetic acid were performed.

2.3. Characterization of Biomass and Products

2.3.1. Solid Fraction

• Proximate analysis
Moisture content, volatile matter (VM) and ash content were determined according to the standards analysis method ASTM D1762-84 [28].
• Elemental analysis
An automatic elemental analyzer EuroEA 3000 Serie (EuroVector S.P.A, Milano, Italy), CHNS-O equipped with a thermal conductivity detector (TCD) was used to determine the content of C, H, N and S of initial biomass and solid products (hydrochars). Samples had already been dried in an oven over 24 h at 105 °C to remove moisture content.
• Fiber analysis
Fiber analysis was performed by Fibretherm FT12 (Königswinter, Germany). Samples were dried at 105 °C for 24 h and cooled in a desiccator before analysis. The cellulose, hemicellulose, lignin and water extractives content of the solid sample was based on Van Soest’s method to calculate neutral detergent fiber (NDF), acid detergent fiber (ADF), and acid detergent lignin (ADL) [29].
• Thermogravimetric analysis (TGA)
Hydrochars were ground and sieved to have a particle size smaller than 150–200 µm. The thermal behavior of hydrochars was analyzed with a Netzsch STA Jupiter 449 F5 thermogravimetric balance (Ahlden, Germany). The sample size was approximately 20 mg, heated from room temperature to 105 °C with a heating rate of 10 K min−1 over 10 min to remove possible moisture from the sample. After this pretreatment step, the sample was heated to 800 °C with a constant heating rate of 10 K min−1 under a constant nitrogen flow of 70 mL min−1.

2.3.2. Liquid Fraction

In order to have a better understanding of changes which occur in the liquid phase after HTC, the total organic carbon (TOC) was measured along with the concentration of chemical compounds through high performance liquid chromatography (HPLC).
• TOC
The TOC of liquid samples was determined using a TOC Analyzer 5050A (Shimadzu Scientific Instruments, Columbia, MD, USA).
• HPLC
The liquid fraction of HTC includes high value molecules (lactic acid, formic acid, acetic acid, levulinic acid (LA), propionic acid, 5-hydroxymethylfurfural (HMF), and furfural), which were determined using HPLC (Shimadzu 20AD, Shimadzu, Canby, OR, USA). This is equipped with a column suitable for organic acids, called Aminex HPX-87H, UV-vis detector (SPD-20A, Shimadzu), and refractive index detector (RID-10A, Shimadzu). The mobile phase consists of a 4 mM solution of H2SO4 in water and a flow rate of 0.6 mL min−1. The column temperature was set at 35 °C. The time required for a complete analysis of each sample was 60 min. Filtration was required prior to HPLC analysis with a 0.2 µm PFTE (VWR International, Radnor, PA, USA). A 10 µL volume of each sample was injected to determine the concentration of chemical compounds.

2.3.3. Fuel Analysis

From Table 2 where 80 and 90 wt.% are the initial moisture contents; 180, 200, and 220 °C the temperatures; and 2 and 4 h the reaction times—the fuel analysis was done using the Equations (1)–(5). The parameters necessary to describe the energy content of hydrochars are higher heating value (HHV) [30], fuel ratio, hydrochar yield (Hy) and energy densification (Ed). Energy yield (Ey) was calculated using the following equations:
  H H V   ( MJ kg ) =   0.3491 × C   +   1.1783 × H   +   0.1005 × S   +   0.1034 × O   +   0.0151 × N   +   0.0211 × Ash  
  Fuel   ratio   =   FC VM  
  H y   ( % ) =   mass   of   dried   hydrochars mass   of   total   dried   feedstock   ×   100  
  E d   =   H H V   of   dried   hydrochars H H V   of   dried   feedstock  
  E y   ( % ) =   Hydrochar   yield × E d  

3. Results and Discussion

The results shown in Table 1, Table 2, Table 3 and Table 4 are expressed as the average of values obtained with a standard deviation below 5%. Due to the calibration of the HPLC the results obtained (Table 5) are the average of the values with a standard deviation below 7%.

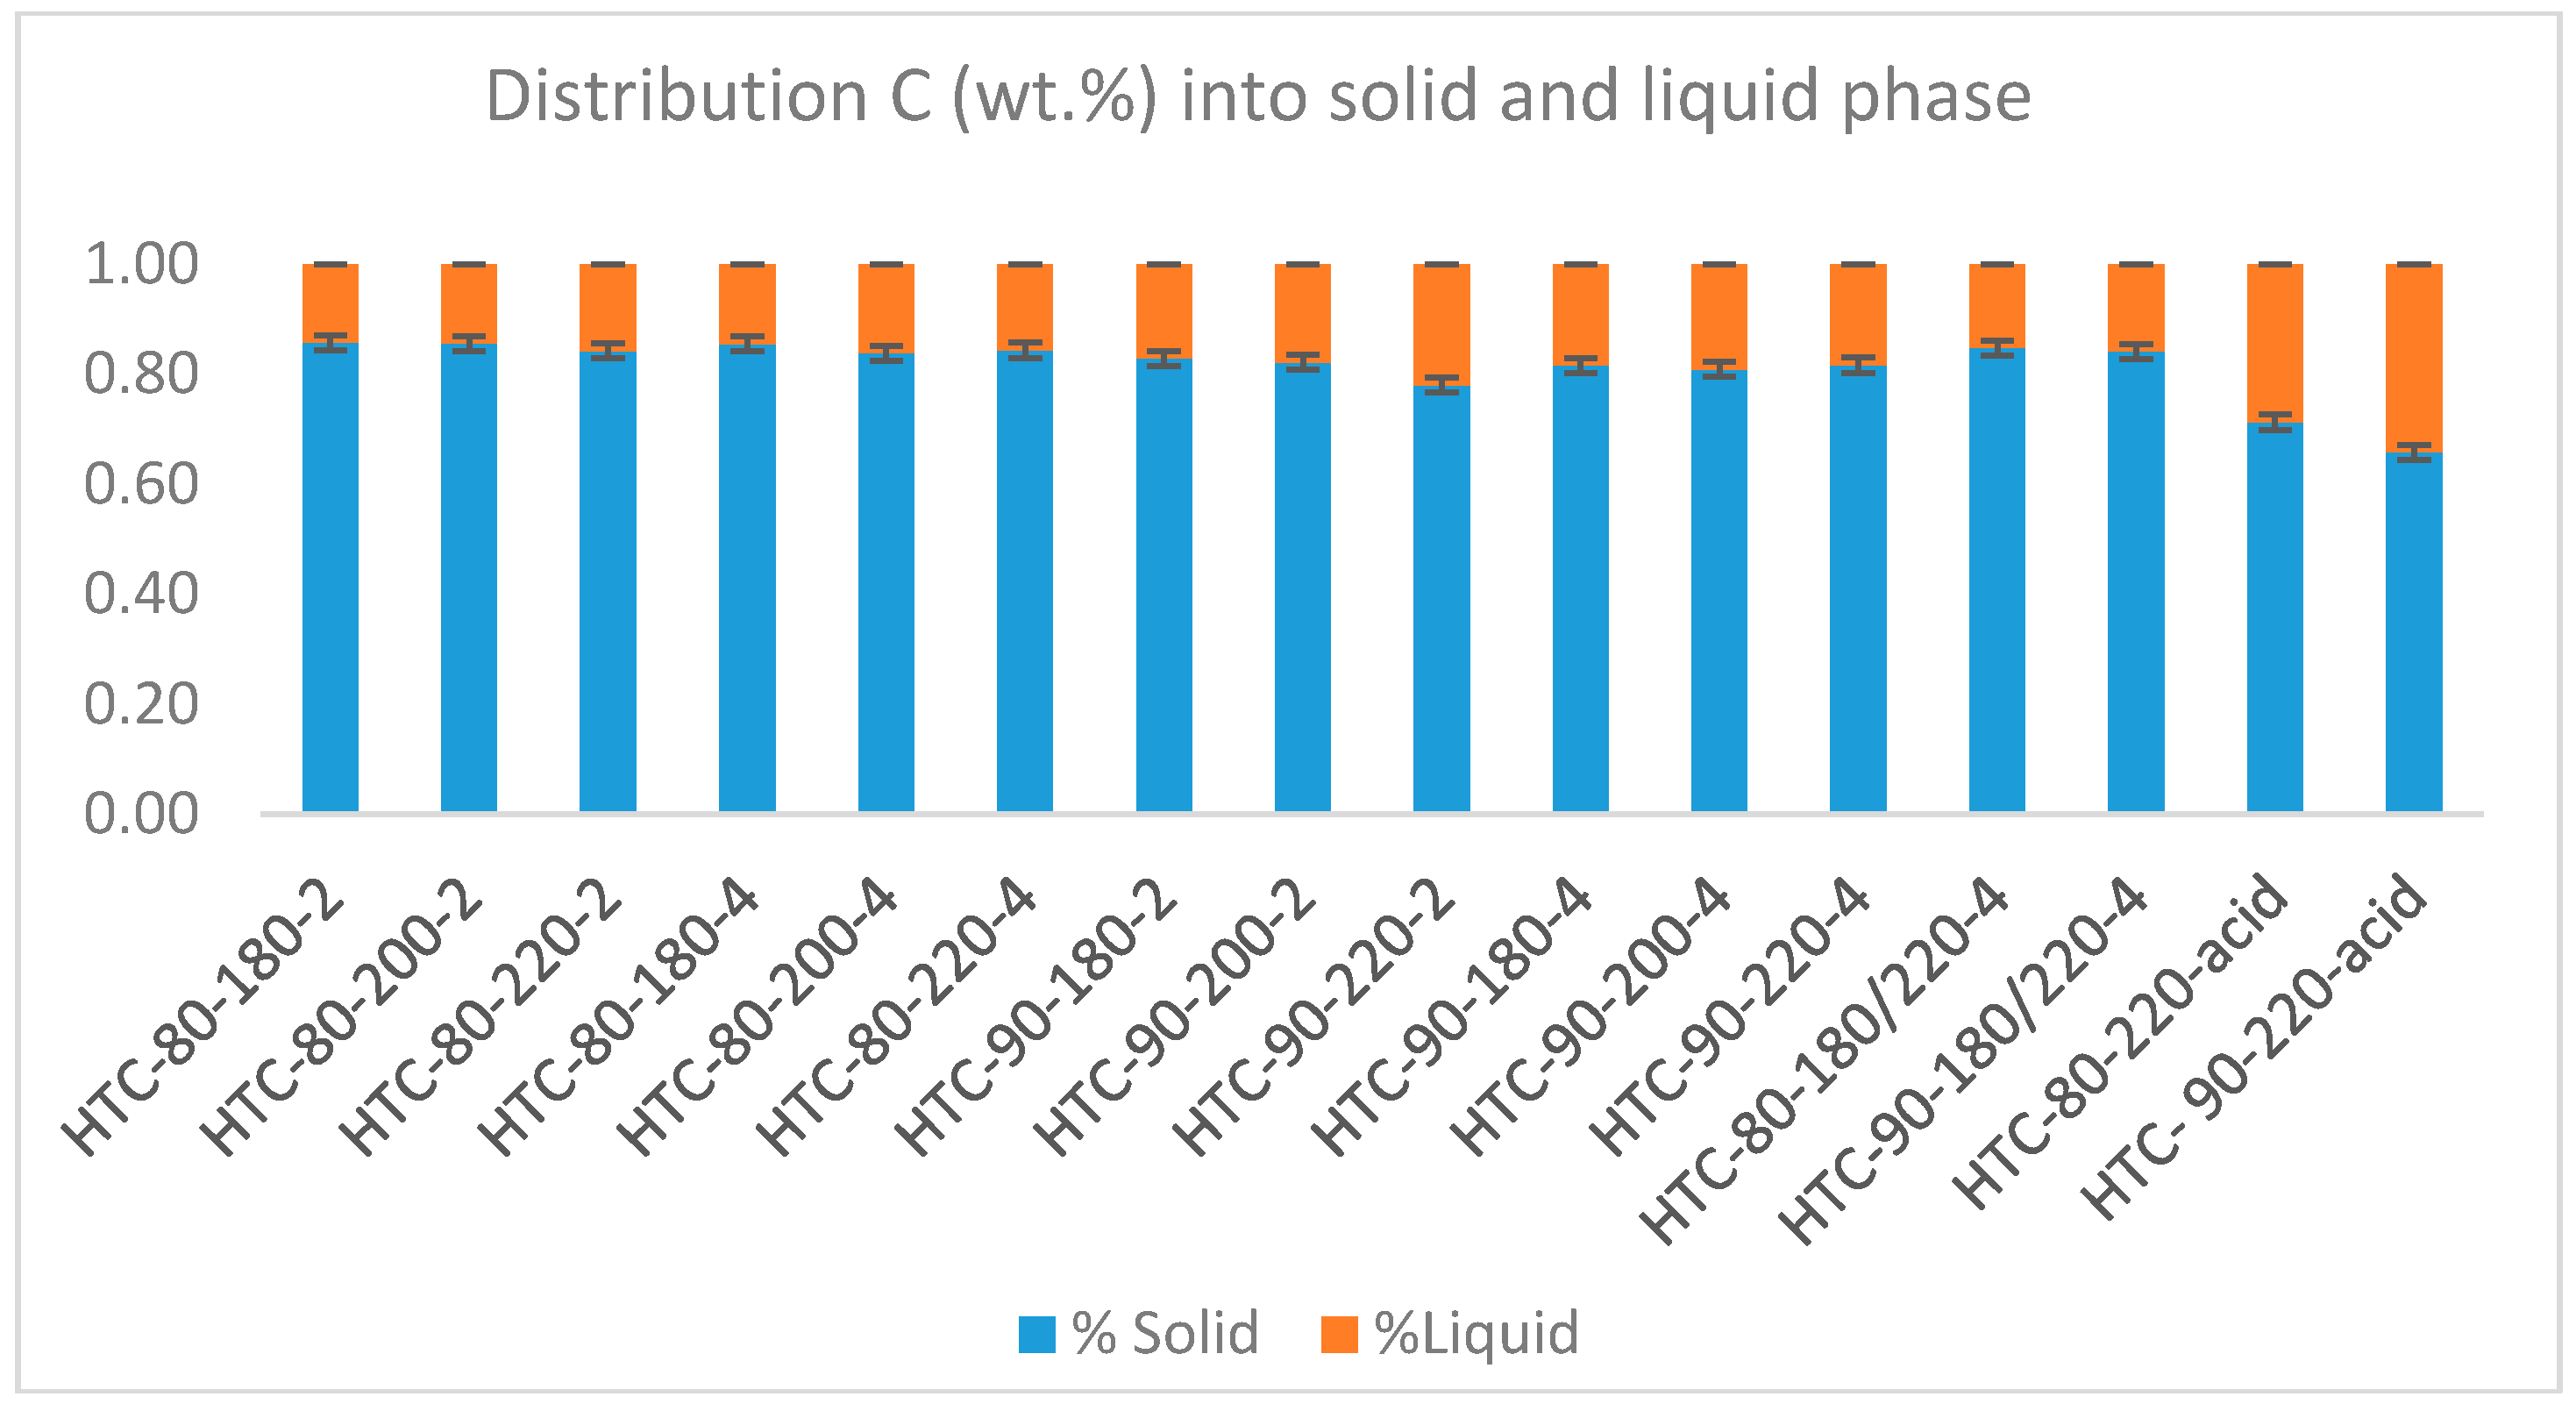
3.1. Carbon Balance of Brewer’s Spent Grains during Hydrothermal Carbonization

The characteristics of native BSG were calculated according to Section 2.3.1. The values obtained are comparable to data reported previously [31,32]. The C content was measured in both solid and liquid phase; it cannot be measured in gas phase, because the volume was too small.
Equations (6)–(11) were used to have a better overview of the carbon distribution in feedstock and products:
Mass of carbon in the feedstock solid phase:
  m ( carbon ) feedstock   solid   =   m feedstock   solid   ×   x ( carbon ) feedstock    
  m ( carbon ) feedstock   liquid   =   m feedstock   liquid   ×   TOC ρ  
Products equations for the mass of carbon in the solid and liquid phase, respectively:
  m ( carbon ) solid   =   m solid   ×   x ( carbon )   solid  
  m ( carbon ) liquid   =   m liquid   ×   TOC ρ  
Distribution of C into products:
  % C solid = m ( carbon ) solid ( m ( carbon ) solid   +   m ( carbon ) liquid )  
  % C liquid = m ( carbon ) liquid ( m ( carbon ) solid   +   m ( carbon ) liquid )  
The use of Equations (6)–(11) and experimental results obtained are showed in Table 3. It can be seen that at the same moisture content but higher temperature, % C content changes and less carbon is in the solid phase (Figure 1). However, with a 90% moisture content and 4 h reaction time, it is observed that % C content remains temperature independent in the solid phase (Figure 1). In general, the increase of the % C content (Figure 1) and the increase of carbon in solid phase is possible due to the polymerization reactions of the monomers solved of the liquid phase, which are formed during the hydrolysis [12]. This influence of the hydrolysis reaction was confirmed with a two-steps reaction, because of the increment of C on the solid phase (90%, 220 °C, 4 h). A first step, with 1 h at a low temperature (180 °C), enhances hydrolysis reactions and leads to the rupture of the initial poly-sugars into monomers, which remain in liquid phase [33]. During the second step, consisting of 3 h reaction time at 220 °C, water elimination to furfural-rings occurs. This loss of water is the “carbonization”, because the content of carbon increases accordingly. These intermediates polymerize and increase the content of C in the solid phase. However, a certain amount of C remains into liquid phase (Figure 1) [34].

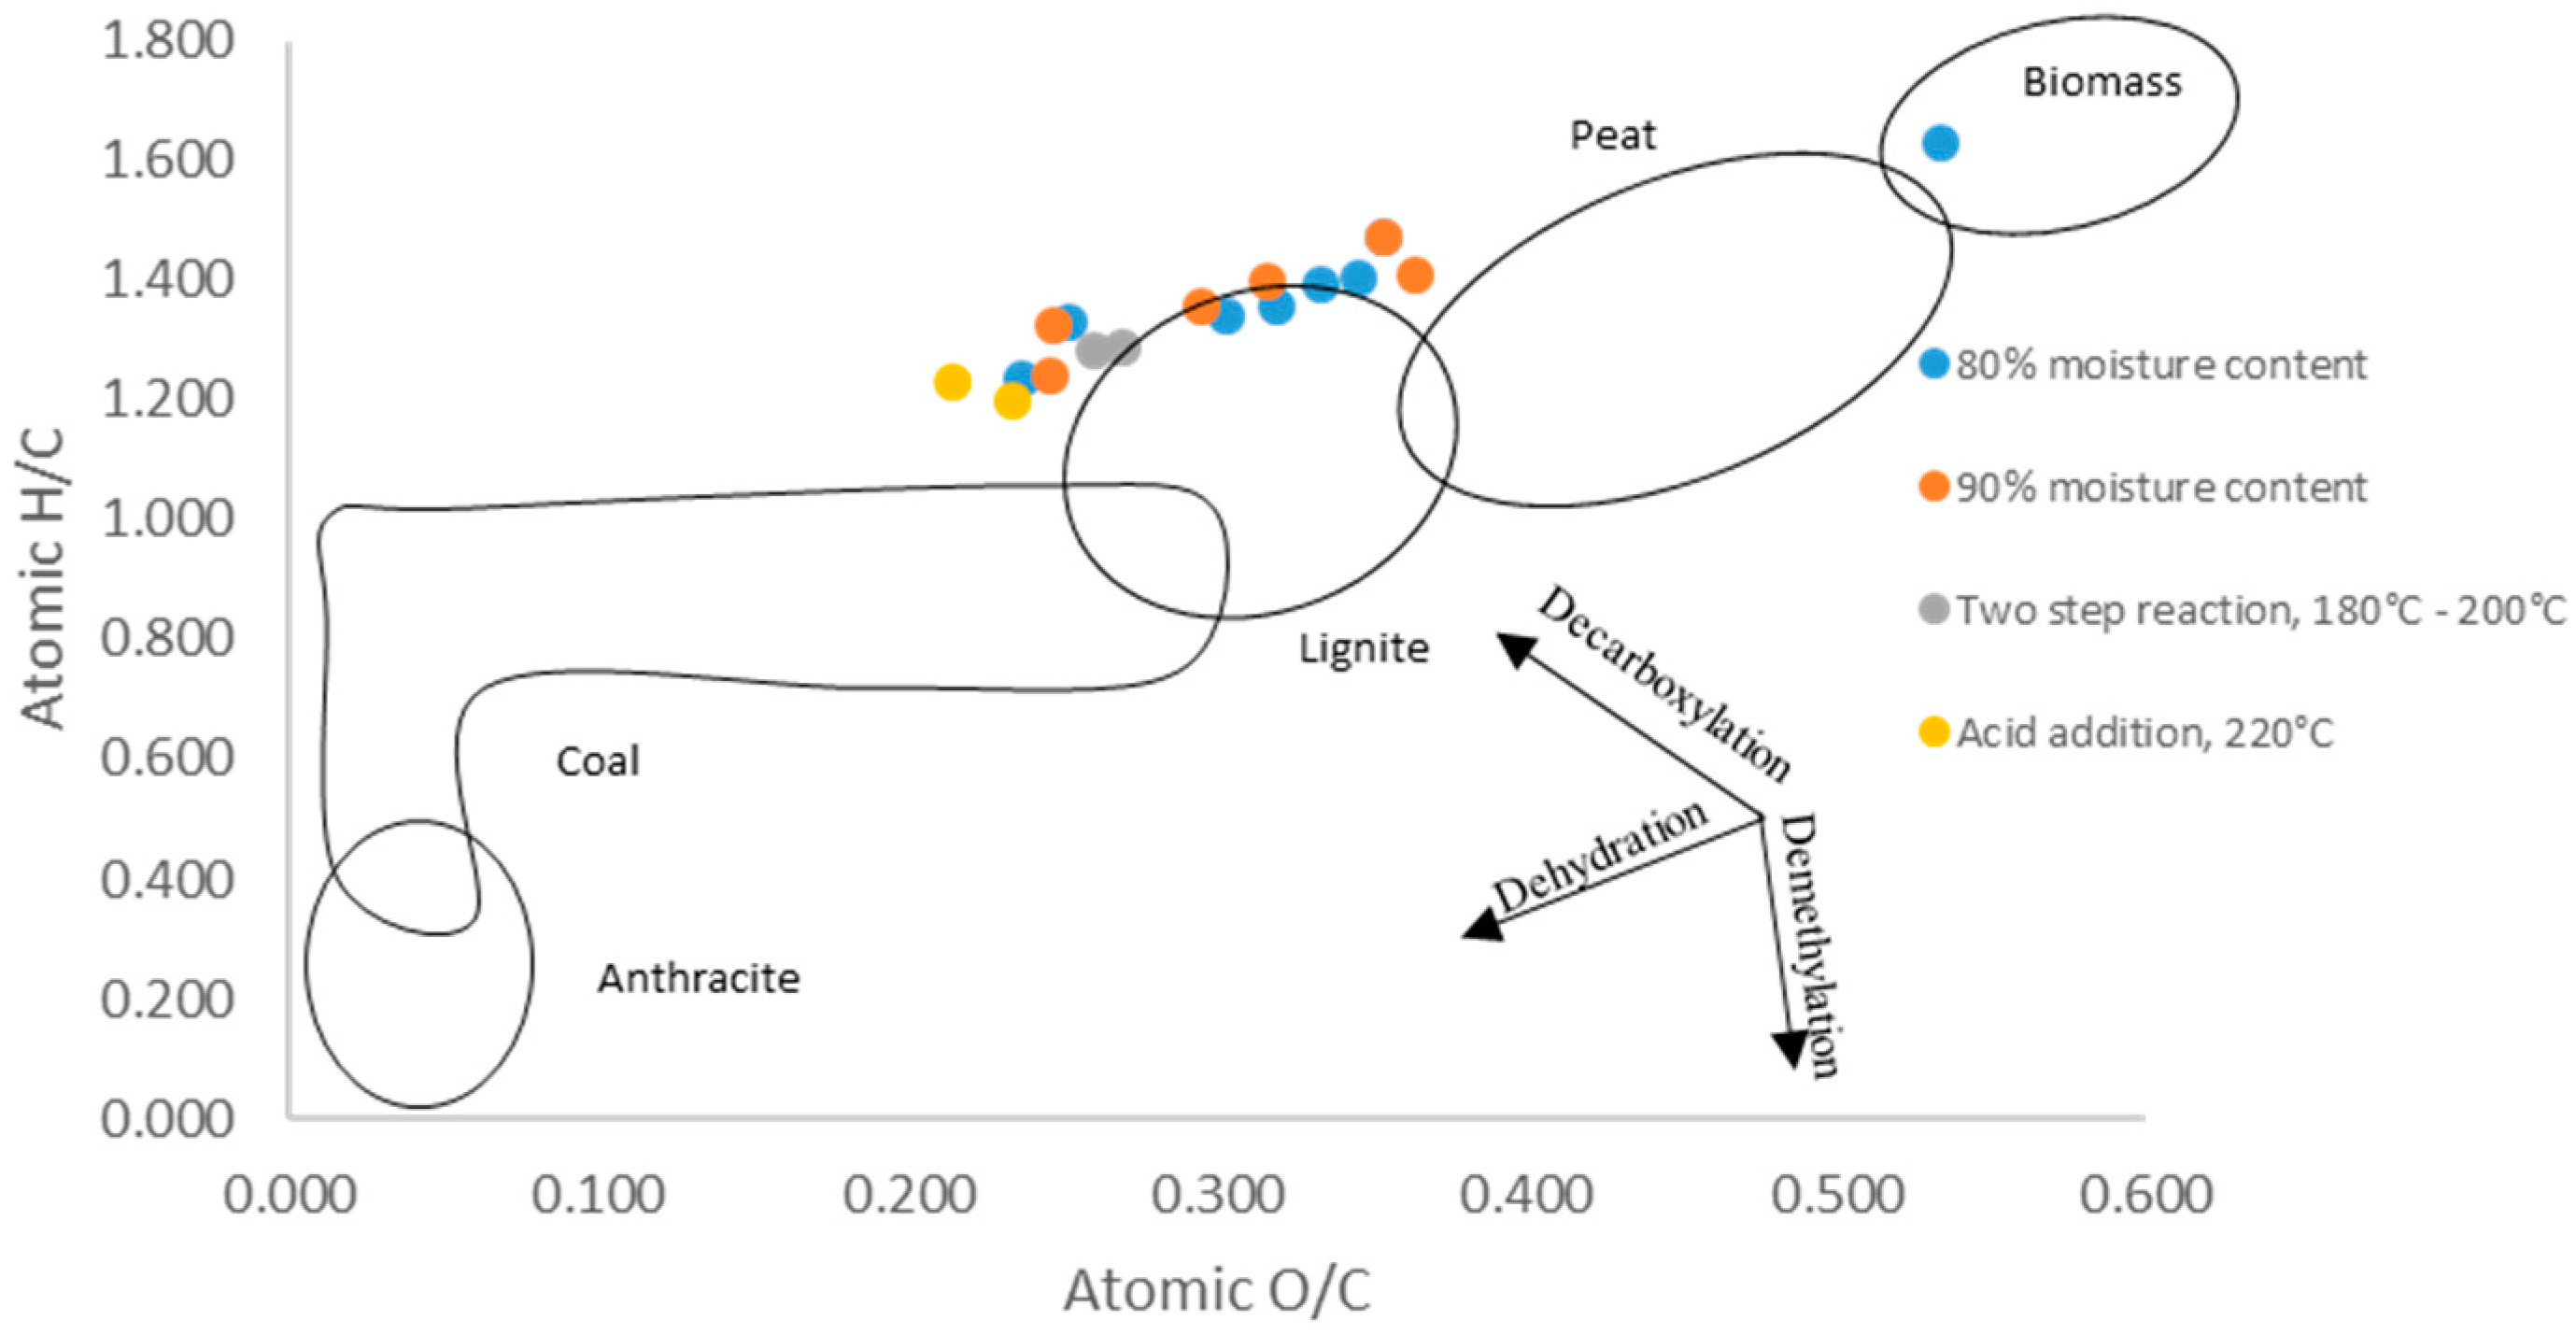
3.2. Characteristics of Hydrochars

Proximate analysis of hydrochars produced under different reaction conditions are showed in Table 2. The VM content decreases with an increase of temperature and reaction time, with different possible explanations. One is the enhancement of dehydration and decarboxylation reactions, increasing the carbon content in the solid from more coal-like material. With increasing severity, the number of crosslinking reactions increases, leading less low-molecular and therefore less volatile molecules. On the other hand, less carbon is found in solid phase (Table 2), which could imply the conversion of VM during HTC into solved compounds in the liquid phase. Both significantly influence the ignition behavior [35,36]. The comparison between VM content under the same conditions, but with different feedstock moisture content, showed no significantly higher value with 80% than with 90% moisture content. In contrast, the FC content of hydrochars increased with temperature and reaction time, in accord with findings of previous studies [37].
The hydrochar ash content was independent of temperature and reaction time. However, it decreased with higher moisture content because the same quantity of ash was in contact with a higher quantity of water. The increase of ash content at 220 °C and a 4 h reaction time with moisture content can be explained by the re-precipitation of some inorganic components [38].
To understand the characteristics of the hydrochars produced, it is necessary to understand the fuel ratio (Equation (2)). The hydrochars produced at 220 °C, with a 4 h reaction time and moisture content of 80% and 90% contains the highest FC, with 29.61% and 31.88%, respectively, and contains the lowest VM of 66.17% (at 80% moisture content) and 64.84% (at 90% moisture content). Consequently, the fuel ratios obtained under these conditions are twice as large as those of the initial feedstock (Table 2).
The yield to hydrochars (Hy %) at low reaction temperature has the highest values; the low HHV (MJ/kg) [39] of this hydrochar causes the Ey of all samples to have similar values (Table 2). This is reported in the literatures [40,41].
The values of Ed obtained were over 1, showing the improvement of energy densification by HTC [42]. As results using varied moisture contents were similar, a value of 90% moisture content was chosen to carry out experiments with the two-steps process and varied acid addition. In comparison with experiments at 180 °C, 4 h and 90% moisture content, performing the reaction in two-steps and incorporating 5% wt. of acid had the effect of reducing the VM content to similar values reached at 220 °C, 4 h and 90% moisture content (Table 3). The two-steps reaction process leads to energy saving, because it produced the same reduction of VM with less energy consumption to carry out the HTC process. Acid addition shows a significant importance, as shown by Ghanim et al. [25], wherein the addition of acetic acid not only reduced ash (%), it also produced an increment of FC (%), which implied an increment of fuel ratio and Ey (%). The reason for this is that polymerization, water elimination and decarboxylation (all reactions) increase the heating value [34,43].
Table 4 summarizes the elemental composition of hydrochars obtained under different operation conditions. According to Funke et al. [12], the atomic ratios of H/C and O/C decreased due to chemical defunctionalization (dehydration reaction and decarboxylation). This relationship between O/C and H/C was plotted as a Van Krevelen diagram (Figure 2). The higher ratios of O/C and H/C, which belong to the original biomass, are plotted in the upper right corner of the diagram. The increment of the temperature and reaction time in HTC reduces the ratios until the typical area of lignite is reached, which is similar to results of others authors [2,18]. The acidification of initial feedstock produced the lowest ratio of O/C and H/C, which can be explained by the reduction of hydroxyl groups by water elimination, which also increased the hydrophobicity of the hydrochar [29]. The reduction of the O/C ratio to half that of the initial biomass is due to the high content of hemicellulose; hemicellulose is the most reactive part of the feedstock biomass. A study carried out by Wikberg et al. [44] showed that a decrement of O/C ratio in coffee cake was due to removal of carboxyl groups from biomass extractives, hemicellulose, and cellulose. Therefore, it can be assumed that oxygen and hydrogen of the initial biomass migrates as water, mainly to the liquid phase [45].
On the other hand, S (%) was constant across the HTC condition range and N (%) decreased with higher moisture content of feedstock and higher temperatures. The high protein and hemicellulose content of BSG (Table 1) has an effect during hydrolysis. Amino acids and amines, as consecutive products of the hydrolysis of proteins, can react with carbonyl groups. This Maillard reaction starts at 180 °C and leads, for example, to N-heterocycles [46,47,48]. These heterocycles become part of the hydrochar. With a higher water content, more N-compounds are solved and not incorporated in the hydrochar. In addition, at higher temperatures, N-containing functional groups are hydrolyzed [16].

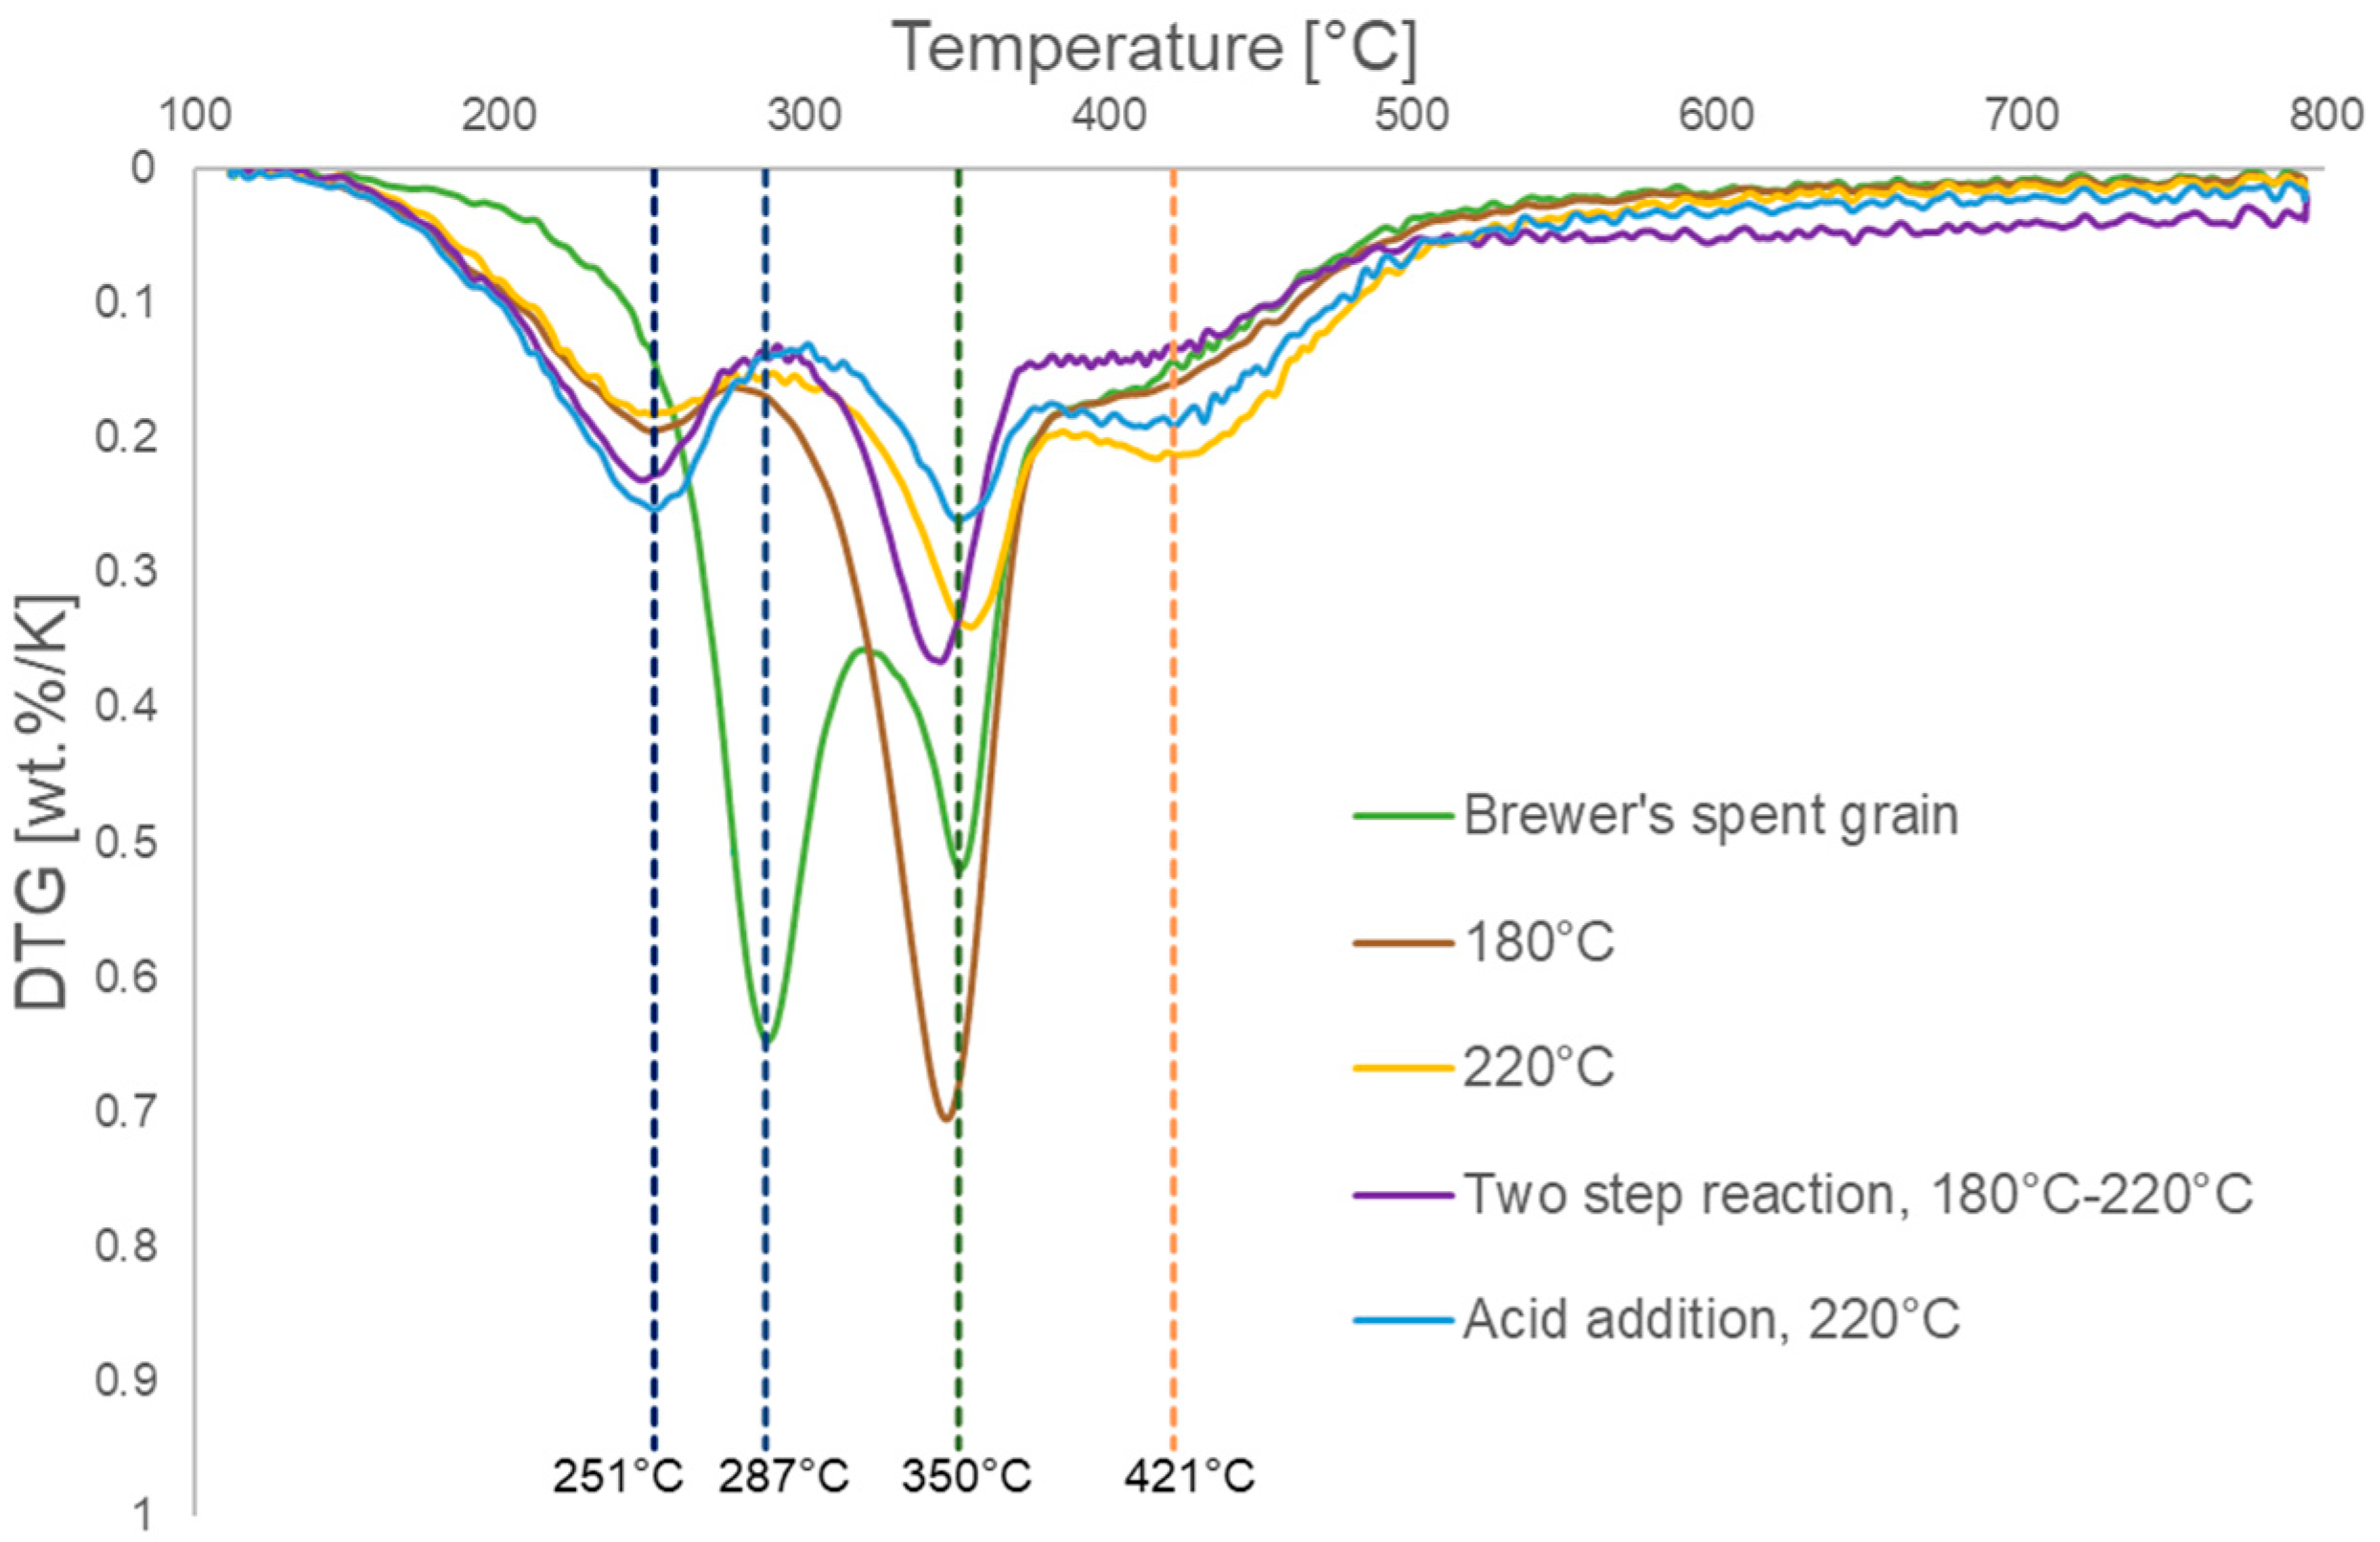
3.3. Thermogravimetric Analysis

The TGA of hydrochars was done for 90% moisture content (regarding feedstock) samples and 4 h of reaction time. The TGA (Figure 3) of hydrochars at 180 °C and 220 °C are used to compare hydrochars produced by the one-step procedure with the hydrochars obtained with two-steps reaction and acid addition. Figure 3 shows the derivative mass loss (DTG) for BSG and hydrochars produced at 180 °C, 220 °C, and in the two-steps reaction between 180 °C and 220 °C and with acid addition at 220 °C. The DTG curves show four characteristic peaks at 251, 287, 350, and 421 °C. The peaks correspond to the three biopolymers of hemicellulose, cellulose and lignin, which built the biomass structure. The composition of the origin biomass is shown in Table 1 and consists of hemicellulose (43.03%), cellulose (23.69%), and lignin (5.78%). However, it was mentioned in Section 2.3.1 that samples were kept at 105 °C for 10 min, so moisture peaks and volatile peaks shown in the reviewed literatures [31,37] at a range of 80 °C to 105 °C, did not appear.
Raw feedstock has a largest peak at 287 °C, which corresponds to hemicellulose decomposition, because hemicellulose is an amorphous polymer and therefore less thermally stable [49]. In addition, it makes it more feasible for hydrolysis reactions than the more crystalline cellulose (see below). Cellulose decomposition has a peak similar to hemicellulose but at a higher temperature [50].
DTG curves of the different hydrochars with the same reaction time but different temperatures (Figure 3) are similar to those of previous studies [14,51]. The peak of hemicellulose disappearing agrees with research published by Kruse et al. [51], which explains that the HTC process leads to degradation of hemicellulose at 180 °C. However, there is a shoulder at 251 °C as a result of the decomposition of feedstock during HTC into more reactive compounds than hemicellulose.
In comparison to the DTG of BSG, hydrochars have a small peak at temperatures around 420 °C. This peak is larger at a higher hydrochar formation temperature. Therefore, it can be attributed to carbonization during HTC leading to short-chained polymers, which are less stable in TGA than the original biomass [51]. It has to be stated here that polycarbohydrates like hemicellulose, and especially cellulose, are stabilized by intermolecular H-bonds, which is not possible in hydrochars. In hydrochars the necessary OH-groups are missing because of water elimination during HTC. Consequently, smaller molecules of hydrochar are evaporated at lower temperatures than carbohydrates fixed in a structure by H-bonds.
The effect of a two-steps reaction and acid addition during HTC on TGA analysis (Figure 3) shows that both improve the hydrolysis of the initial feedstock. This means that fewer residual polycarbohydrates and more carbonization products are found. Both treatments produce more thermal volatile compounds because their peak at a temperature of 251 °C is more than the peak for hydrochars without acid addition or application of the two-steps reaction. Acid addition decreases the peak of cellulose due to catalytic effect of acids on the hydrolysis of cellulose during the HTC process.
In summary, two effects influence the thermal properties of hydrochar. On one hand, the temperature increase results in a decrease of the VM content in the hydrochars (Table 2), producing a thermally stable material with higher HHV (MJ/kg). This is a consequence of stronger crosslinking and the formation of bonds. On the other hand, less thermal stable compounds are formed. For hydrochars there occurs a DTG peak at 251 °C, which may be related with degradation of parts of hydrochars with less stable structures, as well as evaporation of organic substances (HMF), created during HTC. The last DTG peak at 421 °C is related with lignin decomposition [52]. In addition, this peak might be also caused by hydrochar degradation. For hydrochars produced at 180 °C and 220 °C, the peak is increased. This may be due to the decomposition of less stable intermediate carbonization products.

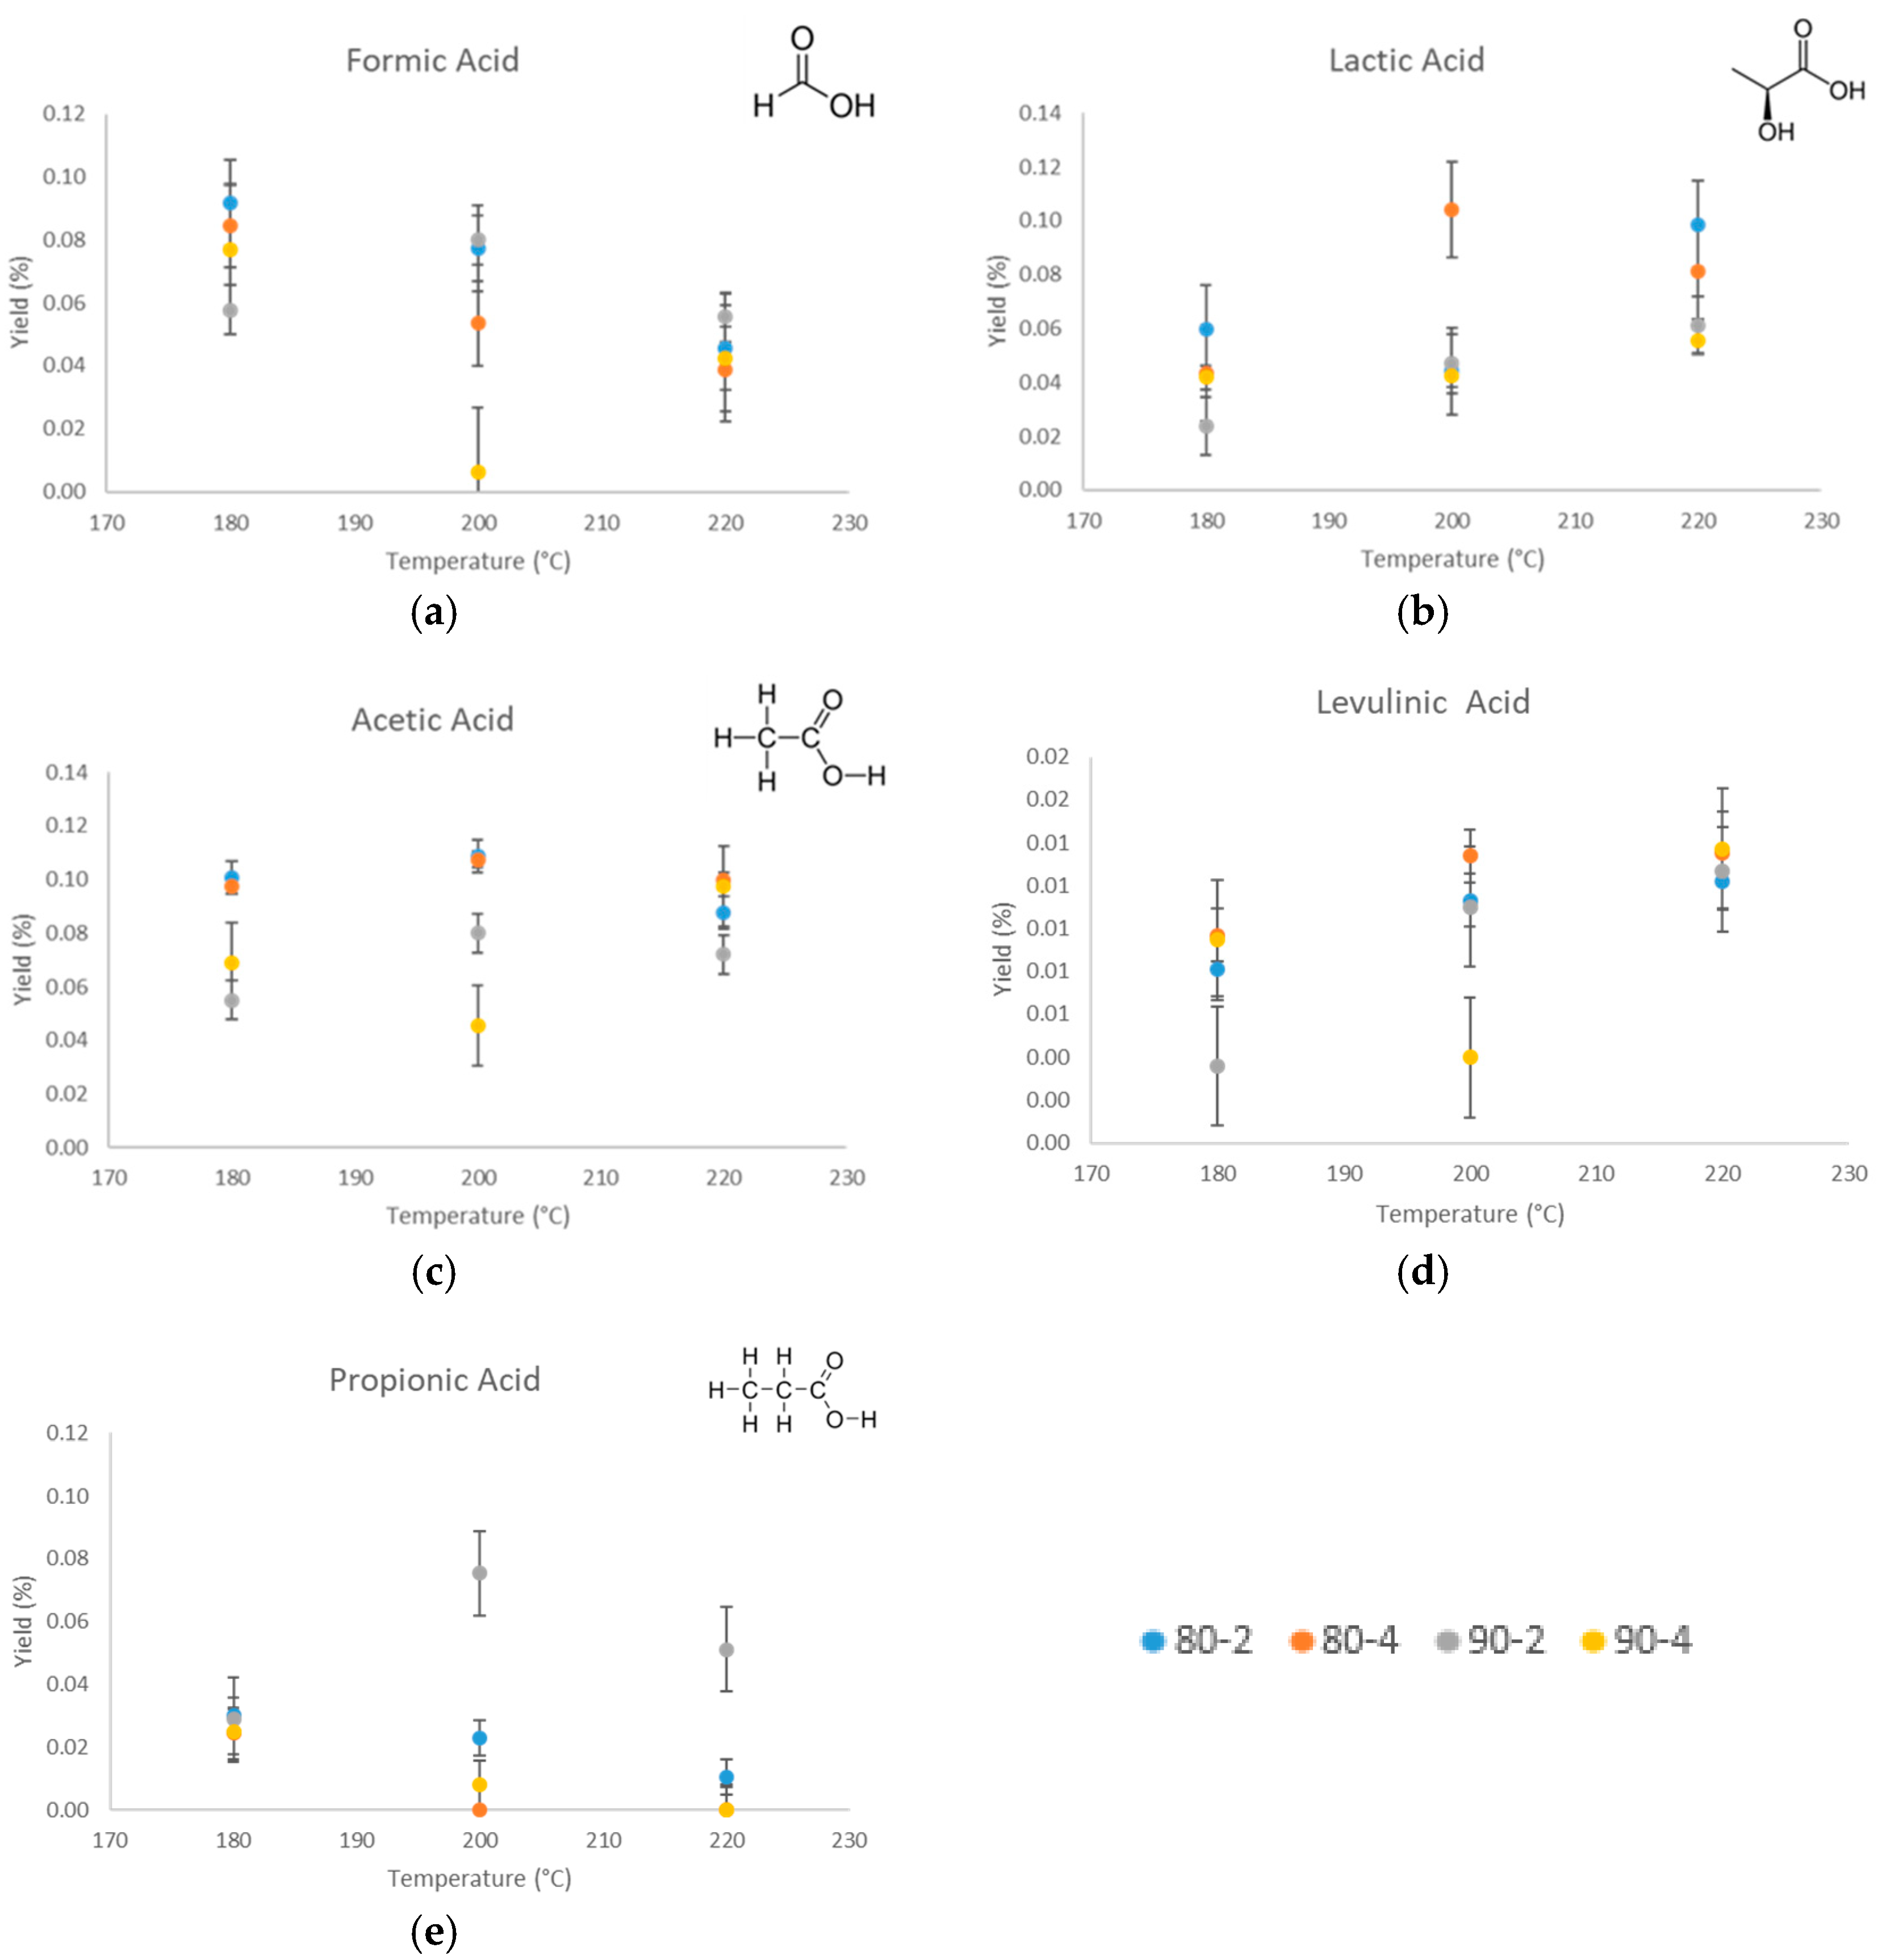
3.4. Characteristics of Liquid Phase

The pH values of different HTC liquid phases are shown in Table 5. The liquid phase after HTC at a temperature of 180 °C has a pH of around 4 and increases to pH 4.6 with increasing reaction temperature and reaction time. It supports the idea that lower temperatures promote hydrolysis reactions, eliciting the release of organic acids, such as acetic acid. Afterwards, these organic acids show further reactions at higher temperatures [53,54]. This supports the formation of other compounds, because hydrolysis is catalyzed by acids. Therefore, the two-steps experiments and acid addition were performed to support the idea of hydrolysis and consecutive re-polymerization mechanisms. Two-steps experiments accomplished during this work showed that 1 h at a temperature of 180 °C is not enough to enhance the promotion of organic acids, because the pH of the liquid phase is slightly lower than for the experiments accomplished at 220 °C, during 4 h of reaction time. At a moisture content of 80% the pH value is 4.53, slightly higher than without acid addition (pH 3.57). The influence of pH level is shown by the yield to organic chemical molecules in the liquid fraction, mainly lactic acid, formic acid, acetic acid, levulinic acid (LA), and propionic acid (Table 5) [55]. These acids are usually found in hydrothermal conversions. Here they are relatively inert molecules, because they have no, or a low, tendency to polymerize. In addition, the yield of the organic chemical compounds in the liquid phase is related with the TOC. The highest values of TOC were obtained at low temperatures, where hydrolysis reactions were promoted but the formation of a solid product by polymerization is too slow.
Figure 4 shows the yields of the main low molecular weight acids (lactic, formic, acetic, levulinic, and propionic acid) produced during HTC. Lactic acid can be obtained through conversion of carbohydrates [56,57] under HTC conditions [57]. The yield trends to increase with the temperature from 180 °C to 220 °C. This fact could be to the production of trioses (glycolaldehyde, diehydroxyacetone and other tautomers) from biomass, which are intermediates produced during retro-aldol condensation of sugars [58]. The trioses further react to lactic acids. According to Zan et al. [59], the formation of lactic acid is not affected by the presence of formic acids; however, in this study (Figure 4a) reflect that higher presence of formic acid is correlated with a lower yields of lactic acid. At low moisture content and 200 °C the highest yield to acetic and propionic acids were found (Figure 4c,e). It is supposed that acetic acid was produced due to oxidation reaction of acetaldehyde. Acetaldehyde was produced via decarbonylation reactions of lactic acid [60]. Lactic acid is also supposed to be converted by dehydration reaction to acrylic acid. Afterwards, hydrogenation of acrylic acid produce propionic acid [60]. In sum, these sequences of reactions are very speculative. Only the primary products can be easily identified.
In addition, the production of levulinic acid (LA) (Figure 4d), which is one of the products of the rehydration of HMF in aqueous media, is observed [61]. Table 5 shows that the addition of acid into the initial slurry produces higher amounts of levulinic acid. According to Licursi et al. [62], it can be due to the catalytic effect of acetic acid on the pH-dependent hydrolysis reaction of cellulose in the initial biomass, which started at temperatures over 200 °C. However, it is more likely that it is because HMF and levulinic acid formation is slightly different. Therefore, the addition of an acid changes the selectivity to LA. LA is preferred at higher acid concentrations due to the selection of LA increasing during the HMF decomposition into LA and humins [43].

4. Conclusions

In this study, we examined the behavior of BSG during HTC and the partition of C into solid and liquid phase under different reaction conditions. These parameters are temperature and reaction time, as well as moisture content. In the experimental range investigated here, the HTC process itself is independent of moisture content, that is a new feedstock variable. The ash content decreases in the case with higher water content. Acid addition produced an increase of carbon distribution to the liquid. The highest fuel ratio of hydrochars was produced at 220 °C, with a 4 h reaction time and acid addition, and TGA curves showed the complete hydrolysis of the hemicellulose and cellulose. Thus, this hydrochar can be used as an ecofriendly solid fuel.
Hydrochar products of a two-steps reaction have higher values to Hy (%) than those produced in a single-step process. The fuel properties of solids are also better than with a single-step reaction. Therefore, two-steps reactions have an economic benefit and lead to an improvement of solid product characteristics.
The HPLC analysis of the different HTC conditions shows different small acids. These are consecutive products of the carbohydrate splitting reactions. They are found because they do not polymerize to hydrochar, or react only with a very low reaction rate.

Author Contributions

P.J.A. performed the investigation and wrote the article draft, M.P.O. performed and discussed the TGA results, and A.K. reviewed the article.

Funding

This research was funded by the European Union’s Horizon 2020 research and innovation program under the Marie Skłodowska-Curie Grant Agreement No. 721991.

Acknowledgments

We gratefully acknowledge the work of doctoral candidate Paul Körner (HPLC).

Conflicts of Interest

The authors declare no conflict of interest.

Appendix A

Figure A1. Experimental set up of HTC into gas-chromatography (GC) oven.
Energies 11 03226 g0a1

References

  1. Liu, Z.; Quek, A.; Kent Hoekman, S.; Balasubramanian, R. Production of solid biochar fuel from waste biomass by hydrothermal carbonization. Fuel 2013, 103, 943–949. [Google Scholar] [CrossRef]
  2. Basso, D.; Patuzzi, F.; Castello, D.; Baratieri, M.; Rada, E.C.; Weiss-Hortala, E.; Fiori, L. Agro-industrial waste to solid biofuel through hydrothermal carbonization. Waste Manag. 2016, 47, 114–121. [Google Scholar] [CrossRef] [PubMed] [Green Version]
  3. Peterson, A.A.; Vogel, F.; Lachance, R.P.; Fröling, M.; Antal, M.J., Jr.; Tester, J.W. Thermochemical biofuel production in hydrothermal media: A review of sub- and supercritical water technologies. Energy Environ. Sci. 2008, 1, 32–65. [Google Scholar] [CrossRef]
  4. Libra, J.A.; Ro, K.S.; Kammann, C.; Funke, A.; Berge, N.D.; Neubauer, Y.; Titirici, M.-M.; Fühner, C.; Bens, O.; Kern, J.; et al. Hydrothermal carbonization of biomass residuals: A comparative review of the chemistry, processes and applications of wet and dry pyrolysis. Biofuels 2014, 2, 71–106. [Google Scholar] [CrossRef]
  5. Gao, P.; Zhou, Y.; Meng, F.; Zhang, Y.; Liu, Z.; Zhang, W.; Xue, G. Preparation and characterization of hydrochar from waste eucalyptus bark by hydrothermal carbonization. Energy 2016, 97, 238–245. [Google Scholar] [CrossRef]
  6. Guizani, C.; Jeguirim, M.; Valin, S.; Limousy, L.; Salvador, S. Biomass Chars: The Effects of Pyrolysis Conditions on Their Morphology, Structure, Chemical Properties and Reactivity. Energies 2017, 10, 796. [Google Scholar] [CrossRef]
  7. Fakkaew, K.; Koottatep, T.; Polprasert, C. Effects of hydrolysis and carbonization reactions on hydrochar production. Bioresour. Technol. 2015, 192, 328–334. [Google Scholar] [CrossRef] [PubMed] [Green Version]
  8. Tsukashima, H. The Infrared Spectra of Artificial Coal made from Submerged Wood at Uozu, Toyama Prefecture, Japan. Bull. Chem. Soc. Jpn. 1966, 39, 460–465. [Google Scholar] [CrossRef] [Green Version]
  9. Mäkelä, M.; Benavente, V.; Fullana, A. Hydrothermal carbonization of lignocellulosic biomass: Effect of process conditions on hydrochar properties. Appl. Energy 2015, 155, 576–584. [Google Scholar] [CrossRef]
  10. Gollakota, A.R.K.; Kishore, N.; Gu, S. A review on hydrothermal liquefaction of biomass. Renew. Sustain. Energy Rev. 2018, 81, 1378–1392. [Google Scholar] [CrossRef]
  11. Yanik, J.; Ebale, S.; Kruse, A.; Saglam, M.; Yuskel, M. Biomass gasification in supercritical water: Part 1. Effect of the nature of biomass. Fuel 2007, 86, 2410–2415. [Google Scholar] [CrossRef]
  12. Funke, A.; Ziegler, F. Hydrothermal carbonization of biomass: A summary and discussion of chemical mechanisms for process engineering. Biofuels Bioprod. Bioref. 2010, 4, 160–177. [Google Scholar] [CrossRef]
  13. Yoshikawa, K.; Prawisudha, P. Hydrothermal Treatment of Municipal Solid Waste for Producing Solid Fuel. In Application of Hydrothermal Reactions to Biomass Conversion; Jin, F., Ed.; Springer: Heidelberg, Germany; New York, NY, USA, 2014; pp. 355–383. [Google Scholar]
  14. Kang, S.; Li, X.; Fan, J.; Chang, J. Characterization of Hydrochars Produced by Hydrothermal Carbonization of Lignin, Cellulose, d-Xylose, and Wood Meal. Ind. Eng. Chem. Res. 2011, 51, 9023–9031. [Google Scholar] [CrossRef]
  15. Sevilla, M.; Fuertes, A.B. The production of carbon materials by hydrothermal carbonization of cellulose. Carbon 2009, 47, 2281–2289. [Google Scholar] [CrossRef] [Green Version]
  16. Kruse, A.; Koch, F.; Stelzl, K.; Wüst, D.; Zeller, M. Fate of Nitrogen during Hydrothermal Carbonization. Energy Fuels 2016, 30, 8037–8042. [Google Scholar] [CrossRef]
  17. Karayıldırım, T.; Sınağ, A.; Kruse, A. Char and Coke Formation as Unwanted Side Reaction of the Hydrothermal Biomass Gasification. Chem. Eng. Technol. 2008, 31, 1561–1568. [Google Scholar] [CrossRef]
  18. Kambo, H.S.; Dutta, A. A comparative review of biochar and hydrochar in terms of production, physico-chemical properties and applications. Renew. Sustain. Energy Rev. 2015, 45, 359–378. [Google Scholar] [CrossRef]
  19. Celus, I.; Brijs, K.; Delcour, J.A. Fractionation and characterization of brewers’ spent grain protein hydrolysates. J. Agric. Food Chem. 2009, 57, 5563–5570. [Google Scholar] [CrossRef] [PubMed]
  20. Santos, M.; Jiménez, J.J.; Bartolomé, B.; Gómez-Cordovés, C.; del Nozal, M.J. Variability of brewer’s spent grain within a brewery. Food Chem. 2003, 80, 17–21. [Google Scholar] [CrossRef]
  21. Celus, I.; Brijs, K.; Delcour, J.A. Enzymatic hydrolysis of brewers’ spent grain proteins and technofunctional properties of the resulting hydrolysates. J. Agric. Food Chem. 2007, 55, 8703–8710. [Google Scholar] [CrossRef] [PubMed]
  22. Pruksakit, W.; Patumsawad, S. Hydrothermal Carbonization (HTC) of Sugarcane Stranded: Effect of Operation Condition to Hydrochar Production. Energy Procedia 2016, 100, 223–226. [Google Scholar] [CrossRef]
  23. Ulbrich, M.; Preßl, D.; Fendt, S.; Gaderer, M.; Spliethoff, H. Impact of HTC reaction conditions on the hydrochar properties and CO2 gasification properties of spent grains. Fuel Process. Technol. 2017, 167, 663–669. [Google Scholar] [CrossRef]
  24. Saba, A.; Saha, P.; Reza, M.T. Co-Hydrothermal Carbonization of coal-biomass blend: Influence of temperature on solid fuel properties. Fuel Process. Technol. 2017, 167, 711–720. [Google Scholar] [CrossRef]
  25. Ghanim, B.M.; Kwapinski, W.; Leahy, J.J. Hydrothermal carbonisation of poultry litter: Effects of initial pH on yields and chemical properties of hydrochars. Bioresour. Technol. 2017, 238, 78–85. [Google Scholar] [CrossRef] [PubMed]
  26. Pecha, B.; Arauzo, P.; Garcia-Perez, M. Impact of combined acid washing and acid impregnation on the pyrolysis of Douglas fir wood. J. Anal. Appl. Pyrolysis 2015, 114, 127–137. [Google Scholar] [CrossRef]
  27. D02 Committee. Test Methods for Instrumental Determination of Carbon, Hydrogen, and Nitrogen in Petroleum Products and Lubricants; ASTM D-5291; American Society for Testing and Materials (ASTM) International: West Conshohocken, PA, USA, 1996. [Google Scholar]
  28. D07 Committee. Test Method for Chemical Analysis of Wood Charcoal; ASTM D1762-84; ASTM International: West Conshohocken, PA, USA, 2013. [Google Scholar]
  29. Reza, M.T.; Uddin, M.H.; Lynam, J.G.; Hoekman, S.K.; Coronella, C.J. Hydrothermal carbonization of loblolly pine: Reaction chemistry and water balance. Biomass Conv. Bioref. 2014, 4, 311–321. [Google Scholar] [CrossRef]
  30. Channiwala, S.A.; Parikh, P.P. A unified correlation for estimating HHV of solid, liquid and gaseous fuels. Fuel 2002, 81, 1051–1063. [Google Scholar] [CrossRef]
  31. Poerschmann, J.; Weiner, B.; Wedwitschka, H.; Baskyr, I.; Koehler, R.; Kopinke, F.-D. Characterization of biocoals and dissolved organic matter phases obtained upon hydrothermal carbonization of brewer’s spent grain. Bioresour. Technol. 2014, 164, 162–169. [Google Scholar] [CrossRef] [PubMed]
  32. Vieira, E.F.; da Silva, D.D.; Carmo, H.; Ferreira, I.M. Protective ability against oxidative stress of brewers’ spent grain protein hydrolysates. Food Chem. 2017, 228, 602–609. [Google Scholar] [CrossRef] [PubMed]
  33. Lachos-Perez, D.; Tompsett, G.A.; Guerra, P.; Timko, M.T.; Rostagno, M.A.; Martínez, J.; Forster-Carneiro, T. Sugars and char formation on subcritical water hydrolysis of sugarcane straw. Bioresour. Technol. 2017, 243, 1069–1077. [Google Scholar] [CrossRef] [PubMed]
  34. Kruse, A.; Funke, A.; Titirici, M.-M. Hydrothermal conversion of biomass to fuels and energetic materials. Curr. Opin. Chem. Biol. 2013, 17, 515–521. [Google Scholar] [CrossRef] [PubMed]
  35. Yao, Z.; Ma, X.; Lin, Y. Effects of hydrothermal treatment temperature and residence time on characteristics and combustion behaviors of green waste. Appl. Therm. Eng. 2016, 104, 678–686. [Google Scholar] [CrossRef]
  36. He, C.; Giannis, A.; Wang, J.-Y. Conversion of sewage sludge to clean solid fuel using hydrothermal carbonization: Hydrochar fuel characteristics and combustion behavior. Appl. Energy 2013, 111, 257–266. [Google Scholar] [CrossRef]
  37. Chen, X.; Ma, X.; Peng, X.; Lin, Y.; Yao, Z. Conversion of sweet potato waste to solid fuel via hydrothermal carbonization. Bioresour. Technol. 2018, 249, 900–907. [Google Scholar] [CrossRef] [PubMed]
  38. Reza, M.T.; Lynam, J.G.; Uddin, M.H.; Coronella, C.J. Hydrothermal carbonization: Fate of inorganics. Biomass Bioenergy 2013, 49, 86–94. [Google Scholar] [CrossRef]
  39. Zhao, X.; Becker, G.C.; Faweya, N.; Rodriguez Correa, C.; Yang, S.; Xie, X.; KRUSE, A. Fertilizer and activated carbon production by hydrothermal carbonization of digestate. Biomass Conv. Bioref. 2018, 8, 423–436. [Google Scholar] [CrossRef]
  40. Volpe, M.; Fiori, L. From olive waste to solid biofuel through hydrothermal carbonisation: The role of temperature and solid load on secondary char formation and hydrochar energy properties. J. Anal. Appl. Pyrolysis 2017, 124, 63–72. [Google Scholar] [CrossRef]
  41. Jain, A.; Balasubramanian, R.; Srinivasan, M.P. Hydrothermal conversion of biomass waste to activated carbon with high porosity: A review. Chem. Eng. J. 2016, 283, 789–805. [Google Scholar] [CrossRef]
  42. Oh, S.-Y.; Yoon, Y.-M. Energy Recovery Efficiency of Poultry Slaughterhouse Sludge Cake by Hydrothermal Carbonization. Energies 2017, 10, 1876. [Google Scholar] [CrossRef]
  43. Körner, P.; Jung, D.; Kruse, A. The effect of different Brønsted acids on the hydrothermal conversion of fructose to HMF. Green Chem. 2018, 20, 2231–2241. [Google Scholar] [CrossRef]
  44. Wikberg, H.; Grönqvist, S.; Niemi, P.; Mikkelson, A.; Siika-Aho, M.; Kanerva, H.; Käsper, A.; Tamminen, T. Hydrothermal treatment followed by enzymatic hydrolysis and hydrothermal carbonization as means to valorise agro- and forest-based biomass residues. Bioresour. Technol. 2017, 235, 70–78. [Google Scholar] [CrossRef] [PubMed]
  45. Licursi, D.; Antonetti, C.; Mattonai, M.; Pérez-Armada, L.; Rivas, S.; Ribechini, E.; Raspolli Galletti, A.M. Multi-valorisation of giant reed (Arundo Donax L.) to give levulinic acid and valuable phenolic antioxidants. Ind. Crops Prod. 2018, 112, 6–17. [Google Scholar] [CrossRef]
  46. Brunner, G. Near critical and supercritical water. Part I. Hydrolytic and hydrothermal processes. J. Supercrit. Fluids 2009, 47, 373–381. [Google Scholar] [CrossRef]
  47. Hodge, J.E. Dehydrated Foods, Chemistry of Browning Reactions in Model Systems. J. Agric. Food Chem. 1953, 1, 928–943. [Google Scholar] [CrossRef]
  48. Moreschi, S.R.M.; Petenate, A.J.; Meireles, M.A.A. Hydrolysis of ginger bagasse starch in subcritical water and carbon dioxide. J. Agric. Food Chem. 2004, 52, 1753–1758. [Google Scholar] [CrossRef] [PubMed]
  49. Sjöström, E. Wood Chemistry. Fundamentals and Applications; Academic Press, Inc.: San Diego, CA, USA; London, UK, 1993. [Google Scholar]
  50. Yang, H.; Yan, R.; Chen, H.; Lee, D.H.; Zheng, C. Characteristics of hemicellulose, cellulose and lignin pyrolysis. Fuel 2007, 86, 1781–1788. [Google Scholar] [CrossRef]
  51. Kruse, A.; Zevaco, T. Properties of Hydrochar as Function of Feedstock, Reaction Conditions and Post-Treatment. Energies 2018, 11, 674. [Google Scholar] [CrossRef]
  52. Liu, C.; Huang, X.; Kong, L. Efficient Low Temperature Hydrothermal Carbonization of Chinese Reed for Biochar with High Energy Density. Energies 2017, 10, 2094. [Google Scholar] [CrossRef]
  53. Ekpo, U.; Ross, A.B.; Camargo-Valero, M.A.; Williams, P.T. A comparison of product yields and inorganic content in process streams following thermal hydrolysis and hydrothermal processing of microalgae, manure and digestate. Bioresour. Technol. 2016, 200, 951–960. [Google Scholar] [CrossRef] [PubMed] [Green Version]
  54. Lucian, M.; Volpe, M.; Gao, L.; Piro, G.; Goldfarb, J.L.; Fiori, L. Impact of hydrothermal carbonization conditions on the formation of hydrochars and secondary chars from the organic fraction of municipal solid waste. Fuel 2018, 233, 257–268. [Google Scholar] [CrossRef]
  55. Hoekman, S.K.; Broch, A.; Robbins, C. Hydrothermal Carbonization (HTC) of Lignocellulosic Biomass. Energy Fuels 2011, 25, 1802–1810. [Google Scholar] [CrossRef]
  56. Bicker, M.; Endres, S.; Ott, L.; Vogel, H. Catalytical conversion of carbohydrates in subcritical water: A new chemical process for lactic acid production. J. Mol. Catal. A Chem. 2005, 239, 151–157. [Google Scholar] [CrossRef]
  57. Rasrendra, C.B.; Makertihartha, I.G.B.N.; Adisasmito, S.; Heeres, H.J. Green Chemicals from d-Glucose: Systematic Studies on Catalytic Effects of Inorganic Salts on the Chemo-Selectivity and Yield in Aqueous Solutions. Top. Catal. 2010, 53, 1241–1247. [Google Scholar] [CrossRef]
  58. Mäki-Arvela, P.; Simakova, I.L.; Salmi, T.; Murzin, D.Y. Production of lactic acid/lactates from biomass and their catalytic transformations to commodities. Chem. Rev. 2014, 114, 1909–1971. [Google Scholar] [CrossRef] [PubMed]
  59. Zan, Y.; Sun, Y.; Kong, L.; Miao, G.; Bao, L.; Wang, H.; Li, S.; Sun, Y. Formic Acid-Induced Controlled-Release Hydrolysis of Microalgae (Scenedesmus) to Lactic Acid over Sn-Beta Catalyst. ChemSusChem 2018. [Google Scholar] [CrossRef] [PubMed]
  60. Aida, T.M.; Ikarashi, A.; Saito, Y.; Watanabe, M.; Smith, R.L.; Arai, K. Dehydration of lactic acid to acrylic acid in high temperature water at high pressures. J. Supercrit. Fluids 2009, 50, 257–264. [Google Scholar] [CrossRef]
  61. Steinbach, D.; Kruse, A.; Sauer, J.; Vetter, P. Sucrose Is a Promising Feedstock for the Synthesis of the Platform Chemical Hydroxymethylfurfural. Energies 2018, 11, 645. [Google Scholar] [CrossRef]
  62. Licursi, D.; Antonetti, C.; Fulignati, S.; Vitolo, S.; Puccini, M.; Ribechini, E.; Bernazzani, L.; Raspolli Galletti, A.M. In-depth characterization of valuable char obtained from hydrothermal conversion of hazelnut shells to levulinic acid. Bioresour. Technol. 2017, 244, 880–888. [Google Scholar] [CrossRef] [PubMed]
Figure 1. Distribution of C into solid, liquid and gas phase.
Energies 11 03226 g001
Figure 2. Van Krevelen diagram for hydrochars versus temperature, residence time and moisture content.
Energies 11 03226 g002
Figure 3. Hydrochar thermal stability at 90% moisture content during 4 h reaction time.
Energies 11 03226 g003
Figure 4. Yield of (a) formic acid, (b) lactic acid, (c) acetic acid, (d) LA, and (e) propionic acid at experimental conditions.
Energies 11 03226 g004
Table 1. Characterization of brewer’s spent grains (BSG). db: dry basis.
ParametersUnitsValues
Dry solid content (105 °C)wt.%3.75
Volatile matter (VM, 950 °C)wt.% (db)76.25
Ash content (750 °C)wt.% (db)4.01
Fixed carbon (FC) contentwt.% (db)16.00
Higher heating value (HHV)MJ kg−1 (db)22.25
Cwt.% (db)51.27
Hwt.% (db)6.97
Nwt.% (db)4.68
Swt.% (db)0.29
Hemicellulose contentwt.% (db)43.03
Cellulose contentwt.% (db)23.69
Lignin contentwt.% (db)5.78
Extractiveswt.% (db)15.56
Proteinswt.% (db) 129.26
1 Standard method (American Society for Testing and Materials (ASTM) D-5291 [27]) was used to calculate protein fraction for BSG on a dry basis by multiplying the total nitrogen value by a factor of 6.25.
Table 2. Proximate analysis and fuel (see methods for description).
SamplesProximate Analysis (wt.% Dry Basis)Fuel RatioHy (%)Ey (%)Ed
VMAshFC
Raw material77.874.3017.830.23---
HTC-80-180-274.924.2920.790.2868.0080.811.19
HTC-80-200-271.964.2923.750.3364.0778.091.22
HTC-80-220-269.034.2626.710.3957.9976.101.31
HTC-80-180-472.794.1823.030.3267.5283.541.24
HTC-80-200-470.504.1525.350.3663.4876.601.21
HTC-80-220-466.174.2229.610.4555.0472.431.32
HTC-90-180-274.223.3922.390.3066.1779.491.20
HTC-90-200-271.693.2425.070.3562.1276.841.24
HTC-90-220-268.043.2228.740.4252.0469.141.33
HTC-90-180-473.153.1223.730.3265.2676.791.18
HTC-90-200-470.333.1626.500.3860.5376.211.26
HTC-90-220-464.863.2731.880.4950.5966.021.31
HTC-80-180/220-465.844.1130.050.4667.0585.511.28
HTC-90-180/220-465.093.1231.790.4970.3090.641.29
HTC-80-220-acid61.543.6734.790.5760.3679.111.31
HTC-90-220-acid59.352.8137.840.6452.5671.281.36
Table 3. Distribution of C into solid and liquid phase.
SamplesSolid wt.%Liquid wt.%
HTC-80-180-20.860.14
HTC-80-200-20.860.14
HTC-80-220-20.840.16
HTC-80-180-40.860.14
HTC-80-200-40.840.16
HTC-80-220-40.840.16
HTC-90-180-20.830.17
HTC-90-200-20.820.18
HTC-90-220-20.780.22
HTC-90-180-40.820.18
HTC-90-200-40.810.19
HTC-90-220-40.820.18
HTC-80-180/220-40.850.15
HTC-90-180/220-40.840.16
HTC-80-220-acid0.710.29
HTC-90-220-acid0.660.34
Table 4. Elemental analysis, O/C and H/C ratios and high heating values (HHV).
SamplesElemental Analysis (% wt. Dry Basis)O/CH/CHHV (MJ/kg)
NCHSO
Raw material4.6851.276.970.2936.520.531.6322.28
HTC-80-180-24.3760.327.070.4527.800.351.4126.48
HTC-80-200-24.1262.027.020.4226.420.321.3627.16
HTC-80-220-24.4165.817.280.4322.070.251.3329.24
HTC-80-180-44.3062.897.020.4325.360.301.3427.57
HTC-80-200-44.0961.197.090.4627.170.331.3926.89
HTC-80-220-44.4667.086.890.4321.140.241.2329.32
HTC-90-180-23.6360.187.390.4428.360.351.4726.76
HTC-90-200-23.8062.297.250.4526.210.321.4027.56
HTC-90-220-23.7566.557.350.4121.940.251.3329.60
HTC-90-180-43.4959.967.050.4229.070.361.4126.22
HTC-90-200-43.8663.547.190.4524.960.291.3628.05
HTC-90-220-44.2566.606.890.4321.830.251.2429.08
HTC-80-180/220-44.4064.846.970.4923.300.271.2928.42
HTC-90-80/220-44.3765.466.990.5322.660.261.2828.73
HTC-80-220-acid4.5567.296.710.5120.940.231.2029.20
HTC-90-220-acid4.2068.677.030.5019.600.211.2330.22
Table 5. pH and dissolved organic chemical yield in liquid fraction at different process conditions. HMF: 5-hydroxymethylfurfural and LA: levulinic acid.
SamplespHLactic AcidFormic AcidAcetic AcidPropionic AcidHMFFurfuralLA
HTC-80-180-24.000.060.090.100.030.010.010.01
HTC-80-200-24.380.040.080.110.020.000.000.01
HTC-80-220-24.530.100.050.090.010.000.000.01
HTC-80-180-44.160.040.080.100.020.000.000.01
HTC-80-200-44.530.100.050.110.000.000.000.01
HTC-80-220-44.530.080.040.100.000.000.000.01
HTC-90-180-23.910.020.060.050.030.010.020.00
HTC-90-200-24.420.050.080.080.080.000.000.01
HTC-90-220-24.560.060.060.070.050.000.000.01
HTC-90-180-44.040.040.080.070.020.000.000.01
HTC-90-200-44.590.040.010.050.010.000.000.00
HTC-90-220-44.660.060.040.100.000.000.000.01
HTC-80-180/220-44.640.080.040.100.100.000.000.01
HTC-90-180/220-44.540.090.050.090.170.000.000.01
HTC-80-220-acid3.670.070.03106.400.150.000.000.02
HTC-90-220-acid3.570.050.03100.520.110.000.000.02

